 Tong Li
 Zhiyuan Xiang
 Yangfan Li
- State Key Laboratory of Marine Environmental Science, Fujian Provincial Key Laboratory for Coastal Ecology and Environmental Studies, College of the Environment and Ecology, Dapeng Center for Bay Area Planning and Development, Xiamen University, Xiamen, China
Cultural ecosystem services (CES) based on nature experiences substantially contribute to public health and human well-being. However, CES’s supply-demand methodology remains scarcely explored on the coastal beach, and the demand relating to public preferences has not been sufficiently unveiled in spatial assessment. Here, we selected recreation services as a lens of CES and applied the knowledge of multi-source big data to better reflect public preferences. Point of Interests (POIs) refer to particularly valuable or interesting places. We proposed to integrate POIs and social media data (Weibo check-in) to quantify the demand for beach recreation services (BRS). We also used socio-ecological indicators to quantify the BRS’s supply. The supply-demand balance of BRS was further identified by quadrant analysis and coupling coordination degree. Our methodology was applied to a typical coastal zone, Shenzhen Dapeng New District, in the Greater Bay Area of China. Over 80% of the beaches in the study area exhibited an imbalanced or barely balanced supply-demand of recreation services. We found that POIs density had a significant influence on a balanced supply-demand of BRS. Multi-source big data (POIs and Weibo check-in) provided an efficient, low-cost, and across-scale approach for public preference mapping than traditional questionnaire surveys. The proposed CES’s supply-demand framework can identify coastal beaches with imbalanced recreation and support sustainable coastal management. Coastal beach management prioritizes not only waste prevention and sufficient safety signs but also proper infrastructure development that contribute sustainably to the human well-being of nature experiences.
1 Introduction
Coastal beaches, which cover more than one-third of the global coastline (Steven et al., 2020), provide health-related benefits such as recreation and leisure, as well as an abundance of amenities and aesthetic beauty (van den Bosch and Ode Sang, 2017; Huynh et al., 2022). Beach recreation not only directly enhances physical and mental health and improves the quality of life (Bratman et al., 2019; Subiza-Pérez et al., 2020) but also represents a significant pillar of the economy in many coastal states (Defeo et al., 2021). However, beaches are under constant change and frequent degradation driven by anthropogenic factors (Vousdoukas et al., 2020), as they are highly developed and densely populated (Jeon and Yang, 2021). To address these impacts, an interdisciplinary management approach is required (Inácio et al., 2022). Ecosystem services reveal the interdependencies between nature and human well-being, which are considered an effective bridge between science and policy (Costanza et al., 2017). Recreation services belongs to the group of cultural ecosystem services (CES) (Daniel et al., 2012), which refers to the nonmaterial benefits that people obtain from the recreational activities of natural settings (Vaz et al., 2019). Recreational CES is promoted as a suitable approach for resolving the contradiction between finite beach resources and rapid economic growth (Duffy, 2015).
For the evaluation of CES, most research has primarily focused on the supply (Bing et al., 2021) and gradually considered the demand (Karasov et al., 2022). Some studies have measured the supply of CES to reflect its potential and accessibility through socio-ecological indicators (Peña et al., 2015; Peña-Alonso et al., 2018). Moreover, big data, such as social media data, provide powerful breakthroughs in CES demand mapping and advance a more interdisciplinary field (Oteros-Rozas et al., 2018; Barros et al., 2020). Comparison to traditional assessments based on travel cost methods (Sinclair et al., 2020), willingness to pay (Moyle et al., 2017) and participatory survey method (Sun et al., 2019), CES demand evaluation using social media data is more low-cost and efficiently spatialize its recreational activities and public preferences by simplifying complex information (Moreno-Llorca et al., 2020; Tu et al., 2020).
Despite technological advances, using social media data to assess CES demand still has limitations (Ghermandi and Sinclair, 2019; Crouzat et al., 2022; Karasov et al., 2022). Social media primarily concentrates on younger, well-educated, and more-experienced people (Donahue et al., 2018; Erskine et al., 2021). Besides, water-based sports and recreational activities involving substantial mental efforts may be less likely to be recorded on social media platforms (Sinclair et al., 2020). Point of Interests (POIs), as a geospatial big data, refers to specific physical infrastructures that attract people such as restaurant, university, and hospital. Recent studies have gradually adopted POIs distribution as a proxy for tourist crowds, human activity, and recreational preferences (Li et al., 2020). Consequently, augmenting social media data with additional big data sources should be developed, thus compensating the potential bias for CES demand mapping (Komossa et al., 2020; Ghermandi, 2022), more generally, for identifying the distribution disparity of supply-demand. Given that recreational CES represents mental health and economic benefits, mapping it as a decision support tool can efficiently guide sustainable beach management (Aalders and Stanik, 2019). Moreover, previous research on CES has mainly focused on city parks (Liu et al., 2020), urban greenspace (Liu et al., 2020), and watersheds (Meng et al., 2020). CES supply-demand framework remains scarcely explored in the coastal beach ecosystem. Therefore, it is imperative to assess and map recreational CES via novel tools and comprehensively construct a supply-demand methodology for the coastal beach to support sustainable management.
Our research aims to propose a CES supply-demand framework of the coastal beach and applied recreation as an example of CES. Understanding the supply and demand of CES is critical for sustainable coastal management, as it provides essential knowledge for designing appropriate interventions where ecosystem provision maintenance or CES opportunity improvement is needed (Gould et al., 2019). In this study, the POIs and Weibo check-in data are introduced to map the demand for beach recreation services (BRS). We also use socio-ecological factors as proxy indicators to quantify the BRS’s supply. The coupling coordination degree and quadrant analysis are developed to investigate the imbalance of supply-demand for BRS, and the Random Forest model is employed to identify the importance of supply and demand indicators on BRS’ imbalance. We had three specific objectives: 1) to map BRS’s demand via multi-source big data; 2) to reveal the imbalanced supply-demand of beach recreation services; 3) to address the imbalance between the supply and demand of BRS for sustainable coastal beach management.
2 Materials and methods
2.1 Study area
Dapeng New District (DPND), located in the southeast of Shenzhen megacity, Guangdong Province, is an essential node in the Guangdong-Hong Kong-Macao Greater Bay Area. As a typical coastal zone, there are 54 beaches in DPND, accounting for 96.4% of the total number of beaches in Shenzhen. The overall tourism revenue of DPND was 51.1 billion yuan, with 10.6 million visitors in 2019. The coastal beaches’ tourism in DPND has contributed to more than 30% of the economy and 50% of the tourists. However, the rapid development of tourism has changed the beach landscape and influenced tourists’ experiences. We selected 29 beaches with high tourism potential and ecological value to analyze the balance between supply and demand for BRS.
According to the ‘Beach Management Regulations’ issued by the Shenzhen Municipal Government in 2018, beaches were divided into four types. 1) bathing beach has a large size and scenic features and allows for water recreation activities such as swimming. 2) enclosure beach has physical fences for better natural conservation and is located near hotel facilities; 3) open beach without fences, permits free sightseeing, and is located near communities. 4) closed beach is preserved and restricted to visit, with no infrastructure, located in the nuclear power plants or eco-protected area (Figure 1).
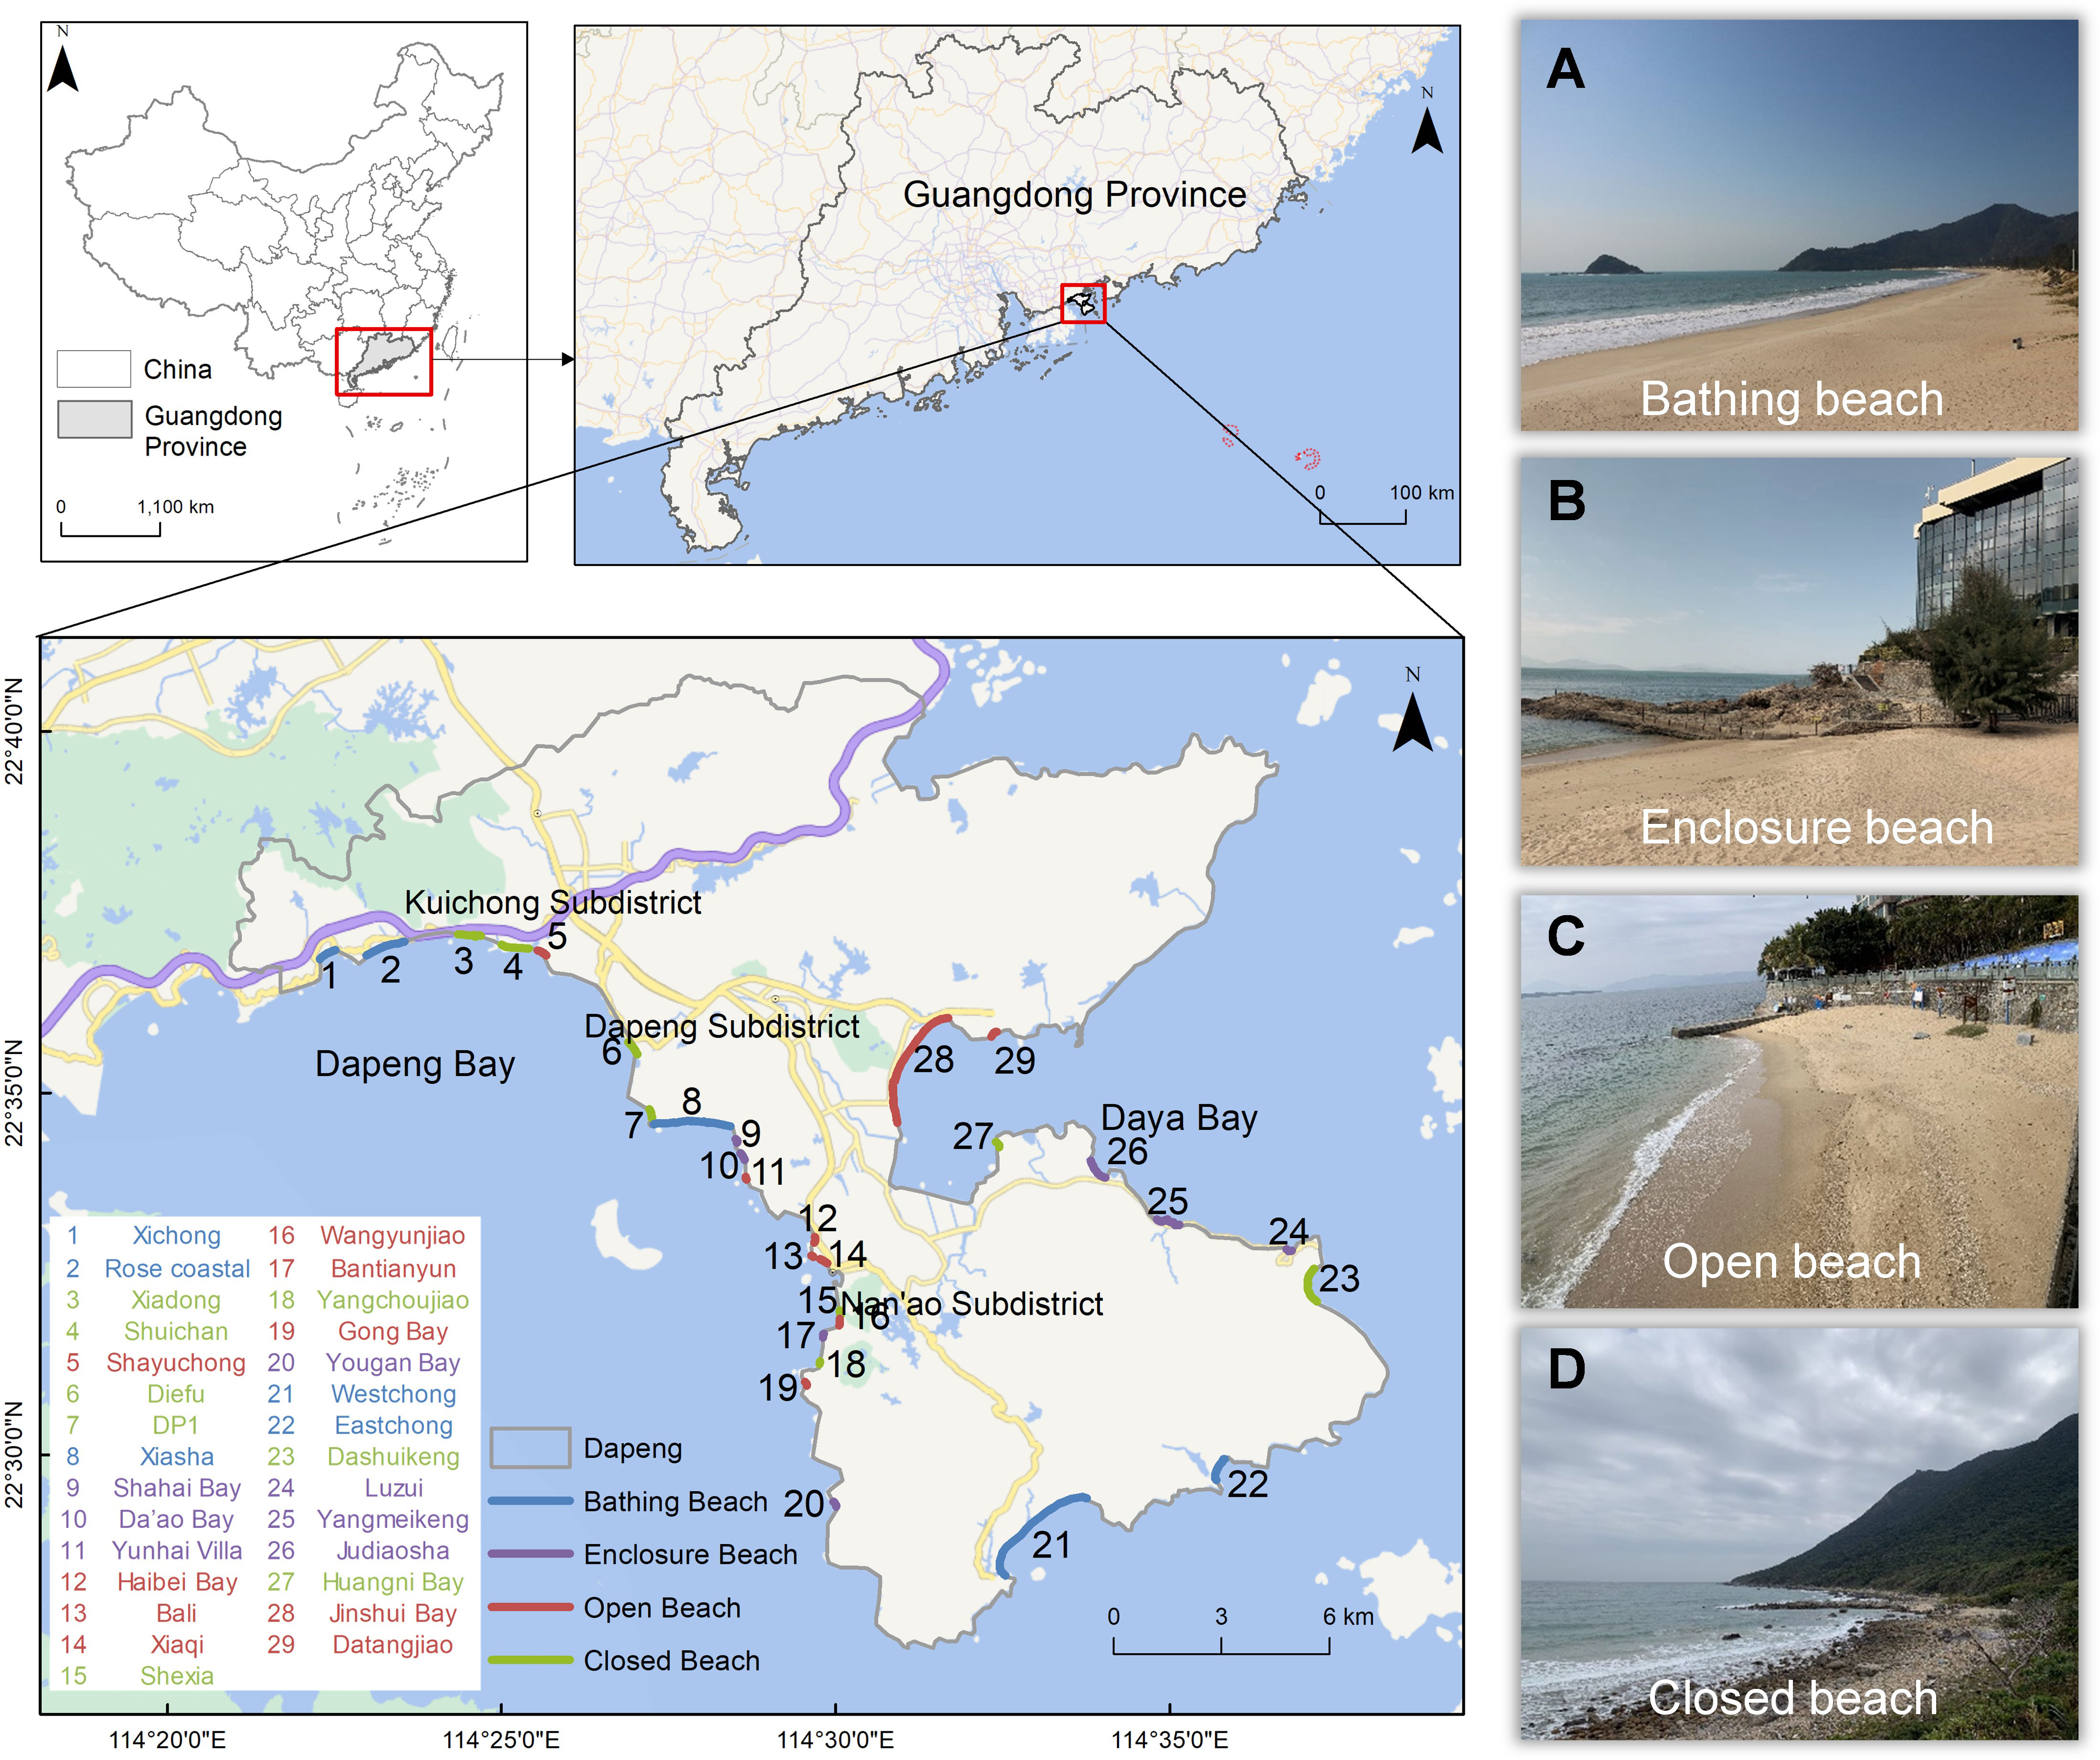
Figure 1 Study area map.
2.2 Methodology
The procedure for evaluating the supply and demand for BRS mainly includes three steps: (1) data preparation; (2) assessment of BRS’s supply and demand; and (3) relationship between supply and demand of BRS (Figure 2).
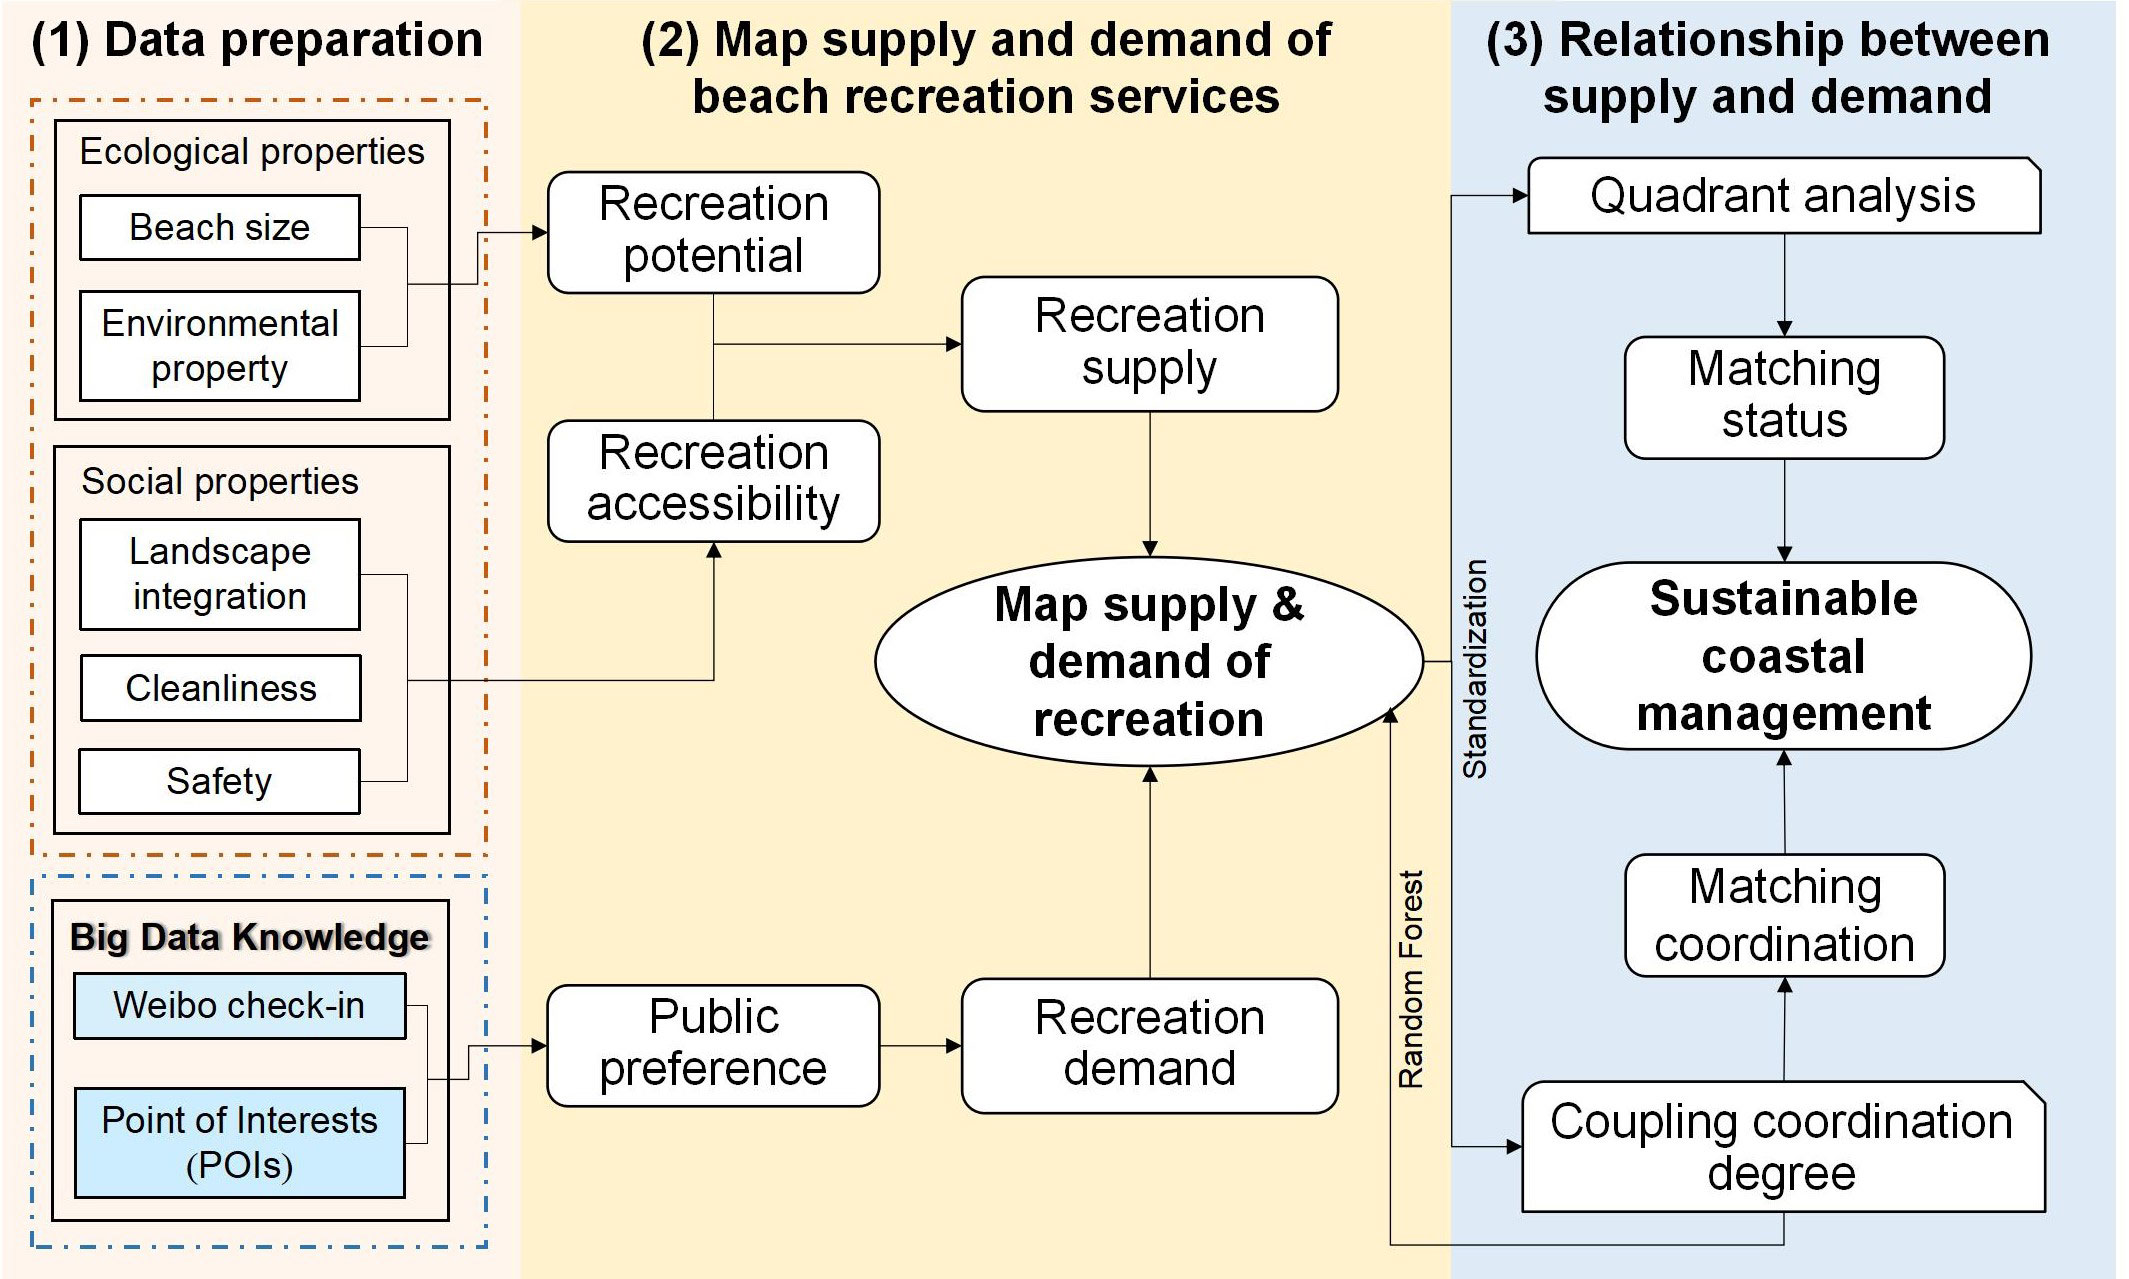
Figure 2 Framework for coastal beach assessment of recreational CES.
2.2.1 Data collection
The beach survey data in the case study, including environmental property, recreational opportunity, cleanliness, and safety, were collected from fieldwork in January 2021. Beach size data (width, length, and area) were acquired from the official government statistics presented in ‘The Statistical Report of Shenzhen Coastal Natural Beach (2017)’. Additionally, multi-source big data include POIs and Weibo check-in data. POIs were retrieved from the Resource and Environment Science and Data Center of the Chinese Academy of Sciences (http://www.resdc.cn/data.aspx?DATAID=3412020). We obtained 11.5 thousand POIs records for 2020 in DPND. Weibo check-in data was obtained from the location service dynamic interface of the Weibo open platform (https://weibo.com/p/100101B2094757D06AA7F5489E). We used Gooseeker (https://gooseeker.com) to collect check-in data from July 2020 to June 2021 once permission to access Weibo was granted. After deleting the duplicate records published simultaneously by the same Weibo ID, we had a total dataset with 8,076 beach check-in records.
2.2.2 Supply and demand assessment of BRS
(1) Supply of BRS
The supply of recreation services is primarily assessed in terms of its potential and accessibility (Peña et al., 2015). Our study adopted proxy indicators based on the social-ecological system to access the beach supply. The supply potential refers to the capacity of ecosystems to provide recreation due to their natural scenic or environmental features. We thus consider ecological indicators concerning beach size and environmental property based on existing research (Peña-Alonso et al., 2018; Chatterjee et al., 2022). Supply accessibility is defined as the possibility for recreation areas to be used and to be reached. We considered landscape integration of specific tourism elements to indicate the recreational availability of the beach (Bing et al., 2021; Inácio et al., 2022). The completeness of the leisure services system and abundant beach activities reflect the level of recreational use of the beach, and transportation roads reflect the ease of access to the beach (Peña-Alonso et al., 2018). Environmental cleanliness (including Garbage, Drains or Discharges, and Floating Debris in the Water) reflects the impact of beach recreational activities and surrounding infrastructure development on environmental protection, as well as the visual aesthetics of the beach scene (Tang, 2015; Chatterjee et al., 2022) Safety was also applied as essential proxies for accessibility (Semeoshenkova et al., 2017; Pouso et al., 2020). The supply of BRS is further calculated by integrating recreation potential and accessibility aspects (Table 1, details in Supplementary material Supplementary Table S1). The supply value was reclassified into five classes (following Natural Jenks Breaks): very high, high, medium, low, and very low (Lavorel et al., 2020).
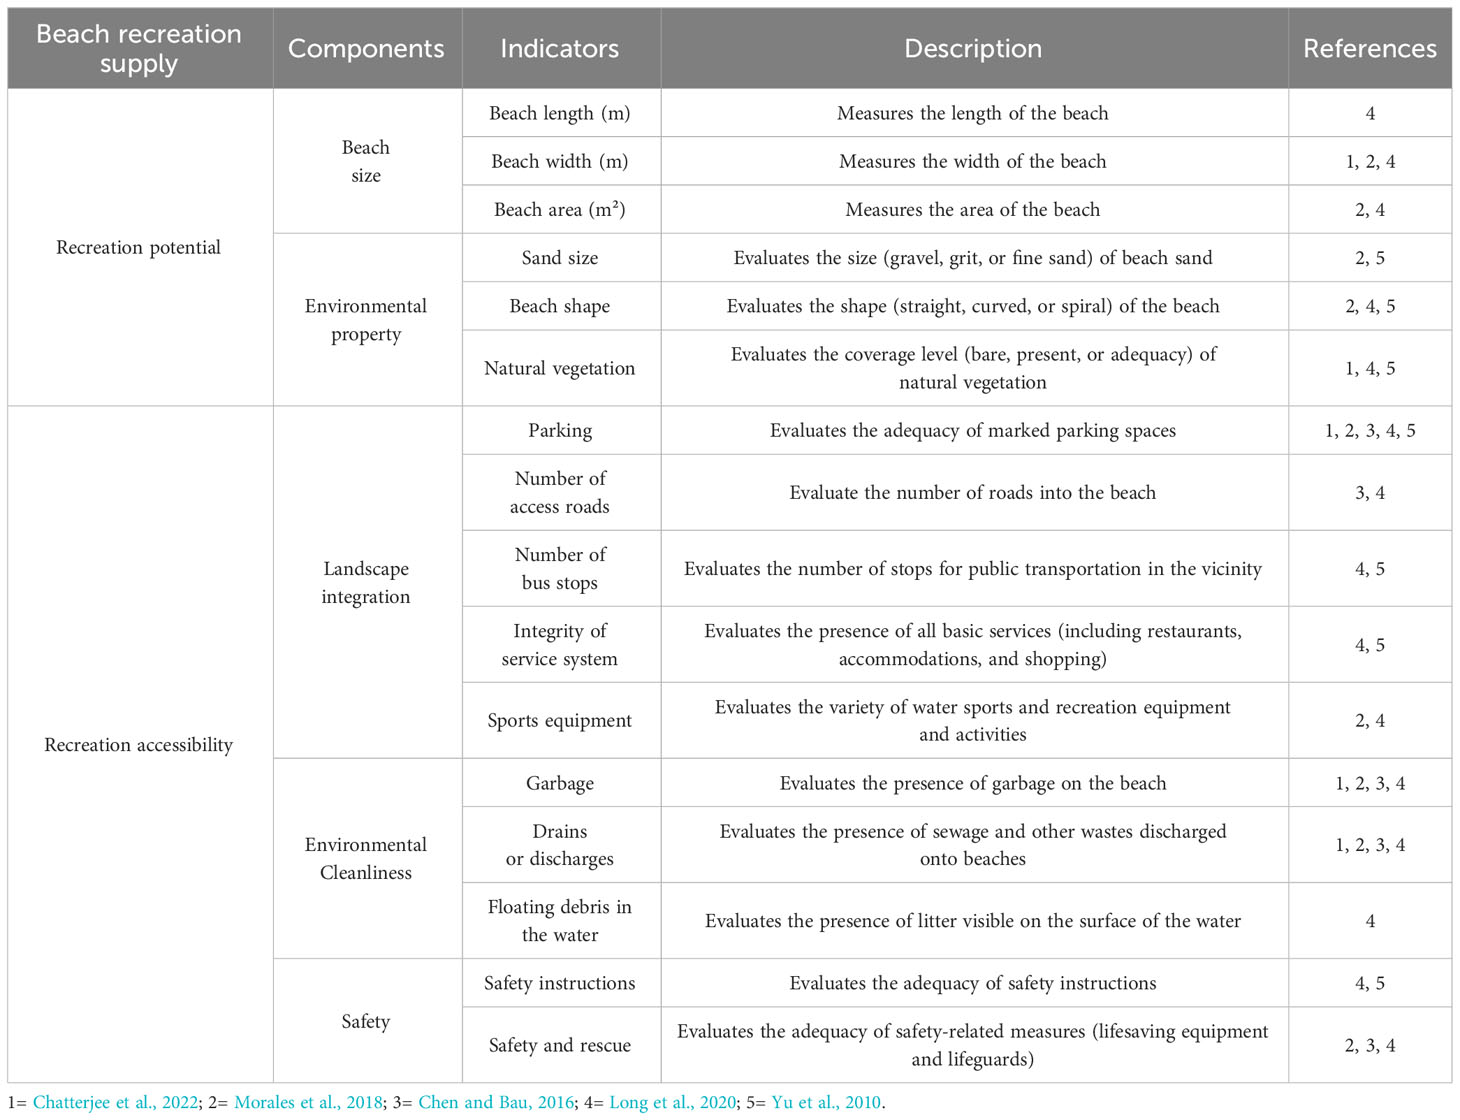
Table 1 Supply evaluation of beach recreation services in DPND.
(2) Demand of BRS
The demand for BRS is defined as the recreational experiences required or desired by society, which are generally expressed as population hotspots, visitation, or public preferences (Villamagna et al., 2013; Wolff et al., 2015; Wei et al., 2017). POIs distribution has been commonly used to reflect the hotspots of human activities and tourist crowds (Li et al., 2018; Fan et al., 2023). Recent studies have confirmed that the density of POIs presented a reliable proxy for determining humans’ recreational preferences, and the recreational areas with more infrastructures tended to attract more visitors (Li et al., 2020). Indeed, there is a significant positive correlation between the density of physical infrastructures and visitor activities (Levin et al., 2017), implying the feasibility of POIs density in assessing the BRS’s demand.
Based on a review of previous studies, the types of POIs used to quantify demand in this study included all physical infrastructure rather than only tourism facilities. We extracted 25 POIs types in DPND, including residential communities, living service infrastructures (post office, photography studio, etc), traffic infrastructure (parking lot, port terminal, etc), financial and insurance infrastructures (bank, insurance company, etc), educational and cultural infrastructures (school, library, art gallery, etc), medical service (hospital, health station, etc), restaurant, governmental institutions, and other infrastructures types. The total number of POIs of all types was quantified using the kernel density analysis in the ArcGIS 10.2 software to map POIs density.
Additionally, Weibo, one of China’s most influential social media platforms, was launched in August 2009. Location-Based Service (LBS) on Weibo is one of the main applications for accessing geospatial information (Ghermandi and Sinclair, 2019). Weibo check-in offers a unique option for users to tag their location and share their location, photographs, texts, and activities (Su et al., 2020). Based on previous studies (Shi et al., 2017; Mancini et al., 2018; Li et al., 2020), a significant positive relationship has been observed between Weibo check-in and official visitor statistics, which validates the capability of check-in data to characterize the tourists’ preferences. Consequently, we selected the number of Weibo check-in as a proxy for BRS’ demand. Hence, the BRS’s demand was mapped by overlaying the POIs density with the number of Weibo check-in, and the demand value was reclassified into five classes (following Natural Jenks Breaks): very high, high, medium, low, and very low (Lavorel et al., 2020).
2.2.3 Analysis of relationship between supply and demand for BRS
(1) Quadrant analysis
The quadrant analysis was adapted to analyze matching states of supply and demand for recreation services after supply/demand was standardized (Equations 1–3) (Xin et al., 2021). We divided the matching states into four categories: high supply-high demand (quadrants I), low supply-high demand (quadrants II), low supply-low demand (quadrants III), and high supply-low demand (quadrants IV), respectively. Specifically, a beach with high supply-high demand was identified as the balance of supply and demand for BRS; the low supply-high demand indicated that supply could not satisfy the human recreational desire; high supply-low demand suggests that there is an abundant supply; low supply-low demand signifies underutilized or underdeveloped beach recreation resources.
Where represents the standardized value of the supply/demand of recreation services for each beach , and . denotes the original, non-standardized value of the supply/demand of recreation services for each beach . indicates the average value of across all beaches. is the standard deviation of all beaches, and refers to the total number of beaches included in the study. Note that all variables in our analysis are dimensionless.
(2) Coupling coordination degree
The coupling coordination degree model (Equations 4, 5) was used to quantitatively analyze the balance or imbalance relationship between the supply and demand of BRS. The variable D is the degree of coupling coordination to represent the balance/imbalance status between supply and demand systems. Variable C is the coupling degree to reflect the interaction between two systems. According to previous studies (Tang, 2015; Shen et al., 2018; Kurniawan et al., 2019), the value of D could be divided into ten types and three scenarios (imbalanced development, transitional development, and balanced development) (Table 2), to reflect the relationship between supply and demand of BRS:
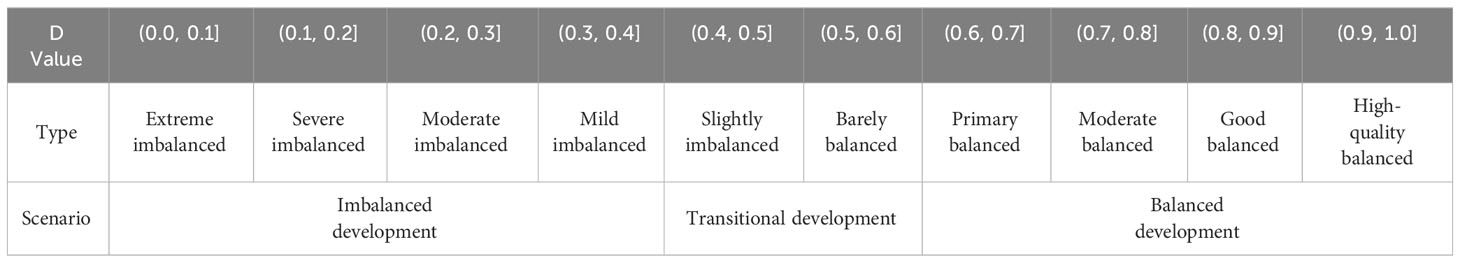
Table 2 The classification and scenario of coupling coordination degree.
(i) In the imbalanced development scenario when D∈(0,0.4], beaches demonstrate varying levels of imbalanced (extreme/severe/moderate/mild) relationship along with a weak interaction between the supply and demand of recreation services. For example, a beach represents higher levels of tourist visitation and public attractiveness, but a more limited recreational supply with small beach size, inconvenient transportation, the presence of environmental cleanliness issues, or inadequate safety equipment, which could result in overcrowding and environmental challenges at the beach.
(ii) In the transitional development scenario when D∈(0.4,0.6], beaches exhibit a slightly unbalanced/barely balanced relationship related to reinforcing the interaction between the supply and demand of recreation services. For example, the beach’s medium tourist visitation and public attractiveness are relatively matched to the recreation supply in terms of a medium beach size, improved transportation, and appropriate safety equipment. However, there may still be slight differences in supply, such as environmental cleanliness issues with garbage, possibly resulting in limitations in sustaining a consistently balanced state of recreation services.
(iii) In the balanced development scenario when D∈(0.6,1], beaches represent diverse levels of balanced (primary/moderate/good/high-quality) relationship along with a strong interaction between the supply and demand of recreation services. For instance, a beach with a high-quality balance level reflects a high level of recreational supply to satisfy the demand for tourist visitation and preferences, providing a large beach size, high-quality ecological properties and environmental cleanliness, good accessibility, and adequate safety equipment, which may provide substantial recreational experiences and benefits for humans.
Where is the coupling degree; is the coupling coordination degree; and are the supply and demand for recreation services for beaches , respectively. Normally, the coefficient of supply and demand for recreation services are equal, i.e., α = β = 1/2 (Tang, 2015).
(3) Random Forest model
We applied the Random Forest (RF) to assess the importance of supply-demand proxy indicators in influencing the coupling coordination degree, investigating the primary controlling variables for maintaining balance in BRS. It is crucial to propose effective intervention measures related to key factors to address imbalances in recreational beaches, focusing on ecosystem conservation, provision enhancement, or improving recreation attractiveness, thereby contributing to sustainable beach management. As a machine learning algorithm for regression analysis, RF applies to nonlinear relationships between variables and determines their relevance, which can more accurately identify the critical factors in complex systems rather than rely on oversimplified proxies or linear algorithms (Manley et al., 2022).
RF algorithm, an ensemble learning approach based on decision trees, constructs trees by randomly selecting two-thirds of the provided dataset. The remaining one-third of the data, which is not utilized in tree generation, serves as out-of-bag (OOB) data for estimating the OOB mean square error (MSEOOB) and evaluating variable importance. The increase in MSE (% IncMSE) is a critical metric for assessing variable importance. Specifically, a notable increase in MSEOOB, observed when substituting a variable’s value in the model, indicates the substantial impact of that variable. The higher the value of %IncMSE, the greater the significance of the variable. Therefore, the %IncMSE metric of the RF model is used to represent the importance of supply/demand variables in influencing coupling coordination degree.
To establish the RF model, we selected the coupling coordination degree as the dependent variable and 18 supply-demand factors as independent variables, including Weibo Check-in (WC), POIs Density (PD), Beach Length (BL), Beach Width (BW), Beach Area (BA), Beach Sand Size (BS), Beach Shape (BP), Natural Vegetation (NV), Parking (PK), Integrity of Service System (IS), Recreation Equipment (RE), Number of Access Roads (RN), Number of Bus Stops (NB), Garbage (BG), Drains or Discharges (DS), Floating Debris in Water (FD), Safety Instructions (SI), and Safety and Rescue (SR). The model parameters, including the minimum number of branch nodes for each tree (nodesize) and the total number of trees in the forest (ntree), were configured based on common and recommended values (Xu et al., 2018), with both set to 5 and 5000, respectively. The accuracy of the model is significantly influenced by the number of randomly selected variables required for growing a tree (mtry). Therefore, the optimal mtry value (12) was identified by sweeping through all values from 1 to M (where M represents the number of variables, 18 in this study) and performing M experiments. To enhance the robustness of the variable importance assessment, we executed 500 iterations of the RF model with seeds ranging from 1 to 500, obtaining the average value of %InMSE for the 18 factors to represent the variable importance (Denisko and Hoffman, 2018). We utilized the ‘randomForest’ package and ‘rfPermute’ package in the R software to construct the RF model. Noted that closed beaches are prohibited development, including supply accessibility and POIs construction, due to their high ecological value. Therefore, the variable importance analysis in the RF model did not include closed beaches to avoid bias in the results.
3 Results
3.1 Supply for BRS
Bathing beaches had the highest supply (85 ± 4.1) of recreation services in Dapeng New District (DPND), with the best performance in Westchong Beach, which benefited from a high-quality ecosystem feature (beach length, width, area, and natural vegetation), provision of services, and excellent beach cleanliness (Figure 3; Supplementary Table S2). Furthermore, enclosure beaches had a high supply score. The results were related to their high-level recreational opportunity and cleanliness (71 ± 9.0). However, the supply capacity for Yunhai Villa Beach, Luzui Beach, and Shanhai Bay Beach was poor, limited by a small beach size (area< 8,000 m2, beach width< 500 m, and length< 30 m). Besides, the low number of bus stops also limited the supply of BRS. Due to the presence of cleanliness issues (garbage and drains or discharges), the small beach size, and insufficient safety and rescue measures, the supply of open beach recreation services was moderate to low level (65 ± 9.6). Closed beaches are protected, and their recreational accessibility is prohibited from developing, resulting in the lowest recreation supply (58 ± 6.1).
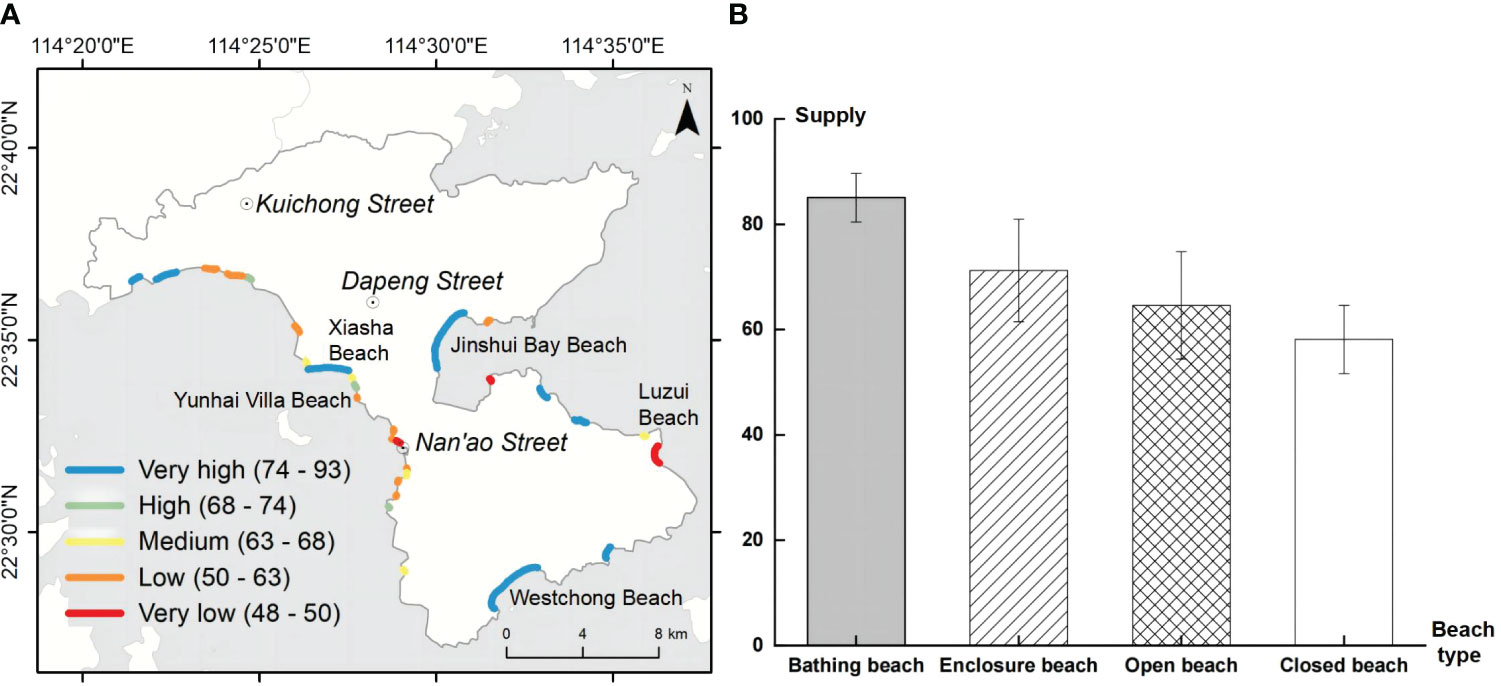
Figure 3 Supply mapping for recreation services (A) and its average supply value in four beach types (B) in DPND.
3.2 Demand for BRS
By comparing check-ins and POIs density along the coastal beach of DPND, we observed a significant heterogeneity in spatial distribution (Figures 4A, B). We found lower check-ins on the small beach but a higher POIs density mainly concentrated near Nan’ao Street on the western coast of DPND. Overall, the very high demand for BRS (Figure 4C; Supplementary Figure S1) was Jinshui Bay Beach (open beach) and Yangmeikeng Beach (enclosure beach), both of which were in higher check-ins and POIs. The high and medium demand for BRS tends to be distributed on open and enclosed beaches, like Wangyunjiao, Bali Island, Shayuchong, Shanhai Bay, and Da’ao Bay Beach, due to the area with high POIs density. Nevertheless, bathing beaches had moderate and low demand, with high check-ins but relatively low POIs concentrations. The demand for closed beaches was very low because their recreation activities are forbidden to protect the ecosystem.
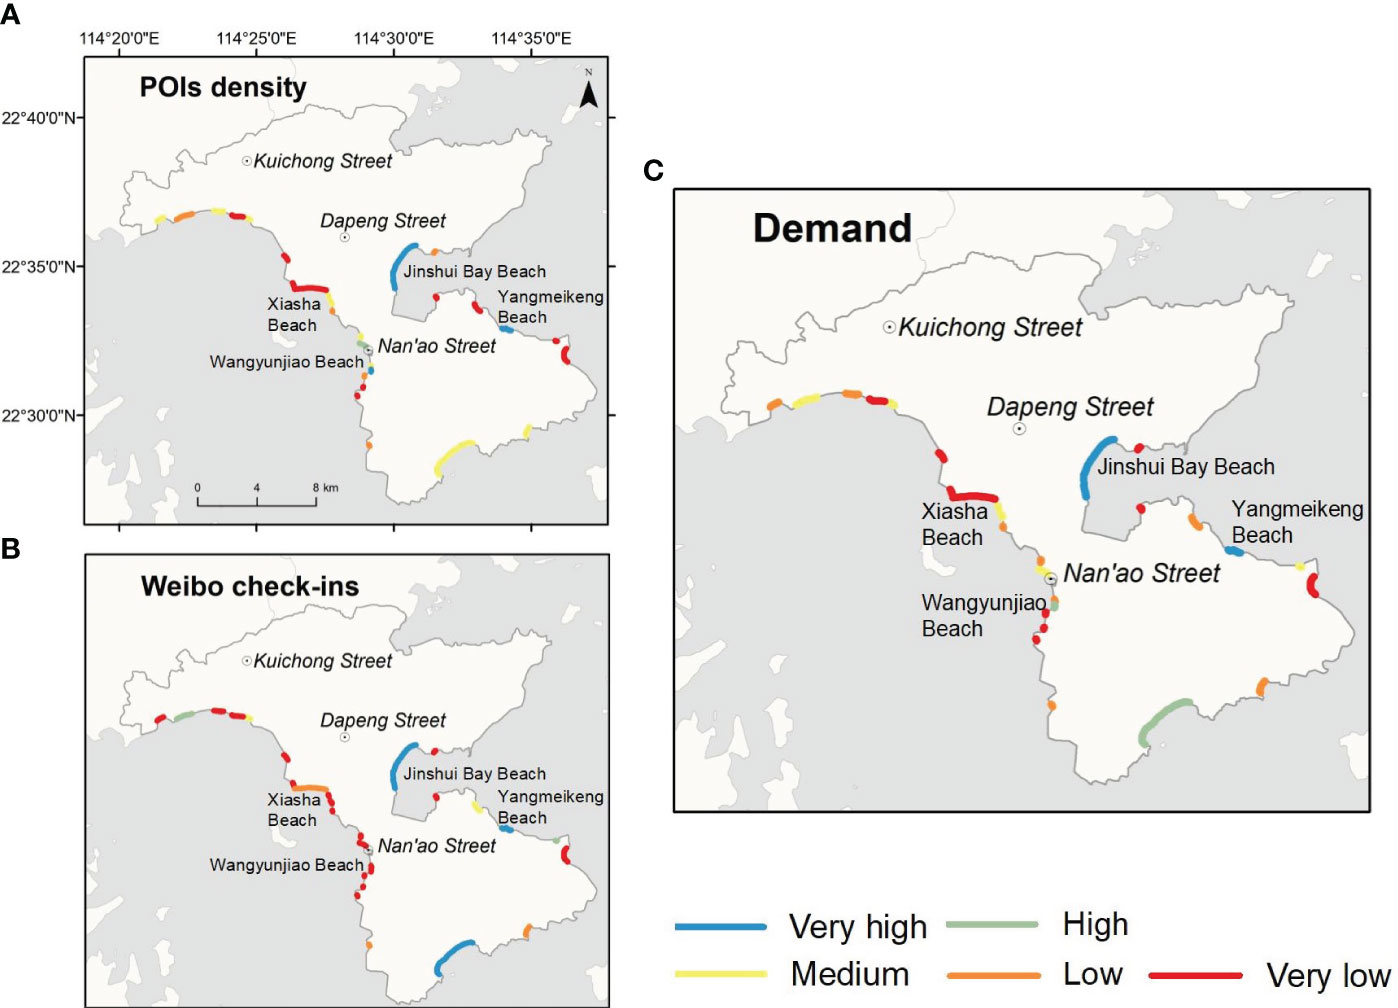
Figure 4 Demand mapping for beach recreation services in DPND: (A) POIs density, (B) Weibo check-ins, (C) demand of recreation services.
3.3 The relationship between supply and demand for BRS
Combining matching status and coupling coordination between supply and demand for recreation services helps intuitively characterize BRS’s imbalanced supply and demand. The matching type of supply-demand of BRS was predominantly in Quadrants III and IV, accounting for 72.4% of the total beaches (Figure 5). Most beaches demonstrated an imbalanced or barely balanced supply-demand for recreation services, accounting for 82.8% of the total beaches (Figure 6). According to the findings, there was a lack of optimal coordination in the coupled beach recreational system. Specifically, bathing beaches were distributed in Quadrants I and IV with a primary balanced state, indicating that low demand impaired the coupling coordination of recreation services. Enclosure beaches’ low demand had a mismatch with their supply in Quadrants IV and III, where the matched state was barely balanced. Open beaches were dispersed throughout the four quadrants, and the coupling state spanned a broad spectrum from high-quality balance to moderate imbalance. These beaches with Quadrants III and Quadrant II were mild or slightly imbalanced because of the low recreation supply. Closed beaches are prevented from tourism development, resulting in low supply-low demand constraints and an imbalanced coupling state.
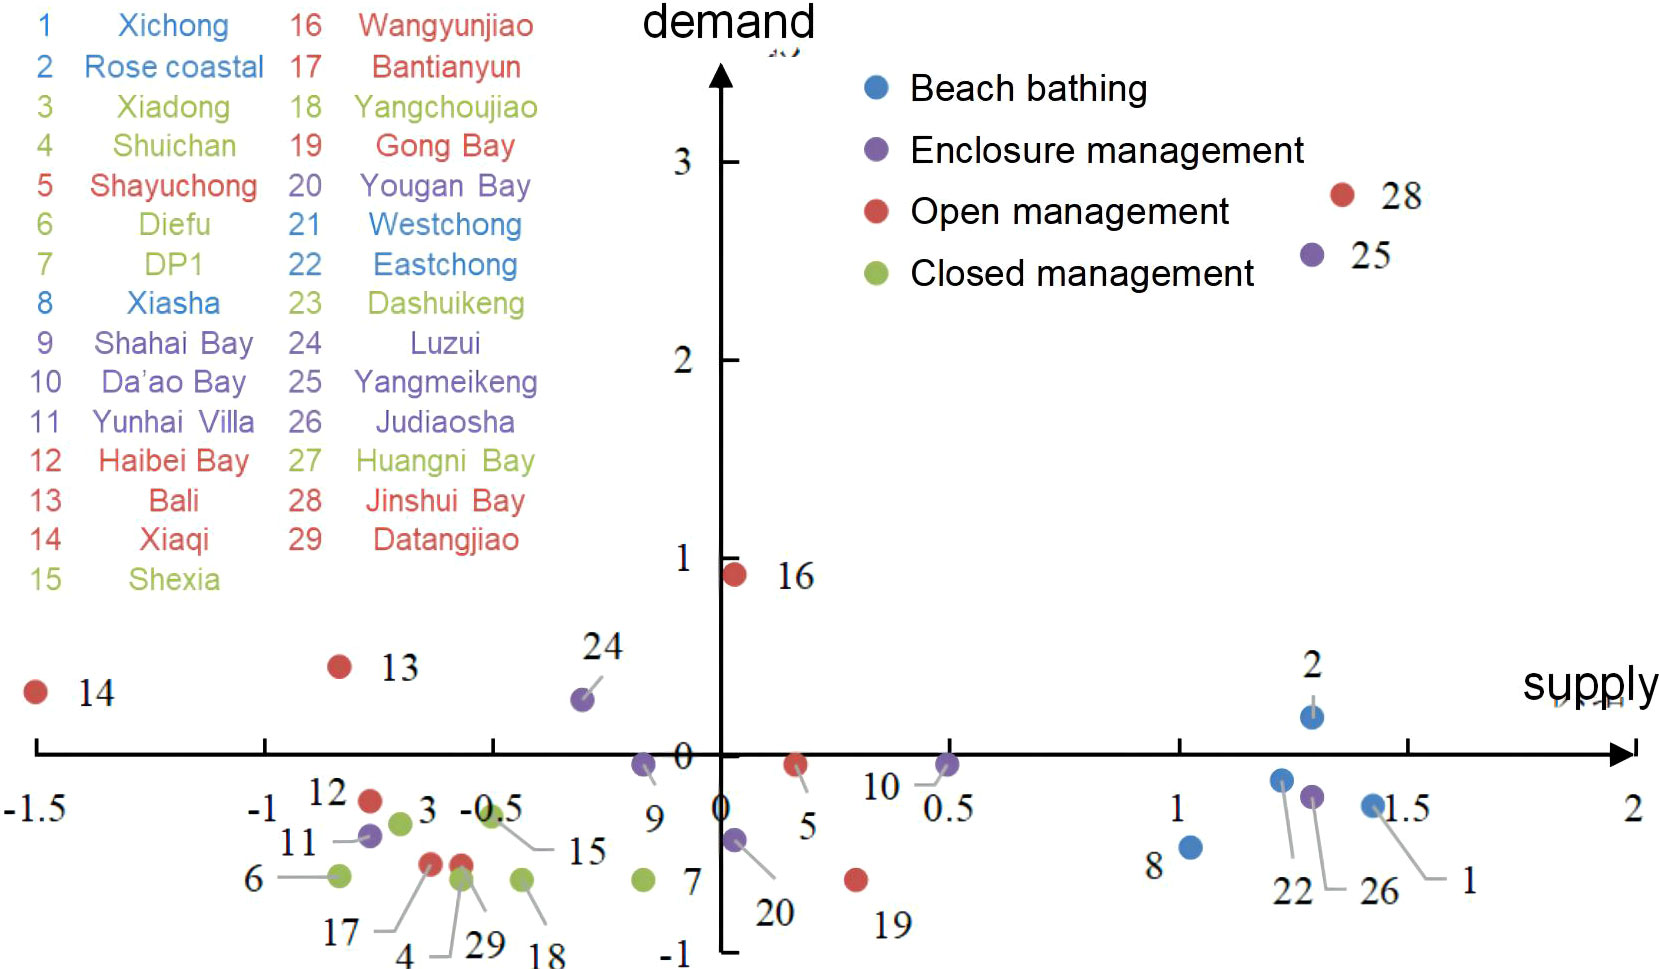
Figure 5 Zoning of the supply and demand for beach recreation services in DPND.
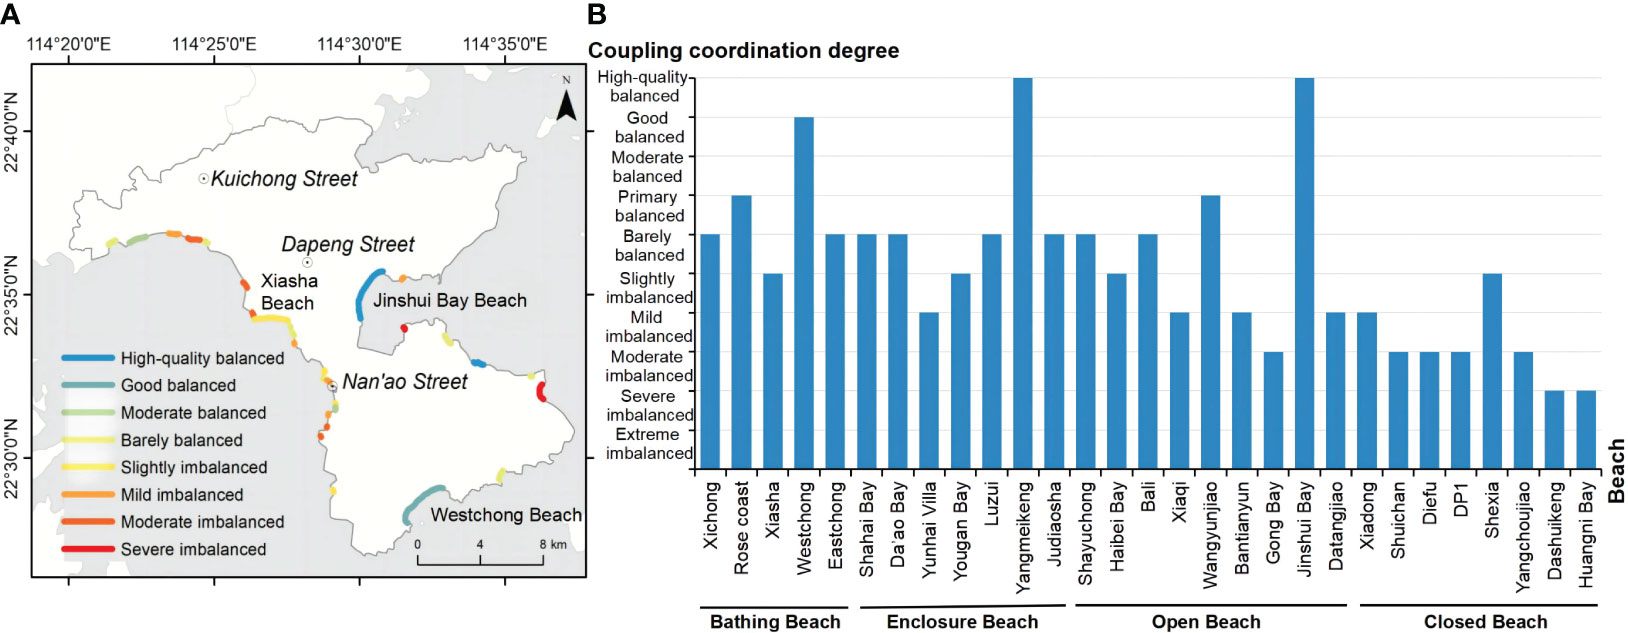
Figure 6 Coupling coordination degree mapping between supply and demand for recreation services (A) and its level in four beach types (B) in DPND.
We subsequently examined the main controlling variables influencing the balance between supply and demand in BRS. Figure 7 illustrates the average importance values (%IncMSE) of each supply/demand variable to the coupling coordination degree in the RF model. A higher increase in mean squared error (%IncMSE) corresponds to greater variable importance, while a negative %IncMSE value indicates minimal impact. The results indicated that Weibo Check-ins (WC) and POIs Density (PD) were the most crucial determinants of the balance of supply and demand in BRS, with the highest average importance values at 38.95% and 25.07, respectively, and both variables having P-values below 0.01 and 0.05. Moreover, Safety Instructions (SI), Beach Length (BL), Garbage (BG), Integrity of Service System (IS), and Beach Area (BA) demonstrated relatively high importance values, representing them as key factors controlling the balance between supply and demand of BRS.
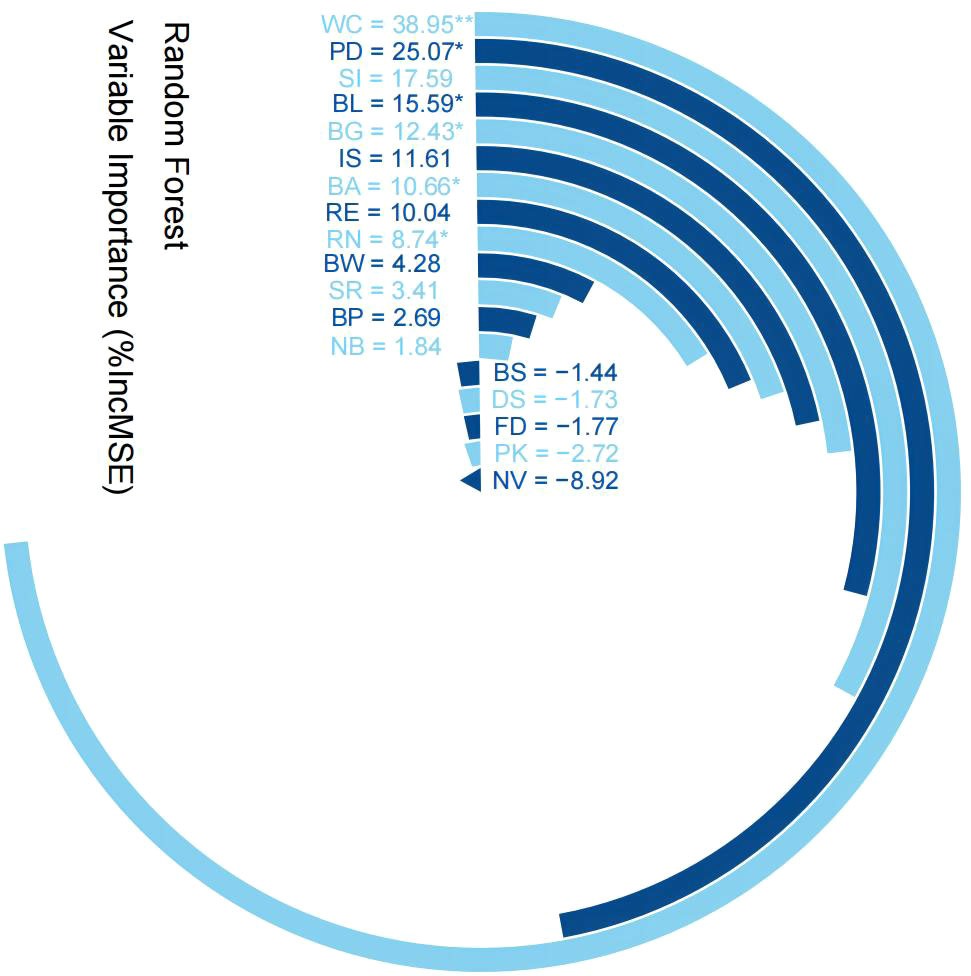
Figure 7 Average importance value for each variable in the RF model. WC, Weibo Check-in; PD, POIs Density; BL, Beach Length; BW, Beach Width; BA, Beach Area; BS, Sand Size; BP, Beach Shape; NV, Natural Vegetation; PK, Parking; IS, Integrity of Service System; RE, Recreation Equipment; RN, Number of Access Roads; NB, Number of Bus Stops; BG, Garbage; DS, Drains or Discharges; FD, Floating Debris in Water; SI, Safety Instructions; SR, Safety and Rescue. “*” and “**” indicate p-values less than 0.05 and 0.01, respectively.
4 Discussion
4.1 Novel method of CES demand based on POIs density
Concerning burgeoning recreation and tourism needs (Defeo et al., 2021), assessing demand for coastal ecosystem services (CES) through a spatially-explicit approach is critical for sustainable coastal management (Liu et al., 2020; Erskine et al., 2021). Recent studies have shown that complementing social media data with additional recreation proxy represents a reliable solution to improve the accuracy of public preferences (Komossa et al., 2020; You et al., 2022). As expected, many studies have demonstrated that POIs data perform well in understanding travel activities and public preferences. Liu et al. (2022) employed POIs distribution as a key node for identifying individual travel activities. Zhao et al. (2019) indicated that POIs presented attraction to the population and enhanced the accuracy of fine-grained population distribution mapping. Li et al. (2022) found that POIs have a strong influence on public preference and tourism satisfaction from word frequency analysis of tourists. Indeed, we found a significant positive correlation (p-value<0.01) between the POIs density and check-in data at the beach in DPNA. In light of such results, POIs density is a reliable surrogate for public preferences, precisely CES demand.
Our study proposed a spatially-explicit method to effectively represent the high-resolution mapping of demand for recreational CES relating to public preferences. Consistent with recent studies (Schirpke et al., 2018; Tardieu and Tuffery, 2019), our model overcame the difficulties in CES demand, which relied heavily on societal value analysis to quantify social preferences and human perception. These methods derived a prediction function of recreation demand based on the displayed preferences of real individuals, but the results are often (1) mainly the sum of visits on record and (2) semi-quantitative analysis based on questionnaires. We thus introduced geospatial big data and social media data, i.e., POIs and Weibo check-in, as the demand surrogates to address those difficulties. The method for estimating demand for recreational CES was considered, providing direct and cost-effective results for high-resolution and long time-series mapping for CES demand on fine scales.
4.2 Impact of POIs for sustainable coastal management
Our research highlights the significant contribution of POIs density to the balance between the supply and demand of BRS (Figure 7), improving the comprehensive understanding of socio-cultural preferences toward CES (Ebner et al., 2022). This result is consistent with previous literature (Kulczyk et al., 2018; Schirpke et al., 2019), demonstrating the importance of infrastructure as a major driver of local tourism development. In comparison with prior research, we have observed an increasing trend of infrastructure development within Dapeng New District (DPND) from 2014 to 2021, promoting a balanced relationship between supply and demand of BRS. Sun et al. (2014) underscored the constraints arising from inadequate environmental and tourism infrastructure within DPND, serving as an imbalanced supply-demand of recreation and a notable impediment to tourism development. A similar phenomenon was observed in Long et al. (2020) research, they identified several beaches with high recreational potential in DPND in 2015 but noted insufficient infrastructure development in areas such as Yangmeikeng Beach, Eastchong Beach, Luzui Beach, and Shayunchong Beach. However, we found that these beaches may experience a substantial increase in infrastructure in recent years. In 2020, they exhibited a high or moderate level of infrastructure density, accompanied by a balanced relationship between the supply and demand of recreational services.
CES should focus on not only the supply of ecosystems but also the suitable development of infrastructure. However, we found that there was a spatial disparity in the distribution of POIs numbers on DPND, contributing to the imbalanced supply-demand of BRS. For example, very low POIs density was presented despite the high supply on Xiasha Beach (bathing beach) and Judiaosha Beach (enclosure beach). The imbalanced state of high supply-low demand of BRS possibly influences the benefits of people enjoying nature experiences (Bratman et al., 2019). Meanwhile, the provision of ecosystem services and their benefits are not evenly distributed in space (Martín-López et al., 2019; Chen et al., 2022). Allocating physical infrastructures has the potential to mitigate these unequal uses and benefits by increasing the recreational attractiveness located on low-preference beaches (McPhearson et al., 2022). Future studies should conduct more in-depth analyses on the evolution of supply-demand dynamics and explore the critical threshold of infrastructure density required to maintain a balanced regime between the supply and demand of BRS, thereby mitigating potential negative environmental impacts.
4.3 Implications for coastal beach management
Concerning the recreation sustainability of coastal beaches in sustainable management, it is imperative to address the imbalanced supply-demand of BRS on DPND. Some measures and strategies for beach types should be proposed by considering the predominant variable of balanced BRS (Figure 7), contributing to sustainable coastal management and human mental health relating to SDG 14 (Life Below Water) and SDG 3 (Good Health and Well-Being). Bathing beaches with high supply and low demand for recreation services are predominantly associated with low POIs density, for example, Xiasha Beach and Rose Coast Beach. Such large beaches have a high capacity for recreational supply, and thus promoting public preference by properly constructing POIs such as tourism and blue infrastructure would be an effective way. Environmental cleanliness and safety-related measures improvement is a priority for the open beach, contributing to mitigating the imbalance where the low supply is incongruent with the high demand for BRS. Closed beaches should be prioritized to focus on ecosystem protection and prevent ecosystem degradation. Simultaneously, to ensure the coordinated development between tourism growth and environmental protection, integrated management addressing the negative impacts of recreational activities on the environment could be regulated through various interventions. For example, controlling visitor numbers is essential to prevent tourism activities from exerting excessive pressure on the coastal beach ecosystem. Additionally, regular environmental monitoring of the beach and surrounding waters, along with public education activities on environmental protection, plays a vital role in safeguarding the coastal ecosystem. We suggest a management strategy for the collaborative development of nearby beaches, which includes integrating crucial factors that influence the coupling coordination degree, such as the beach size and POIs. This strategy is also emphasized in the Shenzhen Coastal Zone Comprehensive Protection and Utilization Plan (2018-2035). For example, an industry of water-based sports could be considered for bathing beaches with large sizes, such as between Xichong Beach and Rose Coast Beach, and Westchong Beach and Eastchong Beach. Additionally, given the abundance of local coral reef resources around enclosure beaches on the western coastline of DPND, a cultural and creative industry, and coral conservation base may be appropriate.
5 Conclusions
Our study integrated multi-source big data to perform a feasible framework for the supply-demand of recreation services assessment for coastal beaches, identifying the imbalance of beaches for sustainable management. POIs density and social media data had a good performance in mapping demand of beach recreation services, with lower costs, higher resolution, and more efficiency than traditional empirical methods.
Combining supply and demand information supports spatially-explicit assessment presenting a reasonable basis for identifying the imbalanced beach to make appropriate interventions. We found that most coastal beaches on DPND exhibited an imbalance in the supply-demand of recreation services. Nevertheless, POIs density can predominantly impact the relationship between the supply and demand of recreation services. Appropriately increasing infrastructure construction could significantly contribute to a balanced supply-demand of beach recreation services. Meantime, a strategy for the collaborative development of nearby beaches and the establishment of industrial infrastructure for coastal beaches could be considered.
Furthermore, for beaches with high supply-low demand for recreation services, appropriate infrastructure construction (e.g. tourism or blue-green infrastructure) to attract more people could be considered. For beaches with low supply-high demand, such as open beaches, environmental-friendly management and security measures improvement should be prioritized. Closed beaches are necessary to improve ecosystem protection and prevent degradation. In addition, considering public preferences might be essential to support sustainable coastal development and long-term human health improvement, particularly in the face of the increasing epidemic or natural disaster risk.
Data availability statement
The original contributions presented in the study are included in the article/Supplementary Material. Further inquiries can be directed to the corresponding author.
Author contributions
TL: Conceptualization, Methodology, Writing – original draft, Writing – review & editing. ZX: Conceptualization, Writing – review & editing. YL: Conceptualization, Funding acquisition, Project administration, Supervision, Writing – review & editing.
Funding
The author(s) declare financial support was received for the research, authorship, and/or publication of this article. Financial support was provided by the National Natural Science Foundation of China Grants (No.41976208).
Acknowledgments
We would appreciate Ms. Youzhu Zhao and Mr. Weihuang Chen at Xiamen University providing valuable suggestions and help with Figure 3 for this research, respectively.
Conflict of interest
The authors declare that the research was conducted in the absence of any commercial or financial relationships that could be construed as a potential conflict of interest.
Publisher’s note
All claims expressed in this article are solely those of the authors and do not necessarily represent those of their affiliated organizations, or those of the publisher, the editors and the reviewers. Any product that may be evaluated in this article, or claim that may be made by its manufacturer, is not guaranteed or endorsed by the publisher.
Supplementary material
The Supplementary Material for this article can be found online at: https://www.frontiersin.org/articles/10.3389/fmars.2024.1288112/full#supplementary-material
References
Aalders I., Stanik N. (2019). Spatial units and scales for cultural ecosystem services: a comparison illustrated by cultural heritage and entertainment services in Scotland. Landscape Ecology. 34, 1635–1651. doi: 10.1007/s10980-019-00827-6
Barros C., Moya-Gómez B., Gutiérrez J. (2020). Using geotagged photographs and GPS tracks from social networks to analyse visitor behaviour in national parks. Curr. Issues Tourism 23, 1291–1310. doi: 10.1080/13683500.2019.1619674
Bing Z., Qiu Y., Huang H., Chen T., Zhong W., Jiang H. (2021). Spatial distribution of cultural ecosystem services demand and supply in urban and suburban areas: A case study from Shanghai, China. Ecol. Indic. 127, 107720. doi: 10.1016/j.ecolind.2021.107720
Bratman G. N., Anderson C. B., Berman M. G., Cochran B., de Vries S., Flanders J., et al. (2019). Nature and mental health: An ecosystem service perspective. Sci. Adv. 5, eaax0903. doi: 10.1126/sciadv.aax0903
Chatterjee P., Dasgupta R., Paul A. K. (2022). Beach beauty in Bengal: Perception of scenery and its implications for coastal management in Purba Medinipur district, eastern India. Mar. Policy 139, 105034. doi: 10.1016/j.marpol.2022.105034
Chen C.-L., Bau Y.-P. (2016). Establishing a multi-criteria evaluation structure for tourist beaches in Taiwan: A foundation for sustainable beach tourism. Ocean Coast. Manage. 121, 88–96. doi: 10.1016/j.ocecoaman.2015.12.013
Chen Y., Ge Y., Yang G., Wu Z., Du Y., Mao F., et al. (2022). Inequalities of urban green space area and ecosystem services along urban center-edge gradients. Landscape Urban Plann. 217, 104266. doi: 10.1016/j.landurbplan.2021.104266
Costanza R., de Groot R., Braat L., Kubiszewski I., Fioramonti L., Sutton P., et al. (2017). Twenty years of ecosystem services: How far have we come and how far do we still need to go? Ecosystem Serv. 28, 1–16. doi: 10.1016/j.ecoser.2017.09.008
Crouzat E., De Frutos A., Grescho V., Carver S., Büermann A., Carvalho-Santos C., et al. (2022). Potential supply and actual use of cultural ecosystem services in mountain protected areas and their surroundings. Ecosystem Serv. 53, 101395. doi: 10.1016/j.ecoser.2021.101395
Daniel T. C., Muhar A., Arnberger A., Aznar O., Boyd J. W., Chan K. M. A., et al. (2012). Contributions of cultural services to the ecosystem services agenda. Proc. Natl. Acad. Sci. U. S. A. 109, 8812–8819. doi: 10.1073/pnas.1114773109
Defeo O., McLachlan A., Armitage D., Elliott M., Pittman J. (2021). Sandy beach social–ecological systems at risk: regime shifts, collapses, and governance challenges. Front. Ecol. Environ. 19, 564–573. doi: 10.1002/fee.2406
Denisko D., Hoffman M. M. (2018). Classification and interaction in random forests. Proc. Natl. Acad. Sci. 115 (8), 1690–1692. doi: 10.1073/pnas.1800256115
Donahue M. L., Keeler B. L., Wood S. A., Fisher D. M., Hamstead Z. A., McPhearson T. (2018). Using social media to understand drivers of urban park visitation in the Twin Cities, MN. Landscape Urban Plann. 175, 1–10. doi: 10.1016/j.landurbplan.2018.02.006
Duffy R. (2015). Nature-based tourism and neoliberalism: concealing contradictions. Tourism Geographies 17, 529–543. doi: 10.1080/14616688.2015.1053972
Ebner M., Schirpke U., Tappeiner U. (2022). Combining multiple socio-cultural approaches–Deeper insights into cultural ecosystem services of mountain lakes? Landscape Urban Plann. 228, 104549. doi: 10.1016/j.landurbplan.2022.104549
Erskine E., Baillie R., Lusseau D. (2021). Marine Protected Areas provide more cultural ecosystem services than other adjacent coastal areas. One Earth 4, 1175–1185. doi: 10.1016/j.oneear.2021.07.014
Fan Z., Zhang F., Loo B. P. Y., Ratti C. (2023). Urban visual intelligence: Uncovering hidden city profiles with street view images. Proc. Natl. Acad. Sci. 120, e2220417120. doi: 10.1073/pnas.2220417120
Ghermandi A. (2022). Geolocated social media data counts as a proxy for recreational visits in natural areas: A meta-analysis. J. Environ. Manage. 317, 115325. doi: 10.1016/j.jenvman.2022.115325
Ghermandi A., Sinclair M. (2019). Passive crowdsourcing of social media in environmental research: A systematic map. Global Environ. Change 55, 36–47. doi: 10.1016/j.gloenvcha.2019.02.003
Gould R. K., Morse J. W., Adams A. B. (2019). Cultural ecosystem services and decision-making: How researchers describe the applications of their work. People Nat. 1, 457–475. doi: 10.1002/pan3.10044
Huynh L. T. M., Gasparatos A., Su J., Dam Lam R., Grant E. I., Fukushi K. (2022). Linking the nonmaterial dimensions of human-nature relations and human well-being through cultural ecosystem services. Sci. Adv. 8, eabn8042. doi: 10.1126/sciadv.abn8042
Inácio M., Gomes E., Bogdzevič K., Kalinauskas M., Zhao W., Pereira P. (2022). Mapping and assessing coastal recreation cultural ecosystem services supply, flow, and demand in Lithuania. J. Environ. Manage. 323, 116175. doi: 10.1016/j.jenvman.2022.116175
Jeon C.-Y., Yang H.-W. (2021). The structural changes of a local tourism network: comparison of before and after COVID-19. Curr. Issues Tourism 24, 3324–3338. doi: 10.1080/13683500.2021.1874890
Karasov O., Heremans S., Külvik M., Domnich A., Burdun I., Kull A., et al. (2022). Beyond land cover: How integrated remote sensing and social media data analysis facilitates assessment of cultural ecosystem services. Ecosystem Serv. 53, 101391. doi: 10.1016/j.ecoser.2021.101391
Komossa F., Wartmann F. M., Kienast F., Verburg P. H. (2020). Comparing outdoor recreation preferences in peri-urban landscapes using different data gathering methods. Landscape Urban Plann. 199, 103796. doi: 10.1016/j.landurbplan.2020.103796
Kulczyk S., Woźniak E., Derek M. (2018). Landscape, facilities and visitors: An integrated model of recreational ecosystem services. Ecosystem Serv. 31, 491–501. doi: 10.1016/j.ecoser.2018.02.016
Kurniawan F., Adrianto L., Bengen D. G., Prasetyo L. B. (2019). The social-ecological status of small islands: An evaluation of island tourism destination management in Indonesia. Tourism Manage. Perspect. 31, 136–144. doi: 10.1016/j.tmp.2019.04.004
Lavorel S., Rey P.-L., Grigulis K., Zawada M., Byczek C. (2020). Interactions between outdoor recreation and iconic terrestrial vertebrates in two French alpine national parks. Ecosystem Serv. 45, 101155. doi: 10.1016/j.ecoser.2020.101155
Levin N., Lechner A. M., Brown G. (2017). An evaluation of crowdsourced information for assessing the visitation and perceived importance of protected areas. Appl. Geogr. 79, 115–126. doi: 10.1016/j.apgeog.2016.12.009
Li F., Li F., Li S., Long Y. (2020). Deciphering the recreational use of urban parks: Experiments using multi-source big data for all Chinese cities. Sci. Total Environ. 701, 134896. doi: 10.1016/j.scitotenv.2019.134896
Li M., Kwan M.-P., Wang F., Wang J. (2018). Using points-of-interest data to estimate commuting patterns in central Shanghai, China. J. Transport Geogr. 72, 201–210. doi: 10.1016/j.jtrangeo.2018.09.004
Li Y., Xie L., Zhang L., Huang L., Lin Y., Su Y., et al. (2022). Understanding different cultural ecosystem services: An exploration of rural landscape preferences based on geographic and social media data. J. Environ. Manage. 317, 115487. doi: 10.1016/j.jenvman.2022.115487
Liu H., Remme R. P., Hamel P., Nong H., Ren H. (2020). Supply and demand assessment of urban recreation service and its implication for greenspace planning-A case study on Guangzhou. Landscape Urban Plann. 203, 103898. doi: 10.1016/j.landurbplan.2020.103898
Liu X., Wu M., Peng B., Huang Q. (2022). Graph-based representation for identifying individual travel activities with spatiotemporal trajectories and POI data. Sci. Rep. 12, 15769. doi: 10.1038/s41598-022-19441-9
Long X. L., Chen P. M., Duan X. W., Chen J. R., Wei X., Shi J. (2020). Study on beaches quality evaluation in Dapeng peninsula, Shenzhen. Mar. Environ. Sci. 39 (4), 576–584. doi: 10.13634/j.cnki.mes.2020.04.012
Mancini F., Coghill G. M., Lusseau D. (2018). Using social media to quantify spatial and temporal dynamics of nature-based recreational activities. PloS One 13, e0200565. doi: 10.1371/journal.pone.0200565
Manley K., Nyelele C., Egoh B. N. (2022). A review of machine learning and big data applications in addressing ecosystem service research gaps. Ecosystem Serv. 57, 101478. doi: 10.1016/j.ecoser.2022.101478
Martín-López B., Felipe-Lucia M. R., Bennett E. M., Norström A., Peterson G., Plieninger T., et al. (2019). A novel telecoupling framework to assess social relations across spatial scales for ecosystem services research. J. Environ. Manage. 241, 251–263. doi: 10.1016/j.jenvman.2019.04.029
McPhearson T., Cook E. M., Berbés-Blázquez M., Cheng C., Grimm N. B., Andersson E., et al. (2022). A social-ecological-technological systems framework for urban ecosystem services. One Earth 5, 505–518. doi: 10.1016/j.oneear.2022.04.007
Meng S., Huang Q., Zhang L., He C., Inostroza L., Bai Y., et al. (2020). Matches and mismatches between the supply of and demand for cultural ecosystem services in rapidly urbanizing watersheds: A case study in the Guanting Reservoir basin, China. Ecosystem Serv. 45, 101156. doi: 10.1016/j.ecoser.2020.101156
Morales G. G., Arreola-Lizárraga J. A., Grano P. R. (2018). Integrated assessment of recreational quality and carrying capacity of an urban beach. Coast. Manage. 46, 316–333. doi: 10.1080/08920753.2018.1474070
Moreno-Llorca R., Méndez F., Ros-Candeira A., Alcaraz-Segura D., Santamaría L., Ramos-Ridao Á.F., et al. (2020). Evaluating tourist profiles and nature-based experiences in Biosphere Reserves using Flickr: Matches and mismatches between online social surveys and photo content analysis. Sci. Total Environ. 737, 140067. doi: 10.1016/j.scitotenv.2020.140067
Moyle B. D., Scherrer P., Weiler B., Wilson E., Caldicott R., Nielsen N. (2017). Assessing preferences of potential visitors for nature-based experiences in protected areas. Tourism Manage. 62, 29–41. doi: 10.1016/j.tourman.2017.03.010
Oteros-Rozas E., Martín-López B., Fagerholm N., Bieling C., Plieninger T. (2018). Using social media photos to explore the relation between cultural ecosystem services and landscape features across five European sites. Ecol. Indic. 94, 74–86. doi: 10.1016/j.ecolind.2017.02.009
Peña L., Casado-Arzuaga I., OnaIndia M. (2015). Mapping recreation supply and demand using an ecological and a social evaluation approach. Ecosystem Serv. 13, 108–118. doi: 10.1016/j.ecoser.2014.12.008
Peña-Alonso C., Pérez-Chacón E., Hernández-Calvento L., Ariza E. (2018). Assessment of scenic, natural and cultural heritage for sustainable management of tourist beaches. A case study of Gran Canaria island (Spain). Land Use Policy 72, 35–45. doi: 10.1016/j.landusepol.2017.12.030
Pouso S., Borja Á., Uyarra M. C. (2020). An interdisciplinary approach for valuing changes after ecological restoration in marine cultural ecosystem services. Front. Mar. Sci. 7. doi: 10.3389/fmars.2020.00715
Schirpke U., Altzinger A., Leitinger G., Tasser E. (2019). Change from agricultural to touristic use: Effects on the aesthetic value of landscapes over the last 150 years. Landscape Urban Plann. 187, 23–35. doi: 10.1016/j.landurbplan.2019.03.004
Schirpke U., Meisch C., Marsoner T., Tappeiner U. (2018). Revealing spatial and temporal patterns of outdoor recreation in the European Alps and their surroundings. Ecosystem Serv. 31, 336–350. doi: 10.1016/j.ecoser.2017.11.017
Semeoshenkova V., Newton A., Contin A., Greggio N. (2017). Development and application of an integrated beach quality index (BQI). Ocean Coast. Manage. 143, 74–86. doi: 10.1016/j.ocecoaman.2016.08.013
Shen L., Huang Y., Huang Z., Lou Y., Ye G., Wong S. W. (2018). Improved coupling analysis on the coordination between socio-economy and carbon emission. Ecol. Indic. 94, 357–366. doi: 10.1016/j.ecolind.2018.06.068
Shi B., Zhao J., Chen P.-J. (2017). Exploring urban tourism crowding in Shanghai via crowdsourcing geospatial data. Curr. Issues Tourism 20, 1186–1209. doi: 10.1080/13683500.2016.1224820
Sinclair M., Mayer M., Woltering M., Ghermandi A. (2020). Valuing nature-based recreation using a crowdsourced travel cost method: A comparison to onsite survey data and value transfer. Ecosystem Serv. 45, 101165. doi: 10.1016/j.ecoser.2020.101165
Steven A., Addo K. A., Llewellyn G., Ca V. T., Boateng I., Bustamante R., et al. (2020). Coastal Development: Resilience, Restoration and Infrastructure Requirements (Washington DC: World Resources Institute). Available at: www.oceanpanel.org/blue-papers/coastal-development-resilience-restoration-and-infrastructure-requirements.
Su X., Spierings B., Dijst M., Tong Z. (2020). Analysing trends in the spatio-temporal behaviour patterns of mainland Chinese tourists and residents in Hong Kong based on Weibo data. Curr. Issues Tourism 23, 1542–1558. doi: 10.1080/13683500.2019.1645096
Subiza-Pérez M., Vozmediano L., San Juan C. (2020). Green and blue settings as providers of mental health ecosystem services: Comparing urban beaches and parks and building a predictive model of psychological restoration. Landscape Urban Plann. 204, 103926. doi: 10.1016/j.landurbplan.2020.103926
Sun R., Li F., Chen L. (2019). A demand index for recreational ecosystem services associated with urban parks in Beijing, China. J. Environ. Manage. 251, 109612. doi: 10.1016/j.jenvman.2019.109612
Sun F. F., Ye Y. H., Yu B. D., Tan Q. L., Wu G. Z., Zhang Y., et al. (2014). Assessment of resource and environment carrying capacity of Dapeng Peninsula, Guangdong. Ecol. Sci. 33, 1194–1199. doi: 10.14108/j.cnki.1008-8873.2014.06.026
Tang Z. (2015). An integrated approach to evaluating the coupling coordination between tourism and the environment. Tourism Manage. 46, 11–19. doi: 10.1016/j.tourman.2014.06.001
Tardieu L., Tuffery L. (2019). From supply to demand factors: What are the determinants of attractiveness for outdoor recreation? Ecol. Economics 161, 163–175. doi: 10.1016/j.ecolecon.2019.03.022
Tu W., Zhu T., Xia J., Zhou Y., Lai Y., Jiang J., et al. (2020). Portraying the spatial dynamics of urban vibrancy using multisource urban big data. Computers Environ. Urban Syst. 80, 101428. doi: 10.1016/j.compenvurbsys.2019.101428
van den Bosch M., Ode Sang Å. (2017). Urban natural environments as nature-based solutions for improved public health – A systematic review of reviews. Environ. Res. 158, 373–384. doi: 10.1016/j.envres.2017.05.040
Vaz A. S., Gonçalves J. F., Pereira P., Santarém F., Vicente J. R., Honrado J. P. (2019). Earth observation and social media: Evaluating the spatiotemporal contribution of non-native trees to cultural ecosystem services. Remote Sens. Environ. 230, 111193. doi: 10.1016/j.rse.2019.05.012
Villamagna A. M., Angermeier P. L., Bennett E. M. (2013). Capacity, pressure, demand, and flow: A conceptual framework for analyzing ecosystem service provision and delivery. Ecol. Complexity 15, 114–121. doi: 10.1016/j.ecocom.2013.07.004
Vousdoukas M. I., Ranasinghe R., Mentaschi L., Plomaritis T. A., Athanasiou P., Luijendijk A., et al. (2020). Sandy coastlines under threat of erosion. Nat. Climate Change 10, 260–263. doi: 10.1038/s41558-020-0697-0
Wei H., Fan W., Wang X., Lu N., Dong X., Zhao Y., et al. (2017). Integrating supply and social demand in ecosystem services assessment: A review. Ecosystem Serv. 25, 15–27. doi: 10.1016/j.ecoser.2017.03.017
Wolff S., Schulp C. J. E., Verburg P. H. (2015). Mapping ecosystem services demand: A review of current research and future perspectives. Ecol. Indic. 55, 159–171. doi: 10.1016/j.ecolind.2015.03.016
Xin R., Skov-Petersen H., Zeng J., Zhou J., Li K., Hu J., et al. (2021). Identifying key areas of imbalanced supply and demand of ecosystem services at the urban agglomeration scale: A case study of the Fujian Delta in China. Sci. Total Environ. 791, 148173. doi: 10.1016/j.scitotenv.2021.148173
Xu L., Shi Y., Fang H., Zhou G., Xu X., Chen L., et al. (2018). Vegetation carbon stocks driven by canopy density and forest age in subtropical forest ecosystems. Sci. Total Environ. 631, 619–626. doi: 10.1016/j.scitotenv.2018.03.080
You S., Zheng Q., Chen B., Xu Z., Lin Y., Gan M., et al. (2022). Identifying the spatiotemporal dynamics of forest ecotourism values with remotely sensed images and social media data: A perspective of public preferences. J. Cleaner Production 341, 130715. doi: 10.1016/j.jclepro.2022.130715
Yu F., Cai F., Li W. J. (2010). Discussion on beach quality standards rating system in China. J. Natural Resour. 26, 541–551. doi: 10.11849/zrzyxb.2011.04.001
Keywords: cultural ecosystem services (CES), point of interest (POI), public preferences, sustainable management, coastal beach
Citation: Li T, Xiang Z and Li Y (2024) POIs-based public preferences mapping on imbalanced supply-demand of recreation services can support sustainable coastal beach management. Front. Mar. Sci. 11:1288112. doi: 10.3389/fmars.2024.1288112
Received: 03 September 2023; Accepted: 16 January 2024;
Published: 07 February 2024.
Edited by:
Agostino Tomasello, University of Palermo, ItalyReviewed by:
Mariangela Sciandra, University of Palermo, ItalyMonica Montefalcone, University of Genoa, Italy
Copyright © 2024 Li, Xiang and Li. This is an open-access article distributed under the terms of the Creative Commons Attribution License (CC BY). The use, distribution or reproduction in other forums is permitted, provided the original author(s) and the copyright owner(s) are credited and that the original publication in this journal is cited, in accordance with accepted academic practice. No use, distribution or reproduction is permitted which does not comply with these terms.
*Correspondence: Yangfan Li, eWFuZ2ZAeG11LmVkdS5jbg==