 KyungJae Lee
 Jae-Hyoung Park
 Young-Gyu Park
- 1Ocean Circulation & Climate Research Department, Korea Institute of Ocean Science and Technology, Busan, Republic of Korea
- 2Division of Earth and Environmental System Sciences, Pukyong National University, Busan, Republic of Korea
Introduction: Understanding the underlying dynamics of regional sea-level rise (SLR), which often deviates from global trends, is crucial for mitigating and adapting to the impacts of severe climate change. This study investigated the causes of high regional SLR rates (> 6.0 mm yr-1) around the frontal region near Ulleung Island in the southwestern East/Japan Sea (EJS). Despite exhibiting rates higher than the global average (3.1 mm yr-1) from 1993 to 2020, the reasons for these higher rates in this region have not been clearly elucidated.
Methods: We aimed to clarify the quantitative effect of the long-term variations of the Ulleung Warm Eddy (UWE) on the high SLR rates near Ulleung Island based on satellite altimetry and ship-based hydrographic data.
Results: During this period, the temperature within the UWE increased, particularly at the temperature-homogeneous layer of approximately 200 m, the lower boundary of the UWE deepened, and the eddy duration per year increased, resulting in high SLR rates within the eddy owing to the steric height rise. The long-term variations in the internal temperature and vertical thickness of the UWE had significantly comparable impacts on SLR rates, with the duration being less influential. The SLR rates by integrating all long-term variations in the UWE (7.6 mm yr-1) quantitatively explained the high long-term SLR rates at Ulleung Island (7.0 mm yr-1).
Discussion: The increasing temperature within the UWE was attributed to the rising temperature of water flowing through the southwestern strait (Korean Strait) in late fall, and the deepening lower boundary and the increasing duration of the UWE resulted from the increased horizontal temperature gradients near the front, leading to enhanced baroclinic instability in the subsurface layers. Our findings suggest that long-term variations in mesoscale eddies can significantly influence the regional SLR rates, deviating substantially from the global average in the frontal region.
1 Introduction
Sea-level rise (SLR) is a pressing issue that is associated with climate change. It poses a serious threat to coastal ecosystems, infrastructure, and human livelihoods, highlighting the need to monitor the current status and understand the underlying dynamics to respond to and mitigate its impacts. At a regional scale, the SLR rates often differ from the global SLR rate (3.1 mm yr-1 for 1993–2020; Von Schuckmann et al., 2021), complicating the understanding of the exact SLR state (Cazenave and Llovel, 2010; Nicholls and Cazenave, 2010; Church and White, 2011; Vinogradov and Ponte, 2011; Stammer et al., 2013). These regional and global SLR rate discrepancies are primarily attributed to dynamic fluctuations in ocean circulation, which, in turn, are a consequence of ongoing climate change (Stammer et al., 2013). Frontal regions in the ocean, distinguished by large horizontal temperature gradients and strong lateral currents, exhibit particularly deviated regional SLR rates, such as the Kuroshio extension (Qiu et al, 2015) and the South Atlantic Ocean (Ruiz-Etcheverry and Saraceno, 2020). Despite previous research, the physical mechanisms driving regional SLR rates in the vicinity of the frontal regions have not been fully elucidated.
The East/Japan Sea (EJS) is a region that shows relatively large spatial variability in regional SLR rates (1–8 mm yr-1) based on satellite altimetry data from 1993 to 2020, despite being a small and semi-closed marginal sea (Watson and Lim, 2020; Figure 1). The EJS, with an average depth of 1700 m, borders the east coast of the Korean Peninsula, is located in the northwestern part of the Pacific Ocean, and is composed of two regions: the southern and northern regions with warm and cold water, respectively. In the southern region, the Tsushima Warm Current, which is a branch of the Kuroshio Current, enters the EJS through a narrow (< 100 km) and shallow (< 200 m) strait (Korea/Tsushima Strait, KTS) and exits through two narrow straits at the eastern boundary of the EJS. The East Korea Warm Current (EKWC), one of the branches of the Tsushima Warm Current, flows northward along the east coast of the Korean Peninsula as a western boundary current, and splits off towards the offshore around 36–38°N, which is associated with the formation of the warm eddies around the Ulleung Island (Lee, 1999; Shin et al., 2005; Chang et al., 2016). In the northern region, cold water generated by a strong upward heat flux in winter flows cyclonically along the coastline. Between these warm and cold regions, a strong front, which is referred to as a subpolar front, is formed between 38°N and 40°N (Chang et al., 2004; Chang et al., 2016). Based on the subpolar front, the southern part shows a stronger warming trend in sea surface temperatures than the northern part (Yeh et al., 2010), which can explain the large spatial variability in regional SLR rates in the EJS (Kang et al., 2005; Yoon et al., 2016).
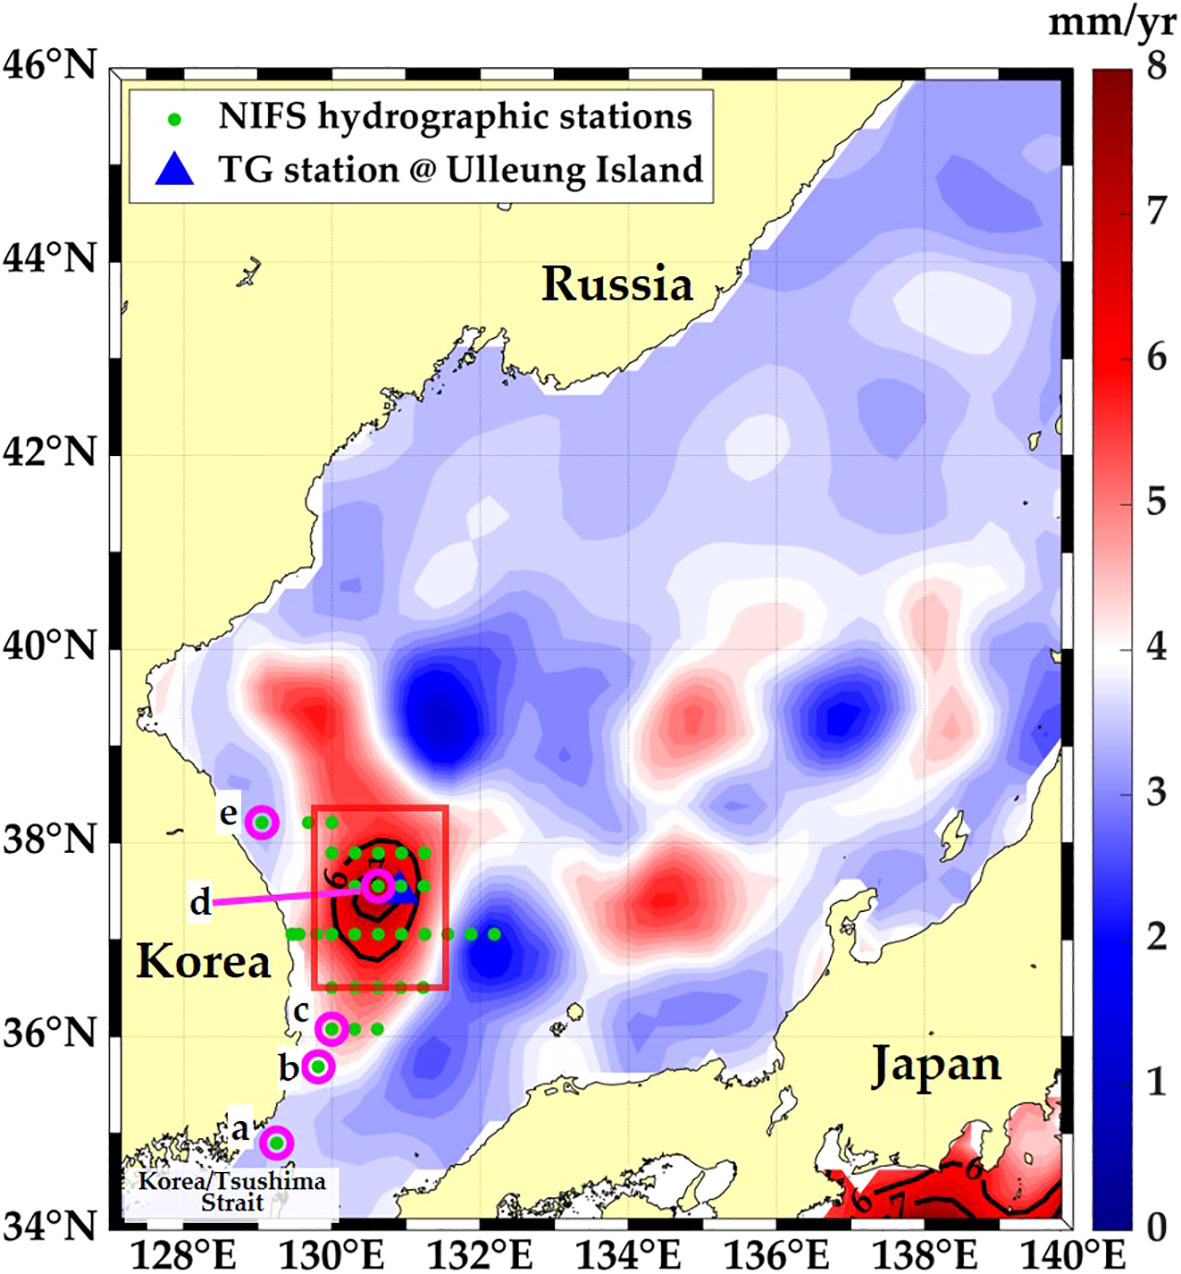
Figure 1 Long-term sea-level rise (SLR) rates based on CMEMS satellite altimetry data in the East/Japan Sea (EJS). The SLR rates are shown with color shading, and the regions with the SLR rates over 6 mm yr-1 are emphasized with black contours. The southwestern part of the EJS which is the interested domain in this study is denoted by the red box. The location of the tide-gauge (TG) station at Ulleung Island and the hydrographic observation stations of National Institute of Fisheries Science (NIFS) the Republic of Korea used in this study are denoted with a blue triangle and green circles, respectively. The NIFS hydrographic stations along the pathway of the East Korea Warm Current (EKWC) (a–c) and on the (d) southern and (e) northern sides of the front are marked with pink open circles.
Relatively high regional SLR rates (> 6 mm yr-1) have been reported around Ulleung Island in the southern part of the EJS based on satellite altimetry data, which are much higher than the global SLR rates (Watson and Lim, 2020). Long-term variations in sea-level in the EJS are known to be driven mainly by the heat content of the upper ocean above 500 m, which is related to the upper circulation pattern, wind-driven circulation, and climate variability around East Asia (Choi et al., 2004; Kang et al., 2005; Yoon et al., 2016). The front movement due to interannual variations in the paths of the Tsushima Warm Current is also responsible for the long-term variability in sea-level in this region (Kim et al., 2002; Choi et al., 2004; Kang et al., 2005; Pak et al., 2019; Lee et al., 2022). Interannual variations in sea-level over the East Asian marginal seas during summer and winter have been attributed to interannual changes in regional sea surface wind patterns (Han et al., 2020a, Han et al., 2020b). Despite the existing research on the various dynamics of long-term sea-level variations in the EJS, a lack of quantitative understanding of the cause of the localized SLR rates exceeding 6 mm yr-1 observed around Ulleung Island in the southwestern region of the EJS remains.
Non-seasonal sea-level variations around Ulleung Island are mainly attributed to variations in steric height due to the migration of warm eddies around the frontal region in the EJS (Kim et al., 2002; Choi et al., 2004; Choi et al., 2009). In the vicinity of Ulleung Island, warm eddies, referred to as Ulleung Warm Eddies (UWE), are frequently produced by the EKWC meandering (Shin et al., 2005; Lee and Niiler, 2010). The UWEs have an average diameter of 100–150 km and a maximum depth of up to 300 m (Shin et al., 2005; Lee et al., 2019), and exhibit the characteristics of intra-thermocline eddies with a 10–12°C mixed layer below 100 m, derived from subduction along the front (Gordon et al., 2002; Ou and Gordon, 2002; Shin et al., 2019). Unlike the mesoscale eddies in the open ocean that propagate westward, the UWE is located in a confined area (“stationary”) or primarily migrates following the mean surface current (Lee et al., 2019). However, high regional SLR rates around Ulleung Island have not yet been quantitatively examined in the context of long-term variations in the UWE characteristics.
This study aimed to quantitatively elucidate the reason for the high SLR rates > 6 mm yr-1 observed during 1993–2020 in the vicinity of Ulleung Island off the east coast of the Korean Peninsula with regard to the long-term variations in the UWE characteristics around the frontal region. The observational data and investigation methods used in this study are described in Section 2. Long-term SLR rates around Ulleung Island and variations in UWE characteristics are presented in Section 3. The results are discussed in Section 4 and summarized and concluded in Section 5.
2 Materials and methods
2.1 Materials
The Copernicus Climate Change (CMEMS C3S) two-satellite gridded merged absolute dynamic topography (ADT) from satellite altimetry (L4) with 1/4° spatial resolution, was used to estimate the spatial patterns of long-term (1993-2020) SLR rates in the EJS and to identify the center and boundary of the UWE. The CMEMS C3S product is characterized by a consistent combination of reference and complementary mission satellite data for each period, minimizing the errors that can arise from orbit adjustments or the introduction of new satellite orbits, making it suitable for the analysis of long-term climate and sea-level variability (CMEMS TAC DUAC products manual). The CMEMS C3S was provided at daily intervals, and specific grid points which is nearest to the Ulleung Island tide gauge (TG) station (130.625°E, 37.625°N; Ulleung Island grid) were selected to compare the long-term variability with sea-level data from Ulleung Island TG station (Figure 1). Sea-level data from the Ulleung Island TG station have been recorded at one-minute intervals since 1983, and data from 1993 to 2020 averaged at one-hour intervals were used for comparison with satellite altimetry data. The sea-level at the TG station was the data applied the inverted-barometer correction to reduce the sea-level variation induced by sea-level pressure.
Ship-based hydrographic data provided by the National Institute of Fisheries Science (NIFS) of the Republic of Korea were used to analyze long-term variations in vertical temperature structures within the UWE (Figure 1). The NIFS data are ship-based observations obtained every two months at 15 standard depths, with the distance between sampling points varying from a minimum of approximately 1.8 km near the coast to a maximum of 28 km in the open sea (Figure 1). Although NIFS data have been collected around the Korean Peninsula since 1961, this study focused on the period from 1993 to 2020, when satellite altimetry data were available. The NIFS dataset provides both salinity and temperature measurements; however, because of the known temporal variability of salinity error variables (Park, 2021), which makes it unsuitable for long-term analysis, only temperature data were used.
2.2 Methods
The centers, boundaries, and tracks of the UWE were identified using gridded satellite altimetry data. First, the SSH-based method (Chelton et al., 2011) was used to identify the centers and boundaries of the mesoscale eddies using the ADT and geostrophic currents based on the ADT from the CMEMS C3S product. The centers of the warm eddies were identified as the grid points with the maximum ADT among the surrounding 3×3 grids, whereas the boundaries were defined by the ADT contours, along which the average geostrophic current velocity reached its maximum among the contours around the grid selected as the warm eddy center. The Rhines scale (), which represents the maximum physical size at which mesoscale structures can grow, was used to extract appropriate mesoscale eddies at a given latitude from the satellite altimetry data (Eden, 2007; Lee et al., 2019), where, is the deviations of the geostrophic current velocities from the temporal mean in each grid, and is the Rossby parameter which denotes the latitudinal differences of the Coriolis parameter. By applying the Rhines scale, mesoscale eddies are defined as having a physically valid size that prevents overestimation without the need for a high-pass filtering process (Lee et al., 2019), and consequently reduces errors in the analysis of long-term variability within Ulleung Warm Eddy (UWE) based on internal temperature profiles. Considering the average migration distance of mesoscale eddies in the EJS (43 km), the detected eddies were tracked, and only those that persisted for more than 35 days were extracted, considering the maximum repeating interval of satellite altimetry orbits (Chelton et al., 2011; Lee et al., 2019). Among the detected and tracked warm eddies in the southwestern part of the EJS, all warm eddies that encompassed Ulleung Island grid at least once during their life cycle (from origin to end) were defined as UWE.
The upper (Hu) and lower boundaries depth (Hl) within the UWE were identified based on the NIFS hydrographic data. Considering the characteristics of the intra-thermocline eddy, which has two thermoclines at the top and bottom of the temperature-homogeneous layer (THL) within the eddy, the thermoclines with the maximum temperature gradient were defined as Hu and Hl. The NIFS temperature profiles observed within the eddy were extracted based on the detected UWE boundaries. The extracted temperature profiles were then linearly interpolated at 1 m vertical intervals, and dT/dz was calculated. Considering the known average mixed-layer depth in the southwestern EJS (60–100 m; Lim et al., 2012), the maximum dT/dz depth below 80 m was defined as Hl, whereas the maximum dT/dz depth above 80 m was defined as Hu. To eliminate the impact of the variation in Hl in each temperature profile due to its position within the eddy, the estimated lower boundary depth was adjusted by considering the deepening shape of the lower boundary of the warm eddy towards its center as a Gaussian profile, according to , as if all profiles were located at the eddy center, where d is the radial distance from the eddy center, R is the radius of the eddy, and and are the lower boundary depths of the given location and the center of the eddy, respectively (Bashmachnikov et al., 2023). The was only used in this study to estimate the long-term variations in the lower boundary of the UWE. It was verified that there was no long-term trend in the distance ratio of d/R, as well as the generation location of the UWE.
Most of the sea-level variations in the vicinity of Ulleung Island are well explained by steric height variations due to the heat content in the upper layer, which can be divided into two parts: increasing the temperature and thickness of the upper layer (Kim et al., 2002; Yoon et al., 2016; Gregory et al., 2019). Similarly, the heat content in the upper layer within the warm eddy can also increase because of both the increase in temperature in the THL and deepening of the lower thermocline, which is due to the thickening of the THL. Their long-term mean and variations, thus, can be expressed as follows, (Yoon et al., 2016). When expanding the right side of the equation, the long-term variation of the heat content, is expressed as, , where the is negligible compared to the other two terms. Thus, can be regarded as the effect of a long-term increase in temperature within the warm eddies, and is the effect of the long-term thickening of the THL in the warm eddies.
The linear trends of the SLR around Ulleung Island, as well as the linear trends of both the temperature within the UWE and depth of its upper and lower boundaries, were calculated to estimate the long-term SLR rates and long-term variations in the temperature and vertical extent of the UWE. To estimate the long-term linear trends of the SLR around Ulleung Island, the sea-level data (ADT from satellite altimetry and sea-level records from Ulleung Island TG station) were averaged annually. In addition, the annual averaged time series of the sea-level was calculated from satellite altimetry data at each center of the UWE (Figure 2). The correlations among the annual averaged time series was calculated after removing the linear trend. To assess the long-term trends in temperature within the UWE and the depths of its upper and lower boundaries, the temperature profiles within the UWE and estimated depths of the upper and lower boundaries of the eddies were averaged annually. Linear regression was then applied to all corresponding 28 years of time series data for each trend calculation. Considering the characteristics of the datasets, which have small sample sizes and large interannual variability compared to long-term trends, a 90% confidence interval was applied to all trend calculations to guarantee a robust analysis (Frederikse et al., 2020).
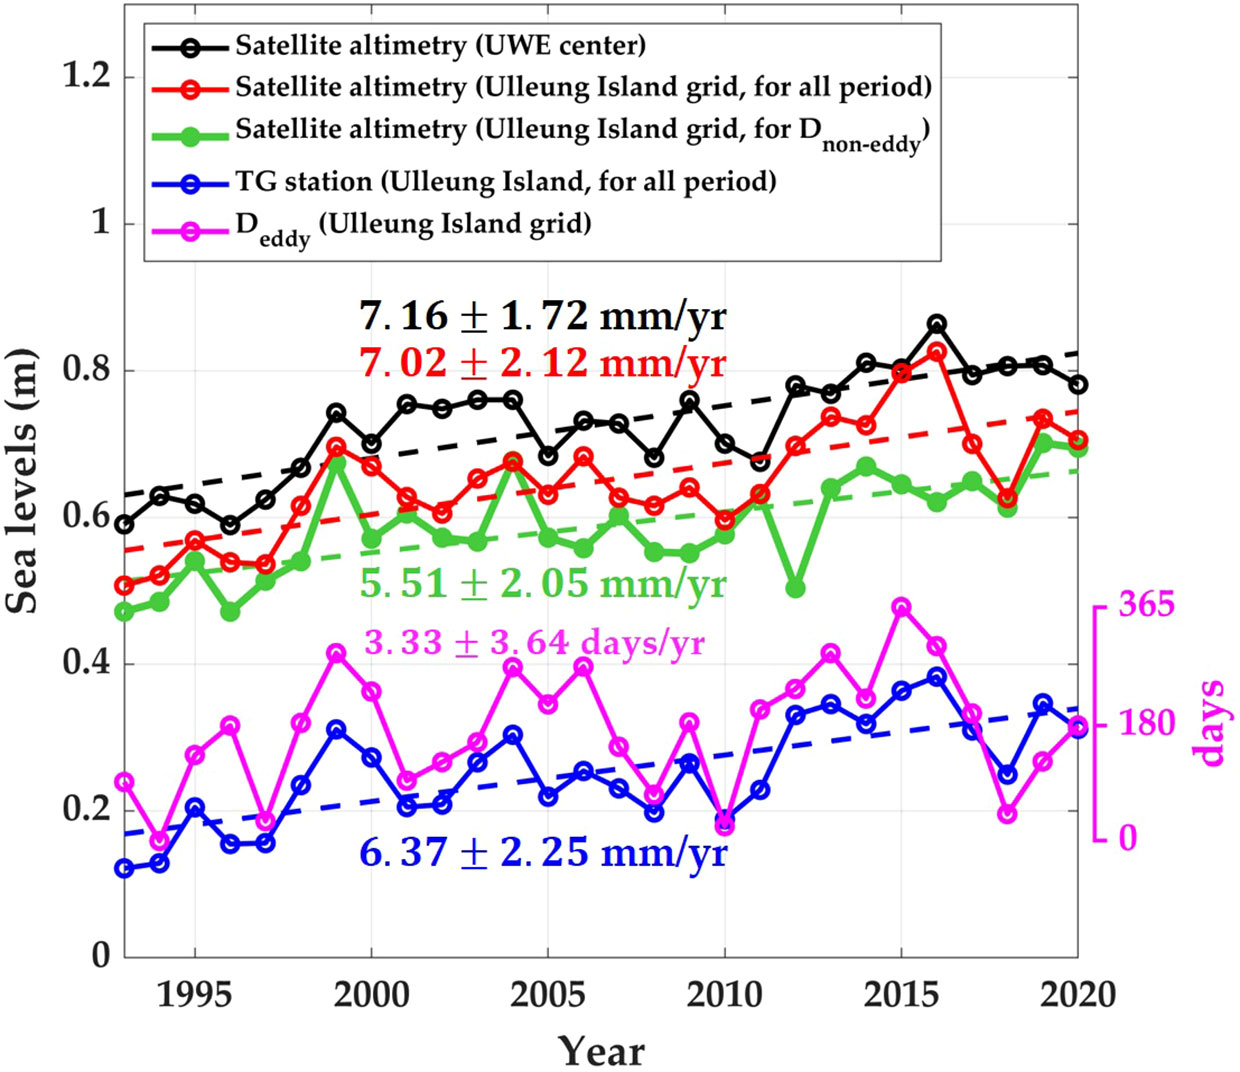
Figure 2 Annually averaged sea-levels from the satellite altimetry (black, red, and green), the tide-gauge (TG) station data (blue), and the Ulleung Warm Eddy (UWE) duration per year () at the Ulleung Island grid (pink). Each graph of the satellite altimetry denotes the sea-levels following the center of Ulleung Warm Eddy (UWE, black), and at the Ulleung Island grid for all period (red) and for (green), respectively. The Ulleung TG station data is denoted for all period (blue). The y-axis for locates on the right side of the axis. Each value is denoted with solid lines and circles, and the long-term trends and rates are denoted with dashed lines and numbers in corresponding colors. The rates are presented with a 90% of confidence interval.
The steric part of the SLR rates due to the long-term variations in the UWE around Ulleung Island was estimated by integrating the steric height rise rate derived from the observed long-term trends in the internal temperature () and vertical extent () of the UWE (Figures 3A, B). The yearly steric height due to the UWE () was estimated by applying the observed linear trends in both the temperature and upper and lower boundaries to the mean temperature profile within the UWE to assess the contribution of each factor separately as Equation 1:
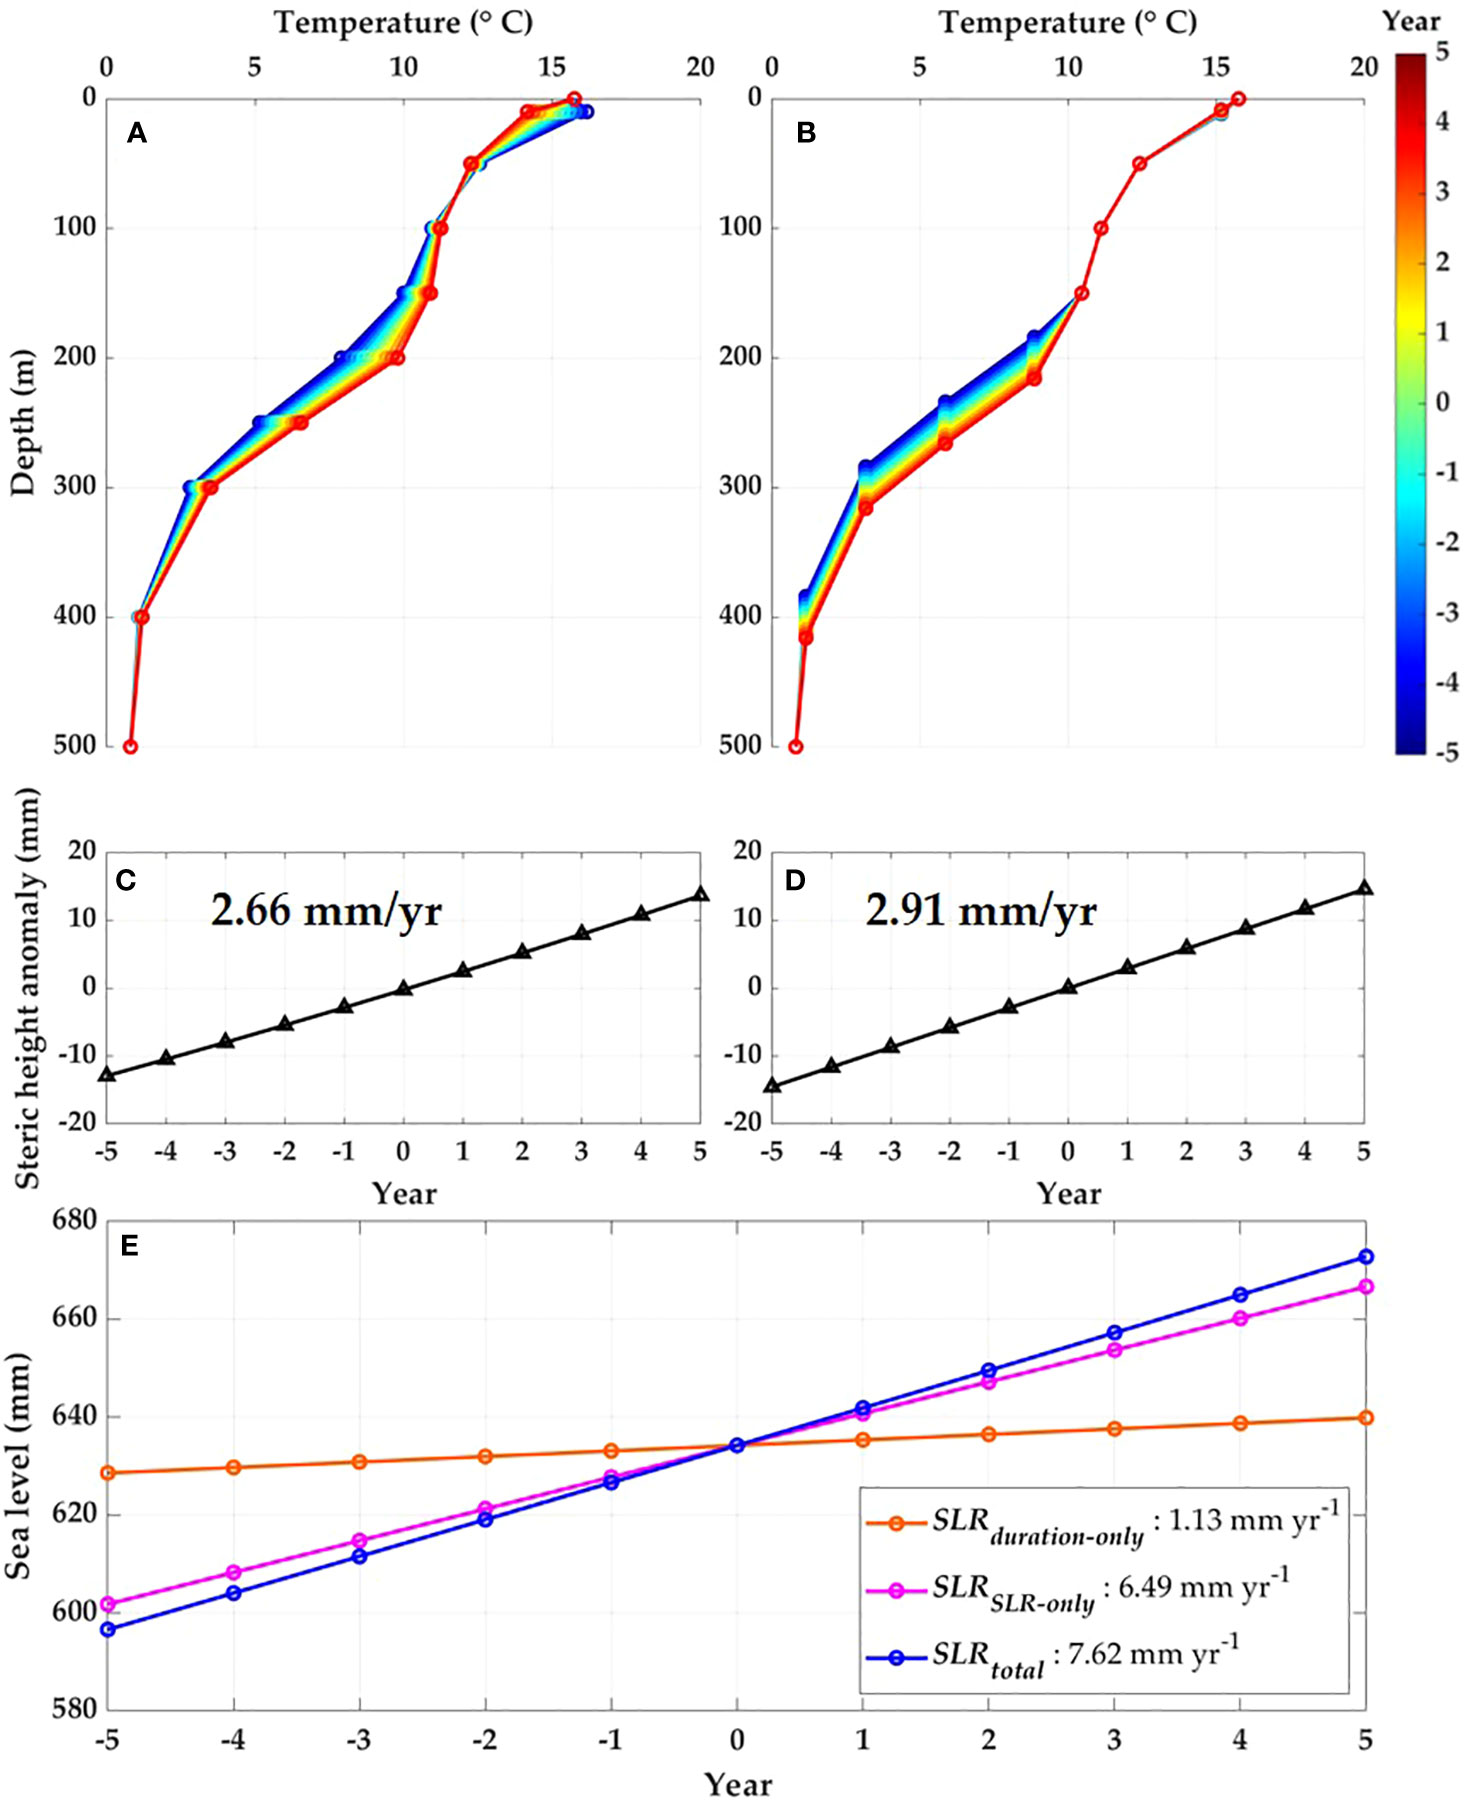
Figure 3 The 10 years of variations of the mean temperature profile within the Ulleung Warm Eddy (UWE) based on the observed linear trends in (A) temperature and (B) the depths of upper and lower boundaries are shown in the upper panels. The colors denote the year from -5 to +5 years. The middle panels denote the steric height rise based on the linear trends in (C) temperature and (D) the depths of upper and lower boundaries within the UWE. The bottom panel (E) denotes the SLR rates calculated using Equation 4 for three scenarios, i.e. (orange), (pink), and (blue).
where and are the time (inputted as a form of n-th year), gravitational acceleration and pressure, respectively, and the steric height is estimated above 500 dbar. The density at each pressure level was calculated by temperature and salinity profiles from NIFS data using the Gibbs Sea waver Oceanographic Toolbox (McDougall and Barker, 2011). Mean temperature and salinity profile () were computed by averaging the temperature and salinity profiles, respectively, observed within the UWE during the entire period (1993–2020). The mean salinity profile was used to calculate density, assuming that the steric height variations are more significantly affected by the temperature, rather than salinity, since the density variations in the EJS are influenced approximately 100 times greater by temperature changes (10-1 –101 °) than by salinity changes (10-3–10-1 g/kg). Assuming that the mean temperature profile corresponds to t=0, the steric height rise rates were calculated for 10 years, from -5 to +5 years, based on the observed linear trends in both the temperature and upper and lower boundaries within the UWE (Figures 3C, D).
Apart from the steric effect due to the existence of the warm eddy, the barystatic effect is the other significant factor contributing to sea-level rise on a basin scale (Gregory et al., 2019; Chen et al., 2022). The barystatic effect () results from the water mass exchange, which varies regionally and is estimated about 2.00 mm/yr in the North Pacific regions during this period, as supported by various research findings (Amin et al., 2020; Camargo et al., 2022; Chen et al., 2022; Royston et al., 2020). Thus, in a specific grid, when warm eddies exist, the SLR rates () can be expressed as Equation 2 synthetically,
Warm eddies, even when not changing their internal structures over the long-term, can contribute to annual sea-level rise if their duration or frequency increases. To assess the impact of the duration of warm eddies on the annual sea-level rise in a specific grid, the number of days within a year that were part of a warm eddy () and the number of non-eddy days () were calculated separately. The long-term variation in the duration of the UWE was estimated by calculating the yearly trend of , termed the Eddy duration increasing rate (ER). To quantify the impact of the UWE duration on SLR rates, can be predicted using the ER as Equation 3,
where represents the average days of warm eddies in a certain grid per year, which is 174 days for the Ulleung Island grid.
Considering the variations of the internal structures and the durations of the UWE, and the barystatic effect, the total annual sea-level at the Ulleung Island grid can be calculated as Equation 4,
where, and denote the average sea-level when the grid is and is not within a warm eddy, with values of 699.05 mm and 575.21 mm, respectively, based on the satellite altimetry at the Ulleung Island grid. represents the SLR rates when the grid is not within a warm eddy, calculated based on the satellite altimetry at the Ulleung Island grid as 5.51 ± 2.05 mm/yr (Figure 2, Table 1). Same as to calculate the rising rate of , assuming that all mean values correspond to t=0, the rising rates of () were calculated for 10-year period, from -5 to +5 years. In addition, we verified the effects of the various interpolation methods (linear, modified akima, and spline) on the temperature profiles, which could affect the vertical extent of the UWE and the within ±6% differences.
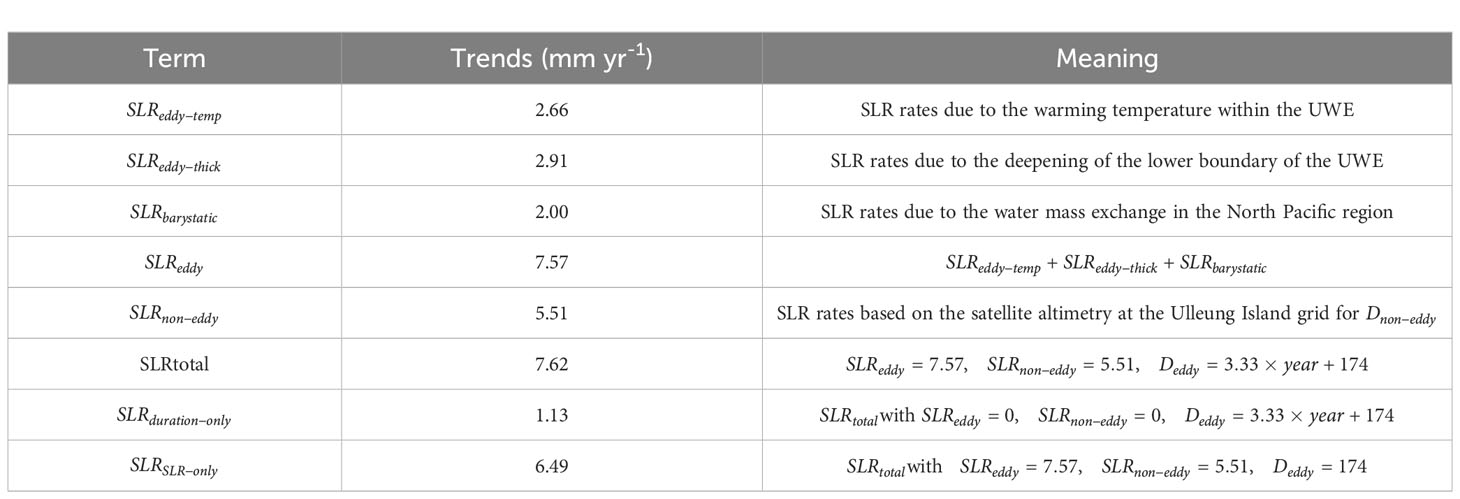
Table 1 SLR rates terms, values, and their meanings.
3 Results
3.1 Sea-level rise around Ulleung Island
The regional SLR rates during 1993–2020 in the EJS were spatially variable with 1–8 mm yr-1, and were noticeably higher (> 6 mm yr-1) around Ulleung Island based on satellite altimetry (Figure 1). There is a notable north-south difference in the spatial distribution of the SLR rates in the EJS, with much higher and more variable rates of 2–7 mm yr-1 in the south of the subpolar front around 40°N than the north, with less than 4 mm yr-1 (Figure 1). In the south of 40°N in the EJS, the spatial variability of the SLR rates in the western part of 133°E, is more variable at 1–8 mm yr-1 compared to 2–6 mm yr-1 in the eastern part. The spatial distribution pattern of high SLR rates in the southwestern part of the EJS (Figure 1, in the red box) exhibited a concentric distribution of SLR rates above 6 mm yr-1 surrounding Ulleung Island. Notably, both the satellite altimetry data and TG observations show similarly high SLR rates (7.02 and 6.37 mm yr-1, respectively) at the Ulleung Island grid, which is more than double the global average SLR rates of 3.1 mm yr-1 (Figure 2).
The interannual variations and long-term linear trends of the annually averaged sea-level, based on both satellite altimetry and TG data in the vicinity of Ulleung Island, exhibited a strong similarity to those at the center of the UWE (Figure 2). The interannual variations of the annually averaged sea-levels at the center of the UWE during 1993–2020 show correlations of 0.69 both with the sea-level changes at the TG station and the satellite altimetry on Ulleung Island grid. Thus, the interannual variations in sea-level around Ulleung Island were well (> 47%) explained by interannual variations in the UWE. Both SLR rates from satellite altimetry (7.02 mm yr-1) and the TG station (6.37 mm yr-1) are similar to those at the center of the UWE (7.16 mm yr-1). When the sea-level from satellite altimetry is averaged only for the period in which the Ulleung Island grid is not included in the UWE (), their correlation with the satellite altimetry for all periods drops to 0.45, and its long-term linear trend () reduces to 5.51 mm yr-1 (Figure 2). These results insist that the long-term variations of the sea-level in the vicinity of Ulleung Island are strongly related to the long-term changes of the UWE.
3.2 UWE changes
The temperature increased in the subsurface layers within the UWE, particularly at the highest rate of increase at approximately 200 m (Figures 4A, B, C). The vertical profile of the long-term temperature change within the UWE showed a general warming trend at depths deeper than 50 m, with the maximum warming rate of 0.2°C yr-1 at approximately 200 m and the warming trend extended up to 400 m in the lower boundary of the eddy. Compared to Figure 4A, which shows the characteristic intra-thermocline eddy features of the UWE, the depths with the highest long-term temperature trend was situated in the temperature homogeneous layer with a temperature of 10–12°. Consequently, the SLR rates within the UWE are driven by a temperature increase in the THL.
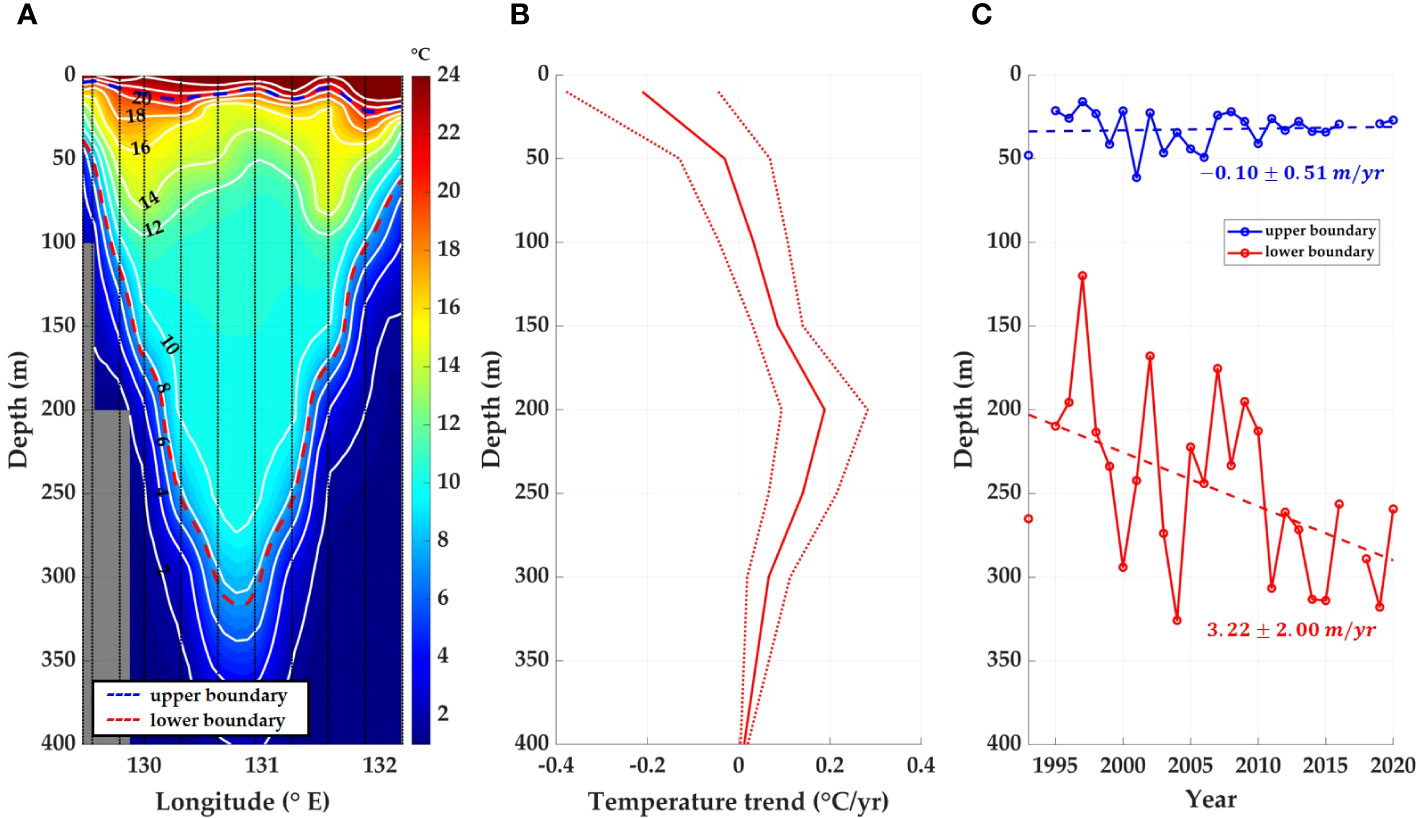
Figure 4 (A) Cross-section of the temperature within the Ulleung Warm Eddy (UWE) in August 2015 based on the National Institute of Fisheries Science (NIFS) hydrographic data. The temperature is denoted with color shading and white solid lines. The upper and lower boundaries of the UWE are highlighted by the blue and red dashed lines, respectively. (B) The vertical profile of temperature trends during 1993–2020 within the UWE is denoted by the red solid line, which is shown with upper and lower limits of a 90% confidence interval denoted by the red dashed lines. (C) Annually averaged depths of the upper (blue) and lower (red) boundaries of the UWE are denoted with solid lines and circles. The long-term trends and SLR rates are denoted with dashed lines and numbers in corresponding colors. The SLR rates are presented with a 90% confidence interval.
The depth of the lower boundary of the UWE showed a significant long-term deepening trend, in contrast to the almost constant upper boundary (Figures 4A, C). While the long-term trend of the UWE’s upper boundary depth showed no significant long-term change (-0.10 ± 0.51 m yr-1), the depth of the lower boundary showed a meaningful deepening trend at a rate of 3.22 ± 2.00 m yr-1. As the upper boundary of the UWE remained constant, but the lower boundary deepened significantly, the eddy became vertically thicker, which could contribute to the steric height rise owing to thermal expansion. The increase in the UWE thickness was primarily attributed to the thickening of the THL within the eddy, which expanded from approximately 150 m in 1993 to approximately 250 m in 2020.
The days per year that the Ulleung Island grid is included within the UWE is increasing, with the ER of 3.33 ± 3.64 days/yr (Figure 2). During the period from 1993 to 2020, the average days per year () that the Ulleung Island grid is included within the UWE (174 days) almost matches the known average life time of the UWE (160 days) (Lee et al., 2019). The effect of the UWE on the sea-level at the Ulleung Island grid has been gradually increasing, and in 2015, there was a case where the UWE affected sea-level variations at the Ulleung Island grid throughout the entire year. In addition, variations in at the Ulleung Island grid show a high correlation with the sea-level variations based on the satellite altimetry at the Ulleung Island grid (0.83). Consequently, the increase in can contribute to the higher SLR rates observed around the Ulleung Island.
3.3 UWE-induced sea-level rise
Because of the warming temperature within the UWE, the steric height increased at a rate of 2.66 mm yr-1 (; Figures 3A, C, Table 1). According to the mean temperature profile, the temperature at 200 m () in which shows the maximum temperature warming rate is 8.85 ° at t=0, which varies from 7.90 ° to 9.80 ° during -5–+5 years. The increase in steric height was predominantly due to the temperature increase in the THL, because the temperature rather decreased in the surface layer above 50 m within the UWE. The steric height rise rate caused by the temperature increase within the UWE was similar to the global average SLR rate of 3.1 mm yr-1. Therefore, the steric height rise due to the temperature increase in the THL within the UWE alone was insufficient to explain the observed SLR rates exceeding 6 mm yr-1 in the vicinity of Ulleung Island and within the UWE itself.
Because of the deepening of the lower boundary of the UWE, the steric height increased at a rate of 2.91 mm yr-1 (; Figures 3B, D, Table 1). According to the mean temperature profile, the mean upper and lower boundaries of the UWE are 50 and 200 m respectively, and the mean THL thickness () is 150 m at t=0. Due to the deepening trend of the lower boundary of the UWE, the thickness of the THL increased from 134.35 m to 165.65 m, from which the steric height rise was derived (Figure 3B). The steric height rise rate due to the deepening of the eddy’s lower boundary was similar to the steric height rise rate caused by the temperature increase.
The (7.62 mm yr-1) calculated based on the steric height rise (), taking into account the internal temperature warming, the deepening of the lower boundary, and the annual duration of the UWE, were similar to the observed SLR rates from satellite altimetry at the Ulleung Island grid (7.02 mm yr-1) and the Ulleung TG station (6.37 mm yr-1) (Figure 3E, Table 1). The estimated steric height rise rate was also similar to the SLR rate based on the satellite altimetry data at the eddy center (7.16 mm yr-1). Even when assuming that both and are zeros in Equation 4, the steric height can still rise by 1.13 mm yr-1 () due to the increase in the duration of the UWE. The , which is the linear sum of the SLR rates due to the internal temperature warming, the deepening lower boundary within the UWE, and the barystatic effect, is 7.57 mm yr-1, which is 1.4 times higher than the . Considering only and respectively, and the duration of the UWE remains constant (), the calculated SLR rate is 6.49 mm yr-1 (), lower than the observed SLR rate based on the satellite altimetry at the Ulleung Island grid. In practice, both the temperature and thickness of the THL within the UWE, as well as its duration, have increased in the long-term. Considering that the was calculated only for the center of the eddy and that the Ulleung Island grid can be located both on the eddy boundary and non-eddy areas, the slightly lower SLR rates at the Ulleung Island grid (7.02 mm yr-1) than the can be explained. As a result, considering the integrated effect of the long-term changes in the UWE on the , the high SLR rates observed around Ulleung Island can be explained quantitatively.
4 Discussions
The temperature within the UWE increased due to the rising temperature of the water flowing into the EJS through the KTS in late fall (October–December) (Figures 5A, B). The THL, where the long-term temperature trend is the highest within the UWE, is formed due to atmospheric cooling after October and is expanded to a depth of 200-300 m during the winter (Shin et al., 2005; Shin et al., 2019). The long-term temperature trend was analyzed along the pathway of the EKWC, which flows into the EJS through the KTS on the beginning period of the formation of the THL in the UWE in late fall. Unlike the average profiles on other periods, the calculated long-term temperature trend during late fall at a depth of approximately 100 m is similar to the maximum long-term temperature trend of 0.2°C yr-1 within the THL in the UWE. Therefore, the temperature increase within the UWE can be attributed to the rising temperature of the Tsushima Warm Current water mass, which enters the Ulleung Basin through the KTS during late fall. Considering the steric height rise rate due to the temperature increase within the UWE (2.66 mm yr-1), which is similar to the global mean SLR rate, the long-term temperature trend of the THL within the UWE is not exceptionally abnormal.
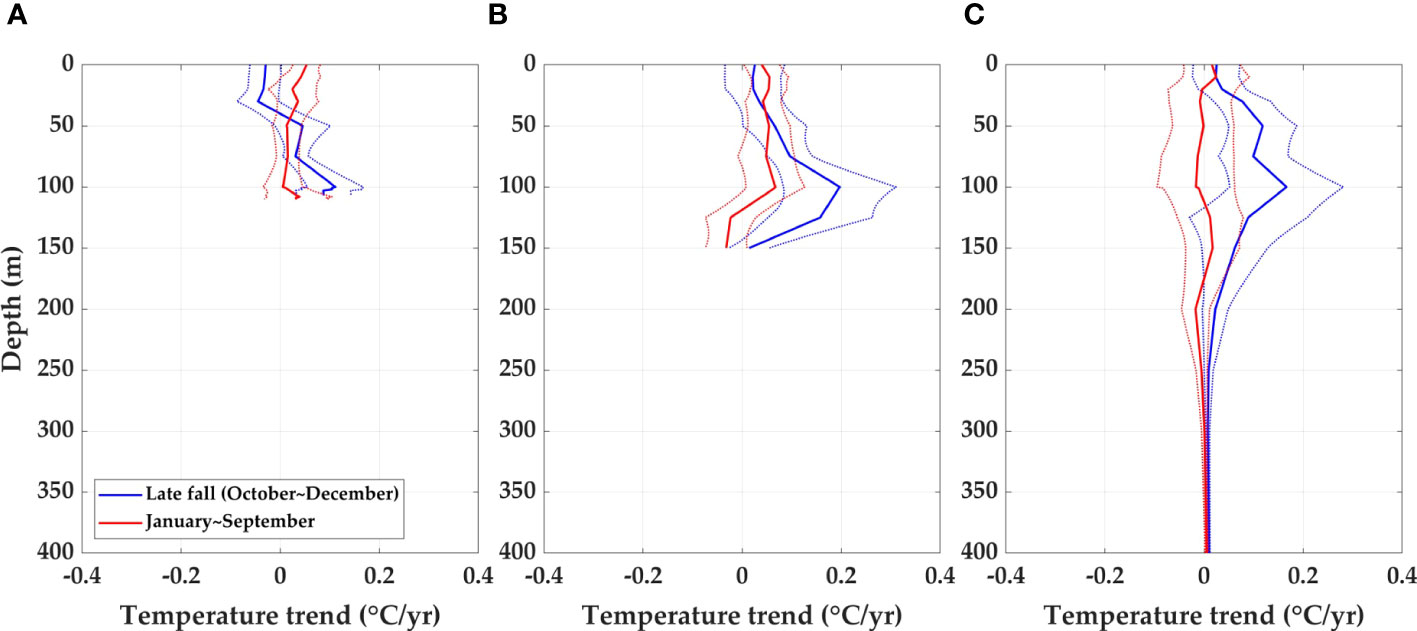
Figure 5 The vertical profiles of long-term temperature trends at corresponding National Institute of Fisheries Science (NIFS) hydrographic stations of (A) a, (B) b, and (C) c from the Korean/Tsushima Strait to the interior of the East/Japan Sea (EJS) (the location denoted in Figure 1). The temperature trends in late fall (October–December) are denoted with blue solid lines, and those averaged in other periods (January–September) are denoted with red lines. Each temperature trend is shown with upper and lower limits of a 90% confidence interval denoted by the dashed lines.
The deepening of the lower boundary and increasing duration of the UWE is attributed to the increasing baroclinic instability around the front (Figure 6B). Eddy formation near the front in the open ocean (Holland and Lin, 1975; Donohue et al., 2016; Hiron et al., 2021) as well as in the EJS (Lee and Niiler, 2010) is caused by increased baroclinic instability caused by meander development. Baroclinic instability near the front can be represented by the Eady growth rate (Eady, 1949; Isachsen, 2015; Sloyan and O’Kane, 2015), which is proportional to the cross-frontal buoyancy gradient. The cross-frontal buoyancy gradient can be expressed as the cross-frontal temperature gradient around the frontal region of the EKWC, because the density variations in the EJS are primarily driven by temperature variations. The depth at which the same horizontal temperature gradient occurred between the two NIFS stations located on either side of the front (Figure 1) consistently exhibited a deepening trend for this period, even when each station was not included in the UWE (Figure 6B). This deepening trend of the horizontal temperature gradient is not due to long-term variations in the UWE, as it was estimated for the period after excluding the effect of the UWE (). As the depth at which the same horizontal temperature gradient occurs becomes deeper than in the past, the increased baroclinic instability at deeper depths can leads to the deepening of the lower boundary of the UWE. The interannual variation of the lower boundary of the UWE coincides with the variation of the temperature gradient line (i.e. ), suggesting that the changes in the depth of the lower boundary of the UWE (Figure 6B white dashed line) are related to the increased baroclinic instability expanding to the deeper depths. Similar relationship was also explored in the previous study (Jing et al., 2019), which examined that a deeper density front was suggested as the possible explanation for the deeper vertical extent of eddies in the Kuroshio extension than in the Oyashio extension.
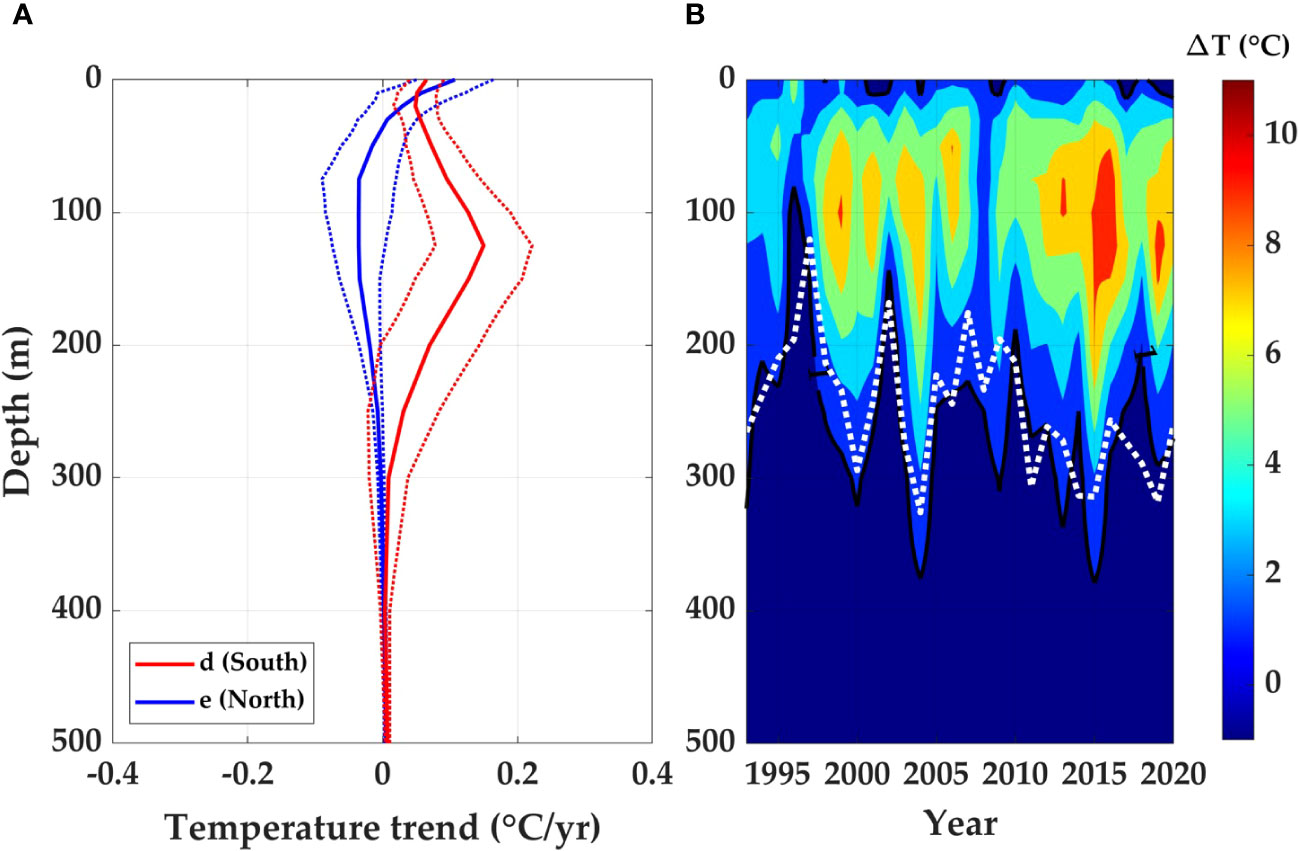
Figure 6 (A) The vertical profiles of long-term temperature trends at the National Institute of Fisheries Science (NIFS) hydrographic stations on the (d) southern (red) and (e) northern (blue) side of the front (the location denoted in Figure 1) for the period when each station was not included in the Ulleung Warm Eddy (UWE). Each temperature trend is shown with upper and lower limits of a 90% confidence interval denoted by the dashed lines. (B) The interannual variations of horizontal temperature gradient between (d) and (e) in depths for the period when each station was not included in the UWE same as (A). The color shading denotes the temperature gradient, and the depths with the horizontal temperature gradient of 1° are highlighted by the black solid line. The interannual variations in depths of the lower boundary of the UWE (as in Figure 3C) are superimposed with a white dashed line.
The deepening density front and the increased baroclinic instability in the subsurface layer are attributed to contrasting long-term trends in the vertical temperature profiles on both sides of the front caused by the EKWC (Figure 6). On the southern side of the front, the temperature exhibited an increasing trend within the 0–300 m depth range, whereas on the northern side, the temperature increased within the 0–50 m depth range, but decreased in the 50–300 m range (Figure 6A). These contrasting long-term trends in vertical temperature profiles separated by the front led to a significant horizontal temperature gradient at the same depth. While previous studies have addressed spatial differences in the long-term trends of sea surface temperatures in the EJS (Yeh et al., 2010; Lee and Park, 2019), the results of the present study additionally highlight that spatial differences in the long-term trends of temperature exhibit a contrasting appearance near the front and extend into the subsurface layer. In short, the high SLR rates resulting from the increasing thickness of the eddy can be described as a deepening of the “container” retaining the heat. Regional differences in subsurface warming trends may alter the long-term characteristics of the UWE, potentially inducing significantly higher regional SLR rates.
Long-term variations in the UWE have a direct impact on the high SLR rates around Ulleung Island because they remain stationary in the vicinity of the generated region, unlike typical westward-propagating mesoscale eddies in the open ocean. In general, eddies in the open ocean propagate westward and travel thousands of kilometers across ocean basins (Chelton et al., 2011; Early et al., 2011). However, the UWE exhibits a significantly smaller displacement, which is less than its average radius of approximately 50 km (Lee et al., 2019). The unique characteristic of the UWE remaining stationary around Ulleung Island allows long-term variations in the UWE to be directly reflected in long-term regional SLR rates.
5 Conclusion
This study quantitatively demonstrated that the high rates of SLR around Ulleung Island are due to long-term variations in the UWE, and investigates the causes of the variations, which include the eddy becoming warmer, vertically thicker and longer lasting. The interannual variability of sea-level around Ulleung Island was well explained by the variability of sea-level at the center of the UWE (corr=0.69), with similar rising rates. The UWE’s long-term variations show a maximum temperature increase of 0.2 ° yr-1 at the THL around 200 m, a deepening of the lower boundary at a rate of 3.22 ± 2.00 m yr-1, and the eddy duration increasing with 3.33 ± 3.64 days yr-1. The analysis of the SLR rates due to the individual causes of the long-term changes in the UWE showed an increase of 2.66 mm yr-1 due to the internal temperature increase and an increase of 2.91 mm yr-1 due to the deepening of lower boundary. When considering the impact of an increase in the eddy duration additionally, the high SLR rates around the Ulleung Island (> 6 mm yr-1) were quantitatively confirmed by the comprehensively estimated SLR rates (, 7.62 mm yr-1). The increasing temperature trend within the UWE is attributed to the increasing temperature trend of the water flowing through the Korean Strait during late fall. The deepening of lower boundary and increasing duration of the UWE can be explained by the enhanced baroclinic instability due to the increased horizontal temperature gradient in the subsurface layer near the front. In addition, the characteristics of the UWE remaining in the generated region allowed its long-term variations to have a significant impact on the long-term SLR rates around Ulleung Island.
This study has implications regarding the understanding of the mechanisms underlying deviations in regional SLR rates around the frontal regions of the global ocean. This highlights not only the importance of the temperature gradients near the front but also the horizontal differences in long-term temperature trends that can change the long-term characteristics of mesoscale eddies. Furthermore, this study quantitatively confirmed that long-term variations in mesoscale eddy characteristics can enhance regional SLR rates near the front region. These findings suggest that SLR rates caused by global warming do not manifest uniformly across frontal regions, displaying complex patterns related to long-term variations in mesoscale eddy characteristics, which may emerge in other frontal regions of the global ocean.
Data availability statement
The original contributions presented in the study are included in the article/supplementary material. Further inquiries can be directed to the corresponding author.
Author contributions
KL: Conceptualization, Data curation, Formal analysis, Investigation, Methodology, Visualization, Writing – original draft, Writing – review & editing. J-HP: Conceptualization, Formal analysis, Funding acquisition, Methodology, Supervision, Writing – review & editing. Y-GP: Formal analysis, Funding acquisition, Supervision, Writing – review & editing.
Funding
The author(s) declare financial support was received for the research, authorship, and/or publication of this article. This research was supported by Korea Institute of Marine Science & Technology Promotion (KIMST) funded by the Ministry of Oceans and Fisheries (RS-2023-00254680).
Acknowledgments
The authors thank Editage (www.editage.co.kr) for the English language editing.
Conflict of interest
The authors declare that this study was conducted in the absence of any commercial or financial relationships that could be construed as potential conflicts of interest.
Publisher’s note
All claims expressed in this article are solely those of the authors and do not necessarily represent those of their affiliated organizations, or those of the publisher, the editors and the reviewers. Any product that may be evaluated in this article, or claim that may be made by its manufacturer, is not guaranteed or endorsed by the publisher.
Abbreviations
ADT, absolute dynamic topography; EKWC, East Korea Warm Current; EJS, East/Japan Sea; ER, Eddy duration increasing rate; KTS, Korea/Tsushima Strait; NIFS, National Institute of Fisheries Science; SLR, sea-level rise; THL, temperature homogeneous layer; UWE, Ulleung Warm Eddy.
References
Amin H., Bagherbandi M., Sjöberg L. E. (2020). Quantifying barystatic sea-level change from satellite altimetry, GRACE and Argo observations over 2005–2016. Adv. Space Res. 65 (8), 1922–1940. doi: 10.1016/j.asr.2020.01.029
Bashmachnikov I. L., Raj R. P., Golubkin P., Kozlov I. E. (2023). Heat Transport by mesoscale eddies in the Norwegian and Greenland Seas. J. Geophys. Res. Oceans 128, e2022. doi: 10.1029/2022JC018987
Camargo C. M. L., Riva R. E. M., Hermans T. H. J., Slangen A. B. A. (2022). Trends and uncertainties of mass-driven sea-level change in the satellite altimetry era. Earth Syst. Dynam. 13, 1351–1375. doi: 10.5194/esd-13-1351-2022
Cazenave A., Llovel W. (2010). Contemporary sea level rise. Annu. Rev. Mar. Sci. 2, 145–173. doi: 10.1146/annurev-marine-120308-081105
Chang K.-I., Teague W. J., Lyu S. J., Perkins H. T., Lee D.-K., Watts D. R., et al. (2004). Circulation and currents in the southwestern East/Japan Sea: Overview and review. Prog. Oceanogr. 61, 105–156. doi: 10.1016/j.pocean.2004.06.005
Chang K.-I., Zhang C. I., Park C., Kang D. J., Ju S. J., Lee S. H., et al. (2016). Oceanography of the east sea (Japan sea) (Switzerland: Springer), 460. doi: 10.1007/978-3-319-22720-7
Chelton D. B., Schlax M. G., Samelson R. M. (2011). Global observations of nonlinear mesoscale eddies. Prog. Oceanogr. 91, 167–216. doi: 10.1016/j.pocean.2011.01.002
Chen J., Cazenave A., Dahle C., Llovel W., Panet I., Pfeffer J., et al. (2022). Applications and challenges of GRACE and GRACE follow-on satellite gravimetry. Surv. Geophys. 43, 305–345. doi: 10.1007/s10712-021-09685-x
Choi B. J., Haidvogel D. B., Cho Y. K. (2004). Nonseasonal sea level variations in the Japan/East Sea from satellite altimeter data. J. Geophys. Res. 109, C12028. doi: 10.1029/2004JC002387
Choi B. J., Haidvogel D. B., Cho Y. K. (2009). Interannual variation of the polar front in the Japan/East Sea from summertime hydrography and sea-level data. J. Mar. Syst. 78, 351–362. doi: 10.1016/j.jmarsys.2008.11.021
Church J. A., White N. J. (2011). Sea-level rise from the late 19th to the early 21st century. Surv. Geophys. 32, 585–602. doi: 10.1007/s10712-011-9119-1
Donohue K. A., Watts D. R., Hamilton P., Leben R., Kennelly M. (2016). Loop Current eddy formation and baroclinic instability. Dyn. Atmos. Oceans. 76, 195–216. doi: 10.1016/j.dynatmoce.2016.01.004
Early J. J., Samelson R. M., Chelton D. B. (2011). The evolution and propagation of quasigeostrophic ocean eddies. J. Phys. Oceanogr. 41, 1535–1555. doi: 10.1175/2011JPO4601.1
Eden C. (2007). Eddy length scales in the North Atlantic Ocean. J. Geophys. Res. 112, C6. doi: 10.1029/2006JC003901
Frederikse T., Landerer F., Caron L., Adhikari S., Parkes D., Humphrey V. W., et al. (2020). The causes of sea-level rise since 1900. Nature 584, 393–397. doi: 10.1038/s41586-020-2591-3
Gordon A. L., Giulivi C. F., Lee C. M., Furey H. H., Bower A., Talley L. (2002). Japan/East Sea intrathermocline eddies. J. Phys. Oceanogr. 32, 1960–1974. doi: 10.1175/1520-0485(2002)032<1960:JESIE>2.0.CO;2
Gregory J. M., Griffies S. M., Hughes C. W., Lowe J. A., Church J. A., Fukumori I., et al. (2019). Concepts and terminology for sea-level: Mean, variability and change, both local and global. Surv. Geophys. 40, 1251–1289. doi: 10.1007/s10712-019-09525-z
Han M., Cho Y.-K., Kang H.-W., Nam S., Byun D.-S., Jeong K.-Y., et al. (2020a). Impacts of atmospheric pressure on the annual maximum of monthly sea-levels in the northeast Asian marginal seas. J. Mar. Sci. Eng. 8, 425. doi: 10.3390/jmse8060425
Han M., Nam S., Cho Y.-K., Kang H.-W., Jeong K.-Y., Lee E. (2020b). Interannual variability of winter sea-levels induced by local wind stress in the northeast Asian marginal seas: 1993–2017. J. Mar. Sci. Eng. 8, 774. doi: 10.3390/jmse8100774
Hiron L., Nolan D. S., Shay L. K. (2021). Study of ageostrophy during strong, nonlinear eddy-front interaction in the Gulf of Mexico. J. Phys. Oceanogr. 51, 745–755. doi: 10.1175/JPO-D-20-0182.1
Holland W. R., Lin L. B. (1975). On the generation of mesoscale eddies and their contribution to the oceanic general circulation. I. A preliminary numerical experiment. J. Phys. Oceanogr. 5, 642–657. doi: 10.1175/1520-0485(1975)005<0642:OTGOME>2.0.CO;2
Isachsen P. E. (2015). Baroclinic instability and the mesoscale eddy field around the Lofoten Basin. J. Geophys. Res. Oceans. 120, 2884–2903. doi: 10.1002/2014JC010448
Jing Z., Chang P., Shan X., Wang S., Wu L., Kurian J. (2019). Mesoscale SST dynamics in the Kuroshio–Oyashio extension region. J. Phys. Oceanogr. 49 (5), 1339–1352. doi: 10.1175/JPO-D-18-0159.1
Kang S. K., Cherniawsky J., Foreman M., Min H. S., Kim C. H., Kang H. W. (2005). Patterns of recent sea-level rise in the East/Japan Sea from satellite altimetry and in situ data. J. Geophys. Res. 110, C07002. doi: 10.1029/2004JC002565
Kim K., Cho Y. K., Choi B. J., Kim Y. G., Beardsley R. C. (2002). Sea-level variability at Ulleung island in the East (Japan) Sea. J. Geophys. Res. Oceans. 107, 1–1. doi: 10.1029/2001JC000895
Lee D. K., Niiler P. (2010). Eddies in the southwestern east/Japan sea. Deep Sea Res. I. 57, 1233–1242. doi: 10.1016/j.dsr.2010.06.002
Lee E. Y., Park K. A. (2019). Change in the recent warming trend of sea surface temperature in the East Sea (Sea of Japan) over decade –2018). Remote Sens. 11, 2613. doi: 10.3390/rs11222613
Lee K. J., Nam S. H., Kim Y. G. (2019). Statistical characteristics of East Sea mesoscale eddies detected, tracked, and grouped using satellite altimeter data from 1993 to 2017. J. Korean Soc Oceanogr. 24, 267–281. doi: 10.7850/jkso.2019.24.2.267
Lee K. J., Nam S. H., Cho Y.-K., Jeong K.-Y., Byun D.-S. (2022). Determination of long-ter –2019) sea-level rise trends around the Korean peninsula using ocean tide-corrected, multi-mission satellite altimetry data. Front. Mar. 9, 810549. doi: 10.3389/fmars.2022.810549
Lee S.-K. (1999). Self-excited variability of the East Korea Warm Current: A quasi-geostrophic model study. J. Korean Soc Oceanogr. 34 (1), 1–21.
Lim S., Jang C. J., Park J. (2012). Climatology of the mixed layer depth in the East/Japan Sea. J. Mar. Syst. 96, 1–14. doi: 10.1016/j.jmarsys.2012.01.003
McDougall T. J., Barker P. M. (2011). Getting started with TEOS-10 and the Gibbs Seawater (GSW) oceanographic toolbox. SCOR/IAPSO WG . 127, 1–28.
Nicholls R. J., Cazenave A. (2010). Sea-level rise and its impact on coastal zones. Science 328, 1517–1520. doi: 10.1126/science.1185782
Ou H. W., Gordon A. (2002). Subduction along a midocean front and the generation of intrathermocline eddies: A theoretical study. J. Phys. Oceanogr. 32, 1975–1986. doi: 10.1175/1520-0485(2002)032<1975:SAAMFA>2.0.CO;2
Pak G., Kim Y. H., Park Y.-G. (2019). Lagrangian approach for a new separation index of the East Korea Warm Current. Ocean Sci. J. 54, 29–38. doi: 10.1007/s12601-018-0059-2
Park J. (2021). Quality Evaluation of long-term shipboard salinity data obtained by NIFS. Sea. 26, 49–61. doi: 10.7850/jkso.2021.26.1.049
Qiu B., Chen S., Wu L., Kida S. (2015). Wind-versus eddy-forced regional sea-level trends and variability in the North Pacific Ocean. J. Clim. 28, 1561–1577. doi: 10.1175/JCLI-D-14-00479.1
Royston S., Vishwakarma B. D., Westaway R. M., Rougier J., Sha Z., Bamber J. L. (2020). Can we resolve the basin-scale sea level trend budget from GRACE ocean mass? J. Geophys. Res. Oceans 125, e2019JC015535. doi: 10.1029/2019JC015535
Ruiz-Etcheverry L. A., Saraceno M. (2020). Sea-level trend and fronts in the South Atlantic Ocean. Geosciences 10, 218. doi: 10.3390/geosciences10060218
Shin H. R., Kim I., Kim D., Kim C. H., Kang B., Lee E. (2019). Physical characteristics and classification of the Ulleung warm eddy in the East Sea (Japan Sea). J. Korean Soc Oceanogr. 24, 298–317. doi: 10.7850/JKSO.2019.24.2.298
Shin H. R., Shin C. W., Kim C., Byun S. K., Hwang S. C. (2005). Movement and structural variation of warm eddy WE92 for three years in the western East/Japan Sea. Deep. Res. Part II 52, 1742–1762. doi: 10.1016/j.dsr2.2004.10.004
Sloyan B. M., O’Kane T. J. (2015). Drivers of decadal variability in the Tasman Sea. J. Geophys. Res. Oceans. 120, 3193–3210. doi: 10.1002/2014JC010550
Stammer D., Cazenave A., Ponte R. M., Tamisiea M. E. (2013). Causes for contemporary regional sea-level changes. Annu. Rev. Mar. Sci. 5, 21–46. doi: 10.1146/annurev-marine-121211-172406
Vinogradov S. V., Ponte R. M. (2011). Low-frequency variability in coastal sea-level from tide gauges and altimetry. J. Geophys. Res. 116, C07006. doi: 10.1029/2011JC007034
Von Schuckmann K., Le Traon P. Y., Smith N., Pascual A., Djavidnia S., Gattuso J. P., et al. (2021). Copernicus marine service ocean state report, issue 5. J. Oper. Oceanogr. 14 sup1, 1–185. doi: 10.1080/1755876X.2021.1946240
Watson P. J., Lim H.-S. (2020). An update on the status of mean sea-level rise around the Korean Peninsula. Atmosphere 11, 1153. doi: 10.3390/atmos11111153
Yeh S. W., Park Y. G., Min H., Kim C. H., Lee J. H. (2010). Analysis of characteristics in the sea surface temperature variability in the East/Japan Sea. Prog. Oceanogr. 85, 213–223. doi: 10.1016/j.pocean.2010.03.001
Keywords: Korean peninsula, sea-level rise, frontal region, mesoscale eddies, sea-level
Citation: Lee K, Park J-H and Park Y-G (2024) Eddy-driven sea-level rise near the frontal region off the east coast of the Korean peninsula during 1993–2020. Front. Mar. Sci. 11:1283076. doi: 10.3389/fmars.2024.1283076
Received: 25 August 2023; Accepted: 17 January 2024;
Published: 01 February 2024.
Edited by:
Matthieu Le Hénaff, University of Miami, United StatesReviewed by:
Yukiharu Hisaki, University of Ryukyus, JapanNariaki Hirose, Japan Meteorological Agency, Japan
Copyright © 2024 Lee, Park and Park. This is an open-access article distributed under the terms of the Creative Commons Attribution License (CC BY). The use, distribution or reproduction in other forums is permitted, provided the original author(s) and the copyright owner(s) are credited and that the original publication in this journal is cited, in accordance with accepted academic practice. No use, distribution or reproduction is permitted which does not comply with these terms.
*Correspondence: Jae-Hyoung Park, b2NlYW5qaHBhcmtAcGtudS5hYy5rcg==