 Baohua Liu
 Jiewen Zheng
 Jingqiang Wang
 Lei Sun2
 Xiaolei Liu
95% of researchers rate our articles as excellent or good
Learn more about the work of our research integrity team to safeguard the quality of each article we publish.
Find out more
ORIGINAL RESEARCH article
Front. Mar. Sci. , 26 February 2024
Sec. Marine Biogeochemistry
Volume 11 - 2024 | https://doi.org/10.3389/fmars.2024.1261164
This article is part of the Research Topic Broadband Seafloor Sediment Acoustic Property and Multi-Parameter Geoacoustic Model View all 11 articles
One popular method of obtaining the acoustic parameters of seabed sediments is by measuring the sound velocity of sediment samples in a laboratory. However, the effects of environmental variation and physical perturbation on acoustic properties are typically neglected in the application of such measured acoustic parameters. In this study, sediment samples were collected from the Huanghai and Bohai seas to measure sound velocity both on the deck and in the laboratory using a digital sonic measuring system. Additionally, sediment compositions, physical and mechanical properties and microstructures were determined. Sound velocity comparisons between on-deck and laboratory measurements indicate that laboratory-measured velocities are generally higher than those measured on the deck, with differences ranging from 1.45 m/s to 130.05 m/s, due to the water loss and densification of sedimentary particles in laboratory settings. The discrepancy of sound velocities measured in the laboratory and on the deck also differ based on the types of sediments sampled. Overall, the discrepancy increases with measurement frequency, increasing average grain diameter and sand content, as well as with decreasing clay content.
The seafloor sedimentary environment, as an important part of the ocean, is complex and heterogeneous, and little is known across different spatial scales at the sediment–water interface than for the seawater environment above (Liu et al., 2022). In marine geological research, acoustic measurements may be considered as the most effective means of exploration due to the excellent propagation characteristics of sound waves through the water column (e.g., as compared to optical and electromagnetic technologies) (Chadwick et al., 2012). The history of geoacoustics can be traced to 1950s, when measurements of the velocity and attenuation of sound waves in sediments were first being conducted in the United States (Hamilton, 1956). Since the 1970s, geoacoustics has developed as an interdisciplinary method applied to hydroacoustic, geological, geophysical and oceanographic investigations (Zhang, 1997). In the 1980s, seafloor sound propagation and sedimentary properties in marine engineering were joined in China (Liang and Lu, 1991), and in the 21st century, a series of related national projects were funded, such as the National Natural Science Foundation projects, publically funded science and technology marine research and the 863 high-technology projects (Han et al., 2011; Kan et al., 2011; Liu et al., 2013). Presently, measurements of the geoacoustic properties of compression wave velocities (namely sound velocity) and shear wave velocities have been necessary components of studies of marine areas.
A detailed understanding of acoustic wave propagation in marine sediments can ultimately lead to improved geoacoustic models and better geotechnical predictions from high-resolution acoustic datasets. Accurate and reliable measurements of geoacoustic parameters over a broad frequency range are key to advancing our knowledge in this area, given that different sediment types may exhibit different characteristics (Best et al., 2001). Sediment acoustic properties are of great importance to the study of acoustic transfer theory, which includes the parameters of sound velocity, shear wave velocity and sound attenuation, among other factors. In the studies of many fields, such as in marine engineering and construction, marine geological hazard analyses and prediction and marine resource exploration, knowledge of seafloor acoustics is essential (Zheng et al., 2014). The direct measurement methods of geoacoustic properties can be classified into three categories:
1. In situ measurements: Since the 1990s, several in situ techniques have been developed and used to measure acoustic properties, including the in situ sediment geoacoustic measurement system (Richardson and Briggs, 1996), sediment acoustic and physical property apparatus (Best et al., 2001), in situ sound speed and attenuation probe (ISSAP) (Kraft et al., 2002), acoustic lance (AL) (Fu et al., 2004), sediment acoustic speed measurement system (Yang et al., 2008), multifrequency in situ geoacoustic measurement system (Tao et al., 2009), hydraulic-driven in situ sediment acoustic measurement system (HSISAMS) (Kan et al., 2011), drag-type in- situ acoustic measurement system (Hou et al., 2014), the ballast in situ sediment acoustic measurement system (BISAMS) (Wang et al., 2018). These can obtain the closest approximation to the real data, but at the highest cost and with complex operational processes; currently, such measurements have only been applicable to the shallow seafloor. Most of these measurement systems can only insert acoustic transducers into the shallow seafloor sediment, and the operation of in situ device are inconvenient such that the system has low working efficiency.
2. On-deck measurements: Sediment samples collected on a research vessel can obtain a close approximation of the real, in situ data. Baldwin et al. (1981) made a marine acoustic measurement device that could measure the sound velocity of the seafloor sediment onto the ship’s deck. Kan et al. (2011) carried out the sediment measurement on the deck and compared sound speeds of seafloor sediments measured by in- situ with the deck laboratorial technique in Southern Yellow Sea. Hou et al. (2013) used the coaxial gap measurement method to take a deck acoustic measurement of the seabed sediments in the Nansha sea area and obtained the sound velocity.
3. Laboratory measurements: As early as 1956, Hamilton (1965) used the resonance chamber technique in the laboratory to test the sound velocity and sound attenuation of sediments in the shallow sea of San Diego. Hamilton and Bachman (1982) measured the compressional wave velocity of sediment from the Bering Sea, North Sea, Mediterranean Sea, equatorial Pacific, and other areas, in the laboratory by a pulse technique (operating at about 200 kHz). Lu and Liang (1994) measured the sound velocity of marine sediments in the southeast coast of China in the laboratory and established its statistical relationship with physical parameters. Best et al. (2001) measured velocity and attenuation in the laboratory at 200-800 kHz on a 1 m long sediment core taken from the Lough Hyne, Ireland, and compared the laboratory and in situ measurement results. McCann et al. (2013) described a new laboratory technique for measuring the compressional wave velocity and attenuation of jacketed samples of unconsolidated marine sediments within the acoustic (sonic) frequency range 1-10 kHz. Zheng et al. (2017) measured the sediment from coastal areas of Jiaozhou Bay in the laboratory, and analysed the correlation between sediment acoustics and geotechnical properties. These measurements are widely used in submarine investigations, but the data obtained can be influenced by the measurement conditions.
The deviations of laboratory-measured data should not be neglected when analysing and using such data in the construction of geoacoustic models and the inversion of physical properties. To solve the problem of such deviations between laboratory and on-deck data due to the changes in measuring conditions, three questions should be considered. First, how much do the laboratory geoacoustic data deviate from the real (in)situ value? Secondly, what is the cause of such deviations? Finally, how might laboratory measurements be calibrated to generate a closer approximation of the real data? In this study, sound velocity, as one important parameter of sedimentary geoacoustic properties, was chosen to compare the differences between measurements made in the field (on-board a research vessel) and those made in the laboratory. Together with the analyses of sediment composition, physical and mechanical properties and microstructure, the mechanism underlying the discrepancy between the two methods was determined, and suggestions were made regarding the calibration of laboratory data for sediment sound velocities in the Huanghai and Bohai seas.
Twenty-five box-type sediment samples with lengths of ~20–30 cm were collected using a box corer (47 × 47 × 114 cm3) from the Bohai Sea and the north part of the Huanghai Sea, over a longitudinal range of 36–40°E and a latitudinal range 119–124°30’N on the spring voyage of the Dongfanghong II in 2014 (Figure 1). After the seafloor sediments were collected, we inserted 110.0-mm-diameter PVC tubes into the box corer to collect short cylindrical samples to preserve the sediment microstructure. These sediment cores were packaged in PVC liner tubes and stored in a sample room with constant temperature and humidity. In order to further analyse the application of the obtained differences between sound velocities measured on the deck and in the laboratory for different types of sediments, data on the sound velocities of sediment samples collected from the southern Huanghai Sea in 2009 are also presented, with the sampling area shown in Figure 1. The sediment samples of the southern Huanghai Sea in 2009 were collected using the gravity sampler, and the top half meter sediment samples were measured using the acoustic transmission method. The detailed collecting and measuring method of sediment in 2009 can be referenced from Kan et al. (2011).
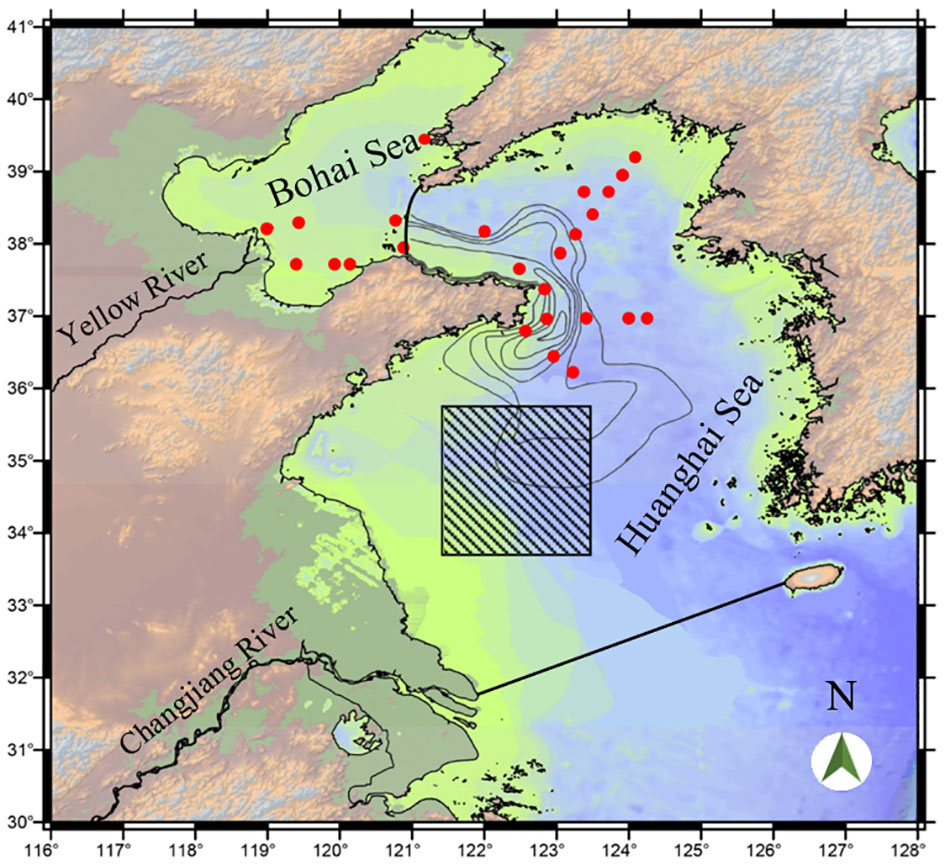
Figure 1 Distribution of sampling sites in the Bohai and northern Huanghai seas in the spring voyage of Dongfanghong II in 2014 (red circles), and the sampling area in the southern Huanghai Sea in the first investigation of sediment acoustics in China in 2009 (square shadow).
Sediments distributed offshore of China display the characteristics of terrigenous debris deposits, which are the product of interactions among fluvial transport, seafloor erosion and deposition, hydrodynamic processes and biological activities. The Huanghai and Bohai seas are mainly dominated by mud and sandy mud, due to their isolation, complex profiles and the high intensity of terrestrial runoff and tidal currents. The Bohai Sea is an enclosed shallow sea, deep with the Asian continent, and with a mean water depth of 18 m; it is connected to the Huanghai Sea via Bohai Bay in the east and is bordered by neighbouring lands on its other three sides. Liaodong Bay, Bohai Bay and Laizhou Bay are located in the north, west and south of the Bohai Sea, respectively. The main rivers discharged into the Bohai Sea are the Huanghe, Haihe, Luanhe and Liaohe. The thickness of quaternary deposits ranges from 300–500 m, and these sediments are composed of terrigenous debris from runoff. Irregular patches of sediments are distributed on the seafloor of the Bohai Sea, and there is a significant discrepancy between the three main bays and the central zone (Meng et al., 2015).
Sediments discharged into the Huanghai Sea are subjected to the interactions of winds, waves, the circulations of a warm current, coastal current and cold water masses, as well as the tidal current. There are three depositional zones each of coarse and fine sediments, and a transitional depositional zones in the Huanghai Sea, which are mainly composed of modern deposits. The coarse depositional zones are located in the eastern Huanghai Sea, Bohai Bay and Haizhou Bay, while the fine, and dominantly modern, depositional zones are located in the middle of the northern and southern regions of the Huanghai Sea, as well as in the old Yellow River subaqueous delta.
The sound velocities of twenty-five sediment samples were measured, both on the research vessel and in the laboratory, and the data for sixteen typical sediment samples are presented here. The sound velocity measurement on the deck were carried out immediately after the sediment cores were collected from seafloor and the time elapsed between the collecting and the measurement was about 30-60 minutes. The sound speed were measured using the whole sediment sample core on the deck and in the laboratory, respectively. The sound velocities of sediment samples were measured at temperatures ranging from ~18.0–20.5°C on the deck and ~19.5–21.5°C in the laboratory. The measurements were conducted using the same equipment, at frequencies ranging from 25–250 kHz, both in the deck and laboratory (Figure 2). The field bench-top acoustic system was composed of a portable bench and a digital sonic meter, with a measurement accuracy equal to ±0.1 mm of the sample length. Meanwhile, the laboratory bench-top acoustic system was composed of an automatic bench and a digital sonic meter, with the same measurement accuracy as in the field tests. The digital sonic meter was equipped with a handheld computer, Bluetooth and a high-speed analogue-to-digital data converter (A/D), with a low-power consumption and a small volume and weight (http://www.cqbtsk.com.cn/english/Sonic/WSD-3.htm). The portable field bench included a dismountable bottom beam, two fixed units and two support units, and the laboratory bench included a movable and locatable slide platform, a fixed holder, guide rail, sliding holder, V-shaped support and a dividing ruler. The purpose of the beams, the platform, and the support units are to fix and support the sediment cores. During the measurement, the sediment core was placed on the measuring platform at first. The acoustic measurements were conducted along with the length of the cores. The planar emitting transducer was pressed onto one side of the sample core section and the receiving transducer was pressed onto the other side of the sample core. A pulse signal was emitted at the central frequency of each emitting transducer. This method uses travel time differences between the acoustic signal through sediment samples and identical reference cores filled with water to measure compressional wave phase speed. The take-off point of a sound wave signal were point out using the conventional manual identification method. The measurement accuracy of the sediment core length of the bench was 0.1 mm, and the digital sonic instrument had a sampling rate of 10 MHz (that is, the accuracy of travel time is ± 0.1 μs) and a sampling length of 4,096 samples. So, the accuracy of sound speed of bench-top acoustic system was estimated to be better than ± 0.1% for a typical sample with a length of 30 cm and velocity of 1500 m/s.
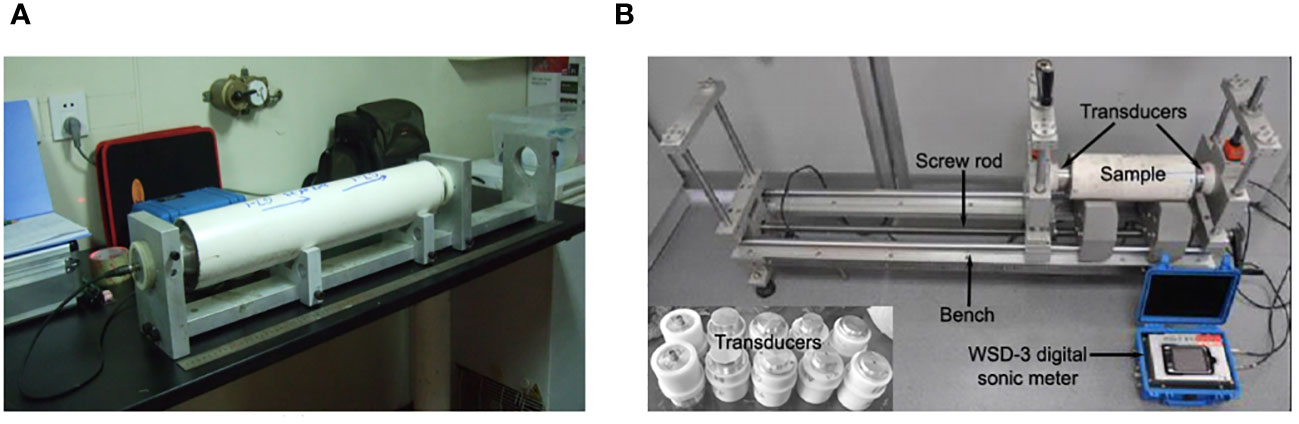
Figure 2 Apparatuses used for the measurement of sound velocities in (A) on the deck and in (B) in the laboratory.
Together with the measurement of the sound velocities of sediment samples, the particle composition, physical and mechanical properties and microstructure were analysed in the laboratory. Laboratory procedures to determine the geotechnical properties of the sediment samples followed the specifications for oceanographic survey GB/T 12763.8-2007 and the standard for geotechnical testing method GB/T 50123-1999, belonging to National Standard of the People’s Republic of China. A laser particle analyser (Malvern 2000, UK) was used to determine the composition, mean grain size, sand content, clay content and sorting coefficient; the sediments were then classified using Shepard’s (1954) ternary diagram based on the obtained sand and clay contents. The physical properties analysed included the wet bulk density, dry bulk density, water content, porosity, permeability coefficient and plasticity index. The wet bulk density is the weight of the mineral solids and porewater per unit volume and was measured using a cutting-ring method using a steel ring sampler (diameter 6 cm, height 2 cm) which was pushed into the sediment sample (Zhou et al., 2008). The water content was measured via oven-drying. The dry bulk density was calculated from the wet bulk density and water content (Zheng et al., 2011). Porosity was calculated by the specific gravity and dry bulk density (Zheng et al., 2011), and the permeability coefficient was measured using the water head difference from the permeability test (Clearman, 2007). The parameters mechanical properties measured in laboratory were the penetration and shear strengths, wherein the penetration strength was measured using a penetrometer (Lei and Xiao, 2002), and shear strength was measured using a miniature Vane shear apparatus (Xu et al., 2017). The liquid limit and plastic limit of sediments were measured using liquid-plastic limit combined tester (Meng et al., 2015), and the plasticity index is the difference of liquid limit and plastic limit. Microstructural observation were performed using a scanning electron microscope (SEM; QUANTA 200, Thermo Fisher Scientific, USA), at the magnifications of ×100, ×800 and ×1500.
At different frequencies, the differences in the sound velocities of the silty sand samples collected from the northern Huanghai Sea and Bohai Sea measured on-site and in the laboratory were generally ~85–130 m/s, and those measured in the laboratory were significantly higher than those measured on the deck. The discrepancies in the sound velocities were slightly different at different frequencies. Meanwhile, it was also found that the dispersion of the sound velocity at different measurement frequencies, which was obtained in the two measurement methods, was consistent (Figures 3A–C).
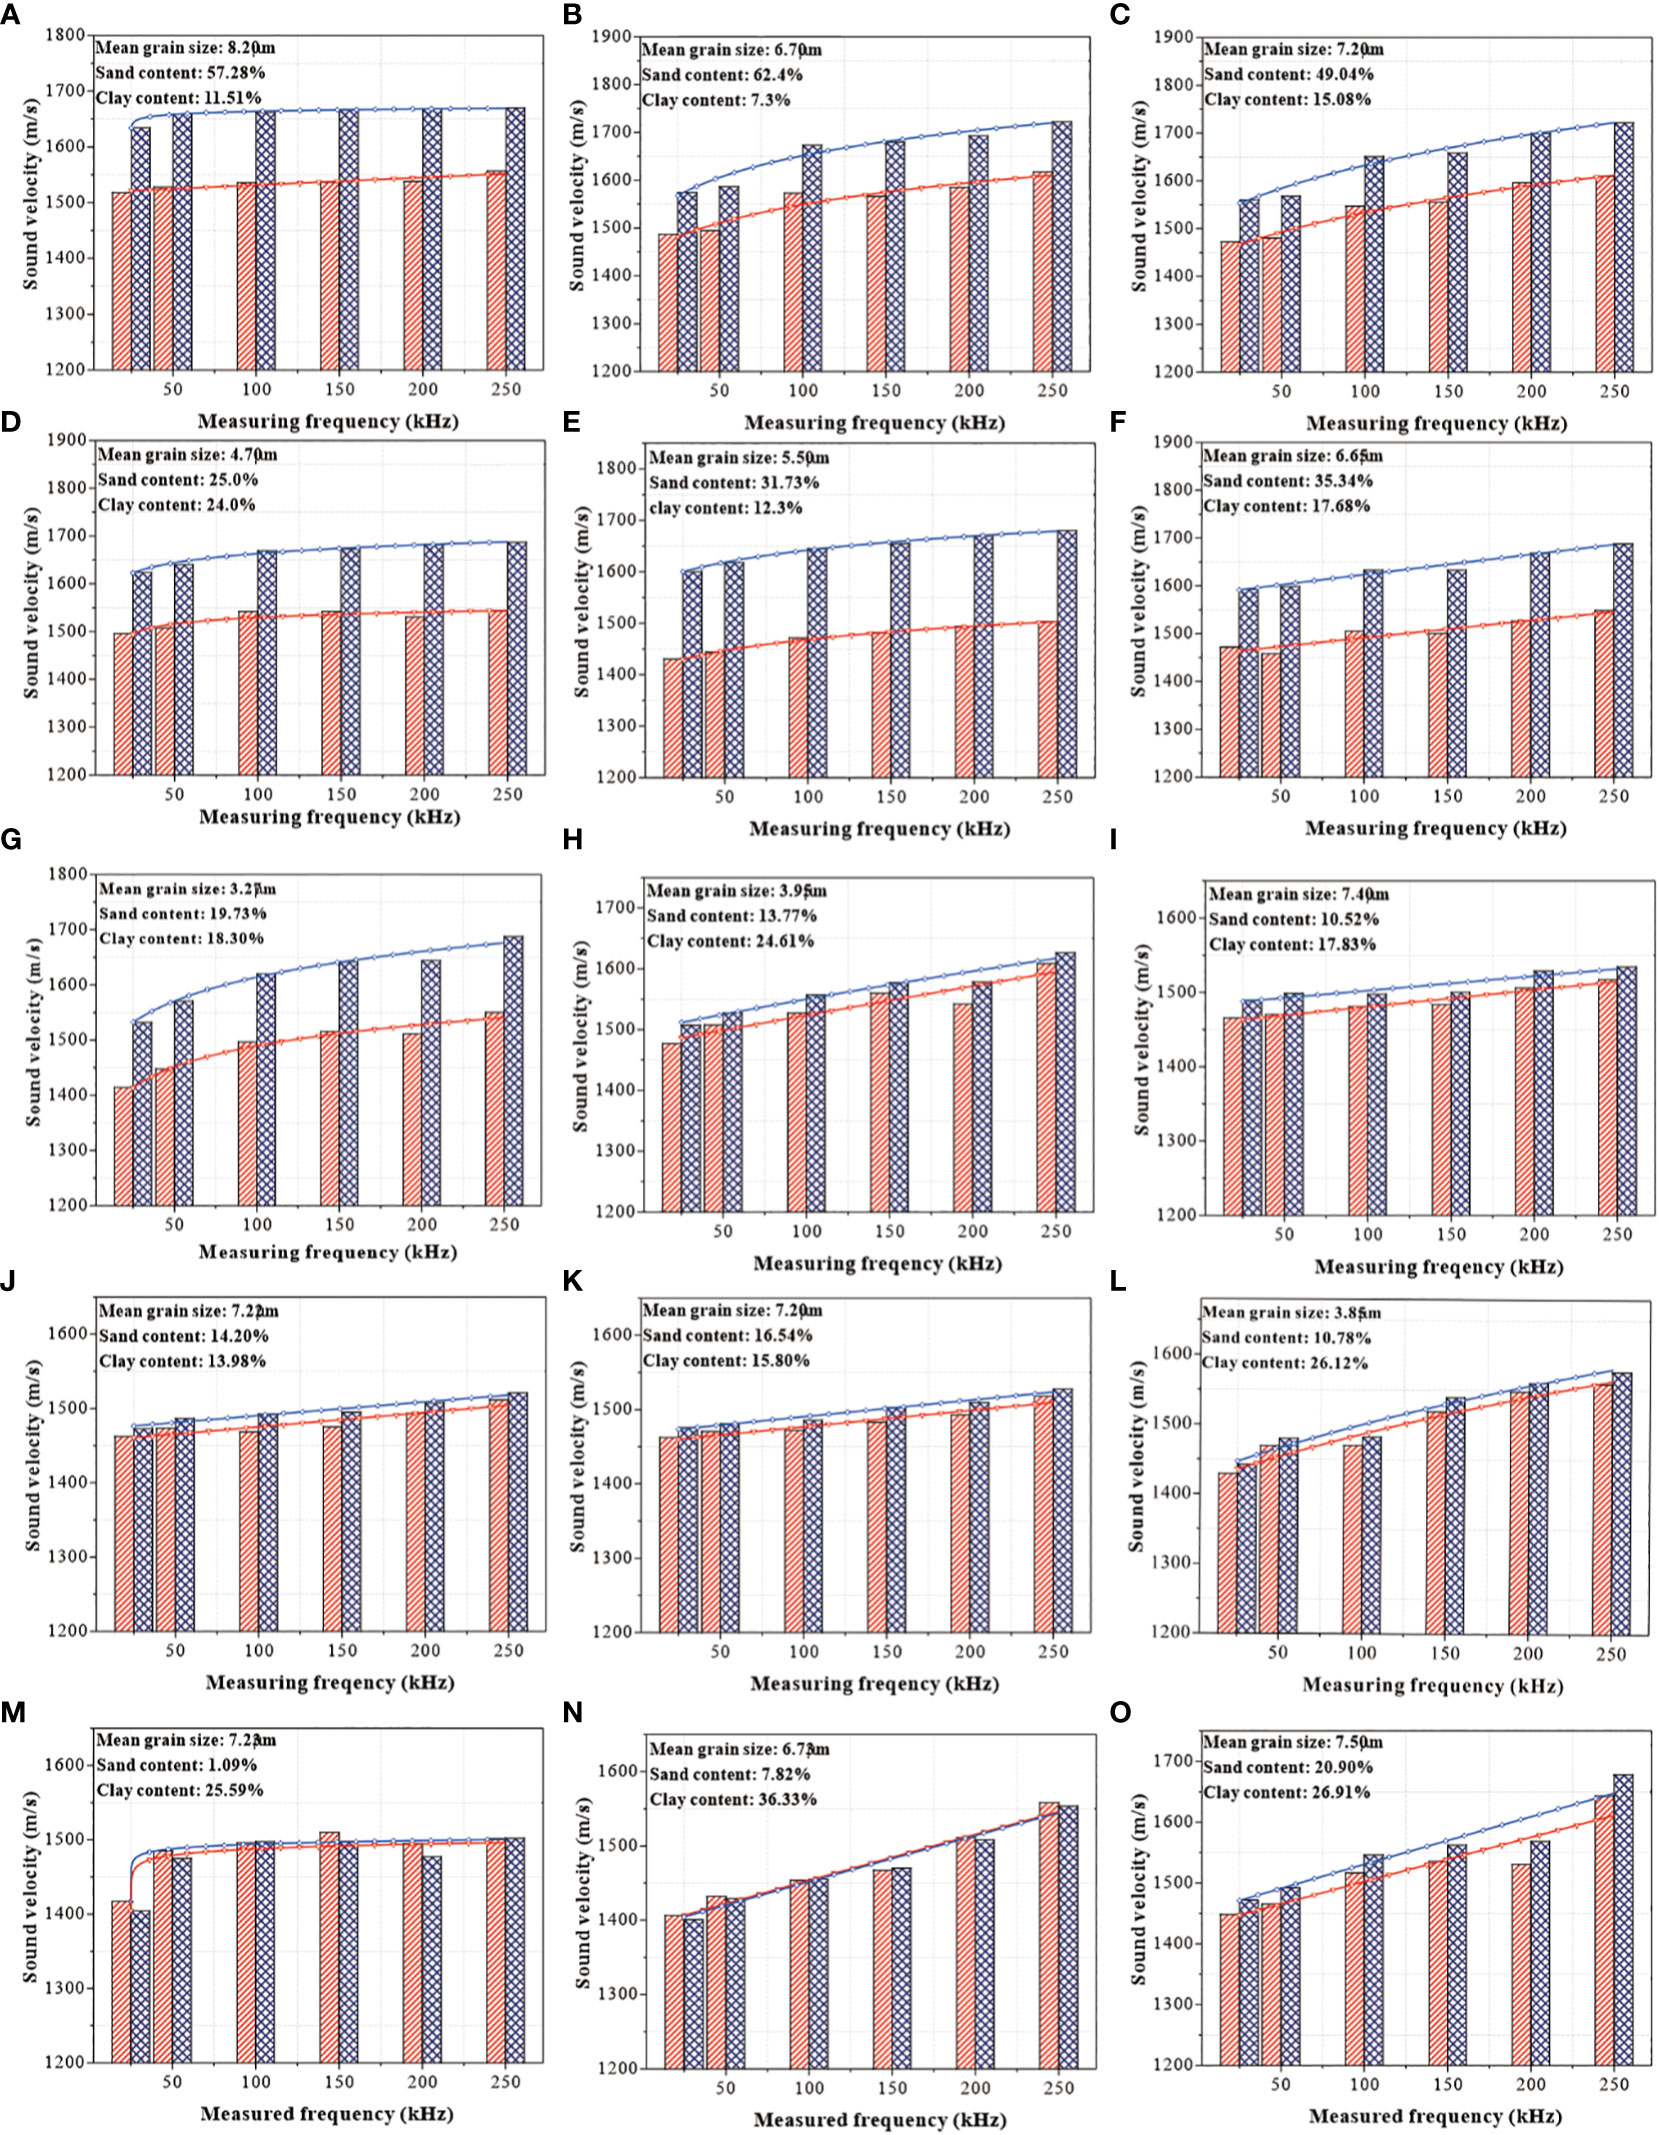
Figure 3 Sound velocities of (A–C) silty sand, (D–G) sandy silt, (H–K) silt and (L–O) clayey silt sediment samples measured on the deck (red bars) and in the laboratory (blue bars), along with their lines of best fit (red = field data; blue = laboratory data).
In this study, a total of three samples of silty sand were collected; the mean particle sizes were 8.20 μm, 7.20 μm and 6.70 μm, respectively, and contents of sand were 62.4%, 57.28% and 49.04%. The clay contents were 15.08%, 11.51% and 7.3%. As can be seen in Figures 3A–C, the larger the mean particle size was, the higher the sand and silt content, and the greater the difference between the sound velocities measured on-site and in the laboratory.
For the same sediment samples, as the measurement frequency differed, the difference between the sound velocities measured on-site and in the laboratory also differed. In order to facilitate the statistical and comparative analysis of sound measured velocities, the ratio of the measured sound velocity on the deck (Vp-f) to that measured in the laboratory (Vp-l) was analysed, and it was found that for the samples of silty sand, ranged from 0.92–0.94. For the same set of sediment samples, was essentially the same when measured at different frequencies. For silty sand samples, the higher the sand content was, the greater the value of , and there was no clear effect of the clay content on .
At different frequencies, the difference between the sound velocities in the sandy silts collected from the northern Huanghai Sea and Bohai Sea that were measured on-site and in the laboratory was generally ~120–180 m/s, which is obviously higher than that of the silty sands. However, what was consistent was the fact that the sound velocities measured in the laboratory were significantly higher than those measured on the deck; the difference between these sound velocities was slightly different at different measurement frequencies. It was also found that the dispersion of the sound velocities at different frequencies were consistent (Figures 3D–G).
In this study, a total of 12 samples of sandy silt were collected, and four typical sediment samples were selected for analyses. The mean particle sizes were 6.65 μm, 5.50 μm, 70 μm, and 3.27 μm, respectively, and the contents of sand were 19.73%, 25.0%, 31.73% and 35.34%. The clay contents were 24.0%, 12.30%, 17.68% and 18.30%. From Figures 3D–G, it can be seen that the higher the clay content of the sandy silt was, the higher the degree of dispersion of sound velocities measured on-site and in the laboratory. Meanwhile, the higher the sand and silt contents were, the higher the differences were in the sound velocities measured on-site and in the laboratory.
Comparing and analysing the ratio of the measured sound velocities on the deck (Vp-f) to those measured in the laboratory (Vp-l), it was found that the of the sandy silt sediments ranged from 0.90–0.92, which is slightly lower than the range of the silty sand samples. However, this finding was consistent with the silty sand samples in that the sound velocity measured at different frequencies was basically the same for the same sediment samples. For the sandy silt samples, the higher the sand and silt contents were (i.e., the lower the clay content), the greater the value of was, and the effect of clay content on was more pronounced than for the silty sand.
The difference in sound velocities of the silt samples collected from the northern Huanghai Sea and Bohai Sea measured on-site and in the laboratory differed by measurement frequency, and was generally ~10–40 m/s, which is obviously lower than the ranges of the sandy silt and silty sand samples. However, consistent with the silty sand samples was the fact that the measured sound velocities in the laboratory were significantly higher than those measured on the deck, but the difference was not large, and the differences varied by measurement frequency. Additionally, it was found that the dispersion of the sound velocities at different frequencies was consistent (Figures 3H–K).
In this study, a total of 10 samples of silt were collected, and four typical samples were selected for analyses. The mean particle sizes were 7.40 μm, 7.29 μm, 7.22 μm and 3.95 μm, respectively, and the sand contents were 16.54%, 14.20%, 13.77% and 10.52%. The clay contents were 24.61%, 17.83%, 15.80% and 13.98%. As can be seen from Figures 3H–K, the higher the clay contents of the silt samples were, the lower the degree of dispersion there was in the sound velocities measured on-site and in the laboratory, and the smaller the difference between the two. Meanwhile, the higher the sand and silt contents were, the higher the differences were in the sound velocities measured on-site and in the laboratory. Compared with the silty sand and sandy silt samples, the degree of dispersion on the deck and in the laboratory was much lower.
By comparing and analysing the ratio of the sound velocities measured on the deck (Vp-f) to those measured in the laboratory (Vp-l), we found that the of the sandy silt samples ranged from 0.98–0.99, which is notably higher than the ranges for silty sand and sandy silt samples. However, in agreement with these sediments, the sound velocity measured at different frequencies was essentially the same for the same sediment samples. Nevertheless, the effects of mean particle size, sand content and clay content on the value of was not statistically significant.
At different frequencies, the difference in the sound velocities of the clayey silt samples collected from the northern Huanghai and Bohai seas and measured on-site and in the laboratory was generally approximately -15–40 m/s, which is obviously lower than that of the sandy silt and silty sand samples. Additionally, these samples were also inconsistent with the those of the first three sediment types, as the difference between the measured sound velocities in the laboratory and on the deck was not significant, and not all of the laboratory measurements were higher than those from the field. However, it was found that the dispersion of the sound velocities at different measurement frequencies was consistent across all sediment types (Figures 3L–O).
In this study, a total of 4 samples of clayey silt were collected, for which the particle size composition is shown in Figures 3L–O. Based on comparative analyses between the sound velocities measured in the laboratory and on the deck, it was found that when the clay content was very high, the difference between the two methods was very small, and the degree of dispersion was also very low. Conversely, when the sand content was high, the difference between the two methods was large.
Comparing and analysing the ratio of the sound velocities measured on the deck (Vp-f) to those measured in the laboratory (Vp-l), it was found that the of the clayey silt samples ranged from 0.99–1.01, which is not only higher than the ranges of silty sand, sandy silt and silt, but the ratio is also >1.0, which indicates that during the measurement of clayey silt, there were some sound velocities measured on the deck that were higher than those measured in the laboratory. Meanwhile, consistent with the former sediment types, the sound velocity measured at different frequencies was basically the same for the same sediment samples. The effect of mean particle size, sand content and clay content on the value of was not significant.
There were four types of sediments collected in the study area of the Yellow Sea and Bohai Sea – silty sand, sandy silt, silt and clayey silt. These different types of sediments exhibited different degrees of granularity in terms of sand content, clay content, mean particle size and the sorting coefficient (Figure 4). For the sand content, samples of silty sand had significantly higher concentrations, ranging from 48.5–63.2%, while samples of silt and clayey silt had much lower concentrations, ranging from 0.2–21.7%, and samples of silt exhibited a moderate concentration in the range of 21.4–37.0%. With respect to clay content, samples of clayey silt had substantially higher concentrations, ranging from 26.6–36.9%. Meanwhile, samples of silty sand had much lower concentrations, ranging from 7.1–15.9%, and samples of sandy silt and silt had middling concentrations, ranging from 12.7–24.7% and 13.8–24.8%, respectively.
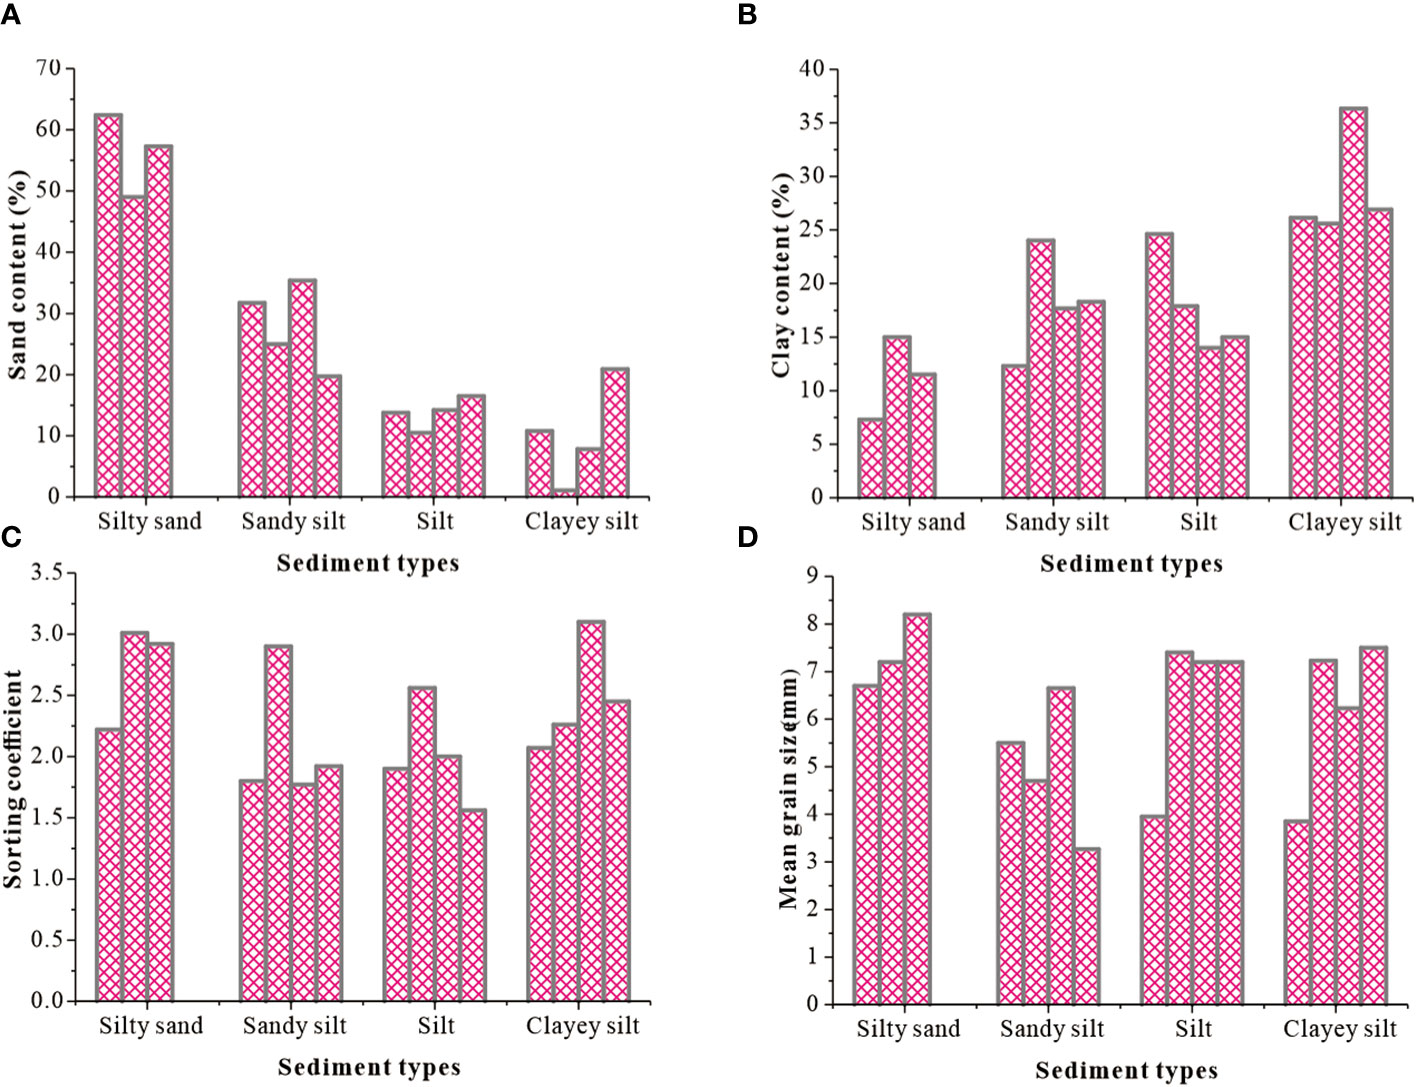
Figure 4 Compositions of different sediments types: (A) sand content; (B) clay content; (C) mean grain size; (D) sorting coefficient.
The mean particle sizes in samples of silty sand were generally higher, ranging from 6.8–8.4 μm, while those of other types of sediments were substantially lower. This was the most obvious for the samples of sandy silt and clayey silt, which ranged in size from 3.4–6.6 μm and 3.9–7.6 μm, respectively. For the samples of silt, the average sizes of individual grains were generally concentrated in the range of 7.0–7.5 μm. With respect to the sorting coefficient, the different types of sediments in the study area were >1.0 and the silty sand had the highest average sorting coefficient, ranging from 2.2–3.1. The silty sand was poorly sorted with good gradation. The sorting coefficient of the clayey silt range from a similar 2.1–3.2. Compared with the other types of sediments in the study area, the sorting coefficients of the sandy silt and silty sediments were generally lower, while the degree of sorting was generally higher.
This study is focused on the sediments collected in the northern Huanghai and Bohai seas, which mainly comprise silty sand, sandy silt, silt and clayey silt. The sediment samples that Meng et al. (2012) collected in the southern Huanghai Sea involved 10 types of sediment, including super-fine sand, silty sand, clayey sand, sandy silt, coarse silt, medium silt, clayey silt, silty clay, clay and sand–silt –clay. Therefore, compared with the characteristics of the sediments in the southern Huanghai Sea, where the sand content ranged from ~0.3–77.3%, clay content ranged from ~8.9–89.5% and the mean particle size ranged from ~0.002–0.129 mm, the sediments in the northern Huanghai and Bohai seas represent a narrower scope and are generally concentrated. However, in terms of the silty sand, sandy silt, silt and clayey silt, the scope of the granular characteristics of the sediment samples collected in this study is broader than in the study of the southern Huanghai Sea by Meng et al. (2012). These differences are related to the quantitative restrictions imposed by the sediment sampling in this work. Nevertheless, on it can be preliminarily estimated that the distributions of the sediments in the northern Yellow Sea and Bohai Sea are typical (Wang et al., 1996).
Different types of sediments in the northern Huanghai Sea and Bohai Sea have physical properties that are obviously different based on the measured wet bulk density, dry bulk density, water content, porosity, plasticity index and permeability coefficient (Figure 5). For wet bulk density and dry bulk density, the samples of different sediment types were arranged in the order of: silty sand > sandy silt > silt > clayey silt, and respectively in the range of 1.58–2.06 g/cm3 and 1.07–1.53 g/cm3. The water contents of different types of sediments in the study area were high, and the moisture content of the clayey silt was the highest. The difference in the water contents among the other three types of sediments was not obvious, as they ranged from 35–45%. With respect to the porosity, clayey silt sediments exhibited the highest porosity and a low degree of consolidation, while the silty sand has the lowest porosity and a high degree of consolidation. Preliminary results showed that it these traits were closely related to the water lost from sediment samples, wherein the samples of sandy silt were more discrete and changed within a wider range. The difference between silt and sandy silt samples was insignificant, and they changed within a standard range.
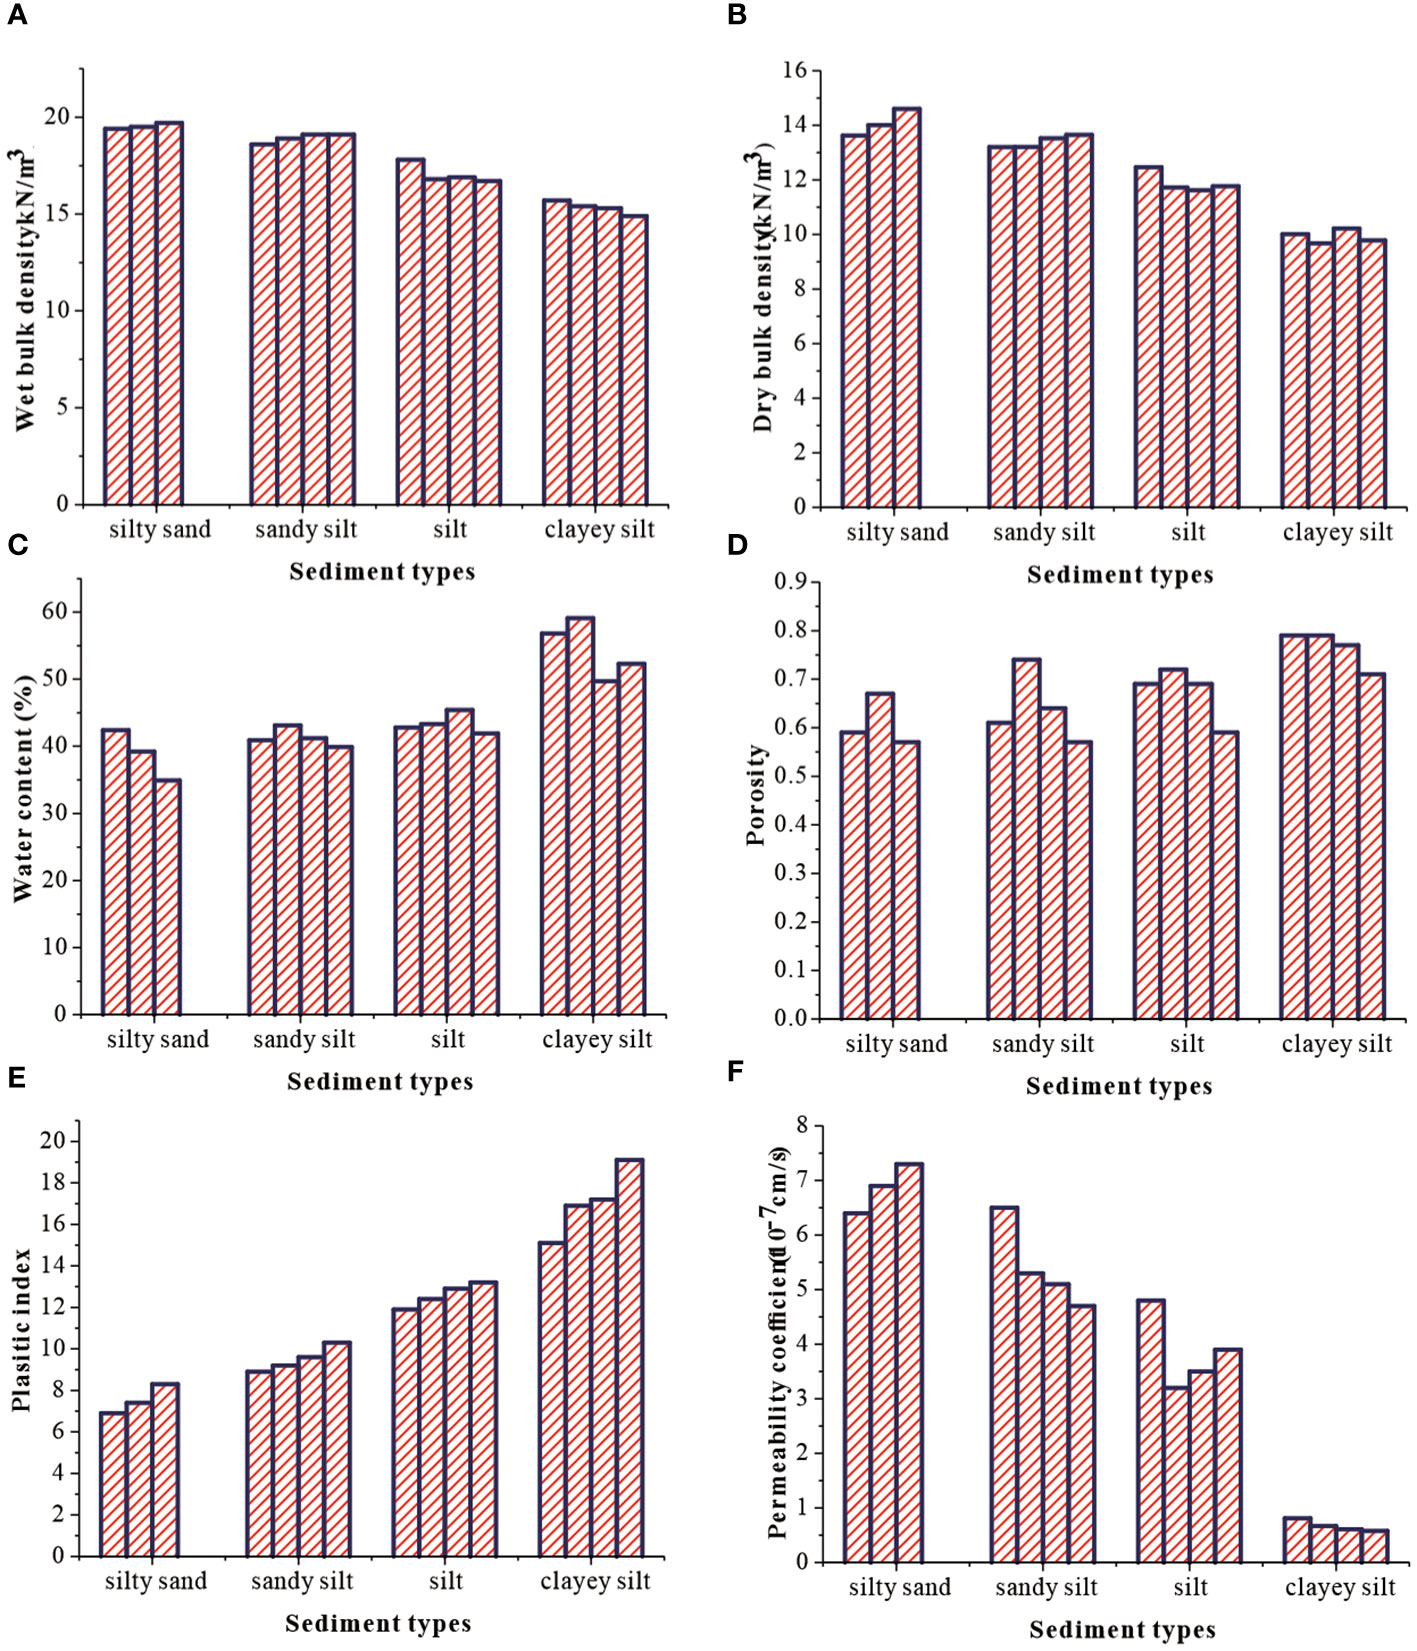
Figure 5 Physical properties of different types of sediment samples: (A) wet bulk density; (B) dry bulk density; (C) water content; (D) porosity; (E) plasticity; (F) permeability coefficient.
For the plasticity index, different types of sediments showed more obvious regularity, which increased in the order of: silty sand< sandy silt< silt< clayey silt. The plasticity index of silty sand was in the range of ~6.5–8.5, while for sandy silt it was ~9.0–11.0, for silt, the range was ~12.5–14.0, and clayey silt ranged from ~14.5–19.5. Finally, the permeability coefficient showed different degrees of regularity for different types of sediments, which increased in the order of clayey silt<silt<sandy silt<silty sand. The permeability of silty sand was in the range of 6.0×10⁻⁷–7.5×10⁻⁷ cm/s, while for sandy silt, it ranged from 4.5×10⁻⁷–6.8×10⁻⁷ cm/s; the permeability range for silt was 3.2×10⁻⁷–5.0×10⁻⁷ cm/s and that of clayey silt was 3.5×10⁻⁷–5.5×10⁻⁸ cm/s.
Compared with the physical properties of the sediments collected in the northern Huanghai and Bohai seas, the sediment types in the southern Huanghai are complex and their properties vary widely. Meng et al. (2012) analysed 10 sediment samples collected from this region in a laboratory, and found a wet bulk density of 1.50–2.07 g/cm3, a water content of 25.0–107.4%, a porosity of 0.40–0.74 and a permeability coefficient ranging from 9.0×10⁻⁸–1.5×10⁻⁷ cm/s. The consistency of the results between our two studies may be seen in the fact that the physical properties of seafloor sediments correspond well to their types, and coarser sediments have higher values for bulk density and permeability, and lower ones for water content and porosity.
The penetration and shear strengths of sediments are important parameters to characterize their macroscopic mechanical properties, which are vital for marine geotechnical engineers. The penetration strength indicates the vertical bearing capacity of the sediment, which is determined by the degree of compaction. The shear strength indicates the maximum shear force that the sediment can bear, which is mainly affected by the adhesion and friction angle of the sediment. Based on laboratory measurements of penetration and shear strength for different types of sediment samples from the northern Huanghai and Bohai seas (Figure 6), it was found that those of silty sand were the highest. The sandy silt and silt exhibited middle values, with insignificant differences between them, whereas clayey silt sediments had very low penetration strengths and high shear strengths. The distributions of the mechanical properties of these sediments could also be obtained in the same manner for the laboratory measurements of the sediments from the southern Huanghai Sea (Meng et al., 2012). However, for the sediments in the north, the differences were particularly notable.
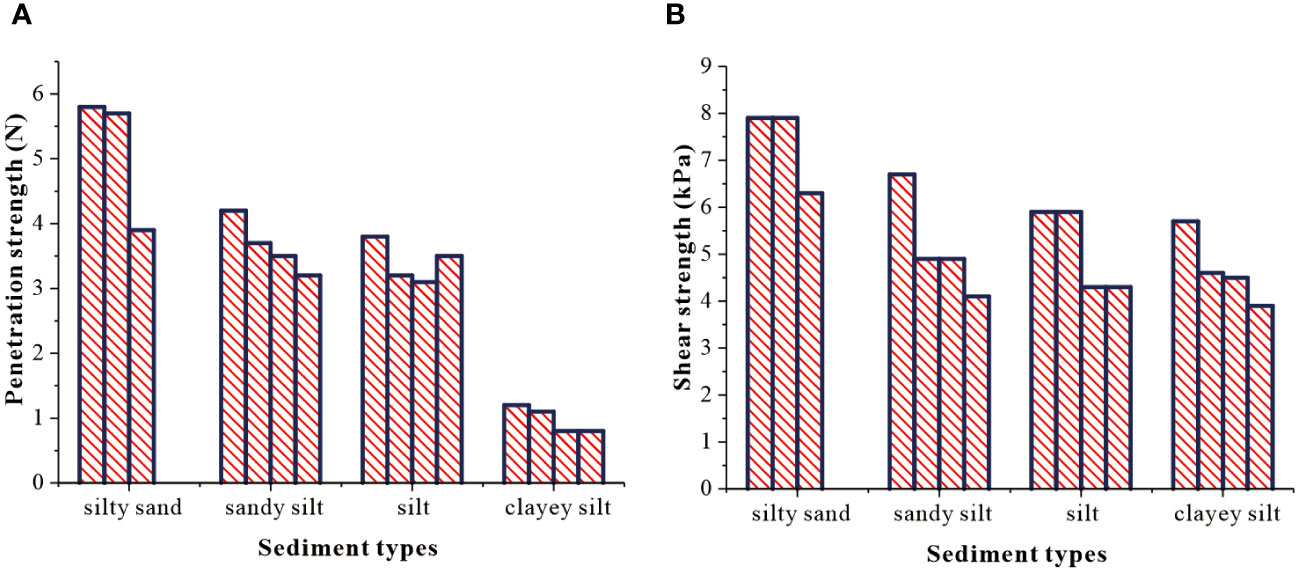
Figure 6 Mechanical properties of different types of sediment samples: (A) penetration strength; (B) shear strength.
Combining the analyses shown in Figures 4–6 and research of Meng et al. (2012) in the southern Huanghai Sea, we identified four types of sediments – silty sand, sandy silt, silt and clayey silt, which could be divided into three categories for measurement in the laboratory. Among them, silty sand constituted a category, sandy silt and silt could be grouped into a single category and clayey silt was the final category. Comparatively, sandy silt and silt have small differences in their particle sizes (i.e., sand content, clay content, average particle size and sorting coefficient), physical properties (i.e., wet bulk density, dry bulk density, water content, porosity, plasticity index and permeability) and mechanical properties (i.e., penetration and shear strength). In this study, the sediment samples were classified according to Shepard’s ternary diagram used for classification according to the Marine Investigation Regulations (GB/T12763.8-2007). In marine geotechnical engineering, sediments are divided into sand, silt and clay according to their plasticity indices (Jia et al., 2011). According to the plasticity index method used in marine geotechnical engineering, there are four types of sediments in the study area, as classified according to the Marine Investigation Regulations, which can be broadly divided into the aforementioned three categories. Among them, silty sand and sandy silt can be roughly classified as sand, while silt and clay are classified as such.
The microstructural characteristics of sediments are important factors that determine their physical mechanics and engineering properties, and also have important impacts on their acoustic properties. In this work, three microscopic structures of different magnifications (×100, ×800 and ×1500) were examined by electron microscopy in the sediments from the northern Huanghai Sea and Bohai Sea. The typical microstructure electron microscope images of four different sediment samples are shown in Figure 7. This microscope images represent the dried particles alignment of different sediments.
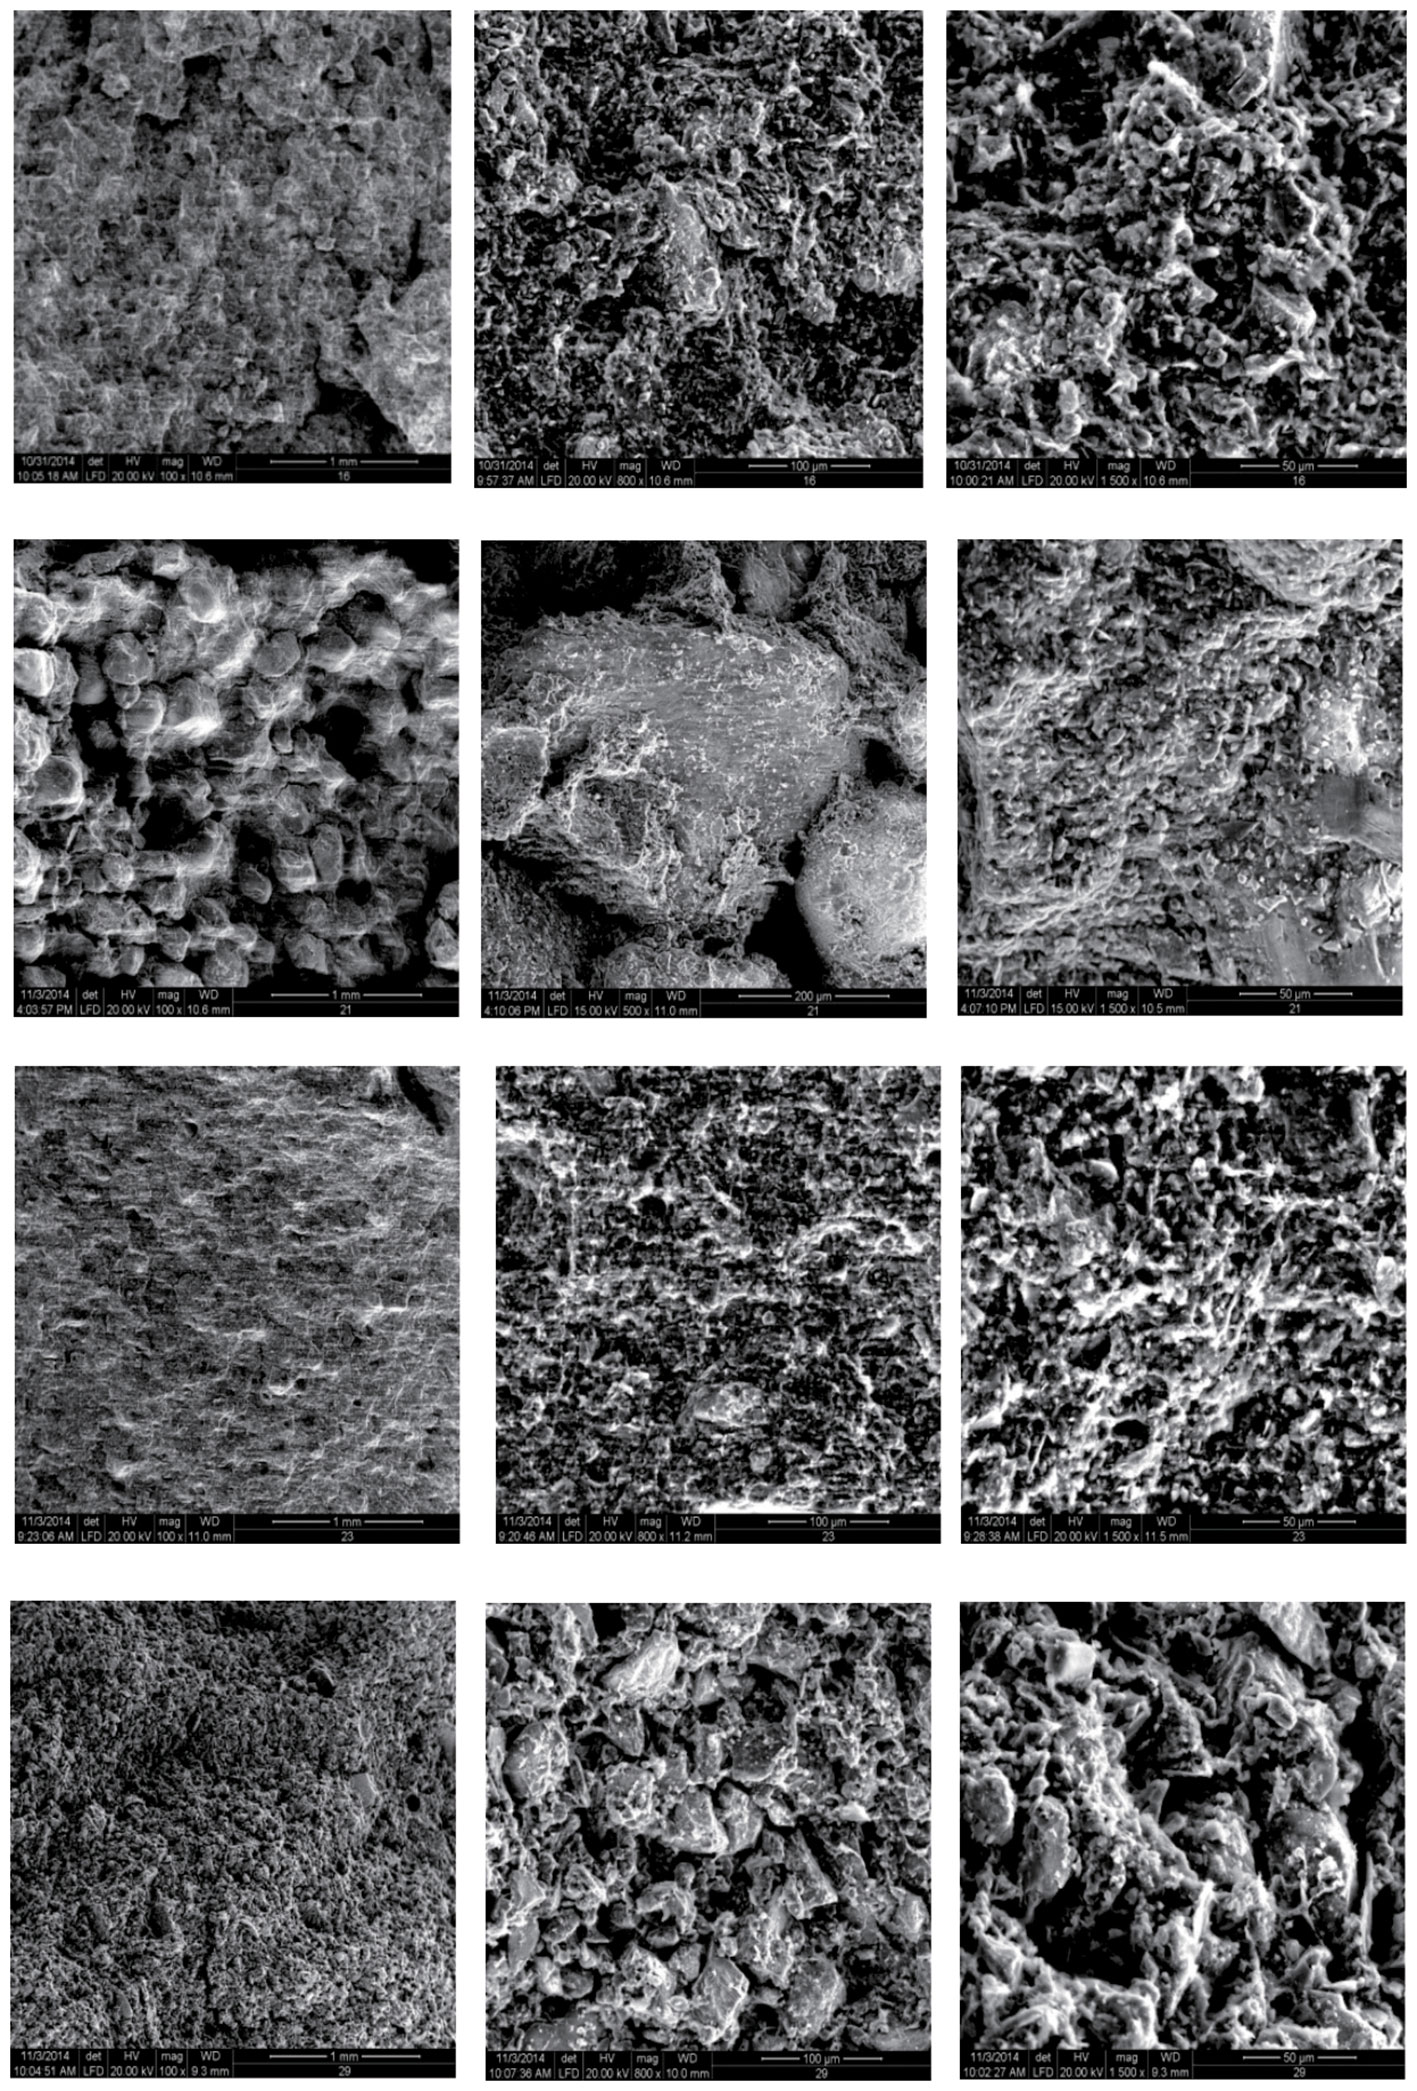
Figure 7 Microstructures of (upper row) silty sand, (upper middle row) sandy silt, (lower middle row) silt and (lower row) clayey silt samples at 100, 800 and 1500 times magnification.
Silty sand had a sedimentary structure based on sand particles, and silt particles supplemented to become the skeleton, with a small amount of clay filling in. It can be seen from the upper panel of Figure 7 that the samples of silty sand had large skeletal particles and their tendency toward a preferred orientation is obvious. The fine particles are filled and attached to larger particles with large pores, which can be approximated as a single grain structure (Hamilton and Bachman, 1982). The content of the sand in sandy silt was less than that of the silty sand, and the content of fine grain sizes increased. It can be seen from the second panel (row) of Figure 7 that the particle sizes of the sedimentary skeleton were much smaller than in the silty sand, with no clear trend of particle orientation. Additionally, the sediments shown in this panel exhibit moderate roundness, and the voids are filled with more fine-grained particles, while also being attached to the skeleton, with more and smaller pores. The sand content in the silt was even lower, and the main component was silt; the clay content increased relative to the sandy silt. It can be seen from the second panel from the bottom in Figure 7 that the abundance of large particles that make up the skeleton is greatly reduced, and there is an obvious grain orientation. The silt grains exhibit poor roundness, and a large number of fine particles fill in and attach to the skeleton, with more and smaller pores than in the sandy silt. Finally, the sand content in clayey silt was very small, as the main components were fine-grained particles and clay. As can be seen from the bottom panel of Figure 7, the clayey silt forms and approximate bundled sheet structure (Hamilton and Bachman, 1982; Meng et al., 2012), wherein large particles are completely surrounded by fine particles, which become aggregates owing to complex physicochemical interactions.
The observation of the microstructural characteristics of sediments involves relatively matured research methods; however, the physical models of sediment geotechnical and acoustic behaviours and properties based on such microstructures are currently lagging behind. Techniques for measuring the porosity sediments from microstructural images have now become possible. Changes in the clay microstructure during consolidation have also been studied and linked to changes in the shape, alignment and spatial arrangement or distribution of clay crystals and aggregates (Zheng et al., 2014). It is also now possible to predict sediment permeability based on the size of the pores pathways observed and the amount and degree of interconnection among pores (Vaughan et al., 2002). Nevertheless, models for predicting compressional or shear wave velocities based on sediment structure and the physicochemical interactions between sediment grains and pore fluids have remained unsuccessful, and much research is still required (B.H. Liu et al., 2013).
Physical characteristics and the conditions of the depositional environment are two major factors affecting the acoustic properties of marine sediments. Meanwhile, the influence of the sedimentary environment on these properties is also largely based on the physical characteristics of the sediments. Changes in environmental conditions that may affect the physical properties of sediments include changes in temperature and pressure during the collection of the sample, as well physical disturbances during sample transport. For shallow sea sediments, the effect of deep-water stress (i.e., depressurisation) on geoacoustic properties is negligible (Li et al., 2008; Wang et al., 2008). Here, we discuss the factors and mechanisms influencing sound velocity measurement errors in the laboratory and on the deck for samples from the Huanghai and Bohai seas with respect to the effects of temperature and physical disturbance during the process of sample transport.
Based on the comparative analysis of the sound velocities measured on the deck and the laboratory for four types of sediments collected from the northern Huanghai and Bohai seas (i.e., silty sand, sandy silt, silt and clayey silt), we found the thresholds of , which ranged from 0.92–0.94, 0.90–0.92, 0.98–0.99 and from 0.99–1.01, respectively (Figure 8). According to our comparative analyses, the values of the four types of sediment in the southern Huanghai Sea are generally within the thresholds of the northern Huanghai Sea and Bohai Sea, and their deviations are less than 5%, which demonstrates that the calculated threshold range of in this study is statistically significant.
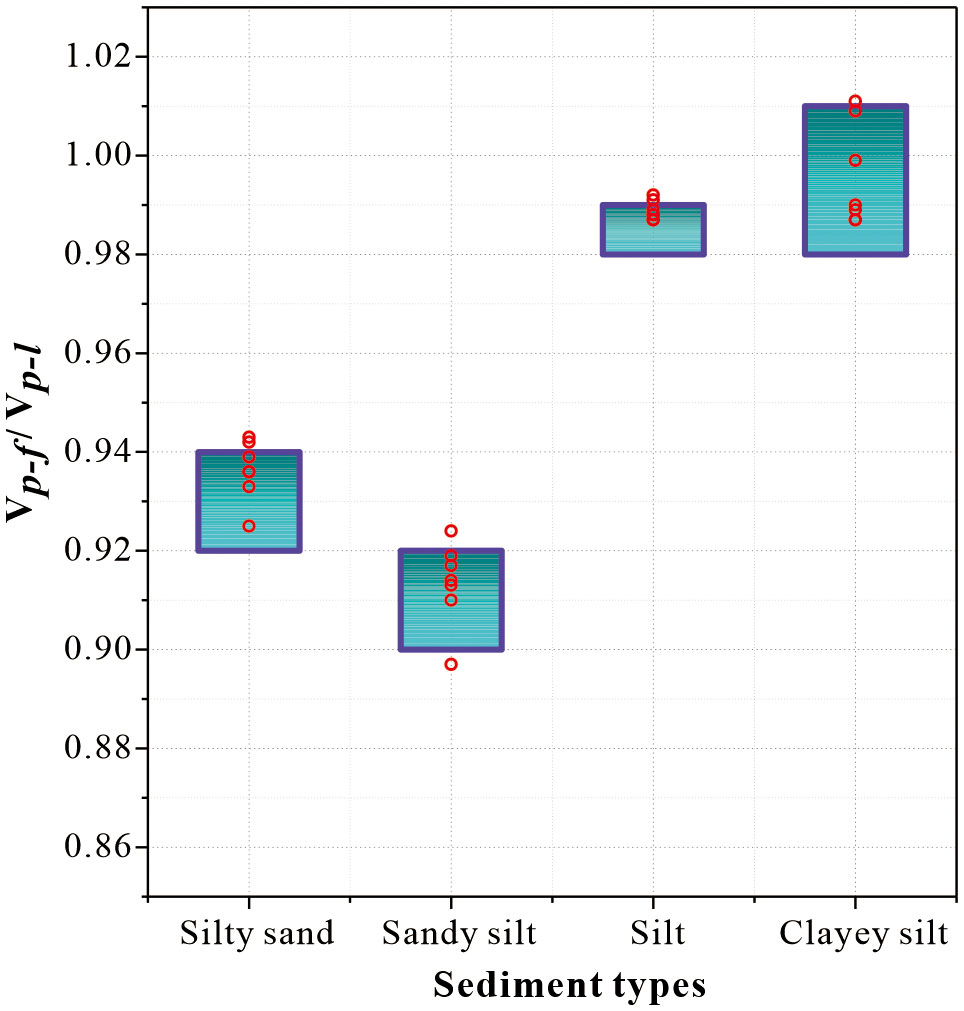
Figure 8 Contrasting sound velocity measurements from the on-deck and laboratory between the northern Huanghai Sea and Bohai Sea (green rectangles) and the southern Huanghai Sea (red circles).
Temperature is one of the most important factors affecting the sound field in the ocean. A clear theoretical system of its influence has now been formed. However, the influence of temperature on the acoustic properties of seafloor sediments is still in the stage of semi-qualitative analysis and a clear understanding of the mechanism of influence has not yet been formed.
Hamilton (1971, 1972) concluded that the acoustic properties of pore water in sediments are the most sensitive to temperature changes and are also the main factors that control the acoustic properties of sediments with temperature. Zou et al. (2008) found three trends in sound velocities with temperature based on temperature-controlled physical model experiments in a laboratory; these were: (1) the positive growth of sound velocity (STPIK), (2) the negative growth of sound velocity (STNIK) and (3) the fluctuation of sound velocity (STWK). Because the test samples for these three trends were all silt, with little differences in porosity, density or water content, it is difficult to clearly interpret these results in terms of the actual effect of such trends in sediment sound velocities with temperature. In this study, it was speculated that seafloor sediments have complex structures due to their different sedimentary histories (Hamilton, 1976; Lu et al., 2003), and the testes samples were all unconsolidated sediments with a loose structure. The difference between loose and unconsolidated structures composed of pore particles of different shapes and geometries leads to the complexity of the relative motions of seawater through pores and the solid-phase particles under thermal motion, possibly resulting in the formation of the three trends observed by Zou et al. (2008). In other words, the microstructure of loose sediments is a critical factor affecting the trends in sound velocity with temperature.
Based on the laboratory measurements of sound velocities with temperature for nine different types of samples, Zeng et al. (2009) showed that the sound velocity decreased with temperature in the order of sand > clay > silt, presumably because as temperature rises, changes in the seepage state cause the porosity of the sediment to increase, such that the seawater volume increases, resulting in a low sound velocity. Thus, sound velocity increases with temperature in the clayey sand and clayey sand–silt. It is speculated that in the clayey silt, moisture does not easily flow due to the high clay content. Furthermore, the composition of clay minerals and sands play an important role in the response of sediment sound velocities with temperature. In other words, the difference between the grain sizes of sedimentary components is the important factor influencing the variation of the sound velocity with temperature for different types of sediments. Hong et al. (2011) analysed the variation of seafloor sediment sound velocities with temperature in the South China Sea. The sound velocities of the sediments in this area varied slowly and exhibited obvious fluctuations, but the overall trend was almost linearly decreasing. We believe that the mechanism underling the effect of temperature on the sound velocity of seafloor sediments was equivalent to the comprehensive effect on the equivalent elastic modulus and density of the sediments.
In the temperature-controlled physical model experiments in laboratories, such as the studies of Zou et al. (2008) and Zeng et al. (2009), the range of temperatures measured has been 0–30°C, and the range of sound velocities has been 1300–1600 m/s. As for the temperature-controlled sound velocity measurement of samples from the South China Sea (Hong et al., 2011), the range of variation in the sound velocity was 1700–1880 m/s within a similar temperature range as for the aforementioned studies, and the variations in the sound velocities of different types of sediments differed. The measured sound velocities of different sediment samples varies within the range of 1400-1600 m/s over the measured temperature range (Meng et al., 2012). In the shipboard field and laboratory sound velocity measurements of sediment samples from the Huanghai and Bohai seas, the measurement temperature ranged from ~18.0–20.5°C, and the temperature difference in the same group was less than 3°C. Based on the present laboratory measurements of sediment sound velocity, it is assumed that temperature had little effect on the sound velocities measured (about 8 m/s), as such a small difference in temperature (≤2.5°C) can be neglected.
The particle size composition of seafloor sediments is one of the important parameters in seafloor sedimentology and soil mechanics, an important parameter can reflect the sedimentary origin, environment and processes of the sediments. Characterizing the size composition of sediments is important for laboratory analyses of seafloor sediment samples (Lu and Liu, 2008). Research of the relationship between the particle size composition and acoustic properties of seafloor sediments began in 1960s and 1970s. Akal (1972) and Hamilton (1976) extensively studied the effects of particle size on the sound velocities of seafloor sediments in the world oceans, and established the empirical relationships of grain size parameters, such as sand content, clay content and mean particle size, with their acoustic properties. In subsequent works, Liang and Lu (1983), Prasad (2002), X.L. Liu et al. (2013) and Kan et al. (2014) have analysed the effect of sediment particle size on the acoustic properties of shallow sediments in different marine areas, and established an empirical ground acoustic model that describes the relationship between sediment particle size and geoacoustic properties, which are suitable for different areas. These studies have revealed that the influence of sediment particle size on the acoustic properties of marine sediments has a clear mathematical relationship that may be quantified during macroscopic characterization. The deviations of on-site sound velocity measurements from laboratory measurements of different types of sediments have obvious differences with respect to their classification and particle size compositions, but what are the effects? What is the mechanism underlying such impacts? The answers to these two questions need to be understood from the point of view of marine soil mechanics to understand the mechanism that causes the deviation between laboratory and on-site sound velocity measurements.
From Figure 3 and Figure 8, it can be seen that the silty sand, sandy silt, clayey silt and silt samples from the Huanghai and Bohai seas have significantly different ranges, while for the same type of sediments, the is concentrated within a narrow range and the deviation is small. The results show that the value of silty sand is similar to that of sandy silt, both of which are notably less than 1.0. The l of the silt is also less than but closer to 1.0, while for clayey silt, values both greater than and less than 1.0 exist. From the l value classifications, silty sand and sandy silt can be grouped into one class, while the classes for silt and clayey silt remain discrete. Based on the characteristics of the particle size components of sediment samples in this study, and according to the Shepard’s classification method of Marine Investigation Regulations (GB/T12763.8-2007) and the plasticity index method of marine geotechnical engineering, silty sand and sandy silt can be roughly classified as sand, and silt and clayey silt can be classified as such.
For superficial sediments, the external environmental factors that cause errors in the shipboard and laboratory acoustics tests are the changes in the temperature of sediment samples and the vibration of sediment samples during transport. From the analyses described in section 5.2, it can be assumed that the change in temperature had little effect on the errors of either on-site or laboratory acoustics tests of sediment samples in this study. Therefore, the impact of vibration during the transport of sediment samples can be taken as the main factor causing the deviation of the laboratory-measured velocities from the on-site ones. As shown in Figure 3 and Figure 8, the influence of vibration during the transport of sediment samples obviously differed between silty sand and sandy silt, and between silt and clayey silt. Based on analogous analyses in marine sediment surveys and marine geotechnical classification methods, the difference in the above influencing mechanisms could be analysed from the perspective of marine soil mechanics.
In the study of marine soil mechanics, sandy soil has the characteristic of micro-vibrational liquefaction, and clay exhibits obvious thixotropic characteristics under the action of dynamic forces. As the transitional soil between sand and clay, silt has both the liquefaction characteristics of sandy soil and the thixotropic characteristics of clay (Jia et al., 2011). The liquefaction of sand refers to the phenomenon that the saturated sand entered a liquid state under the action of vibration; due to the increase of pore water pressure, the sand changes from a solid state to a liquid state from the decrease in the effective stress. The mechanism is the saturated fine sand has a tendency to move and become denser under vibrational forces, wherein the stress migrates from the sand framework to the water, and due to the poor penetration of fine sand, the pore water pressure will increase sharply. When the pore water pressure reaches the total stress value, the effective stress declines to 0. The particles will then be suspended in the water, and the sand will liquefy (Liu et al., 2017). After a period of time following liquefaction, the drainage and consolidation processes will occur, resulting in more intense consolidation (Li et al., 2008). Meanwhile, the thixotropic property of clay is such that when the structure of clay is disturbed, the electric double layer is destroyed, resulting in reduced strength. However, with the increase of standing time, a new equilibrium is formed among the soil particles, ions and water molecules, and the soil strength recovers gradually. Nevertheless, the recovered characteristics generally do not differ greatly from the initial sediment strength; this property is called soil thixotropy.
Based on the analyses presented here, it can be inferred that silty sand and sandy silt both have the dynamic liquefaction characteristics of sandy soils, such that the liquefaction and re-consolidation processes that occur during sample transport are important mechanisms that lead to significantly higher laboratory sound velocities than those recorded on the deck. Clayey silt has the dynamic thixotropy characteristic of clay, and the thixotropic resumption process during sample transport is also an important mechanism that leads to significantly higher laboratory sound velocities than those from the on-deck. With the dual characteristics of liquefaction and thixotropy, the processes of liquefaction, re-consolidation and thixotropic resumption of silt–sand occurring in the process of sample transport are the important factors that lead to significantly higher laboratory sound velocities than those measured on the deck for silts. The dual characteristics of silt–sand, with dynamic liquefaction–thixotropy, determine that its ranges from those of sandy silt and silty sand to that of clayey silt.
Particle size is the main factor that affects the dynamic liquefaction and thixotropic properties of sands, silts and clays (Zheng et al., 2011), and indirectly affects the of silty sand, sandy silt, silt and clayey silt. Based on a comparative analysis of the on-deck- and laboratory-measured sound velocities in the sediment samples from the northern Huanghai and Bohai seas, it can be concluded that the of the silt samples was the least affected by the particle size composition, while those of sandy silt and silty sand were the most affected (Figure 9). For the of clayey sand, different granularity parameters have different influences. In the sample tests performed in this study, the clay content of clayey silt was more concentrated, so it was difficult to judge the influence of clay content on its . However, we can clearly point out that the sorting coefficient and sand content had significant impacts (Figures 9B–D).
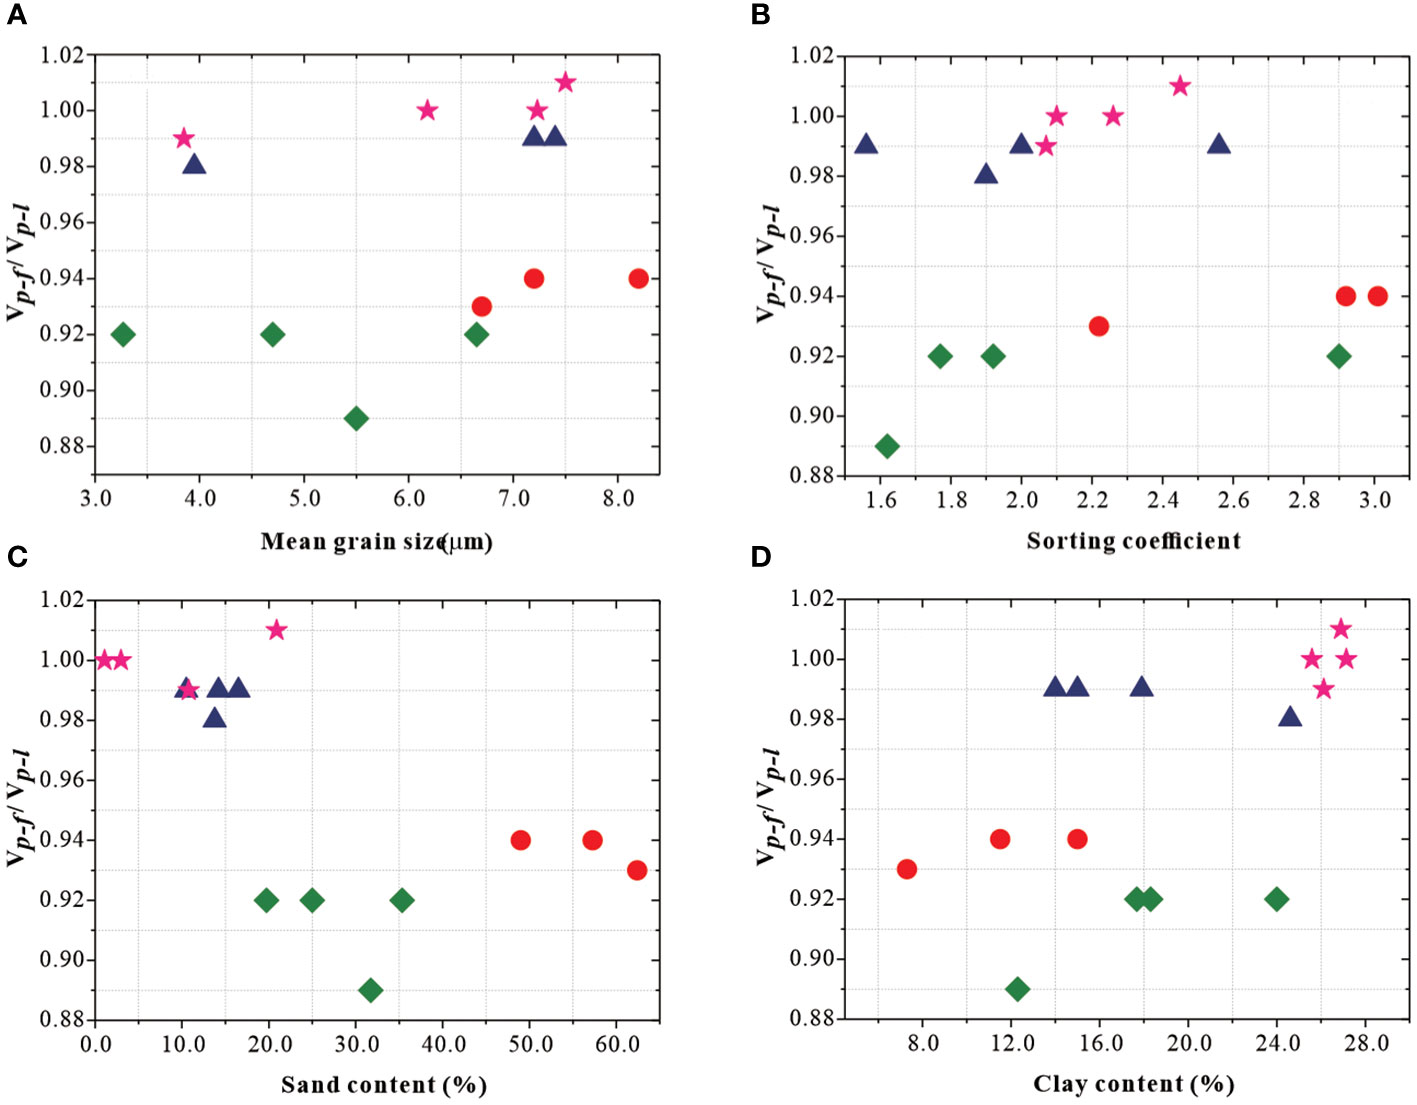
Figure 9 Variation in the on-deck- and laboratory-measured sound velocities () with particle size: (A) mean grain size; (B) sorting coefficient; (C) sand content; (D) clay content in different types of sediments in the study area. Circles denote silty sand; diamonds represent sandy silt; triangles represent silt and stars denote clayey silt.
Based on the microstructural observations, it was found that both the silty sand and sandy silt had large skeletal particles, tendencies for preferred grain orientations and the fine particles were filled and attached to larger particles (Figure 7 upper row and upper middle row). The large and small particles and their combined arrangements can greatly affect the infiltration and drainage of sediments, thus affecting their liquefaction and re-consolidation, and the resultant change in . The clayey silt had an approximately bundled sheet structure (Hamilton and Bachman, 1982), with large particles that were completely surrounded by fine particles, some of which became aggregates owing to complex physicochemical interactions (Figure 7 lower row). For clayey silts with relatively concentrated clay contents, the effects of sand content and particle size on the electric double layer and the microstructure of the aggregates were relatively prominent. Therefore, the variations in the sand content and sorting coefficients had significant effects on the thixotropic properties of the clayey silt, which in turn affected its . As a feature of dynamic liquefaction, re-consolidation and thixotropic resumption, particle size parameters exhibit a coupled effect on the dynamic characteristics of silty sand, making it difficult to determine which particle size factor had a significant impact. This is also an important reason that the of the silt was obviously higher than those of the sandy silt and silty sand.
Based on the discussion and analyses in sections 5.2 and 5.3, it has now been shown that the dynamic liquefaction and re-consolidation and the dynamic thixotropy resumption processes of sediment samples are the important external factors that lead to the differences between the on-site and laboratory sound velocity measurements of sediments in the Huanghai and Bohai seas. External environmental conditions often affect the acoustic properties of sediments by changing the sedimentary characteristics of their properties, which acts as a trigger mechanism, as the physical properties of sediments are important internal factors that determine their acoustic properties (B.H. Liu et al., 2013). Numerous studies have shown that there are relatively clear mathematical relationships among bulk density, water content, porosity and other physical properties of sediments and their sound velocities (Hamilton and Bachman, 1982; Bachman, 1985; Orsi and Dunn, 1990; Kim et al., 2001; B.H. Liu et al., 2013). At present, the consistent research results obtained have shown that the larger the bulk density, the lower the water content, the smaller the porosity and the higher the sound velocity of the sediment.
In this study, the physical properties of sediment samples from on-site were not measured. However, comparative analyses of the on-deck- and laboratory-measured physical properties of a large number of sediments collected by Li et al. (2013) in the southern Huanghai Sea showed that the wet bulk density of sediments measured in the laboratory is generally higher than that of sediments measured on the deck, and the laboratory measurements of water content are generally lower than those obtained on site. The results presented here are closely related to the dynamic liquefaction and re-consolidation of the samples of silty sand, sandy silt and silt during transport. After the sediment sample was liquefied for a period of time, the pore water was drained and re-consolidation (i.e., compaction) occurred, which led to the aforementioned changes in physical properties. From Figure 10, it can be seen that there are still some measurement data that show that the laboratory measurements were not much different from the on-site index. These data are the result of sediment samples exhibiting dynamic thixotropy, such as clayey silt. For sediment samples with thixotropy resumption, little water loss and no significant changes in wet bulk density were observed during the dynamic–static change. Therefore, a comparative analysis of the measured data from the southern Huanghai Sea confirms that liquefaction, re-consolidation and the resumption of thixotropy in sediment samples affect their values based on changes in sediment physical properties.
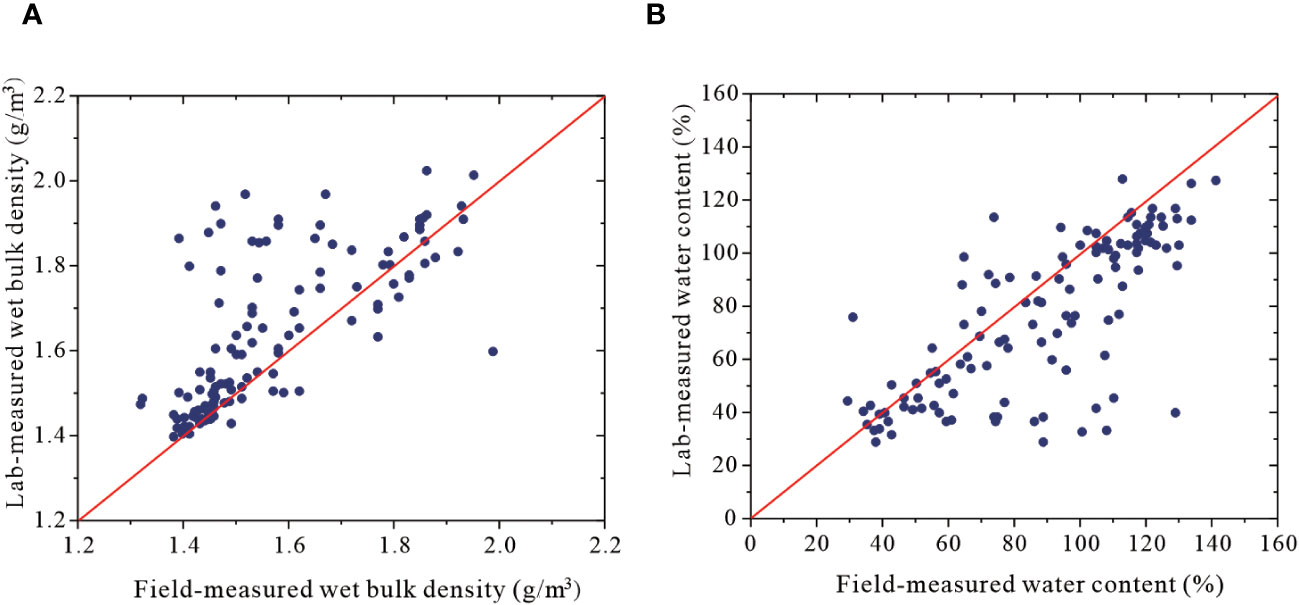
Figure 10 Comparison of the bulk densities (A) and water contents of sediments measured on the deck and in the laboratory (B) (Li et al., 2013).
In order to further analyse the factors that may influence the differences in the sound velocities between the those measured in the laboratory and the on-deck for the sediments from the Huanghai and Bohai seas, we statistically analysed the relationship between the physical parameters measured in the laboratory and . Due to the limitations of on-site testing of the physical properties of sediment samples, the description of the relationship between the sound velocities and the physical properties of sediment samples in this sedimentary acoustic study, a laboratory measurement index was adopted (Hamilton, 1972; Lu and Liu, 2008; Meng et al., 2012; B.H. Liu et al., 2013), Therefore, in this study, the physical properties of sediment samples were not tested on-site, and only the effects of physical parameters measured in the laboratory on were analysed. (Figure 11).
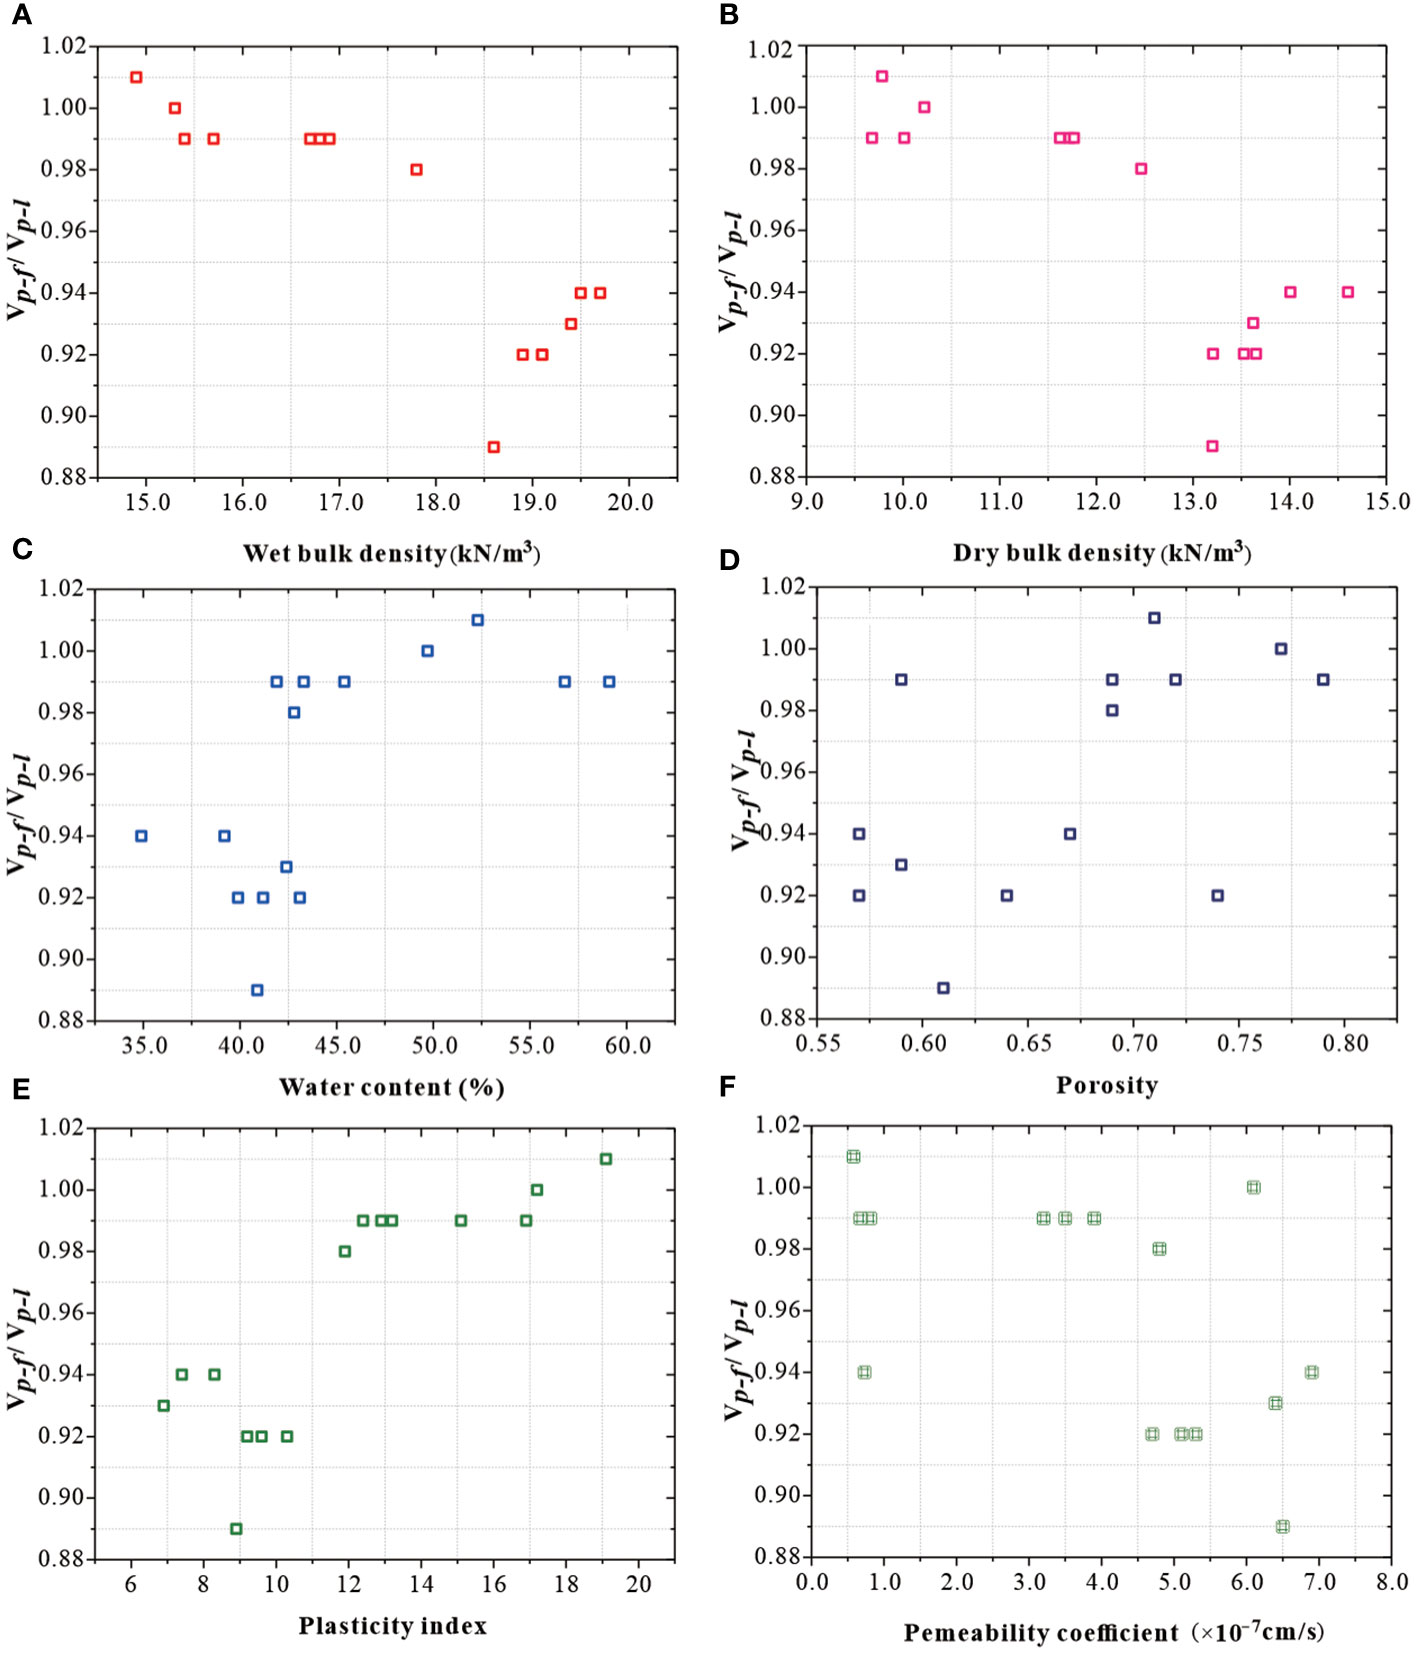
Figure 11 Variation of with the physical parameters of different types of sediment in the study area: (A) wet bulk density; (B) dry bulk density; (C) water content; (D) porosity; (E) plasticity index; (F) permeability coefficient.
Because different types of sediments differ substantially in their physical properties, and different types of sediments were represented by fewer samples, the impacts of the physical properties of different types of sediment on were not separately analysed. From a broad perspective, the impacts of the lab-measured bulk density (wet and dry bulk density), water content and plasticity index on was more pronounced than those of laboratory-measured porosity and permeability (Figure 11). The decreased with the increase of bulk density when the wet bulk density was lower than 18.0 kN/m3 and the dry bulk density was lower than 13.0 kN/m3. When the wet bulk density was higher than 18.0 kN/m3 and the dry bulk density was higher than 13.0 kN/m3, increased with increasing bulk density (Figures 11A, B). Additionally, when the water content was above 40.0%, showed a significant positive correlation with water content (Figure 11C). When the plasticity index was higher than 9.0, also showed a significant positive correlation with the plasticity index (Figure 11D).
Porosity is one of the most important physical parameters, and also has exhibited the most significant relationship with sound velocity statistics in previous empirical acoustic models used for studying the sound velocities and physical properties of sediments (Pan et al., 2006; Meng et al., 2012; Kan et al., 2014). However, the effect of porosity on is not significant, which shows that the absolute value of the sediment pore size is an important parameter that affects the sound velocity. However, the effect of the absolute value of the sediment pore size on the difference between the velocities measured on-site and those measured in the laboratory is not obvious. In our analyses, it could be seen that compaction and decreases in the porosity of sediments during dynamic liquefaction and re-consolidation were the important factors influencing the of silty sand, sandy silt and silt. It can be inferred that the variation of porosity under dynamic actions is also likely to be an important factor affecting , which needs further study.
Based on a comparative analysis of the physical properties of sediments from the southern Huanghai Sea measured on site (i.e., shipboard) and in the laboratory, it was found that the large bulk density and high water content measured in the laboratory indicated that the values measured on the deck were also generally high. In the process of dynamic liquefaction, re-consolidation and thixotropy, changes in water content and bulk density are also large (Meng et al., 2012). Therefore, the effect of laboratory-measured bulk density and water content on can represent the effect of bulk density and water content on . The plasticity index of sediments is a physical indicator determined by the sediment particle size, and is independent of sediment disturbances. The effect of the plasticity index on can represent sediment type. Comparative analyses showed that the effect of the particle size (Figure 9) and plasticity index (Figure 11) on is consistent, which therefore demonstrates that the two classification methods, Shepard’s ternary diagram of Marine Investigation Regulations (GB/T12763.8-2007) and the plasticity index of sediments in marine geotechnical engineering, are different in approach but equally satisfactory in their results in terms of the influence on in the Huanghai and Bohai seas.
We compared the deviations between the sound velocities of seafloor sediments measured on-site and in the laboratory (), and their mechanisms were analysed by combining the on-site and laboratory measurements obtained from a surveying voyage in the southern Huanghai Sea in 2009 with the on-site and laboratory measurements acquired in 2014 from the northern Huanghai Sea and Bohai Sea. There were different degrees of deviations in the sound velocities of on-site and laboratory measurements in the Huanghai Sea and Bohai Sea sediment samples. The deviations between different sediment types were significant. Among them, the ratio of was in the range of ~0.90–0.92 for sandy silt, ~0.92–0.94 for silty sand, ~0.98–0.99 for silt and ~0.99–1.01 for clayey silt.
Changes in temperature and disturbance during the transport of the samples were the key environmental factors causing deviations to exist in the measured sound velocities. Among them, the dynamic liquefaction, re-consolidation and thixotropic resumption processes that occurred during transport and the standing of samples were the most important dynamical mechanisms of acoustic deviations, all of which were caused by disturbances during sample transport. Sandy silts and silty sands exhibited dynamic liquefaction and re-consolidation, while the clayey silts exhibited thixotropy and resumption and the silts showed dynamic liquefaction, re-consolidation, thixotropy and then resumption. The dynamic formation mechanisms of the deviations between on-deck- and laboratory-measured sound velocities were the changes in the properties of sediments by external actions. Sediment porosity was not an important factor; however, the values of bulk density, water content and the plasticity index had significant impacts on the differences between measured velocities[1].
The raw data supporting the conclusions of this article will be made available by the authors, without undue reservation.
BL: Funding acquisition, Writing – original draft, Writing – review & editing. JZ: Data curation, Writing – original draft, Writing – review & editing. JW: Writing – original draft, Writing – review & editing. XL: Funding acquisition, Investigation, Writing – original draft, Writing – review & editing. LS: Data curation, Writing – review & editing.
The author(s) declare financial support was received for the research, authorship, and/or publication of this article. This work was supported by the National Natural Science Foundation of China (42022052, U2006202, 42176191), the Shandong Provincial Natural Science Foundation (ZR2020YQ29, ZR2022YQ40), and the Basic Scientific Fund for National Public Research Institutes of China (2022S01).
The authors declare that the research was conducted in the absence of any commercial or financial relationships that could be construed as a potential conflict of interest.
All claims expressed in this article are solely those of the authors and do not necessarily represent those of their affiliated organizations, or those of the publisher, the editors and the reviewers. Any product that may be evaluated in this article, or claim that may be made by its manufacturer, is not guaranteed or endorsed by the publisher.
Akal T. (1972). The relationship between the physical properties of underwater sediments that affect bottom reflection. Mar. Geol. 13, 251–260. doi: 10.1016/0025-3227(72)90054-0.
Bachman R. T. (1985). Acoustic and physical property relationships in marine sediments. J. Acoustical Soc. America 78, 616–623. doi: 10.1121/1.392429.
Baldwin K. C., Celikkol B., Silva A. J. (1981). Marine sediment acoustic measurement system. Ocean Eng. 8, 481–488. doi: 10.1016/0029-8018(81)90013-5.
Best A. I., Huggett Q. J., Harris A J. K. (2001). Comparison of in situand laboratory acoustic measurements on Lough Hyne marine sediment. J. Acoustic Soc. America 110, 695–709. doi: 10.1121/1.1382616.
Chadwick W. W., Dziak R. P., Haxel J. H., Embley R. W., Matsumoto H. (2012). Submarine landslide triggered by volcanic eruption recorded by in situhydrophone. Geological Soc. America 40, 51–54. doi: 10.1130/G32495.1
Clearman W. M. (2007). Measurement and correlation of directional permeability and forchheimer’s inertial coefficient of micro porous structures used in pulse tube cryocoolers (Atlanta, Georgia, USA: Georgia Institute of Technology).
Fu S. S., Tao C., Prasad M., Wilkens R. H., Fraser L. N. (2004). Acoustic properties of coral sands, Waikiki, Hawaii. J. Acoustical Soc. America 115, 2013–2020. doi: 10.1121/1.1689340.
Hamilton E. L. (1956). Low sound velocities in high-porosity sediments. J. Acoustical 28, 16–19. doi: 10.1121/1.1908208.
Hamilton E. L. (1965). Sound speed and related physical properties of sediments from Experimental Mohole (Guadalupe Site). Geophysics 30, 257–261. doi: 10.1190/1.1439566.
Hamilton E. L. (1971). Elastic properties of marine sediments. J. Geophysics Res. 76, 6350–6366. doi: 10.1029/JB076i002p00579.
Hamilton E. L. (1972). Compressional wave attenuation in marine sediments. Geophysics 37, 620–646. doi: 10.1190/1.1440287.
Hamilton E. L. (1976). Variations of density and porosity with depth in deep-sea sediments. J. Sedimentol. Petroleum 46, 280–300. doi: 10.1306/212F6F3C-2B24-11D7-8648000102C1865D
Hamilton E. L., Bachman R. T. (1982). Sound velocity and related properties of marine sediments. J. Acoustical Soc. America 72, 1891–1904. doi: 10.1121/1.388539.
Han T. C., Liu B. H., Kan G. M., Meng X. M., Ding Z. J. (2011). Joint elastic-electrical properties of sediments in the Yellow Sea. Sci. China Earth Sci. 3, 1–8. doi: 10.1007/s11430-011-4335-6
Hong G., Wu B. H., Zou D. P. (2011). Experimental study on acoustic characteristics of seafloor sediment on effects of temperature. J. Trop. Oceanogr. 30, 70–73. doi: 10.11978/j.issn.1009-5470.2011.06.070
Hou Z. Y., Guo C. S., Wang J. Q. (2013). Surface sediments acoustic velocity and porosity correlation in Nansha sea area abyssal region. Mar. Sci. 37, 77–82.
Hou Z. Y., Guo C. S., Wang J. Q., Li H. Y., Li T. G. (2014). Tests of new in- situseabed acoustic measurement system in Qingdao. Chin. J. Oceanol. Limnol. 32, 1172–1178. doi: 10.1007/s00343-015-4013-1.
Jia Y. G., Shan H. X., Yang X. J., Meng X. M., Chang F. Q., Zheng J. W. (2011). Sediment dynamics and hazards in Yellow River Delta (Beijing: Science Press).
Kan G. M., Liu B. H., Zhao Y. X. (2011). Self-contained in situsediment acoustic measurement system based on hydraulic-driving penetration. High Technol. Letter 17, 311–316.
Kan G. M., Su Y. F., Liu B. H. (2014). Properties of acoustic impendance of seafloor sediments in the middle area of the Southern Yellow Sea. J. Jilin Univ. (Earth Sci. Edition) 1, 19–26.
Kim D. C., Sung J. Y., Park S. C., Lee G. H., Choi J. H., Kim G. Y., et al. (2001). Physical and acoustic properties of shelf sediments, the South Sea of Korea. Mar. Geol. 179, 39–50. doi: 10.1016/S0025-3227(01)00200-6.
Kraft B. J., Mayer L. A., Simpkin P., Lavoie P., Jabs E., Lynskey, et al. (2002). “Impact of Littoral Environmental Variability of Acoustic Predictions and Sonar Performance,” in Calculation of in situacoustic wave properties in marine sediments, 123–130. (Springer, Dordrecht).
Lei H. Y., Xiao S. F. (2002). Research on soil structure characteristics and its quantitative parameter through pocket penetrometer. J. Tianjin Univ. 35, 718–722.
Li F. F., Cui Q. L., Li M., Zhou Q., Zou G. T. (2008). Acoustic velocity of water under high temperature and high pressure: validity of the equation of state of water. China J. High Pressure Phys. 22, 281–285.
Li G. B., Kan G. M., Meng X. M., Liu B. H., Han G. Z. (2013). Effects of the condition changes on the laboratory acoustic velocity measurements of seafloor sediments. Adv. Mar. Sci. 31, 211–218.
Liang Y. B., Lu B. (1983). Acoustic-physical parameters of seafloor sediments of a low velocity continental shelf area. Trop. Oceanol. 2, 191–201.
Liang Y. B., Lu B. (1991). Marine sediment acoustics, physics, and mechanics. Advance Earth Sci. 6, 42–43.
Liu B. H., Han T. C., Kan G. M., Li G. B. (2013). Correlations between the in situacoustic properties and geotechnical parameters of sediments in the Yellow Sea, China. J. Asian Earth Sci. 77, 83–90. doi: 10.1016/j.jseaes.2013.07.040.
Liu X. L., Jia Y. G., Zheng J. W., Shan H. X. (2017). An experimental investigation of wave-induced sediment responses in a natural silty seabed: New insights into seabed stratification. Sedimentology 64, 508–529. doi: 10.1111/sed.12312.
Liu X. L., Jia Y. G., Zheng J. W., Yang X. J. (2013). Consolidation of sediments discharged from the Yellow River: Implications for sediment erodibility. Ocean Dynamics 63, 371–384. doi: 10.1007/s10236-013-0599-z.
Liu X. L., Lu Y., Yu H. Y., Ma L. K., Li X. Y., Li W. J., et al. (2022). In- situobservation of storm-induced wave-supported fluid mud occurrence in the subaqueous Yellow River delta. J. Geophysical Res.: Oceans 127, e2021JC018190. doi: 10.1029/2021JC018190
Lu B., Huang S. J., Li G. X. (2003). Vertical variations of core sound velocity: evidence of paleooceanographic history since the Pleistocene epoch. Mar. Georesources &. Geotechnol. 21, 63–71. doi: 10.1080/716100485
Lu B., Liang Y. B. (1994). Statistical correlation between physical parameters and sound velocity of marine sediments in the southeast coast of China. Sci. China: Chem. Life Sci. Geol. 24, 110–114.
Lu B., Liu Q. (2008). Grain and pore factors in acoustic response of seafloor sediments. J. Trop. Oceanogr. 27, 23–30.
Mccann C., Sothcott J., Best A. I. (2013). A new laboratory technique for determining the compressional wave properties of marine sediments at sonic frequencies and in situpressures. Geophysical Prospecting 62, 97–116. doi: 10.1111/1365-2478.12079
Meng X. M., Li G. B., Han G. Z., Kan G. M. (2015). Sound velocity and related properties of seafloor sediments in the Bering Sea and Chukchi Sea. Acta Oceanologica Sin. 34, 75–80. doi: 10.1007/s13131-015-0669-9.
Meng X. M., Liu B. H., Kan G. M., Li G. B. (2012). An experimental study on acoustic properties and their influencing factors of marine sediment in the southern Huanghai Sea. Acta Oceanologica Sin. 34, 74–83.
Orsi T. H., Dunn D. A. (1990). Sound velocity and related physical properties of fine-grained abyssal sediments from the Brazil Basin (South Atlantic Ocean). J. Acoustic Soc. America 88, 1536–1542. doi: 10.1121/1.400311.
Pan G. F., Ye Y. C., Lai X. H., Chen X. S., Lv X. F. (2006). Shear wave velocity of seabed sediment from laboratory measurements and its relationship with physical properties of sediment. Acta Oceanologica Sin. 28, 64–69.
Prasad M. (2002). Acoustic measurements in unconsolidated sands at low effective pressure and overpressure detection. Geophysics 67, 405–412. doi: 10.1190/1.1468600.
Richardson M. D., Briggs K. B. (1996). In situand laboratory geoacoustic measurements in soft mud and hard-packed sand sediments: Implications for high-frequency acoustic propagation and scattering. Geo-Marine Lett. 16, 196–203. doi: 10.1007/BF01204509.
Shepard F. P. (1954). Nomenclature based on sand-silt-clay ratios. J. Sedimentary Petrology 24, 151–158. doi: 10.1306/D4269774-2B26-11D7-8648000102C1865D
Tao C. H., Deng X. M., Li H. X., Zhou J. P., Jin X. B., Fu S. S., et al. (2009). Development of in- situmarine sediment geo-acoustic measurement system with real-time and multi frequencies (the Second Generation). China Ocean Eng. 23, 769–778.
Vaughan W. C., Easley D. H., Lavoie D. L. (2002). Averageing pore statistics of two-dimensional images for predicting permeability. J. Hydraulic Eng. 128, 1002–1007. doi: 10.1061/(ASCE)0733-9429(2002)128:11(1002).
Wang J., Li G., Liu B., Kan G. M., Sun Z. W., Meng X. M., et al. (2018). An experimental study of the ballast in situSediment acoustic measurement system in south China sea. Mar. Georesources Geotechnol. 36, 515–521. doi: 10.1080/1064119X.2017.1348413.
Wang Q., Liu C. Y., Wu Y. Z., Zhang L., Li H. S. (2008). Relation between the acoustic characters of sea bottom sediment and the seawater depth. Appl. Acoustics 27, 217–221.
Xu Y., Li P., Li P., Du J., Liu L. J., Gao W., et al. (2017). The difference analysis of physical-mechanical properties of sediments in the central South Yellow Sea and Zhe-Min coastal area in China. Acta Oceanol. Sin. 36, 77–85. doi: 10.1007/s13131-017-1000-8.
Yang J., Tang D., Williams K. L. (2008). Direct measurement of sediment sound speed in Shallow Water’06. J. Acoustical Soc. America 124, EL116–EL121. doi: 10.1121/1.2963038.
Zeng J. Y., Zou D. P., Wu B. H., Zhang W. F. (2009). Acoustic signal processing and spectrum analysis of seafloor sediment under temperature perturbation. J. Trop. Oceanogr. 28, 80–88.
Zhang S. Y. (1997). Geo-acoustics: the important discipline to study seabed environment. Physics 26, 280–285.
Zheng J., Jia Y., Liu X., Shan H. X. (2014). Sediment characteristics as a function of variable hydrodynamics in a tidal flat of the Yellow River Delta, China. J. Offshore Mechanics Arctic Eng. 136, 1–12. doi: 10.1115/1.4025547.
Zheng J. W., Liu B. H., Kan G. M., Liu X. L., Li G. B., Pei Y. L. (2017). Correlation between sediment acoustics and geotechnical properties in Jiaozhou bay. J. Chongqing Jiaotong Univ. (Natural Science) 36, 57–63.
Zheng J., Shan H., Jia Y., Liu X. L., Hou W. (2011). Field tests and observation of wave loading influence on erodibility of silty sediments in Huanghe Estuary, China. J. Coast. Res. 27, 706–717.
Zhou X., Li H., He J., Wang Q., Zhang X. (2008). Design of multi-segment in situsoil sampler testing bulk density. Trans. Chin. Soc. Agric. Eng. 24, 127–130.
Keywords: sound velocity, on-deck measurement, laboratory measurement, seafloor sediment, Huanghai Sea, Bohai Sea
Citation: Liu B, Zheng J, Wang J, Sun L and Liu X (2024) On-deck vs. laboratory analyses of the sound velocity of sediments from the Huanghai and Bohai seas. Front. Mar. Sci. 11:1261164. doi: 10.3389/fmars.2024.1261164
Received: 19 July 2023; Accepted: 02 February 2024;
Published: 26 February 2024.
Edited by:
Preston Wilson, The University of Texas at Austin, United StatesReviewed by:
Megan Ballard, The University of Texas at Austin, United StatesCopyright © 2024 Liu, Zheng, Wang, Sun and Liu. This is an open-access article distributed under the terms of the Creative Commons Attribution License (CC BY). The use, distribution or reproduction in other forums is permitted, provided the original author(s) and the copyright owner(s) are credited and that the original publication in this journal is cited, in accordance with accepted academic practice. No use, distribution or reproduction is permitted which does not comply with these terms.
*Correspondence: Jiewen Zheng, and6aGVuZ0BxbmxtLmFj; Xiaolei Liu, eGlhb2xlaUBvdWMuZWR1LmNu
Disclaimer: All claims expressed in this article are solely those of the authors and do not necessarily represent those of their affiliated organizations, or those of the publisher, the editors and the reviewers. Any product that may be evaluated in this article or claim that may be made by its manufacturer is not guaranteed or endorsed by the publisher.
Research integrity at Frontiers
Learn more about the work of our research integrity team to safeguard the quality of each article we publish.