- 1Ecological Risk Research Department, KIOST (Korea Institute of Ocean Science and Technology), Geoje, Republic of Korea
- 2Strategy and Planning Office, Geosystem Research Corporation, Gunpo, Republic of Korea
- 3Department of Ocean Environmental Sciences, Chungnam National University, Daejeon, Republic of Korea
We integrated data from field observations during April and March with data from a 2-week mesocosm experiment to investigate changes in phytoplankton populations in southern Korean coastal waters (KCWs) following nutrient enrichment during early spring of 2021. The mesocosm experiments used 1000 L cylindrical plastic containers that had natural seawater (control), a low nutrient (LN) treatment, or a high nutrient (HN) treatment. The field observations showed that increased freshwater runoff following spring rainfall led to elevated levels of dissolved inorganic nitrogen and silicate and a significant increase in total phytoplankton abundance. In March, nutrient enrichment from water mixing and terrestrial runoff led to dominance of cryptophyte Cryptomonas spp. In April, higher nutrient levels than March (p< 0.05) resulting from increased terrestrial runoff after rainfall and dominant species were Skeletonema spp., and Cryptomonas spp. In the mesocosm experiment, a succession from E. zodiacus initially to Chaetoceros spp. in the middle stage, and then to Cylindrotheca closterium and Pseudo-nitzschia spp. finally was observed, depending on the species-specific nutrient availability after nutrient addition. In principal component analysis, the negative correlation between C. closterium and nutrient levels supports their nutrient availability, which is an adaptation to low-nutrient conditions. The combined data from the field observations and mesocosm experiments indicated that nutrient supplementation from terrestrial runoff and tidal mixing played a crucial role in determining the dynamics of phytoplankton populations during early spring in the KCWs.
1 Introduction
The seasonal changes in phytoplankton biomass in temperate aquatic waters is typically characterized by phytoplankton blooms during the spring season (Smayda, 1973). These blooms are critical events in pelagic food webs because the carbon fixed by phytoplankton is an energy source for organisms at higher trophic levels (Thomas and Gibson, 1990). Multiple factors trigger the onset of these spring blooms, including increased levels of nutrients in the water column due to winter mixing, a longer day length, and increased photosynthetic photon flux density (Paerl et al., 1990; Satoh et al., 2000; Baek et al., 2009). Notably, resource competition affects phytoplankton abundance during the spring, influenced by alterations in bottom-up processes including nutrients, salinity, and temperature (Carpenter and Chang, 1988; Durbin and Durbin, 1992; Heiskanen and Keck, 1996). Nutrient loading in coastal waters plays a crucial role in shaping the dynamics of phytoplankton blooms, and are an important part of bottom-up control.
Temperate coastal areas are global hotspots for marine productivity, and are characterized by a high biomass of primary producers and high yields from fisheries (Martin and Fitzwater, 1988; Boyd et al., 2007; Sigman and Hain, 2012). These regions play a crucial role in providing micro- and macronutrients that support approximately 40% of the global human population (Cloern, 2001; Galloway et al., 2004). The Korean Peninsula is in a temperate zone, and seasonal monsoons in this area have a pronounced seasonality (Kang et al., 2002). During the fall and winter dry seasons, there are strong winds from the north and northwest with minimal precipitation (Kim et al., 2014). In contrast, the spring and summer seasons are characterized by winds from the south and southeast with heavy rainfall (Baek et al., 2019; Yoon et al., 2022). This seasonal pattern has significant effects on the nutrient dynamics of the coastal waters. For example, rainfall and river discharge introduce inorganic nutrients, such as nitrate, phosphate, and silicate, into the euphotic zone (Chen et al., 1999; Lunven et al., 2005; Zhou et al., 2008; Ryan et al., 2009). These nutrient inputs have major effects on the population dynamics of phytoplankton, the primary producers in these ecosystems (Paerl et al., 1990; Jiang et al., 2019). Thus, many field studies have focused on oceanographic conditions and the biological properties of these ecosystems to better understand the interactions of changes in nutrients with phytoplankton growth.
Mesocosm studies are crucial research tools for ecologists because they bridge the gap between laboratory experiments and field observations (Odum, 1984; Short, 1987). Although many mesocosm experiments have examined phytoplankton dynamics during the summer (Suzuki et al., 1997; Agawin et al., 2000; Duarte et al., 2000; Raveh et al., 2019; Yoon et al., 2023), fewer mesocosm studies have examined spring phytoplankton blooms. Therefore, we performed a large-scale mesocosm experiment to assess the timing of phytoplankton blooms following nutrient loading during early spring and field surveys to investigate spatiotemporal variations of phytoplankton in the southern Korea coastal waters (KCWs). Our hypothesis was that if high nutrient levels persist for a short period of time (several weeks) after nutrient loading, then pelagic diatom blooms may occur due to bottom-up control, and this could regulate the magnitude of early spring phytoplankton blooms and affect nutrient consumption.
2 Materials and methods
2.1 Field sampling and meteorological data
Field sampling was conducted at 13 stations (S1–S13) along the southern KCWs in March and April 2021 (Figure 1A). In situ measurements of water quality parameters, including temperature, salinity, pH, and dissolved oxygen (DO), were performed at the surface water using a device from YSI EXO2 Sonde probes (Yellow Springs, OH, USA). Surface water samples were collected using a bucket at all sampling stations. Subsamples (500 mL) that were used for analysis of inorganic dissolved nutrients and chlorophyll a (Chl. a) were immediately filtered through GF/F filters (diameter: 47 mm, pore size: 0.7 μm; Whatman, UK) in the field. The filtrates were then transferred to acid-cleaned 15-mL conical tubes (SPL Life Sciences, Korea), and HgCl2 (final concentration 0.1%) was added to prevent changes from biological reactions (Kirkwood, 1992). The filters and filtrates were stored at −20°C in the dark prior to laboratory analysis. For analysis of phytoplankton composition, 500 mL of surface water was collected in polyethylene (PE) bottles and immediately fixed with 3% Lugol’s solution. Data on precipitation (Geoje Island) and solar radiation (Namhae) for the study area during 2021 were from the Korea Meteorological Administration (KMA, www.weather.go.kr).
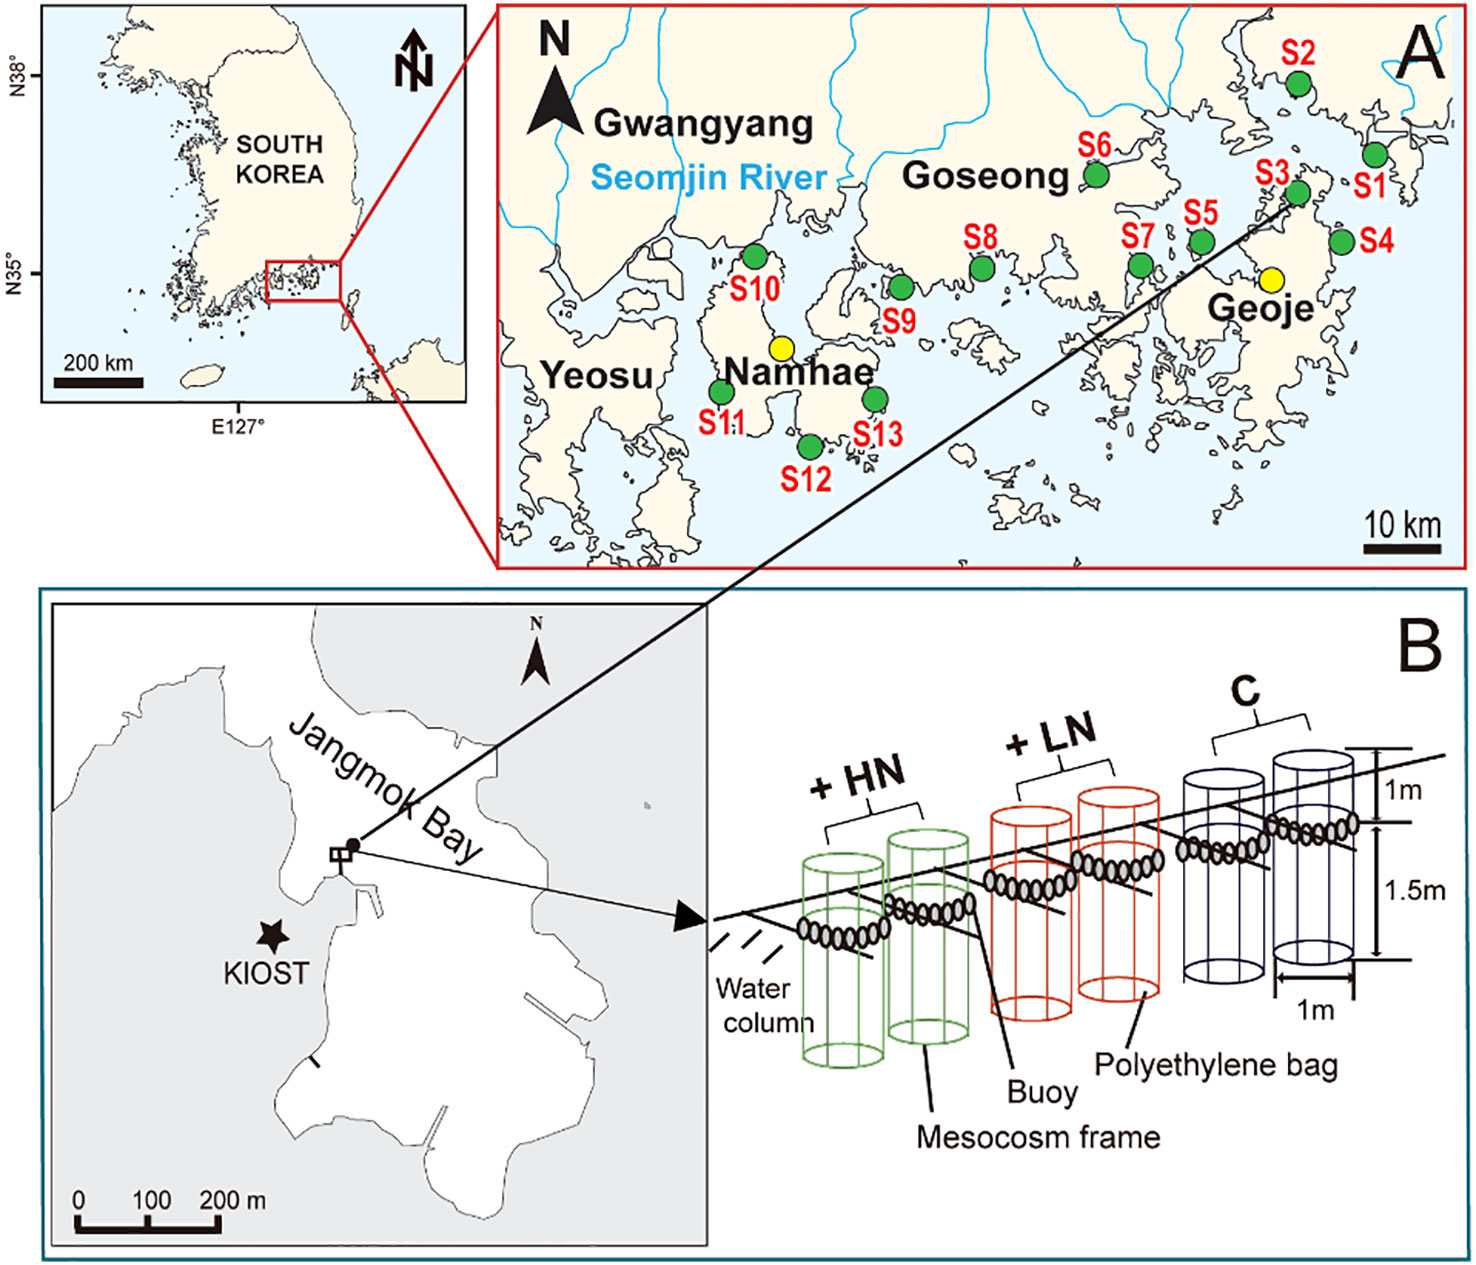
Figure 1 Locations of the 13 field stations (A) and the mesocosm experiments in Jangmok Bay (B). There were two control (C) mesocosms, two low nutrient (LN) mesocosms, and two high nutrient (HN) mesocosms. Yellow circle indicate the locations obtained from the climate data of Namhae (solar irradiance) and Geoje Island (precipitation).
2.2 Design of mesocosm experiments
The mesocosm experiment was from 24 March to 8 April 2021 in the coastal waters of Geoje Island, South Korea (34°59′37″N, 128°40′27″E). Each mesocosm was cylindrical (diameter: 1.0 m, height: 2.5 m), made of transparent PE, and contained 1000 L of natural seawater that was continuously collected from below 2 m using polyvinyl chloride (PVC) and PE hoses and a pumping apparatus (Figure 1B). To prevent accidental entry of surrounding seawater due to wave action, the upper 1 m of each mesocosm extended above the water surface. All mesocosms were securely tied to a steel structure using ropes. The control mesocosms had natural seawater alone, and each treatment group had N:P:Si additions in a molar ratio of 16:1:16, the Redfield ratio (Redfield et al., 1963); the low nutrient (LN) group had 32 μM nitrate, 2 μM phosphate, and 32 μM silicate And the high nutrient (HN) group had 96 μM nitrate, 6 μM phosphate, and 96 μM silicate. Sodium nitrate, sodium metasilicate nonahydrate, and sodium phosphate from JUNSEI (Japan) were the sources of nitrate, silicate, and phosphate. There were six mesocosms, with two mesocosms per group. Due to the large size and handling limitations (non-uniformity within repetitions) of mesocosm experiments, numerous researchers have conducted experiments utilizing gradient conditions rather than three repetitions, and the validity of their results has been demonstrated in many publications (Schä et al., 2001; Sandaa et al., 2009; Zöllner et al., 2009; Baek et al., 2013; Park et al., 2014; Lee et al., 2023). Considering this, the duplicated gradient experiments were performed in this study. The water column within each mesocosm was mixed once a day and before sample collection using a 3.5-m long vertical agitator made of PVC.
2.3 Collection of samples from mesocosms
The physicochemical conditions during the experiment (temperature, salinity, DO, and pH) were measured at the water surface in each mesocosm using a YSI EXO2 Sonde probes (Yellow Springs, OH, USA). Surface water samples were also manually collected using a non-toxic PE beaker after whole water mixing in mesocosm on day 0, 2, 4, 6, 8, 10 and 15. Similar to the field sampling, mesocosm samples were collected for measurement of inorganic nutrients and Chl. a. For identification and enumeration of phytoplankton, water samples were fixed with 3% Lugol’s solution and stored at room temperature until analysis.
2.4 Sample analyses
For laboratory analysis of field and mesocosm samples, the concentration of Chl. a (µg L-1) was determined using a Turner 10-AU Field Fluorometer (Turner BioSystems, Sunnyvale, CA, USA). Prior to analysis, the filtered material was extracted with 90% acetone and kept in the dark for 24 h. The concentrations of dissolved inorganic nutrients (ammonium, nitrate + nitrite, phosphate, and silicate) were measured using a flow injection auto-analyzer (Quattro 39; Seal Analytical, Fareham, Hampshire, United Kingdom), as described by Parsons et al. (1984), which was calibrated using Reference Materials for Nutrients in Seawater (RMNS; KANSO Technos Co., Ltd., Japan). To count and identify phytoplankton, each Lugol’s-fixed sample (500 mL) was concentrated to approximately 50 mL by decanting the supernatant and storage at room temperature. These sub-samples were allowed to settle for 10 min and then a sample of 100 to 400 µL was transferred into a Sedgewick-Rafter Chamber. Identification and counting of phytoplankton cells were performed using light microscopy (200 or 400×). Morphologically distinct species were identified to the species and genus levels (Wetzel and Likens, 2000; Tomas, 1997).
2.5 Calculations of biovolume, growth rate and statistical analyses
In addition to cell density, the biovolume of marine phytoplankton cells is important to the study of phytoplankton ecology (Sun and Liu, 2003). The dominant species (Chaetoceros spp., Cylindrotheca closterium, Eucampia zodiacus, Pseudo-nitzschia spp., and Cryptomonas spp.) cell density data in this study were converted to biovolume (μm3 L-1) using cell dimensions applied to Olenina (2006) as cell density × cell volume of each species. The specific growth rate of dominant diatom in mesocosm experiment was calculated as Equation 1:
where Xt is the cell concentration at time t, X0 is the initial cell concentration, and △t is the incubation time in days (Wood et al., 2005). The t-test was used to determine the significance of differences in abiotic and biotic factors between field stations during March and April, and a p-value below 0.05 was considered significant. Statistical analyses were performed using SPSS version 17.0 (SPSS Inc., Chicago, IL, USA).
For analysis of phytoplankton communities (group averages) in the field, non-metric multidimensional-scaling (MDS) ordination using the Bray-Curtis similarity index was performed to analyze species composition data with PRIMER 5 software. The relationships of phytoplankton groups with environmental factors in the southern KCWs and selection of variables that best described the distribution of groups were analyzed using redundancy analysis (RDA), a linear method of direct ordination (Ter Braak, 1994; Ter Braak and Smilauer, 1998). Specifically, RDA was used to determine the correlation of planktonic algae at the genus level with environmental factors in all mesocosms using CANOCO for Windows version 4.5, with log-transformation of phytoplankton numbers and environmental variables prior to analysis.
To assess the associations of dominant phytoplankton species with environmental factors in the mesocosms and to identify variables that had the strongest effect, principal component analysis (PCA), a linear method of direct ordination (Wold et al., 1987), was performed using R version 4.2.1.
3 Results
The changes in precipitation and solar radiation throughout 2021 followed the seasonal pattern that is typical of temperate areas, with the highest levels of rain from June to September and the highest levels of solar radiation from April to August (Figure 2A). Thus, the 2-week mesocosm experiment was conducted prior to the periods of maximal rainfall and solar radiation. The cumulative precipitation for the 7-days prior to the field sampling was 38.8 mm in March and 79.6 mm in April (Figure 2B). During the mesocosm experiment, rainfall occurred on days 3, 4, 10, and 11, with the most precipitation (64.4 mm) on day 10 (April 3). Solar radiation ranged from 1.02 to 6.84 kWh m-2, and the average was 1.23 ± 0.15 kWh m-2. The levels of solar radiation were lowest on days that had rainfall, except for day 4 and day 11 in the experimental period.
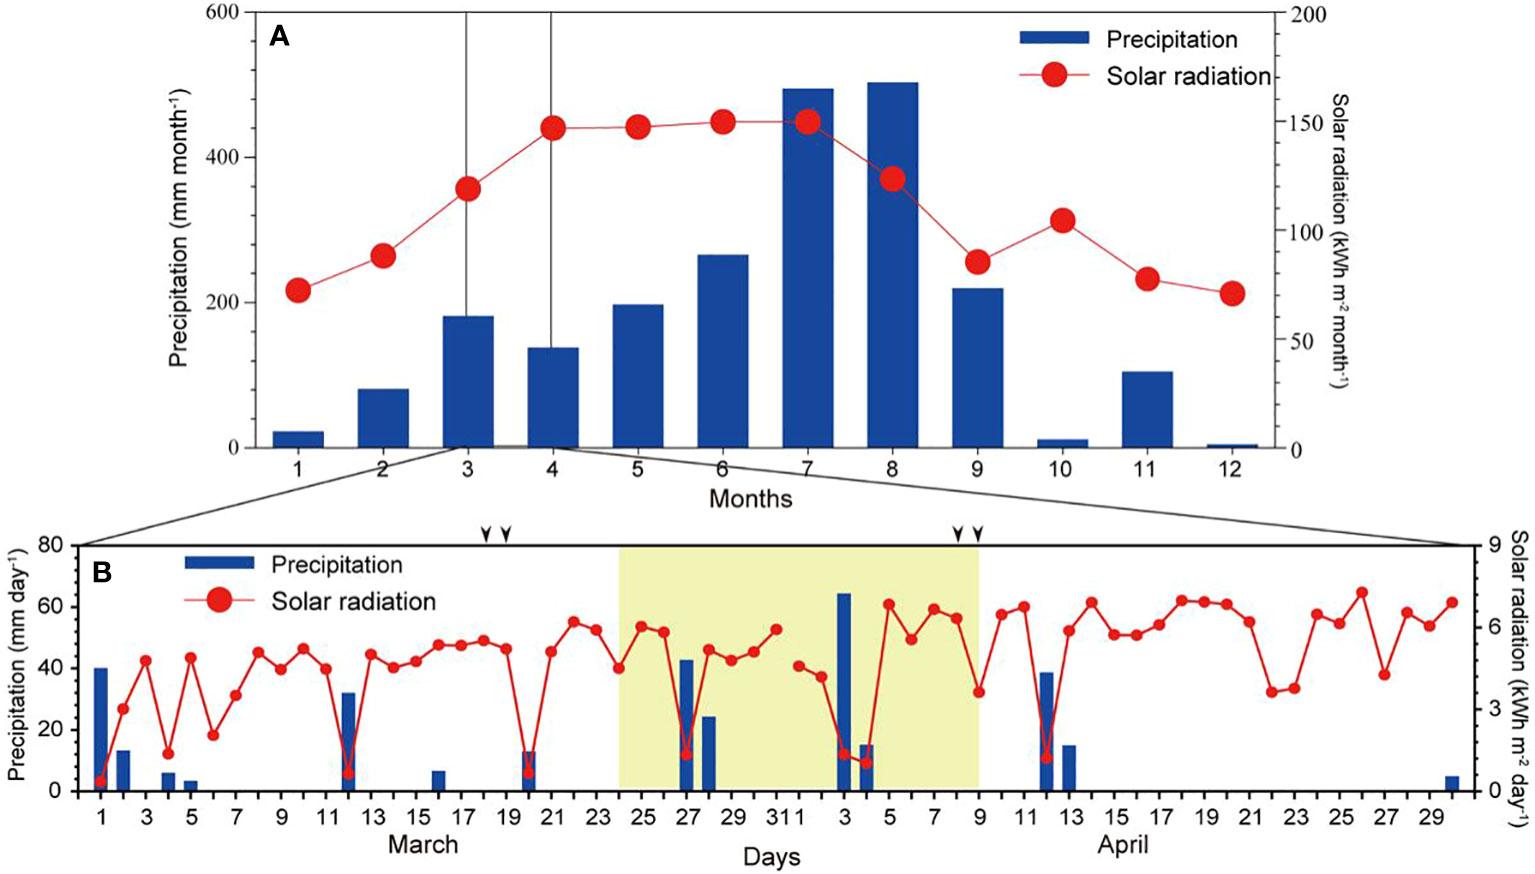
Figure 2 Monthly precipitation in Geoje Island (bars) and solar radiation in Namhae (circles) at the South Sea of the Korean Peninsula from January to December 2021 (A). Daily precipitation and solar radiation during March and April 2021 (B). Arrows: dates of field sampling; yellow area: period of the mesocosm experiment.
3.1 Abiotic factors: field studies
Our analysis of data collected at 13 field stations demonstrated that the surface water temperature ranged from 10.04 to 12.25°C in March and from 13.16 to 17.04°C in April (Figure 3A). During both months, the surface salinity remained above 32 (Figure 3B) and the DO concentration ranged from 7.83 to 11.61 mg L-1 (Figure 3C). The pH varied from 7.86 to 8.48 (Figure 3D). Among these environmental factors in March and April, only DO concentration had a significant difference (p< 0.05; Figures 3E−H).
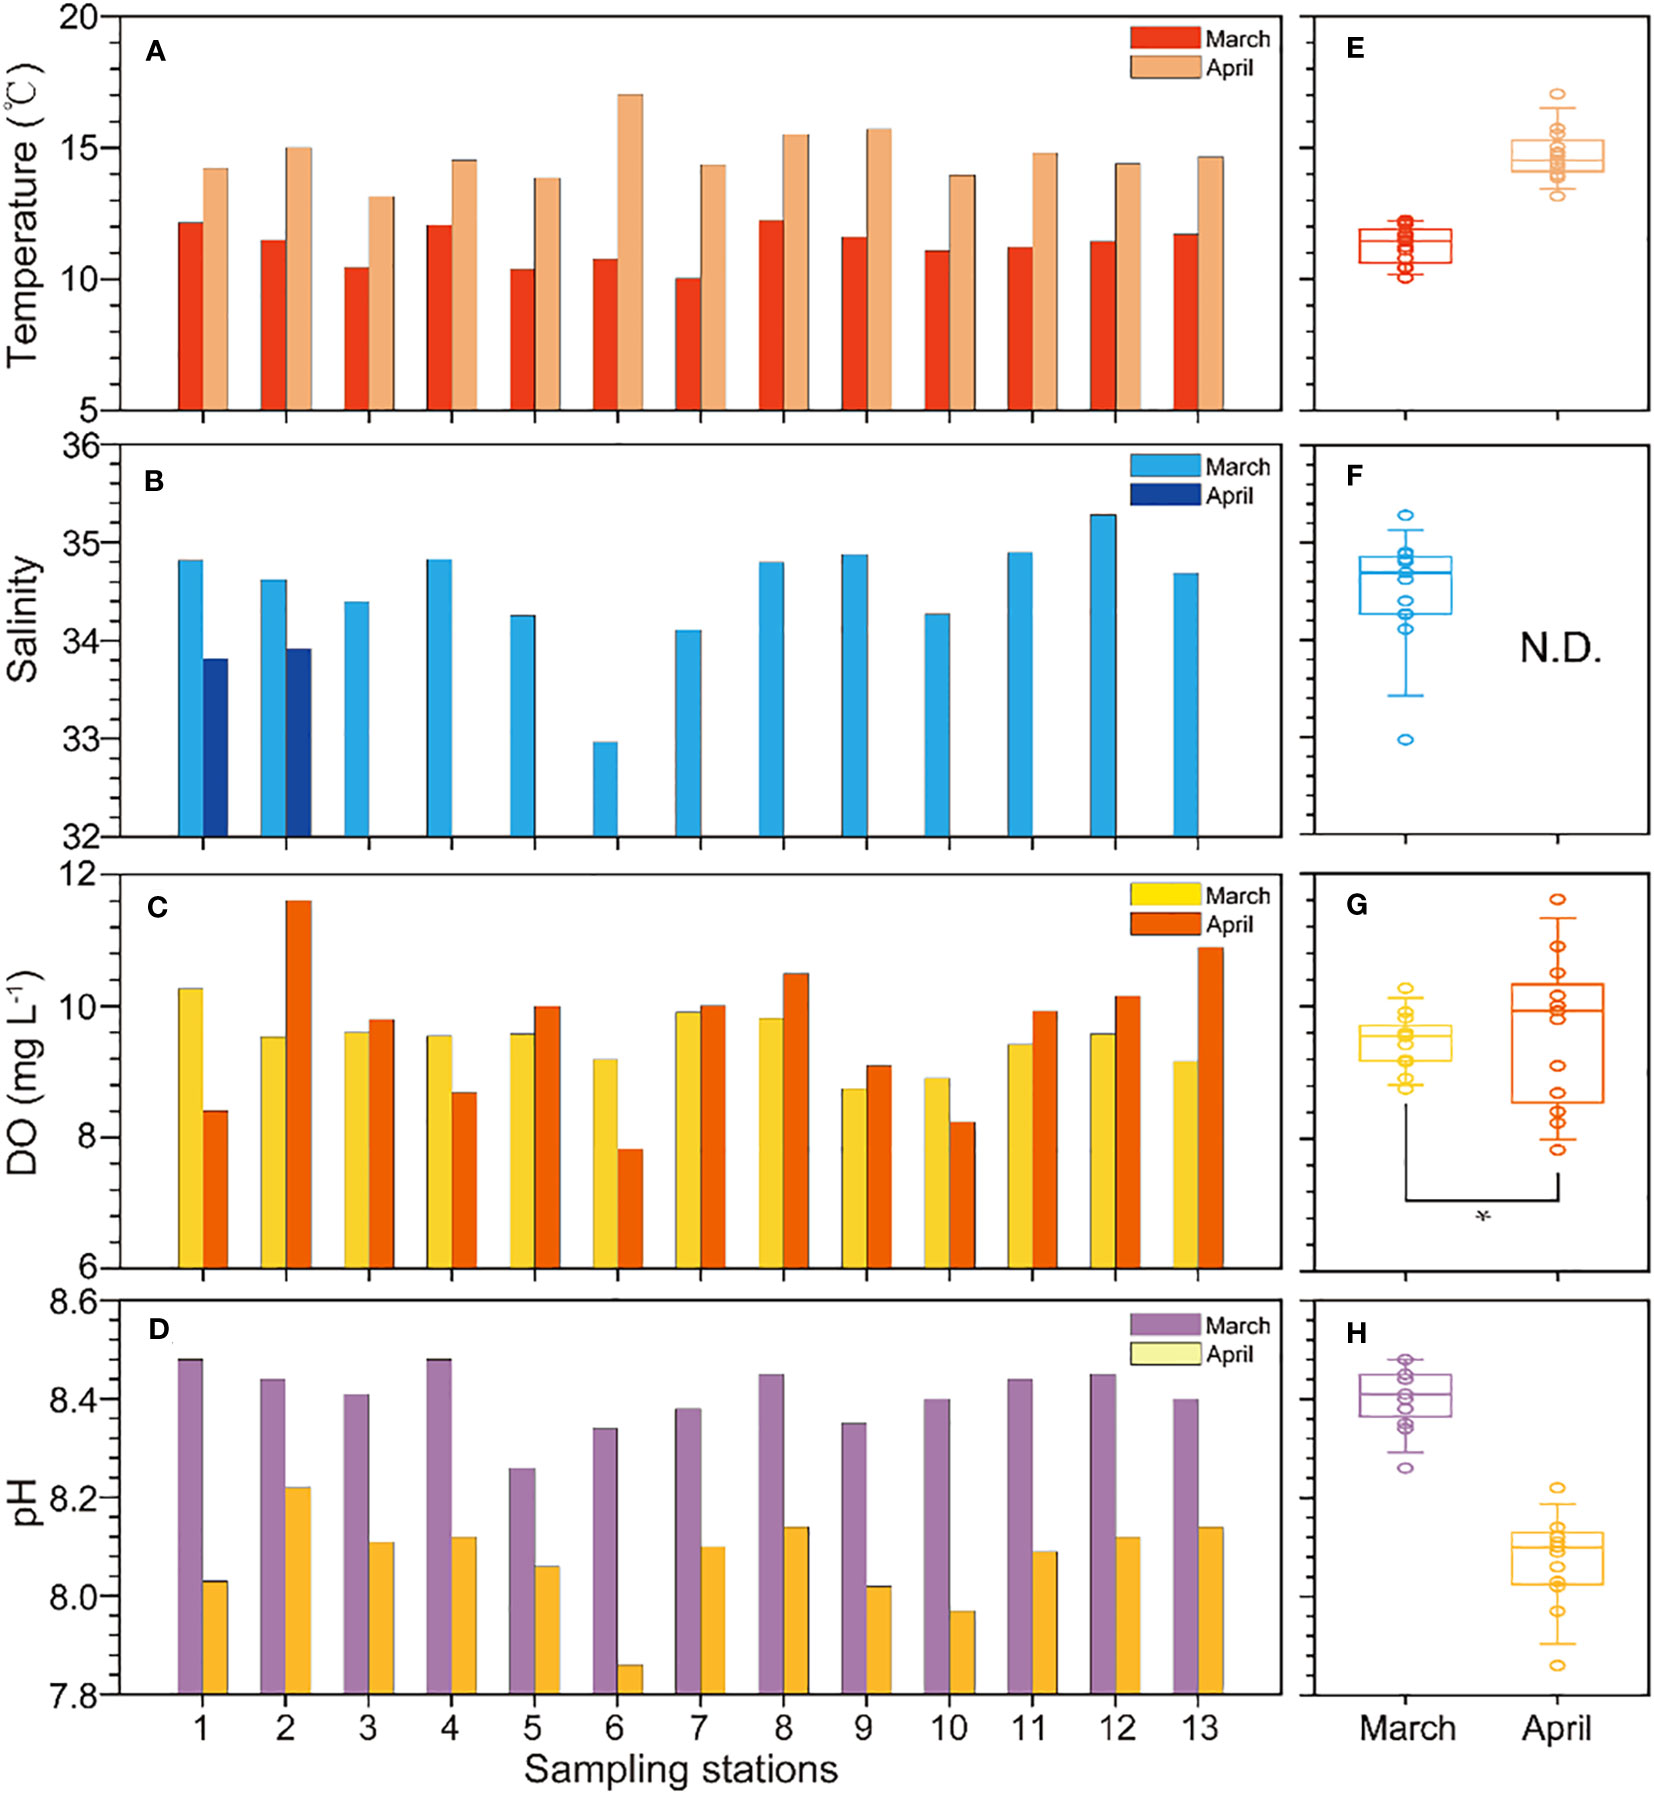
Figure 3 Environmental factors at the 13 field stations during March and April. Temperature (A), salinity (B), dissolved oxygen (DO) (C) and pH (D), and the boxplots (E-H) are for comparison between March and April. Asterisk: significant difference (P< 0.05).
There were significant spatial variations in dissolved inorganic nutrients during March and April (Figure 4). The nitrate+nitrite concentration varied from 1.62 to 10.98 μM in March and from 1.58 to 56.01 μM in April, and the highest concentration was at S6. The ammonium concentration ranged from 0.81 to 6.14 μM in March and from 0.55 to 6.42 μM in April, and the highest concentration was also at S6. The phosphate concentration had minimal fluctuations, and only ranged from 0.37 to 0.58 μM during both months. The silicate concentration remained relatively high, and ranged from 1.91 to 14.25 μM in March and from 3.74 to 44.23 μM in April. The concentrations of nitrate+nitrite and silicate were significantly higher in April compared to March (p< 0.05; Figures 4E−H).
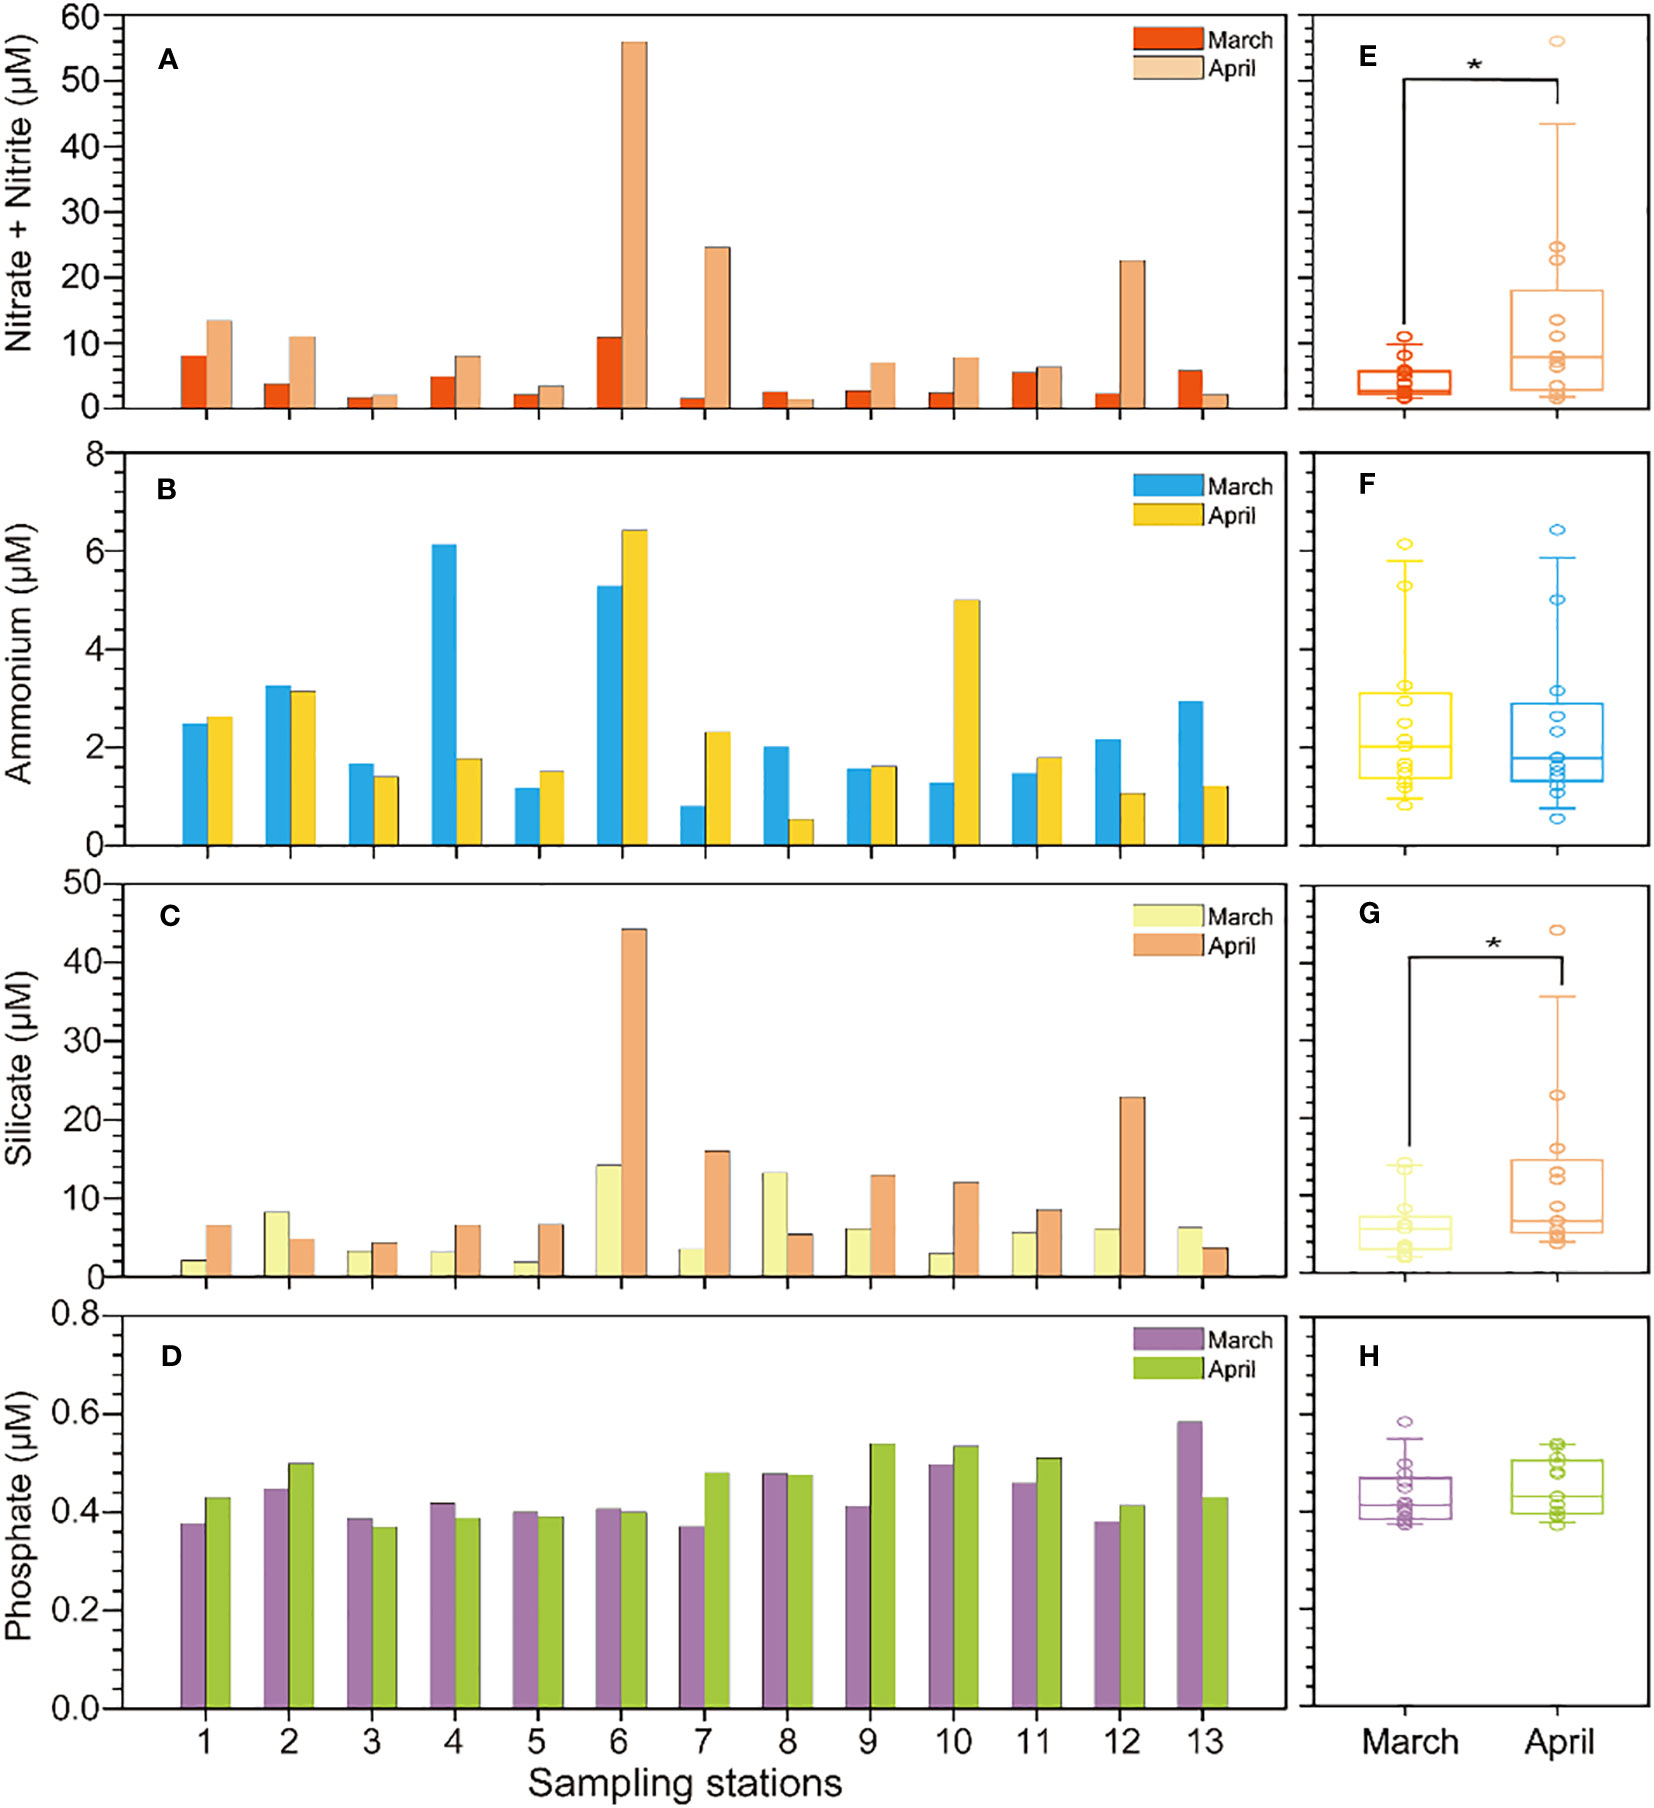
Figure 4 Levels of nitrate+nitrite (A), phosphate (B), ammonium (C), and silicate (D) at the 13 field stations during March and April, and the boxplots (E-H) are for comparison between March and April. Asterisk: significant difference (P< 0.05).
3.2 Biomass (abundance and Chl. a) and composition of phytoplankton: field studies
In March, the concentration of Chl. a ranged from 0.26 to 3.23 μg L-1 (average: 0.89 ± 0.89 μg L-1) and the average total phytoplankton abundance was 1.25 × 10⁵ ± 1.11 cells L-1, with the highest levels of both parameters at S1 and S13 (Figure 5A). In April, the average Chl. a concentration was 1.20 ± 0.41 μg L-1, the total phytoplankton abundance was 1.12 to 9.84 × 10⁵ cells L-1, and both of these parameters were higher than during March (Figure 5B).
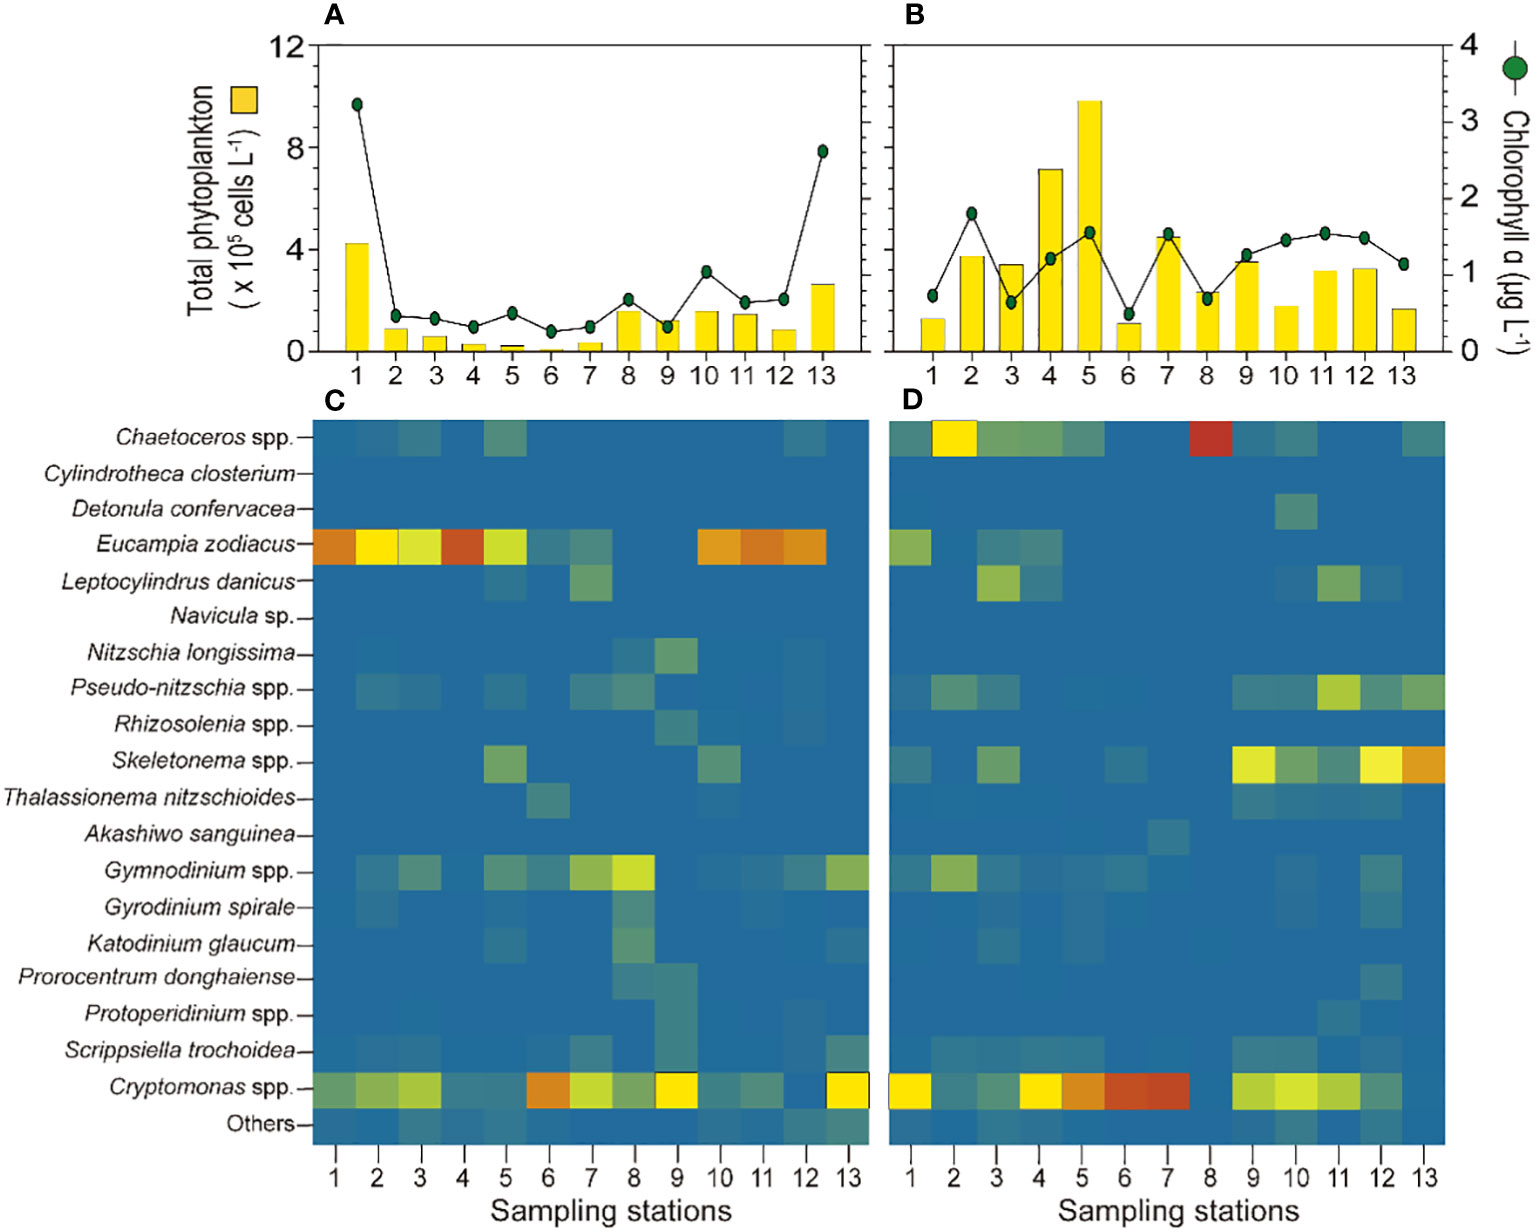
Figure 5 Phytoplankton abundance (bars) and Chl. a concentration (circles) (A: March, B: April), and relative ratio of different phytoplankton (C: March, D: April) at the 13 field stations.
The dominant species at most stations during March were Eucampia zodiacus and Cryptomonas spp. (Figure 5C). In particular, Cryptomonas spp. accounted for nearly 50% of all phytoplankton at S6 and S7, which were near the river. During April, at S6 and S7, Cryptomonas spp. was dominant and accounted for more than 90% of all phytoplankton (Figure 5D); at S9, S12, and S13, Skeletonema spp. was dominant; and at S2, Chaetoceros spp. accounted for approximately 52% of all phytoplankton.
3.3 Abiotic factors: mesocosm studies
The changes in water temperature and salinity were similar in the three different mesocosm groups (Figures 6A, B). In particular, the water temperature increased in all three groups throughout the experimental period, and ranged from 11.81 ± 0.01°C to 14.11 ± 0.05°C. The salinity slightly decreased to 31.78 ± 0.01 from 32.84 ± 0.04, and was lowest following rainfall on day 10. The DO concentration was lowest at the start of the experiment (9.13 ± 0.04 mg L-1) and increased in all three groups until day 3 (Figure 6C); after day 3, the DO level decreased in the control mesocosm; on day 8, the DO concentration was 13.26 ± 0.23 mg L-1 in the LN group and 18.92 ± 0.54 mg L-1 in the HN group. The DO and Chl. a dynamics were similar in the HN group (R2 = 0.80, p< 0.01), and each had a maximum on day 8. The pH ranged from 8.75 ± 0.01 to 9.11 ± 0.02, and the highest value (9.11) was on day 8 (Figure 6D), at which time there was a significant depletion of nutrients in the HN group.
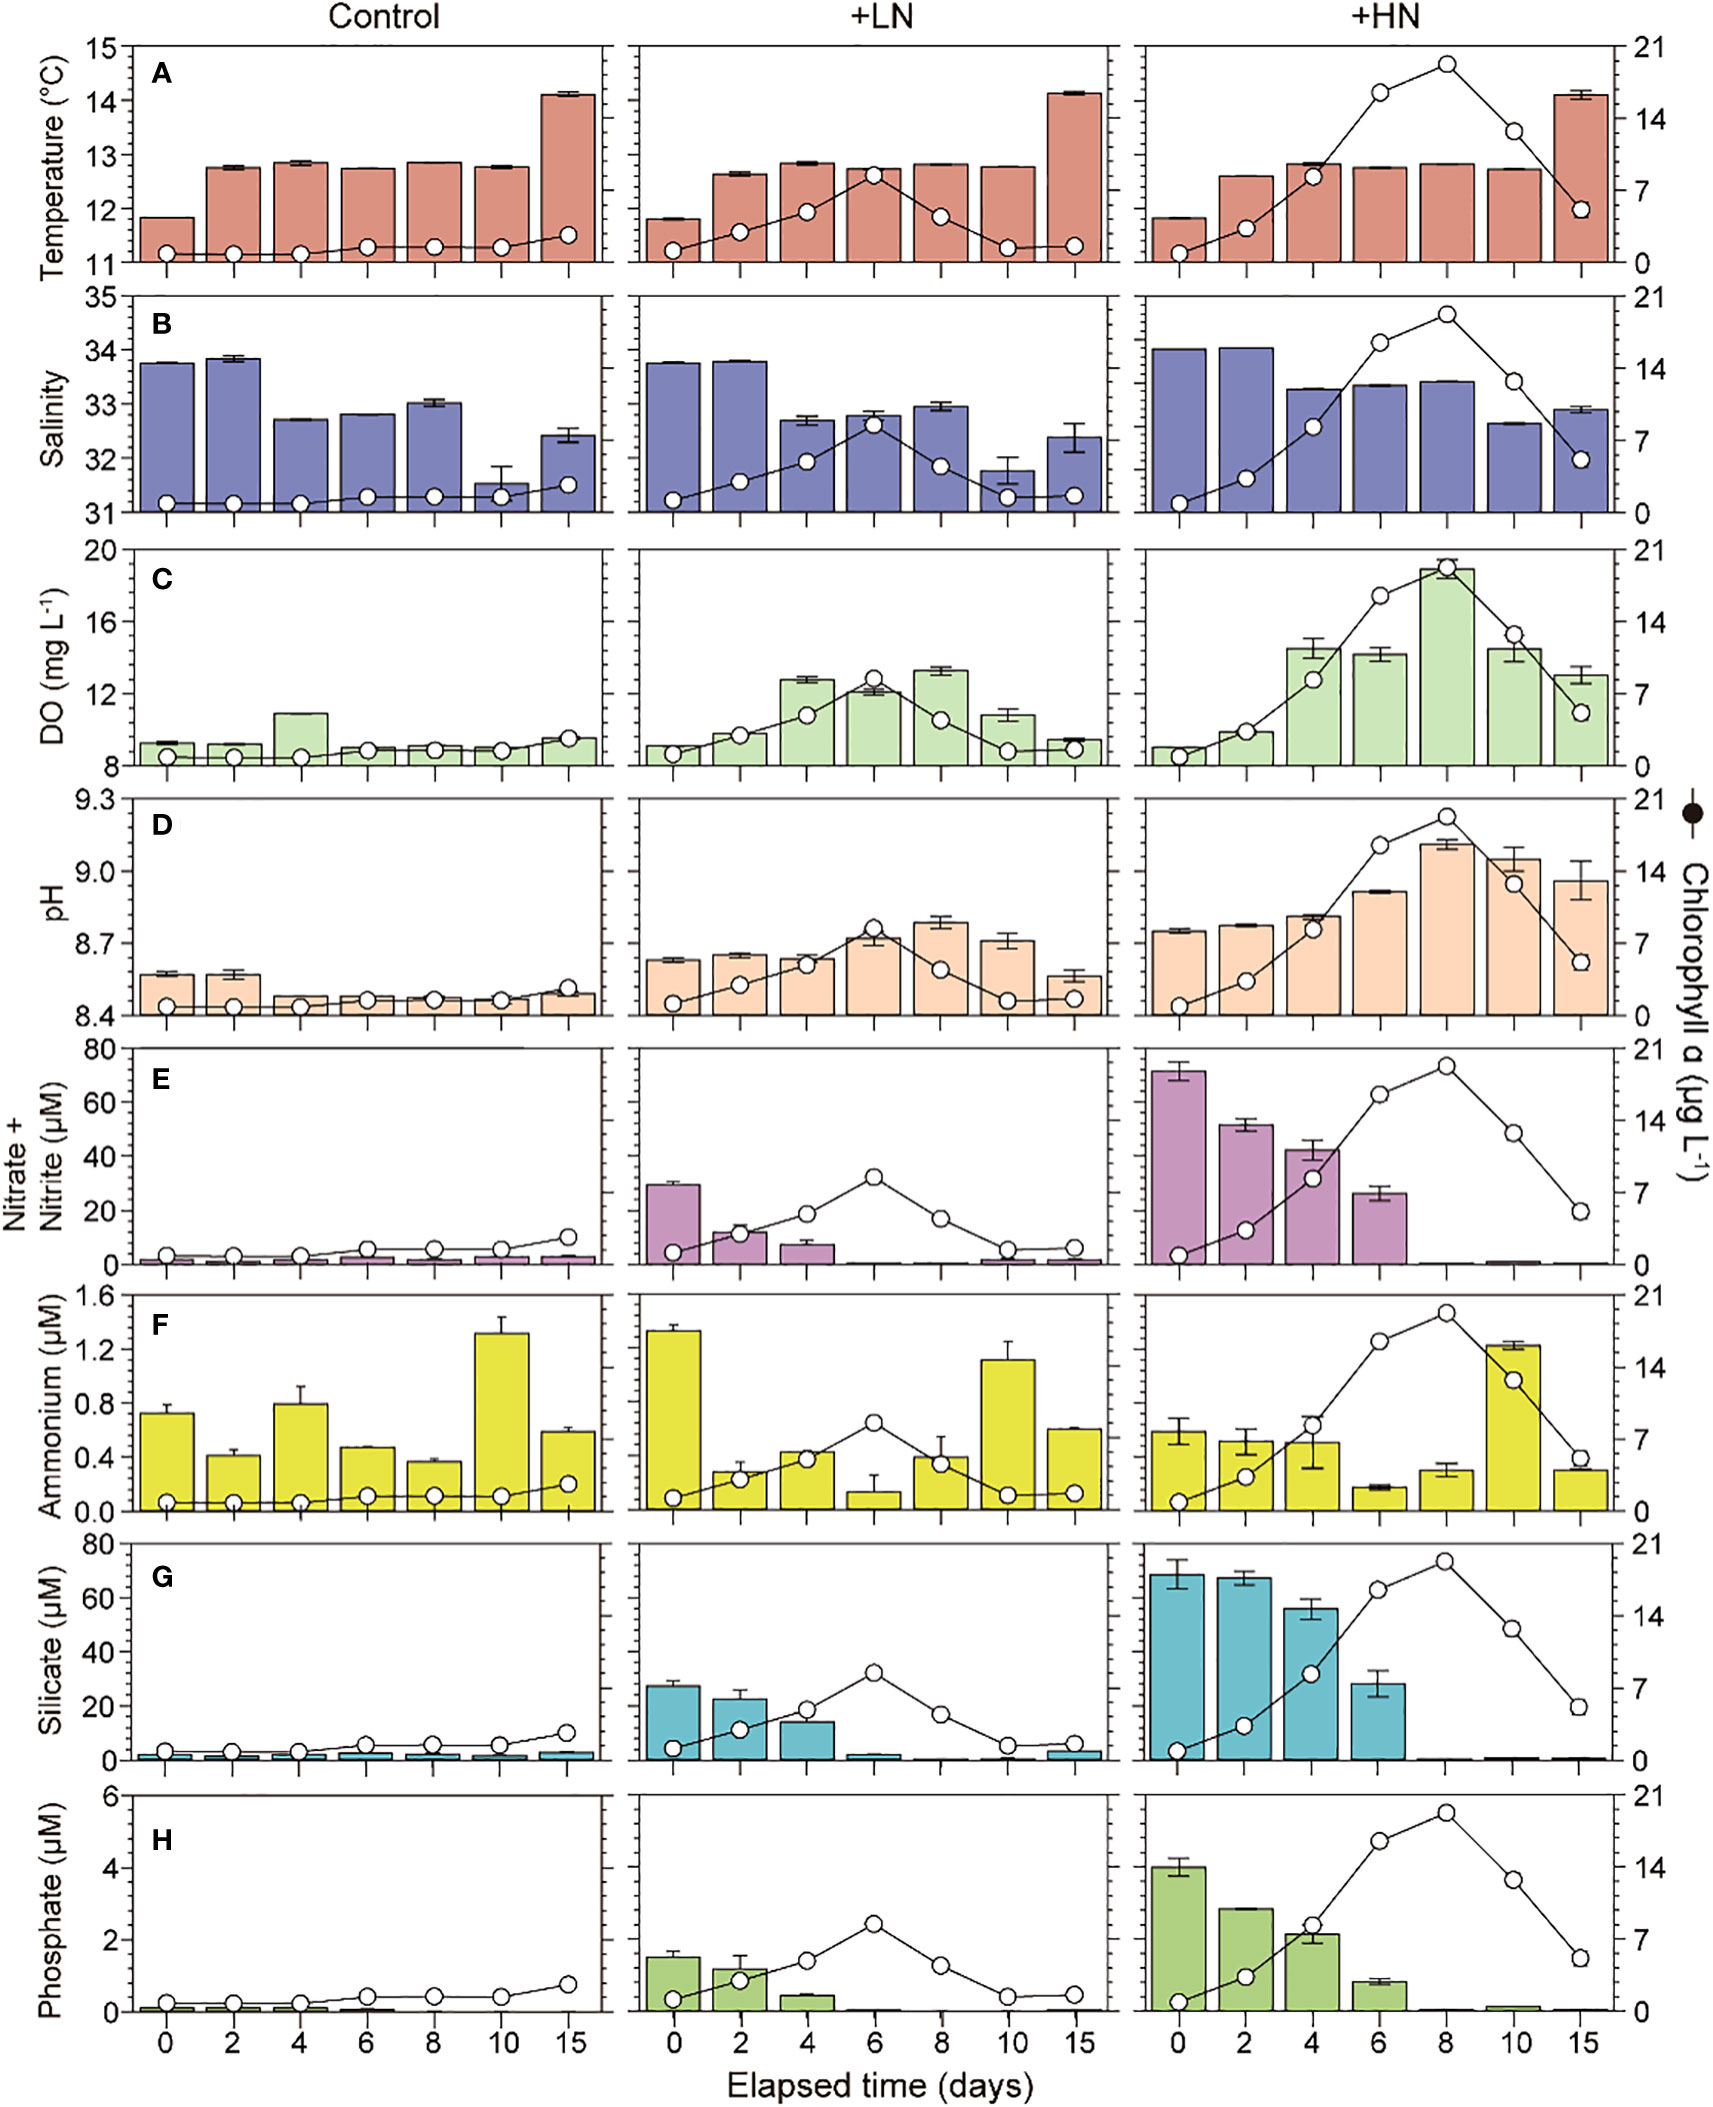
Figure 6 Temporal changes in temperature (A), salinity (B), dissolved oxygen (DO) (C), pH (D), nitrate+nitrite (E), ammonium (F), silicate (G), phosphate (H), and Chl. a (line with circles) in the control, LN, and HN mesocosms during the experimental period.
In general, the nutrient concentrations gradually decreased over the 2-week experiment, and were mostly depleted by day 8 (Figures 6E−H). In the control group, the nitrate+nitrite concentration was 1.91 ± 0.08 μM initially, 2.94 ± 0.48 μM at the midpoint, and 1.04 ± 0.24 μM at the end (Figure 6E). The ammonium concentration remained relatively low in all three groups, and ranged from 0.13 to 1.33 μM (Figure 6F). In the control group, the silicate level varied from 1.58 to 2.91 μM (Figure 6G); in the LN group, the silicate level was 27.27 ± 2.01 μM initially, 0.50 ± 0.01 μM on day 8, and 3.40 ± 1.01 µM on day 15; in the HN group, the initially high silicate level decreased to 0.61 ± 0.03 μM on day 8 and remained low until day 15. In the control group, the phosphate concentration varied from 0.01 ± 0.01 to 0.12 ± 0.01 μM (Figure 6H); in the LN and HN groups, the phosphate level declined to undetectable levels on day 8.
3.4 Biotic factors: mesocosm studies
3.4.1 Biomass (abundance and Chl. a) and composition of phytoplankton
The abundance of phytoplankton was higher in the order HN, LN, and control group, with diatoms dominating overall in all experimental groups (Figure 7). In the control group, the abundance of phytoplankton decreased from 2.1 × 10⁵ cells L-1 at the beginning of the experiment to 0.4 × 10⁵ cells L-1 at the end (Figure 7A); the concentration of Chl. a in the control group was 0.84 μg L-1 at the beginning of the experiment and increased continuously to 2.63 μg L-1. In the LN group, the abundance of phytoplankton ranged from 1.4 to 22.48 × 10⁵ cells L-1. The abundance of phytoplankton in this group peaked on day 6 and then gradually declined. The concentration of Chl. a was 1.13 μg L-1 initially, 8.44 μg L-1 on day 6, and 1.59 μg L-1 at the end, in parallel with the changes in total phytoplankton abundance. In the HN group, the abundance of phytoplankton reached a maximum of 66.65 × 10⁵ cells L-1 on day 8 and gradually decreased to 19.03 × 10⁵ cells L-1 at the end. The concentration of Chl. a varied from 0.88 to 19.24 μg L-1, in parallel with the change in phytoplankton abundance.
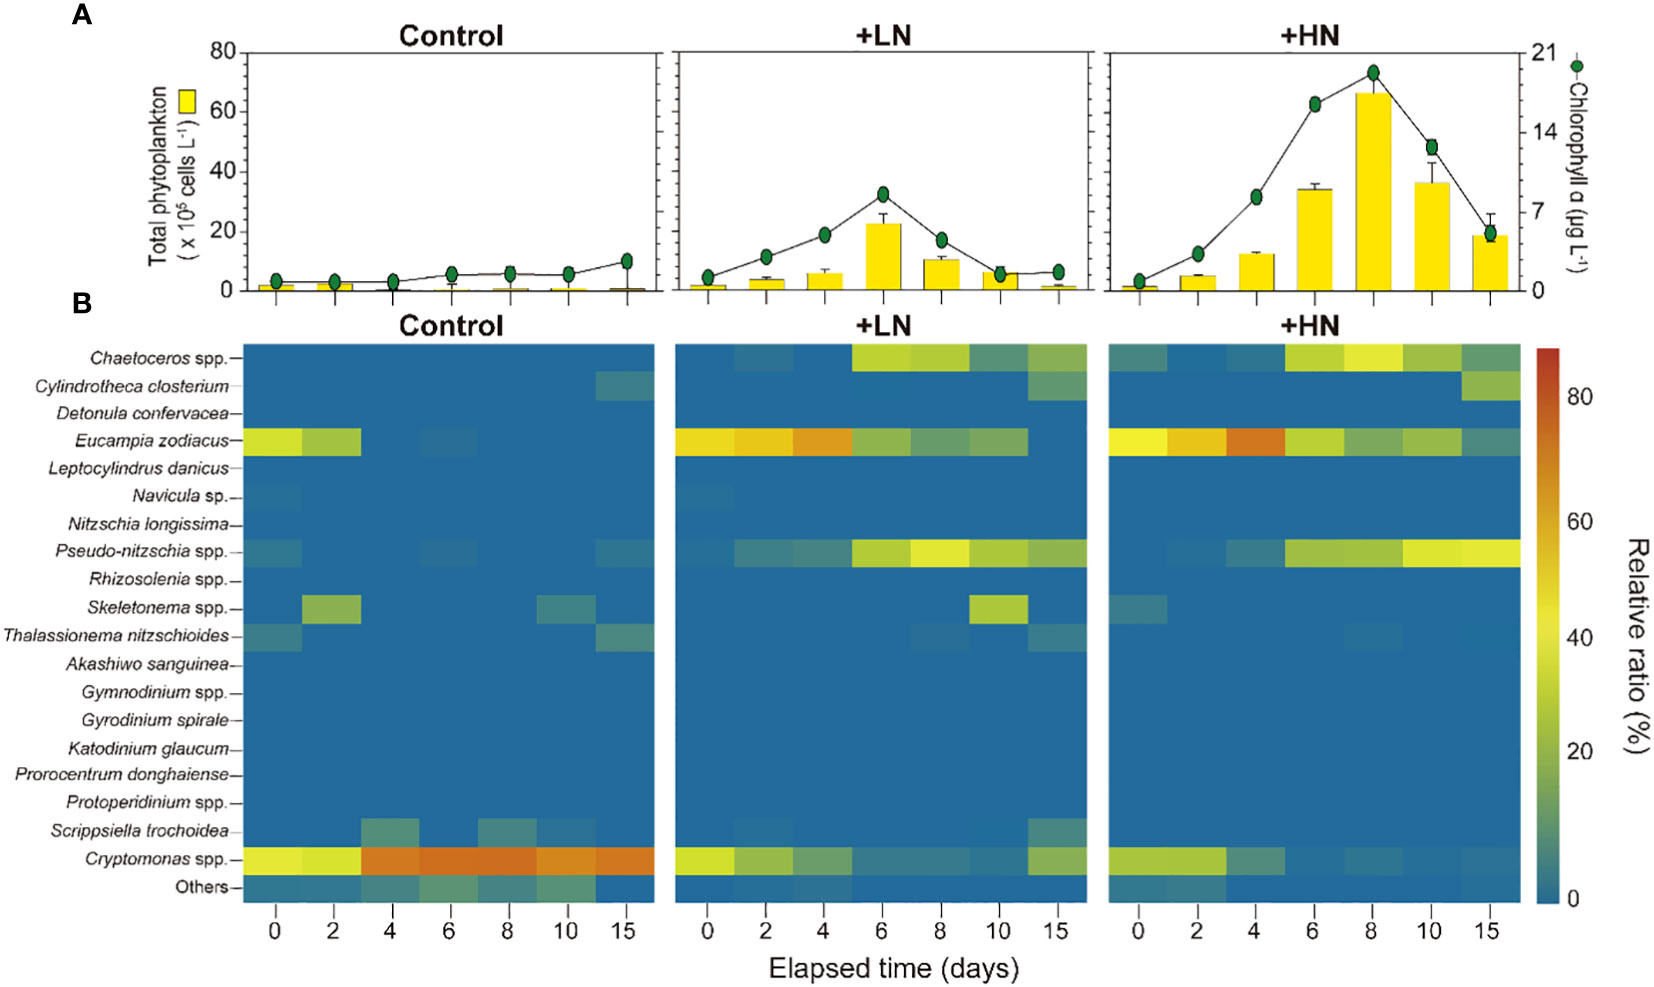
Figure 7 Phytoplankton abundance (bars), Chl. a concentration (line with circles) (A), and relative ratio of different phytoplankton in the control, LN, and HN groups (B) during the mesocosm experiment.
In the control group, initially, Cryptomonas spp. and E. zodiacus accounted for approximately 40% of all phytoplankton, but the percentage of Cryptomonas spp. increased over time, and it was more than 80% at the end of the experiment (Figure 7B). Pseudo-nitzschia spp. and C. closterium accounted for approximately 5% of phytoplankton at the end. In the LN group, diatoms were predominant throughout the experimental period; E. zodiacus was initially dominant and accounted for approximately 56.9% of all phytoplankton at the beginning. The proportion of E. zodiacus gradually increased to 72% by day 4, and decreased after day 4; Pseudo-nitzschia spp. and Chaetoceros spp. accounted for approximately 35% of all phytoplankton on days 6 and 8, and this shift in the phytoplankton community paralleled changes in nutrient concentrations. At the end of the experiment, C. closterium accounted for approximately 14.2% of the total. Diatoms were also dominant in the HN group, and E. zodiacus was the main species (50.7%) at the beginning in the HN and LN groups. Over the time, the proportions of Pseudo-nitzschia spp. and Chaetoceros spp. gradually increased. Pseudo-nitzschia spp. accounted more than 40% of phytoplankton, and C. closterium accounted for approximately 25% of phytoplankton until the end of the experiment.
3.4.2 Biovolume and cell densities of dominant species
The biovolume of dominant species (Chaetoceros spp., C. closterium, E. zodiacus, Pseudo-nitzschia spp., and Cryptomonas spp.) was calculated in the three different mesocosm groups (Figure 8). In the control, the biovolume of Cryptomonas spp. increased from 1.58 to 1.74 × 108 μm3 L-1 on day 2, and remained relatively constant (< 1.30 × 108 μm3 L-1) (Figure 8A). The biovolume of E. zodiacus was 2.30 × 108 μm3 L-1 at the beginning of the experiment, and consistently declined. In the LN group, biovolume of E. zodiacus and Cryptomonas spp. initially accounted for high value 2.78 and 1.20 × 108 μm3 L-1, respectively (Figure 8B). Biovolume of Chaetoceros spp. increased significantly and reached a maximum approximately 21.43 × 108 μm3 L-1 on day 6. In the HN group, E. zodiacus and Cryptomonas spp. also observed high biovolume at the beginning of the experiment (Figure 8C). On day 8, the biovolume of E. zodiacus increased to 36.68 × 108 μm3 L-1. At that time, Chaetoceros spp. was a 79.56 × 108 μm3 L-1 that was double of the E. zodiacus. At the end of the experiment, biovolume of Pseudo-nitzschia spp. was highest as 17.67 × 108 μm3 L-1, and the biovolume of C. closterium increased to 1.21 × 108 μm3 L-1.
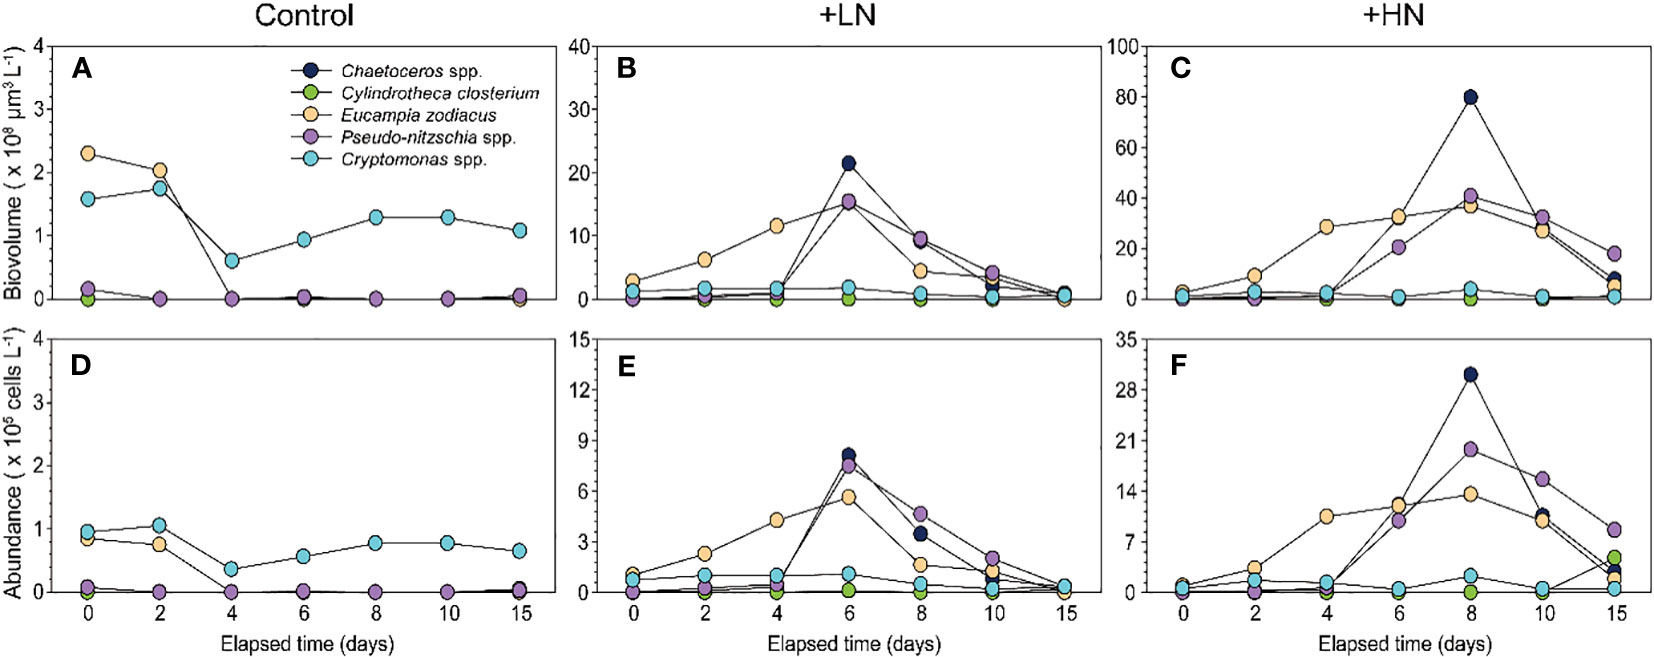
Figure 8 Changes in biovolume (A−C) and abundance (D−F) of dominant species (Chaetoceros spp., Eucampia zodiacus, Pseudo-nitzschia spp., Cylindrotheca closterium and Cryptomonas spp.) in the control, LN, and HN groups during the mesocosm experiment.
In the control, the cell density of Cryptomonas spp. and E. zodiacus were 1.05 and 0.75 × 10⁵ cells L-1 on day 2 (Figure 8D). In the LN group, E. zodiacus and Cryptomonas spp. were relatively high value of 1.03 and 0.73 × 10⁵ cells L-1, respectively, at the beginning of the experiment. The Chaetoceros spp. was maxima of 8.1 × 10⁵ cells L-1 on day 6 (Figure 8E). In the HN group, the initial cell density of E. zodiacus and Cryptomonas spp. were 0.9 and 0.6× 10⁵ cells L-1 (Figure 8F). On day 8, Chaetoceros spp. were 30.08 × 10⁵ cells L-1, and E. zodiacus was 13.6× 10⁵ cells L-1. The cell density of C. closterium increased to 4.8 × 10⁵ cells L-1 and Pseudo-nitzschia spp. was 8.6 × 10⁵ cells L-1. Comparison the counting data with biovolume, it was observed that the biovolume of large-sized E. zodiacus was underestimated, while the biovolume of small-sized Pseudo-nitzschia spp. was overestimated. However, overall changes in cell density exhibited a similar trend to biovolume.
3.4.3 Specific growth rate of dominant species
We also calculated daily specific growth rates for the three dominant diatom species, Chaetoceros spp., E. zodiacus, and Pseudo-nitzschia spp. (Table 1). There was no significant growth in the control group. In the LN groups the growth rate of E. zodiacus consistently decreased from 0.40 ± 0.08 to 0.14 ± 0.01 d-1 over time but the growth rate of Chaetoceros spp. increased to 1.62 ± 0.23 d-1 on day 4. In the HN groups, similar to the LN group, the growth rate of E. zodiacus was 0.65 ± 0.08 d-1 on day 2 and then gradually decreased to 0.06 ± 0.02 d-1 on day 8. The growth rate of Chaetoceros spp. was 0.26 ± 0.08 d-1 on day 2 and increased to 1.70 ± 0.05 d-1 on day 6, just prior to nutrient depletion. The growth rate of Pseudo-nitzschia spp. was the highest values on day 6 in both HN and LN groups, with values of 1.38 ± 0.06 d-1 and 1.34 ± 0.45 d-1, respectively.
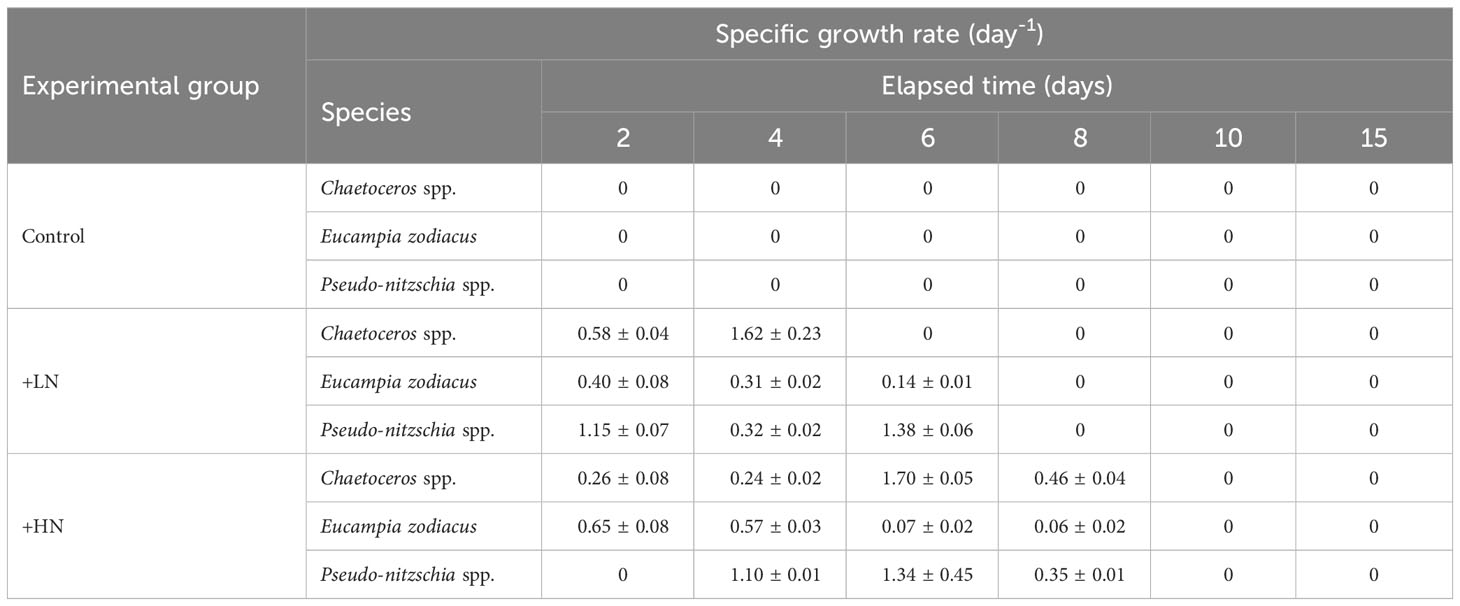
Table 1 Specific growth rates of diatoms Chaetoceros spp., Eucampia zodiacus, and Pseudo-nitzschia spp. in the control, LN, and HN groups during the mesocosm experiment.
3.5 Statistical analyses: field and mesocosm studies
We performed cluster analysis and non-metric MDS to analyze phytoplankton composition in southern KCWs from field data (Figures 9A–D). The results showed that the phytoplankton community structure during each month separated into three distinct groups (both p< 0.01). In March, the stations in group 1 (S1, S2, S3, S4, S10, S11, S12) were characterized by E. zodiacus and the stations in group 2 (S6, S9, S13) were characterized Cryptomonas spp. Notably, the stations within these groups were geographically distant from each other, indicating significant spatial variations in the composition of phytoplankton communities. In April, the stations in Group 1 (S5, S6, S7) were characterized by a dominance of Cryptomonas spp. and Skeletonema spp., and these three stations were close to the river, indicating that river effluent likely affected phytoplankton community composition.
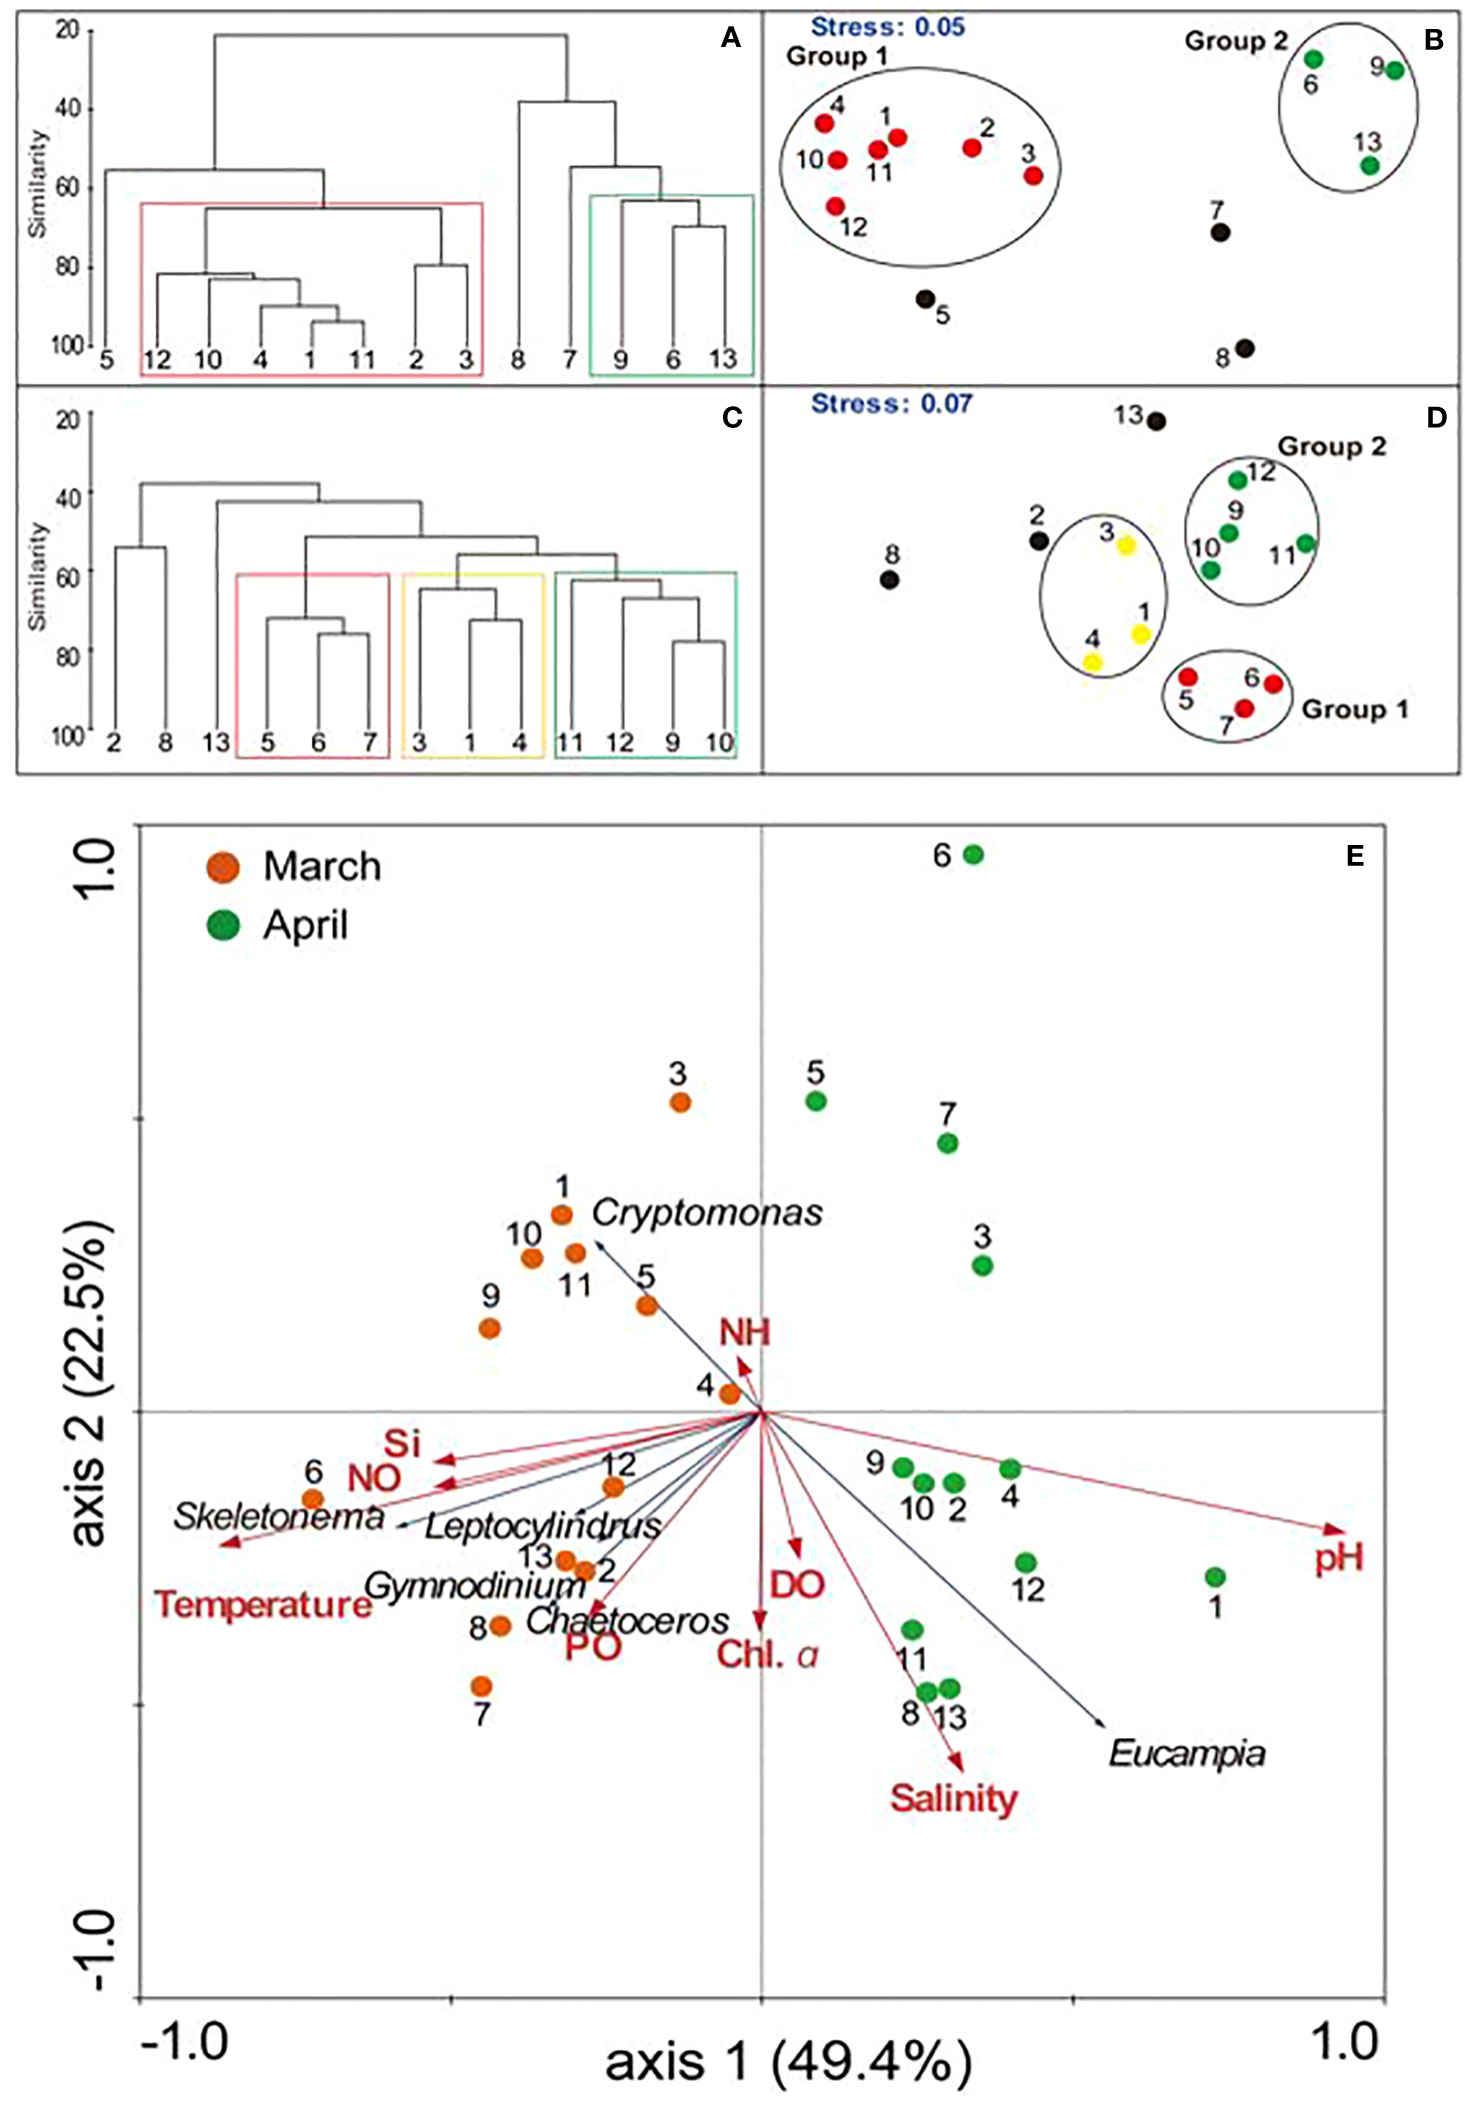
Figure 9 Cluster analysis (A: March, C: April) and multidimensional scaling (B: March, D: April) of phytoplankton assemblages at the 13 field stations. Redundancy analysis (E) of field data, showing the relationships of nine environmental parameters (red arrows; NO [nitrate+nitrite], DO, Chl. a, Si, pH, salinity, temperature, PO [phosphate], NH [ammonium]) with six phytoplankton species (black arrows; Cryptomonas, Eucampia, Gymnodinium, Chaetoceros, Leptocylindrus, Skeletonema) at the 13 field stations during March (numbered red circles) and April (numbered green circles).
We also performed RDA of the field data to identify the relationships of phytoplankton with environmental variables (Figures 9E). The results demonstrated that multiple variables (temperature, ammonium, nitrate+nitrite, salinity, silicate, phosphate, DO, pH, and Chl. a) explained a significant amount of the variability in the phytoplankton communities. The first two redundancy axes accounted for 52.5% of the variance in the species-environmental variable biplot (axis 1: 49.4%; axis 2: 22.5%). Axis 1 had a strong positive correlation with pH and a negative correlation with nitrate+nitrite and silicate. Axis 2 had strong negative correlations with the concentrations of DO and Chl. a, and a positive correlation with ammonia. In addition, Cryptomonas spp. had a negative association with salinity and E. zodiacus.
In mesocosm data, we used PCA to analyze phytoplankton composition (Figure 10). The species-environment variable biplot demonstrated that the first two redundancy axes explained 67.6% of the total variance (PC1: 39.8%, PC2: 27.8%). PC1 had positive loading for Chl. a, Chaetoceros spp., and E. zodiacus, and negative loading for NH4+. PC2 had positive loading for the nutrient variables, and C. closterium had a negative correlation with the nutrient variables.
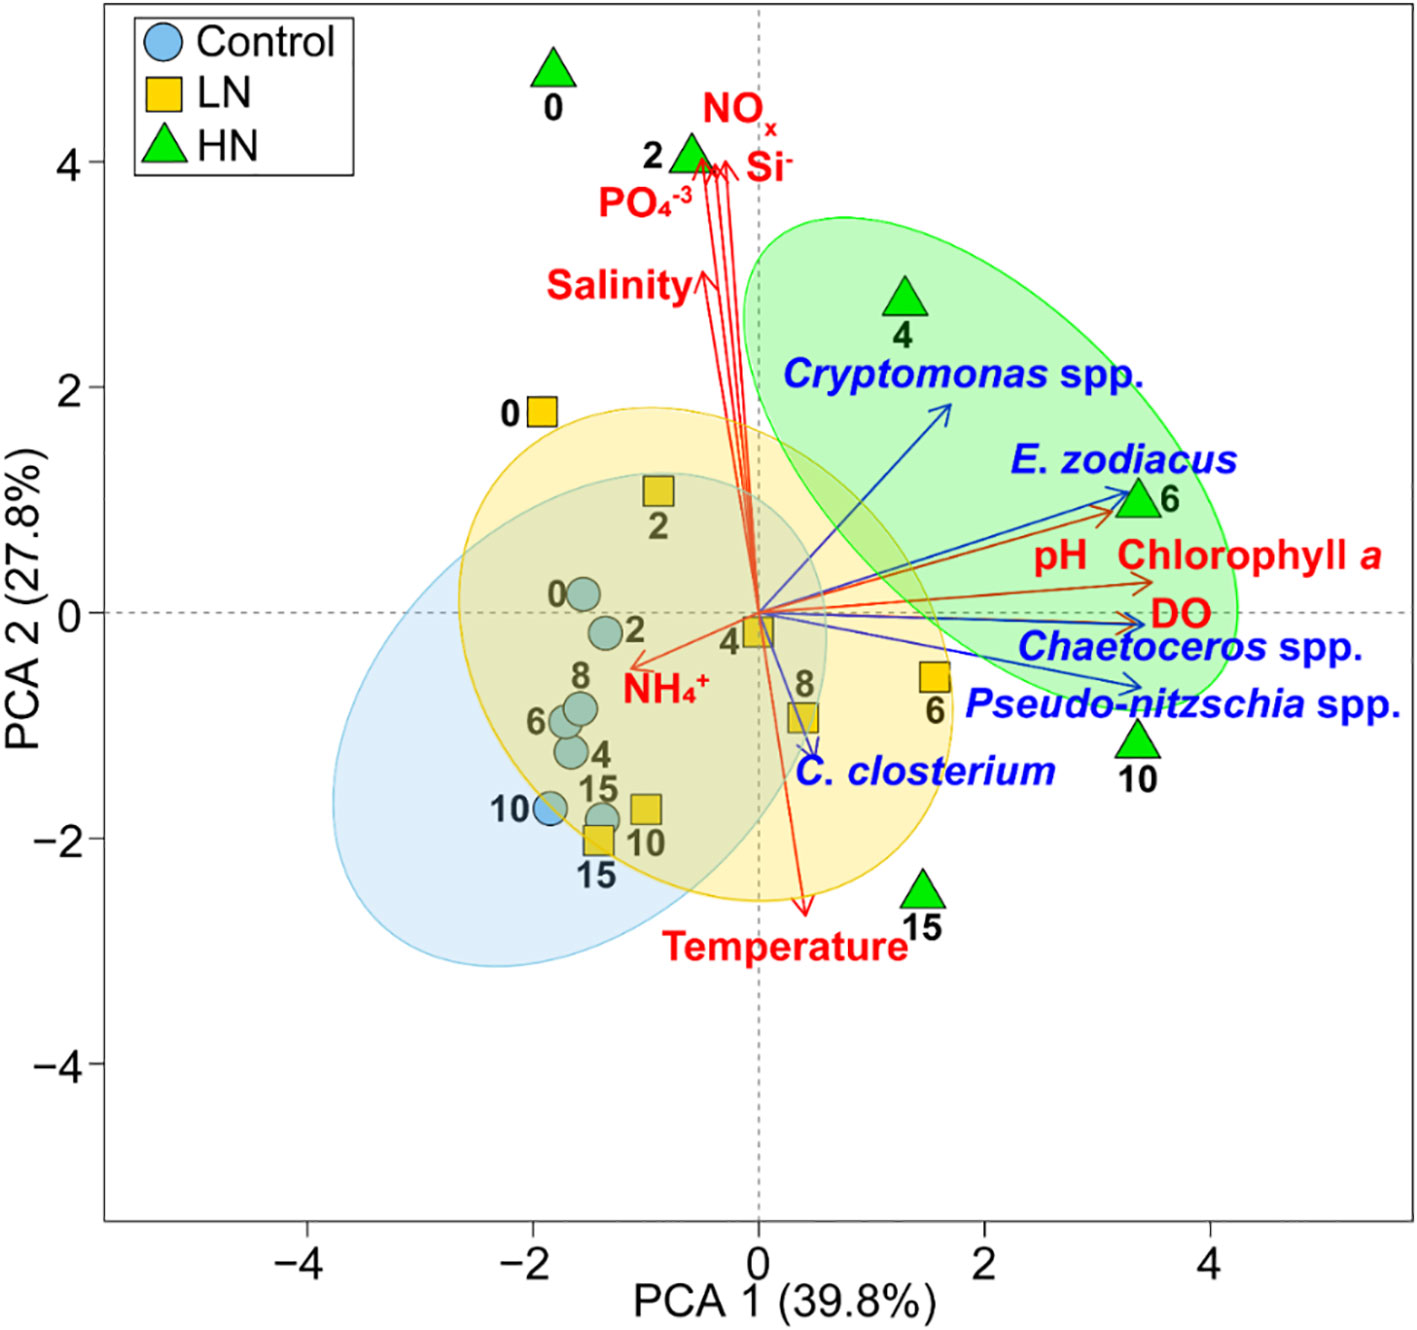
Figure 10 Principal component analysis of mesocosm data in the control group (blue circles), LN group (orange squares), and HN group (green triangles), showing the relationships of nine environmental variables (red arrows; NO [nitrate+nitrite], DO, Chl. a, Si, pH, salinity, temperature, PO [phosphate], NH [ammonium]) with five phytoplankton species (blue arrows; Cryptomonas, E. zodiacus, C. closterium, Chaetoceros, Pseudo-nitzschia). The numbers (0–15) indicate measurement day and the ovals indicate three distinct groups.
4 Discussion
4.1 Environmental factors and the phytoplankton community: field studies
It is widely recognized that nutrient levels have major effects on the growth of phytoplankton in coastal waters (Wang et al., 2010; Baek et al., 2019; Baek et al., 2020; Youn et al., 2022). Nutrients are primarily introduced into these coastal waters by mixing, upwelling events, and river runoff, and these events are especially common during the rainy seasons in temperate regions (Baek et al., 2015; Baek et al., 2018; Baek et al., 2020). Our field measurements indicated the mean concentrations of dissolved inorganic nitrogen (DIN) and dissolved silicate (DSi) were significantly higher during April than March (DIN: 6.74 ± 4.02 vs. 15.18 ± 16.12 μM, t-test: t = minus;1.83, p< 0.05; DSi: 5.93 ± 3.97 vs. 11.95 ± 11.15 μM, t-test: t = −2.06, p< 0.05). There was also a significantly greater abundance of phytoplankton during April than March (t-test: t = −3.12, p< 0.05). The cumulative rainfall during the 7-day period prior to the sampling in April (79.6 mm) was approximately twice as high as in March (38.8 mm). Therefore, the greater rainfall during April led to increased discharge of nutrients from nearby rivers, and this was the most likely cause of the increased abundance of phytoplankton. The findings from our field survey, together with the results of our mesocosm experiments (described below), highlight the important effects of nutrient inputs from terrestrial runoff on phytoplankton populations in nearby coastal waters, even during the early spring. Our findings are also consistent with previous studies by Yoon et al. (2023) and Baek et al. (2015; 2020), which also demonstrated trends of nutrient-driven effects on phytoplankton population dynamics in mesocosm and field surveys during the summer.
In March, the dominant species following cell density were the diatom E. zodiacus and the cryptophyte Cryptomonas spp. Based on geographical data and MDS analysis, we divided the phytoplankton assemblage into three groups, and there were two main groups. Group I, which is characterized by E. zodiacus, and Group II, which is characterized by Cryptomonas spp. These two groups were in different regions of the southern KCWs, and had significant differences in silicate (t-test: t = 1.23, p< 0.05) and salinity (t-test: t = −2.19, p< 0.05). Group II was characterized by high silicate and low salinity, and cryptophytes, including Cryptomonas spp., are more tolerant of changes in salinity than diatoms and dinoflagellates (Thomas and Gibson, 1990; Yoon et al., 2022). Moreover, Cryptomonas spp. is dominant in many estuarine areas (Lee et al., 2020; Yoon et al., 2022). Therefore, the presence of cryptophytes in Group II was likely attributable to the low salinity due to terrestrial runoff. The RDA analysis supported a negative correlation between Cryptomonas spp. and salinity. The diatom E. zodiacus can utilize nitrogen efficiently at low temperature conditions (around 9°C) and, the blooms of E. zodiacus have occurred almost every year during the low temperature period (7.5 to 11.0°C) from winter through early spring (Nishikawa et al., 2007; Nishikawa and Hori, 2015). As such, the physiological characteristics of E. zodiacus would have made it possible to have an advantage in the less affluent environment in March (low nitrogen and temperature conditions).
In April, similar to March, there were high abundances of Cryptomonas spp. and the diatom Skeletonema spp. Tidal currents in coastal waters play a dual role, in that they increase mixing of the water mass and they also increase translocation of phytoplankton (Shearman and Lentz, 2004; Queiroga et al., 2007; Shanks et al., 2014). Skeletonema spp. in particular is common in coastal and estuarine waters worldwide, except for polar regions (Kooistra et al., 2008; Assmy et al., 2019). This diatom can also adapt to brackish water, as demonstrated by Brand (1984) and Rijstenbil (1989). We found that the proportion of Skeletonema spp. was consistently high in the outer stations of the Seomjin River (S12), indicating that it may have been transported or dispersed by tidal currents following initial growth under the high nutrient and low salinity conditions near river mouths. Previous studies by Baek et al. (2015) and Lee et al. (2018) also showed that Skeletonema spp. accounted for a significant amount of the total phytoplankton biomass in the Gwangyang Bay and Seomjin River of Korea. Therefore, the results of our field observations and these previous studies suggest that Skeletonema spp. can proliferate under conditions of high nutrients and low salinity. In addition to Cryptomonas spp. and Skeletonema spp., Chaetoceros spp. and E. zodiacus were also highly abundant during our spring field survey. Our mesocosm experiments (described below) were designed to improve understanding of the temporal dynamics of these species following nutrient additions. Specifically, our mesocosm studies focused on the species that dominated during different stages: Cryptomonas spp., E. zodiacus, and Chaetoceros spp. during the early and middle stages, and C. closterium and Pseudo-nitzschia spp. during the middle and later stages.
4.2 Population dynamics of the phytoplankton community: mesocosm studies
The maximum phytoplankton abundance in the mesocosm experiment was on day 6 in the LN group and day 8 in the HN group, coinciding with timing of nutrient depletion. Notably, in our spring mesocosm study, the response of phytoplankton to nutrient infusion exhibited a slower growth compared to a recent summer mesocosm experiment (Yoon et al., 2023). In this previous summer mesocosm study, phytoplankton had a large rapid response to nutrient addition, and we attribute this to the higher water temperature and the higher level of nutrients during the summer. The nutrient uptake and cellular metabolism of phytoplankton were accelerated at high water temperatures (Montagnes et al., 2003; Kingsolver, 2009; Thomas et al., 2012). The mean water temperature of our spring mesocosms was 12.82 ± 0.62°C, but the previously described summer mesocosms (Yoon et al., 2023) had a mean water temperature of 28.54 ± 1.29°C, a difference of approximately 16°C. Thus, we attribute the two- to four-day delay in nutrient depletion and attainment of maximum phytoplankton biomass in our spring mesocosms to the lower water temperature. In other words, temperature affects nutrient consumption by phytoplankton, and a lower temperature during spring delays the proliferation of phytoplankton by several days.
At the beginning of our mesocosm experiment, the phytoplankton community was dominated by Cryptomonas spp. and E. zodiacus. Although the abundance of Cryptomonas spp. remained relatively stable in the control group throughout the experimental period, the abundances changed significantly in the LN and HN groups. As mentioned above, the diatom E. zodiacus may have been dominant in initial natural seawater (in study site) based on the physiological characteristics of relatively high nutrient uptake rate under low temperatures (Nishikawa et al., 2009). Based on the competitive advantage of high initial cell density (Grover, 1991), the cell density and biovolume of E. zodiacus rapidly increased with the use of abundant nutrients (Figure 8), but the growth rate of E. zodiacus in LN and HN groups was already decreasing from day 2. On the day 6, when nutrients were not depleted, the dominant species shifted from E. zodiacus to Chaetoceros spp. The next dominant diatom Chaetoceros spp., characterized by rapid growth under high nutrient conditions (Lomas and Glibert, 2000; Shevchenko et al., 2004; Sinclair et al., 2009), and in this mesocosm study, the maximum growth rate was over 1.7 d-1, which was substantially higher than that of E. zodiacus (0.65 d-1) (Table 1). This suggests that the fast and effective nutrient uptake and growth ability of Chaetoceros allowed them to dominate even at low initial cell densities. Consequently, we propose that E. zodiacus and Chaetoceros spp. have a high capacity for growth in nutrient-rich waters due to their efficient uptake of nutrients, as also demonstrated in previous studies (Estrada and Berdalet, 1997; Collos et al., 2005; Nishikawa and Hori, 2004; Tantanasarit et al., 2013). However, it suggests that not only the nutrient uptake capacity but also the initial cell density is highly important in determining dominance.
Following nutrient depletion in the mesocosm experiment, the phytoplankton C. closterium and Pseudo-nitzschia spp. gradually dominated. These two relatively small species have high surface-to-volume ratios, which allows for efficient nutrient uptake even in nutrient-depleted conditions. This suggests these small species have the ability to adapt and grow well under conditions of limited nutrients (Harrison and Hurd, 2001; Cochlan et al., 2008; Loureiro et al., 2009). Recent mesocosm studies by Park et al. (2020) and Yoon et al. (2023) also demonstrated the dominance of these two species in nutrient-depleted conditions. In agreement, our PCA analysis revealed significant negative correlations between the abundance of C. closterium and the levels of nitrate, phosphate, and silicate. The dominant species shifted to changes in nutrient levels, leading to changes in cell size as well as cell density. In mesocosm, which is a closed ecosystem and uses only limited resources, biovolume combining cell volume and cell density may be a more reasonable way to track nutrient use, especially by phytoplankton (Thomas et al., 2018). It revealed that the resource utilization of the dominant diatoms could underestimate the biovolume of E. zodiacus and overestimate the biovolume of Pseudo-niztschia spp. based on cell density (Figure 8). On the other hand, in our mesocosm, this difference between cell density and biovolume was not large due to the similarity of cell size in dominant diatoms, which conversely proves that the analysis using cell density is reasonable. However, this can be completely reversed when macroplankton is introduced in the community, so the biovolume that can better explain the use of resources in the ecosystem needs to be considered in future studies.
In previous study (Smetacek, 1999; Silkin et al., 2013), in response to nutrient, a succession from cryptophytes to diatoms in field have reported, and this phenomenon was also reproduced in our mesocosm experiment. The reproducibility of these phenomena demonstrates the potential of mesocosms to represent the field and suggest that it can be used as powerful tools to bridge the large gap between laboratory-based experiments and field. Among our field survey, there was sampling site similar to the initial conditions of our mesocosm experiment (high nutrient enrichment and predominance of Cryptomonas spp. at S6). Although cautious, based on the results of our mesocosm experiments, it is possible to predict the dominance of diatoms specialized in nutrients in the future at that site. Studying phytoplankton community changes through mesocosm experiments, which replicate field conditions while controlling influential factors, aids in comprehending the causes of phytoplankton changes in natural environments and occasionally predicting field outcomes.
5 Conclusion
Our field data highlighted the significant effect of nutrient input from terrestrial runoff after rainfall in shaping the population dynamics of phytoplankton during early spring, particularly the cryptophyte Cryptomonas spp. and the diatoms Chaetoceros spp., Skeletonema spp., and E. zodiacus (Figure 11A). Based on the results in our LN and HN mesocosms, we propose that two diatoms, E. zodiacus and Chaetoceros spp., grow rapidly in nutrient-rich waters. Chaetoceros spp. in particular has the ability to rapidly utilize nutrients, and this was responsible for its dominance despite the initial low cell density (Figure 11B). Following the depletion of most nutrients, C. closterium and Pseudo-nitzschia spp., which are known for efficient nutrient utilization due to their small size, became the dominant species. These results demonstrated the succession of dominant species based on their nutrient uptake and utilization capabilities in response to varying nutrient levels. When viewed together, our laboratory and field data emphasize the significance of environmental factors, such as nutrient concentration, terrestrial runoff, and tidal effects, and biological factors, such as the half-saturation coefficients for nutrient uptake and cell size, in shaping the dynamics of the phytoplankton community in the KCWs. The mesocosm results presented in this study integrated experimental data on phytoplankton community composition, population dynamics, and nutrient interactions, and thereby bridge the gap between laboratory experiments and real-world observations.
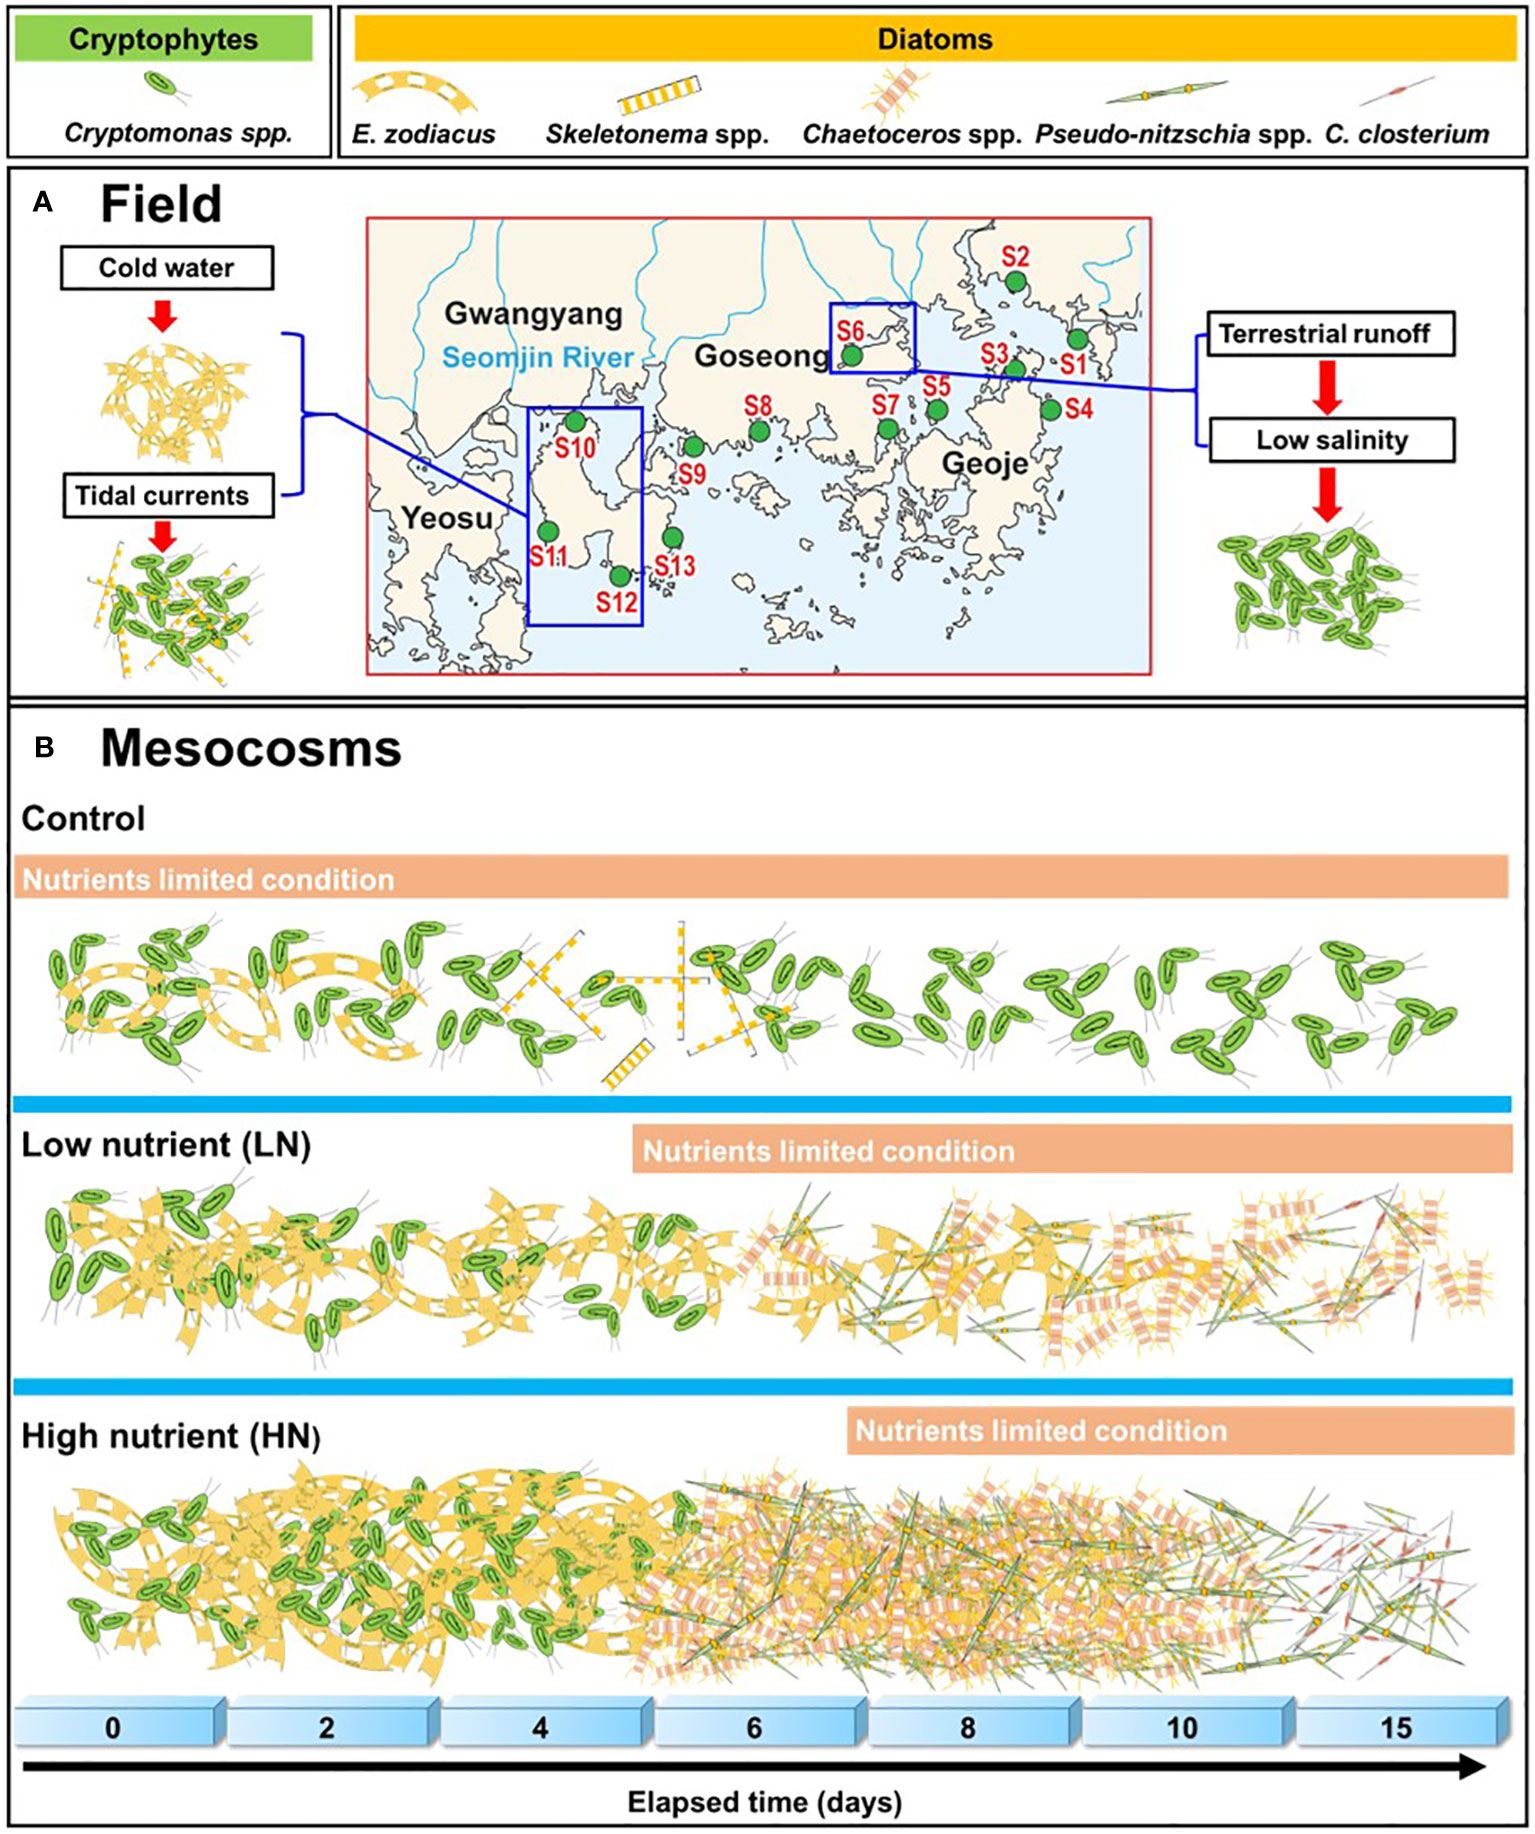
Figure 11 Schematic illustration of phytoplankton community related with environmental factors in field (A) and the time-course response of the phytoplankton community for the control and the LN and HN treatments in mesocosms (B).
Data availability statement
The datasets presented in this study can be found in online repositories. The names of the repository/repositories and accession number(s) can be found in the article/supplementary material.
Author contributions
JY: Conceptualization, Formal analysis, Investigation, Visualization, Writing – original draft. YL: Writing – review & editing. SH: Validation, Writing – review & editing. SB: Funding acquisition, Validation, Writing – review & editing.
Funding
The author(s) declare financial support was received for the research, authorship, and/or publication of this article. This research was supported by ‘Land/Sea-based input and fate of microplastics in the marine environment’ of Korea Institute of Marine Science & Technology Promotion (KIMST) funded by the Ministry of Oceans and Fisheries, Republic of Korea (no. 20220357). This research was also supported by grant (20163MFDS641) from the Ministry of Food and Drug Safety, Republic of Korea.
Conflict of interest
Author JY was employed by the company Geosystem Research Corporation.
The remaining authors declare that the research was conducted in the absence of any commercial or financial relationships that could be construed as a potential conflict of interest.
The reviewer HS declared a shared affiliation with the authors SB, JY, and YL to the handling editor at the time of review.
Publisher’s note
All claims expressed in this article are solely those of the authors and do not necessarily represent those of their affiliated organizations, or those of the publisher, the editors and the reviewers. Any product that may be evaluated in this article, or claim that may be made by its manufacturer, is not guaranteed or endorsed by the publisher.
References
Agawin N. S., Duarte C. M., Agustí S. (2000). Nutrient and temperature control of the contribution of picoplankton to phytoplankton biomass and production. Limnol. Oceanogr. 45 (3), 591–600. doi: 10.4319/lo.2000.45.3.0591
Assmy P., Smetacek V., Montresor M., Ferrante M. I. (2019). “Algal blooms,” in Encyclopedia of microbiology, 4th edn. Ed. Schmidt T. M. (Cambridge. MA: Academic Press), 61–79.
Baek S. H., Kim D., Kim Y. O., Son M., Kim Y. J., Lee M., et al. (2019). Seasonal changes in abiotic environmental conditions in the Busan coastal region (South Korea) due to the Nakdong River in 2013 and effect of these changes on phytoplankton communities. Cont. Shelf. Res. 175, 116–126.
Baek S. H., Kim D., Son M., Yun S. M., Kim Y. O. (2015). Seasonal distribution of phytoplankton assemblages and nutrient-enriched bioassays as indicators of nutrient limitation of phytoplankton growth in Gwangyang Bay, Korea. Estuar. Coast. Shelf Sci. 163, 265–278. doi: 10.1016/j.ecss.2014.12.035
Baek S. H., Lee M., Kim Y. B. (2018). Spring phytoplankton community response to an episodic windstorm event in oligotrophic waters offshore from the Ulleungdo and Dokdo islands, Korea. J. Sea Res. 132, 1–14. doi: 10.1016/j.seares.2017.11.003
Baek S. H., Lee M., Park B. S., Lim Y. K. (2020). Variation in phytoplankton community due to an autumn typhoon and winter water turbulence in southern Korean coastal waters. Sustainability. 12 (7), 2781. doi: 10.3390/su12072781
Baek S. H., Shimode S., Kim H. C., Han M. S., Kikuchi T. (2009). Strong bottom–up effects on phytoplankton community caused by a rainfall during spring and summer in Sagami Bay, Japan. J. Mar. Syst. 75 (1-2), 253–264. doi: 10.1016/j.jmarsys.2008.10.005
Baek S. H., Son M., Bae S. W., Shin K., Na D. H., Cho H., et al. (2013). Algicidal activity of the thiazolidinedione derivative TD49 against the harmful dinoflagellate Heterocapsa circularisquama in a mesocosm enclosure. J. Appl. Phycol. 25, 1555–1565. doi: 10.1007/s10811-012-9953-7
Boyd P. W., Jickells T., Law C. S., Blain S., Boyle E. A., Buesseler K. O., et al. (2007). Mesoscale iron enrichment experiments 1993-2005: synthesis and future directions. Science. 315, 612–617. doi: 10.1126/science.1131669
Brand L. E. (1984). The salinity tolerance of forty-six marine phytoplankton isolates. Estuar. Coast. Shelf Sci. 18 (5), 543–556. doi: 10.1016/0272-7714(84)90089-1
Carpenter E. J., Chang J. (1988). Species-specific phytoplankton growth rates via diel DNA synthesis cycles. 1. Concept of the method. Mar. Ecol. Prog. Ser. Oldendorf. 43 (1), 105–111. doi: 10.3354/meps043105
Chen Y. L. L., Lu H. B., Shiah F. K., Gong G. C., Liu K. K., Kanda J. (1999). New production and f-ratio on the continental shelf of the East China Sea: comparisons between nitrate inputs from the subsurface Kuroshio Current and the Changjiang River. Estuar. Coast. Shelf Sci. 48, 59–75. doi: 10.1006/ecss.1999.0404
Cloern J. E. (2001). Our evolving conceptual model of the coastal eutrophication problem. Mar. Ecol. Prog. Seri. 210, 223–253. doi: 10.3354/meps210223
Cochlan W. P., Herndon J., Kudela R. M. (2008). Inorganic and organic nitrogen uptake by the toxigenic diatom Pseudo-nitzschia australis (Bacillariophyceae). Harmful Algae. 8, 111–118. doi: 10.1016/j.hal.2008.08.008
Collos Y., Vaquer A., Souchu P. (2005). Acclimation of nitrate uptake by phytoplankton to high substrate levels 1. J. Phycol. 41 (3), 466–478. doi: 10.1111/j.1529-8817.2005.00067.x
Duarte C. M., Agusti S., Agawin N. S. (2000). Response of a Mediterranean phytoplankton community to increased nutrient inputs: a mesocosm experiment. Mar. Ecol. Prog. Ser. 195, 61–70. doi: 10.3354/meps195061
Durbin E. G., Durbin A. G. (1992). Effects of temperature and food abundance on grazing and short-term weight change in the marine copepod Acartia hudsonica. Limnol. Oceanogr. 37 (2), 361–378. doi: 10.4319/lo.1992.37.2.0361
Galloway J. N., Dentener F. J., Capone D. G., Boyer E. W., Howarth R. W., Seitzinger S. P., et al. (2004). Nitrogen cycles: past, present, and future. Biogeochemistry. 70, 153–226. doi: 10.1007/s10533-004-0370-0
Grover J. P. (1991). Resource competition in a variable environment: phytoplankton growing according to the variable-internal-stores model. Am. Naturalist. 138 (4), 811–835. doi: 10.1086/285254
Harrison P. J., Hurd C. L. (2001). Nutrient physiology of seaweeds: application of concepts to aquaculture. Cah. Biol. Mar. 42, 71–82.
Heiskanen A. S., Keck A. (1996). Distribution and sinking rates of phytoplankton, detritus, and particulate biogenic silica in the Laptev Sea and Lena River (Arctic Siberia). Mar. Chem. 53 (3-4), 229–245. doi: 10.1016/0304-4203(95)00091-7
Jiang Z., Chen J., Gao Y., Zhai H., Jin H., Zhou F., et al. (2019). Regulation of spatial changes in phytoplankton community by water column stability and nutrients in the southern Yellow Sea. J. Geophys. Res. Biogeosci. 124, 2610–2627. doi: 10.1029/2018JG004785
Kang I. S., Jin K., Wang B., Lau K. M., Shukla J., Krishnamurthy V., et al. (2002). Intercomparison of the climatological variations of Asian summer monsoon precipitation simulated by 10 GCMs. Climate Dynamics 19, 383–395. doi: 10.1007/s00382-002-0245-9
Kim J. Y., Kim H., Choi M. S., Lee H. M., Bai S. C.. (2014). Spatial and temporal variations of the trophodynamics of anchovy (Engraulis japonicus) in the southern coastal waters of Korea using fatty acid trophic markers. Anim. Cells. Syst. 18, 425–434.
Kingsolver J. G. (2009). The well-temperatured biologist: (American society of naturalists presidential address). Am. Naturalist. 174 (6), 755–768. doi: 10.1086/648310
Kirkwood D. S. (1992). Stability of solutions of nutrient salts during storage. Mar. Chem. 38 (3-4), 151–164. doi: 10.1016/0304-4203(92)90032-6
Kooistra W. H., Sarno D., Balzano S., Gu H., Andersen R. A., Zingone A. (2008). Global diversity and biogeography of Skeletonema species (Bacillariophyta). Protist. 159 (2), 177–193. doi: 10.1016/j.protis.2007.09.004
Lee C. H., Lim Y. K., Yoon J. N., Baek S. H. (2023). Impacts of nutrient and marine plastic debris influx on the microalgal community (phytoplankton and periphyton) in Korean temperate coastal waters: Mesocosm study. J. Appl. Phycol. 35, 2309–2322. doi: 10.1007/s10811-023-03069-x
Lee M., Park B. S., Baek S. H. (2018). Tidal influences on biotic and abiotic factors in the Seomjin River Estuary and Gwangyang Bay, Korea. Estuaries. Coast. 41, 1977–1993. doi: 10.1007/s12237-018-0404-9
Lee M., Won N. I., Baek S. H. (2020). Comparison of HPLC pigment analysis and microscopy in phytoplankton assessment in the Seomjin River Estuary, Korea. Sustainability. 12, 1675. doi: 10.3390/su12041675
Lomas M. W., Glibert P. M. (2000). Comparisons of nitrate uptake, storage, and reduction in marine diatoms and flagellates. J. Phycol. 36, 903–913. doi: 10.1046/j.1529-8817.2000.99029.x
Loureiro S., Jauzein C., Garcés E., Collos Y., Camp J., Vaqué D. (2009). The significance of organic nutrients in the nutrition of Pseudo-nitzschia delicatissima (Bacillariophyceae). J. Plankton. Res. 31, 399–410. doi: 10.1093/plankt/fbn122
Lunven M., Guillaud J. F., Youénou A., Crassous M. P., Berric R., Le Gall E., et al. (2005). Nutrient and phytoplankton distribution in the Loire River plume (Bay of Biscay, France) resolved by a new Fine Scale Sampler. Estuar. Coast. Shelf Sci. 65, 94–108. doi: 10.1016/j.ecss.2005.06.001
Martin J. H., Fitzwater S. E. (1988). Iron deficiency limits phytoplankton growth in the north-east Pacific subarctic. Nature. 331, 341–343. doi: 10.1038/331341a0
Montagnes D. J., Kimmance S. A., Atkinson D. (2003). Using Q10: can growth rates increase linearly with temperature? Aquat. Microb. Ecol. 32 (3), 307–313. doi: 10.3354/ame032307
Nishikawa T., Hori Y. (2004). Effects of nitrogen, phosphorus and silicon on the growth of the diatom Eucampia zodiacus caused bleaching of seaweed Porphyra isolated from the Harima-Nada, the Seto Inland Sea, Japan. Bull. Japanese Soc. Sci. Fisheries (Japan) 70, 31-38. doi: 10.2331/suisan.70.31
Nishikawa T., Hori Y. (2015). Estimation of the nutrient consumption by various cell sizes of the diatom Eucampia zodiacus: A representative organism causing bleaching of aquacultured nori. Harmful Algae. 44, 32–36. doi: 10.1016/j.hal.2015.02.007
Nishikawa T., Hori Y., Tanida K., Imai I. (2007). Population dynamics of the harmful diatom Eucampia zodiacus Ehrenberg causing bleachings of Porphyra thalli in aquaculture in Harima-Nada, the Seto Inland Sea, Japan. Harmful algae. 6 (6), 763–773. doi: 10.1016/j.hal.2007.04.005
Nishikawa T., Tarutani K., Yamamoto T. (2009). Nitrate and phosphate uptake kinetics of the harmful diatom Eucampia zodiacus Ehrenberg, a causative organism in the bleaching of aquacultured Porphyra thalli. Harmful algae. 8 (3), 513–517. doi: 10.1016/j.hal.2008.10.006
Olenina I. (2006). Biovolumes and size-classes of phytoplankton in the Baltic Sea. Balt. Sea Environ. Proc. 106, 23-142.
Paerl H. W., Rudek J., Mallin M. A. (1990). Stimulation of phytoplankton production in coastal waters by natural rainfall inputs: nutritional and trophic implications. Mar. Biol. 107, 247–254. doi: 10.1007/BF01319823
Park BS, Lee M, Shin K, Baek B. S., Lee M., Baek S. H. (2020). Response of the bacterioplankton composition to inorganic nutrient loading and phytoplankton in southern Korean coastal waters: A mesocosm study. Mar Ecol 41:1–14.
Park K. T., Lee K., Shin K., Yang E. J., Hyun B., Kim J. M., et al. (2014). Direct linkage between dimethyl sulfide production and microzooplankton grazing, resulting from prey composition change under high partial pressure of carbon dioxide conditions. Environ. Sci. Technol. 48, 4750–4756. doi: 10.1021/es403351h
Parsons T., Maita Y., Lalli C. (1984). A manual of biological and chemical methods for seawater analysis. Perg. Press. 1, 475–490.
Queiroga H., Cruz T., dos Santos A., Dubert J., González-Gordillo J. I., Paula J., et al. (2007). Oceanographic and behavioural processes affecting invertebrate larval dispersal and supply in the western Iberia upwelling ecosystem. Prog. Oceanogr. 74 (2-3), 174–191. doi: 10.1016/j.pocean.2007.04.007
Raveh O., Angel D. L., Astrahan P., Belkin N., Bar-Zeev E., Rahav E. (2019). Phytoplankton response to N-rich well amelioration brines: A mesocosm study from the southeastern Mediterranean Sea. Mar. pollut. Bull. 146, 355–365. doi: 10.1016/j.marpolbul.2019.06.067
Redfield A. C., Ketchum B. H., Richards F. A. (1963). The influence of organisms on the composition of seawater. The sea. 2, 26–77.
Rijstenbil J. W. (1989). Competitive interaction between Ditylum brightwellii and Skeletonema costatum by toxic metabolites. Netherlands J. Sea Res. 23 (1), 23–27. doi: 10.1016/0077-7579(89)90039-2
Ryan J. P., Fischer A. M., Kudela R. M., Gower J. F., King S. A., Marin I. I. I. R., et al. (2009). Influences of upwelling and downwelling winds on red tide bloom dynamics in Monterey Bay, California. Cont. Shelf. Res. 29, 785–795. doi: 10.1016/j.csr.2008.11.006
Sandaa R. A., Gómez-Consarnau L., Pinhassi J., Riemann L., Malits A., Weinbauer M. G., et al. (2009). Viral control of bacterial biodiversity–evidence from a nutrient-enriched marine mesocosm experiment. Environ. Microbiol. 11, 2585–2597. doi: 10.1111/j.1462-2920.2009.01983.x
Satoh F., Hamasaki K., Toda T., Taguchi S. (2000). Summer phytoplankton bloom in Manazuru Harbor, Sagami Bay, central Japan. Plankton Biol. Ecol. 47 (2), 73–79.
Schä H., Bernard L., Courties C., Lebaron P., Servais P., Pukall R., et al. (2001). Microbial community dynamics in Mediterranean nutrient-enriched seawater mesocosms: changes in the genetic diversity of bacterial populations. FEMS. Microbiol. Ecol. 34, 243–253. doi: 10.1111/j.1574-6941.2001.tb00775.x
Shanks A. L., Morgan S. G., MacMahan J., Reniers A. J., Jarvis M., Brown J., et al. (2014). Onshore transport of plankton by internal tides and upwelling-relaxation events. Mar. Ecol. Prog. Ser. 502, 39–51. doi: 10.3354/meps10717
Shearman R. K., Lentz S. J. (2004). Observations of tidal variability on the New England shelf. J. Geophys. Res. Oceans. 109, C06010.
Shevchenko O. G., Orlova T. Y., Maslennikov S. I. (2004). Seasonal dynamics of the diatoms of the genus Chaetoceros Ehrenberg in Amursky Bay (Sea of Japan). Russ. J. Mar. Biol. 30, 11–19. doi: 10.1023/B:RUMB.0000020564.12182.b8
Short F. T. (1987). Effects of sediment nutrients on seagrasses: literature review and mesocosm experiment. Aquat. Bot. 27 (1), 41–57. doi: 10.1016/0304-3770(87)90085-4
Sigman D. M., Hain M. P. (2012). The biological productivity of the ocean. Nat. Educ. Knowledge. 3, 21.
Silkin V. A., Pautova L. A., Lifanchuk A. V. (2013). Physiological regulatory mechanisms of the marine phytoplankton community structure. Russ. J. Plant Physiol. 60, 541–548.
Sinclair G., Kamykowski D., Glibert P. M. (2009). Growth, uptake, and assimilation of ammonium, nitrate, and urea, by three strains of Karenia brevis grown under low light. Harmful Algae. 8, 770–780. doi: 10.1016/j.hal.2009.02.006
Smayda T. J. (1973). The growth of Skeletonema costatum during a winter-spring bloom in Narragansett Bay, Rhode Island. Norw. J. Bot. 20, 219–247.
Smetacek V. (1999). Diatoms and the ocean carbon cycle. Protist. 150, 25–32. doi: 10.1016/S1434-4610(99)70006-4
Sun J., Liu D. (2003). Geometric models for calculating cell biovolume and surface area for phytoplankton. J. Plankton Res. 25, 1331–1346. doi: 10.1093/plankt/fbg096
Suzuki K., Handa N., Nishida T., Wong C. S. (1997). Estimation of phytoplankton succession in a fertilized mesocosm during summer using high-performance liquid chromatographic analysis of pigments. J. Exp. Mar. Biol. Ecol. 214 (1-2), 1–17. doi: 10.1016/S0022-0981(97)00003-8
Tantanasarit C., Englande A. J., Babel S. (2013). Nitrogen, phosphorus and silicon uptake kinetics by marine diatom Chaetoceros calcitrans under high nutrient concentrations. J. Exp. Mar. Biol. Ecol. 446, 67–75. doi: 10.1016/j.jembe.2013.05.004
Ter Braak C. J. (1994). Canonical community ordination. Part I: Basic theory and linear methods. Ecoscience 1, 127–140. doi: 10.1080/11956860.1994.11682237
Ter Braak C. T., Smilauer P. (1998). CANOCO reference manual and user’s guide to Canoco for Windows: software for canonical community ordination (version 4) Centr. Biom (Netherlands). 351p.
Thomas M. K., Fontana S., Reyes M., Pomati F. (2018). Quantifying cell densities and biovolumes of phytoplankton communities and functional groups using scanning flow cytometry, machine learning and unsupervised clustering. PloS One 13, e0196225. doi: 10.1371/journal.pone.0196225
Thomas M. K., Kremer C. T., Klausmeier C. A., Litchman E. (2012). A global pattern of thermal adaptation in marine phytoplankton. Science. 338 (6110), 1085–1088. doi: 10.1126/science.1224836
Thomas W. H., Gibson C. H. (1990). Effects of small-scale turbulence on microalgae. J. Appl. Phycol. 2, 71–77. doi: 10.1007/BF02179771
Wang J., Tang D., Sui Y. (2010). Winter phytoplankton bloom induced by subsurface upwelling and mixed layer entrainment southwest of Luzon Strait. J. Mar. Syst. 83 (3-4), 141–149. doi: 10.1016/j.jmarsys.2010.05.006
Wold S., Esbensen K., Geladi P. (1987). Principal component analysis. Chemometrics Intell. Lab. Syst. 2 (1-3), 37–52. doi: 10.1016/0169-7439(87)80084-9
Wood M. A., Everroad R. C., Wingard L. M. (2005). “Measuring growth rates in microalgal cultures,” in Ed. Andersen R. A., ‘Algal culturing techniques’, 269–285 Elsevier, Academic. Press.
Yoon J. N., Lee M., Jin H., Lim Y. K., Ro H., Park Y. G., et al. (2022). Summer distributional characteristics of surface phytoplankton related with multiple environmental variables in the korean coastal waters. J. Mar. Sci. Eng. 10, 850. doi: 10.3390/jmse10070850
Yoon J. N., Lim Y. K., Baek S. H. (2023). Time-series response of water column phytoplankton and periphyton on attachment plates following nutrient addition during summer in mesocosms. J. Appl. Phycol. 35, 1301–1315. doi: 10.1007/s10811-023-02932-1
Youn J. N., Lim Y. K., Kim D. S., Kim Y. O., Baek S. H. (2022). Seasonal changes in phytoplankton community related with environmental factors in the Busan coastal region in 2014. Korean. J. Environ. Biol. 40, 112–123. doi: 10.11626/KJEB.2022.40.1.112
Zhou M. J., Shen Z. L., Yu R. C. (2008). Responses of a coastal phytoplankton community to increased nutrient input from the Changjiang (Yangtze) River. Cont. Shelf. Res. 28, 1483–1489. doi: 10.1016/j.csr.2007.02.009
Keywords: spring bloom, diatom, nutrients, terrestrial runoff, mesocosm
Citation: Yoon JN, Lim YK, Hong S and Baek SH (2024) Use of mesocosm and field studies to assess the effects of nutrient levels on phytoplankton population dynamics in Korean coastal waters. Front. Mar. Sci. 11:1253708. doi: 10.3389/fmars.2024.1253708
Received: 06 July 2023; Accepted: 02 January 2024;
Published: 26 January 2024.
Edited by:
Stelios Katsanevakis, University of the Aegean, GreeceReviewed by:
Hyeon Ho Shin, Korea Institute of Ocean Science and Technology (KIOST), Republic of KoreaJerónimo Pan, National Scientific and Technical Research Council (CONICET), Argentina
Savvas Genitsaris, National and Kapodistrian University of Athens, Greece
Copyright © 2024 Yoon, Lim, Hong and Baek. This is an open-access article distributed under the terms of the Creative Commons Attribution License (CC BY). The use, distribution or reproduction in other forums is permitted, provided the original author(s) and the copyright owner(s) are credited and that the original publication in this journal is cited, in accordance with accepted academic practice. No use, distribution or reproduction is permitted which does not comply with these terms.
*Correspondence: Seung Ho Baek, YmFla3NoQGtpb3N0LmFjLmty
 Ji Nam Yoon1,2
 Seongjin Hong
 Seung Ho Baek