
94% of researchers rate our articles as excellent or good
Learn more about the work of our research integrity team to safeguard the quality of each article we publish.
Find out more
ORIGINAL RESEARCH article
Front. Mar. Sci., 29 February 2024
Sec. Ocean Observation
Volume 11 - 2024 | https://doi.org/10.3389/fmars.2024.1250815
This article is part of the Research TopicApplication of Remote Sensing in Coastal Oceanic ProcessesView all 11 articles
 Lohitzune Solabarrieta1*
 Maria Fernandes2
 Irene Ruiz1
 Macu Ferrer2
 Pedro Liria1
 Iñaki de Santiago1
 Jorge Sánchez2Jose Antonio Aranda3
 Anna Rubio1
Global concern on extreme events is increasing the need for real time monitoring of the wave fields in coastal areas. High Frequency (HF) radars, a remote sensing technology widely applied to measure near real time surface coastal currents with demonstrated accuracy, can also play a major role in the operational monitoring of waves height, period and direction. However, the ability of HF radar to measure waves can be jeopardized by specific ocean-meteorological and environmental conditions. Thus, a case-to-case analysis and parameterization is necessary to ensure the best data in each study area. In the southeastern (SE) Bay of Biscay, the EuskOOS HF radar network, composed by two compact HF radar stations provides hourly surface waves data in near real time. In this work, we analyze the effects of wind and noise levels on the radar skills for wave measurement, compared with existing in-situ data obtained by an offshore buoy. Then, the HF radar wave measurements for 2022 are analyzed with special focus on the most energetic observed wave events. The analysis performed versus in-situ data shows that both stations present reliable and accurate data for waves over 1.5 m, in agreement to what can be expected for a 4.46 MHz radar. The highest correlations are observed for waves > 4 m significant wave height, which demonstrates the capabilities for monitoring highly energetic events. Interference and noise detected on very precise time slots significantly reduced the availability and reliability of the measurements. Also, local winds blowing from land direction were found to affect the agreement between radar and in-situ measurements. Recommendations extracted from the analysis are provided, with the aim that they can be extended to other HF networks for more accurate wave monitoring.
Global concern on extreme natural events is increasing, particularly for coastal areas that are more susceptible to these phenomena. Extreme natural events include, but are not limited to: heatwaves, heavy precipitation, intense storms and winds and extreme oceanic waves. As they become more frequent, severe, and long-lasting, coastal communities are likely to be more vulnerable. Extreme events interact with the diverse coastal ocean processes at different temporal and spatial scales threating morphological dynamics and ultimately affecting human socio-economics activities in coastal areas. In the context of the Blue Economy development, an adequate wave monitoring for real time assessment of coastal risk and historical data for analysis of extreme event regime has become crucial.
Traditionally, wave measurements have primarily relied on visual observations conducted by personnel onboard vessels and in-situ mooring instruments, with the associate scarceness of spatial measurements, and elevated installation and maintenance costs. In recent decades, the coverage of operational (automated and in real time) wave measurements has increased along the coasts, thanks to the growing number of coastal in-situ observatories and, at open sea, thanks to consolidated wave satellite data products (e.g. Copernicus Marine Services Global Ocean L 3 Significant Wave Height along-track product: https://doi.org/10.48670/moi-00179). Satellite data products exhibit decreased effectiveness as they approach near the coastline areas, where High Frequency (HF) radars can complete the gaps of satellite products. Wave data from global and local models have also increased in the past decades (e.g. the Copernicus Marine Services Global Ocean Waves Analysis and Forecast, based on the operational global ocean analysis and forecast system of Météo-France, https://doi.org/10.48670/moi-00017) and they have been improved with the assimilation of the existing in-situ and remote data.
Considerable efforts have been directed towards establishing an operational wave monitoring system in the southeastern Bay of Biscay (SE BoB) combining in-situ measurements and model data. Since 2007, within the framework of EuskOOS operational oceanography system (doi.org/10.57762/T4WH-DQ48), several buoys have been deployed across the SE BoB, seeking a better understanding of the wave dynamics from a more sustained and cost-effective perspective (Solabarrieta et al., 2022). In-situ measurements by buoys underpin operational early warning systems from wave impact in the area (Gaztelumendi et al., 2018) and enable to assess the performance of coastal wave models (Ferrer et al., 2010). Nonetheless, the spatial resolution achievable through in-situ systems is constrained by technical and economic limitations. In 2009, a coastal-based HF radar was installed to complete the in-situ observations and provides since then near-real-time surface currents fields. HF radars can be separated mainly in two types, based on the method they use to retrieve and interpret the echoes from the sea: beam forming (BF) and Direction Finding (DF). BF is used by phased array radars while DF is mainly used by compact antennas. The EuskOOS SeaSonde® compact HF radar (EuskOOS HF radar from now on) network has already been used to study surface coastal transport processes in the area in combination with multisource data (Rubio et al., 2011; Rubio et al., 2013; Solabarrieta et al., 2014; Solabarrieta et al., 2015; Solabarrieta et al., 2016; Manso-Narvarte et al., 2018; Rubio et al., 2018; Rubio et al., 2020; Manso-Narvarte et al., 2021). Besides measuring sea surface water velocity [Crombie (1955), Barrick et al., 1977, Paduan and Rosenfeld (1996) and Paduan and Graber (1997)], the HF radar can also monitor waves (Lipa, 1978; Lipa and Barrick, 1982; Lipa and Nyden, 2005; Gurgel et al., 2006; Wyatt, 2011; Wyatt, 2021). Although wave retrieval application is less common than currents retrieval, especially in real time, and this topic it is still being developed (Lopez et al., 2016), several studies have analyzed and validated waves information from compact (Lorente et al., 2018; Orasi et al., 2018; Lorente et al., 2019; Saviano et al., 2019; Basañez et al., 2020) and phased array (Wyatt and Green, 2009; Lopez and Conley, 2019; Mundaca-Moraga et al., 2021) HF radars in the last few years.
Wave information can be retrieved from the inversion of the second order component of the Doppler spectrum as defined in the literature (Barrick 1986; Gurgel et al., 1999; Lipa and Nyden, 2005). The relation between the ocean wave directional spectrum and the received HF radar Doppler spectrum, must be inverted to obtain wave parameters (Barrick, 1977; Green and Wyatt, 2006; Gurgel et al., 2006). Two main methods are currently used for waves data extraction: full integral inversion (used by phased array HF radars, which use Beam Forming) and ocean wave spectrum model fitting (mainly used by compact HF radars). Both phased array and compact HF radar systems can provide wave information based on the inversion of the second order component of the Doppler spectrum. However, the compact station HF radar systems (the ones analyzed in this study) also require assumptions about spatial homogeneity of the wave field and no depth effects along the rings centered in the stations during the ocean wave spectrum model fitting (Lipa and Barrick, 1986; Lipa and Nyden, 2005; Lipa and Nyden, 2005; Wyatt, 2021). Wave information from compact HF radars incorporates therefore the area of the analyzed ring around the station.
Environmental factors can affect currents data quality and acquisition from HF radars (Kohut and Glenn, 2003; Yang et al., 2018; Horstmann et al., 2019; Mantovani et al., 2020). HF radar wave measurements use a much lower signal level retrieved from the second order component of the Doppler spectrum than currents (retrieved from the first order component) and they are also affected by environmental conditions (Wyatt et al., 2010; Wyatt and Green, 2023). Indeed, wave retrieval methodology is susceptible to electromagnetic noise of environmental or human origin and to ocean-meteorological conditions to a greater extent than the measurement of currents. The ability of HF radar technology in capturing wave parameters with sufficient quality is highly dependent on ocean-meteorological and environmental conditions (e.g. bathymetry, coastline, radio interference, ionospheric noise, direction and intensity of winds and currents, direction, period and height of waves, simultaneous presence of bimodal waves and wind, etc…) present always in the measurement area of the HF radar. While the ability to measure bimodal seas using phased array radars has been demonstrated (e.g. Wyatt and Green, 2022), the dependency of ocean-meteorological conditions is even higher for compact HF radar stations, due to the assumption of the spatial homogeneity of the wave characteristics along each range ring centred on the HF radar stations. Consequently, much more comprehensive analysis, configuration adjustments, parameterization, and validation procedures remain imperative to enhance understanding and optimization of the compact HF radar capabilities in providing operational wave measurements. To assess the ability of a specific compact HF radar to measure waves, it is therefore necessary to characterize the study area based on these conditions.
Although the global examples of the use of HF radar to collect operational information on ocean waves are more and more numerous, the limitations exposed in the previous paragraphs explain that compared to surface currents, wave information from HF radars is usually much less common. In fact, the European HFR Node is processing and sharing currents data from 280 HF radar stations (both compact and phased array HF radars) all around the world (https://www.hfrnode.eu/map/) but there is no operational wave dataflow from these stations.
The EuskOOS HF radar network, featuring 2 compact HF radar stations located in the SE BoB, stands as a testament to the underutilization of wave information owing to these challenges. The work presented in this paper is the first attempt to study the EuskOOS HF radar historical wave measurements compared with existing in-situ data in the SE BoB. The capabilities of compact HF radar networks to exploit operational wave data have been analyzed, taking advantage of the large existing worldwide HF radar network (https://www.hfrnode.eu/map/) that could be used for real-time wave data retrieval.
The objectives of this study for compact HF radars encompass the following aims: (i) conducting a comprehensive analysis and evaluation of wave measurements obtained from the EuskOOS HF radar network under different ocean-meteorological conditions. (ii) identifying the pertinent variables that should be taken into account to assess periods of optimal functionality within any compact HF radar network. (iii) identifying the potential ocean-meteorological conditions during which the wave data derived from the EuskOOS HF radar can offer valuable insights for operational and historical analysis. (iv) assessing the capabilities of the EuskOOS HF radar for monitoring intense (extreme) events.
The Bay of Biscay is located in the Northeast of the Atlantic Ocean, between Brest (France) and Cape Finisterre (Spain) (Lavín et al., 2006) (Figure 1). The wave climate of the Bay of Biscay is tied to its geographic position on the Northeast Atlantic, and it is modulated by its topographic and bathymetric characteristics (Gonzalez et al., 2004; Borja et al., 2019). Throughout the year, the primary swell direction is from the NW, driven by the low-pressure systems of the North Atlantic (typical winter wave field distribution is represented by the WAM model on March 23, 2023, in Figure 1). Seasonal variability characterizes the wave climate, with relatively mild conditions during summer owing to the extension of the Azorean anticyclone which buffers the intensity of storms and extremely energetic conditions during winter (Gonzalez et al., 2004). In fact, recent studies highlight the significant increase of the winter-mean wave height and variability over the last seven decades (Castelle et al., 2018). This is demonstrated by the concatenation of extreme events during the past years such as the Klaus storm (January 2009), which produced significant wave height (hereinafter Hs) of 13 m and peak period (hereinafter Tp) of 15 s at Bilbao-Vizcaya buoy (Lavaud et al., 2020), and the Xynthia storm (2010), which generated storm surges up to 1.5 m or the highly energetic 2013/2014 winter, which recorded the highest winter average wave height since 1948 (Masselink et al., 2016). In the last few years, events with these characteristics have generated wave overtopping of coastal structures in the study area with damages and risk to structures and humans. Traditional in-situ wave measurements are often damaged or they failure connectivity during such important moments. High Frequency radars located in the study area can help on the real time characterization of the waves without data disruption especially during extreme events. The historical measurements can also help on the characterization and prediction of the increasing frequency and severity of these extreme events.
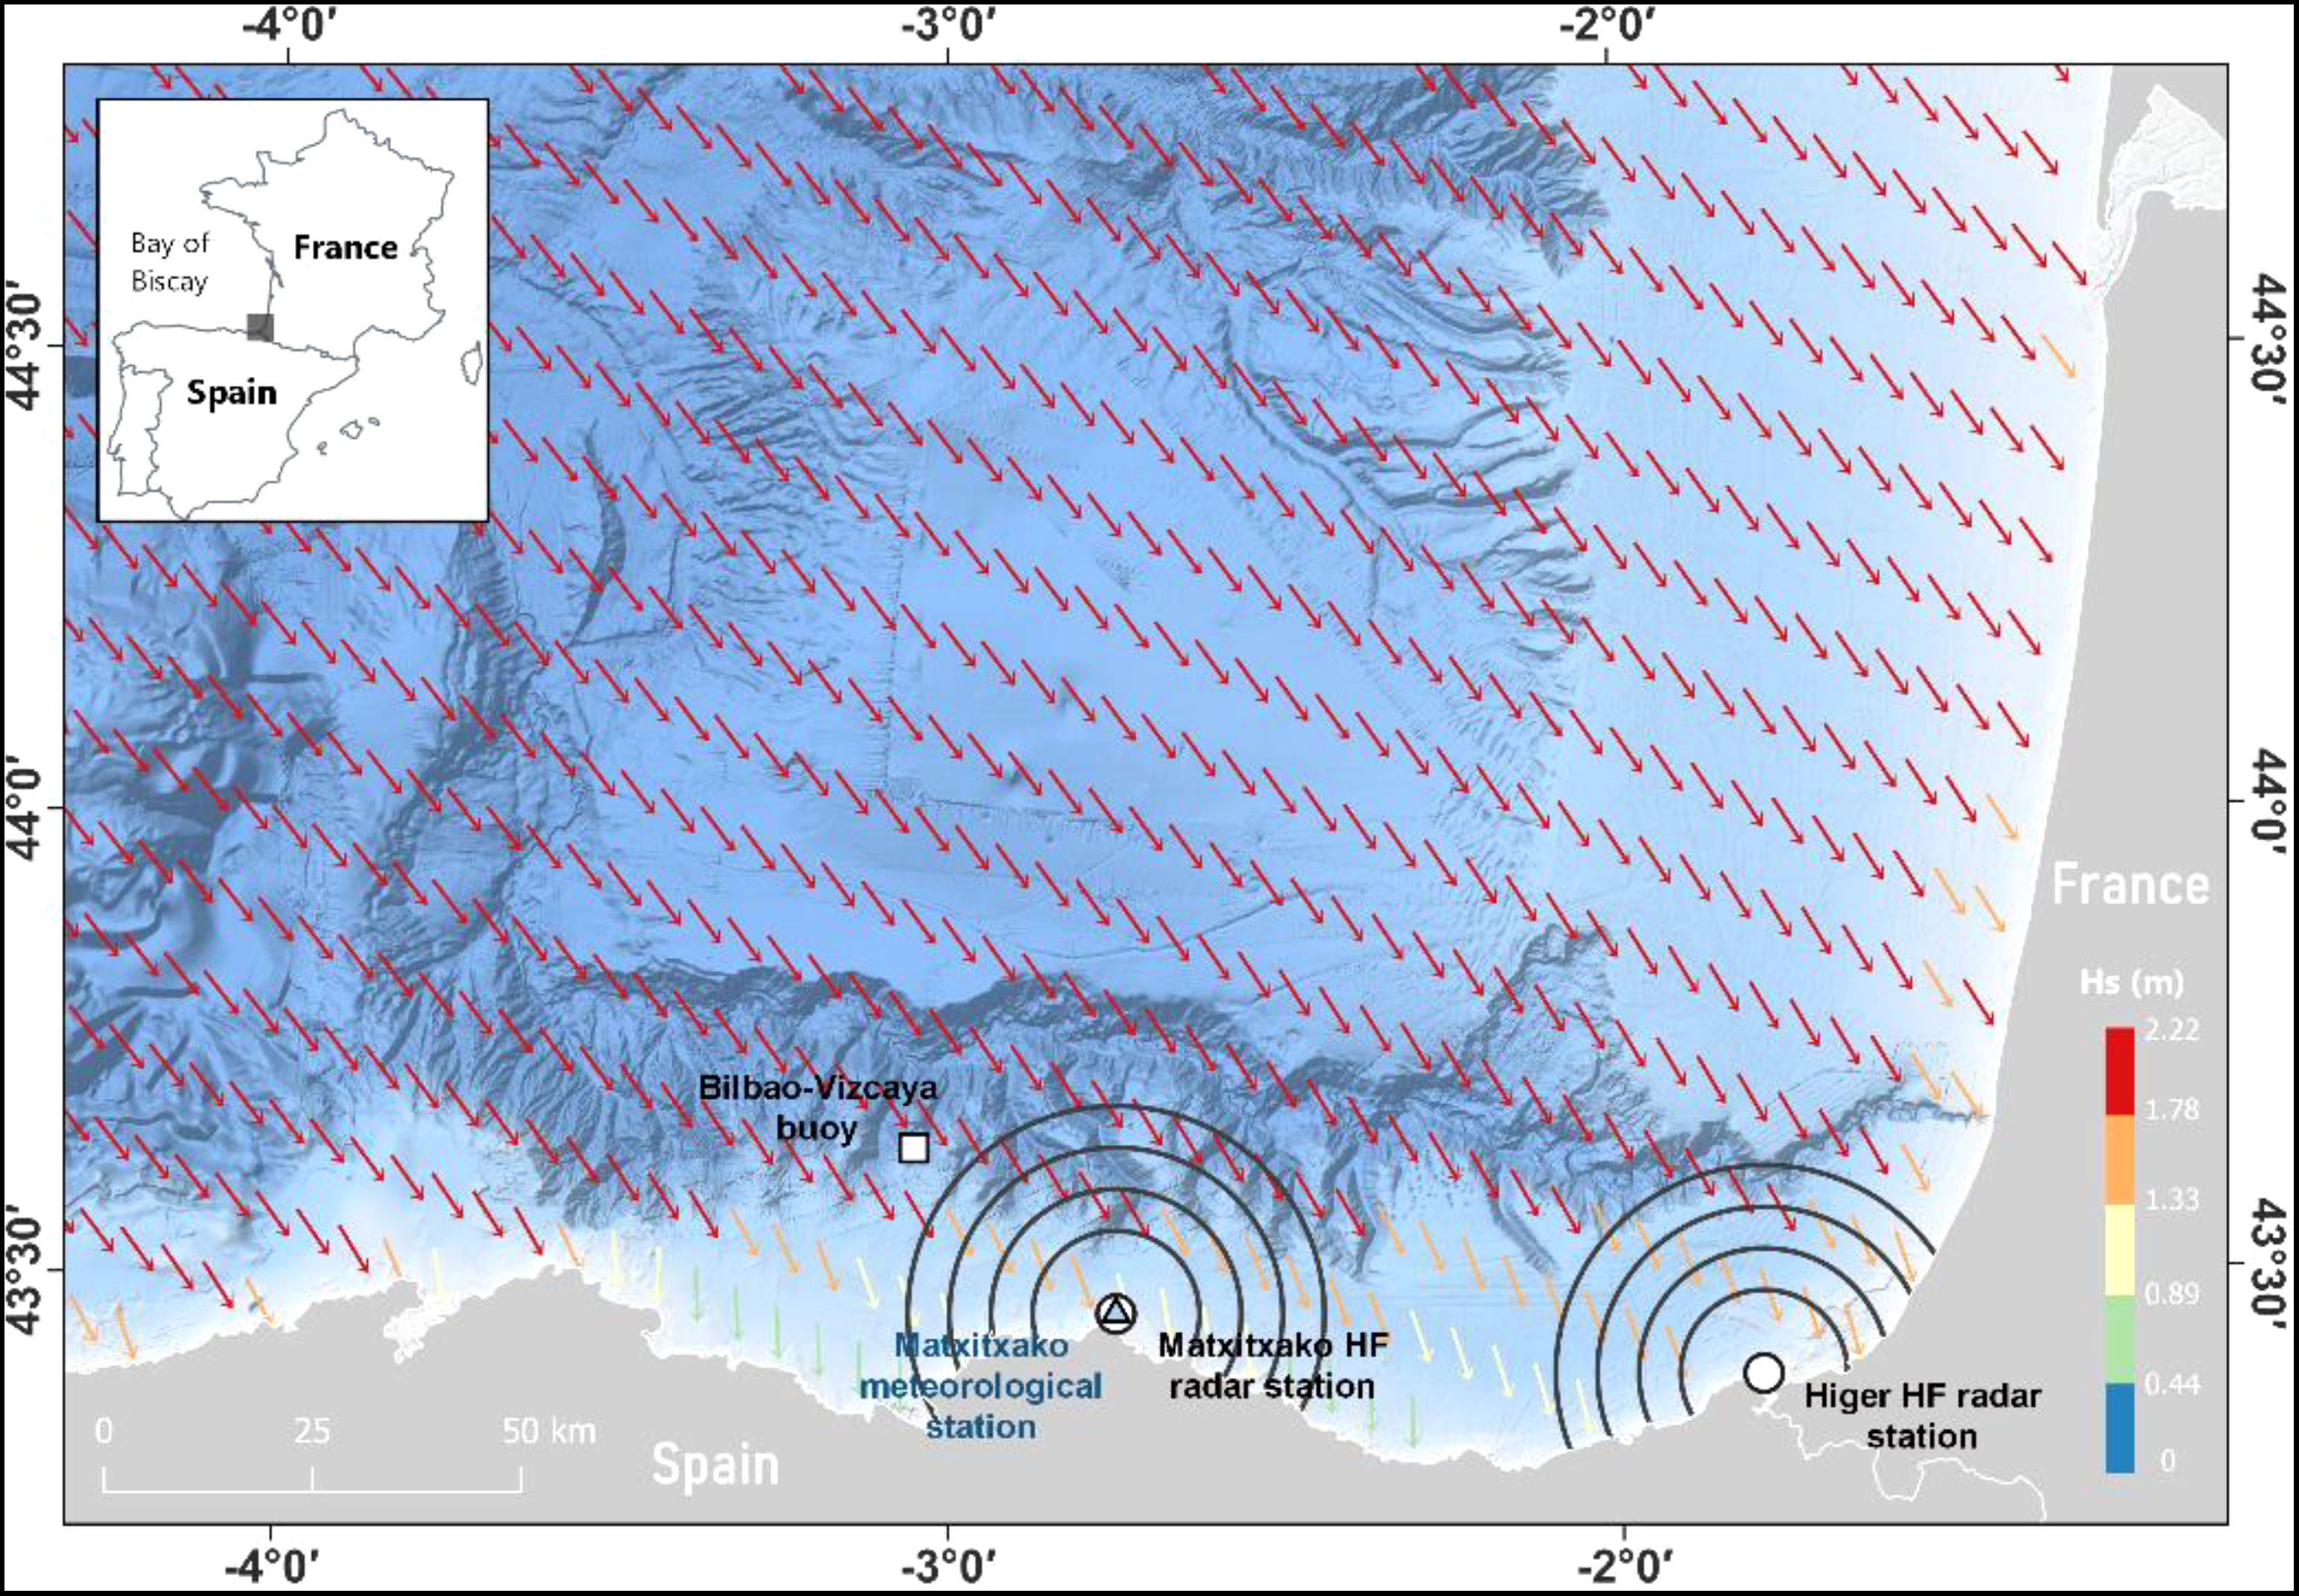
Figure 1 Location of Matxitxako and Higer HF radar stations (white filled dots), Bilbao-Vizcaya buoy (white filled square, and Euskalmet wind station (blue triangle). Black inner circles represent the center of range cells (rings) RC2-RC5 for wave measurements by HF radar stations. Colored arrows over the water area represent the significant wave height (Hs) from WAM wave model on March 23, 2023 (representative of typical winter wave field in the study area).
The EuskOOS HF radar network is a Seasonde® compact CODAR system of high frequency radars, composed of two radio stations (Matxitxako and Higer) which operate at a central frequency of 4.46MHz, with an operational bandwidth of 30 kHz. In this study, we use wave and wind data from each of the stations independently (Table 1; Figure 1) in the period 2020-2022. HF radar radial data cover a spatial range of up to approximately 180 km from the coastline and provides information on surface currents, Hs, Tp and wave direction (hereinafter Wdir). The network is equipped with CODAR’s Radial Suite Release 8 update 5 software for radial and wave data processing. As a component of JERICO-RI (https://www.jerico-ri.eu/) the EuskOOS HF radar operates in accordance with the best practices, standards, and recommendations outlined in the JERICO-S3 project (see Solabarrieta et al., 2016; Mantovani et al., 2020 and Rubio et al., 2018, for details). They are shared as part of Copernicus Global Ocean- in-situ Near real- and delayed-time surface ocean currents products (https://doi.org/10.48670/moi-00041 & https://doi.org/10.17882/86236). The network has provided surface current hourly data (with 3 hours rolling average) since 2009, with some interruptions mostly due to maintenance stops or malfunctioning related to severe atmospheric conditions. The performance of this network for ocean currents measurements and its potential for the study of ocean processes and transport patterns have already been demonstrated by previous works (e.g., Rubio et al., 2011; Solabarrieta et al., 2014; Solabarrieta et al., 2015; Solabarrieta et al., 2016; Manso-Narvarte et al., 2018; Rubio et al., 2018; Rubio et al., 2019; Manso-Narvarte et al., 2020; Rubio et al., 2020; Manso-Narvarte et al., 2021; Ruiz et al., 2022). However, wave information has so far remained unexploited.
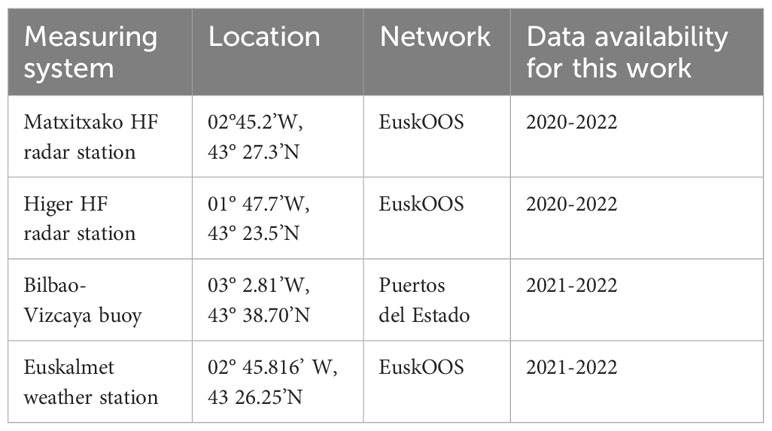
Table 1 Measuring system locations, network and data periods used in this study.
The EuskOOS compact HF radar stations, produce short time CrossSpectra files (CSS) every 10 minutes. CSS measurements are site-centred and include the information from ~5 km spaced circular range cells (RC). These files are processed using the Seasonde® Radial Suite R8u5 proprietary software, applying Pierson-Moskowitz model (Lipa and Nyden, 2005) to the second order spectrum of the spatially averaged wave parameters for a given range of RCs. RCs used in this study were located between 10 and 25 km (RC2-RC5) as indicated in Figure 1. SeaSonde HF radar wave data are typically stored in monthly WVLM text files from each radial station. WVLM files are filtered using all RCs and then averaged over time and range, producing hourly wave parameters directly from the proprietary software. Those files also include quality controlled hourly wave parameters and relevant QC metrics, such as Spectra Counts, Doppler Bins and Vector Flags, specifically used to discard or include data in the output quality-controlled wave files. Only values that passed all the imposed QC metric values by the software are available in the final WVLM text files from each radial station. These values have been considered as hourly wave parameters for this study. For further information on the waves retrieval files, the reader is referred to the CODAR support documentation manual in www.support.codar.com, in Radial Suite 8 wave file format section (http://support.codar.com/Technicians_Information_Page_for_SeaSondes/Manuals_Documentation_Release_8/File_Formats/File_Wave.pdf) (accessed November 21, 2023).
At operational frequencies ranging from 3 to 10 MHz, HF radars can measure longer waves with periods typically ranging from 5 to 20 seconds and wavelengths from 50 to 300 meters. These lower operating frequencies enable extended range coverage but are not able to measure low Hs waves. Due to this intrinsic limitation, for HF radar operating at 4.46 MHz, when the Hs is below 1.5 m, the second-order spectrum, which has lower energy than the first-order one, approaches the noise floor, and consequently, it is easily contaminated (Lipa and Nyden, 2005). As a result, sea states with Hs below 1.5 m from EuskOOS HF radar cannot efficiently reflect the radar transmitted electromagnetic signal and cannot properly be retrieved from the backscattered echo (Wyatt and Green, 2009; Wyatt, 2011; Lopez et al., 2016). Maximum Hs retrievable with 4.46MHz radars is 20m, which is out of the range of expected Hs in the study area.
Bilbao-Vizcaya offshore buoy, integrated into the measuring network of Puertos del Estado (http://portus.puertos.es), was deployed in 1990 in the coastal waters of the SE BoB (Table 1; Figure 1). It is a Seawatch directional buoy, with a diameter of 2.8 m and anchored at a 600 m depth. It conducts measurements for 20 minutes each hour and provides hourly near real time wave parameters (Hs, mean and peak wave period and direction), extracted from directional spectrum [E(f, θ)], as follows:
- Directional spectrum Where, , and M=2 in case of a Pitch Roll buoy
- Significant Wave height: ,
- Mean wave period:
- Peak period: ,
- Mean wave direction:
This buoy was selected for validation considering the location of the HF radar stations (northwest from the two HF radar stations) and its alignment with the prevailing wave direction within the study area.
Wind-fields were collected from Matxitxako meteorological station (Table 1; Figure 1). This station is located at 433 m high, and it is part of the hydro-meteorological network of the Basque Country, which consists of more than 120 stations connected in real-time. This station was selected after checking that direction from observed wind-fields showed the best correlation to HF radar wind direction measurements (extracted following Lipa and Nyden, 2005), when compared to simulated winds provided by available meteorological models (e.g. the model from the Meteorological Agency of Galicia close to Bilbao-Vizcaya buoy location).
Ocean-meteorological and environmental data collected during 2020, 2021 and 2022 underwent analysis and classification to characterize the waves in the study area. 2022 was used as target year for statistical analysis since it presented the highest data availability from the HF radar and the offshore buoy. The following data and parameters were used as foundational background information to assess and optimize the HF radar data processing configuration:
On one hand, the information on the coastline and bathymetry in the measurements from HF radar: (i) Spatial coordinates of HF radar measurements, (ii) HF radar operating frequency and (iii) Antenna pattern used.
On the other hand, environmental and ocean-meteorological data from in-situ sources (buoy and weather stations) within or near the HF radar coverage area: (i) Spatial coordinates of the in-situ measurements; (ii) Existing bathymetry and coastline in the proximity of these in-situ measurements; (iii) Measurements of significant height/peak swell, swell period, swell direction; (iv) Measurements of wind direction and intensity; (v) Ocean-meteorological data of waves (height, period, direction) and wind (direction and intensity) provided by numerical models (e.g. CMEMS).
To validate and assess the wave retrieval capabilities of the EuskOOS HF radar network, Hs, Tp and Wdir from the two HF radar stations and from the Bilbao-Vizcaya buoy were compared on a monthly basis. Monthly mean values of Hs were calculated for Higer and Matxitxako HF radar stations and for Bilbao-Vizcaya buoy. However, in calculating monthly means, only waves with Hs>1,5m were included due to the limitations of the 4,46 MHz radars for the retrieval of smaller waves. The statistics to analyze and compare data were the following:
Considering two series of data, {X(ti); i= 1,…, N}, {Y(ti); i=1,…, N},
- Mean Value of X time series:
- Bias:
- Root Mean Square:
- Correlation Coefficient:
Monthly winds from Matxitxako meteorological station were plotted together with the wind direction from HF radar stations to determine the local wind conditions throughout the year. HF radar skills for waves retrieval in periods with different wind conditions were also analyzed. Statistical comparisons were conducted to check HF radar skills during specific wind directions, considering wind sectors of 45 degrees.
Extreme wave events within the study area were defined as instances where Hs measured by the buoy exceeded 4m for time periods over 12h (Gorman, 2018). This threshold was applied to showcase HF radar data available exclusively for periods when Bilbao-Vizcaya buoy Hs > 4m.
Noise interferes widely in the quality and availability of the wave data derived from HF radar technology. Since Matxitxako and Higer HF radar stations experienced periodic high noise periods, with an associated data availability decrease, a qualitative and quantitative inspection of the wave data and spectra provided by both stations were performed to assess the noise impact over the wave dataset quality and availability.
Wave data from EuskOOS HF radar network underwent statistical analysis and later comparison with data from an in-situ buoy. An analysis on a monthly basis was conducted, followed by the analysis of extreme events. Moreover, the effect of different wind and noise conditions on the data availability and accuracy was undertaken.
Monthly mean values of Hs were calculated for Higer and Matxitxako HF radar stations and for the Bilbao-Vizcaya buoy in 2022 (Table 2). Results unveiled a clear seasonal cycle that peaks during winter, especially in February and November. Bilbao-Vizcaya buoy wave data represent the seasonal variations, showing mild conditions during summer and extreme energetic conditions during winter, as previously described by Gonzalez et al., (2004). The absolute minimum Hs for both HF radar stations and Bilbao-Vizcaya buoy occurred in July. Hs monthly mean values measured by Higer HF radar station ( Higer = 2.8m) were higher than those provided by HF radar Matxitxako station ( Matx = 2.18m) and Bilbao-Vizcaya buoy ( Buoy = 2.5m). Higher values near Higer HF radar station can be related to the local conditions of the data retrieval coverage area of the station (Figure 1).
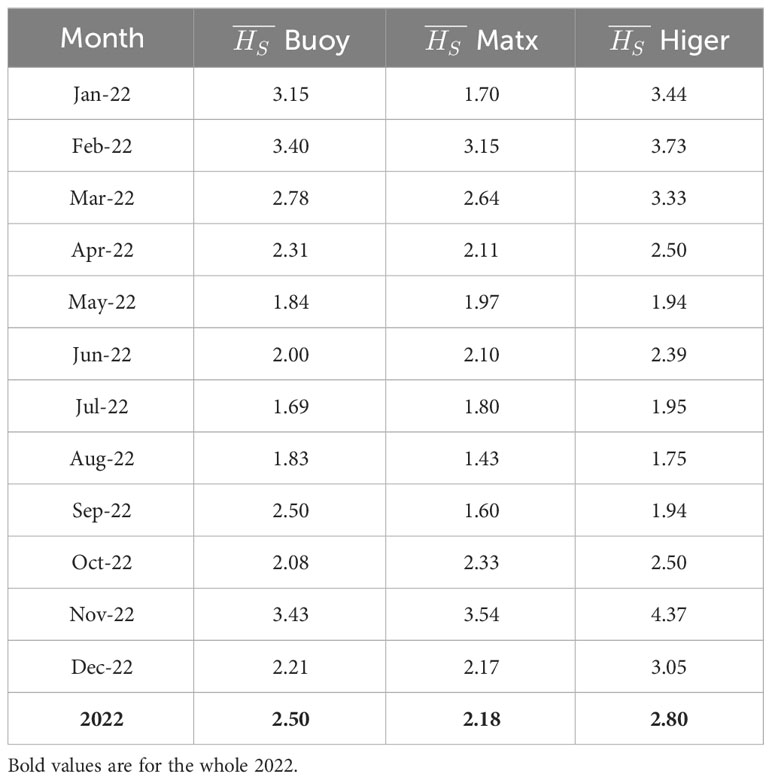
Table 2 Mean values of Hs>1.5m for Bilbao-Vizcaya buoy (referred as “Buoy”) and HF radar stations (referred as Higer and Matx, for Higer and Matxitxako HF radar stations, respectively) during 2022.
Hs, Tp and Wdir measured by Matxitxako and Higer HF radar stations and Bilbao-Vizcaya buoy have been plotted for each month of 2022. An illustrative example of February 2022, depicting data from Matxitxako and Higer HF radar stations is presented in Figure 2.
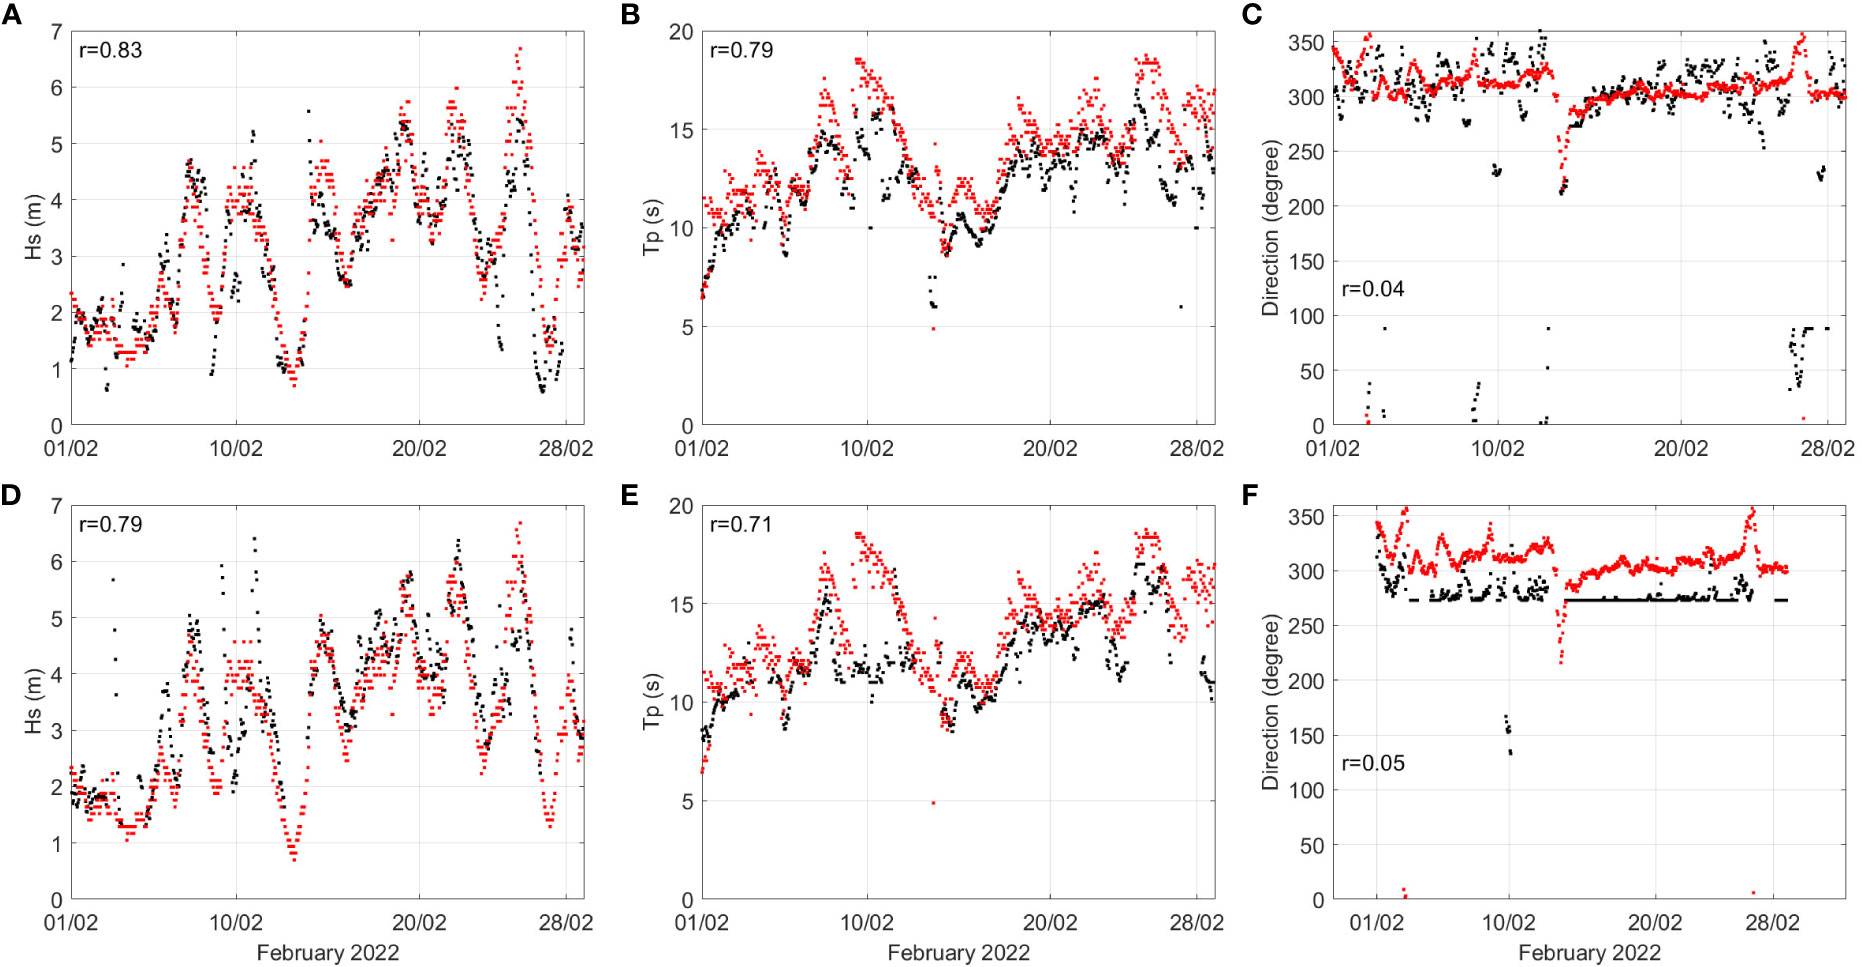
Figure 2 (A, D) Hs, (B, E) Tp and (C, F) Wdir comparison for February 2022, between Bilbao-Vizcaya buoy and (A–C) Matxitxako HF radar station and (D–F) Higer HF radar station. Black dots correspond to HF radars and red dots correspond to the Bilbao-Vizcaya buoy. Units are provided in the axis labels.
Tables 3, 4 delineate the monthly statistical comparison between Bilbao-Vizcaya buoy and both Matxitxako and Higer HF radar stations during 2022, for Hs>1.5m. Overall, the buoy data availability (86.4%) was higher than HF radar Matxitxako (60.31%) and Higer (52.3%) stations, respectively. Concerning the Hs, comparisons between Matxitxako HF radar station and Bilbao-Vizcaya buoy (Table 3), show monthly r values up to 0.83 (and typically over 0.6), except for January when there is a significant lack of HF radar data (only 25.68% Matxitxako HF radar station data availability).
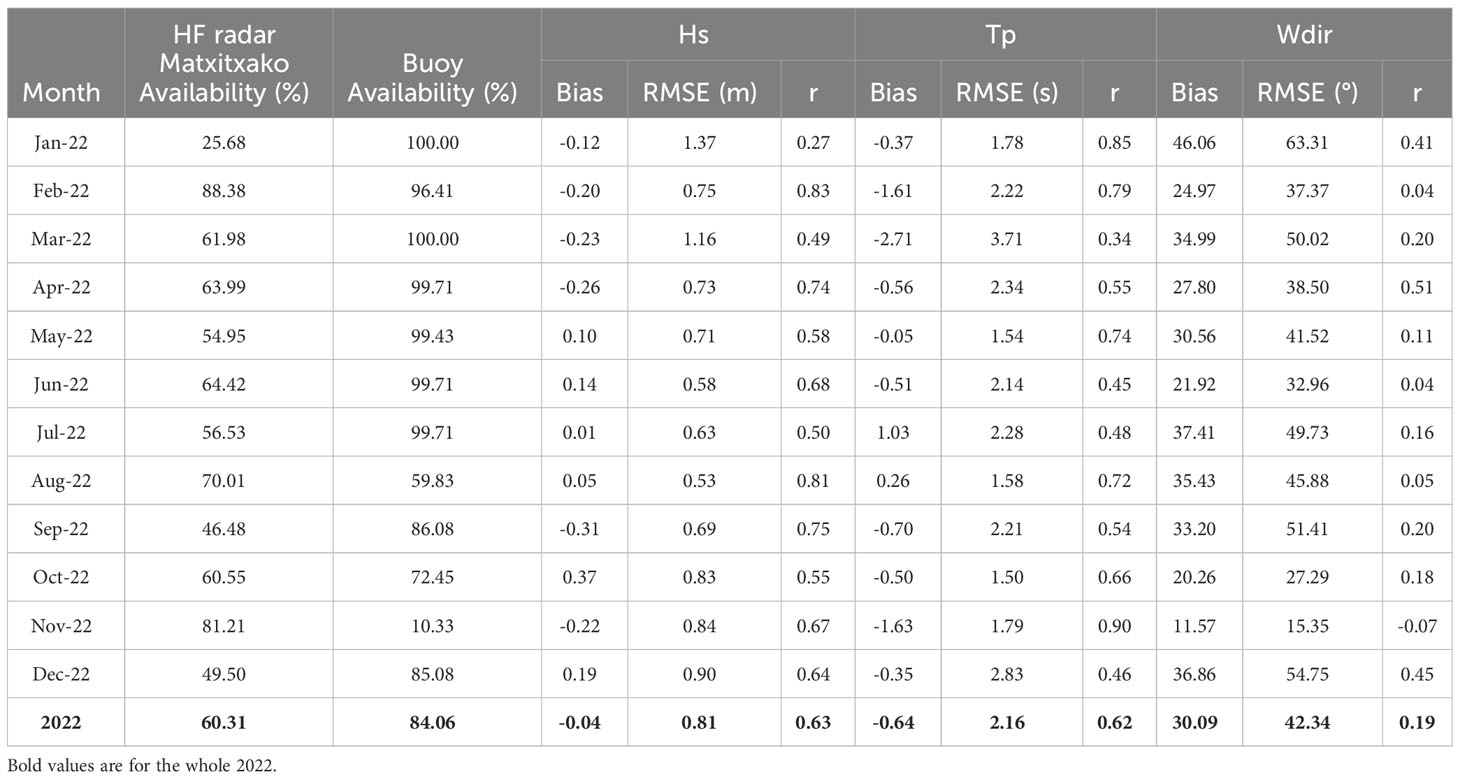
Table 3 Data availability and statistical comparison of Hs>1.5m values for Bilbao-Vizcaya buoy and Matxitxako HF radar station, during 2022.
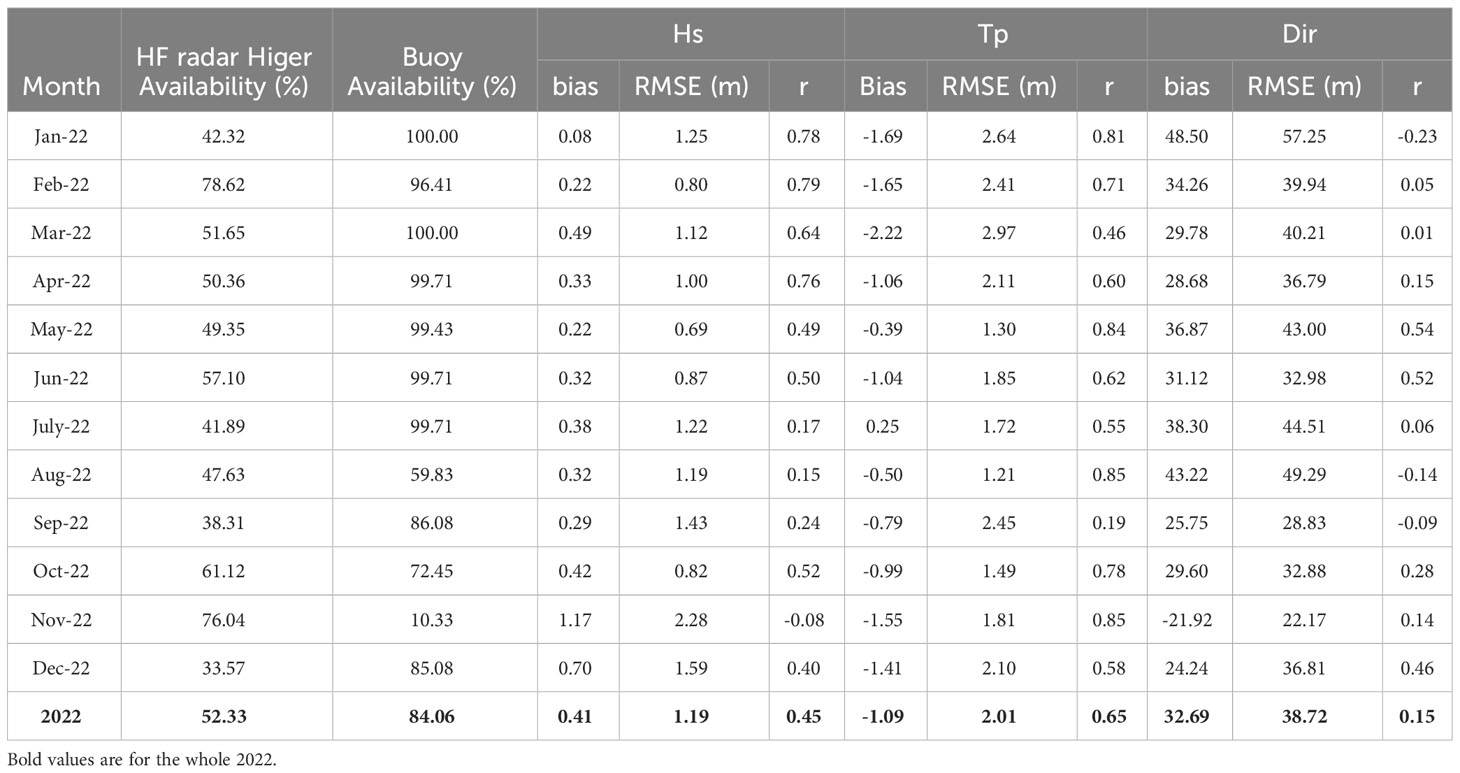
Table 4 Data availability and statistical comparison of Hs>1.5m values for Bilbao-Vizcaya buoy and Higer HF radar station, during 2022.
In the comparison of Tp, r values vary between 0.34-0.90. Conversely, Wdir comparisons show lower r values (0.07-0.4) than these found for Hs and Tp, with very low minimum values in some months (e.g. February, June, August and November).
Similarly, Higer HF radar station and Bilbao-Vizcaya buoy comparison (Table 4) also shows r values up to 0.78 for Hs and up to 0.85 for Tp. However, certain months present lower Hs r values, as November, when very low buoy data availability existed, or July when there was low HF radar data availability. Wdir comparison shows again low minimum values, as observed in Matxitxako HF station.
Noise significantly affects both data availability and quality. For 2020-2022, monthly data availability values were plotted for all-day, night-time (6 p.m. to 6 a.m.), and day-time (6 a.m. to 6 p.m.) periods (Figure 3). Clear differences are observed between day-time and night-time (Figure 3) for the two HF radar stations. Data availability ranged between 20% and 60%, reaching up to 80% by the end of 2021. Day-time data availability ranges around 30-40% while night-time data availability oscillates between 10% and 20%. Please note that lower data availability observed in 2020 and 2021, compared to 2022, is partially related to system failures.
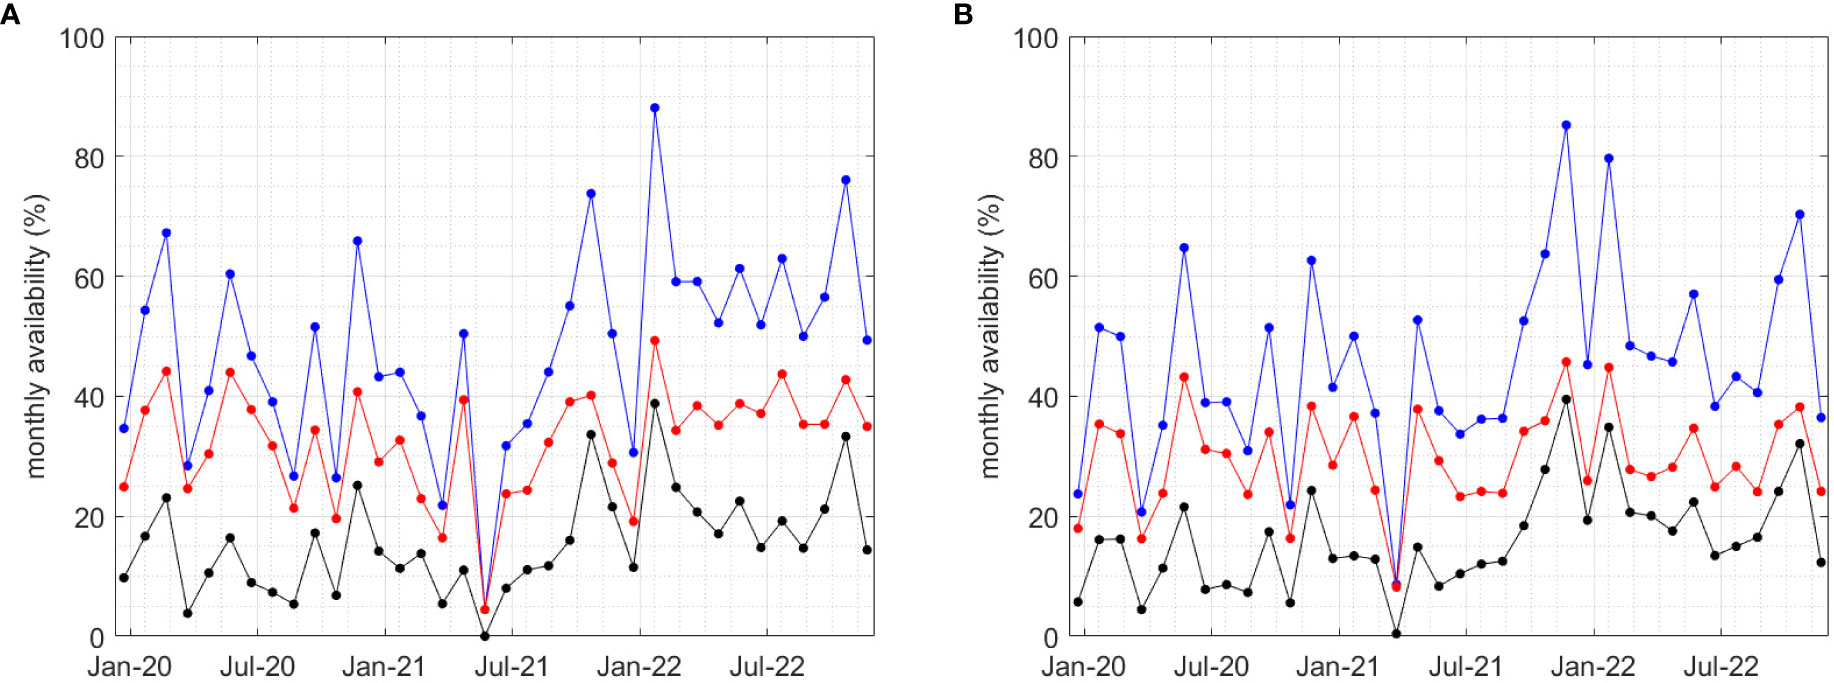
Figure 3 Day-time (6 a.m. to 6 p.m., red line) and night-time (6 p.m. to 6 a.m., black line) monthly data availability % from (A) Matxitxako HF radar station and (B) Higer HF radar station, for 2020-2022. Blue line represents the whole data availability %.
SNR from the 3 loops reported by each antenna were plotted (not shown) to understand the relation of the data availability and noise. Daily noise level fluctuations were observed in the two HF radar antennas, ranging from 0 to 70, with higher SNR during day-time and lower SNR during night-time. The 3 loops mean SNR for day-time was 47 (41) and night-time 37 (35) for Matxitxako and Higer HF radar stations respectively, showing 11-21% lower SNR during night-time periods than day-time periods. Moreover, results show that there is no wave data availability for SNR values below 30 for Matxitxako and Higer radar stations. Approximately 20% of the night-time periods, SNR is below 30 in both HF radar stations, explaining the data availability decrease observed in Figure 3. Only 5% of the time SNR are below this threshold during day-time periods.
Hs correlations between the HF radar stations depending on SNR intervals were computed for the whole 2022 year (Table 5). No correlation decrease is observed for SNR over 40 values in Matxitxako and Higer HF radar stations (r values around 0.62 to 0.92). Low correlation values are observed for data with SNR between 30-40 in Matxitxako and Higer HF radar stations. Although wave data with SNR below the previous threshold only represent around 10% of the whole extracted wave data, those results suggest not only wave data availability decrease during noisy periods but also a small reduction in data quality related to the lowest SNR values.
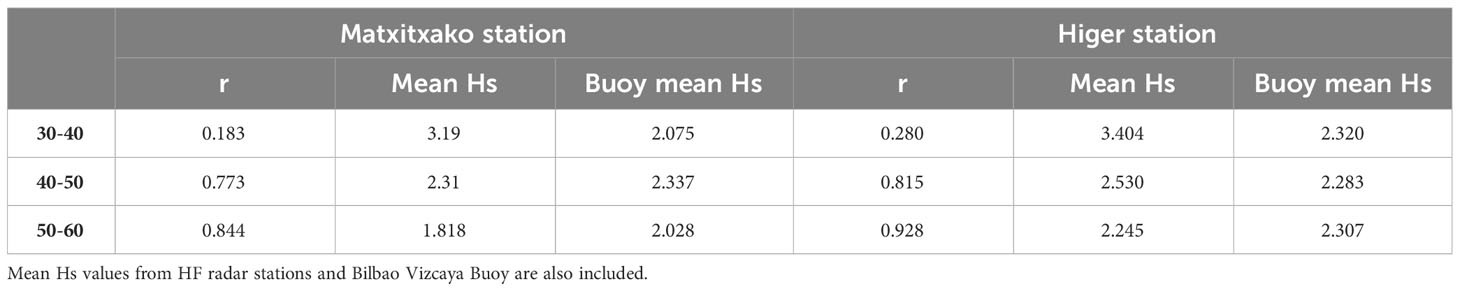
Table 5 Correlation values between Bilbao Vizcaya Buoy and Matxitxako and Higer HF radar stations, for different SNR levels in 2022.
For intense noise periods, when data retrieval becomes not possible (occurring 20% of the night-time periods), the interferences in the received signal are easily visible in the spectra from the HF radar stations and the patterns generated by the reflection of the emitted signal become difficult to identify. Spectra from CODAR HF radar contain three individual spectra, from two antennas and a monopole used for the detection of the incoming angle of the received signal (Kohut and Glenn, 2003) (see examples in Figures 4, 5). Each spectrum contains two main peak pairs (first and second order) in both left and right side of the spectra, used for surface currents and wave information retrieval, respectively (see Barrick, 1977). Visual inspection of the spectra during systematically noisy and low noise periods, identified by Figures 4, 5, showcase how high noise levels prevent the correct detection of the second order peaks, which contain the wave information. Figures 4, 5 show examples of the day-time (clean) spectra on February 11, 2022, and nighttime (noisy) spectra on February 10, 2022, respectively. The right side second order peaks are clearly identified in Figure 4 (short light-blue peaks at the right side of the right first order green peak) while the second order peaks are shadowed by the interference noise in Figure 5 (just first order peaks are identified, both in the left and right sides of the spectra). In both cases, the first order peaks are clearly identified showing that the current measurement, inferred from a much stronger signal in the spectra, is not affected by the interference noise.
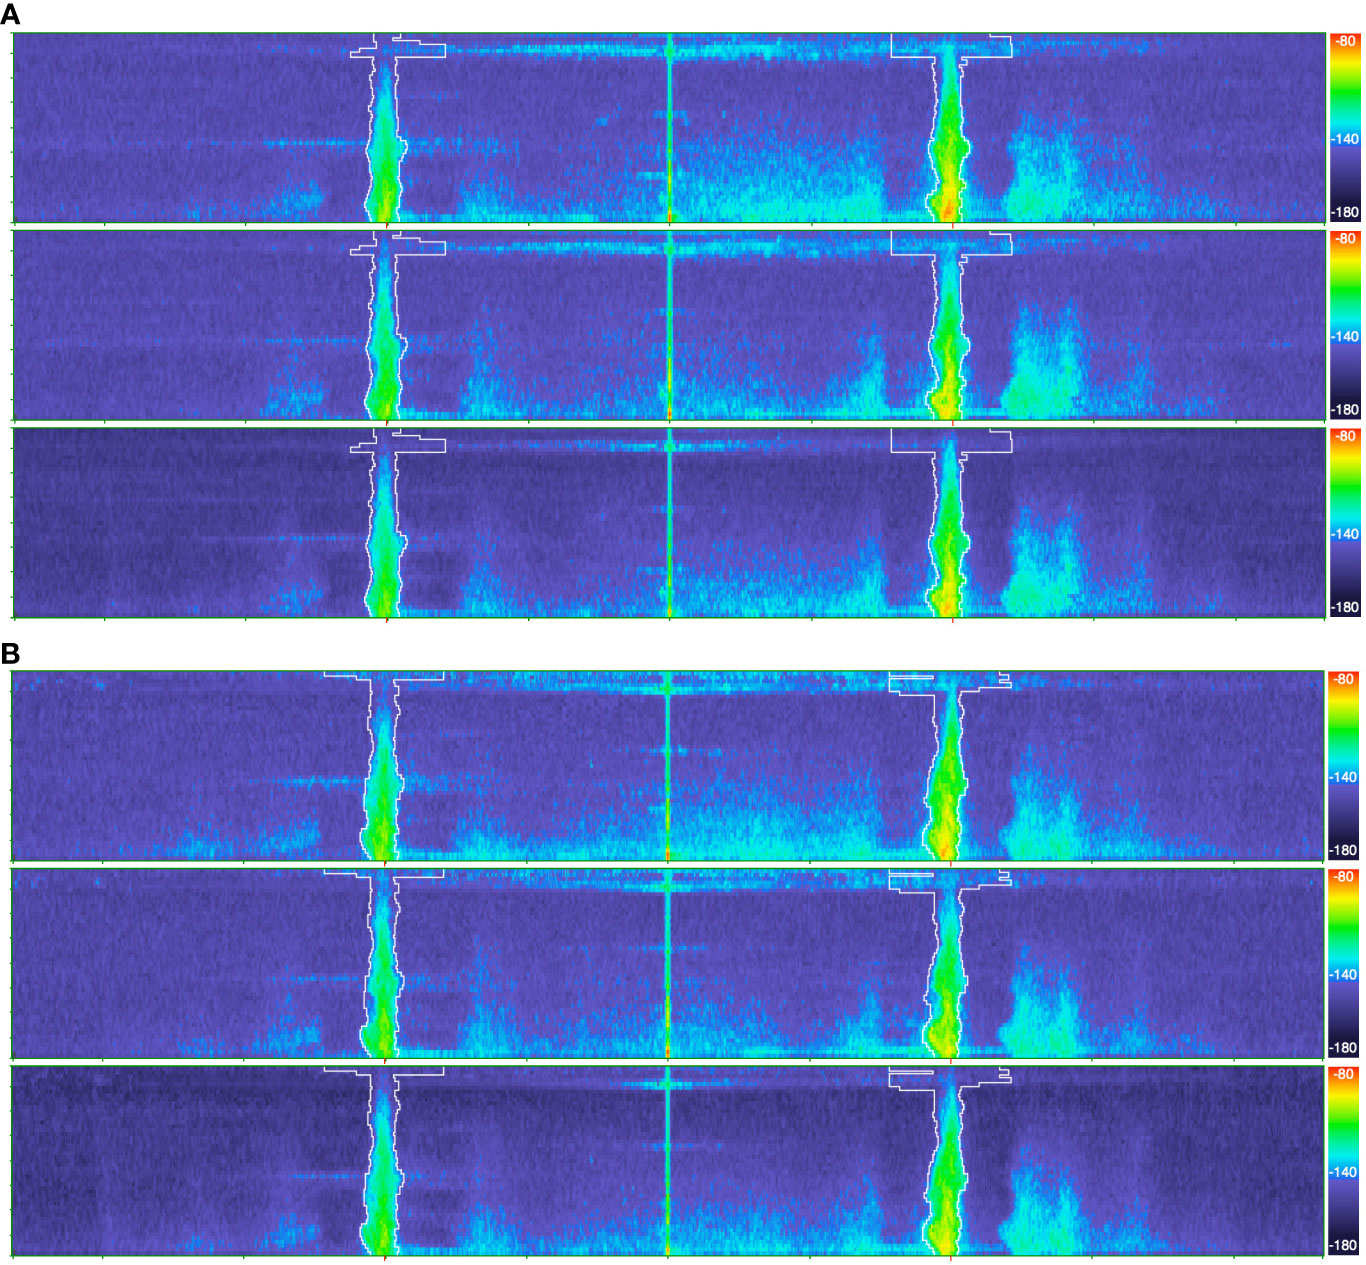
Figure 4 Day-time (6 a.m. to 6 p.m.) spectra maps from Matxitxako HF radar station at 12:00 (A) and 15:30 (B), in February 11, 2022. Lower spectra on each (A, B) subplot, is from Loop 1, the middle spectra from Loop 2 and to upper spectra is from the Monopole antenna. Y axes show the range from 0-250 km.
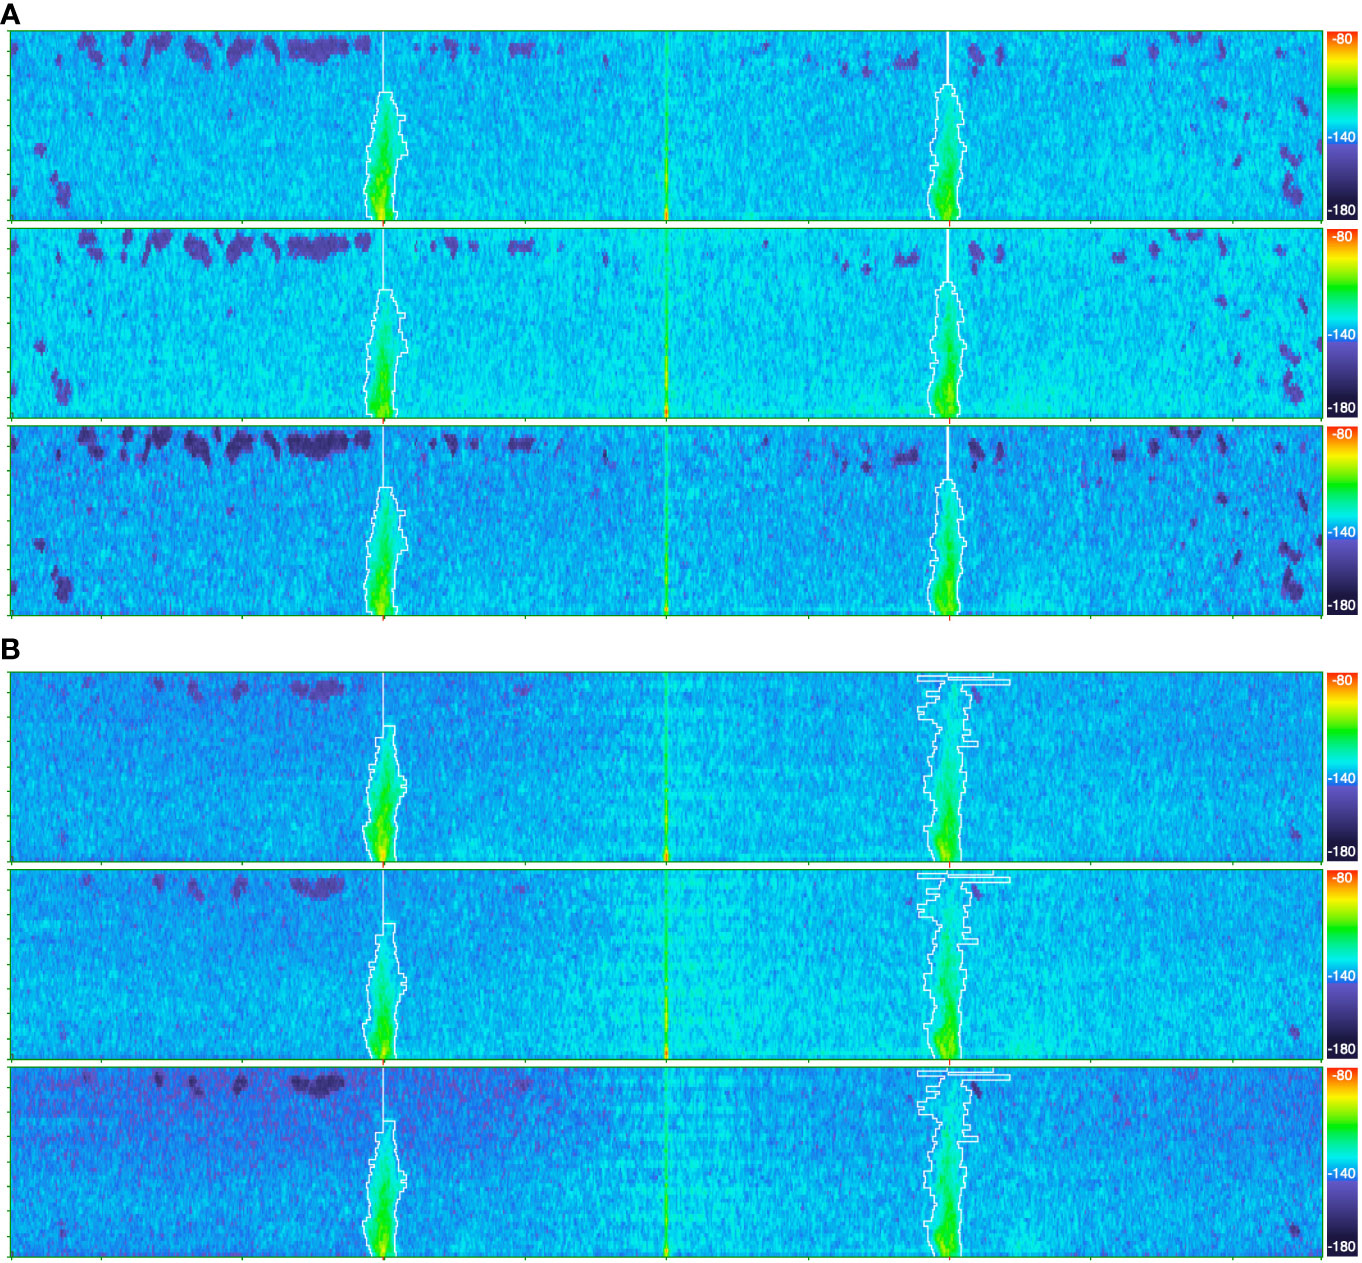
Figure 5 Night-time (6 p.m. to 6 a.m.) spectra maps from Matxitxako HF radar station (A) at 23:00 on February 10, 2022, and (B) at 02:00 on February 11, 2022. Lower spectra on each (A, B) subplot, is from Loop 1, the middle spectra from Loop 2 and to upper spectra is from the Monopole antenna. Y axes show the range from 0-250 km.
Bias, RMSE and r values have been calculated for Hs, Tp and Wdir, for 8 wind sectors of 45°, to investigate possible differences for different wind directions (Table 6). Results for 2022 show Hs correlation values around 0.80 for Matxitxako HF radar station and around 0.7 for Higer HF radar station and similar results are obtained for Tp. Overall, small but not significant differences are observed for the different wind sections.
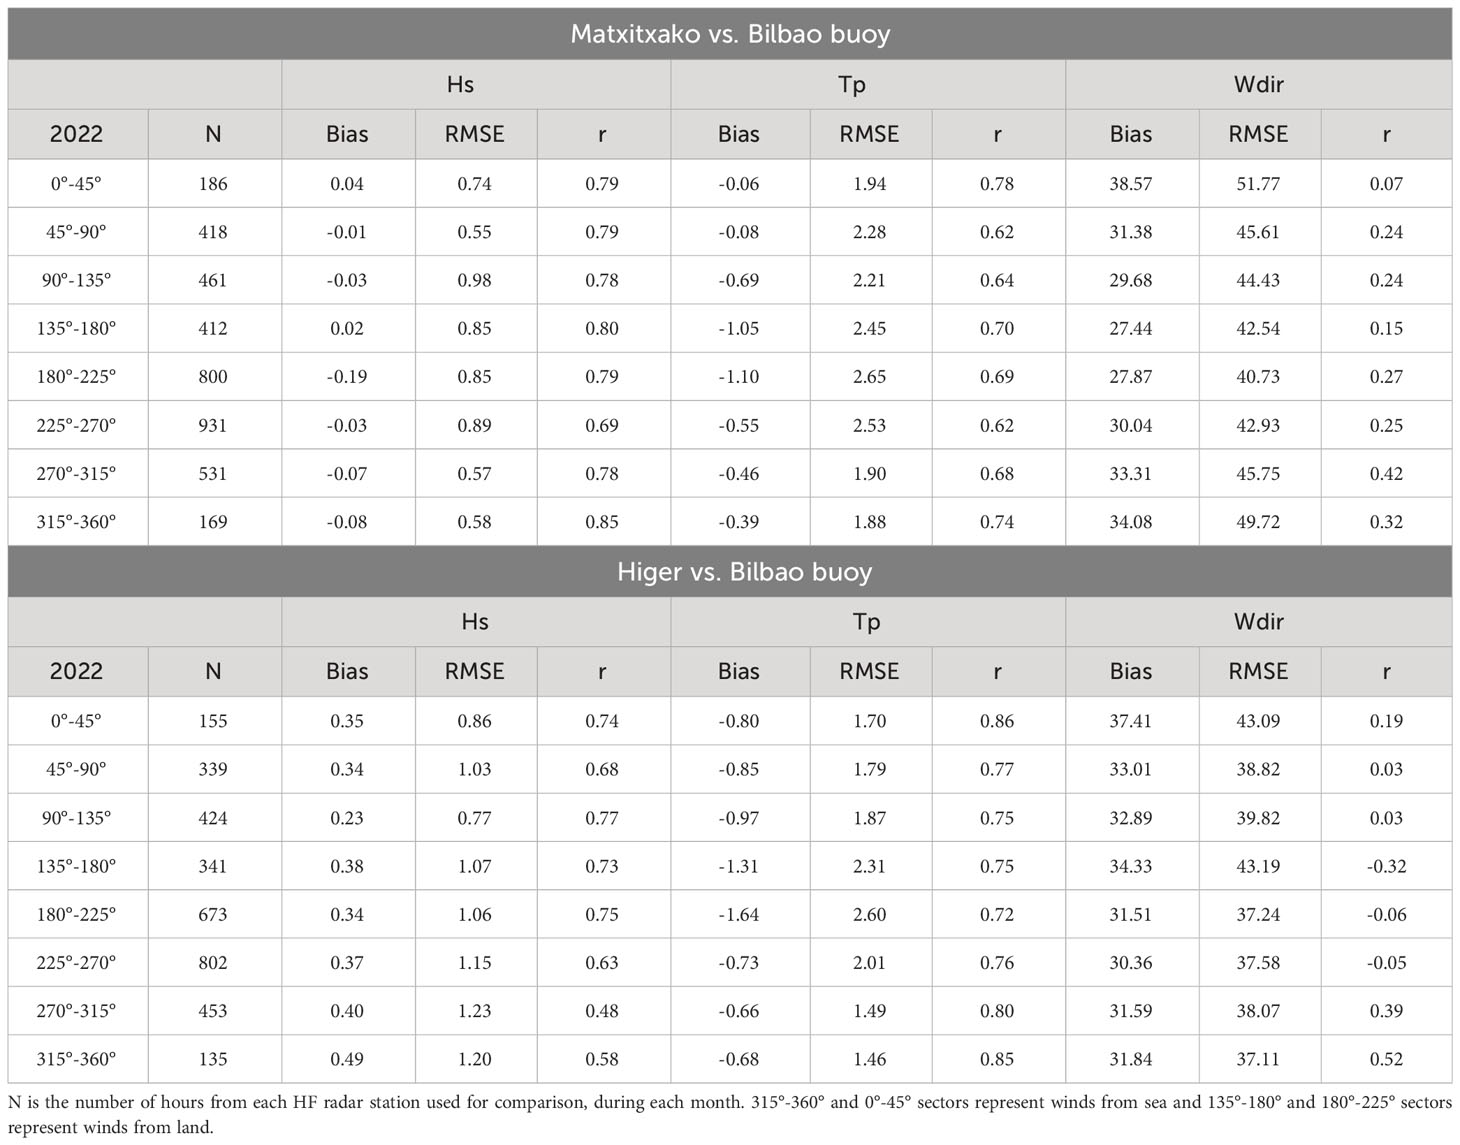
Table 6 Bias, RMSE and correlation (r) values of Hs, Tp and Wdir for Matxitxako and Higer HF radar stations and Bilbao Vizcaya Buoy, for 2022.
It is known that HF radar and in-situ wave data measurements often reveal significant discrepancies under specific wind conditions, although no significant differences have been identified in Table 6 for specific angles. To delve deeper into this investigation, monthly plots of wave height from Matxitxako HF radar station and Bilbao-Vizcaya buoy, together with wind direction from Matxitxako HF radar station vs. Matxitxako meteorological station have been plotted to analyze the differences observed under specific different wind conditions. Examples from March 2021 in Figure 6 (northward winds and waves in same direction) and from February 2021 in Figure 7 (southward winds and waves in opposite directions), were examined to elucidate these differences.
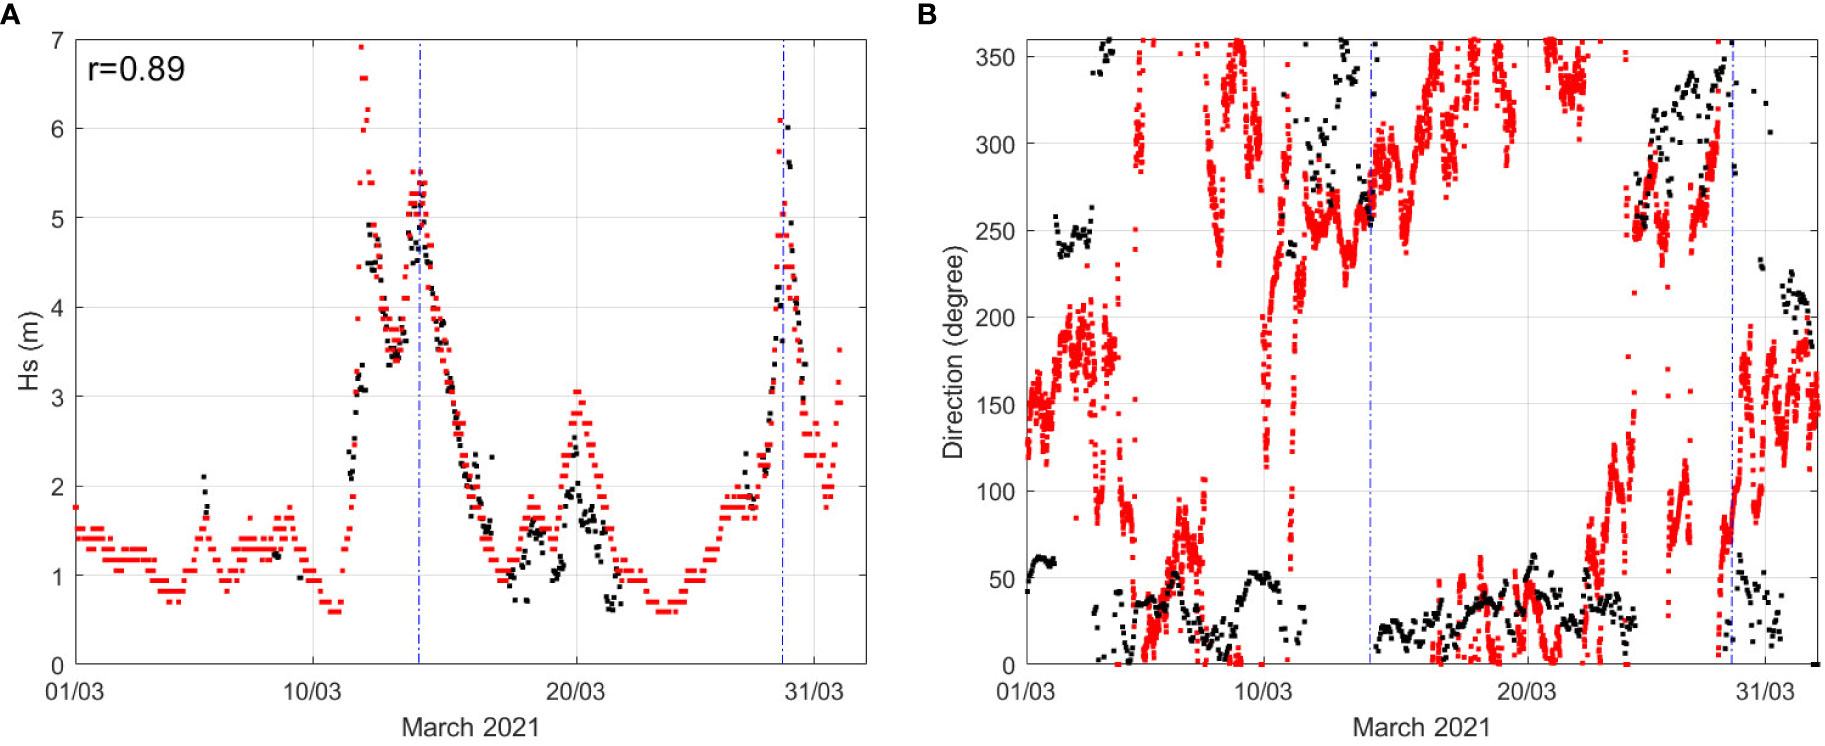
Figure 6 (A) Wave height from Matxitxako HF radar station (black dots) and Bilbao-Vizcaya buoy (red dots) and (B) wind direction from Matxitxako HF radar station (black dots) and Matxitxako meteorological station (red dots) in March 2021. Blue dashed lines mark March 14 and March 28 events.
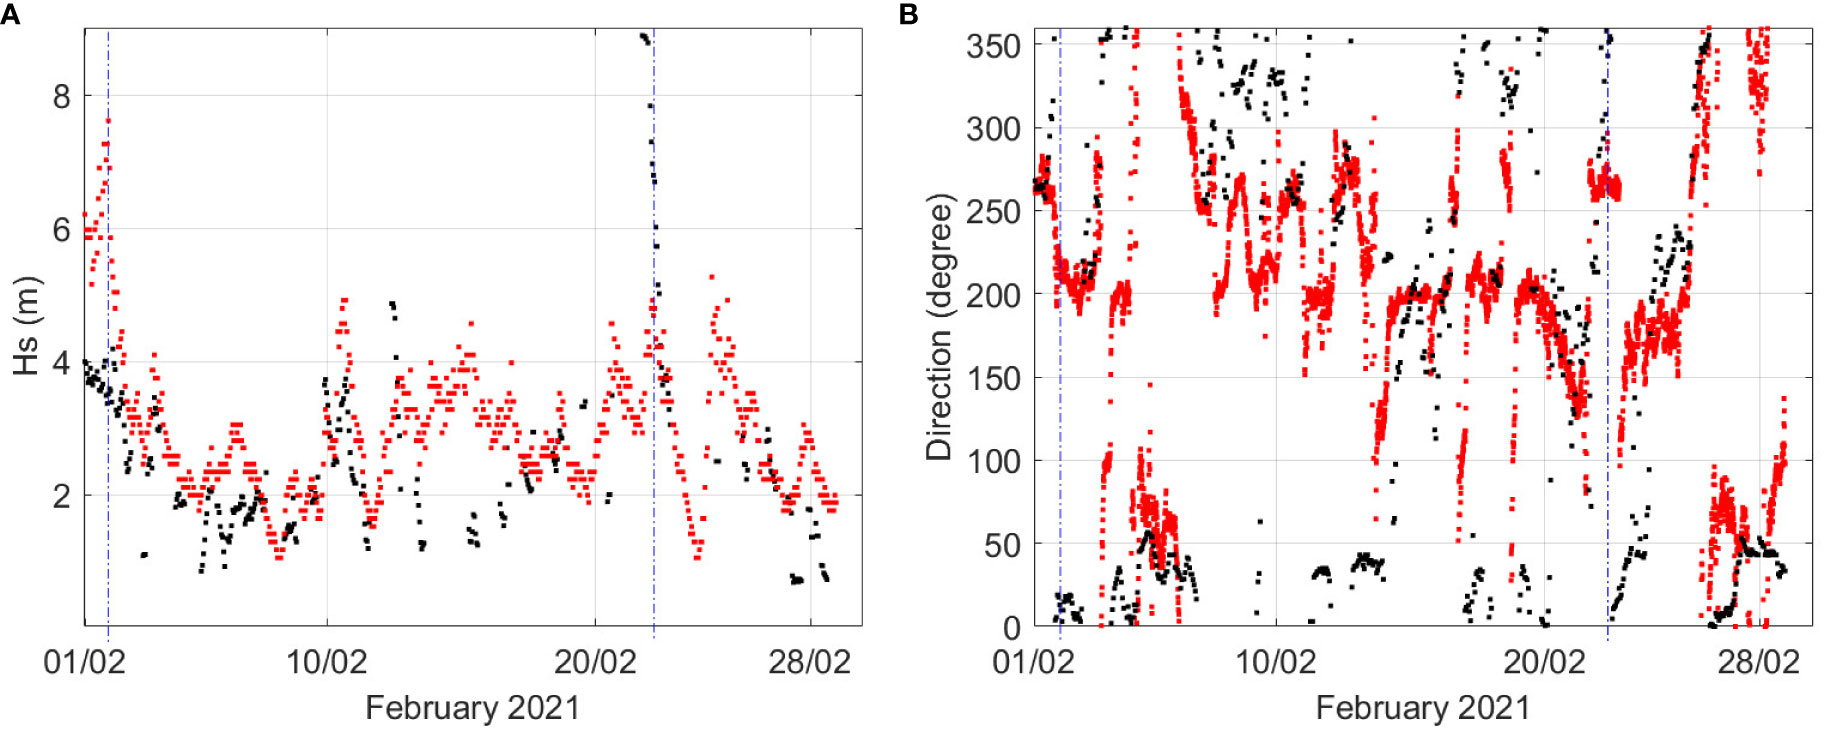
Figure 7 (A) Wave height from Matxitxako HF radar station (black dots) and Bilbao-Vizcaya buoy (red dots) and (B) wind direction from Matxitxako HF radar station (black dots) and Matxitxako meteorological station (red dots) in February 2021. Blue dashed lines mark February 2nd and 22nd events.
Figure 6 shows Hs and wind direction recorded during March 2021. Wave events with Hs>=5m occurred on March 14 and 27 (indicated with dashed blue vertical lines in Figure 6). These occurrences coincided with predominant northern winds measured by the Matxitxako meteorological station and by the Matxitxako HF radar station. Figure 6A shows similar Hs measurements from HF radar Matxitxako station and Bilbao-Vizcaya buoy on those two days, when both wave and wind direction had the same main direction.
Figure 7 shows Hs and wind direction during February 2021. Hs discrepancies are observed for example in Figure 7A on February 2nd and 22nd (blue dashed vertical lines), between Matxitxako HF radar and the Bilbao Vizcaya buoy. Similar situations have been observed in other (not shown) months and they are related systematically to periods when different wind conditions are measured by the HF radar and the coastal Matxitxako meteorological station. In these situations, wind conditions are spatially not uniform along the HF radar measuring area and results suggest this has a direct effect on the estimation of Hs.
The analysis of the HF radar capability in identifying extreme events was made by comparing Hs, Tp, and Wdir for both Matxitxako and Higer HF radar stations and Bilbao-Vizcaya buoy through 2021 and 2022 (see examples for February 2022 in Figures 8, 9). Monthly graphics indicate that as expected, the extreme events occur predominantly from November to March (figures not shown).
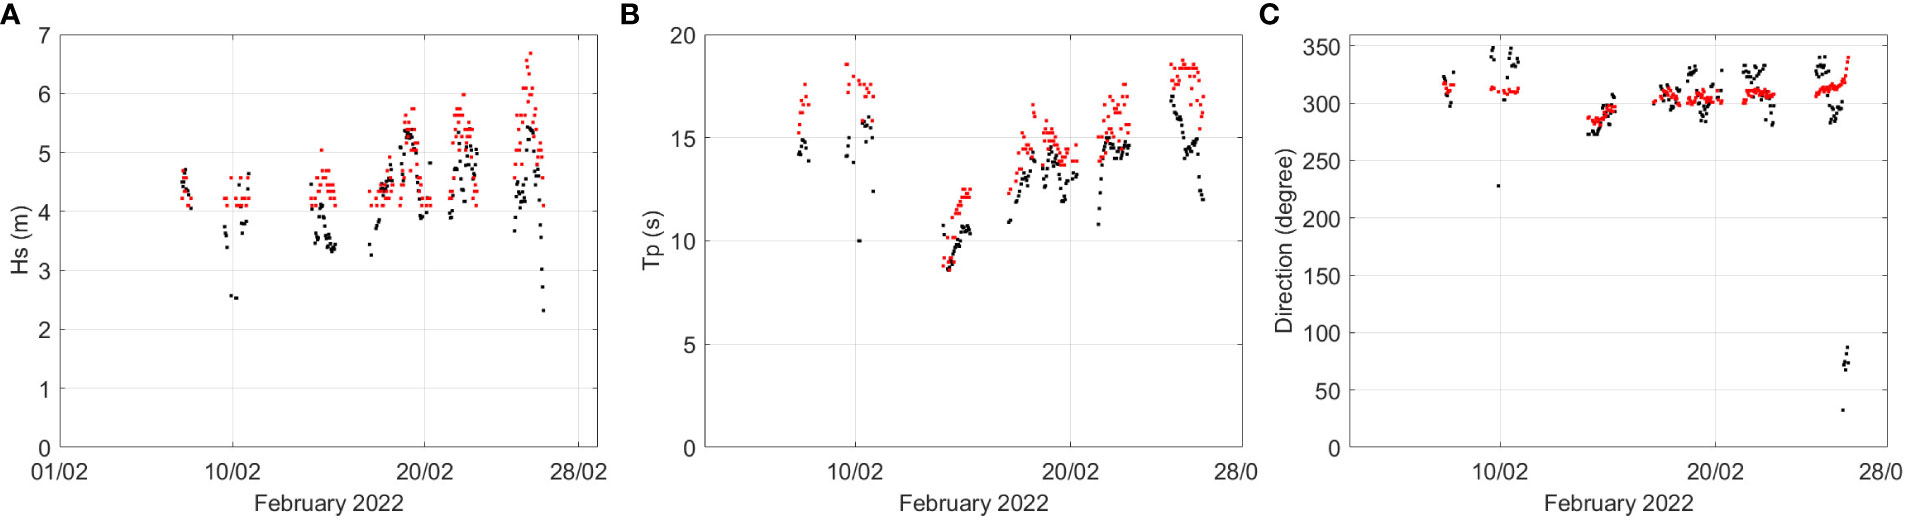
Figure 8 (A) Hs, (B) Tp and (C) Wdir during extreme events (Hs> 4m) from Bilbao-Vizcaya buoy (red dots) and Matxitxako HF radar station (black dots) for February 2022.
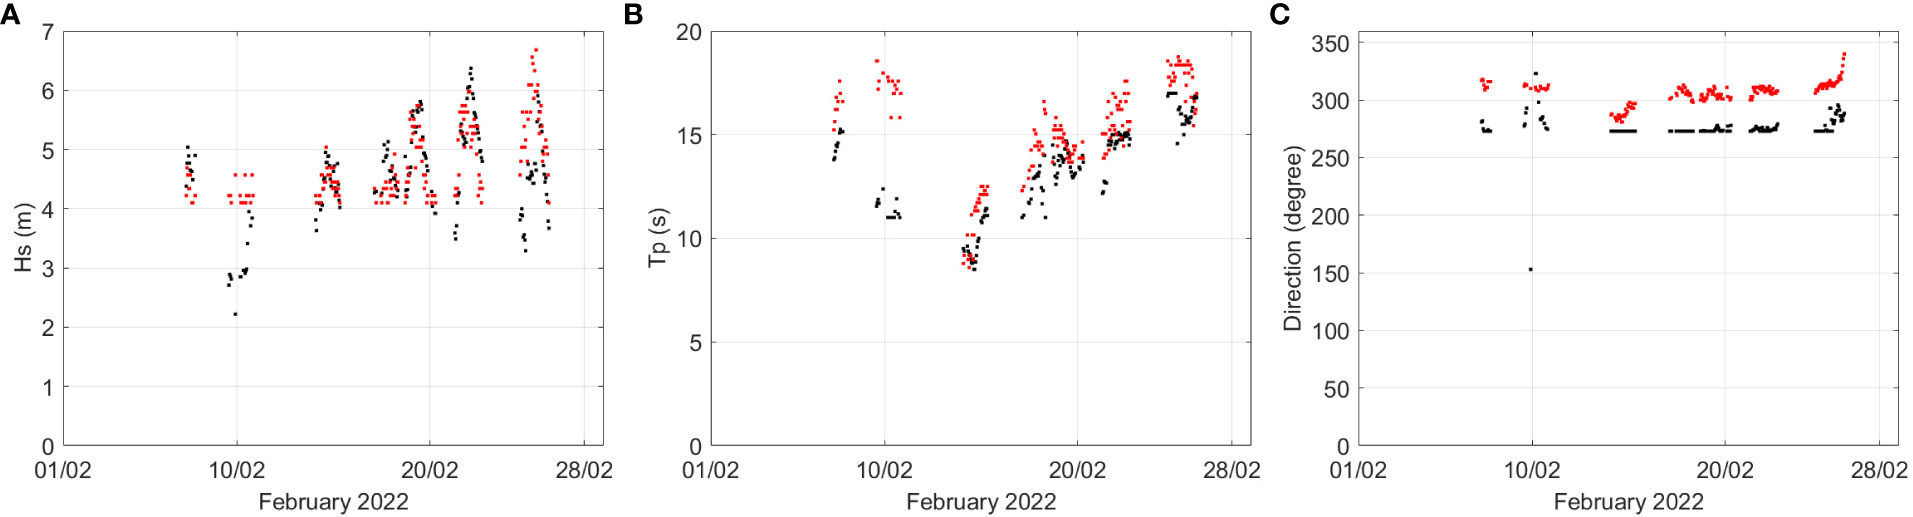
Figure 9 (A) Hs, (B) Tp and (C) Wdir during extreme events (Hs> 4m) from Bilbao-Vizcaya buoy (red dots) and Higer HF radar station (black dots) for February 2022.
Throughout 2021 and 2022, the Matxitxako HF radar station identified a total of 21 extreme events. The Hs exceeded 8 m for one of these events (February 2021), 6 m during seven events and the remaining events exceed 4m. The Wdir ranged between 270° and 350° being the most frequent around 300°. The Tp ranged between 10 and 18 seconds, which is consistent with the extreme events that reach the Basque coast from the North Atlantic Ocean. Higer HF radar station identified the same extreme events as in Matxitxako HF radar station, showing lower Wdir variability in Higer HF radar station than in Matxitxako HF radar station and Bilbao-Vizcaya buoy.
HF radars play a crucial role in the coastal ocean by offering synoptic current and wave measurements across extensive areas in near real-time. Integration of these measurements into numerical models has the potential to greatly improve the accuracy of coastal forecasts. Currently, HF radars are integral components of numerous European Coastal Observatories, opening the possibility of widespread distribution of wave data (alongside coastal surface currents) through various channels in Europe, including Copernicus Marine Services. Furthermore, they have the potential to serve as a reliable complement to traditional wave monitoring systems such as buoys and satellites, enhancing the overall wave monitoring capabilities. Despite the utilization of HF radar wave data spanning several decades, its operational availability for complementing traditional wave datasets remains restricted due to a range of limitations for the operational retrieval of accurate measurement, especially for compact HF radar systems. It is imperative to acquire a deeper comprehension of these limitations, which are closely linked to geographical, physical, and environmental conditions specific to each compact HF radar installation. The analysis conducted here has contributed to this direction by shedding light on the impact of wind and noise levels on the reliability of wave measurements over a span of several years.
Comparisons conducted in 2022 between Matxitxako and Higer HF radar stations and the Bilbao-Vizcaya buoy reveal monthly mean values of r, up to 0.83 and RMSE mean values below 1m for Hs comparison. However, this performance decreases significantly in periods when the HF radar data availability is lower (e.g. January 2022) and in periods of unfavorable wind and noise conditions. Those values align with previous studies using HF radar for wave retrieval (e.g. Lipa et al., 2014; Atan et al., 2015; Bué et al., 2020). Differences observed between HF radars and the Bilbao-Vizcaya buoy are mainly related to different issues. On the one hand challenges associated to the retrieval of wave data from the spectra of the backscattered signal (limitations for waves with Hs<1.5m related to the operating frequency and lower performance under unfavorable noise conditions). On the other hand, differences associated with the nature of the measurement itself (spatial integration of wave HF radar data and pointwise measurements of the offshore buoy) and the existing spatial variability of the wave field along the RC, where we assume wave spectra homogeneity for compact SeaSonde® HF radars.
The fact that the minimum Hs that can be measured by a radar operating at 4.46 MHz is 1.5m (Lipa and Nyden, 2005) can explain Hs differences measured by the HF radar when compared to the buoy if all Hs ranges are considered (including Hs< 1.5 m, not shown). During low energetic sea states the strength of the second-order spectra can be very weak, and any spurious contributions to the spectrum would have a significant impact on the ability of the processing scheme to retrieve the correct Hs values.
Noise is a critical factor that interferes widely in the availability of data and on its quality. In the case of Matxitxako and Higer both stations suffer high periods of night-time noise. Noisy periods have been identified based on the SNR from the HF radar station, from approximately 6 p.m. to 6 a.m. (night-time) with high noise levels (Figure 5) and low noise levels from 6 a.m. to 6 p.m. (day-time) (Figure 4). This will affect data availability and quality during night-time as seen in section 4.2. Noise is affecting data availability and measuring values but also when interference is very significant, it may directly not retrieve wave information. The origin of this intense interference is still unknown. However, it seems to be local as it does not affect to Galician HF radars (not shown) located in northwestern Spain. We recommend doing further inspection of the data during noisy periods before the data usage for both operational and post-processing purpose of EuskOOS HF radar network.
Tp, and Wdir r values span between 0.34-0.85 and 0.04-0.54, respectively. The lower r values observed for Tp and Wdir can be related to the contribution of the errors associated with the definition of the dominant characteristics of the waves during bimodal sea states. In these situations, big errors are common when comparing different datasets (Cahill and Lewis, 2014) and the differences in the methodology used in this study between the two measuring systems can increase the discrepancies. Consequently, the values of direction measured by the buoy and the HF radar should be seen as a whole, ensuring that both, compact HF radar stations and Bilbao-Vizcaya buoy measure on the same range of Wdir values. This is the case for this study, where HF radar stations and buoy present values between 250° - 360° (Figures 8C, 9C).
Hs, Tp and Wdir values present also differences between both HF radar stations (Matxitxako and Higer). These differences are related to: (i) the measuring location of Bilbao Vizcaya buoy and the covering area of the RCs from Matxitxako (closer) and Higer (no overlapping area) stations; (ii) both HF radar stations are measuring slightly different wave conditions, as they are set up in different coastal locations. In fact, there is a larger (smaller) bathymetry steepness in Matxitxako (Higer) which may explain the lower (higher) measured wave heights (to be further investigated); and (iii) they are under environmental (noise and wind) conditions that can present spatial variability.
Spatial heterogeneity in wind conditions can also generate differences between HF radar and in-situ measurements. Results in section 4.3 show that there are no significant differences for different wind direction sections when spatially homogeneous winds affect the study area. It has also been shown how wind can affect the HF radar measurements and originate significant differences in the Hs estimation, when comparing the two measuring systems in presence of local non-homogeneous wind conditions. The area monitored by Matxitxako and Higer HF radar stations can reach ~50 km in length and ~25 km wide. Results suggest that Matxitxako HF radar station is highly influenced by local winds from land due to its geographical position. We have noted that swell and wind-waves with opposite directions (influence of local wind), can interfere in data quality. This should be taken into consideration in other SeaSonde® HF radar networks too, when local winds (not covering the whole HF radar footprint) are present. Depending on the direction and intensity, wave local conditions could spatially vary, and this variability can be as high as the variability of the wind direction and intensity. Since compact SeaSonde® HF radar stations will always measure the most energetic signal, either from swell or wind-waves, in bi-modal seas, swell conditions can be missed by the radar in case of an intense wind-wave field. The buoy will measure the full wave movement, whether it is swell or wind-waves or both mixed. If the buoy is quite far from the HF radar station, this difference can be more noticeable. The discrepancies found in this work between HF radar and buoy measurements do not demonstrate unavailability or malfunctioning of any of these instruments, but the consequence of the different nature of the measurements made by them. This highlights the importance of understanding the physical processes behind the measured variability. We recommend analyzing the performance of the HF radar system under different wind conditions. Further analysis is required to understand the mechanism under the underestimation or overestimation of Hs from the analyzed HF radar observed in spatially non-uniform wind conditions. The influence of the fetch and wind duration have not been analyzed in this work because due to the geographical location and configuration of the study area, waves may only be limited by fetch or wind duration during marginal time periods. But those factors should be considered and analyzed in other areas with different geographical configurations.
Monthly analysis of the extreme events for 2021-2022 (section 4.4) shows that the extreme events from HF radar occur during winter months, mainly February, March, and April, also observed by the Bilbao-Vizcaya buoy and as previously described in the study area (Gonzalez et al., 2004). The fact that both Matxitxako and Higer HF radar stations identify previously known extreme events features, together with the good agreement with the Bilbao-Vizcaya buoy suggest that EuskOOS HF radar network is capable of measuring sea states during extreme events. This is especially interesting as extreme event periods are when in-situ instruments usually suffer technical problems, being at the same time less accessible, which leads to longer periods with no data. Further work should include the analysis of the whole available wave time series from the EuskOOS HF radar data for the characterization of changes in the extreme wave regime and its variability. In the EuskOOS HF radar network, sea states with Hs<1.5m occur commonly in the study area (according to the Bilbao-Vizcaya buoy), this in turn limits the use of the HF radar for the characterization of less energetic sea states.
The analysis of the EuskOOS HF radar network capabilities for wave data retrieval under different conditions conducted in this paper allowed us to extract some key points to be taken into consideration for more accurate wave retrieval from HF radars:
- HF radar measurements performance for low/high Hs waves depend on their operating frequency and should be taken with caution during the QC process. For this reason, we recommend checking the limitations of the HF radar configuration to find the min/max Hs limits of the operating frequency and comparing these values with the Hs range values expected in the study area.
- An interference and noise analysis in the frequency range of operation of the HF radar in the study area should be done if wave data from the HF radar want to be exploited. The best scenario will be to analyze the noise levels prior to the installation of any new system, to avoid interferences that could make wave data retrieval impossible. Note that the origin of the interferences can be environmental or human source, and as shown in this contribution it can be strongly variable with time. For the installed HF radar scenarios, SNR should be analyzed to quantify and understand the existence of noise in each HF radar station and its affection to data quality and availability.
- Wind affects waves, and local wind spatial variability can create differences in the data retrieval from different measuring systems, such as buoys and HF radars. A deep analysis of local wind effects on the wave field is recommended prior to the analysis of HF radar wave data against in-situ measurements.
The combination of all the previous conditions should enhance the reliability and performance for the wave’s retrieval from SeaSonde® HF radars and optimize the installation and maintenance of new HF radars for wave retrieval during specific wave/wind/noise conditions.
An assessment of the wave measurement capabilities of the EuskOOS HF radar network has been conducted, identifying the key variables that need to be considered when determining reliable operational periods. Statistical validation and comparison analysis of the HF radar performance for wave measurement versus in-situ data (from the Bilbao-Vizcaya buoy) have demonstrated the performances of the HF Radars for the characterization of seasonal variability of the Hs and Tp (with much lower performances for Wdir) in the SE Bay of Biscay; with values in agreement to independent in-situ data and those that can be found in the literature about compact HF radar systems. The best correlations are obtained for homogeneous wind and favorable noise conditions. Matxitxako and Higer HF radar stations showed as well good performance for the identification of extreme events, also identified (with similar Hs and frequency) by the in-situ buoy, which reveals the advantage of this technology comparing to the problems and data availability decrease of in-situ instruments during such extreme events. The measurements in Matxitxako and Higer HF radar stations also accounted for the spatial variability of the wave field in the area. Noise influence on the quality of waves retrieval of the EuskOOS HF radar network was also analyzed. High interference and noise detected during night-time were observed to significantly reduce the availability and (to a lesser extent) the reliability of the wave data. The importance of wind on the HF radar measurements was also highlighted, as the wind directly affects the waves and their characteristics and can explain differences observed between in-situ and radar measurements for SeaSonde® HF radars. Gaining a comprehensive understanding of the limitations associated with accurate retrieval of wave data from HF radars, including factors related to geographical, physical, and environmental conditions, is crucial for enhancing their reliability. This understanding enables informed decisions regarding the optimal location and configuration of new and existing radar installations, ultimately boosting their operational availability for effectively complementing standard wave data measurements.
Finally, this analysis and the obtained conclusions will be useful for the historical wave data analysis (2009-nowadays) in the study area. The analysis of the evolution of extreme events will specially be interesting to see the increase of the extreme events, both in magnitude and frequency, that is happening not only in the Bay of Biscay but also worldwide.
The original contributions presented in the study are included in the article/supplementary materials, further inquiries can be directed to the corresponding author/s.
LS worked on the setup of the methodology, data and results analysis, paper writing and final submission. MarF worked on the setup of the methodology, data analysis and paper writing. IR worked on the results analysis, figures creation and paper writing. MacF worked on the setup of the methodology, data analysis and paper writing. PL worked on the results analysis and paper writing. IS worked on the results analysis and paper writing. JS worked on the setup of the methodology and data analysis. JA worked on the results analysis. AR worked on the setup of the methodology, data and results analysis and paper writing. All authors contributed to the article and approved the submitted version.
The author(s) declare financial support was received for the research, authorship, and/or publication of this article. This research has been partially funded by the PI-BREAK project, through the Grant PLEC2021-007810 funded by MCIN(AEI)10.13039/501100011033 and, by European Union NextGenerationEU/PRTR. This research has also been partially funded through the EU’s H2020 Program JERICO-S3 project (grant agreement no. 871153) and the project LAMARCA (PID2021-123352OB-C33) funded by MICIN/AEI /10.13039/501100011033/ and by FEDER (UE).
We thank the Emergencies and Meteorology Directorate (Security department) of the Basque Government for public data provision from the Basque operational Oceanography System EuskOOS. This research was partially carried out under the framework of KOSTARISK, Cross-Border Laboratory for Coastal Risk Research. The joint laboratory KOSTARISK is supported by E2S UPPA, the AZTI Foundation and the center Rivages Pro Tech of SUEZ. This paper is contribution nº 1163 from AZTI, Marine Research, Basque Research and Technology Alliance (BRTA).
Authors MarF, MacF, and JS are employed by the company Qualitas Instruments S.A.
The remaining authors declare that the research was conducted in the absence of any commercial or financial relationships that could be construed as a potential conflict of interest.
The author AR declared that they were an editorial board member of Frontiers, at the time of submission. This had no impact on the peer review process and the final decision.
All claims expressed in this article are solely those of the authors and do not necessarily represent those of their affiliated organizations, or those of the publisher, the editors and the reviewers. Any product that may be evaluated in this article, or claim that may be made by its manufacturer, is not guaranteed or endorsed by the publisher.
Atan R., Goggins J., Harnett M., Nash S., Agostinho P. (2015). “Assessment of extreme wave height evens in Galway Bay using High Frequency radar (CODAR) data,” in Renewable Energies Offshore (Boca Raton, FL, USA: CRC Press), 49–56.
Barrick D. E. (1977). Extraction of wave parameters from measured HF radar sea-echo Doppler spectra. Radio Sci. 12, 415–424. doi: 10.1029/RS012i003p00415
Barrick D. E., Evans M. W., Weber B. L. (1977). Ocean surface currents mapped by radar. Science 198, 138–144. doi: 10.1126/science.198.4313.138
Basañez A., Lorente P., Montero P., Álvarez-Fanjul E., Pérez-Muñuzuri V. (2020). Quality assessment and practical interpretation of the wave parameters estimated by HF radars in NW Spain. Remote Sens. 12, 598. doi: 10.3390/rs12040598
Borja A., Amouroux D., Anschutz P., Gómez-Gesteira M., Uyarra M. C., Valdés L. (2019). Chapter 5 - The Bay of Biscay, World Seas: an Environmental Evaluation. 2nd ed. (Academic Press), 113–152, ISBN 9780128050682. doi: 10.1016/B978-0-12-805068-2.00006-1
Bué I., Semedo Á., Catalão J. (2020). Evaluation of HF radar wave measurements in Iberian Peninsula by comparison with satellite altimetry and in situ wave buoy observations. Remote Sens. 12 (21), 3623. doi: 10.3390/rs12213623
Cahill B., Lewis T. (2014). “Wave period ratios and the calculation of wave power,” in Proceedings of the 2nd Marine Energy Technology Symposium, METS 2014, Seattle, WA, USA, 15–18 April.
Castelle B., Dodet G., Masselink G., Scott T. (2018). Increased winter-mean wave height, variability, and periodicity in the Northeast Atlantic over 1949–2017. Geophysical Res. Lett. 45, 3586–3596. doi: 10.1002/2017GL076884
Ferrer L., Liria P., Bolaños R., Balseiro C., Carracedo P., González-Marco D., et al. (2010). Reliability of coupled meteorological and wave models to estimate wave energy resource in the Bay of Biscay. In Proc. 3rd Int. Conf. Ocean Energy (ICOE), 6 october, Bilbao.
Gaztelumendi S., Egaña J., Liria P., Aranda J. A. (2018). Description of a coastal impact event in Basque Country: the 9 February 2016 case. Adv. Sci. Res. 15, 137–143. doi: 10.5194/asr-15-137-2018
Gonzalez M., Uriarte A., Fontan A., Mader J., Gyssels P. (2004). “Chapter 6: marine dynamics,” in Oceanography and Marine Environment of the Basque Country, vol. 70 . Eds. Borja A., Collins M. (Amsterdam: Elsevier Oceanography Series), 133–158.
Gorman R. (2018). “Extreme wave indices for New Zealand coastal and oceanic waters updated to 2017,” in Prepared for the Ministry for the Environment. NIWA Client Report No: 2018325HN.
Green J. J., Wyatt L. (2006). Row-action inversion of the Barrick–Weber equations. J. Atmos Oceanic Technol. 23, 501–510. doi: 10.1175/JTECH1854.1
Gurgel K.-W., Antonischki G., Essen H.-H., Schlick T. (1999). Wellen radar (WERA), a new ground-wave based HF radar for ocean remote sensing. Coast. Eng. 37, 219–234. doi: 10.1016/S0378-3839(99)00027-7
Gurgel K.-W., Essen H.-H., Schlick T. (2006). An empirical methodto derive ocean waves from second-order Bragg scattering:prospects and limitations. IEEE J. Ocean. Eng. 31, 804–811. doi: 10.1109/JOE.2006.886225
Horstmann J., Corgnati L., Mantovani C., Quentin C., Reyes E., Rubio A., et al. (2019). Report on Best Practice in the implementation and use of new systems in JERICO-RI.. In Part 1: HF-radar systems and Part 2: Cabled coastal observatories. WP2, Deliverable 2.4. Version 1.0. Brest, France, Ifremer for JERICO-NEXT, 141pp. (JERICO-NEXT-W2-D2.4.-07052019-V1.0). doi: 10.25607/OBP-1005
Kohut J. T., Glenn S. M. (2003). Improving HF radar surface current measurements with measured antenna beam patterns. J. Atmospheric Oceanic Technol. 20 (9), 1303–1316. doi: 10.1175/1520-0426(2003)020<1303:IHRSCM>2.0.CO;2
Lavaud L., Bertin X., Martins K., Arnaud G., Bouin M. N. (2020). The contribution of short-wave breaking to storm surges: The case Klaus in the Southern Bay of Biscay. Ocean Model. 156 (January), 101710. doi: 10.1016/j.ocemod.2020.101710
Lavín A., Valdés L., Sánchez F., Abaunza P., Forest A., Bouucher J., et al. (2006). “Chapter 24. The Bay of Biscay: The encountering of the Ocean and the shelf,” in The Sea, Volume 14. Part B. The Global Coastal Ocean: Interdisciplinary Regional Studies and Synthesis. First Edition. Chapter, 24. Eds. Robinson A. R., Brink K. H. Harvard University Press, 933–1001.
Lipa B. (1978). Inversion of second—order radar echoes from the sea. J. Geophys. Res. 83-C2, 959–962. doi: 10.1029/JC083iC02p00959
Lipa B., Barrick D. (1982). “Wave propagation laboratory. Analysis methods for narrow-beam high-frequency Radar Sea Echo,” in Wave propagation laboratory. U.S. Department of Commerce, National Oceanic and Atmospheric Administration, Environmental Research Laboratories. Available at: https://books.google.es/books?id=Lw9UAAAAMAAJ.
Lipa B. J., Barrick D. E. (1986). Extraction of sea state from HF radar sea echo: mathematical theory and modelling. Radio Science 21, 81–100. doi: 10.1029/RS021i001p00081
Lipa B., Barrick D., Alonso-Martirena A., Fernandes M., Ferrer M., Nyden B. (2014). Brahan project high frequency radar ocean measurements: currents, winds, waves and their interactions. Remote Sens 6, 12094–12117. doi: 10.3390/rs61212094
Lipa B., Nyden B. (2005). Directional wave information from the SeaSonde. IEEE Journal of Oceannographic Engineering 30, 221–231. doi: 10.1109/JOE.2004.839929
Lopez G., Conley D. C. (2019). Comparison of HF radar fields of directional wave spectra against in situ measurements at multiple locations. J. Mar. Sci. Eng. 7, 271. doi: 10.3390/jmse7080271
Lopez G., Conley D. C., Greaves D. (2016). Calibration, validation, and analysis of an empirical algorithm for the retrieval of wave spectra from HF radar sea echo. J. Atmos OceanicTechnol 33 (2), 245–261. doi: 10.1175/JTECH-D-15-0159.1
Lorente P., Basañez Mercader A., Piedracoba S., Pérez-Muñuzuri V., Montero P., Sotillo M. G., et al. (2019). Long-term skill assessment of SeaSonde radar-derived wave parameters in the Galician coast (NW Spain). Int. J. Remote Sens. 40 (24), 9208–9236. doi: 10.1080/01431161.2019.1629714
Lorente P., Sotillo M. G., Aouf L., Amo-Baladrón A., Barrera E., Dalphinet A., et al. (2018). Extreme wave height events in NW Spain: A combined multi-sensor and model approach. Remote Sens. 10, 1. doi: 10.3390/rs10010001
Manso-Narvarte I., Caballero A., Rubio A., Dufau C., Birol F. (2018). Joint analysis of coastal altimetry and high-frequency (HF) radar data: Observability of seasonal and mesoscale ocean dynamics in the Bay of Biscay. Ocean Sci. 14, 1265–1281. doi: 10.5194/os-14-1265-2018
Manso-Narvarte I., Fredj E., Jordà G., Berta M., Griffa A., Caballero A., et al. (2020). 3D reconstruction of ocean velocity from high-frequency radar and acoustic Doppler current profiler: A model-based assessment study. Ocean Sci. 16, 575–591. doi: 10.5194/os-16-575-2020
Manso-Narvarte I., Rubio A., Jordà G., Carpenter J., Merckelbach L., Caballero A. (2021). Three-dimensional characterization of a coastal mode-water eddy from multiplatform observations and a data reconstruction method. Remote Sens. 13, 674. doi: 10.3390/rs13040674
Mantovani C., Corgnati L., Horstmann J., Rubio A., Reyes E., Quentin C., et al. (2020). BestPractices on high frequency radarDeployment and operation for oceanCurrent measurement. Front. Mar. Sci. 7. doi: 10.3389/fmars.2020.00210
Masselink G., Castelle B., Scott T., Dodet G., Suanez S., Jackson D., et al. (2016). Extreme wave activity during 2013/2014 winter and morphological impacts along the Atlantic coast of Europe. Geophysical Res. Lett. 43 (5), 2135–2143. doi: 10.1002/2015GL067492
Mundaca-Moraga V., Abarca-del-Rio R., Figueroa D., Morales J. (2021). A preliminary study of wave energy resource using an HF marine radar, application to an eastern Southern Pacific location: advantages and opportunities. Remote Sens. 13, 203. doi: 10.3390/rs13020203
Orasi A., Picone M., Drago A., Capodici F., Gauci A., Nardone G., et al. (2018). HF radar for wind waves measurements in the Malta-Sicily Channel. Measurement 128, 446–454. doi: 10.1016/j.measurement.2018.06.060
Rubio A., Fontán A., Lazure P., González M., Valencia V., Ferrer L., et al. (2013). Seasonal to tidal variability of currents and temperature in waters of the continental slope, southeastern Bay of Biscay. J. Mar. Syst. 109–110, S121–S133. doi: 10.1016/j.jmarsys.2012.01.004
Rubio A., Caballero A., Orfila A., Hernández-Carrasco I., Ferrer L., González M., et al. (2018). Eddy-induced cross-shelf export of high Chl-a coastal waters in the SE Bay of Biscay. Remote Sens. Environ. 205, 290–304. doi: 10.1016/j.rse.2017.10.037
Rubio A., Hernández-Carrasco I., Orfila A., González M., Reyes E., Corgnati L., et al. (2020). A Lagrangian approach to monitor local particle retention conditions in coastal areas, in: Copernicus Marine Service Ocean State Report. J. Operational Oceanography 13:sup1 (4), S1–S172. doi: 10.1080/1755876X.2020.1785097
Rubio A., Manso-Narvarte I., Caballero A., Corgnati L., Mantovani C., Reyes E., et al. (2019). The seasonal intensification of the slope Iberian Poleward Current, in: Copernicus Marine Service Ocean State Report. J. Oper. Oceanogr. 12 (3), 13–18. doi: 10.1080/1755876X.2019.1633075
Rubio A., Reverdin G., Fontán A., González M., Mader J. (2011). Mapping near-inertial variability in the SE Bay of Biscay from HF radar data and two offshore moored buoys. Geophys. Res. Lett. 38, 19. doi: 10.1029/2011GL048783
Ruiz I., Rubio A., Abascal A. J., Basurko O. C. (2022). Modelling floating riverine litter in the south-eastern Bay of Biscay: a regional distribution from a seasonal perspective. Ocean Sci. 18, 1703–1724. doi: 10.5194/os-18-1703-2022
Saviano S., Kalampokis A., Zambianchi E., Uttieri M. (2019). A year-long assessment of wave measurements retrieved from an HF radar network in the Gulf of Naples (Tyrrhenian Sea, Western Mediterranean Sea). J. Oper. Oceanogr. 12, 1–15. doi: 10.1080/1755876X.2019.1565853
Solabarrieta L., del Campo A., Alvarez D., Abalia A., Nieto A., Epelde I., et al. (2022). “Revamping data system and portal in the Basque Operational Oceanography,” in 2022 IEEE International Workshop on Metrology for the Sea; Learning to Measure Sea Health Parameters (MetroSea), Milazzo, Italy. 193–197. doi: 10.1109/MetroSea55331.2022.9950947
Solabarrieta L., Frolov S., Cook M., Paduan J., Rubio A., González M., et al. (2016). Skill assessment of hf radar–derived products for lagrangian simulations in the bay of biscay. J. Atmos. Ocean. Tech. 33, 2585–2597. doi: 10.1175/JTECH-D-16-0045.1
Solabarrieta L., Rubio A., Cárdenas M., Castanedo S., Esnaola G., Méndez F. J., et al. (2015). Probabilistic relationships between wind and surface water circulation patterns in the SE Bay of Biscay. Ocean Dynam. 65, 1289–1303. doi: 10.1007/s10236-015-0871-5
Solabarrieta L., Rubio A., Castanedo S., Medina R., Charria G., Hernández C. (2014). Surface water circulation patterns in the southeastern Bay of Biscay: New evidences from HF radar data. Cont. Shelf Res. 74, 60–76. doi: 10.1016/j.csr.2013.11.022
Wyatt L. R. (2011). “Wave mapping with HF radar,” in IEEE/OES 10th current, waves and turbulence measure-ments (CWTM), Monterey, CA, USA. 25–30, IEEE. doi: 10.1109/CWTM.2011.5759519
Wyatt (2021). “Chapter 6: ocean wave measurements,” in eds. Huang W., Gil E.W. Ocean Remote Sensing Technologies: High frequency, marine and GNSS-based radar. IET Digital Library. 2021. doi: 10.1049/SBRA537E_ch6
Wyatt L. R., Green J. J. (2009). “Measuring high and low waves with HF radar,” in OCEANS 2009-EUROPE. Oceans 09: Balancing technology with future needs, Bremen, Germany, 11-14 May 2009. 1–5. doi: 10.1109/OCEANSE.2009.5278328
Wyatt L. R., Green J. J. (2022). Swell and wind-sea partitioning of HF radar directional spectra. J. Operational Oceanography 17, 28–39. doi: 10.1080/1755876X.2022.2127232
Wyatt L. R., Green J. J. (2023). Developments in scope and availability of HF radar wave measurements and robust evaluation of their accuracy. Remote Sens. 15 (23), 5536. doi: 10.3390/rs15235536
Wyatt L. R., Green J. J., Middleditch A. (2010). HF radar data quality requirements for wave measurement. Coast. Eng. 58 (4), 327–336. doi: 10.1016/j.coastaleng.2010.11.005
Keywords: waves, High Frequency radars, noise, environmental factors, Bay of Biscay, validation, coastal processes
Citation: Solabarrieta L, Fernandes M, Ruiz I, Ferrer M, Liria P, de Santiago I, Sánchez J, Aranda JA and Rubio A (2024) Waves from compact SeaSonde® High Frequency radars in the southeastern Bay of Biscay: measurement performance under different noise and wind conditions. Front. Mar. Sci. 11:1250815. doi: 10.3389/fmars.2024.1250815
Received: 30 June 2023; Accepted: 23 January 2024;
Published: 29 February 2024.
Edited by:
Michael Hartnett, University of Galway, IrelandReviewed by:
Lucy Rhiannon Wyatt, The University of Sheffield, United KingdomCopyright © 2024 Solabarrieta, Fernandes, Ruiz, Ferrer, Liria, de Santiago, Sánchez, Aranda and Rubio. This is an open-access article distributed under the terms of the Creative Commons Attribution License (CC BY). The use, distribution or reproduction in other forums is permitted, provided the original author(s) and the copyright owner(s) are credited and that the original publication in this journal is cited, in accordance with accepted academic practice. No use, distribution or reproduction is permitted which does not comply with these terms.
*Correspondence: Lohitzune Solabarrieta, bHNvbGFiYXJyaWV0YUBhenRpLmVz
Disclaimer: All claims expressed in this article are solely those of the authors and do not necessarily represent those of their affiliated organizations, or those of the publisher, the editors and the reviewers. Any product that may be evaluated in this article or claim that may be made by its manufacturer is not guaranteed or endorsed by the publisher.
Research integrity at Frontiers
Learn more about the work of our research integrity team to safeguard the quality of each article we publish.