 Erick R. Olvera-Prado
 Steven L. Morey3,4
 Eric P. Chassignet
- 1Departamento de Ingeniería de Procesos e Hidráulica, CBI, Universidad Autónoma Metropolitana - Iztapalapa, Mexico City, Mexico
- 2Instituto de Ciencias de la Atmósfera y Cambio Climático, Universidad Nacional Autónoma de Mexico, Mexico City, Mexico
- 3Center for Ocean-Atmospheric Prediction Studies, Florida State University, Tallahassee, FL, United States
- 4School of the Environment, Florida Agricultural and Mechanical University, Tallahassee, FL, United States
The roles of the Loop Current (LC) and associated eddies in driving the circulation of the Gulf of Mexico (GoM) have been investigated for several decades from different perspectives. Nevertheless, a clear understanding of the relative contributions of the wind forcing and the Loop Current eddies (LCEs) to the GoM circulation and variability remain lacking. In this study, the roles of these two factors in sustaining the less well-known western GoM upper-layer (~1000 m) circulation are investigated with two numerical experiments using the HYbrid Coordinate Ocean Model (HYCOM). First, we examine the relative contributions of the wind and LCEs in setting the mean circulation in the western GOM. We then perform a vorticity balance to analyze the relative importance of the physical processes, including the wind stress, involved in sustaining the western GoM circulation. The results show that the wind stress contributes to a mean anticyclonic circulation in the central and northwestern Gulf, while in the southwestern subregion both wind and LCEs combine to induce a cyclonic circulation, highlighting the role of wind stress curl and topographic confinement. The vorticity balance analysis conducted in the upper layer of the western basin shows that planetary vorticity and stretching are primarily responsible for the balance in time scales longer than weeks, and their co-variability are good indicators of LCEs entering the central and northwestern subregions. However, the southwestern subregion is primarily driven by vortex stretching. Mean advection of vorticity and planetary vorticity are also contributors to the time-averaged vorticity field. Since the wind stress is distributed over the upper layer of the GoM, direct input of vorticity in the regional vorticity balance is negligible, but it does play a role through the vortex stretching term. The results also suggest that wind forcing acts to produce larger, faster moving, and longer-lived anticyclonic eddies that impact the western Gulf and modulate the circulation over monthly timescales.
1 Introduction
The Gulf of Mexico (GoM) is a semi-enclosed sea located in the western Atlantic Ocean, connected with the Caribbean Sea through the Yucatan Channel and with the North Atlantic Ocean through the Florida Straits (Figure 1). The circulation in the basin is forced at the surface by the wind stress, and to a lesser degree by heat and freshwater fluxes, and at the Yucatan Channel by the Yucatan Current. The Yucatan Channel flow is driven by the western boundary current of the North Atlantic Subtropical Gyre, an anticyclonic circulation forced by the northward compensation of the Sverdrup transport due to the wind stress curl, and the surface component of the meridional overturning cell (Schmitz et al., 2005), yielding a mean transport of 27.0 ± 0.5 Sv (1 Sv = 106 m3 s−1) (Athié et al., 2015; Rousset and Beal, 2010; Sheinbaum et al., 2002). In the eastern GoM, the Yucatan Current enters the GoM through the Yucatan Channel and forms an anticyclonic looping circulation, the Loop Current (LC), which, in its extended phase, intrudes further north and episodically sheds large warm-core anticyclonic vortices called Loop Current eddies (LCEs). These LCEs have a time interval between separation events (referred to as LCE separation period) observed to range from a few weeks to 18-19 months (Sturges and Leben, 2000; Leben, 2005; Vukovich, 2012). LCEs have diameters of about 300 km or more (Vukovich, 2012), an average westward propagation speed of 4.4 +/- 2.9 km/day (Leben, 2005; Vukovich, 2007) and lifetimes of months to approximately a year (Elliott, 1982; Frolov et al., 2004). The LC exits the basin through the Florida Straits becoming the Florida Current and then the Gulf Stream.
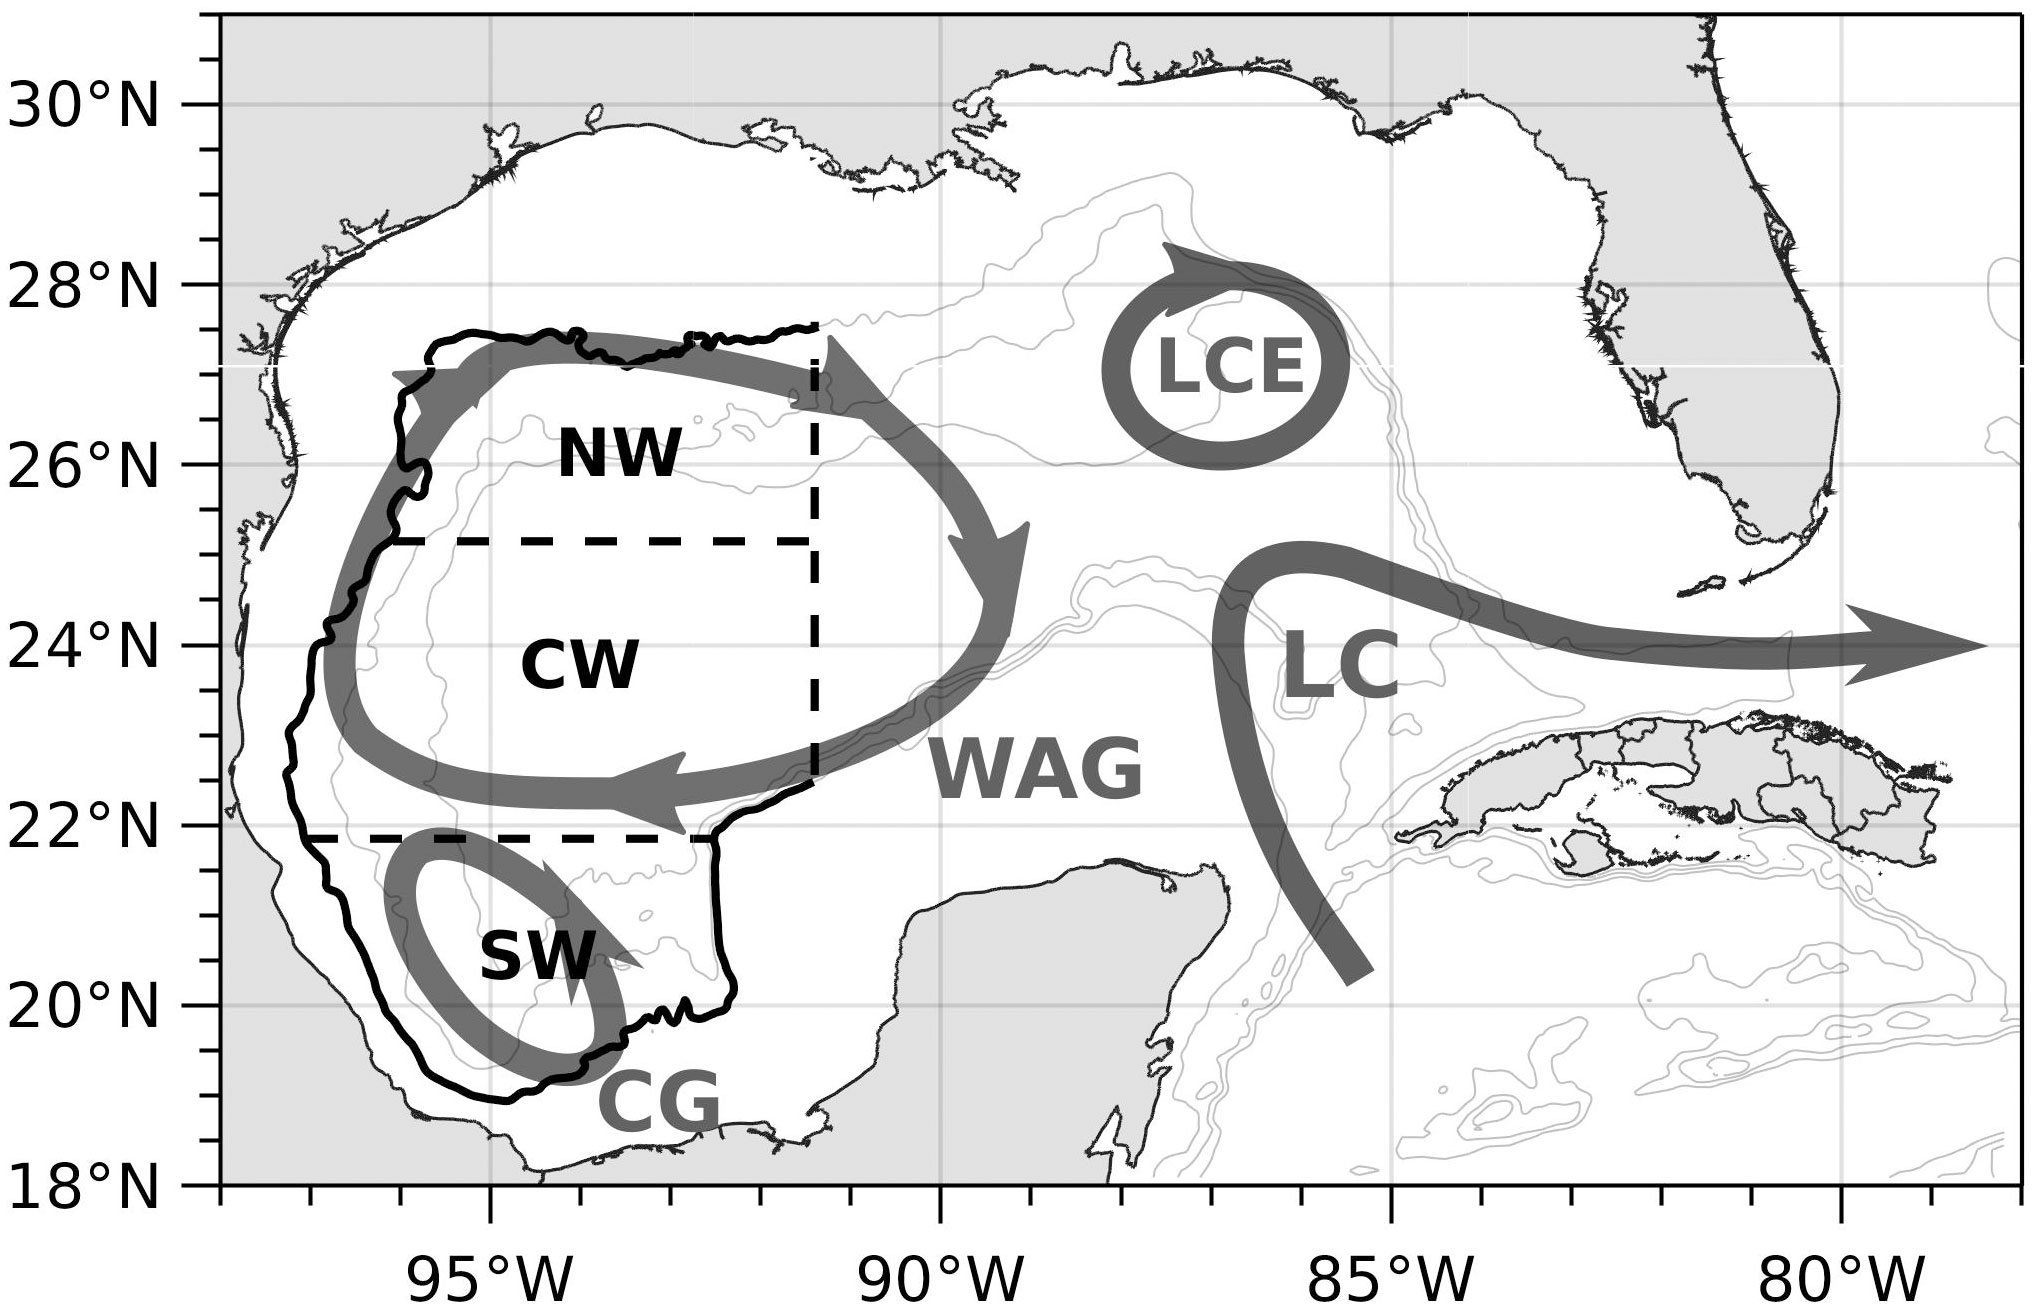
Figure 1 Schematic of the major upper layer circulation patterns in the GoM: The Loop Current (LC), Loop Current eddy (LCE), the Western Anticyclonic Gyre (WAG) and the Campeche Gyre (CG). The boundaries of the three western subregions are also shown in in black lines. The gray contours represent the 1000-, 2000-, and 3000-m isobaths.
The upper layer circulation of the western Gulf is commonly described in two subregions with different behavior: the northwestern region is dominated by an anticyclonic circulation and the presence of mesoscale eddies (LCEs) (Vidal et al., 1994), and the Bay of Campeche in the south, characterized by a cyclonic circulation known as the Campeche Gyre (Vázquez de la Cerda et al., 2005; Perez-Brunius et al., 2013; Olvera-Prado et al., 2023b). It has been shown that circulation on the shelves presents strong seasonality driven by the wind (Zavala-Hidalgo et al., 2003; Morey et al., 2005). Through an analysis using self-organizing maps, Meza-Padilla et al. (2019) extracted circulation patterns from modeled salinity and current fields in the western GoM and confirmed the dominant role of LCEs over local and regional dynamics as suggested by previous studies. By comparing different sources of observational data, Sturges (2020) found that the mean near-surface flow in the southwestern GoM depicts an east-west direction with values ~10 cm/s or more, and no clear evidence of a near-surface return flow back to the east. In the northwestern part, the author found that mean flow is not significantly different from zero, and transport to the west from LCEs is possibly returned in a deep boundary flow driven by the rectification of deep topographic Rossby waves.
Vázquez de la Cerda et al. (2005) presented strong evidence of a mean cyclonic gyre in the Bay of Campeche likely forced by the positive wind stress curl that prevails in this region throughout the year (Figure 2F), using oceanographic observations available at the time. Other studies suggest that the LCEs collapsing against the western boundary influence the cyclonic circulation in the Bay in an irregular manner. Vidal et al. (1992), concluded that the collision of a LCE with the southwestern continental shelf led to a transfer of mass and angular momentum to the south, thereby producing a cyclonic eddy. Also, Romanou et al. (2004) suggest that the cyclonic circulation in the Bay is caused by accretion of cyclones generated in the western Gulf by interaction of LCEs with the continental slope. Using a set of observations, Perez-Brunius et al. (2013) provided further evidence that the cyclonic gyre is vertically coherent, extending below 1000 m and confined to the deep western basin. The authors concluded that the cyclonic gyre results from the contributions of wind stress curl and topographic confinement via conservation of potential vorticity in an equivalent barotropic flow but suggest the need to determine the role the wind plays in the seasonal modulation of the cyclonic circulation. Their data also suggest that the intraseasonal variability of the surface currents are mainly due to changes in the position, size and intensity of the cyclonic gyre, influenced by energetic LCEs impacting the western boundary. Using a set of numerical simulations, Olvera-Prado et al. (2023b) found that the wind is the dominant factor modulating the seasonal variability of the Campeche Gyre. The LCEs and associated cyclonic circulations also contribute to the non-seasonal component of the flow in the Bay of Campeche when they collide with the western boundary.
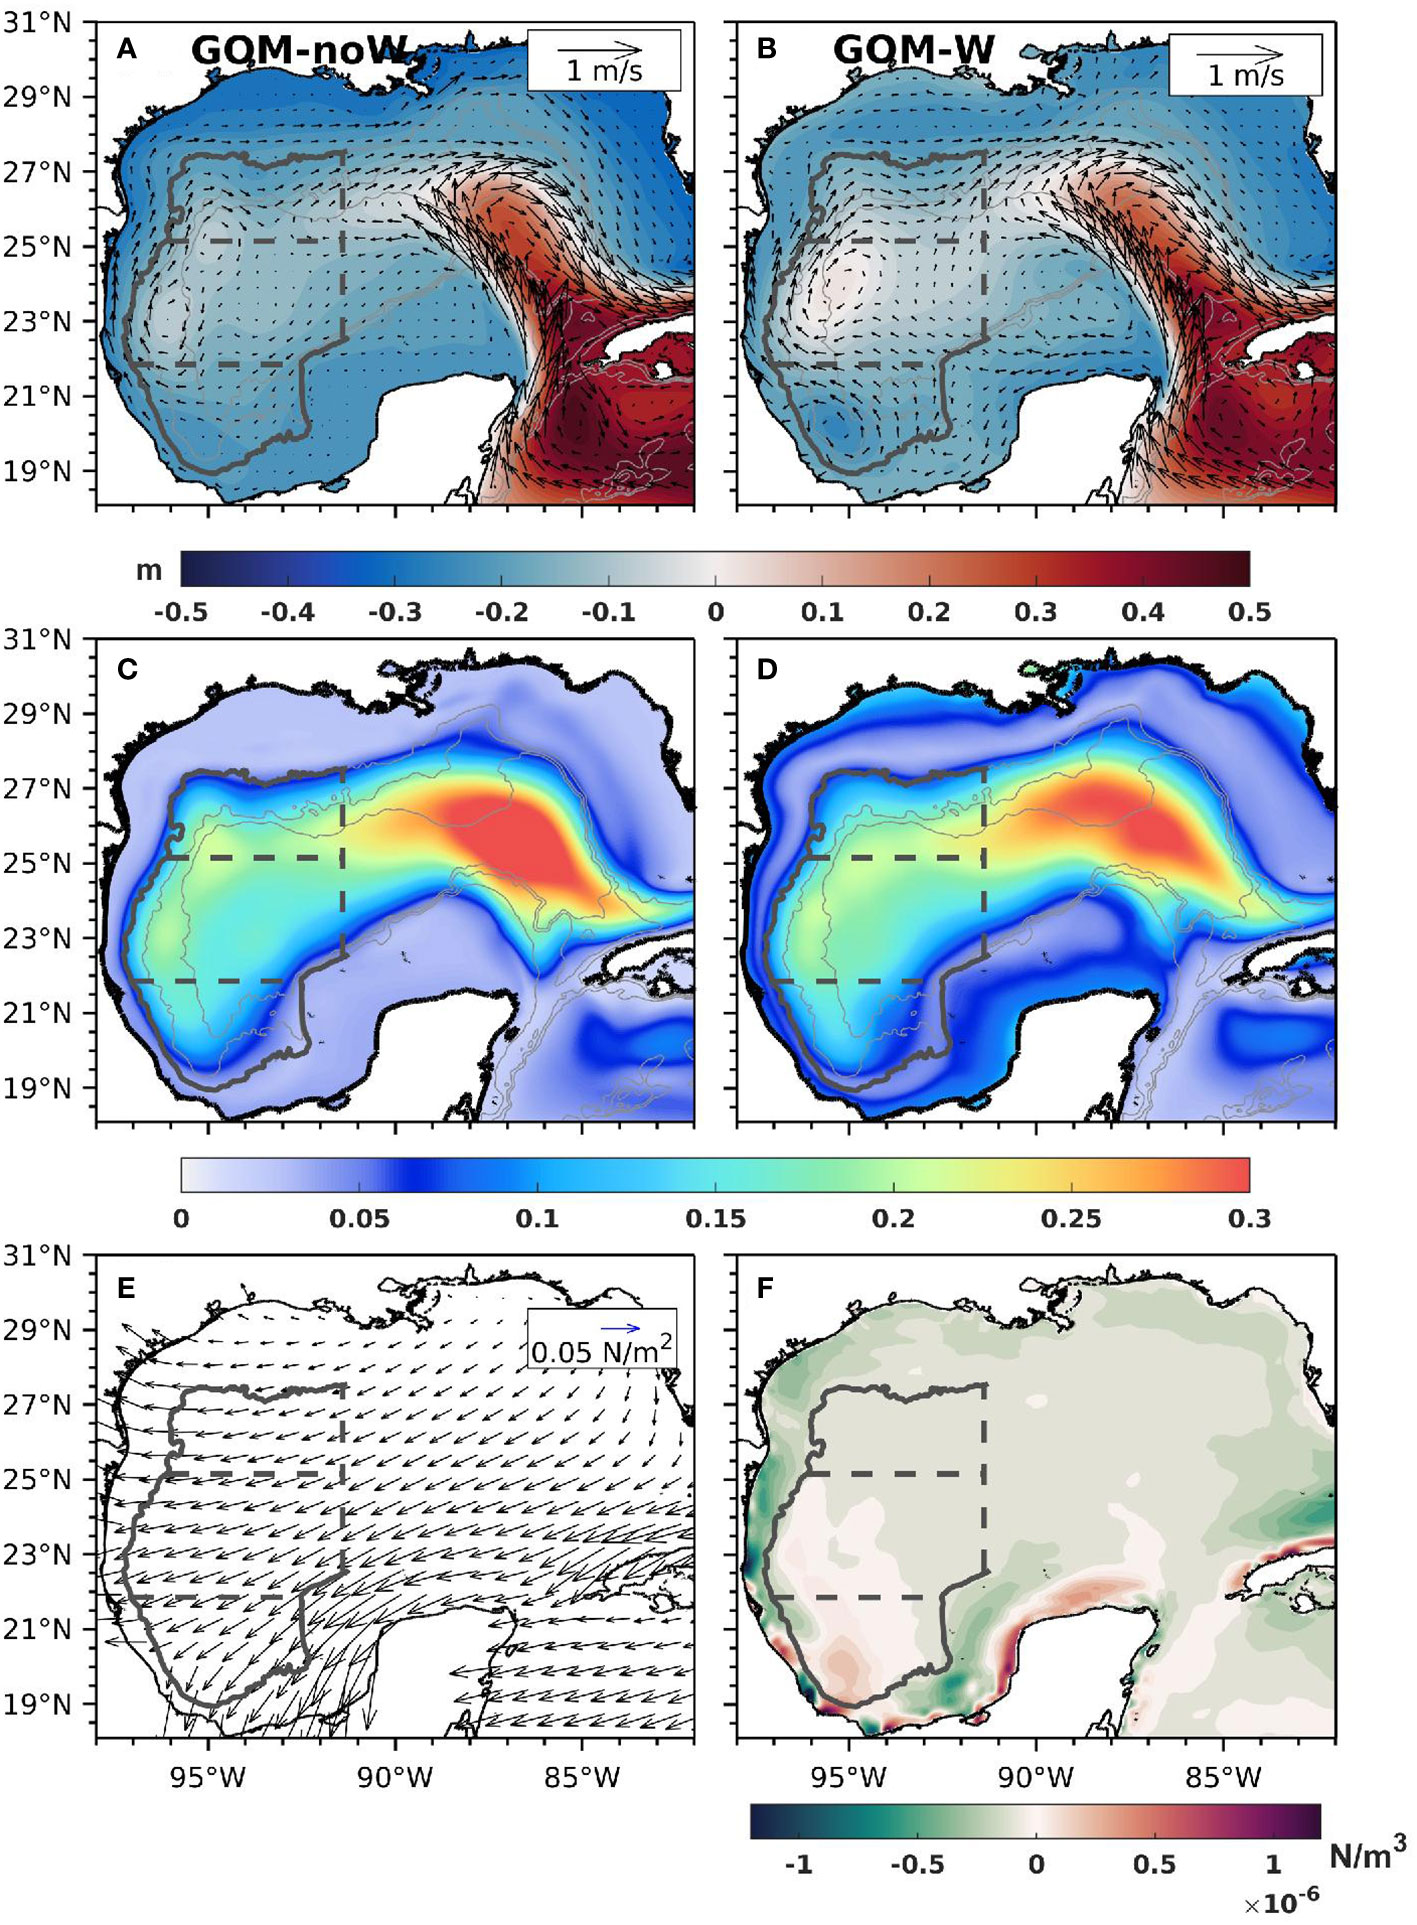
Figure 2 (A, B) Mean surface velocity vectors and SSH contours for experiments GOM-noW and GOM-W respectively; standard deviation of the SSH from (C) GOM-noW and (D) GOM-W (E) mean wind stress vectors and (F) mean wind stress curl. Gray contours in a-d represent the 1000-, 2000-, and 3000-m isobaths.
Comparatively, studies on the relative contributions of the wind and the LC-induced circulation for the entire GoM are scarce. Early studies suggested that the wind stress (Figure 2E) and basin geometry of the GoM seem suitable for the development of a Western Boundary Current from the combined effects of LCEs and large-scale wind stress curl forcing (Figure 2F) (Sturges and Blaha, 1976), although the relative importance of such forcings was not fully understood. Fundamental work by Elliott (1982) of LC versus wind energy sources indicate that although the energy contribution of the wind stress and LC rings is about the same (2.8 x10⁴ Jm−2 and 5.1 x10⁴ Jm−2, respectively), the wind stress energy is a basin-wide value, whereas the ring’s available potential energy is concentrated into a smaller length scale consistent with the north-south scale of the current. Contrary to Elliott (1982) deductions, Sturges (1993) examined their relative contribution by focusing on the annual cycle of the estimated flow as deduced from a compilation of ship drift data and concluded that the western boundary current is driven by the annual variation in wind stress curl augmented by Ekman Pumping, with the flow along the current strongest in July and weakest in October. He also found evidence that LCEs shed from the Loop Current had no annual periodicity, so they make no significant contribution to the long-term annual signal. Vidal et al. (1999), through an analysis of the geostrophic circulation in the western Gulf during summer in 1985, found that the western boundary current is formed by conservation of angular momentum produced by the collision of LCEs against the western boundary and concluded that in the presence of a LCE, the wind-driven background circulation is overwhelmed. Lee and Mellor (2003) noted that, in addition to wind forcing, their model-determined anticyclonic upper-level circulation in the western Gulf is strongly influenced by the average contribution of LCEs propagating to the west while dispersing anticyclonic vorticity. The bulk of these previous studies suggest that seasonal flow in the western GoM is wind forced, but that a detailed quantitative determination of the partitioning between the wind and eddy contributions to the mean flow is needed (Perez-Brunius et al., 2013; Zavala-Hidalgo et al., 2014).
In this study, we investigate the relative importance of the wind and the LCEs in driving the circulation of the western GoM using a set of two long-term, free-running numerical simulations conducted with the HYbrid Coordinate Ocean Model (HYCOM), in which we isolate the effects of these processes to discern their relative contributions. First, the separate and joint effect of the wind and LCEs is examined through calculation of a circulation index in three subregions defined over deep waters (>1000 m) in the western GoM: north-western (NW), central-western (CW), and south-western (SW) (Figure 1). Results from this calculation show that wind forcing reverses the mean circulation in the NW subregion from weakly cyclonic in the non-wind forced simulation to weakly anticyclonic, similarly enhances the anticyclonic circulation in the CW subregion, and forces the cyclonic circulation in the SW subregion. Next, a vorticity balance is performed over these subregions to analyze the contributions of the different terms in the balance and their relationships with the physical processes occurring in the region, including the wind and LCEs. This analysis clarifies the relative roles of wind forcing and eddies in governing the vorticity budget of the upper 1000 m in the western GoM subregions. Wind forcing impacts the vorticity budget through the vortex stretching, with eddies contributing to the modulation of the vorticity on monthly timescales. The layout of this paper is as follows: In section 2, the numerical setup is described, together with a quantification of the impact of atmospheric forcing on LCE metrics. The relative contributions of the wind and LCEs to the circulation of the western GoM are addressed in section 3. In section 4, a vorticity balance analysis is used to infer the roles of different processes in sustaining the circulation of the western GoM over different time scales. Finally, a summary of the results and conclusions are presented in section 5.
2 Methods and data
2.1 The numerical simulations
To address the contributions of the wind and mesoscale processes to the circulation in the western GoM, two free-running (i.e., no data assimilation) simulations were conducted in the GoM region with HYCOM (Wallcraft et al., 2009). HYCOM uses a generalized hybrid vertical coordinate system that allows vertical coordinates to follow isopycnal layers in the deep stratified ocean and transition to pressure coordinates or terrain-following coordinates in unstratified regions or coastal areas, respectively (Bleck and Boudra, 1981; Bleck, 2002; Chassignet et al., 2003; Chassignet et al., 2006). The regional HYCOM GoM domain is equivalent to the one used by Dukhovskoy et al. (2015) and Laxenaire et al. (2023), configured from 18°N to 32°N and 98°W to 77°W (Figure 1), therefore covering the northwestern Caribbean Sea and part of the western North Atlantic Ocean, with a 1/25° horizontal resolution (∼3.8-4.2 km) and 36 hybrid vertical layers, which are mainly isopycnal layers in the open ocean below the mixed layer and z-layers within it. Both simulations use monthly climatology open boundary conditions constructed from the 22-year (1994-2015) 1/12° Global Ocean Forecasting System 3.1 reanalysis GLBb0.08-53.X (Metzger et al., 2017). The target densities, which define the vertical grid in the model, are inherited from the global reanalysis. Sea surface salinity and sea surface temperature are restored to monthly climatological values from the Generalized Digital Environmental Model v. 4.
Both simulations share the specifications mentioned above, however, their main features are listed below:
• Experiment GOM-W is the control run since it is the most realistic simulation with wind forcing. Following spin-up, hourly 10-m wind speed is prescribed using the Climate Forecast System Reanalysis (Saha et al., 2010) from 1997-2015 that has a horizontal resolution of 38 km. The wind stress τ is calculated using bulk formulae during model run time taking into account the surface current speed.
where τ is the wind stress vector, ρ is the density of the air, U10 is the wind vector at 10 m, Ucurr is the ocean surface velocity vector, and CD is obtained from an approximation to the COARE 3.0 bulk algorithm (Fairall et al., 2003).
• Experiment GOM-noW is the model experiment with no wind forcing. The wind forcing is turned off to discern the influence of LCEs in the absence of wind forcing.
With the approach described above, we ensure that both experiments are equivalent, except for the wind. The input of vorticity through wind forcing was shown by Ohlmann et al. (2001) to be of the same order of magnitude as LCEs on long time scales. They estimated that the mean vorticity flux along the western GoM due to LCEs is 6.3 x 10⁻¹⁴ s-2, while the mean vorticity flux due to wind stress curl in the same region is 4.0 x 10⁻¹⁴ s-2.
Both experiments were initialized from the global reanalysis mean state for January 1994, and they were run from 1994 to 2015 (22 years) with outputs saved daily. The vertical viscosity and diffusivity through the water column are prescribed with the K-profile parameterization (KPP; Large et al., 1994). The KPP parameters take into account the contributions of: a) resolved shear instability, b) unresolved shear instability due to the background wave field, and c) double diffusion. For more details on the numerical setup, the reader is referred to Dukhovskoy et al. (2015); Laxenaire et al. (2023), and Olvera-Prado et al. (2023b). The control experiment (GOM-W) was thoroughly validated against altimetry and in-situ observations in Olvera-Prado et al. (2023b). The evaluation showed realistic LC variability, including LC extension (Figures 3E, F) and area (Figures 3G, H), and distribution of LCE separation period (Figure 3C), monthly occurrence (Figure 3D) and trajectories (Figures 3A, B). The Yucatan Channel flow structure and transport comparisons with data were also in good agreement. Finally, the model was shown to successfully resolve the mean deep circulation patterns and energy fields previously reported by observational studies. It is important to note that since identical open boundary conditions are prescribed in both simulations, and owing to the facts stated above, the role of the wind in modifying some of the LC and LCE characteristics can be isolated and, thus, evaluated.
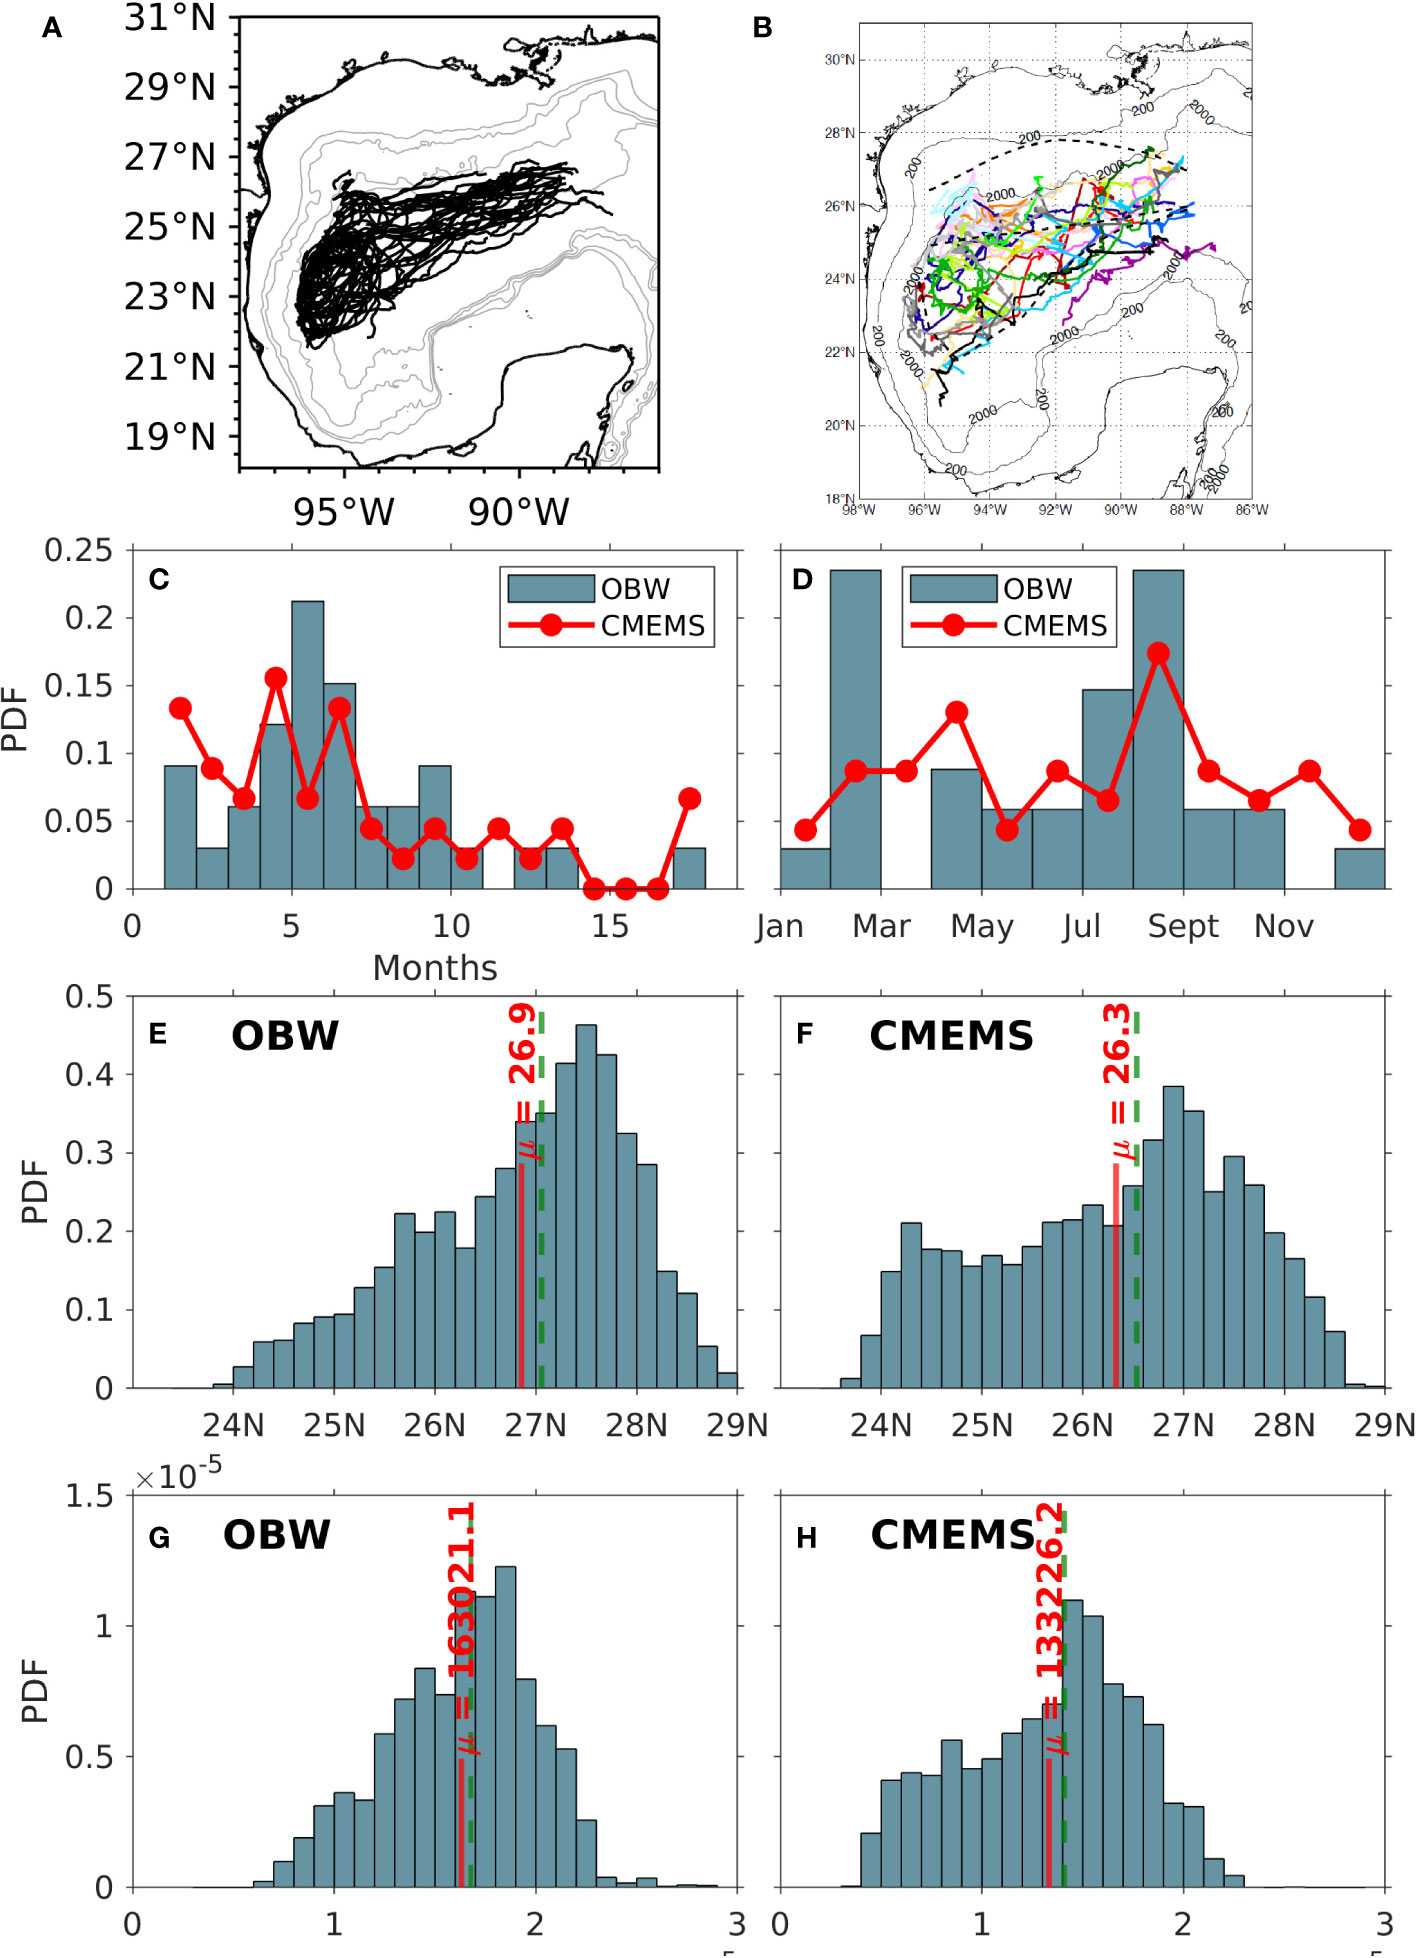
Figure 3 Trajectories of every LCE from (A) HYCOM and (B) observations (from Donohue et al. (2008)). Comparison between OBW model control run outputs and the CMEMS database for normalized histograms of (C) LCE separation period and (D) monthly occurrence. Normalized histograms of LC northernmost latitude penetration from (E) model outputs and (F) CMEMS. Normalized histograms of LC area (×105 km 2) from (G) model outputs and (H) CMEMS (from Olvera-Prado et al., 20023b).
The impact of the wind forcing on LCE metrics was evaluated by tracking the LC and LCE fronts using the 0.17-m contour in the 22-year record of the demeaned sea surface height (SSH) fields for experiments GOM-W and GOM-noW (Leben, 2005; Dukhovskoy et al., 2015; Olvera-Prado et al., 2023b). Results from the objective tracking technique identified a total of 37 and 36 separation events for experiments GOM-W and GOM-noW, respectively. The mean LCE separation period, which is the time between two consecutive separation events, is 7 months with a median of 6.2 months for experiment GOM-W. Meanwhile for experiment GOM-noW, the mean separation period is 7 months with a median of 6.6 months. Overall, there is good agreement in the distribution of the LCE separation period between experiment GOM-W and the observations (Sturges and Leben, 2000).
Although the shape and size of a mesoscale eddy generally evolve during its life cycle, here the area of the LCE is used as an overall measure of size and provides some insight on the impact of wind forcing on the LCEs. Table 1 shows the mean LCE area from detachment until death for experiments GOM-W and GOM-noW. The mean value of each distribution indicates that GOM-W LCEs are, on average, slightly bigger with wind forcing when compared to GOM-noW (3.75 x10⁴ km2 versus 3.22 x10⁴ km2). The mean lifetimes for the LCEs are roughly 252 and 237 days with standard deviations of 122 and 103 days for experiments GOM-W and GOM-noW, respectively (Table 1). These values fall within published estimates of ∼6 months to one year (Elliott, 1982; Frolov et al., 2004). Mean westward propagation speeds are 3.6 and 3.12 km/day with standard deviations of 1.31 and 0.78 km/day for GOM-W and GOM-noW, respectively. These results are comparable to several previous observational and numerical studies (Leben, 2005; Vukovich, 2007, and more) based on the westward long Rossby wave speed around these latitudes. The above suggests that, statistically, the cumulative effect of the local large-scale wind tends to increase the LCE size, lifespan, speed and distance traveled before dissipation, as well as to modify the eddy shedding period. This means that the eddies in the simulation with atmospheric forcing (GOM-W) are likely to more strongly impact the circulation in the western Gulf, which is consistent with the increase seen in SSH variability along the LCE westward pathway in the GOM-W simulation over the GOM-noW simulation (Figure 2). The SSH variability is, however, smaller in GOM-W when compared to the GOM-noW experiment (Figure 2) in agreement with Chaichitehrani and He (2024) who state that the wind stress work over the GoM is negative due to the relative wind stress (Equation 1) and associated eddy killing effect (Larrañaga et al., 2022).
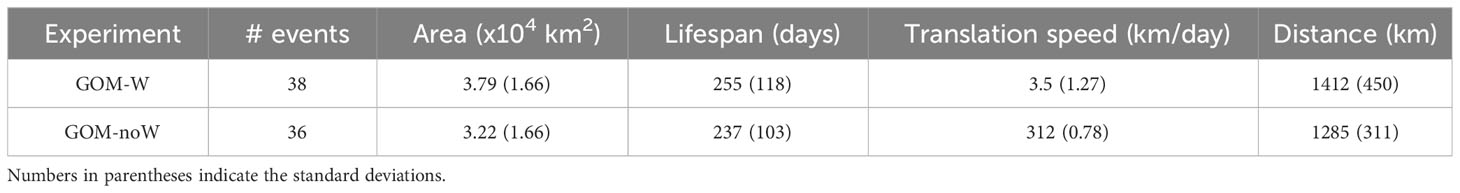
Table 1 Mean LCE properties for experiments GOM-noW and GOM-W.
It is important to note that, since the background wind-driven circulation is absent in the western Gulf of Mexico when the wind forcing is turned off, one does expect differences in the time evolution of the LC and LCE characteristics as shown above. This is not an entirely new result, since Oey et al. (2003) found that the wind-induced transport fluctuations through the Greater Antilles Passages cause LCE shedding to be more frequent (3–7 months). Meanwhile Chang and Oey (2012) found that the seasonal signal of the wind over the GoM and Caribbean Sea can modify the Yucatan Channel transport, inducing favorable conditions for eddy shedding in summer and winter. More recently, Chaichitehrani and He (2024), using a set of atmospheric and oceanic reanalysis, confirmed the role of the easterly winds over the Caribbean Sea in modulating the Yucatan Channel transport, which in turn is correlated with major eddy shading events. The impact of the wind stress curl in the western Gulf of Mexico on the eddy pathway and mean circulation is further discussed in section 3.
2.2 Circulation index
To quantify the circulation in the Gulf, an index is computed over the pre-defined subregions of the western Gulf (Figures 1 and 2) over deep waters (>1000 m): north-western (NW), central-western (CW), and south-western (SW). The definition of these subregions is based on the analysis of Vukovich (2007), who defines three mean paths in the GoM (northern, central and southern paths, his figure 17) based on the paths that LCEs follow during their western propagation once they separate from the LC and whose final fates fall within the subregions. We choose to compute the index over the upper 1000 m, since it represents a typical depth of the main thermocline in the GoM and the Atlantic (Liu and Tanhua, 2021), where the signature of the wind-driven currents like the LC (and the Gulf Stream) extends. Furthermore, the 1000 m depth also corresponds to the depth of the first baroclinic mode crossing and, thus, we can assume that the circulation in the GoM is reasonably well represented by a two-layer system with an upper layer of 1000 m (Hamilton, 2009). We can then compute the depth-averaged area-integrated relative vorticity of the upper layer, i.e., the Circulation Index (CI). According to the Stokes’ theorem, the circulation (Equation 2), Γ, defined by the line integral of the velocity field around a closed curve C, can be computed from the area integral of the vorticity over the area enclosed by the curve A as
For this calculation, the 1000 m depth-averaged velocities are used and Γ becomes the CI. The CI is computed individually in each of the western basin subregions delimited by the dashed lines in Figures 1 and 2: NW, CW and SW.
2.3 Upper ocean vorticity balance
Analysis of the vorticity budget through calculation of the different terms in the vorticity equation has been used to elucidate the roles of different physical processes in governing the circulation of many ocean regions in numerical model studies (e.g., Boudra and Chassignet, 1988; Murray et al., 2001; Azevedo Correia de Souza et al., 2015). Understanding the upper ocean vorticity balance in the GoM provides insight into the conditions under which the circulation is driven by certain processes, such as those associated with the wind and the LCEs. For this study, the vorticity balance Equation 3 is derived from the momentum equation given by
where v is the horizontal velocity vector (u, v), ζ is the relative vorticity, f is the Coriolis parameter, k is vertical unit vector, M = z + pα is the Montgomery Potential, α is the specific volume of water, τ is the wind stress, ν is the horizontal turbulent viscosity and Δp is the layer thickness. Taking the vertical component from the curl of Equation 3, yields the differential form of the relative vorticity equation. Then, it is possible to estimate the contribution of different forcing terms to the vorticity balance, calculated at each model grid point.
where, in addition to the terms described above, β is the meridional gradient of f. On the right hand side of Equation 4, the first term is the advection of relative vorticity (ADV); the second term is the advection of planetary vorticity (BETA); the third term is the vortex stretching (STRCH); the fourth term is the wind stress curl (WIND) and the fifth term is the viscous stress curl (VISC). Equation 4 is then discretized in a similar fashion to the Boudra and Chassignet (1988) application for the Agulhas region, i.e.,
where the Δ(x,y) () operator is the difference between () at neighboring grid points divided by the (x,y)-directions grid distance. Similarly () is an average of () over consecutive grid points.
3 Contribution of wind and LCEs to the GoM mean circulation
We first address the relative importance of the wind and eddy-driven circulation in the GoM by examining the mean circulation obtained averaging the 22 years of daily output for each experiment. Figure 2 shows the maps of mean surface velocity and SSH for experiments GOM-noW (a) and GOM-W (b).
Experiment GOM-noW depicts a narrow area of high pressure, extending from the LC through the central-western subregion which mimics the south-west trajectory of LCEs once they detach from the LC, represented by light blue color (negative anomalies after demeaning). An interesting result is the absence of a surface cyclonic circulation associated with a low in dynamic height representing the Campeche Gyre in the Bay of Campeche for experiment GOM-noW. This suggests that the latter is primarily wind-driven (Figure 4). Experiment GOM-W shows a broader anti-cyclonic circulation over the central- and north-western subregions (Figure 2B) located from 90°W to the western boundary and from 20°N to the northern boundary of the domain covering an area of approximately 700 x 500 km. This difference with GOM-noW is consistent with the role of the negative wind stress curl that prevails over the region (Figure 2F). In the Bay of Campeche, bound to the west, the semi-permanent cyclonic circulation is shown with center at 95.5°W, 20°N and is represented by dark blue (a low in dynamic height) in Figure 2B. Higher values of SSH standard deviation extending westward of 90°W is a manifestation of the larger and longer-lived LCEs found in the wind-forced simulation (Figures 2C, D).
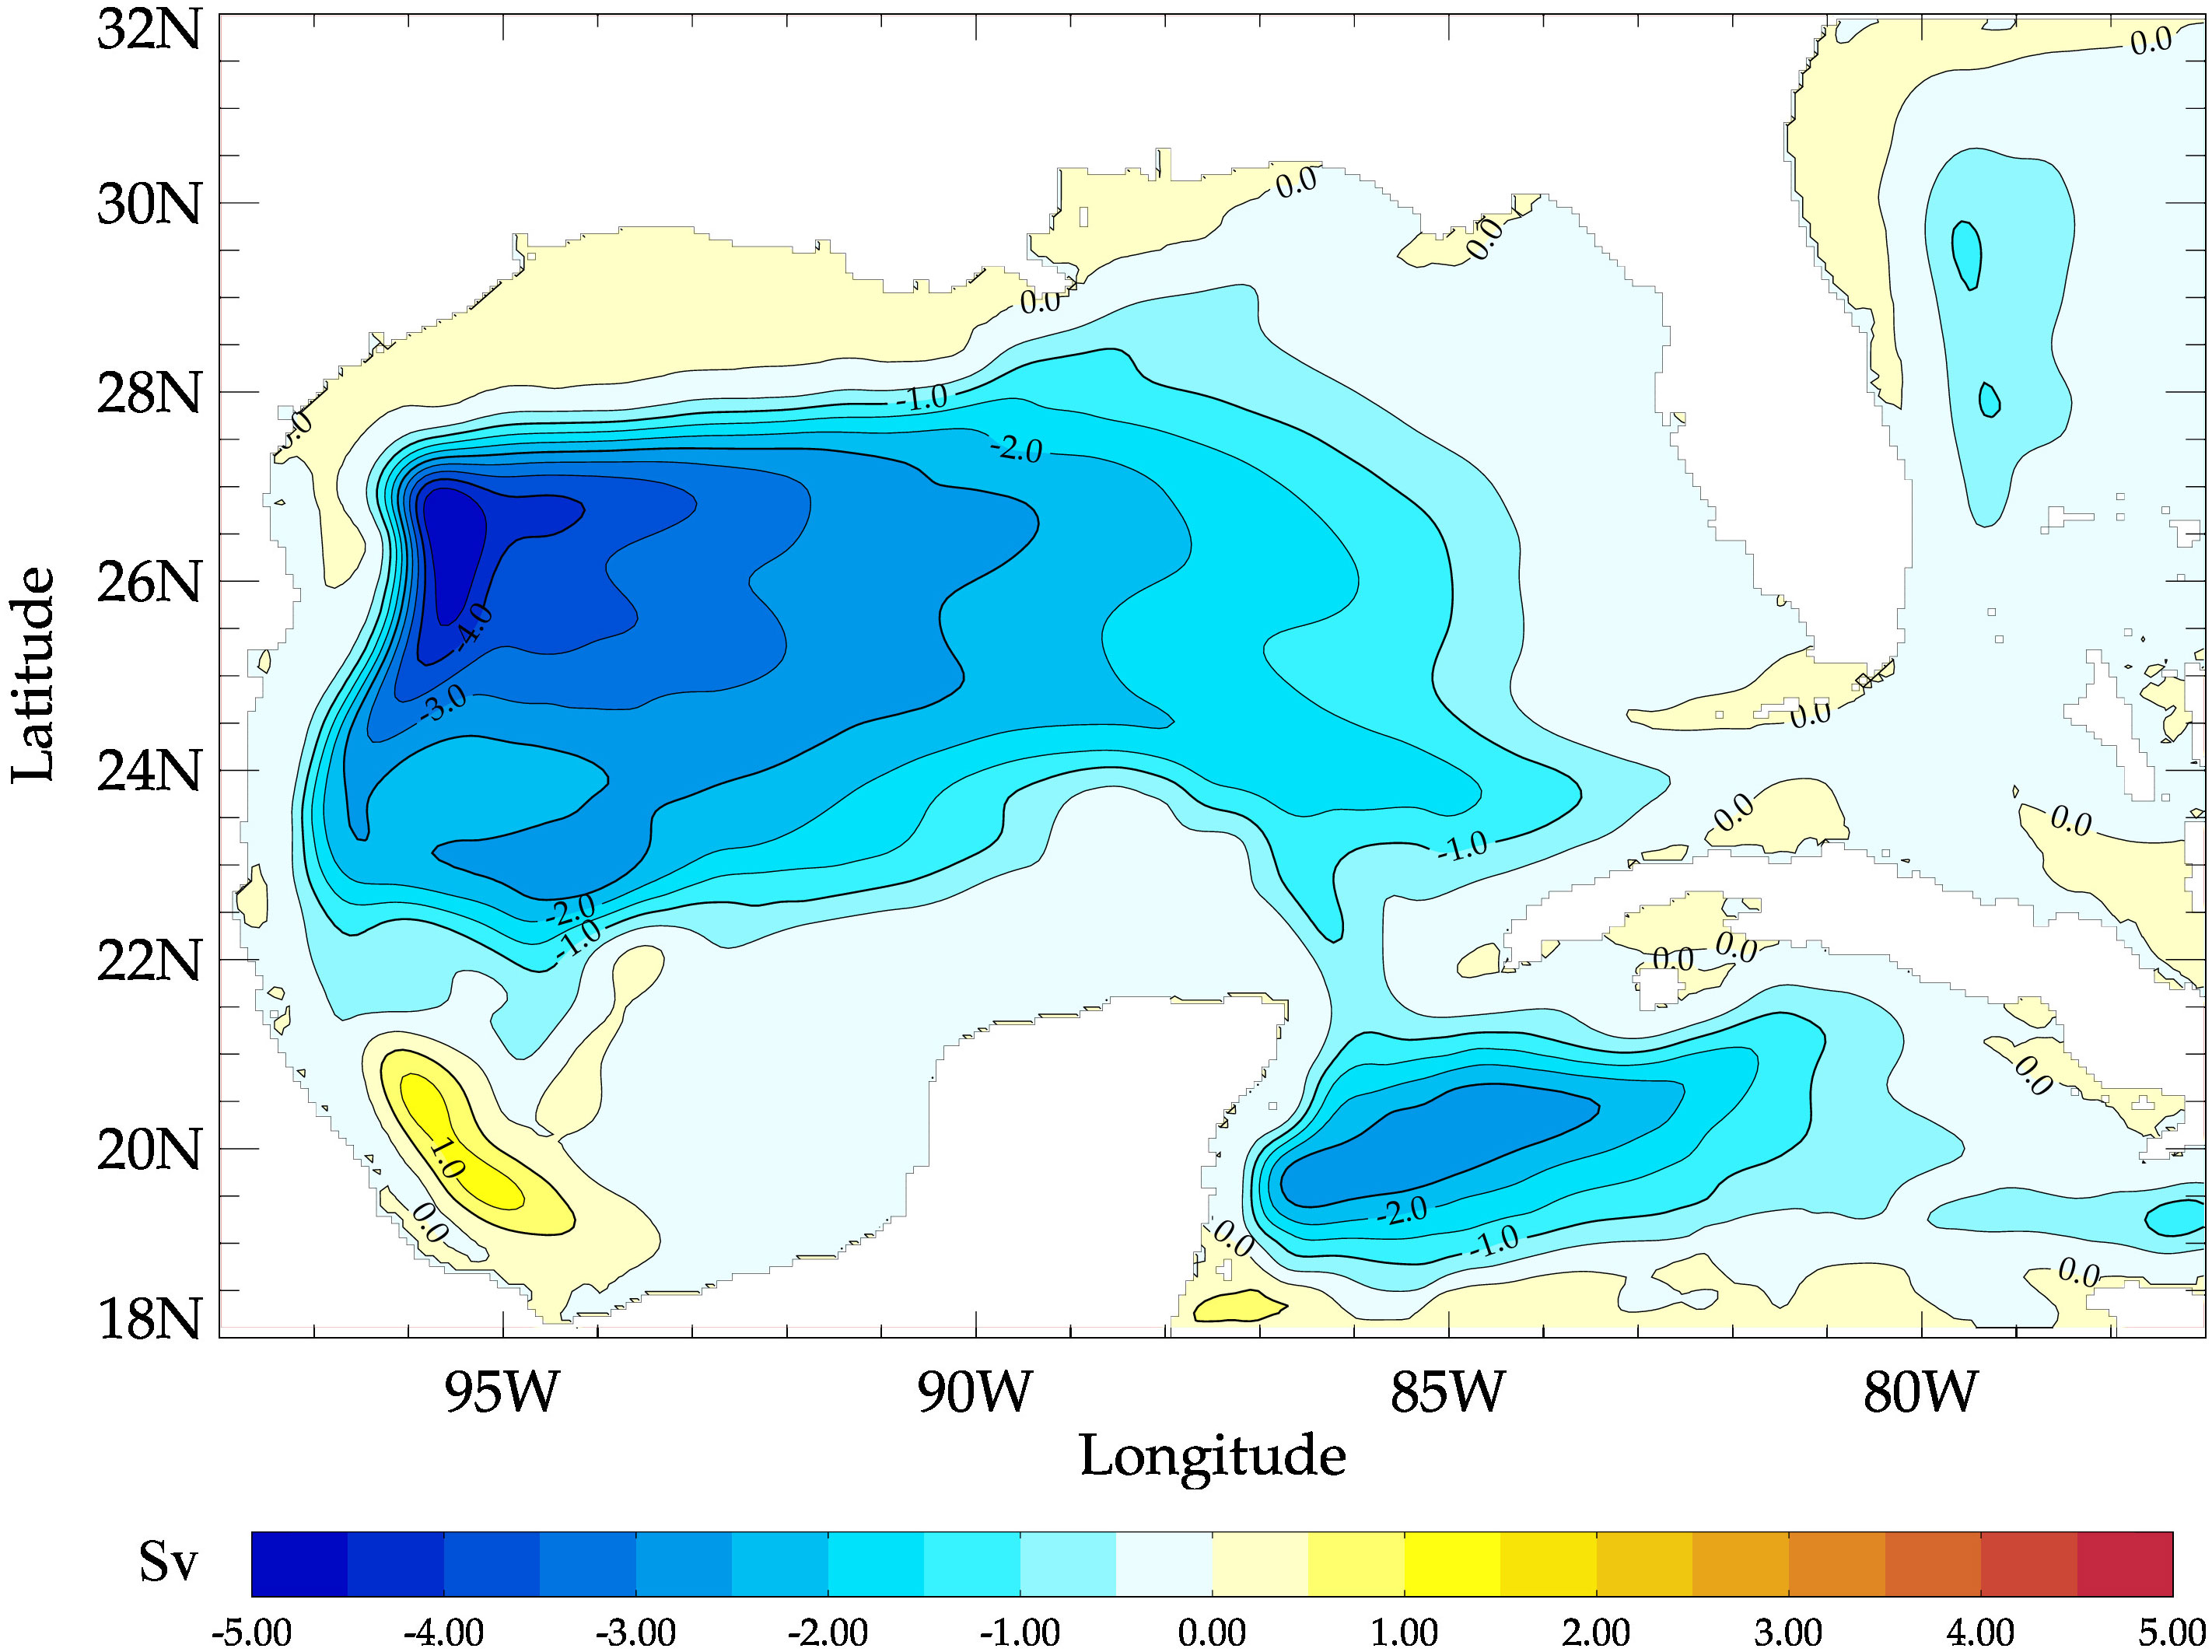
Figure 4 Wind-induced linear Sverdrup circulation computed as in Townsend et al. (2000).
The time series of CI (not shown) for the GOM-W and GOM-noW experiments show no marked seasonal cycle; therefore, we focus on the average CI value for each subregion represented with a bar chart in Figure 5. Focusing first on the NW subregion, it is observed that experiment GOM-noW produce a cyclonic circulation on average with mean CI = 0.8 × 10⁴ m2/s, while for experiment GOM-W, the mean CI is = -0.5 × 10⁴ m2/s meaning that the average circulation is anticyclonic. Now, if the western GoM circulation can be thought as an eddy-induced flow superimposed over the wind driven circulation, it could be said that in the NW subregion the eddy-driven flow is slightly cyclonic on average, and changes to slightly anticyclonic with the inclusion of wind. Second, in the CW subregion, both experiments produce an anticyclonic circulation (negative CI mean), somewhat expected since it is observed on the horizontal maps of time-averaged velocity and SSH. The anticyclonic circulation is somewhat stronger in the presence of wind (experiment GOM-W). Using the same analogy as above, it could be said that wind tends to strengthen the anticyclonic circulation as seen in the more negative value of the mean CI of experiment GOM-W (red bar). Finally, in the SW subregion, both experiments produce a cyclonic circulation on average (positive CI mean) verifying the presence of the quasi-permanent gyre in the western region, a result also expected. It is noteworthy, however, that the CI is more positive in the experiment with wind (GOM-W) by a factor of approximately 3 times the standard deviation, demonstrating the importance of the wind stress curl in strengthening the Campeche Gyre. This result suggests that the Campeche gyre is the result of the contribution of, at least, 2 processes: one being the strong cyclonic circulation produced by the positive wind stress curl that prevails over the region throughout the year (Figures 2F, 4) and the other the average contribution of the large cyclones accompanying the LCEs that eventually enter the Bay (Olvera-Prado et al., 2023b).
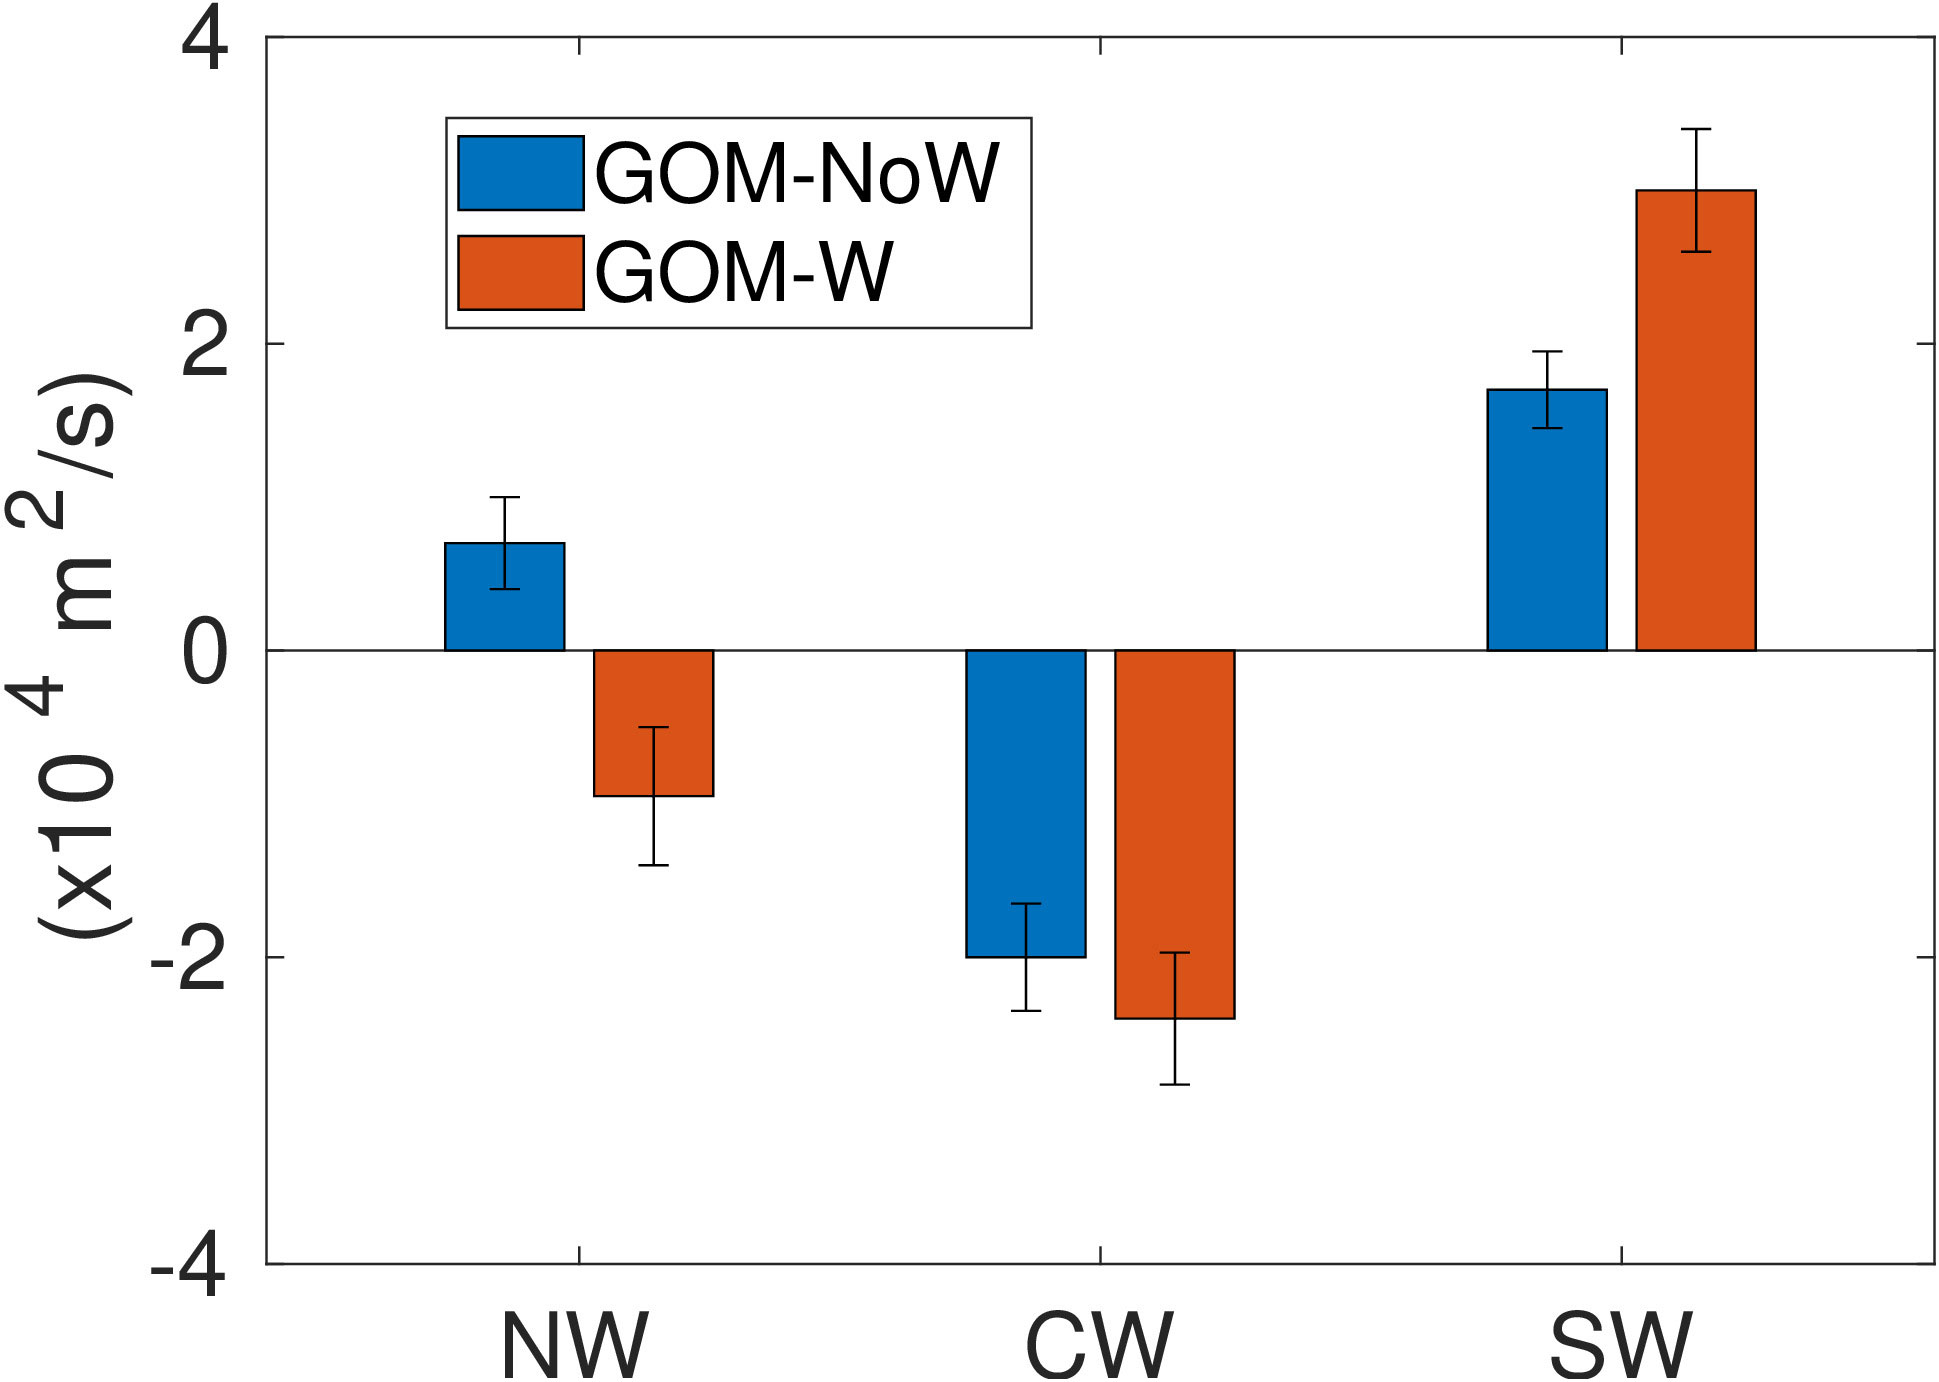
Figure 5 Mean circulation index computed in the three sub-regions for experiments GOM-noW (blue) and GOM-W (red). Error bars indicate one standard deviation.
The relative role of the wind stress in determining the circulation of the western GoM can be further understood by considering the linear response of the ocean to the large-scale, low-frequency wind forcing, or the Sverdrup circulation (Figure 4) as in Townsend et al. (2000). Barotropic Sverdrup transport streamlines show an anticyclonic circulation strongest in the NW subregion (about 5 Sv) weakening over the CW subregion. This result is consistent with the reversing of the mean circulation from weakly cyclonic to anticyclonic with the addition of wind to the nonlinear HYCOM simulation and slightly strengthening the anticyclonic circulation in the CW subregion (Figure 5). A strong barotropic Sverdrup circulation is induced by the wind in the SW subregion, again consistent with the profound strengthening of the cyclonic circulation in this region when wind forcing is added to the nonlinear HYCOM simulation (Figure 5).
4 The vorticity balance in the western Gulf of Mexico
4.1 Time-mean vorticity balance
Determining the dominant balances of terms of the vorticity equation aids in understanding the physical mechanisms that govern the mean and variability of the circulation. This analysis examines the time-mean upper-layer vorticity balance in the NW, CW, and SW subregions of the GoM extending seaward of the 1000 m isobath. First, all the variables of Equation 5 are depth-averaged over the upper 30 layers of the model, corresponding to an upper layer extending down to a mean depth of approximately 1000 m, with the exception of the wind stress τ, which is a surface variable. Then, the time-averaged spatial fields of the terms in Equation 5 are compared for experiments GOM-noW and GOM-W.
Focusing on the western Gulf, the mean relative vorticity for experiment GOM-noW (Figure 6A) shows an anticyclonic maximum in the CW subregion (negative values in blue) centered at 96°W and 23°N, which is accompanied with small regions of negative and positive relative vorticity. In fact, a secondary maximum of cyclonic vorticity (positive values in red) is observed to the east of the anticyclonic maximum. The location of this secondary maximum suggests that it may be the result of two processes, one is the barotropic signature of the Sigsbee Abyssal Gyre (Perez-Brunius et al., 2018), a feature that has been recently found to be well-resolved in non-data assimilative HYCOM simulations (Morey et al., 2020; Olvera-Prado et al., 2023a), and the other process may involve the cyclones that accompany the LCEs and form directly to their north, traveling clockwise surrounding it and which eventually enter the southern region (Frolov et al., 2004; Olvera-Prado et al., 2023b). In the SW subregion, the cyclonic vorticity maximum in the western Bay of Campeche is consistent with the relatively weaker net cyclonic circulation mentioned earlier for this simulation, and there is even a small area with anticyclonic vorticity just to the north that could be produced by LCEs colliding with the western boundary and whose southern rim penetrates into the SW subregion. The NW subregion seems to be influenced by the LCEs traveling on a northern path and reaching the western boundary.
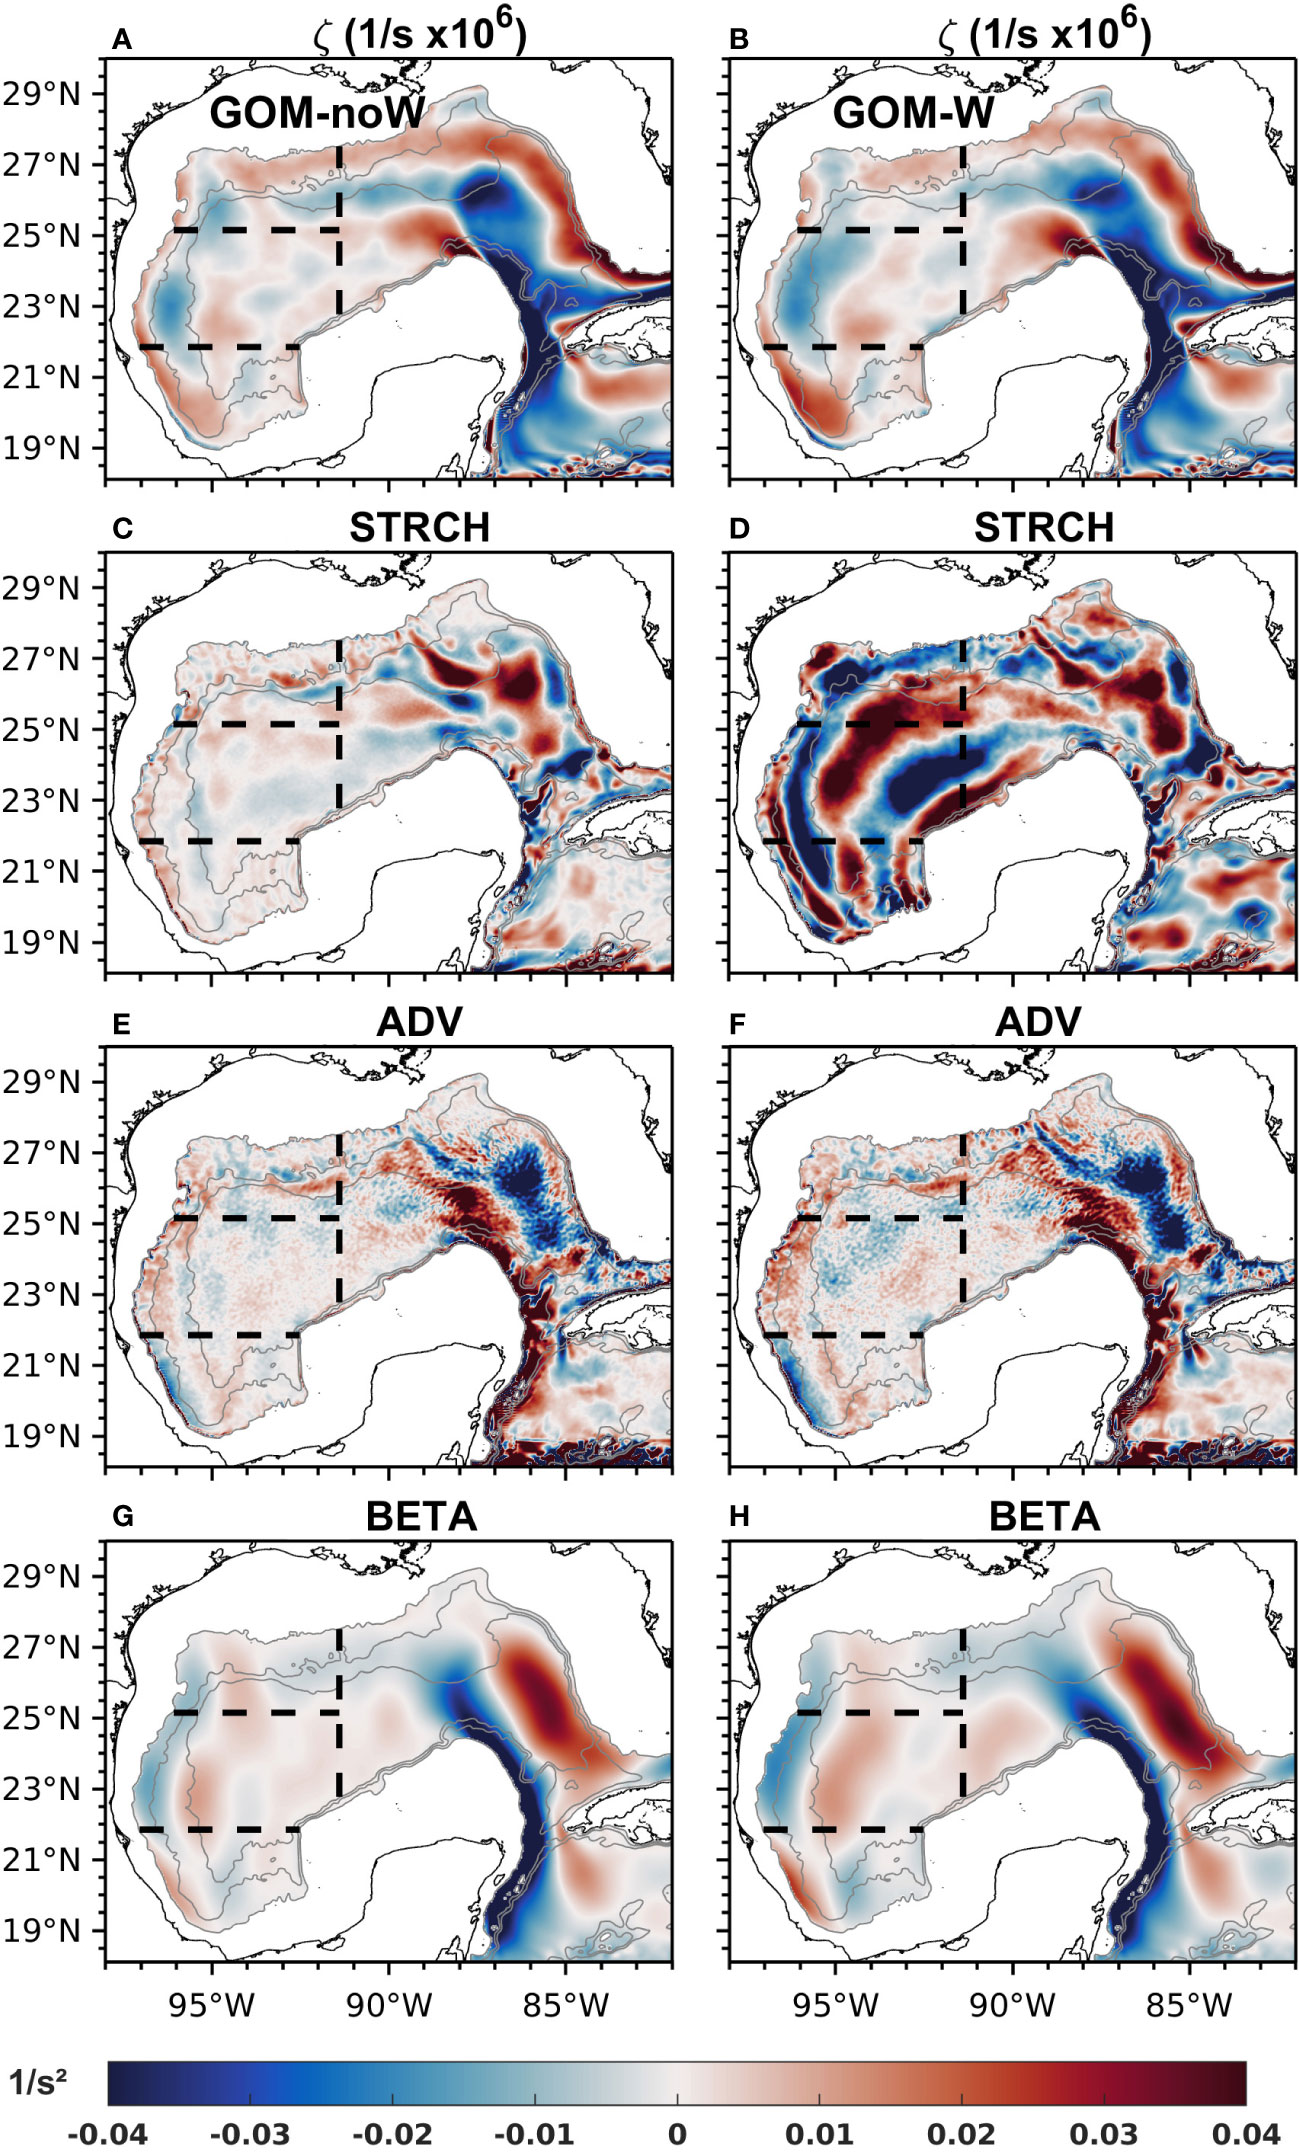
Figure 6 Mean maps of upper-layer relative vorticity derived from modeled velocity for experiments (A) GOM-noW and (B) GOM-W; stretching for (C) GOM-noW and (D) GOM-W; advection of vorticity for (E) GOM-noW and (F) GOM-W and; planetary vorticity advection for (G) GOM-noW and (H) GOM-W. Gray contours represent the 1000, 2000 and 3000 m isobaths, and black dashed lines the limits of the NW, CW and SW subregions.
Experiment GOM-W (Figure 6B) also depicts a region of strong anticyclonic vorticity dominating in the CW subregion, being consistent with the mean circulation on the western boundary of Figure 2B and with the region where most of the LCEs dissipate (LCs paths not shown). This structure is stronger and more organized compared to experiment GOM-noW. In the SW subregion, the cyclonic vorticity maximum in the western region is also consistent with the Campeche Gyre, but with larger magnitude than the GOM-noW experiment. The NW subregion shows no very defined pattern, only a pair of cyclonic anticyclonic regions that could be the result of the average contribution of wind and LCEs.
The relative vorticity structure over the LC region depicts similar patterns in both experiments, a strong anticyclonic vorticity core surrounded by a cyclonic vorticity band produced by the cyclones formed around the front of the LC. This average structure suggests the dominance of the LC system over the role of the wind in the eastern region.
The horizontal maps of the STRCH, ADV and BETA terms averaged over the 22-year period are shown in Figures 6C, E, G for experiment GOM-noW. The average contribution of advection (Figure 6E) reveals paths of advected anticyclonic and cyclonic vorticity (blue and red respectively) through the CW and NW subregions, with a north-south orientation, presumably responsible for the anticyclonic maximum and part of the secondary cyclonic maximum shown in Figure 6A. Also, the SW subregion shows an area of advection of cyclonic vorticity, which contributes to the cyclonic vorticity maximum in that region. Similarly, the advection of planetary vorticity (Figure 6G) seems to be responsible for conveying part of the anticyclonic vorticity carried by LCEs northward, once they reach the western boundary (around 96.5° W and confined mainly within the CW and NW subregions) and part of the cyclonic vorticity carried southward by the cyclones formed to the north of LCEs once they reach the western boundary (around 95° W within the CW and NW subregions). Being a second-order derivative, the vorticity gradient present in the ADV term is highly sensitive to noise, producing a noisier ADV field, which can be seen in Figure 6E while the planetary vorticity advection term, a first order derivative, presents a smoother pattern (Figure 6G). However, it is somewhat noticeable that the meridionally-oriented bands of positive and negative BETA on the western part of the CW and NW subregions are balanced partially by ADV. The above is reasonable given the fact that these two terms are also highly balanced over the LC region, an interesting fact beyond the aim of this study but certainly important to mention. The mean map of the STRCH term (Figure 6C) shows similar magnitude values as ADV and BETA terms in the western GoM, but with no clear pattern that could be related to a particular physical process.
The horizontal maps of the vorticity balance STRCH, ADV and BETA terms for experiment GOM-W are shown in Figures 6D, F, H. In general, ADV and BETA terms have similar mean patterns and behavior to those for experiment GOM-noW, but with higher magnitude values. The meridionally-oriented bands of positive and negative BETA are compensated partially by the ADV term. On the other hand, the mean contribution of the STRCH term to the mean vorticity field is stronger and depicts a defined pattern in GOM-W. The map shows strong paths of anticyclonic and cyclonic vorticity oriented in a northeast-southwest direction in the NW and CW subregions. These paths propagate down to the SW subregion, where a strong core of positive vorticity is located in the Campeche Gyre region. The fact that this particular distribution of paths appears with such strength in the wind-driven experiment (GOM-W), suggests that the paths are directly related to the isopycnal interface displacement and associated velocity field of the wind-driven circulation in the western Gulf (Figure 4) and, therefore, the STRCH term can be a mechanism for the input of vorticity through wind stress (e.g., Ekman pumping).
Results of the vorticity analysis also indicate that the contributions of the WIND and VISC terms to the mean vorticity field are negligible in both experiments; therefore, these maps are not presented. For the WIND term in GOM-W, the main reason for this result is that the wind stress effect is distributed over a large depth and that its contribution is cumulative. Overall, the presence of a well-organized (mean) circulation indicates that the dominant contribution to mean upper-layer relative vorticity is stretching, advection of vorticity and planetary vorticity advection.
4.2 Time-varying vorticity balance
Analyses of the mean state and vorticity balances in the GoM do not yield a complete picture of the processes controlling the circulation due to its highly variable nature. The GoM circulation exhibits strong variability at high frequencies due to synoptic variability, monthly periods associated with its energetic mesoscale activity and long period variability due to seasonal and interannual modulation of inflow conditions and atmospheric forcing. The analysis in this section now focuses on the vorticity balances at high frequencies (daily time scales) through inspection of instantaneous values of the terms of the vorticity equation, and at lower frequencies associated with mesoscale activity.
Figures 7A–H shows the horizontal maps of relative vorticity ζ, STRCH, ADV and BETA terms for experiments GOM-noW and GOM-W respectively. The maps are for the simulation day August 8, 2000 for GOM-noW (a, c, e and g), when two LCEs are located inside the CW subregion, and for the simulation day March 15, 2005 for GOM-W (b, d, f and h), a time when the LC depicts an intermediate stage, a LCE is just detached from the LC and another LCE is located in the CW subregion. (Note that the dates presented here correspond to dates of wind forcing and are used for convenience to refer to particular model times. However, because there is no data assimilation in these experiments, model results should not be directly compared to observations for these or any particular times). From these maps, one can observe large magnitudes of the terms representing advection of relative vorticity and planetary vorticity over regions of strong currents like the LC or LCEs in both experiments. The BETA term has smaller magnitudes compared to the advection of relative vorticity, but with less small-scale variability and thus appearing more coherent with the mesoscale circulation features. In particular, the dominance of the meridional velocity in the BETA term leads to defined patterns of negative and positive values found to the left and right sides of the LCE and LC due to the anticyclonic circulation (taking into account the negative sign in front of the term in Equation 4).
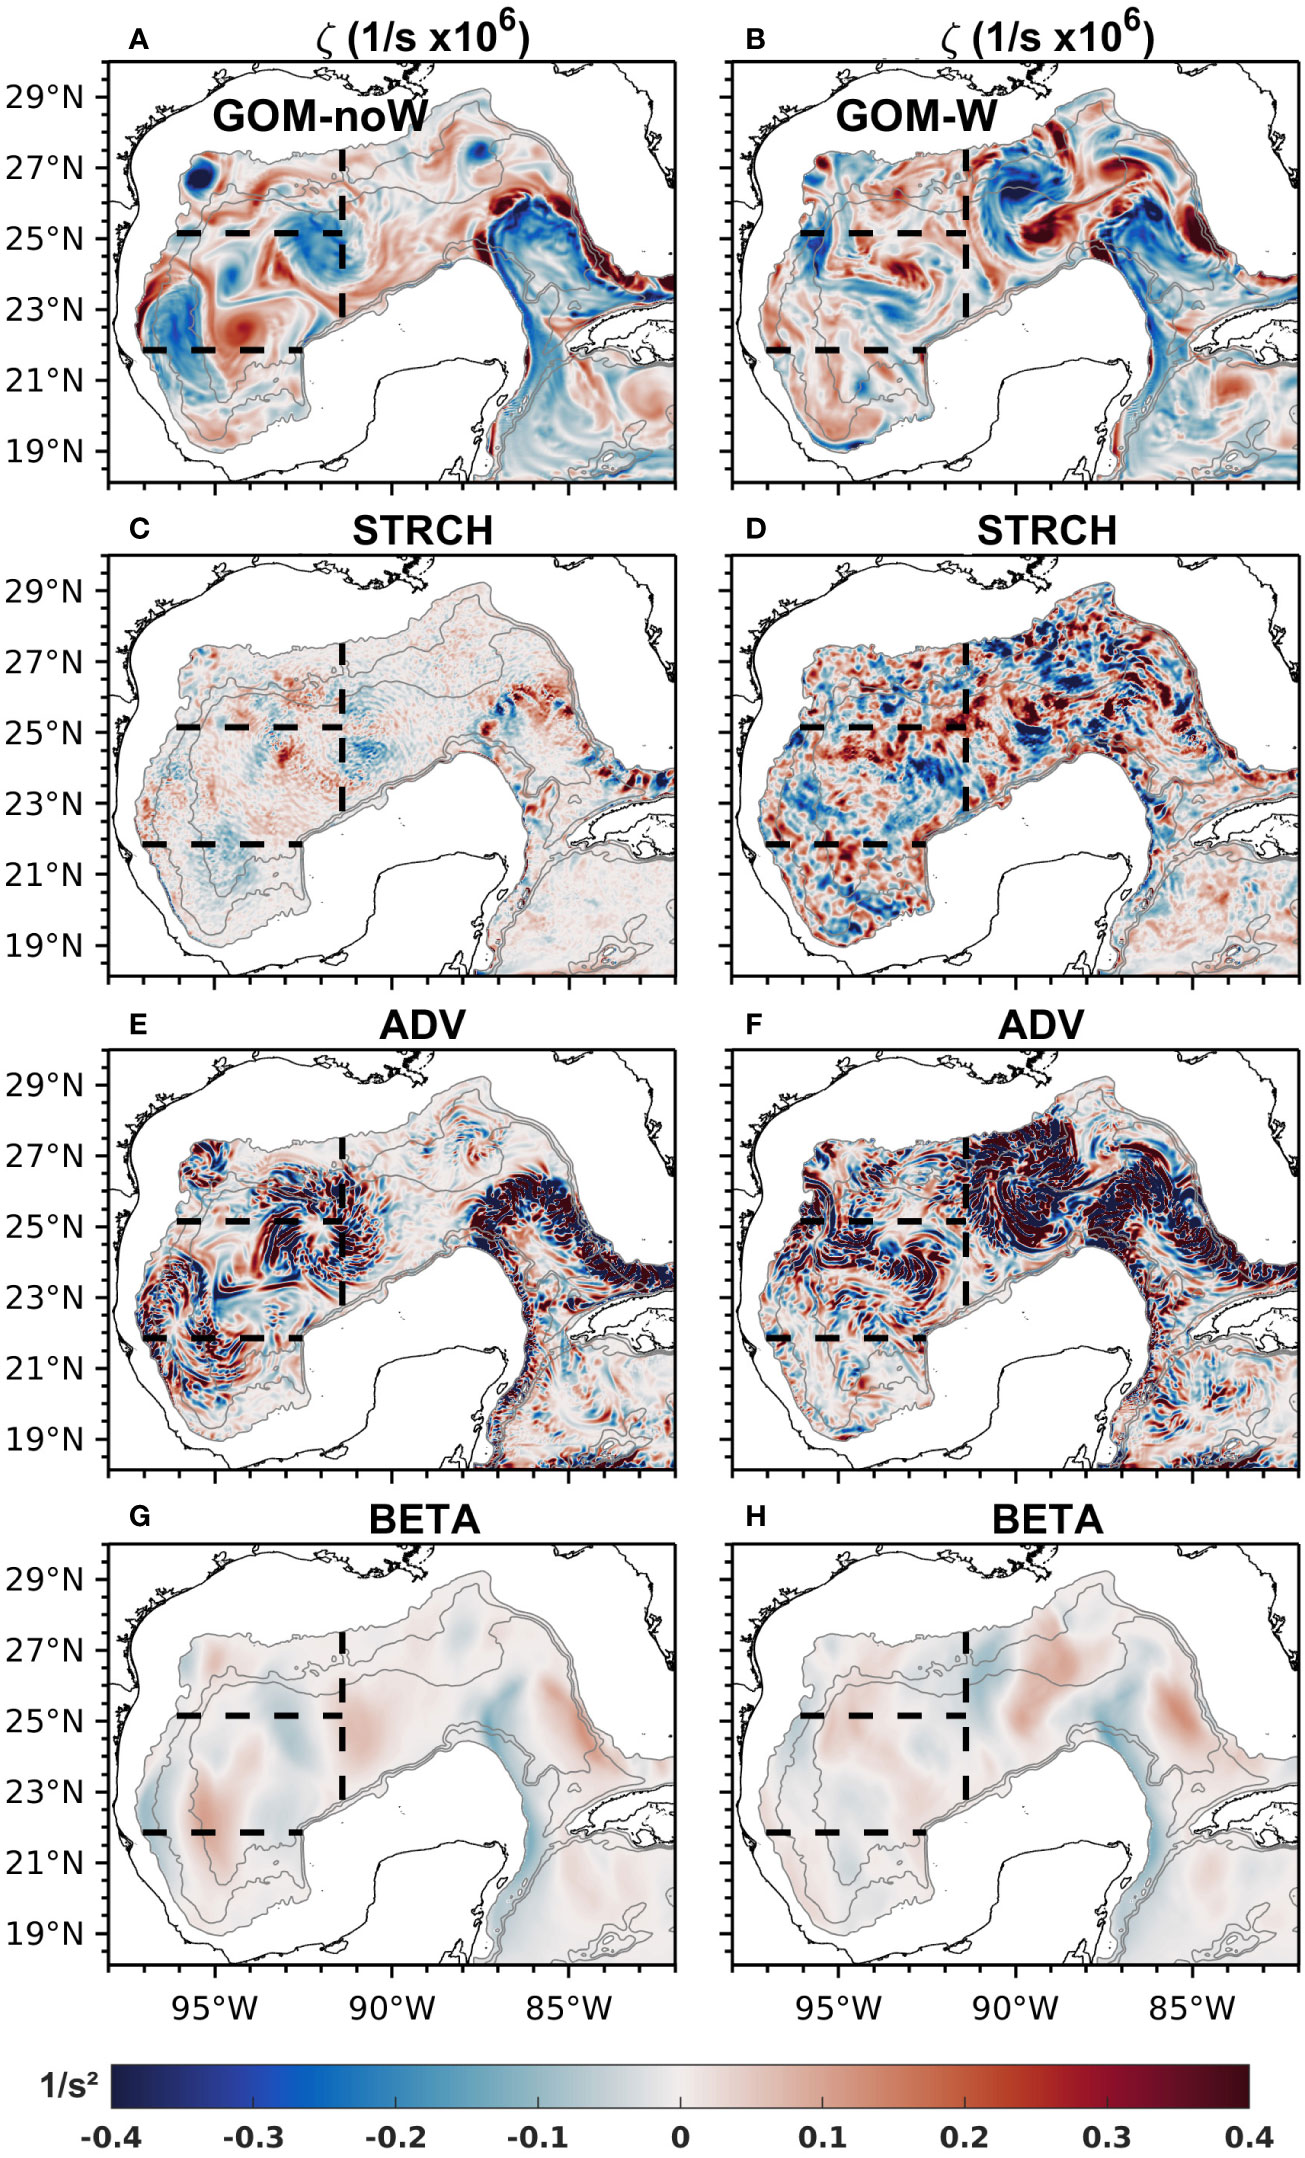
Figure 7 Instantaneous maps of upper-layer relative vorticity derived from modeled velocity for experiments (A) GOM-noW (August 8th, 2000) and (B) GOM-W (March 15th, 2005); stretching for (C) GOM-noW and (D) GOM-W; advection of vorticity for (E) GOM-noW and (F) GOM-W and; planetary vorticity advection for (G) GOM-noW and (H) GOM-W. Gray contours represent the 1000, 2000 and 3000 m isobaths, and black dashed lines the limits of the NW, CW and SW subregions. Although the dates differ between experiments, the aim is to show the variability and magnitude of the fields rather than directly compare them.
Instantaneous maps of the STRCH term reveal generally higher magnitudes and spatial variability in the GOM-W (Figure 7C) simulation compared to the GOM-noW (Figure 7D) simulation, which confines the higher spatial variability to a region over the LC and LCE. The differences in the STRCH terms in the GOM-W simulation can only be due to small-scale wind-induced processes, such as frontal eddies or meanders traversing the periphery of the larger mesoscale features.
In order to look into the time-varying balance at longer time scales typical of the mesoscale variability in the Gulf, time series of the terms in Equation 4 are first constructed by integrating them over each subregion for the whole 22-year record of daily model output. Then, a 30-day running mean filter is applied to the whole set of time series in the three subregions for GOM-noW and GOM-W (Figures 8E, F). Primarily, the balance in both cases is a combination of vortex stretching, planetary vorticity advection and advection of vorticity and to a lesser extent to viscous stress curl and wind stress curl in GOM-noW. Figures 8B, D, F show that in the three subregions, the contribution of the STRCH (green line) dominates, since it is the term that exhibits larger amplitude and variability, especially in the NW and CW. However, in the NW and CW subregions BETA (blue line) also becomes important in some time periods. In fact, it can be seen that for periods of ∼2-3 months length, BETA balances STRCH. The advection of vorticity (pink line) in GOM-W occurs either because it balances STRCH when it and BETA are out of phase or to help BETA compensate STRCH when its amplitude is high. There are a few exceptions with periods when BETA is negligible and ADV compensates STRCH entirely. In GOM-noW (Figures 8A, C, E), STRCH, BETA and ADV depict the same behavior as in GOM-W, except that the latter still shows remnants of high-frequency variability after the filter was applied. In both experiments, typical values of vortex stretching, and planetary vorticity advection are around +/- 1 x10¹⁰ m2s−2 with maximum values of +/- 2 x10¹⁰ m2s−2, while advection of vorticity does not increase above +/- 0.5 x10¹⁰ m2s−2 in most of the cases. On the other hand, wind stress curl (gray line) in GOM-W shows values an order of magnitude smaller and its contribution to the balance becomes important in apparent atmospheric events, presumably during storms such as cold fronts or tropical cyclones. A zoomed-in figure of the time series is shown in Figure 9 for model years 2001-2002.
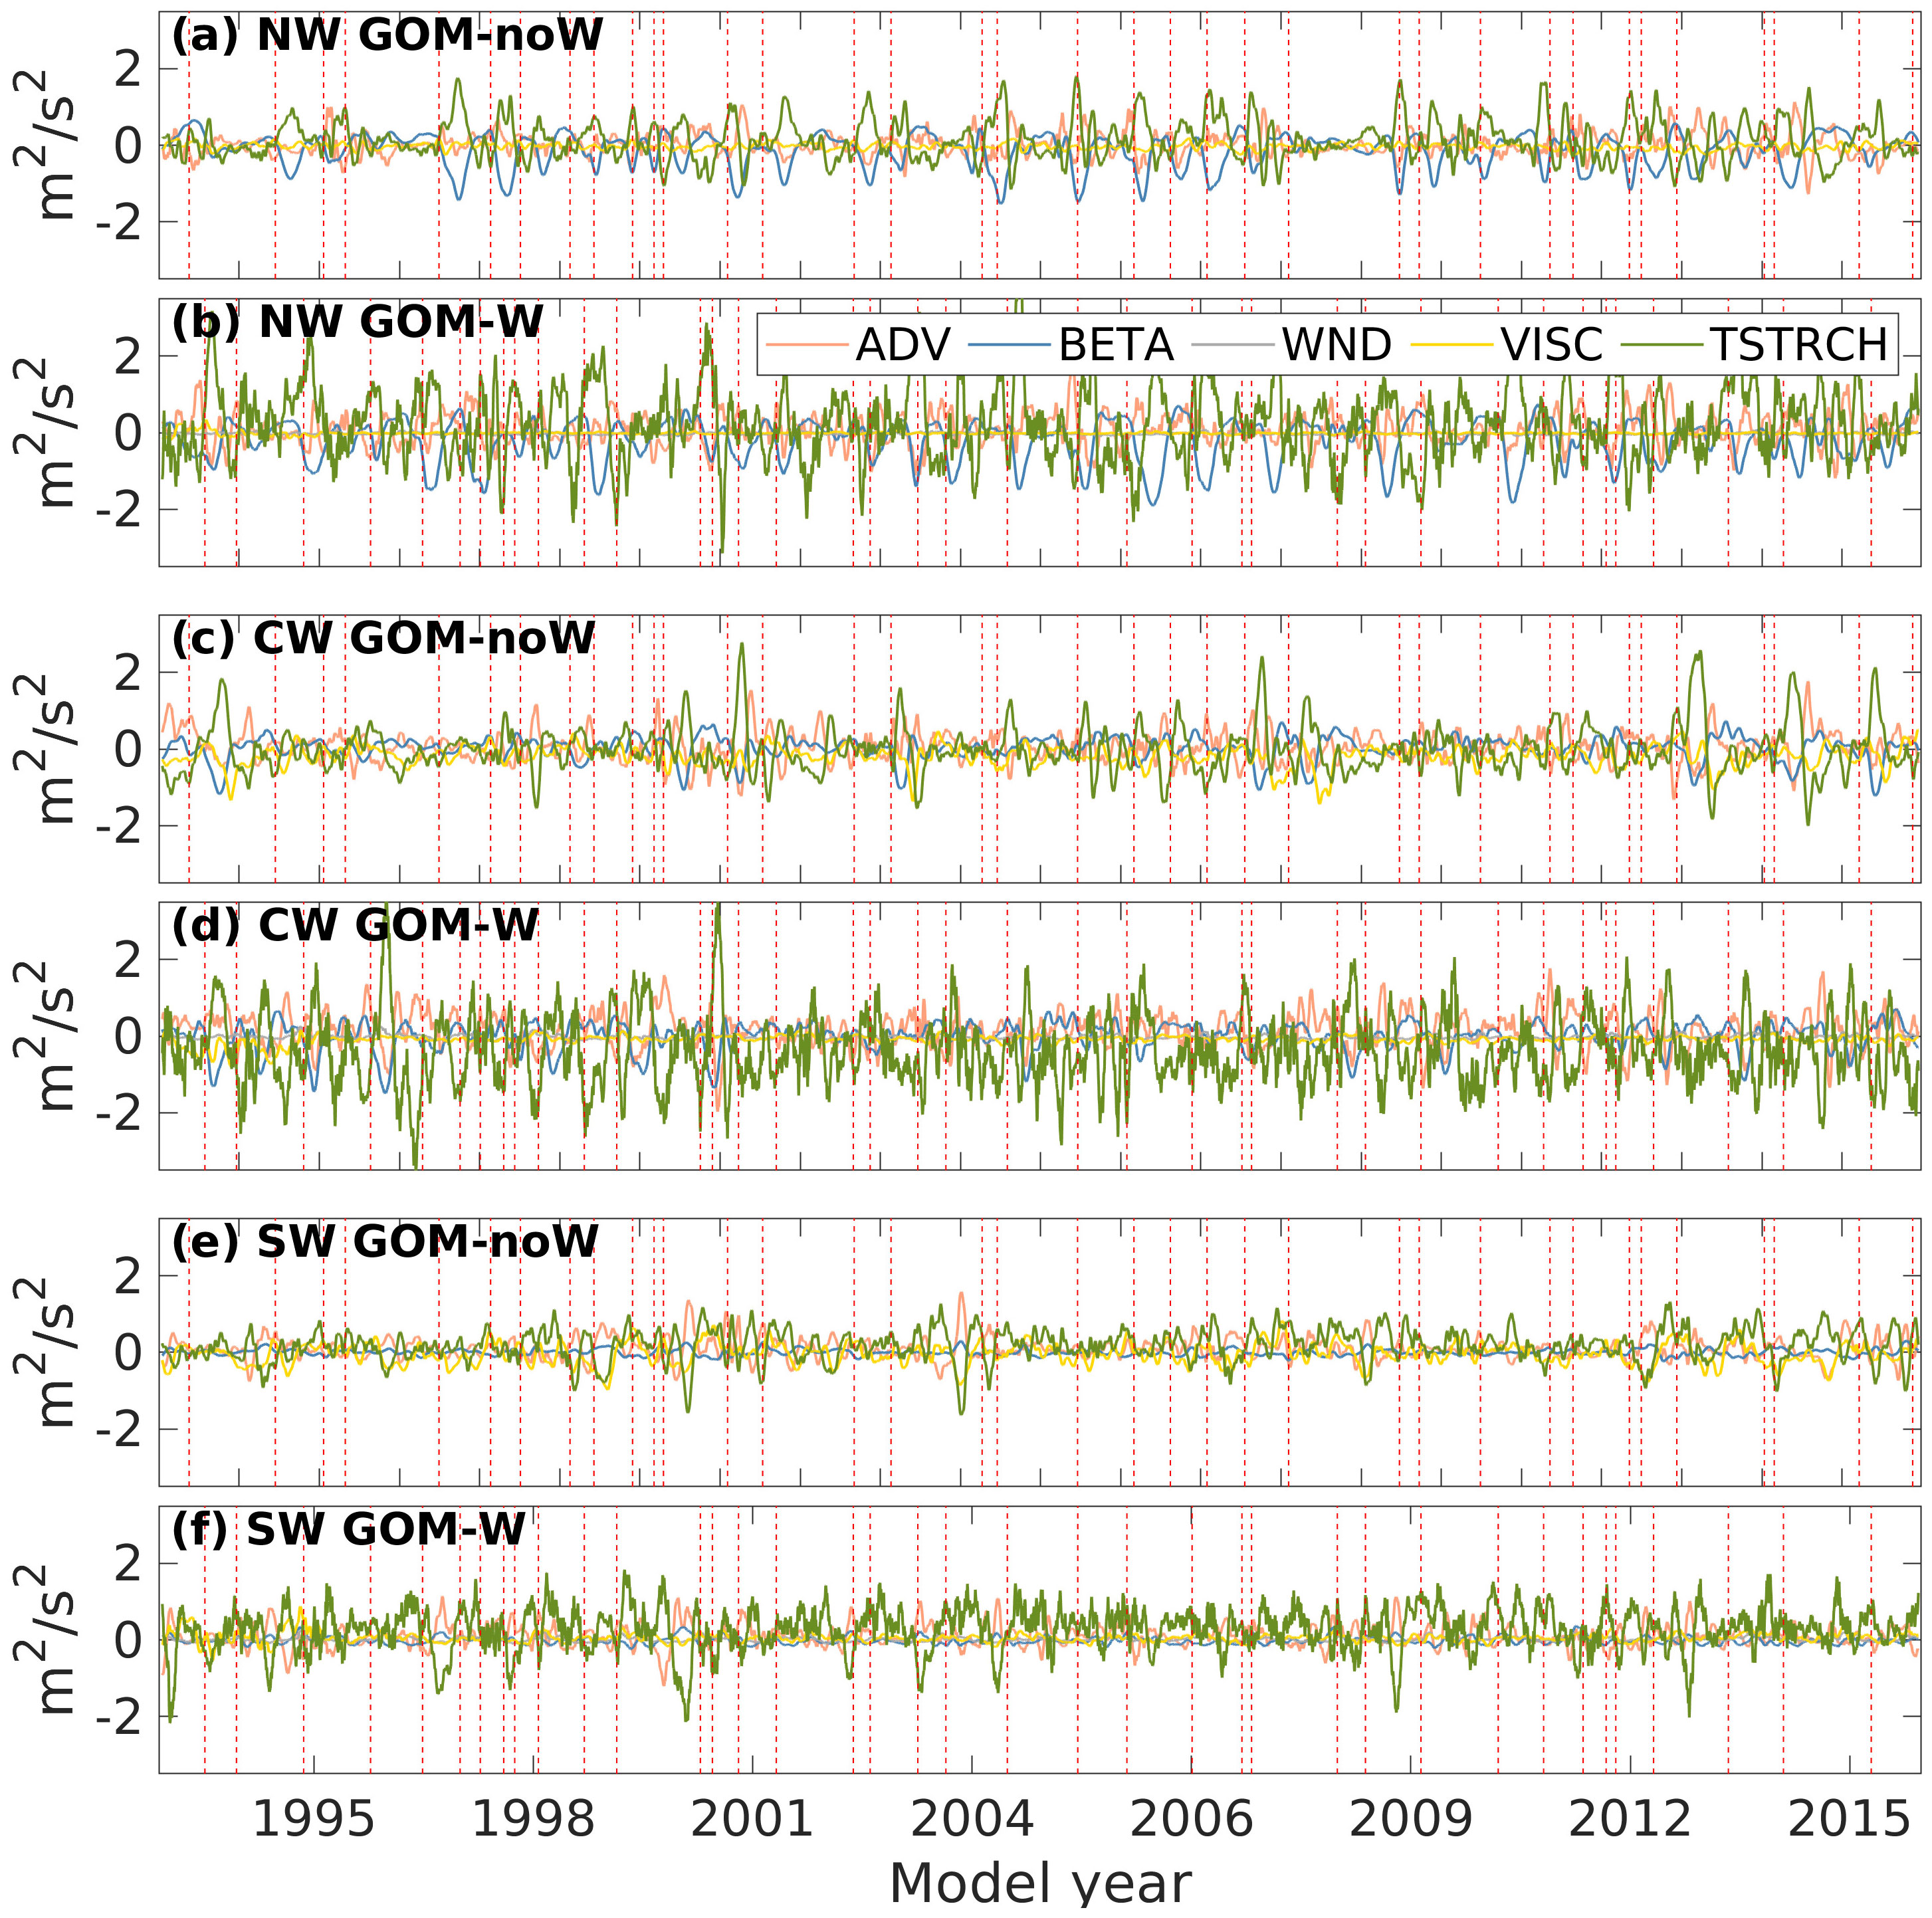
Figure 8 Time series of low-pass filtered spatially-integrated advection of vorticity (pink line), advection of planetary vorticity (blue line), stretching (green line), wind stress curl (gray line) and viscous stress curl (yellow line); for experiment GOM-noW, for the (A) NW (C) CW and (E) SW subregions; and for experiment GOM-W, for the (B) NW (D) CW and (F) SW regions. All values are multiplied by x10-10. Red vertical dashed lines indicate the LCEs shedding dates for the corresponding experiment.
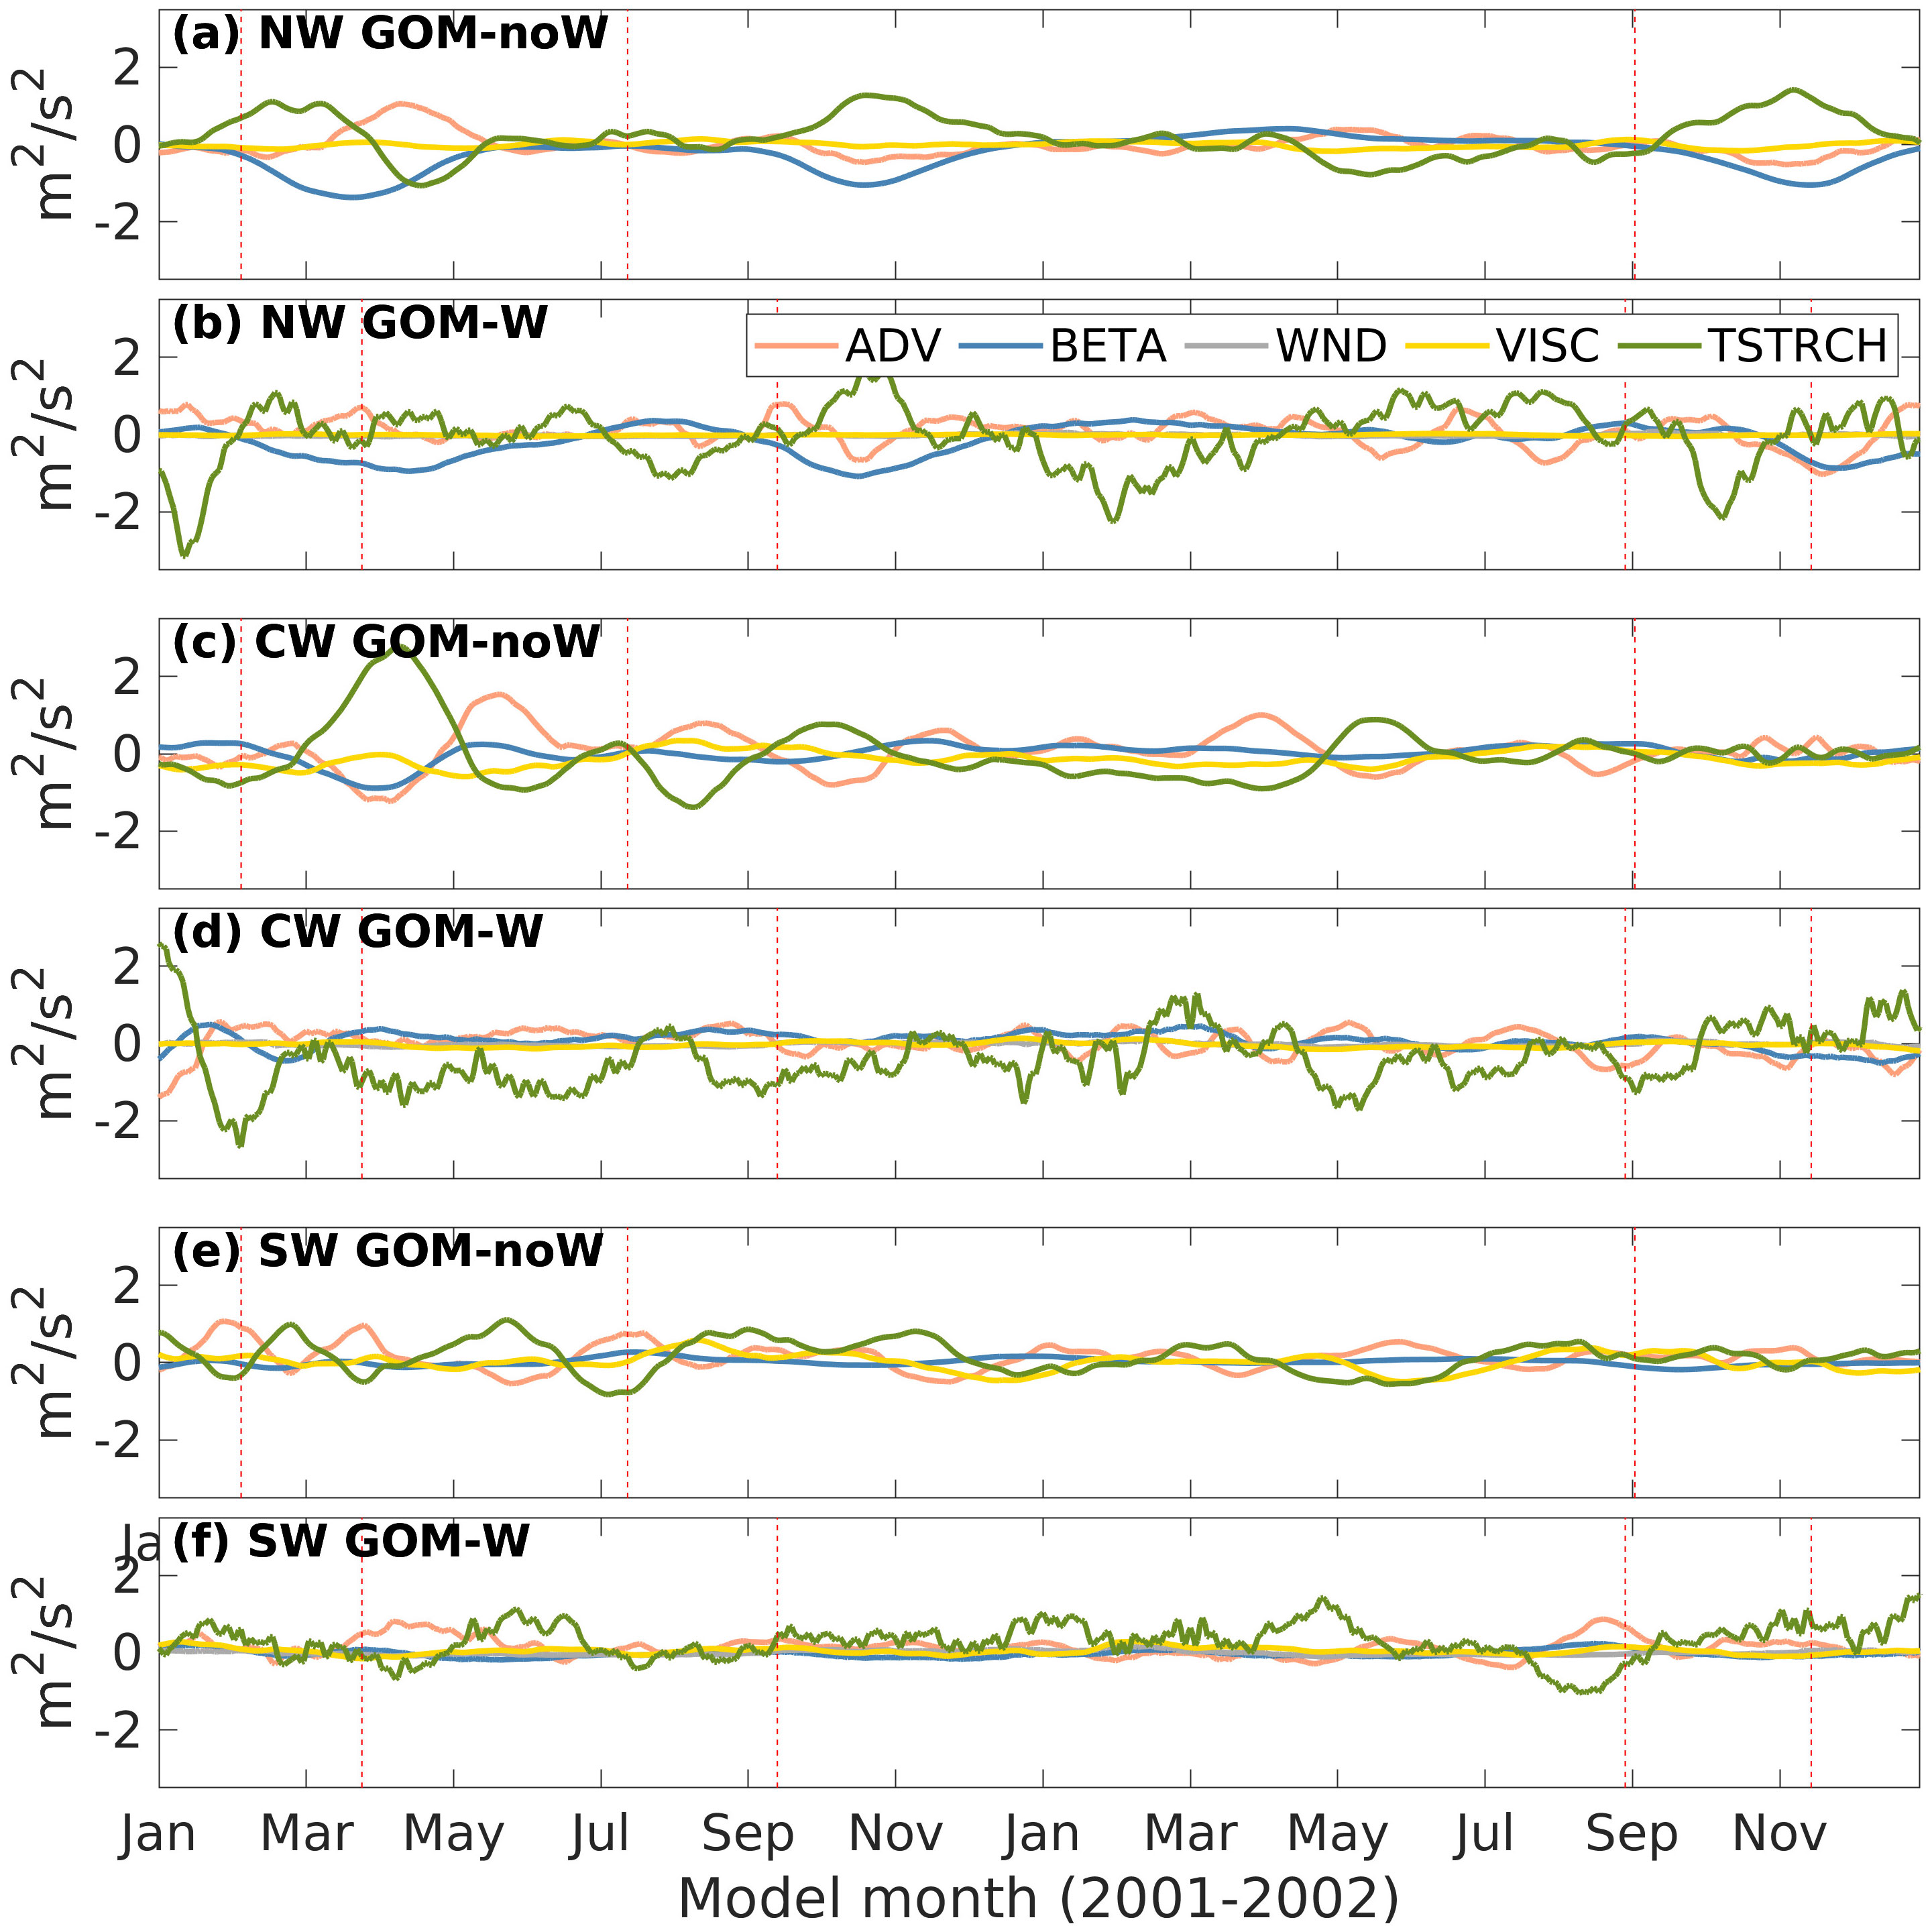
Figure 9 Same as Figure 8 but zoomed-in for model years 2001-2002.
To assess the importance of the different terms in the vorticity balance over long time scales and how they compare between experiments, a scale analysis was performed for the low-pass filtered data of GOM-noW and GOM-W for the whole 22-year simulation. The scale analysis consists of dividing each term by the sum of them i.e., ∂ζ/∂t as defined in Equation 4, in order to ascertain how much of the variability is explained by each term. Figure 10 shows box plots of the distribution of scaled terms for each subregion for the filtered time series. The wide distributions of STRCH in both experiments confirm its dominance in impacting the variability in the three subregions. It can reach values as high as 5 times ∂ζ/∂t, with an exception for the CW subregion in GOM-noW (blue box plots) where ADV becomes equally important as STRCH. ADV and BETA show secondary importance and distributions behave similarly between GOM-noW and GOM-W. WIND and VISC contributions to the vorticity balance can be considered negligible. An interesting result is that the distributions of the vorticity balance terms show a smaller variability for GOM-W than for GOM-noW in the three subregions, which is mainly due to the fact that the amplitude and variability of ∂ζ/∂t is larger for GOM-W (not shown); this fact suggests that circulation remains more persistent through the year in the absence of wind forcing.
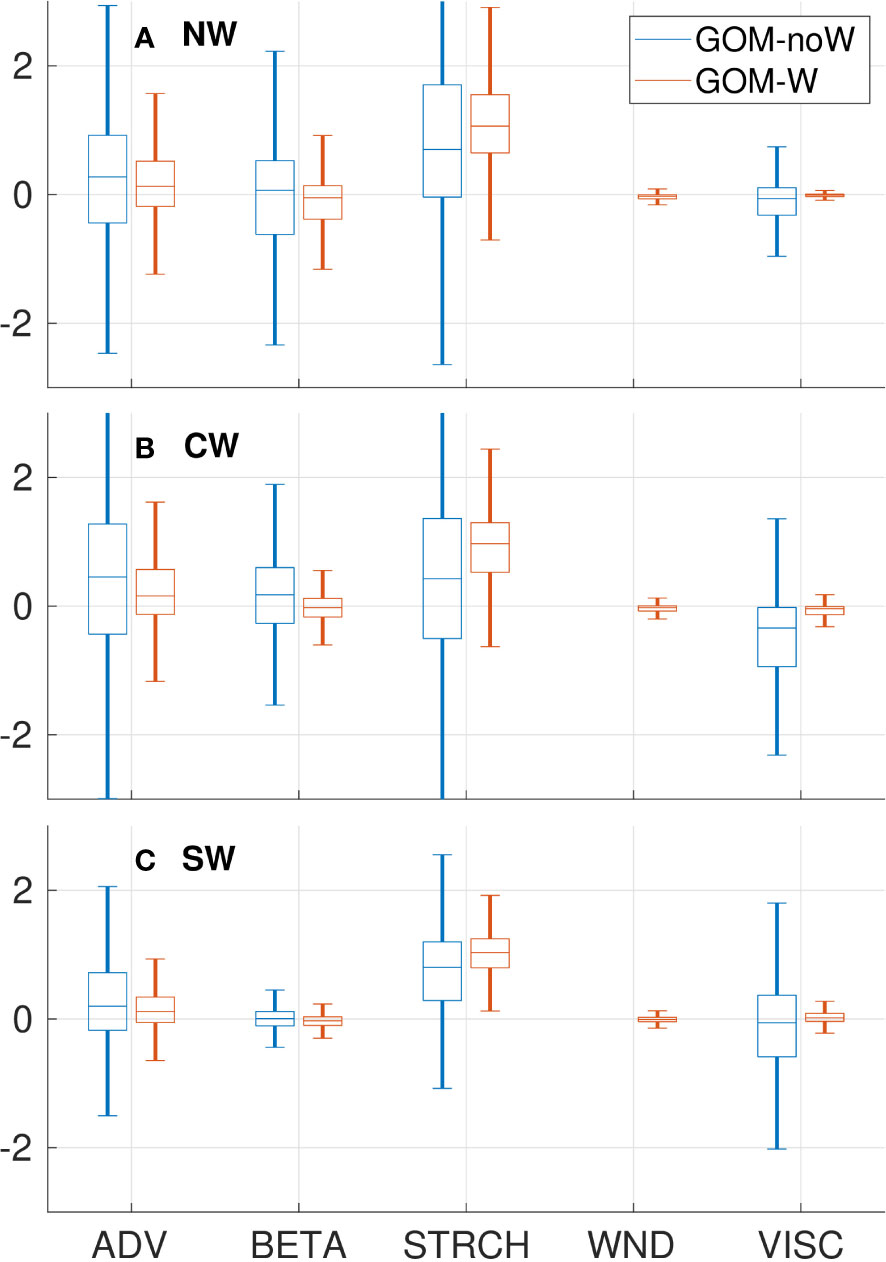
Figure 10 Boxplots of the distributions of vorticity balance terms scaled by ∂ζ/∂t in the (A) NW, (B) CW and (C) SW subregions and for experiments GOM-noW (blue boxes) and GOM-W (red boxes).
Now the question arises as to what ocean process is responsible for the first-order balance between STRCH and BETA lasting around 2-3 months, especially because these events happen with apparently no periodicity. Our hypothesis is that these events could be related to mesoscale features like LCEs. Therefore, we focus on a single event happening in 2005of the GOM-W simulation, to shed more light into the problem. Figure 11 shows the instantaneous horizontal maps of ADV, BETA and STRCH terms for May 2005 for the control experiment (GOM-W), when a LCE is entering the NW subregion, along with the time series of BETA, STRCH and ADV in which the vertical red line indicates the time when the snapshots are shown. Also, the gray thick contours show the 0.17 m contour representing the LCE and LC cores. It can be observed that when the eddy is entering the region, BETA becomes more negative and STRCH more positive, balancing each other; this suggests that the northward velocity in the region becomes stronger and the water column stretches due to the arrival of the deepened isopycnals within the eddy. It also can be seen that, although ADV is not entirely insignificant in the NW subregion (Figure 9A), its time series does not show a distinctive behavior during the period the LCE enters the region (Apr-Jul), but it does later on when it becomes important and balances the STRCH term. It is important to note that LCEs have a direct influence in the CW and NW subregions compared to the SW subregion, where they rarely enter with a sufficiently strong circulation, since they have already experienced some dissipation. Consequently, the BETA term becomes less important in the SW subregion.
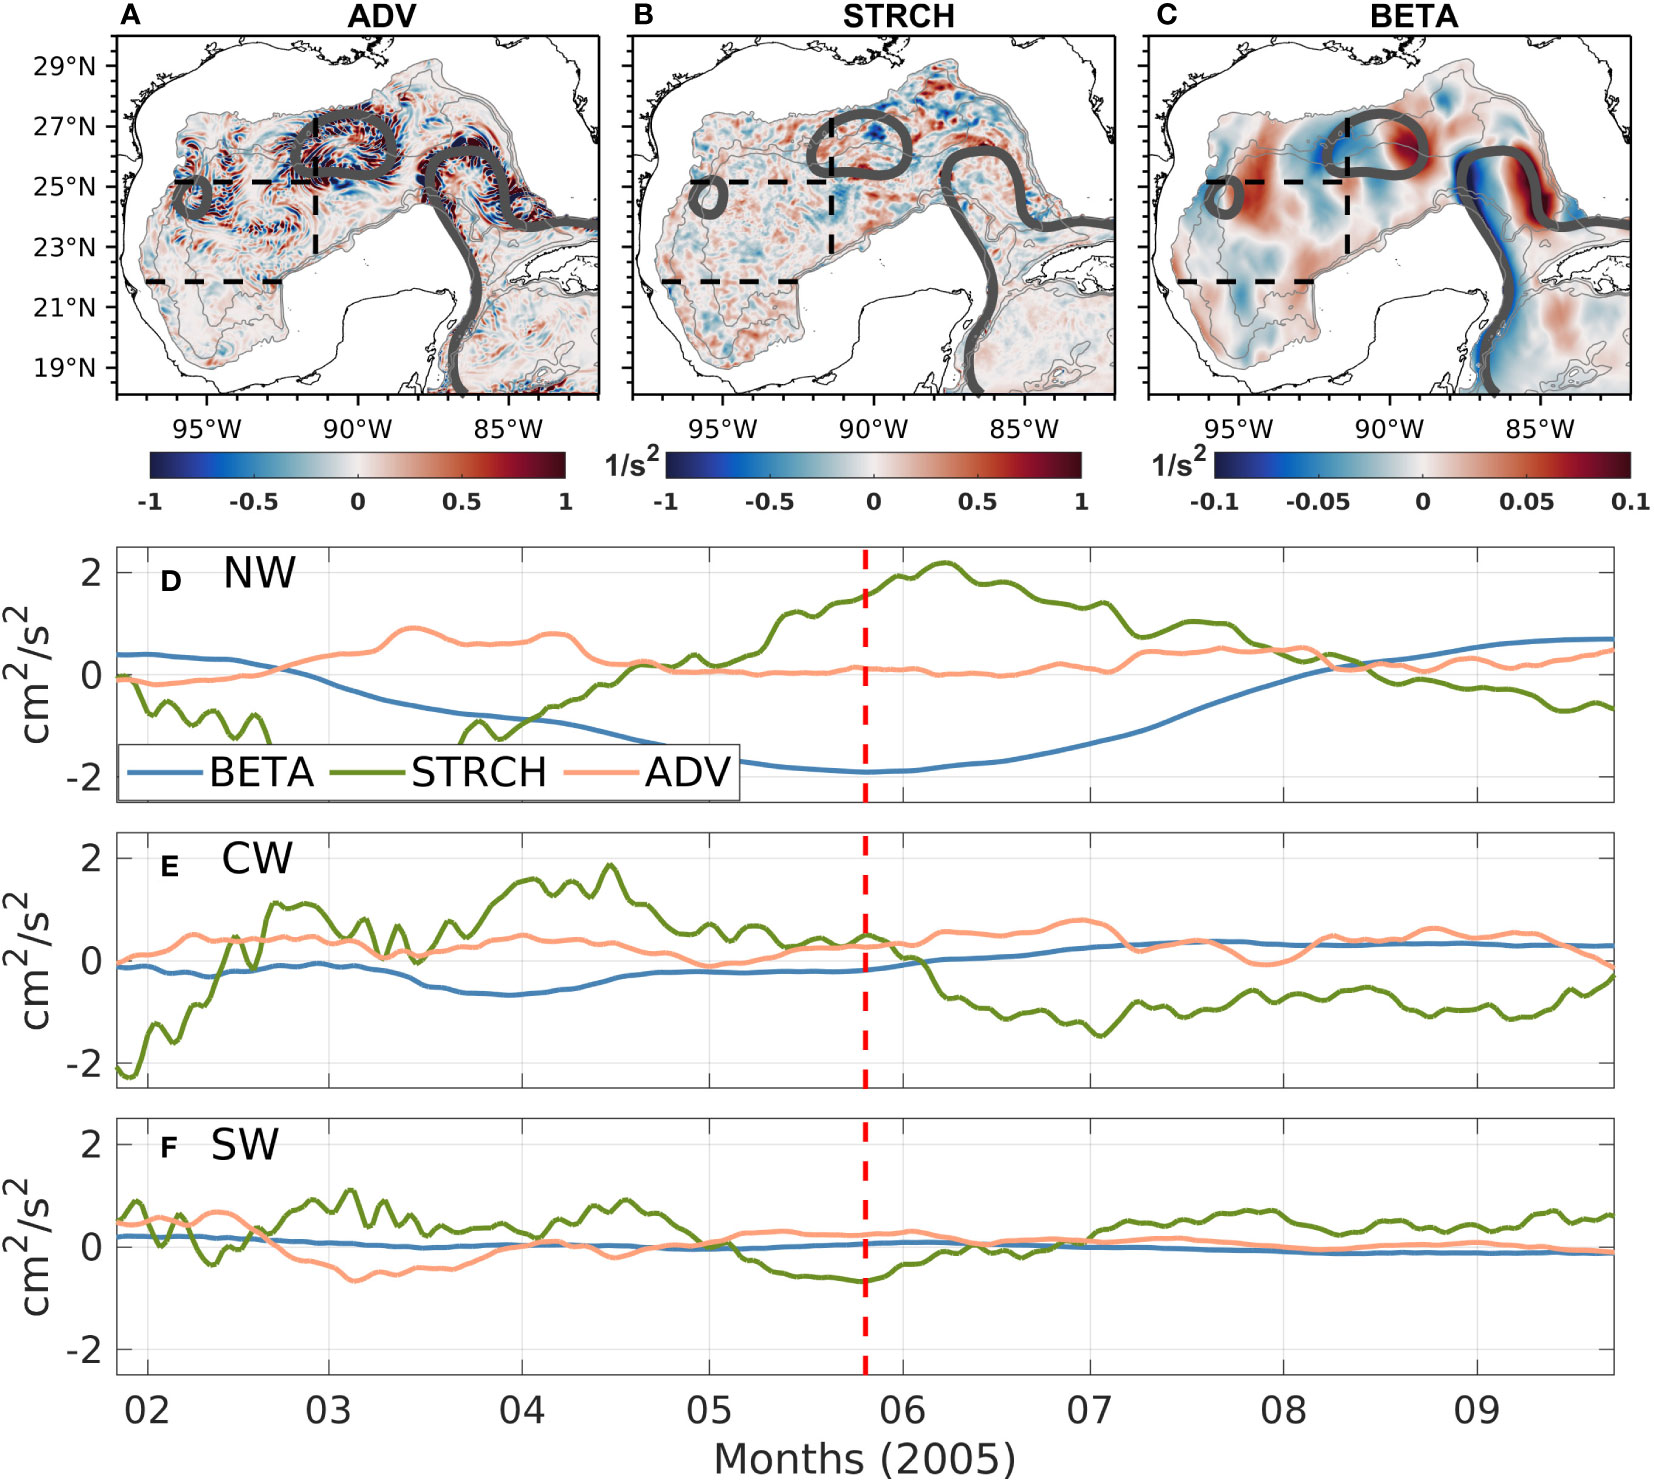
Figure 11 Instantaneous fields of (A) ADV, (B) STRCH and (C) BETA for 26th of May 2005 of experiment GOM-W; the time series are shown for the BETA, STRCH and ADV terms, for the (D) NW, (E) CW and (F) SW subregions. The vertical red line is centered on the date of the analysis.
5 Summary and conclusions
The Gulf of Mexico is one of the most studied regions in the world ocean, even so, there is still a need to better understand the mechanisms that govern the circulation in the region. One example is the western Gulf, where the circulation over deep waters responds to the large-scale, low-frequency winds and the migration of LCEs in a complex way. We used two multi-year, free-running numerical simulations configured for the Gulf of Mexico using HYCOM in order to help us better understand the role of the wind, LCEs and other processes in the circulation of the Gulf but in particular the upper layer (<1000 m) in the western region. The results show that there is an indirect effect of the wind on the circulation leading to an increase of the LCE size, lifespan, speed and distance traveled. Although the scope of the present study is not to understand the mechanisms behind this behavior, the fact that LCEs tend to stay longer in the western GoM in the presence of wind means that the region is exposed to more vorticity input through LCEs. Therefore, we can expect that, for instance, the BETA term in the vorticity balance becomes more important more frequently in experiment GOM-W.
We computed a circulation index (CI), which is the depth-averaged and horizontally integrated relative vorticity for the three subregions in the western Gulf, to estimate the relative contributions of the wind and LCEs on the mean circulation of each subregion. Although the physics of the ocean model is nonlinear, the results show that the effect of these factors is approximately additive as long as the western GoM circulation is thought as an eddy-induced flow superimposed over a wind-driven circulation. We found that, in the NW subregion the LCEs produce a mean cyclonic flow in the absence of wind. When the wind is added, the circulation changes to weakly anticyclonic. In the CW subregion. Mean anticyclonic flow induced by the wind tends to enhance the comparatively weaker anticyclonic flow induced by LCEs. In the SW subregion LCEs and its associated eddy field can induce a cyclonic flow, which is enhanced by the wind.
We analyze the upper (~1000 m) ocean vorticity field in order to obtain a description of the contribution of different processes to the circulation in the three western subregions described above and at different time scales. The results show that stretching (STRCH), the advection of relative vorticity (ADV) and the advection of planetary vorticity (BETA) are the dominant terms transporting or moving around vorticity on average. This can be interpreted as the influence of the mesoscale activity generated by the LCEs and low-frequency (monthly time scale) wind variability. We speculate that the high-frequency (daily time scale) wind variability is responsible for the inertial currents present in the STRCH instantaneous field and in the area-integrated time series. We found that there is a primary balance between the low-pass filtered area-integrated time series of BETA and STRCH within the NW and CW subregions at irregular intervals. This balance is reached by means of isopycnal deepening and strengthen of the y-component of the velocity occurring whenever a LCE enters the eastern boundary of the NW or CW subregions, therefore the variability of these terms become a good indicator of LCEs entering the western Gulf. On the other hand, the scaling analysis helps to determine the relative importance of the STRCH and BETA terms on long time scales, as well as the more persistent cyclonic circulation in the Bay of Campeche compared with the CW and NW subregions. Finally, we found that the input of vorticity through wind stress curl (WIND) and viscous stress curl (VISC) are negligible. However, it is important to clarify that this fact does not mean that the contribution of wind to the circulation is null, it is just that its effect is integrated over a large depth (~1000 m), corresponding to the main thermocline depth, and that its contribution is cumulative.
Future studies can include separation of the vorticity balance terms into the mean and eddy components, and additional approaches to deepen our knowledge of the roles of the wind and LCEs in the western GoM circulation, such as performing new experiments to evaluate: (a) the impact of the current feedback to the wind forcing (Larrañaga et al., 2022), (b) the impact of the wind-SST coupling on the LC and LCE shedding and characteristics (Chelton et al., 2007), and (c) the impact on future climate on the GoM circulation (Liu et al., 2012).
Data availability statement
The raw data supporting the conclusions of this article will be made available by the authors, without undue reservation.
Author contributions
All authors designed the study, analyzed, interpreted the data, and contributed to the writing of the manuscript. EROP ran the numerical simulations. All authors contributed to the article and approved the submitted version.
Funding
The author(s) declare financial support was received for the research, authorship, and/or publication of this article. EC and SM acknowledge support from the Gulf Research Program of the National Academies of Sciences, Engineering, and Medicine under award numbers 2000009966 and 2000013149. SM’s contribution was also made possible by the National Oceanic and Atmospheric Administration (NOAA) Office of Education, Educational Partnership Program with Minority-Serving Institutions award #NA21SEC4810004 (NOAA Center for Coastal and Marine Ecosystems-II). The content is solely the responsibility of the authors and does not necessarily represent the official views of the Gulf Research Program, the National Academies of Sciences, Engineering, and Medicine, or the U.S. Department of Commerce, NOAA.
Acknowledgments
EROP thanks the National Council of Science and Technology of Mexico (CONACYT), the Office of Naval Research (ONR) and the Secretariat of Public Education (SEP) for supporting his PhD studies at the Center for Ocean-Atmospheric Prediction Studies, FSU. We acknowledge Jorge Zavala-Hidalgo and the Instituto de Ciencias de la Atmósfera y Cambio Climático, UNAM, for the use of the supercomputer Ometeotl to run the HYCOM simulations. EROP acknowledges Alexandra Bozec for her guidance and advice when conducting the numerical simulations with HYCOM.
Conflict of interest
The authors declare that the research was conducted in the absence of any commercial or financial relationships that could be construed as a potential conflict of interest.
Publisher’s note
All claims expressed in this article are solely those of the authors and do not necessarily represent those of their affiliated organizations, or those of the publisher, the editors and the reviewers. Any product that may be evaluated in this article, or claim that may be made by its manufacturer, is not guaranteed or endorsed by the publisher.
References
Athié G., Sheinbaum J., Leben R., Ochoa J., Shannon M. R., Candela J. (2015). Interannual variability in the Yucatan channel flow. Geophysical Res. Lett. 42 (5), 1496–1503. doi: 10.1002/2014GL062674
Azevedo Correia de Souza J. M., Powell B., Castillo-Trujillo A. C., Flament P. (2015). The vorticity balance of the ocean surface in Hawaii from a regional reanalysis. J. Phys. Oceanography 45 (2), 424–440. doi: 10.1175/JPO-D-14-0074.1
Bleck R. (2002). An oceanic general circulation model framed in hybrid isopycnic-cartesian coordinates. Ocean Model. 4 (1), 55–88. doi: 10.1016/S1463-5003(01)00012-9
Bleck R., Boudra D. B. (1981). Initial testing of a numerical ocean circulation model using a hybrid (quasi-isopycnic) vertical coordinate. J. Phys. Oceanography 11 (6), 755–770. doi: 10.1175/1520-0485(1981)011<0755:ITOANO>2.0.CO;2
Boudra D. B., Chassignet E. P. (1988). Dynamics of Agulhas retroflection and ring formation in a numerical model. part i: The vorticity balance. J. Phys. Oceanography 18 (2), 280–303. doi: 10.1175/1520-0485(1988)018<0280:DOARAR>2.0.CO;2
Chaichitehrani N., He R. (2024). Investigation of ocean environmental variables and their variations associated with major Loop Current eddy-shedding events in the Gulf of Mexico. Deep Sea Res. Part II: Topical Stud. Oceanography 213, 105354. doi: 10.1016/j.dsr2.2023.105354
Chang Y.-L., Oey L.-Y. (2012). Why does the Loop Current tend to shed more eddies in summer and winter?: seasonal Loop Current shedding. Geophys. Res. Lett. 39 (5), L05605. doi: 10.1029/2011GL050773
Chassignet E. P., Hurlburt H. E., Smedstad O. M., Halliwell G. R., Wallcraft A. J., Metzger E. J., et al. (2006). Generalized vertical coordinates for eddy-resolving global and coastal ocean forecasts. Oceanography 19, 118–129. doi: 10.5670/oceanog.2006.95
Chassignet E. P., Smith L. T., Halliwell G. R., Bleck R. (2003). North atlantic simulations with the hybrid coordinate ocean model (hycom): Impact of the vertical coordinate choice, reference pressure, and thermobaricity. J. Phys. Oceanography 33 (12), 2504–2526. doi: 10.1175/1520-0485(2003)033<2504:NASWTH>2.0.CO;2
Chelton D. B., Schlax M. G., Samelson R. M. (2007). Summertime coupling between sea surface temperature and wind stress in the California current system. J. Phys. Oceanogr. 37, 495–517. doi: 10.1175/JPO3025.1
Donohue K. A., Hamilton P., Leben R., Watts R., Waddell E. (2008). Survey of deepwater currents in the northwestern Gulf of Mexico. Tech. Rep. MMS 2, 91.
Dukhovskoy D. S., Leben R. R., Chassignet E. P., Hall C. A., Morey S. L., Nedbor-Gross R. (2015). Characterization of the uncertainty of loop current metrics using a multidecadal numerical simulation and altimeter observations. Deep-Sea Res. Part I 100, 140–158. doi: 10.1016/j.dsr.2015.01.005
Elliott B. A. (1982). Anticyclonic rings in the Gulf of Mexico. J. Phys. Oceanography 12 (11), 1292–1309. doi: 10.1175/1520-0485(1982)012<1292:ARITGO>2.0.CO;2
Fairall C. W., Bradley E. F., Hare J. E., Grachev A. A., Edson J. B. (2003). Bulk parameterization of air–sea fluxes: updates and verification for the COARE algorithm. J. Climate 16, 571–591. doi: 10.1175/1520-0442(2003)016<0571:BPOASF>2.0.CO;2
Frolov S. A., Sutyrin G. G., Rowe G. D., Rothstein L. M. (2004). Loop current eddy interaction with the western boundary in the Gulf of Mexico. J. Phys. Oceanography 34 (10), 2223–2237. doi: 10.1175/1520-0485(2004)034<2223:LCEIWT>2.0.CO;2
Hamilton (2009). Topographic Rossby waves in the Gulf of Mexico. Prog. Oceanogr. 82 (1), 1–31. doi: 10.1016/j.pocean.2009.04.019
Large W. G., McWilliams J. C., Doney S. C. (1994). Oceanic vertical mixing: A review and a model with a nonlocal boundary layer parameterization. Rev. Geophys. 32 (4), 363–403. doi: 10.1029/94RG01872
Larrañaga M., Renault L., Jouanno J. (2022). Partial control of the Gulf of Mexico dynamics by the current feedback to the atmosphere. J. Phys. Oceanogr. 52, 2515–2530. doi: 10.1175/JPO-D-21-0271.1
Laxenaire R., Chassignet E. P., Dukhovskoy D., Morey S. L. (2023). Impact of upstream variability on the Loop Current dynamics in numerical simulations of the Gulf of Mexico. Front. Mar. Sci. 10. doi: 10.3389/fmars.2023.1080779
Leben R. R. (2005). Altimeter-derived loop current metrics. In Circulation in the Gulf of Mexico: Observations and Models (eds Sturges W., Lugo-Fernandez A.), 181–201. doi: 10.1029/161GM15
Lee H.-C., Mellor G. L. (2003). Numerical simulation of the gulf stream system: The loop current and the deep circulation. Journal of Geophysical Research: Oceans, 108(C2).Liu, Y., S.-K. Lee, B. A. Muhling, J. T. Lamkin, and XXXD. B. Enfield (2012), Significant reduction of the Loop Current in the 21st century and its impact on the Gulf of Mexico. J. Geophys. Res. 117, C05039. doi: 10.1029/2011JC007555
Liu M., Tanhua T. (2021). Water masses in the Atlantic Ocean: characteristics and distributions. Ocean Sci. 17, 463–486. doi: 10.5194/os-17-463-2021
Liu Y., Lee S.-K., Muhling B. A., Lamkin J. T., Enfield D. B. (2012). Significant reduction of the Loop Current in the 21st century and its impact on the Gulf of Mexico. J. Geophys. Res. 117, C05039. doi: 10.1029/2011JC007555
Metzger E., Helber R., Hogan P., Posey P., Thoppil P., Townsend T., et al. (2017). Global ocean forecast system 3.1 validation testing. 60.
Meza-Padilla R., Enriquez C., Liu Y., Appendini C. M. (2019). Ocean circulation in the western Gulf of Mexico using self-organizing maps. J. Geophys. Res. Oceans 124, 4152–4167. doi: 10.1029/2018JC014377
Morey S., Gopalakrishnan G., Pallaz Sanz E., Azevedo C., Donohue K., Perez-Brunius P., et al. (2020). Assessment of numerical simulations of deep circulation and variability in the Gulf of Mexico using recent observations. J. Phys. Oceanogr. 50, 1045–1064. doi: 10.1175/JPO-D-19-0137.1
Morey S. L., Zavala-Hidalgo J., O'Brien J. J. (2005). “The seasonal variability of continental shelf circulation in the northern and western Gulf of Mexico from a high-resolution numerical model,” in Circulation in the Gulf of Mexico: Observations and Models. Eds. Sturges W., Lugo-Fernandez A, 203–218. doi: 10.1029/161GM16
Murray C. P., Morey S. L., O’Brien J. J. (2001). Interannual variability of upper ocean vorticity balances in the Gulf of Alaska. J. Geophysical Research: Oceans 106 (C3), 4479–4491. doi: 10.1029/1999JC000071
Oey L.-Y., Lee H.-C., Schmitz W. J. Jr. (2003). Effects of winds and Caribbean eddies on the frequency of Loop Current eddy shedding: A numerical model study. J. Geophys. Res. 108, 3324. doi: 10.1029/2002JC001698
Ohlmann J. C., Niiler P. P., Fox C. A., Leben R. R. (2001). Eddy energy and shelf interactions in the Gulf of Mexico. J. Geophys Res. Oceans 106 (C2), 2605–2620. doi: 10.1029/1999JC000162
Olvera-Prado E. R., Moreles E., Zavala-Hidalgo J., Romero-Centeno R. (2023a). “Upper–lower layer coupling of recurrent circulation patterns in the Gulf of Mexico,” in Journal of Physical Oceanography, vol. 53. , 533–550. Available at: https://journals.ametsoc.org/view/journals/phoc/53/2/JPO-D-21-0281.1.xml. Retrieved Feb 14, 2023.
Olvera-Prado E. R., Romero-Centeno R., Zavala-Hidalgo J., Moreles E., Ruiz-Angulo A. (2023b). Contribution of the wind, Loop Current Eddies, and topography to the circulation in the southern Gulf of Mexico. Ocean Dynamics. 73, 597–618. doi: 10.1007/s10236-023-01569-5
Perez-Brunius P., Furey H., Bower A., Hamilton P., Candela J., Garcıa-Carrillo P., et al. (2018). Dominant circulation patterns of the deep Gulf of Mexico. J. Phys. Oceanography 48 (3), 511–529. doi: 10.1175/JPO-D-17-0140.1
Perez-Brunius P., Garcıa-Carrillo P., Dubranna J., Sheinbaum J., Candela J. (2013). Direct observations of the upper layer circulation in the southern Gulf of Mexico. Deep Sea Research Part II: Topical Studies in Oceanography. Modern Phys. Oceanography Professor H.T. Rossby 85, 182–194. doi: 10.1016/j.dsr2.2012.07.020
Romanou A., Chassignet E. P., Sturges W. (2004). Gulf of Mexico circulation within a high-resolution numerical simulation of the north atlantic ocean. J. Geophysical Research: Oceans 109, C01003. doi: 10.1029/2003JC001770
Rousset C., Beal L. M. (2010). Observations of the florida and yucatan currents from a caribbean cruise ship. J. Phys. Oceanography 40 (7), 1575–1581. doi: 10.1175/2010JPO4447.1
Saha S., Moorthi S., Pan H., Wu X., Wang J., Nadiga S. (2010). The NCEP climate forecast system reanalysis. Bull. Am. Meteorological Soc. 91 (8), 1015–1058. doi: 10.1175/2010BAMS3001.1
Schmitz W., Biggs D., Lugo-Fernandez A., Oey L.-Y., Sturges W. (2005). A Synopsis of the Circulation in the Gulf of Mexico and on its Continental Margins. 11–29. doi: 10.1029/161GM03
Sheinbaum J., Candela J., Badan A., Ochoa J. (2002). Flow structure and transport in the Yucatan channel. Geophysical Res. Lett. 29 (3), 10–1–10–4. doi: 10.1029/2001GL013990
Sturges W. (1993). The annual cycle of the western boundary current in the Gulf of Mexico. J. Geophysical Research: Oceans 98 (C10), 18053–18068. doi: 10.1029/93JC01730
Sturges W. (2020). On the mean flow in the western Gulf of Mexico and a reappraisal of errors in ship-drift data. J. Phys. Oceanography 50 (7), 1983–1988. doi: 10.1175/JPO-D-19-0260.1
Sturges W., Blaha J. P. (1976). A western boundary current in the Gulf of Mexico. Science 192 (4237), 367–369. doi: 10.1126/science.192.4237.367
Sturges W., Leben R. (2000). Frequency of ring separations from the loop current in the Gulf of Mexico: A revised estimate. J. Phys. Oceanography 30 (7), 1814–1819. doi: 10.1175/1520-0485(2000)030<1814:FORSFT>2.0.CO;2
Townsend T. L., Hurlburt H. E., Hogan P. J. (2000). Modeled Sverdrup flow in the North Atlantic from 11 different wind stress climatologies. Dyn. Atmo. Ocean 32 (3-4), 373–417. doi: 10.1016/S0377-0265(00)00052-X
Vázquez de la Cerda A. M., Reid R. O., DiMarco S. F., et al. (2005). “Bay of Campeche circulation: An update,” in Circulation in the Gulf of Mexico: Observations and Models. Eds. Sturges W., Lugo-Fernandez A. (American Geophysical Union (AGU), 279–293. doi: 10.1029/161GM20
Vidal V. M. V., Vidal F. V., Hernandez A. F., Meza E., Perez-Molero J. M. (1994). Baroclinic flows, transports, and kinematic properties in a cyclonic-anticyclonic-cyclonic ring triad in the gulf of Mexico. J. Geophysical Research: Oceans 99 (C4), 7571–7597. doi: 10.1029/93JC03334
Vidal V. M. V., Vidal F. V., Meza E., Portilla J., Zambrano L., Jaimes B. (1999). Ring slope interactions and the formation of the western boundary current in the Gulf of Mexico. J. Geophysical Research: Oceans 104 (C9), 20523–20550. doi: 10.1029/1999JC900118
Vidal V. M. V., Vidal F. V., Perez-Molero J. M. (1992). Collision of a loop current anticyclonic ring against the continental shelf slope of the western Gulf of Mexico. J. Geophysical Research: Oceans 97 (C2), 2155–2172. doi: 10.1029/91JC00486
Vukovich F. M. (2007). Climatology of ocean features in the Gulf of Mexico using satellite remote sensing data. J. Phys. Oceanography 37 (3), 689–707. doi: 10.1175/JPO2989.1
Vukovich F. (2012). Changes in the loop current’s eddy shedding in the period 2001–2010. Int. J. Oceanography 2012, 11–18. doi: 10.1155/2012/439042
Wallcraft A., Metzger E., Carroll S. (2009). Software design description for the HYbrid Coordinate Ocean Model (HYCOM), version 2.2.
Zavala-Hidalgo J., Romero-Centeno R., Mateos-Jasso A., Morey S. L., Martınez-Lopez B. (2014). The response of the Gulf of Mexico to wind and heat flux forcing: What has been learned in recent years? Atmosfera 27 (3), 317–334. doi: 10.1016/S0187-6236(14)71119-1
Keywords: Gulf of Mexico, Loop Current eddies, wind forcing, ocean modeling, vorticity balance
Citation: Olvera-Prado ER, Morey SL and Chassignet EP (2024) Contribution of the wind and Loop Current eddies to the circulation in the western Gulf of Mexico. Front. Mar. Sci. 11:1185849. doi: 10.3389/fmars.2024.1185849
Received: 14 March 2023; Accepted: 29 January 2024;
Published: 15 February 2024.
Edited by:
Weifeng (Gordon) Zhang, Woods Hole Oceanographic Institution, United StatesReviewed by:
Huijie Xue, University of Maine, United StatesNabi Allahdadi, North Carolina State University, United States
Copyright © 2024 Olvera-Prado, Morey and Chassignet. This is an open-access article distributed under the terms of the Creative Commons Attribution License (CC BY). The use, distribution or reproduction in other forums is permitted, provided the original author(s) and the copyright owner(s) are credited and that the original publication in this journal is cited, in accordance with accepted academic practice. No use, distribution or reproduction is permitted which does not comply with these terms.
*Correspondence: Erick R. Olvera-Prado, ZXJvbHZlcmFAaXp0LnVhbS5teA==