- 1Department of Fisheries, Faculty of Agriculture and Natural Resources, Gonbad Kavous University, Gonbad Kavous, Iran
- 2Faculty of Fisheries and Environmental Science, Gorgan University of Agricultural and Natural Resources, Gorgan, Iran
- 3Iran Fisheries Organization, Bushehr, Iran
- 4CAS in Marine Biology, Faculty of Marine Sciences, Annamalai University, Parangipettai, Tamil Nadu, India
The widespread presence of microplastics (MPs) in freshwater systems as an emerging environmental pollutant has caused a global environmental problem. The present study investigates the distribution and abundance of source pathway and abundance of microplastics in surface sediment samples from rivers discharging into the Gorgan Bay, southeast of the Caspian Sea. A total of 57 surface sediment samples were taken from 19 stations to investigate the potential hot spots of pollution in the four rivers leading to the Gorgan Bay. The average level of microplastics was 333 ± 268 particles/kg. The highest amount is in the estuary of the Qarasu River (1080 ± 380 particles/kg) due to the accumulation of fishing, boating and tourism activities and the lowest amount in the forest area (80 ± 19 particles/kg) in the Klak River. The most common type of microplastic was fiber (68%). Microplastic pollution in the studied rivers is mostly black and gray (75.39%), and about 53% of them were sized less than 1000 μm. Spectroscopic analysis (Fourier Transform Infrared (FT-IR) of the MP showed that 37% were polyethylene, polyethylene (37%) and polypropylene (27%) were the dominating groups. The sediments’ size was significantly correlated (p>0.05) with the presence of microplastics. Sediments with a coarse grain (sand) demonstrated a great potential to store microplastics. The results of this study can be used for the management and protection policies of Gorgan Bay.
Introduction
Plastics, which are synthetic polymers, have become integral to modern life and have had a significant impact on various aspects of society. The production and consumption of plastic have been steadily increasing since the mid-20th century. In 2020, the global production of plastics reached a staggering 367 million tonnes, with Asia being responsible for 51% of this total (Plastics Europe, 2020). While plastics offer numerous benefits to society and the economy, the improper disposal of plastic waste has led to environmental pollution and poses risks to ecosystems. Consequently, plastic pollution has become a pressing global environmental concern (van Emmerik and Schwarz, 2020).
Microplastics (MPs) are tiny plastic particles with a diameter smaller than 5 mm, and they are believed to have detrimental effects on ecosystems. Several researchers have conducted studies on the abundance, distribution, types, shapes, sizes, polymer colors, and potential ecotoxicological threats posed by MPs (Auta et al., 2017; Peng et al., 2020). However, there is a limited amount of research focused on understanding the abundance, distribution, characteristics, pollution hotspots, risks, and fate of MP pollution in river environments (Horton et al., 2017; Blettler et al., 2018; Li et al., 2018).
Microplastics (MPs) found in the environment can be classified into two categories: primary and secondary. Primary MPs originate from sources such as personal care products, fertilizers, detergents, cleaning products, and paints. On the other hand, secondary MPs are formed through the fragmentation of larger plastic items under various environmental conditions, including exposure to sunlight, oxidants, weathering, and degradation (Gewert et al., 2015; Scudo et al., 2017). Both riverine and marine systems receive MPs from different sources. Point sources, such as wastewater treatment plants, contribute to the presence of MPs in water bodies. Additionally, non-point terrestrial sources, such as agricultural areas, also contribute to the input of MPs into rivers and oceans (Siegfried et al., 2017; Kataoka et al., 2019).
Rivers play a dual role in the transport of microplastics, acting both as sinks and as conduits to the oceans (Scherer et al., 2020). Whether microplastics float near the water’s surface or sink to the bottom depends on their density and shape (Waldschläger and Schüttrumpf, 2019). The Caspian Sea, being an important marine system, is exposed to significant industrial and transportation activities, as well as oil pollution. The sinking of microplastics into sediments in coastal areas of the Caspian Sea, including Gorgan Bay, may be attributed to factors such as tourism development, river flow, and disturbances caused by shipping and fishing. Additionally, microplastic debris can experience increased density after biofouling, which occurs when microorganisms rapidly colonize the surfaces of microplastics. Due to their lower density, microplastic particles are more easily re-mobilized compared to natural sediments (Waldschläger and Schüttrumpf, 2019). The distribution and occurrence of microplastics in river systems are complex and influenced by the distribution of pollutants and sources (Haberstroh et al., 2021), as well as fluvial dynamics, including seasonality (Laermanns et al., 2021). Several studies highlight the significance of medium and small rivers in microplastic distribution, noting that the abundance of microplastics is often higher in smaller rivers due to their proximity to point sources (Constant et al., 2020; Kunz et al., 2023; Büngener et al., 2024). Consequently, tributaries are increasingly recognized as significant contributors of microplastics to larger rivers (Scherer et al., 2020).
Indeed, urban areas have been identified as significant point sources of pollution to rivers, and the abundance and types of microplastics (MPs) found in rivers are influenced by factors such as population size and the number of industrial and wastewater treatment plant (WWTP) discharge points in these urban areas (Murphy et al., 2016; Kataoka et al., 2019). Additionally, non-point sources of pollution associated with terrestrial uses, including agriculture, can also contribute to the presence of MPs in the aquatic environment. These non-point sources may include sewage sludge, coated fertilizers, irrigation water, agrochemicals, and other agricultural inputs (Huang et al., 2020; Ouyang et al., 2020; Qiu et al., 2020). However, there is still limited knowledge about the effects of land use on the contributions of both non-point and point sources of microplastic contamination in river environments (Siegfried et al., 2017; Kataoka et al., 2019). Therefore, it is crucial to study the emission of MPs from rivers to bays in order to understand the transport, fate, and plastic pollution loads from terrestrial sources to marine environments. Concentrations of microplastics in freshwater sediments have been found to reach similar levels as those observed in some of the most contaminated marine sediments worldwide (Hu et al., 2018; Luo et al., 2019).
Plastic polymers, including substances like polyvinyl chloride (PVC), can indeed have toxic effects on both humans and animals. Some plastic polymers have been identified as carcinogens and mutagens, posing risks to health (Lithner et al., 2011). Microplastic pollution presents significant risks to the environment, including the ingestion of microplastic particles by marine organisms, which can lead to various health issues (Li, 2019). Furthermore, studies have observed the presence of different polymer types in human urine and blood, indicating potential exposure and uptake of microplastics in humans (Xu et al., 2018). The impact of microplastics on human health, environmental protection, and global sustainability is of great concern. Despite the widespread presence of microplastics in aquatic environments, our understanding of the threats posed by these pollutants is still limited (Koelmans et al., 2017). Therefore, it is essential to develop pollution load indices and conduct risk assessments for different polymer types and their hotspots. Such assessments are crucial for the development and implementation of effective pollution control and management strategies to mitigate the risks associated with microplastic pollution.
The Caspian Sea and Gorgan Bay are important as an ecologically sensitive environments both in terms of aquatic (including sturgeon and Caspian kutum) and in terms of residential, and tourist (Gholizadeh and Patimar, 2018). Previous studies on microplastics (MPs) in Gorgan Bay have been conducted by Bagheri et al. (2020) and Gholizadeh and Cera (2022). However, these studies have only investigated a limited number of locations, providing a partial understanding of the issue. Furthermore, there is a scarcity of information in Iran regarding the contamination of rivers with MPs resulting from various land uses, including agriculture, industry, and residential drainage (Soltani et al., 2022). Therefore, conducting research on MPs pollution in river water can offer valuable new insights into identifying sources and understanding their impacts. Additionally, it is important to estimate the distribution of MPs from rivers to Gorgan Bay, taking into account the influence of various human activities occurring along its margins, such as agriculture, urban sewage, and tourism. Such research should also assess the types of polymers present in the microplastics. This information is crucial for the development of effective measures to mitigate microplastic pollution and implement appropriate management approaches in Gorgan Bay.
This study aimed to investigate the distribution of microplastics (MPs) in rivers, focusing on the relationship between human activities and MP pollution levels. The hypothesis posited that the upstream areas of the rivers, characterized by minimal human activity in high-altitude regions, would have the lowest MP concentrations, while the downstream areas affected by intensive human activities such as agriculture and residential areas would exhibit the highest MP levels. To test this hypothesis, the frequency and quantity of MPs in the sediment were examined in the Kalk, Mohammadabad, Bagu, and Qarasu rivers, extending from the upstream regions to the downstream area leading to the Gorgan Bay. The research objectives included comparing MP pollution levels among different river stations, investigating patterns of MP distribution related to urban and agricultural inputs, assessing the potential increase in MP pollution from upstream to downstream, and identifying hotspots for ecological monitoring and plastic waste management. This study provides a comprehensive assessment of MPs in rivers, examining their loading under various land uses, their transfer to the Gorgan Bay as a source channel, and the associated risks to river environments.
Materials and methods
Study sites, sampling and sample preparation
Gorgan Bay, situated in the southeast of the Caspian Sea, is the largest bay in the region. It is formed by the Miankaleh Peninsula, which extends into the Caspian Sea. Gorgan Bay, along with Miankaleh Wetland and Lapoo-Zaghmarz, has been designated as a Ramsar site, making it the world’s first internationally recognized wetland complex. The bay, along with its surrounding areas including Miankaleh Peninsula and Gomishan International Wetland, provides a valuable habitat for various species. It is also part of the Miankaleh Wildlife Sanctuary. The ecosystem of Gorgan Bay is influenced by the Caspian Sea, nearby rivers, and the Miankaleh Peninsula. The region is home to 23 distinct habitats that support diverse communities of coastal marine animals. The Kelak, MohammadAbad, and Baghu rivers, located on the hillside of Jahan Mora Mountain, are relatively small in scale. Baghu village, situated in Bandargaz city, has a population of around 700 people and cultivates approximately 142 hectares of agricultural land. The main occupations in this village are traditional agriculture, horticulture, and animal husbandry. Klak River, located in Khalil Shahr city with a population of 19,421 people, is known for horticulture and agriculture. The river originates from a mountainous area, passes through cities, villages, and agricultural lands, and eventually flows into Gorgan Bay. The Qarasu watershed, one of the three main sub-basins in the northern Alborz area, covers a wide area of the Gorgan plain in the southwest of Golestan province. It spans an area of approximately 1638 km2 and has a varied topography, with altitudes ranging from -26 meters at the mouth of Gorgan Bay to 3200 meters in the heights of Garmabadesht. The rivers within the Qarasu watershed have an average slope of 1.2%. The basin’s average height is 624 meters, and it receives an average annual rainfall of 581 mm. Qarasu River used to serve as a natural spawning ground for Rutilus rutilus.
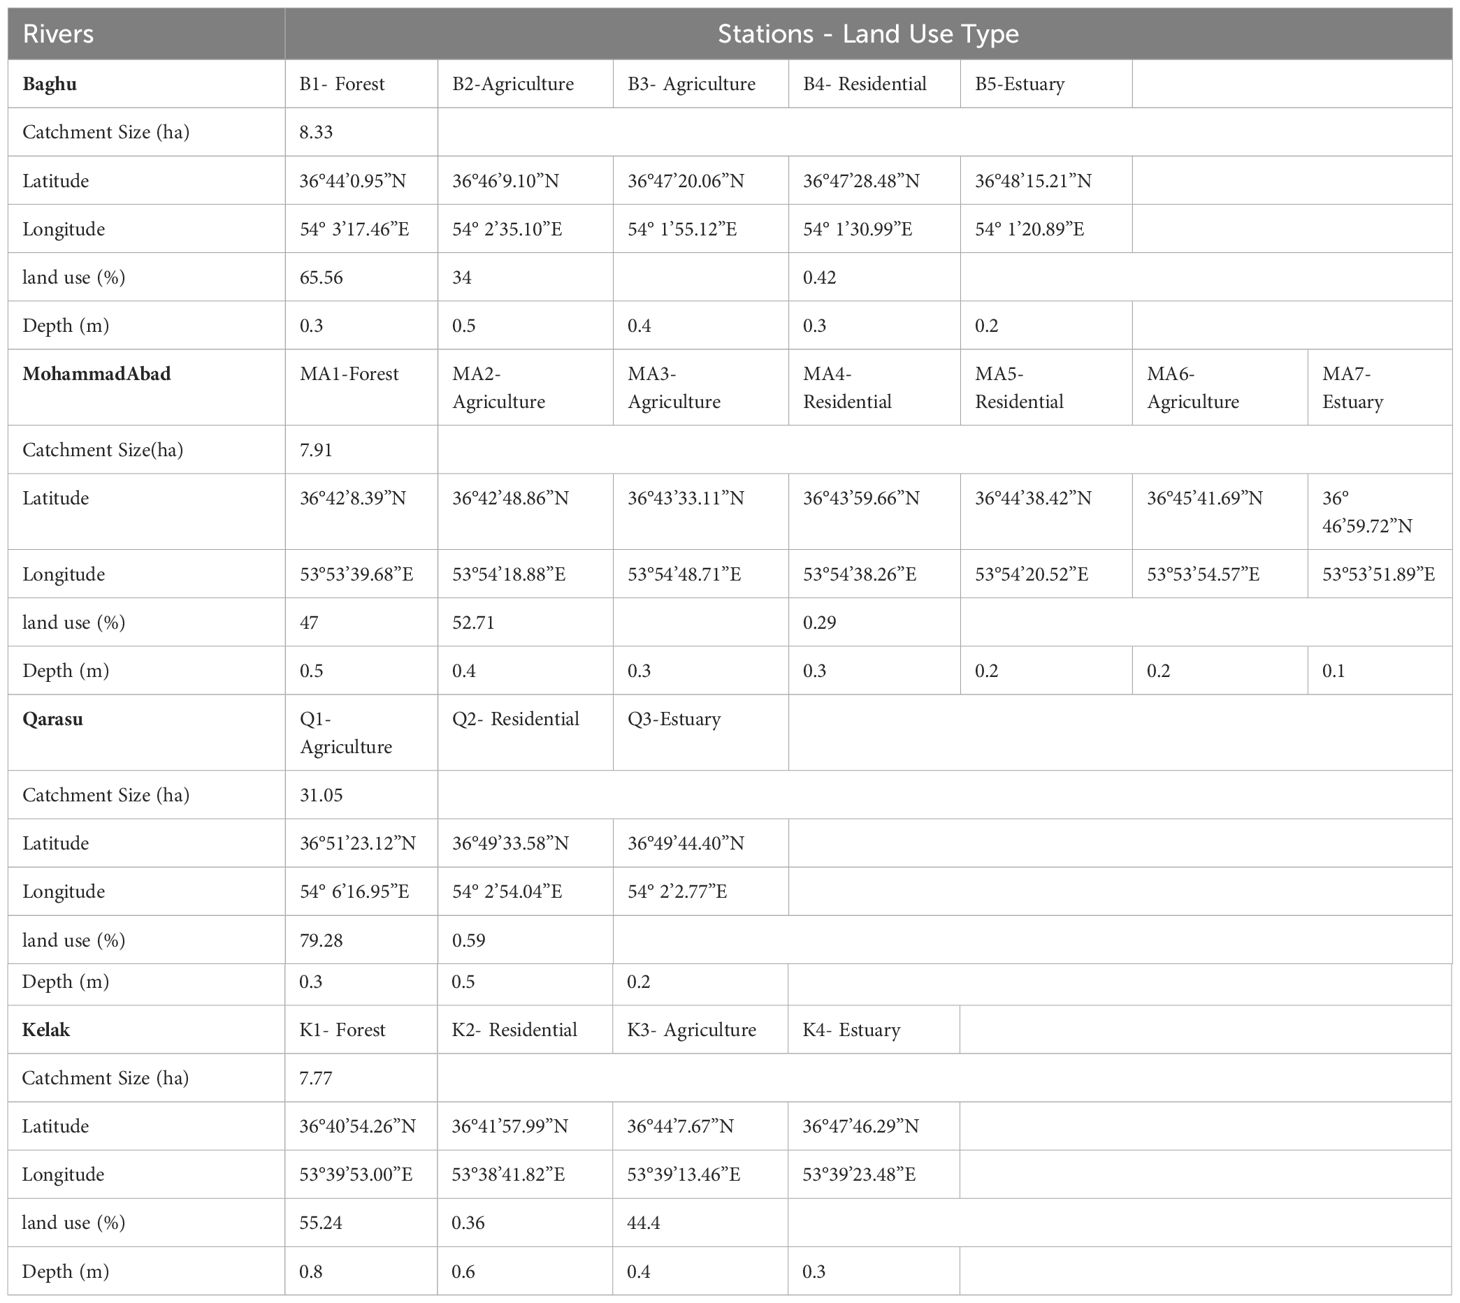
The study employed a sampling approach to select stations along the rivers based on their location in the upstream, middle, and downstream regions. The first station of each river was situated in the upstream region, while the last station was positioned in the estuary. The middle stations were located in areas characterized by residential and agricultural land uses. The selection of these sampling stations was guided by the goal of assessing both point and non-point sources of contamination in the basins. Four land-use categories, namely forest, agriculture, residential, and estuary, were considered in the sampling area. The upstream regions, represented by the first stations on the Kelak, Mohammadabad, and Baghu rivers, were characterized by low population density and minimal impact from non-point sources, particularly agricultural and forestry activities. The intermediate stations, comprising the second and third river stations, were vulnerable to point sources of contamination. These stations were moderately populated and influenced by urban areas as well as non-point sources such as agriculture. The downstream and estuarine stations experienced significant impacts from both point and non-point sources due to high population density and the presence of agricultural, urban, and residential land uses. The study area’s zoning information can be found in Figure 1 and Table 1.
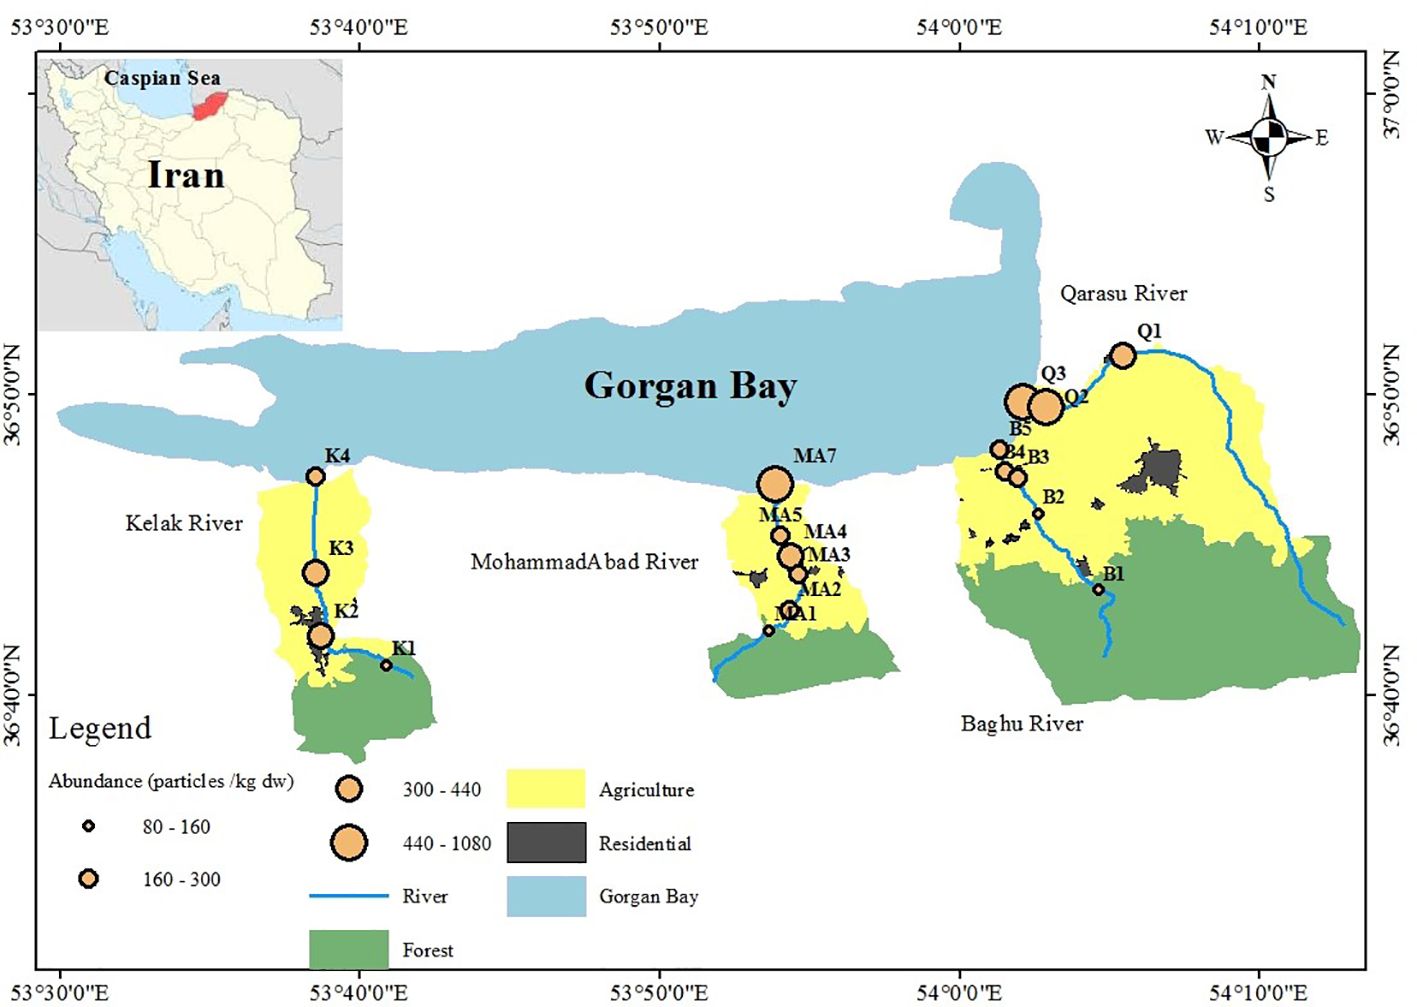
Figure 1 Distributions of MPs abundances and land uses among study stations of the Kelak, MohammadAbad, Baghu, and Qarasu rivers, Iran.
During the autumn of 2020, sediment samples were collected from four rivers, namely Kelak, MohammadAbad, Baghu, and Qarasu. The sampling was conducted using a Van Veen Grab sampler, which has a sampling area of 225 cm². Three replicates of each sample were taken, and the sediment was stored in pre-cleaned containers made of non-plastic materials. The sampling operation followed the guidelines outlined in the European Marine Waste Monitoring Guide (TSG_ML) and focused on collecting the top 5 cm of sediment (Li et al., 2020).
To extract microplastics from the sediment samples, various methods are available. Commonly used methods include the utilization of NaI, ZnCl2, NaCl, or sodium polytungstate (SPT) (Quinn et al., 2017; Abidli et al., 2018). Plastic particles have densities ranging from 0.8 to 2.3 g cm-3, depending on the polymer type and production process, whereas the density of sand particles or sediments is approximately 2.65 g cm-3 (Li et al., 2018). In this study, ZnCl2 with a density of 1.5 g cm-3 was employed for the separation and classification of plastic sediment particles at the selected stations.
Identification and characterization
The sediment samples were analyzed for microplastics following the protocol outlined by Claessens et al. (2011). Initially, 100 g of sediments were dried overnight at 60°C in an oven. To remove organic matter, 1 mL of 30% H2O2 was added to the sediments and left overnight. A filtered solution of ZnCl2 (1.5 g cm-3, Merck Schuchardt OHG 85662, Germany) was then used to separate the microplastics from the sediment samples. For mechanical separation, a magnetic stirrer was employed to mix the sediment (100 g) for 5 minutes. The solution was allowed to settle for 10 minutes, enabling the sediment particles to settle while the microplastics floated. The suspended particles were filtered through Whatman filter paper (grade 42, pore size 2 μm, Sartorius Stedim Biotech, Göttingen, Germany) using a vacuum pump, and the filters were collected in a clean glass petri dish. The filters were dried at 60°C in an oven. A stereomicroscope (NOVEL, Ningbo Yongxin Optic Co., Ltd., China) with a magnification range of 10x - 40x was employed to visually examine all the filters. Microplastic particles were confirmed using a hot needle (Devriese et al., 2015). The size of the microplastic particles was measured using ImageJ software, while their color and shape were detected using the stereomicroscope.
To conduct FTIR analysis on the microplastic particles, a total of 137 out of 317 particles were randomly selected. The samples were prepared according to the method described by Konechnaya et al. (2021). FTIR absorption spectra were obtained using a Bruker spectrometer (Vertex70, Germany). The scanning range of the FTIR absorption spectrum was set from 4000 to 400 cm-1, with a resolution of 4 cm-1 and 64 scans per sample. The identification of the chemical structures of specific polymer samples was based on their IR absorption frequencies, following the references provided by Braun (2013), Pavia et al. (2008), Loder et al. (2015), Kappler et al. (2016), Primpke et al. (2017), and Bagheri et al. (2020). A similarity threshold of greater than 70% between the sample and the reference spectrum was considered acceptable for identification purposes.
Quality control to prevent microplastic contamination
Throughout the experiment, precautions were taken to prevent air pollution and minimize contamination. Cotton laboratory coats and nitrile gloves were worn by the researchers. To maintain cleanliness, work surfaces and all devices were cleaned with 70% alcohol before and after each laboratory work session. Solutions were filtered prior to use to prevent contamination. Aluminum foils were utilized to cover the samples during the experiment, further protecting them from potential external contaminants. To assess the possibility of cross-contamination, a control blank consisting of pure water was carried out (Gholizadeh and Cera, 2022). The results of the blank tests indicated that the level of microplastic contamination in the water or air was negligible. To ensure the absence of plastic fibers in the solution, all water and reagents were passed through filter papers with a pore size of 0.7 μm (Whatman filters).
Statistical analysis
Initially, the collected data underwent normality testing using the Shapiro-Wilk’s test and Levene’s test to assess variance homogeneity. To examine variations among different groups (specifically, sampling sites and sampling stations), a two-way ANOVA test was employed to analyze the differences in group means. Subsequently, a post hoc LSD test was conducted as a multiple comparison procedure. IBM SPSS® Statistics (version 25.0.1.1) was used for these analyses, with a significance level (α) set at 0.05. Principal Component Analysis (PCA) was performed on loading values to evaluate similarities based on microplastic (MPs) concentrations. The PCA aimed to uncover the relationship between sediment particle size types and the abundance of MPs collected at sampling stations. Statistical analysis was carried out using Primer software (version 6), while Excel 2013 was utilized to create graphical representations of the data.
Results and discussion
Abundance and distribution of MPs
Figure 2 illustrates that all sampling sites were contaminated with microplastics (MPs). The total number of MPs counted was 317, corresponding to a concentration of 6340 particles per kilogram of dry weight (kg dw). The average MP concentration was 333.68 ± 211.17 particles/kg dw. Table 2 provides a summary of microplastic concentrations observed in the study regions and other geographic locations with river waters. Comparing the abundance of MP particles in sediment globally to this study, significant variations were observed, ranging from as low as 39.4 ± 16.1 particles/kg in the Yangtze River, China (Li et al., 2020), to as high as 700 ± 170.2 particles/kg in the Alna River, Norway (Bottolfsen, 2016). In this study, microplastics were found at levels ranging from 80 to 1080 particles/kg (Figure 2). The highest MP abundance was observed at the Q3-estuary in the Qarasu River (1080 ± 345.31 particles/kg), followed by the Q2-residential area (800 ± 244.11 particles/kg) and the MA7-estuary in the MohammadAbad River (720 ± 202.05 particles/kg). Stations 3, characterized by agricultural land use in Kelak and Baghu, contained similar amounts of microplastics, which were three times lower than the abundance observed in the estuary area (360.3 ± 97.45 particles/kg and 320.1 ± 81.29 particles/kg, respectively). The Qarasu River exhibited the highest total frequency of MPs, followed by MohammadAbad, Kelak, and Baghu, respectively. The distribution and abundance of microplastics among the upstream, middle, and downstream stations followed the order: estuary > urban > agriculture > forest. The highest MP abundance was detected in the Qarasu River (Figure 2). The two-way ANOVA test indicated that there were significant differences in MP levels among all stations and between sampling sites (p < 0.05).
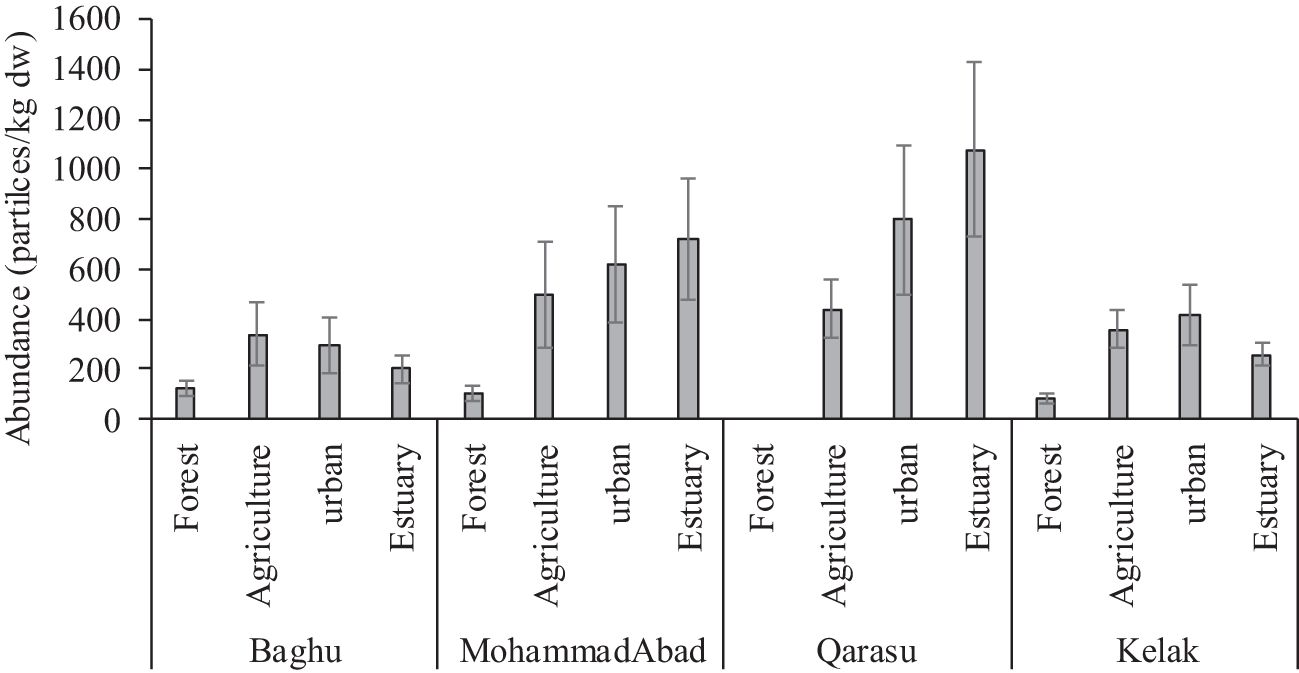
Figure 2 Abundance of microplastics in sediments of the sampling stations are presented as mean (n=3) and standard deviation.
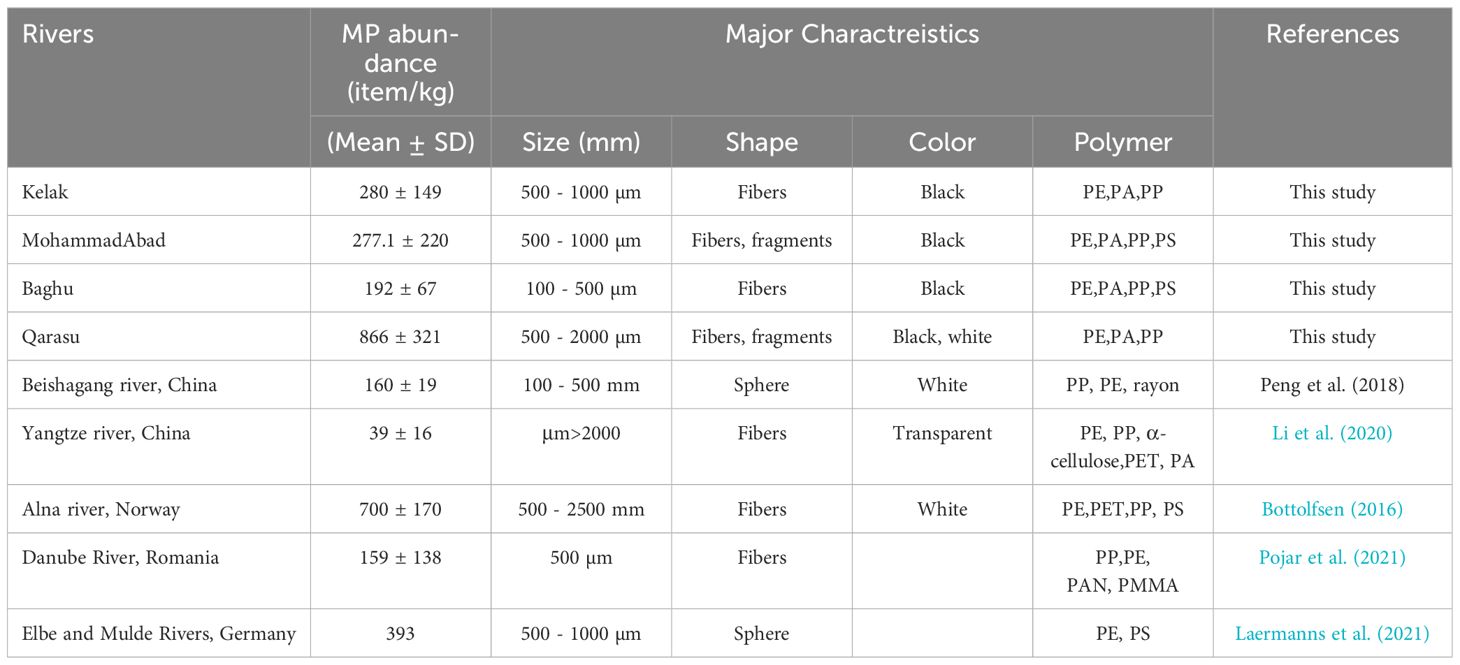
Table 2 Summary of the abundance and features of MPs in different river environments around the world.
Figure 2 illustrates the variations in abundance and distribution of microplastics (MPs) among the upstream, middle, and downstream study stations. Previous studies have consistently found higher plastic pollution in areas with significant anthropogenic activities (Horton et al., 2017; Masoudi et al., 2022; Gholizadeh et al., 2023; Willis et al., 2017). In line with these findings, our results indicate that the abundance of microplastics in the rivers was higher in downstream areas compared to upstream areas. Specifically, urban and rural areas such as B4, MA5, MA6, Q2, and K2 exhibited higher frequencies of MPs compared to other stations. The data further revealed that the predominant land use activity (urban or agriculture) in a given area influenced the presence of MPs in the corresponding rivers, as well as downstream regions. These urban and agricultural areas exhibited relatively higher frequencies of MPs compared to stations primarily affected by non-point agricultural sources and forested regions in the upstream stations (B1, MA1, and K1) (Figure 1, Table 1). Middle stations (B2 and MA2) were primarily influenced by non-point agricultural resources, and the number of MPs observed at upstream stations was relatively lower than those at downstream monitoring stations. These results suggest that a combination of non-point and point sources can contribute to higher concentrations of microplastics in rivers compared to either non-point or point sources alone (evident in stations Q3 and Q2). Additionally, the estuaries and residential stations of the Qarasu River exhibited the highest frequencies of MPs among all stations.
In the upstream sampling stations, the dominant land use activities were primarily related to forestry. The average numbers of MPs in these regions were as follows: MA1 (100 ± 32 particles/kg), K1 (80 ± 21 particles/kg), and B1 (120 ± 30 particles/kg) (Figure 2). These upstream study stations, characterized by a low population, were mainly influenced by non-point sources and forested areas (MA1: 100 particles/kg, K1: 80 particles/kg, and B1: 120 particles/kg) (Figure 2). The average MP abundance in sediment samples was determined to be 397 ± 128 particles/kg. This value was notably higher than the MP concentrations observed in the Beishagang River, China (160 ± 19 particles/kg), the Yangtze River, China (39.4 ± 16 particles/kg), and the Danube River, Romania (159.2 ± 138 particles/kg) (Table 2). However, the MP concentration in the sediment of the Alna River, Norway (700 ± 170 particles/kg), was considerably higher than what was found in our study.
The forested areas, including MA1 and K1, may also be influenced by additional processes and environmental factors such as the non-point transportation of atmospheric MPs (Allen et al., 2019). Overall, our findings revealed that non-point sources have the potential to release a significant quantity of MPs, alongside point sources, which aligns with the results reported by Baldwin et al. (2016).
The microplastic particles collected were categorized into three main groups: fibers (Figures 3A, D), fragments (Figure 3B), and films (Figure 3C). The observed microplastic particles were classified based on their shapes, which included fibers, fragments, and films. The two-way ANOVA test revealed a statistically significant difference in the types of microplastics (fiber, fragment, and film) among the study sites (p < 0.01). Fibers, in particular, have attracted significant research interest as they are commonly observed in aquatic environments such as Gorgan Bay and the Caspian Sea (Bagheri et al., 2020; Mehdinia et al., 2020; Nematollahi et al., 2020; Gholizadeh and Cera, 2022; Rasta et al., 2020). Among the extracted microplastics, fibers accounted for the highest proportion (68%), while fragments comprised 33% and films made up only 2% of the total. The prevalence of fibers has also been observed in sediment samples from other bay areas worldwide (Mendoza et al., 2020; Osorio et al., 2021; Alves and Figueiredo, 2019; Özgüler et al., 2022). The stations located along the Kelak River exhibited similar proportions of these microplastic shapes due to their distribution. In the Baghu River, the upstream study stations had higher ratios of fibers compared to the downstream stations. In the MohammadAbad River, all stations showed similar ratios of fragments and fibers, with MA5 having a higher proportion of fragments. In the Qarasu River, all stations except Q2 had similar proportions of fragments and fibers, with fibers being the dominant shape observed (Figure 4). Significantly high amounts of microplastic fibers were detected in sediment samples collected from stations situated in agricultural and residential areas. Studies indicate that polyethylene (PE) and polypropylene (PP) microplastics, commonly used in products such as toothpaste, facial cleansers, and clothing, contribute to the presence of these fibers (Gholizadeh et al., 2024). Various factors, including the input of microplastics into the river, population coverage, sampling and extraction methods, can account for the differences in microplastic abundance in the sediment (Bagheri et al., 2024).
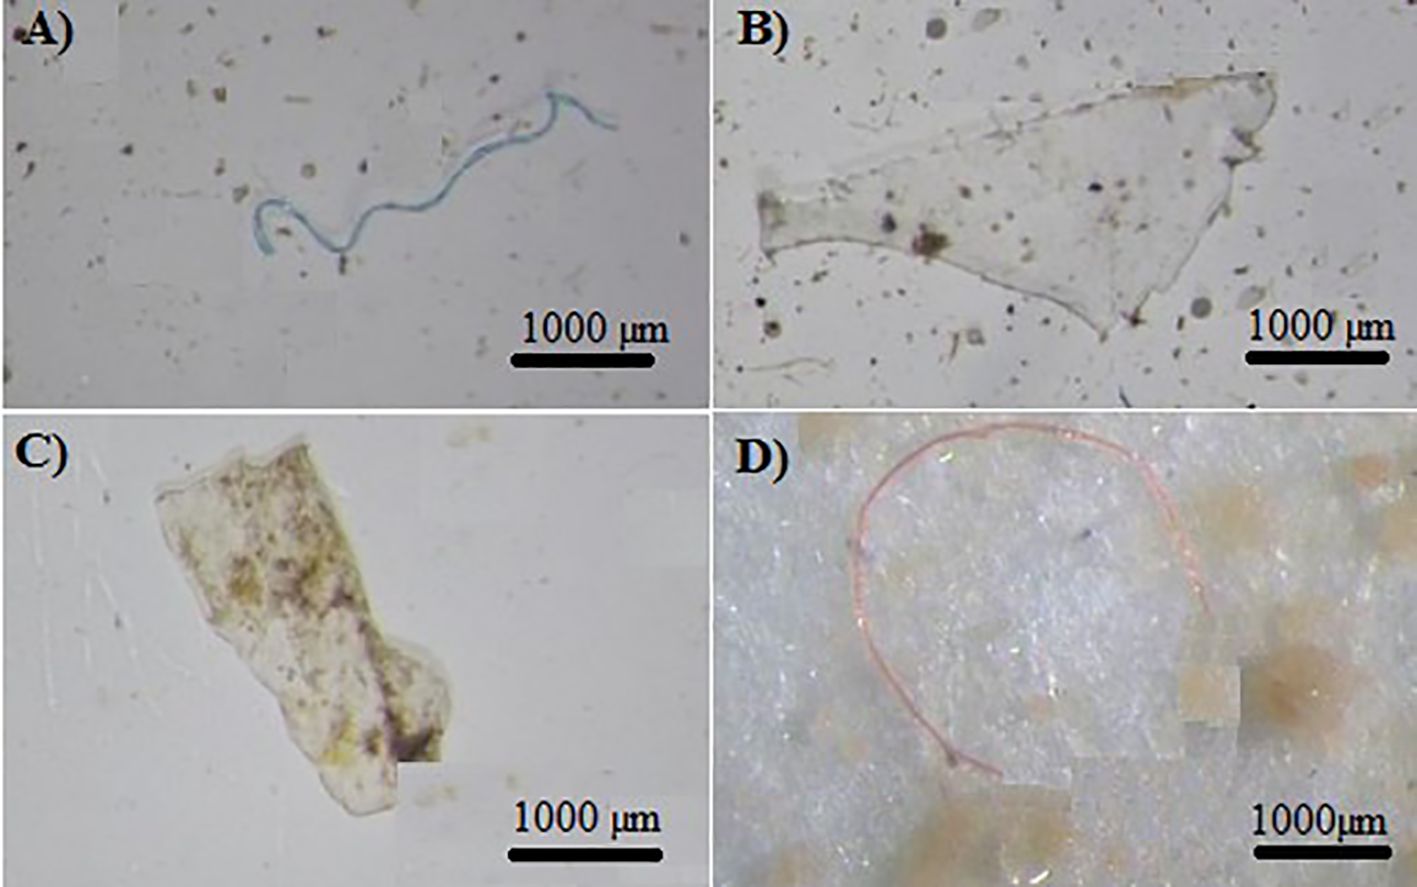
Figure 3 Types of microplastics collected in the sediment of the study rivers: (A, D) fiber; (B) fragment and (C) film.
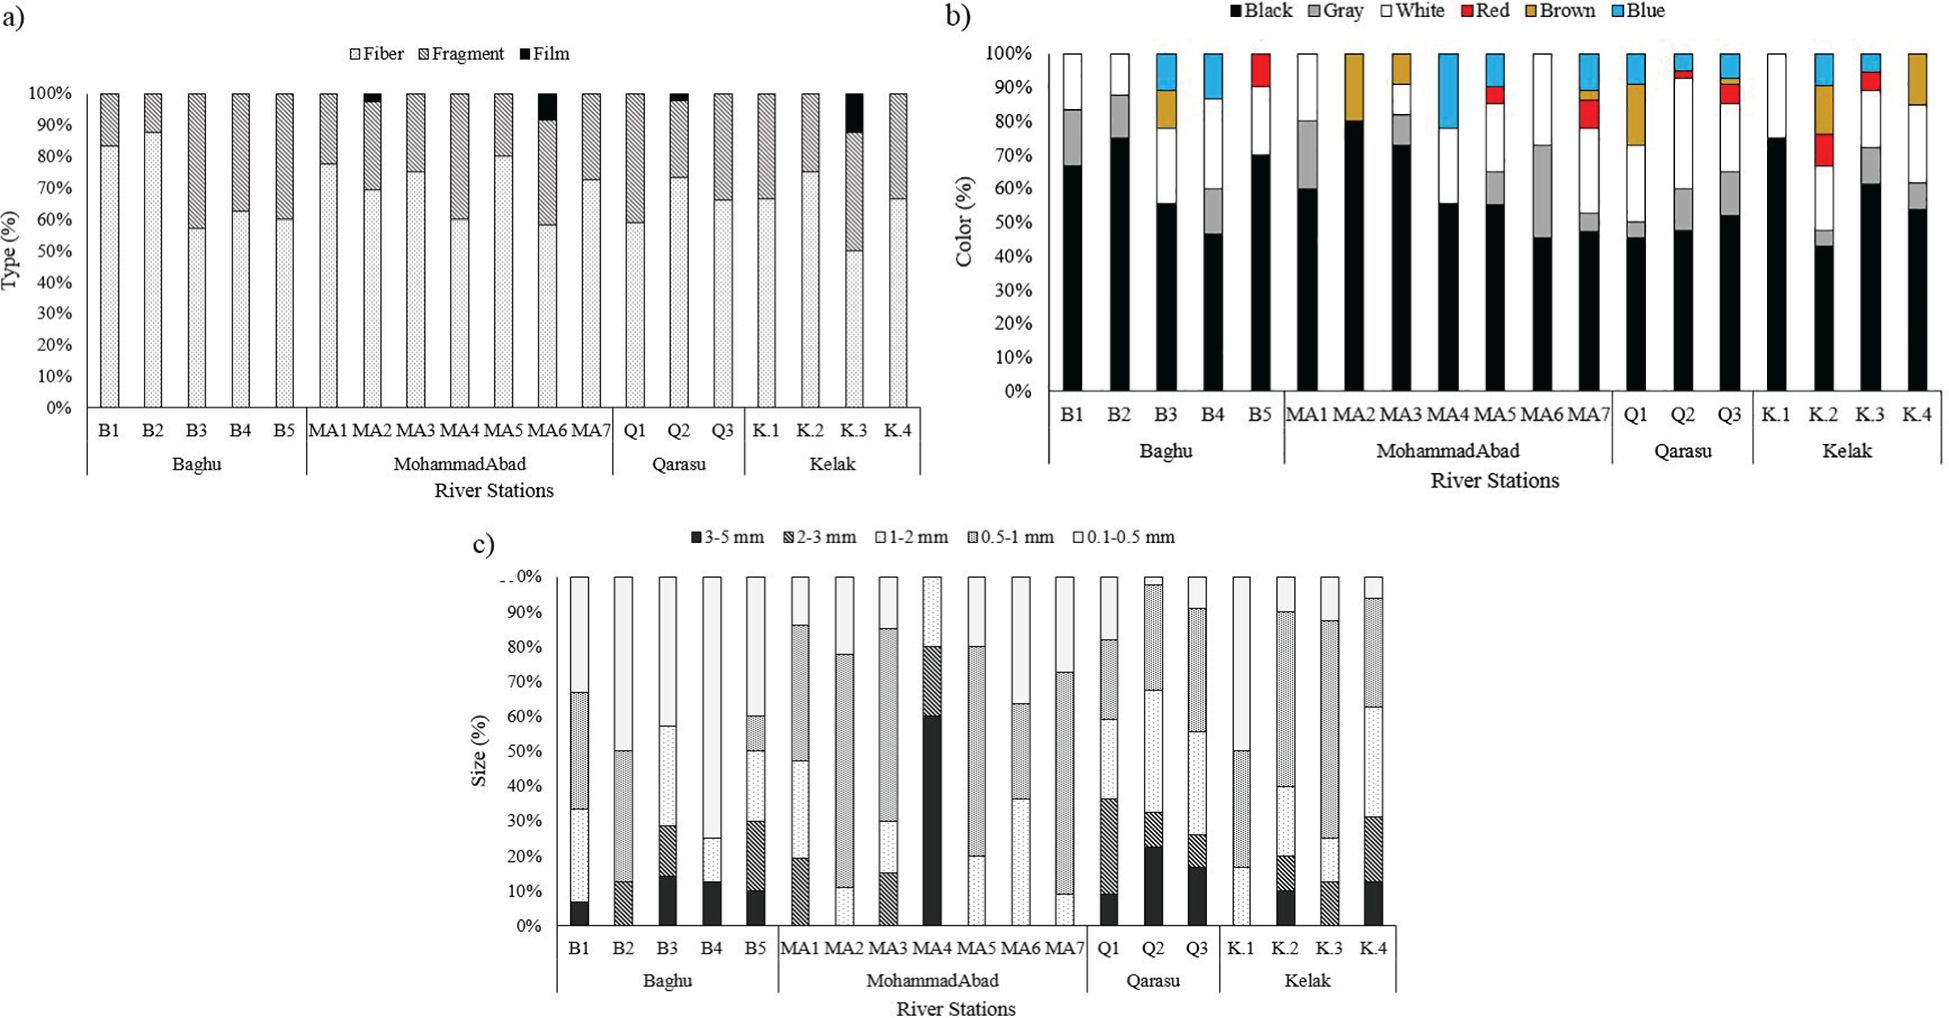
Figure 4 Mean abundance of microplastics (n: 3) in the sediments among the river sampling stations categorized by (A) shape, (B) color, and (C) size.
When examining the shapes of the microplastic particles under a stereomicroscope, the most commonly detected shapes across all stations were fibers (205 pieces, 68%), fragments (91 pieces, 30%), and films (4 pieces, 2%). Additionally, observations based on shape-size ratios revealed that all shapes (fibers, fragments, and films) predominantly belonged to small-sized microplastics (Figure 4A). Microplastic particles of various colors were also observed in the river sediments (Figure 4B). The extracted microplastics could be categorized into different colors, including black (53.31%), gray (22.08%), white (9.46%), blue (6.94%), brown (4.42%), and red (3.79%). Black was the most prevalent color among all sediment samples. The higher presence of black-colored microplastics was also noted in surveys conducted by Cincinelli et al. (2021) in the Black Sea and Montoto-Martínez et al. (2020) in the Canary Islands. Microplastics of various sizes were found in all sediment samples. Furthermore, the results demonstrated that a higher percentage (53%) of all identified microplastics were small-sized (less than 1000 µm), while microplastics sized between 1000 and 2000 µm accounted for the next category (25%). In terms of distribution, small-sized microplastics were evenly observed in all study points along the four rivers (Figure 4C). The larger proportion of smaller microplastics may be attributed to the continuous breakdown and deposition of plastics caused by weathering processes.
Comparing microplastic contamination levels in different locations is crucial for understanding the significance of low or high values. Our results indicated high levels of microplastic contamination in urban and agricultural areas compared to other studies. This can be attributed to the distinct characteristics of the study sites and waste production. Townsend et al. (2019) also found a positive correlation between the concentration of microplastics and the level of urbanization in watersheds. Isobe et al. (2015) stated that as the size of tiny plastic particles decreases, their quantity increases. Mani et al. (2015) also highlighted that larger plastics progressively break down into smaller microplastic pieces in aquatic environments due to mechanical action and solar oxidation. Other studies have also observed a higher incidence of small microplastics compared to larger ones, which is consistent with our findings (Naji et al., 2019; Ghayebzadeh et al., 2021). The high concentrations of smaller microplastics pose a greater risk as microplastic toxicity is size-dependent, and smaller microplastics tend to be more toxic than larger ones (Qin et al., 2021; Zhang et al., 2021).
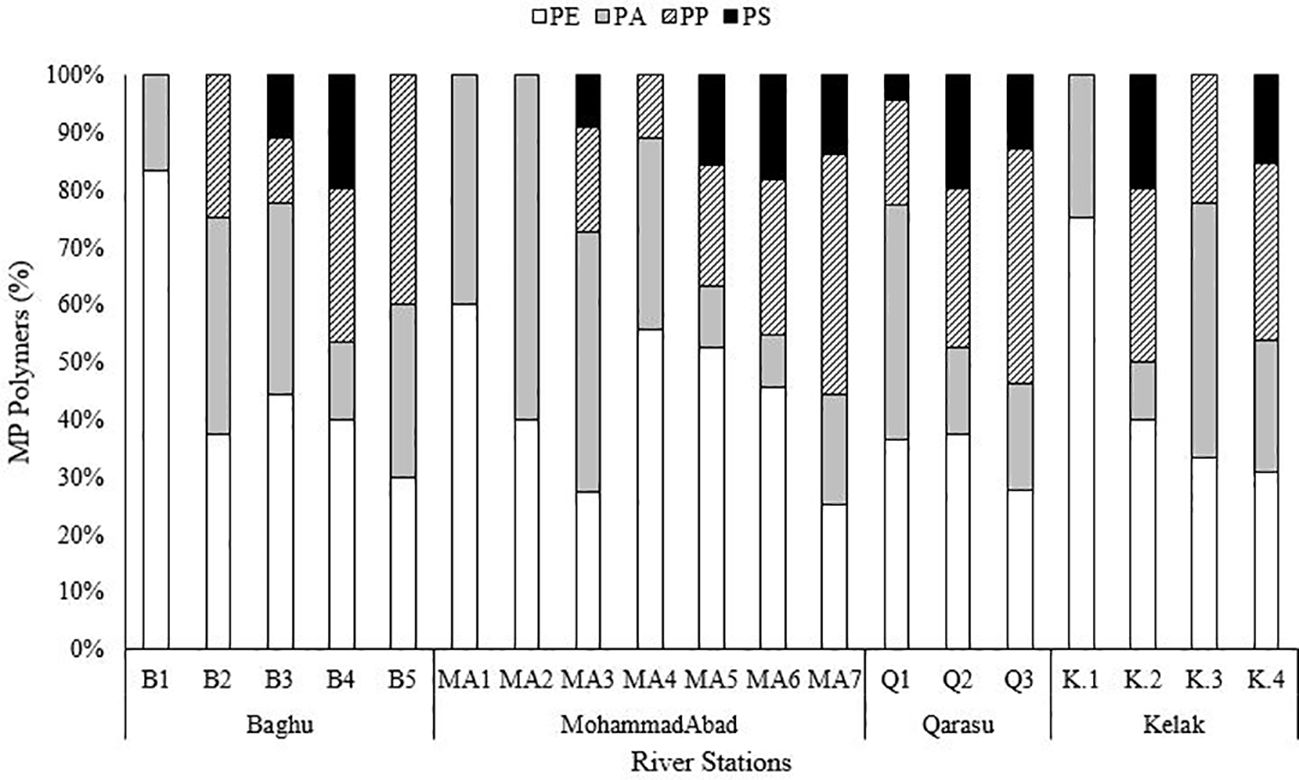
FTIR spectroscopy analysis identified four different types of polymers present in the microplastic samples (Figure 5). The dominant polymers detected were polyethylene (PE) at 37%, polypropylene (PP) at 27%, polyamide (PA) at 23%, and polystyrene (PS) at 12% across all sampling stations (Figure 6). Although these were the dominant polymers, there were also low-abundance polymers that made significant contributions at certain stations, such as PS at stations K2 and Q2. A previous study conducted by Bagheri et al. (2020) also reported PE as the main type of microplastics found in the sediments of Gorgan Bay. The types of polymers present in microplastics can provide valuable information about their sources of pollution (Shim et al., 2018). Currently, PP and PE are widely used plastics in urban areas, industry, food packaging, and agriculture (Gholizadeh and Cera, 2022). In this study, PP and PE were abundantly observed at all sampling stations in Gorgan Bay. Possible sources of these polymers include fishing nets, drink bottles, bottle caps, and packaging bags. In residential areas, waste from sources such as tires (15%), residential waste (35%), and landfills (20%) may contribute to the presence of these polymers. Considering the accumulation of waste over the years, it is expected that residential areas would exhibit greater diversity in terms of polymer types compared to agricultural areas and forest land use.
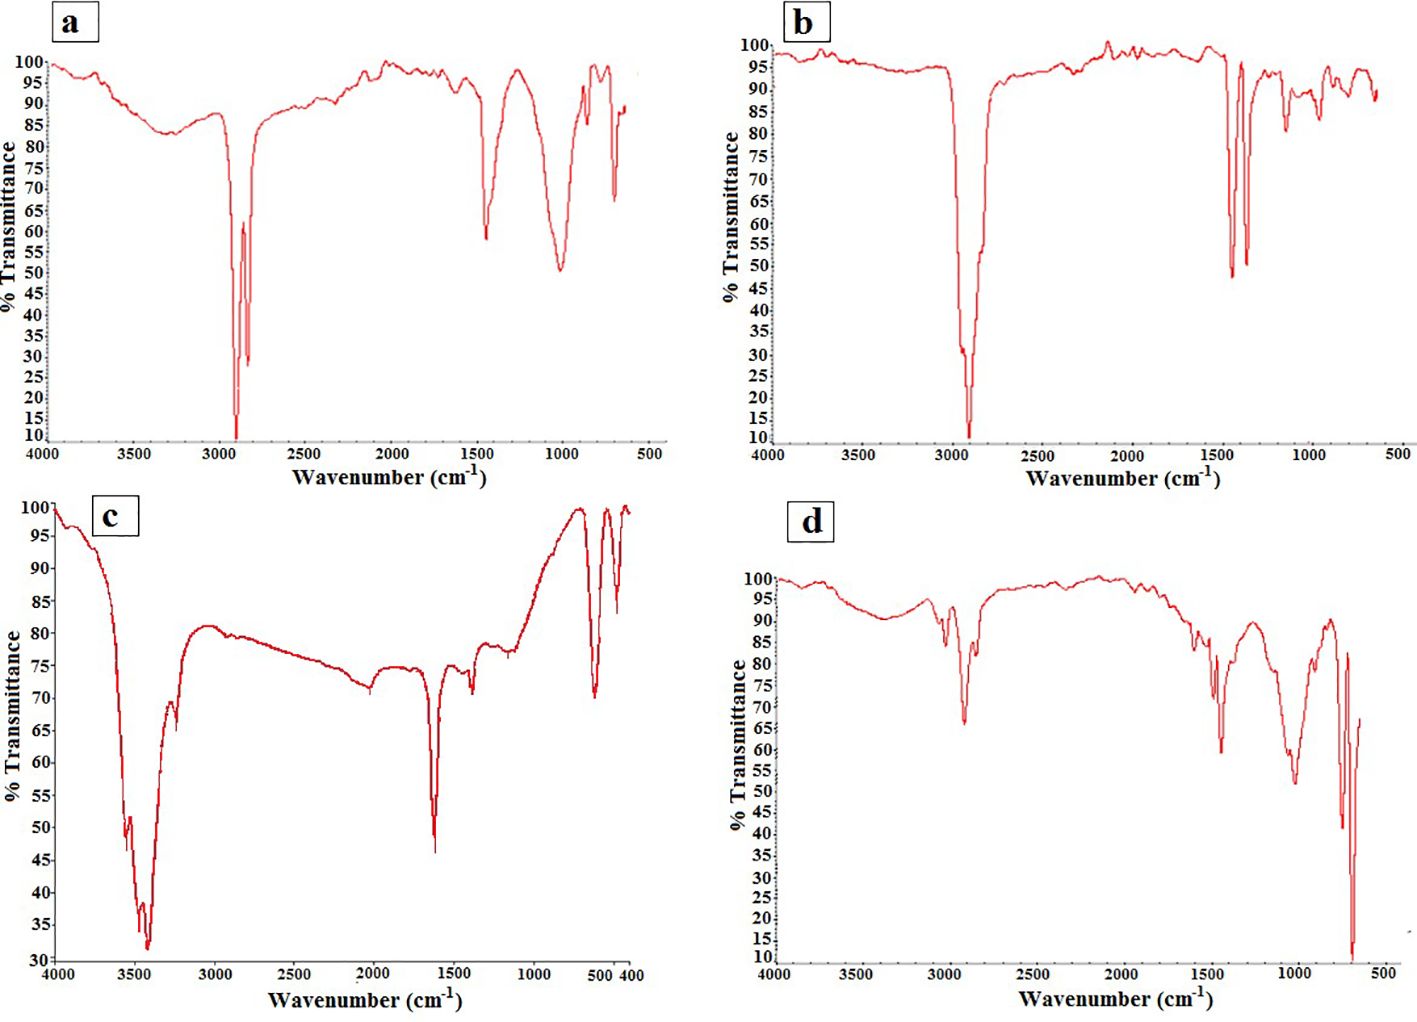
Figure 5 Spectra of the polymers of microplastics found in the sediments: (A) polyethylene; (B) polypropylene; (C) polyamide; (D) polystyrene.
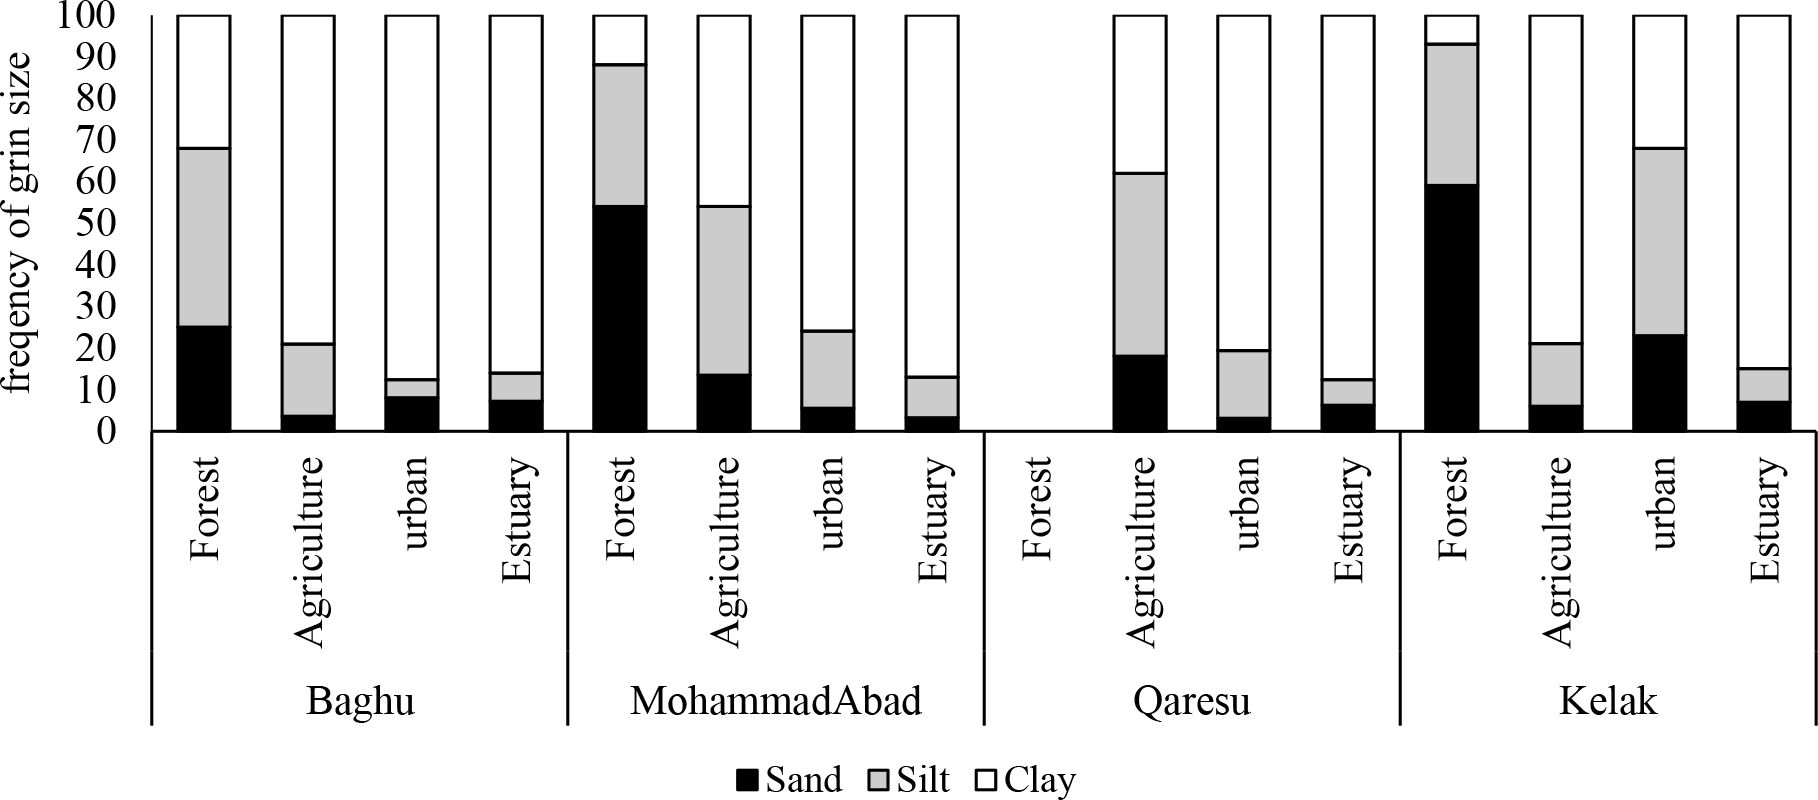
The substrate grain size analysis revealed varying occurrences of clay, silt, and sand at each sampling station (Figure 7). The minimum and maximum proportions of sand particles were observed in the estuary of MohammadAbad (3.2%) and the forest area of Kelak (59%), respectively. The highest level of silt particles was detected in urban regions of Kelak (45%), while the lowest silt particle content was observed in the urban area of Baghu (4.34%). The range of clay particles across the sampling stations ranged from 12% to 87.6%, with a mean of 57.18% ± 23.44.
The principal component analysis (PCA) was performed on the five different colors of microplastics (MPs) found, along with the main shape types associated with four different land uses. The Kaiser-Meyer-Olkin (KMO) values, higher than 0.7, indicate the adequacy of the data for performing PCA. The results are presented in Figure 8. PC1 and PC2 explained 32.2% and 22.6% of the total variances, respectively. The stations B1, K1, and MA1 located in the forest area exhibited a correlation (p>0.05) with silt and sand and had the lowest density of MPs. These stations fell within PC1. On the other hand, the stations MA2, MA3, BA2, BA3, and KA3, situated in agricultural areas, were associated with organic matter, clay, and electrical conductivity (EC). These stations had a moderate level of MPs. The stations located in the estuary area showed a strong correlation with fiber, fragment, and film shape types and had high loads of MPs (Figures 2, 8). This study confirms that the density of MPs is significantly influenced by soil texture, particularly clay and organic load, which facilitate the adhesion of MPs to the sediments.
The results indicate that different types of microplastic (MP) polymers and their occurrence ratios vary among the upstream, middle, and downstream study stations. This suggests that anthropogenic activities have influenced the presence of plastic polymers in the environment. The influence of land use is presumed to be a factor in determining the types of polymer found in MPs, rather than their frequency. Currently, polymers are extensively used in the production of various products to meet the demands of modern life (Plastics Europe, 2020). The major polymers identified in this study, namely PE, PP, and PA, accounted for 88% of the total MPs. These results are consistent with previous studies conducted in different parts of the world. Additionally, data on Iran’s plastic production and consumption in 2020 revealed that PE, PP, PS, and PA comprised over 50% of the nation’s production. According to the World Population Review, Iran ranked 17th in plastic waste production in 2021, generating approximately 4 million tons of plastic waste. PE, PP, PS, and PET account for 62.5% of global plastic demand, as reported by Plastics Europe (2020). Therefore, the widespread use of plastics is a significant source of MPs pollution in Iran’s aquatic environments. The prevalence of MP polymers at all river sites indicates that MPs are being released into the environment due to the improper disposal of plastics in both point and non-point sources. These polymers are often associated with “disposable” plastics that are predominantly used in household, industrial, agricultural, and commercial settings. MPs are easily transported through wastewater and waste streams, leading to environmental pollution (GESAMP, 2016; UNEP, 2018; Plastics Europe, 2020).
PE fibers are widely used in various applications such as textiles, ropes, agriculture, and fishing nets. Previous studies conducted in Gorgan Bay (Bagheri et al., 2020; Gholizadeh and Cera, 2022) as well as other regions of the Caspian Sea (Mehdinia et al., 2020; Nematollahi et al., 2020) have also reported the presence of PE and PP particles. PE and PP are produced in large quantities and are commonly utilized as packaging materials for short-term purposes (Plastics Europe, 2020). Furthermore, PP and PE are among the primary types of polymers used in the construction of ropes for marine and boating applications. In urban areas, polyethylene and polypropylene fibers were predominantly found in downstream regions, such as MA7, MA5, and Q3, and were widespread in densely populated urban areas in the form of microplastics. Additionally, polyethylene fibers were particularly abundant in upstream stations like B1, MA1, and K1, which are located in forested and non-residential areas. Various sources contribute to the release of large quantities of PE, PP, PA, and PS into the rivers of the Gorgan Bay catchment, including domestic sewage, laundry drainage from washing machines, textiles, wastewater treatment plants (WWTPs), clothing, non-point sources such as fishing tools and aquaculture nets, as well as urban and agricultural activities (Bagheri et al., 2020).
The frequency of microplastics (MPs) in the examined rivers was compared to similar studies conducted around the world (Table 2). The comparisons revealed similar frequencies with the Danube River in Romania and the Beishagang River in China. However, the frequency of MPs in the Qarasu River was several times higher than in the other rivers. Generally, the frequency of MPs in the rivers included in this study was higher compared to other rivers investigated in different parts of the world. This finding highlights the elevated vulnerability of these small freshwater systems to MP pollution. Furthermore, the surface waters of these rivers were found to contain films, fibers, small microplastics (SMPs), PE, PP, and PET, which is consistent with findings from other rivers worldwide. The presence of films, fibers, components, SMPs, PE, PP, and PET in the surface waters of these rivers is similar to what has been observed in other rivers globally.
Contamination features, and potential threats to aquatic ecosystems
Based on the findings, four rivers in the Gorgan Bay Basin were found to contain prominent microplastics, such as fragments and fibers of various colors (<1000 μm). The former study by de Sa et al. (2018) found that fragments and fibers are the most frequently observed microplastics in marine organisms. Some earlier studies have demonstrated that tiny microplastic particles pose greater risks (Lei et al., 2018) and increase the likelihood of ingestion and biological transport by aquatic organisms (Katija et al., 2017; Zheng et al., 2020).
MP fibers have been found to possess higher toxicity towards aquatic animals, as indicated by Ziajahromi et al. (2017). Laboratory investigations have revealed that microplastic polymers have numerous eco-toxicological consequences on aquatic animals, encompassing reduced growth, increased mortality, interference with reproduction, diminished population size, impaired gene expression, and elevated oxidative stress, as documented by de Sa et al. (2018). The ingestion and absorption of microplastics can lead to physical injuries, such as intestinal obstruction and internal harm, as exemplified by Wright et al. (2013). Concerns regarding potential human exposure to microplastics have witnessed a surge in recent years, as noted in the studies conducted by Wright and Kelly (2017); Rist et al. (2018), and Cox et al. (2019). The impacts of microplastics on humans within river ecosystems are influenced by various factors, including fisheries, agriculture, freshwater food production, drinking water resources, and the consumption of aquatic food products.
Furthermore, the accumulation of microplastics (MPs) in both freshwater and marine environments can have implications for humans through their entry into the food supply chains, as highlighted in studies by Carbery et al. (2018); Oliveira et al. (2019), and Nelms et al. (2018). The present study identified the characteristics of MPs and their potential hazards, indicating possible environmental threats to the river ecosystems under investigation. These threats may extend to humans and other aquatic organisms within the Gorgan Bay ecosystem, which is part of the Caspian Sea. MPs encompass a diverse array of toxic contaminants that can carry additional toxic organic and inorganic chemicals, thereby increasing the risks associated with MP pollution, as suggested by Rochman et al. (2019). Therefore, it is crucial to develop comprehensive models that assess the risks associated with MP contamination and their interactions with other toxic contaminants, as emphasized by Yanga et al. (2022). Ecotoxicological studies play a critical role in determining the overall effects of MPs on aquatic ecosystems, their transfer through food chains, and their potential impact on human health.
Conclusions
This study aimed to investigate the frequency and levels of microplastic (MP) pollution in the four rivers of the Gorgan Bay Basin. The dominant types of microplastics observed were fibers, fragments, and films, which varied in shapes, colors, and sizes. The results confirmed that the Kelak, Mohammad Abad, Baghu, and Qarasu rivers were significant pathways for MP pollution entering the Gorgan Bay. The characteristics of the identified microplastics pose high risks and eco-toxicological threats to these rivers and the Gorgan Bay ecosystems, as well as potential hazards to humans through the food chain. The findings of this study also highlight the importance of assessing MP pollution in small-scale rivers and emphasize the need for continuous monitoring of pollution in these areas. Furthermore, the spatial distribution of microplastics can be used to identify hotspots of higher contamination levels, which can aid in targeted contamination monitoring and management prioritization. These findings have practical implications for the development of strategies to manage different river basins, control microplastic pollution, reduce risks, improve management techniques, and establish standardized water quality requirements. Future research should focus on evaluating watersheds, identifying pollution sources based on land use, and assessing their impacts on surrounding areas to facilitate integrated environmental management.
Funding
The author(s) declare financial support was received for the research, authorship, and/or publication of this article. This study is supported financially by Gonbad Kavous University (project number: 6.00.84, 2021), Gonbad-e Kavus, Golestan province, Iran.
Conflict of interest
The authors declare that the research was conducted in the absence of any commercial or financial relationships that could be construed as a potential conflict of interest.
Publisher’s note
All claims expressed in this article are solely those of the authors and do not necessarily represent those of their affiliated organizations, or those of the publisher, the editors and the reviewers. Any product that may be evaluated in this article, or claim that may be made by its manufacturer, is not guaranteed or endorsed by the publisher.
References
Abidli S., Antunes J., Ferreira J. L., Lahbib Y., Sobral P., El Menif N. T. (2018). Microplastics in sediments from the littoral zone of the North Tunisian coast (Mediterranean Sea). Estuar. Coast. Shelf Sci. 205, 1–9. doi: 10.1016/j.ecss.2018.03.006
Allen S., Allen D., Phoenix V. R., Roux G. L., Jiménez P. D., Simonneau A., et al. (2019). Atmospheric transport and deposition of microplastics in a remote mountain catchment. Nat. Geosci. 12, 339–344. doi: 10.1038/s41561-019-0335-5
Auta H. S., Emenike C. U., Fauziah S. H. (2017). Distribution and importance of microplastics in the marine environment: a review of the sources, fate, effects, and potential solutions. Environ. Int. 102, 165–176. doi: 10.1016/j.envint.2017.02.013
Bagheri T., Gholizadeh M., Abarghouei S., Zakeri M., Hedayati A., Rabaniha M., et al. (2020). Microplastics distribution, abundance and composition in sediment, fishes and benthic organisms of the Gorgan Bay, Caspian sea. Chemosphere 257, 127201. doi: 10.1016/j.chemosphere.2020.127201
Bagheri T., Pourang N., Saravi H. N., Bandpei M. A. A., Fazli H., Gholizadeh M., et al. (2024). Risk assessment of microplastics influenced by human activities along the gorganroud river (Iran) and its estuary to the Caspian Sea. J. Polym. Environ. 32, 815–825. doi: 10.1007/s10924-023-03010-w
Baldwin A. K., Corsi S. R., Mason S. A. (2016). Plastic debris in 29 great lakes tributaries: relations to watershed attributes and hydrology. Environ. Sci. Technol. 50, 10377–10385. doi: 10.1021/acs.est.6b02917
Blettler M. C. M., Abrial E., Khan F. R., Sivri N., Espinola L. A. (2018). Freshwater plastic pollution: recognizing research biases and identifying knowledge gaps. Water Res. 143, 416–424. doi: 10.1016/j.watres.2018.06.015
Bottolfsen T. (2016). Microplastics in River Sediments, Norway: Evaluation of a Recent Technique for the Detection of Microplastic Particles (Norway: Master's thesis, Norwegian University of Life Sciences, Ås).
Büngener L., Schäffer S. M., Schwarz A., Schwalb A. (2024). Microplastics in a small river: Occurrence and influencing factors along the river Oker, Northern Germany. J. Contam. Hydrol. 264, 104366. doi: 10.1016/j.jconhyd.2024.104366
Carbery M., O’Connor W., Palanisami T. (2018). Trophic transfer of microplastics and mixed contaminants in the marine food web and implications for human health. Environ. Int. 115, 400–409. doi: 10.1016/j.envint.2018.03.007
Constant M., Ludwig W., Kerhervé P., Sola J., Charrière B., Sanchez-Vidal A., et al. (2020). Microplastic fluxes in a large and a small Mediterranean river catchments: the têt and the Rhône, northwestern Mediterranean sea. Sci. Total Environ. 716, 136984. doi: 10.1016/j.scitotenv.2020.136984
Cox K. D., Covernton G. A., Davies H. L., Dower J. F., Juanes F., Dudas S. E. (2019). Human consumption of microplastics. Environ. Sci. Technol. 53, 7068–7074. doi: 10.1021/acs.est.9b01517
de Sa L. C., Oliveira M., Ribeiro F., Rocha T. L., Futter M. N. (2018). Studies of the effects of microplastics on aquatic organisms: what do we know and where should we focus our efforts in the future? Sci. Total Environ. 645, 1029–1039. doi: 10.1016/j.scitotenv.2018.07.207
GESAMP. (2016). Sources, Fate and Effects of Microplastics in the Marine Environment: Part Two of a Global Assessment. Eds. Kershaw P. J., Rochman C. M. (London: IMO/ FAO/UNESCO-IOC/UNIDO/WMO/IAEA/UN/UNEP/UNDP Joint Group of Experts on the Scientific Aspects of Marine Environmental Protection), 220. Rep. Stud. GESAMP No. 93p.
Gewert B., Plassmann M. M., MacLeod M. (2015). Pathways for degradation of plastic polymers floating in the marine environment. Environ. Sci. Process Impacts 17, 1513–1521. doi: 10.1039/C5EM00207A
Gholizadeh M., Cera A. (2022). Microplastic contamination in the sediments of Qarasu estuary in Gorgan Bay, south-east of Caspian Sea, Iran. Sci. Total Environ. 838, 155913. doi: 10.1016/j.scitotenv.2022.155913
Gholizadeh M., Patimar R. (2018). Ecological risk assessment of heavy metals in surface sediments from the Gorgan bay, Caspian sea. Mar. pollut. Bull. 137, 662–667. doi: 10.1016/j.marpolbul.2018.11.009
Gholizadeh M., Shadi A., Abadi A., Nemati M., Senapathi V., Karthikeyan S. (2023). Abundance and characteristics of microplastic in some commercial species from the Persian Gulf, Iran. J. Environ. Manage. 344, 118386. doi: 10.1016/j.jenvman.2023.118386
Gholizadeh M., Shadi A., Abadi A., Nemati M., Senapathi V., Karthikeyan S., et al. (2024). Exploring the microplastic pollution: Unveiling origins and varieties in coastal sediments and waters of the Bushehr Province, Persian Gulf, Iran. Mar. pollut. Bull. 198, 115939. doi: 10.1016/j.marpolbul.2023.115939
Haberstroh C. J., Arias M. E., Yin Z., Wang M. C. (2021). Effects of urban hydrology on plastic transport in a subtropical river, 1. ACS ES&T Water acsestwater 1 (8), 1714–1727. doi: 10.1021/acsestwater.1c00072
Horton A. A., Walton A., Spurgeon D. J., Lahive E., Svendsen C. (2017). Microplastics in freshwater and terrestrial environments: evaluating the current understanding to identify the knowledge gaps and future research priorities. Sci. Total Environ. 586, 127–141. doi: 10.1016/j.scitotenv.2017.01.190
Hu L., Chernick M., Hinton D. E., Shi H. (2018). Microplastics in small waterbodies and tadpoles from Yangtze River Delta, China. Environ. Sci. Technol. 52, 8885–8893. doi: 10.1021/acs.est.8b02279
Huang Y., Liu Q., Jia W., Yan C., Wang J. (2020). Agricultural plastic mulching as a source of microplastics in the terrestrial environment. Environ. pollut. 260, 114096. doi: 10.1016/j.envpol.2020.114096
Kataoka T., Nihei Y., Kudou K., Hinata H. (2019). Assessment of the sources and inflow processes of microplastics in the river environments of Japan. Environ. pollut. 244, 958–965. doi: 10.1016/j.envpol.2018.10.111
Katija K., Choy C. A., Sherlock R. E., Sherman A. D., Robison B. H. (2017). From the surface to the seafloor: how giant larvaceans transport microplastics into the deep sea. Sci. Adv. 3, e1700715. doi: 10.1126/sciadv.1700715
Koelmans A. A., Besseling E., Foekema E., Kooi M., Mintenig S., Ossendorp B. C., et al. (2017). Risks of plastic debris: unravelling fact, opinion, perception, and belief. Environ. Sci. Technol. 51, 11513–11519. doi: 10.1021/acs.est.7b02219
Kunz A., Schneider F., Anthony N., Lin H. T. (2023). Microplastics in rivers along an urban-rural gradient in an urban agglomeration: Correlation with land use, potential sources and pathways. Environ. pollut. 321, 121096. doi: 10.1016/j.envpol.2023.121096
Laermanns H., Reifferscheid G., Kruse J., Földi C., Dierkes G., Schaefer D., et al. (2021). Microplastic in water and sediments at the confluence of the Elbe and Mulde rivers in Germany. Front. Environ. Sci. 9. doi: 10.3389/fenvs.2021.794895
Lei L., Wu S., Lu S., Liu M., Song Y., Fu Z., et al. (2018). Microplastic particles cause intestinal damage and other adverse effects in Zebrafish Danio Rerio and nematode Caenorhabditis elegans. Sci. Total Environ. 619–620, 1–8. doi: 10.1016/j.scitotenv.2017.11.103
Li J., Liu H., Paul Chen J. (2018). Microplastics in freshwater systems: a review on occurrence, environmental effects, and methods for microplastics detection. Water Res. 137, 362–374. doi: 10.1016/j.watres.2017.12.056
Li Y., Lu Z., Zheng H., Wang J., Chen C. (2020). Microplastics in surface water and sediments of Chongming Island in the Yangtze Estuary, China. Environ. Sci. Eur. 32, 1–12. doi: 10.1186/s12302-020-0297-7
Lithner D., Larsson A., Dave G. (2011). Environmental and health hazard ranking and assessment of plastic polymers based on chemical composition. Sci. Total Environ. 409, 3309–3324. doi: 10.1016/j.scitotenv.2011.04.038
Luo W., Su L., Craig N. J., Du F., Wu C., Shi H. (2019). Comparison of microplastic pollution in different water bodies from urban creeks to coastal waters. Environ. pollut. 246, 174–182. doi: 10.1016/j.envpol.2018.11.081
Masoudi E., Hedayati A., Bagheri T., Salati A., Safari R., Gholizadeh M., et al. (2022). Different land uses influenced on characteristics and distribution of microplastics in Qarasu Basin Rivers, Gorgan Bay, Caspian Sea. Environ. Sci. pollut. Res. 29, 64031–64039. doi: 10.1007/s11356-022-20342-7
Mehdinia A., Dehbandi R., Hamzehpour A., Rahnama R. (2020). Identification of microplastics in the sediments of the southern coasts of the Caspian Sea, north of Iran. Environ. pollut. 258, 113738. doi: 10.1016/j.envpol.2019.113738
Murphy F., Ewins C., Carbonnier F., Quinn B. (2016). Wastewater treatment works (WwTW) as a source of microplastics in the aquatic environment. Environ. Sci. Technol. 50, 5800–5808. doi: 10.1021/acs.est.5b05416
Nelms S. E., Galloway T. S., Godley B. J., Jarvis D. S., Lindeque P. K. (2018). Investigating microplastic trophic transfer in marine top predators. Environ. pollut. 238, 999–1007. doi: 10.1016/j.envpol.2018.02.016
Nematollahi M. J., Moore F., Keshavarzi B., Vogt R. D., Saravi H. N., Busquets R. (2020). Microplastic particles in sediments and waters, south of Caspian Sea: Frequency, distribution, characteristics, and chemical composition. Ecotoxicology Environ. Saf. 206, 111137. doi: 10.1016/j.ecoenv.2020.111137
Oliveira M., Almeida M., Miguel I. (2019). A micro(nano)plastic boomerang tale: a never ending story? TrAC Trends Anal. Chem. 112, 196–200. doi: 10.1016/j.trac.2019.01.005
Ouyang W., Zhang Y., Wang L., Barcelo D., Wang Y., Lin C. (2020). Seasonal relevance of agricultural diffuse pollutant with microplastic in the bay. J. Hazard. Mater. 396, 122602. doi: 10.1016/j.jhazmat.2020.122602
Peng L., Fu D., Qi H., Lan C. Q., Yu H., Ge C. (2020). Micro- and nano-plastics in marine environment: source, distribution and threats - a review. Sci. Total Environ. 698, 134254. doi: 10.1016/j.scitotenv.2019.134254
Plastics Europe. (2020). Plastics - the Facts 2020. Available online at: https://www.plasticseurope.org/application/files/5716/0752/4286/AF_Plastics_the_facts-WEB-2020-ING_FINAL.pdf.
Pojar I., Stănică A., Stock F., Kochleus C., Schultz M., Bradley C. (2021). Sedimentary microplastic concentrations from the Romanian Danube River to the Black Sea. Sci. Rep. 11, 2000. doi: 10.1038/s41598-021-81724-4
Qiu R., Song Y., Zhang X., Xie B., He D. (2020). “Microplastics in urban environments: sources, pathways, and distribution,” in Microplastics in Terrestrial Environments. The Handbook of Environmental Chemistry, vol. 95 . Eds. He D., Luo Y. (Springer, Cham). doi: 10.1007/698_2020_447
Quinn B., Murphy F., Ewins C. (2017). Validation of density separation for the rapid recovery of microplastics from sediment. Anal. Methods 9, 1491–1498. doi: 10.1039/C6AY02542K
Rist S., Carney Almroth B., Hartmann N. B., Karlsson T. M. (2018). A critical perspective on early communications concerning human health aspects of microplastics. Sci. Total Environ. 626, 720–726. doi: 10.1016/j.scitotenv.2018.01.092
Rochman C. M., B. C., Bikker J., Djuric N., Earn A., Bucci K., et al. (2019). Rethinking microplastics as a diverse contaminant suite. Environ. Toxicol. Chem. 38, 703–711. doi: 10.1002/etc.4371
Scherer C., Weber A., Stock F., Vurusic S., Egerci H., Kochleus C., et al. (2020). Comparative assessment of microplastics in water and sediment of a large European river. Sci. Total Environ. 738, 139866. doi: 10.1016/j.scitotenv.2020.139866
Scudo A., Liebmann B., Corden C., Tyrer D., Kreissig J., Warwick O. (2017). Intentionally Added Microplastics in Products. Available online at: http://ec.europa.eu/environment/chemicals/reach/pdf/39168.
Siegfried M., Koelmans A. A., Besseling E., Kroeze C. (2017). Export of microplastics from land to sea. A modelling approach. Water Res. 127, 249–257. doi: 10.1016/j.watres.2017.10.011
Soltani N., Keshavarzi B., Moore F., Busquets R., Nematollahi M. J., Javid R., et al. (2022). Effect of land use on microplastic pollution in a major boundary waterway: The Arvand River. Sci. Total Environ. 830, 154728. doi: 10.1016/j.scitotenv.2022.154728
Townsend K. R., Lu H. C., Sharley D. J., Pettigrove V. (2019). Associations between microplastic pollution and land use in urban wetland sediments. Environ. Sci. pollut. Res. 26, 22551–22561. doi: 10.1007/s11356-019-04885-w
UNEP. (2018). Legal Limits on Single-Use Plastics and Microplastics: A Global Review of National Laws and Regulations (United Nations Environment Programme). Available online at: https://www.unenvironment.org/resources/report/legal-limits-single-use-plasticsandmicroplastics (Accessed 04 April 2020).
van Emmerik T., Schwarz A. (2020). Plastic debris in rivers. WIREs Water 7, e1398. doi: 10.1002/wat2.1398n
Waldschläger K., Schüttrumpf H. (2019). Effects of particle properties on the settling and rise velocities of microplastics in freshwater under laboratory conditions. Environ. Sci. Technol. 53, 1958–1966. doi: 10.1021/acs.est.8b06794
Wright S. L., Kelly F. J. (2017). Plastic and human health: a micro issue? Environ. Sci. Technol. 51, 6634–6647. doi: 10.1021/acs.est.7b00423
Wright S. L., Thompson R. C., Galloway T. S. (2013). The physical impacts of microplastics on marine organisms: a review. Environ. pollut. 178, 483–492. doi: 10.1016/j.envpol.2013.02.031
Yanga H., Dong H., Huang Y., Chen G., Wang J. (2022). Review: Interactions of microplastics and main pollutants and environmental behavior in soils. Sci. Total Environ. 825, 153511. doi: 10.1016/j.scitotenv.2022.153511
Zheng S., Zhao Y., Liangwei W., Liang J., Liu T., Zhu M., et al. (2020). Characteristics of microplastics ingested by zooplankton from the Bohai Sea, China. Sci. Total Environ. 713, 136357. doi: 10.1016/j.scitotenv.2019.136357
Keywords: freshwater environments, riverine microplastics, sediment, land-use, Gorgan Bay
Citation: Gholizadeh M, Hedayati A, Pouladi M and Sundaramanickam A (2024) Source of plastic contamination of the rivers ending to the Gorgan Bay, southeast of the Caspian Sea, Iran. Front. Mar. Sci. 11:1150755. doi: 10.3389/fmars.2024.1150755
Received: 24 January 2023; Accepted: 24 July 2024;
Published: 20 August 2024.
Edited by:
Francesca De Falco, AREA Science Park, ItalyReviewed by:
Jose-Luis Martinez-Guitarte, National University of Distance Education (UNED), SpainParvin Sadeghi, Chabahar Maritime University, Iran
Copyright © 2024 Gholizadeh, Hedayati, Pouladi and Sundaramanickam. This is an open-access article distributed under the terms of the Creative Commons Attribution License (CC BY). The use, distribution or reproduction in other forums is permitted, provided the original author(s) and the copyright owner(s) are credited and that the original publication in this journal is cited, in accordance with accepted academic practice. No use, distribution or reproduction is permitted which does not comply with these terms.
*Correspondence: Mohammad Gholizadeh, Z2hvbGl6YWRlX01vaGFtbWFkQHlhaG9vLmNvbQ==
†ORCID: Mohammad Gholizadeh, orcid.org/0000-0002-2314-0714
Seyed Aliakbar Hedayati, orcid.org/0000-0001-7658-5314
Arumugam Sundaramanickam, orcid.org/0000-0002-2682-445X
 Mohammad Gholizadeh
 Aliakbar Hedayati2†
 Mojtaba Pouladi
 Arumugam Sundaramanickam