 Alex N. Tidd
 Vasquez Caballero1,3
 Jorge García Molinos
- 1Centro de Investigación Mariña, Universidade de Vigo, Future Oceans Lab, Lagoas-Marcosende, Vigo, Spain
- 2Theoretical Ecology Group, Department of Biological Sciences (BIO), University of Bergen, Bergen, Norway
- 3Center for Applied Economics and Strategy, RTI International, Research Triangle Park, NC, United States
- 4Institute for Marine and Antarctic Studies, University of Tasmania, Hobart, TAS, Australia
- 5Centre for Marine Socioecology, University of Tasmania, Battery Point, TAS, Australia
- 6Arctic Research Center, Hokkaido University, Sapporo, Japan
- 7Graduate School of Environmental Science, Hokkaido University, Sapporo, Japan
There is an urgent need to assess the extent to which the global fishing enterprise can be sustainable in the face of climate change. Artisanal fishing plays a crucial role in sustaining livelihoods and meeting food security demands in coastal countries. Yet, the ability of the artisanal sector to do so not only depends on the economic efficiency of the fleets, but also on the changing productivity and distribution of target species under rapid climate change in the oceans. These impacts are already leading to sudden declines, long-term collapses in production, or increases in the price of fish products, which can further exacerbate excess levels of fishing capacity. We examined historical changes (1950-2014) in technical efficiency within the global artisanal fishing fleets in relation to sea surface temperature anomalies, market prices by taxonomic group, and fuel costs. We show that temperature anomalies affected countries differently; while some have enhanced production from an increase in the resource distribution, which alter the structure of the ecosystem, others have had to adapt to the negative impacts of seawater warming. In addition, efficiency decreases are also related to rises in global marine fish price, whereby more labour and capital are attracted into the fishery, which in turn can lead to an excess in fleet capacity. Our results contribute to the understanding of how the effects of climate-induced change in the oceans could potentially affect the efficiency of artisanal fishing fleets.
1 Introduction
At a time of increasing demand for global food resources (Barange et al., 2014) and growing understanding on the observed (Weatherdon et al., 2016) and projected (Gaines et al., 2018) global impacts of climate change on fisheries, new approaches are needed to assess their sustainability and adaptive capacity across different systems and scales (Thiault et al., 2019). Factors such as anthropogenic climate change have implications toward global change (e.g., employment and/or mobility) or changes in demand from population growth and wealth—that risk significant changes to sustainable yields or substantial increases in the price of fish products, both of which could negatively affect many people’s lives in terms of health, well-being, and dietary needs (Golden et al., 2016). A key challenge for fisheries is how we can rigorously evaluate their sustainability to effectively anticipate and avoid risks to fisheries livelihoods and economies under climate change. However, this is often undiagnosed because of limited data on fishing effort and the exogenous drivers (e.g., climatic, costs and prices) that influence fishing (Lam et al., 2016).
Threats to marine capture stocks continue due in part to government subsidies, globally representing US$35.4 billion annually (Sumaila et al., 2019), which encourage wasteful, uneconomic fishing practices in already overcapitalized fisheries, where current numbers of vessels double those of the 1950s and maintain fishing effort even when stock levels decline (Rousseau et al., 2019). It is also important to note that fisheries subsidies are now directed towards conservation and research/management and away from capacity enhancement (see Skerritt et al., 2020). Other contributing causes include: (i) the failure to regulate access rights, which are insufficiently defined and enforced (Costello et al., 2008) leading to Illegal, Unreported and Unregulated (IUU) fishing (Agnew et al., 2009); and (ii) the increase in the number of fish markets (Cunningham and Gréboval, 2001), and (iii) technological creep, i.e., year-to-year increases in technical efficiency (Tidd et al., 2016; Tidd et al., 2022). The culmination of the above factors can lead to excess capacity (surplus use of inputs to produce potential outputs) and low technical efficiency, which can threaten the long-term sustainability of global fisheries resources and economic viability of fishing operations (Garcia and Grainger, 2005). Simply, technical efficiency relates to economics in that fish are targeted at the lowest possible costs. It is therefore not a useful indicator to make inferences about relative stock biomass size changes as technical efficiency can be high or low, regardless of fish stock biomass levels. This is due to a combination of factors, because excess capacity changes through time (Hilborn and Walters, 1992), whereby fishers produce less than under normal operating conditions because of changes in market conditions, management regulations, environmental factors, energy-efficient fishing means, skilled employees, and stock abundance (Herrero and Pascoe, 2003).
Of increasing concern are the global motorized artisanal fisheries that represent 57% of the global 3.7 million vessels and 50% of the total global 145.9-gigawatt power as of 2015 (Rousseau et al., 2019). For this fishing sector, much less is known in terms of the status of targeted global stocks or the level of excess capacity, compared to industrial fisheries (Lancker et al., 2019). Furthermore, artisanal fleets operate in coastal waters and generally have higher exposure to climate change impacts and extreme events (Bezner Kerr et al., 2022; Ilosvay et al., 2022), and a lower adaptive capacity than industrial fleets due to fisher’s mobility constraints and the level of technology (Bezner Kerr et al., 2022; Cooley et al., 2022). Despite the importance of artisanal fisheries for employment and nutrition, especially in developing countries, they are often unregulated and have historically been less studied than industrial fisheries (Júnior et al., 2016). Here, we aim to fill this gap by focusing on the global artisanal fishing fleet and how technical efficiency is affected under climate and economic change.
Indicators that connect economic and social-ecological processes are in short supply, as are indicators to determine the extent to which fishing has reached or exceeded capacity (i.e., the excess fishing pressure that threatens both the sustainability of fish stock and the socioeconomic performance of the fleet) across the global ocean. Some indicators and frameworks for determining fisheries performance do exist (e.g., Anderson et al., 2015), providing a collective insight into how management and exogenous factors interact with the resource and community factors as to who benefits. The recent development of fishing maps of global catch reconstruction time series (Watson and Tidd, 2018) combined with satellite remote sensing provide scientists with the opportunity for more comprehensive methods to globally address changes in stock levels concerning target reference points and the associated social and economic risks. There have also been advances through the development of bio-economic models to assess what broad-scale fisheries reform might look like for global fisheries (Costello et al., 2016), including management scenarios under climate change (Gaines et al., 2018; Free et al., 2020; Leitão et al., 2020). However, these global analyses often do not disentangle the effects of the industrial and artisanal fishing sectors due to poorly detailed and incomplete reports of fish catches. In addition, there are still very few examples in the literature that directly explore how fishing behaviour and efficiency change as a result of climate change (Rubio et al., 2020). The present study contributes to fill this gap. Several studies have used environmental predictor variables such as temperature anomalies to model fish growth (e.g., Sande et al., 2019), or the influence of ENSO indices in modelling tuna abundance indices (e.g., Ducharme-Barth et al., 2022). Other studies have used a combination of environmental variables for estimating technical efficiencies in diverse sectors such as coastal aquaculture fisheries (Schrobback et al., 2014) or grain production within the agriculture sector (Neumann et al., 2010).
A recent study provided an assessment of global fishing efficiencies and highlighted that many of the countries having years of low technical efficiency (excess capacity) are also those with a high vulnerability to climate induced change (e.g., western central Pacific Ocean), and have a low adaptive capacity to respond to those changes (i.e, low Gross Domestic Product (GDP)) (Tidd et al., 2022). However, it may be important for countries to have excess capacity in the fleet for adaptive reasons, preparedness to address maintenance issues such as breakdowns or engine refits, and/or readiness to respond to cyclic weather systems affecting stocks such as El Niño and La Niña in Oceania and South America, respectively. Further, where fish stock distributional changes are likely to occur across jurisdictional borders, increased tensions among the nations sharing the fisheries resource are to be expected (Pinsky et al., 2018; Oremus et al., 2020). This chain of impacts is likely to disproportionately affect small-scale artisanal fisheries, which are constrained by limited adaptation capacity and their dependence on coastal ecosystems. Importantly, society needs a better understanding of how climate change impacts our food systems. While mean temperatures represent the single most important predictor of global distributions of marine biota (Tittensor et al., 2010), short-term, periodic changes in climatic conditions are known to influence the abundance and distribution of many species (e.g., Lehodey et al., 1997). Extreme and prolonged temperature anomalies are of increasing concern because they can significantly alter the abundance, composition and geographical ranges of commercial species while damaging important supporting ecosystems such as corals, kelps, and seagrasses (Smale et al., 2019). These impacts can have significant socio-economic implications, including altered fishing patterns, prices collapses and closures of fisheries (Cavole et al., 2016). In this study, we focus on sea surface temperature anomalies as an indicator of climatic change to specifically explore how the technical efficiencies of artisanal fleets have been affected globally. While artisanal fleets have been found to be vulnerable to the long-term effects of climate change (Tidd et al., 2022), here we specifically ask 1) how has climate change influenced/impacted global artisanal fleets’ technical efficiency at the exclusive economic zones (EEZs) level, and 2) how the dynamic changing market conditions affect technical efficiency.
To address these questions this paper combines the results from a previous Data Envelopment Analysis (DEA) (Farrell, 1957) time-series (1950-2014) of artisanal fisheries technical efficiency estimates from Tidd et al. (2022), with additional data on market dynamics and climate change. We apply a second stage statistical approach (Hoff, 2007) to predict technical efficiency scores subject to market dynamics (costs and prices), and sea surface temperature anomalies. By monitoring changes in technical efficiency influenced by exogenous factors (i.e., climatic, cost, and prices), we will provide novel important knowledge for the enforcement of fisheries regulations under continually changing economics and environmental conditions.
2 Materials and methods
2.1 Data envelopment analysis (DEA)
Economic approaches to estimate technical efficiency, defined as the ratio of the current output (catch) to potential output or simply what is caught/what could be caught with available means, i.e., the ability to catch fish (Herrero and Pascoe, 2003), have been widely used to assess economic sustainability in many sectors including fisheries (e.g., environmental decision making and policy analysis; Mardani et al., 2018). Among them, Data Envelopment Analysis (DEA; Farrell, 1957) is a useful tool for estimating technical efficiency that accounts for additional variables that affect output such as short-term changes in market conditions (e.g., cost and prices) or stock abundance, and differences in the technical efficiency of countries (fleets and/or vessels). One of the key benefits of DEA is that it does not require individual fisher information on revenue and costs. This approach is invaluable in data-limited situations and across multiple scales of aggregation (from individual vessels to entire fleets and fisheries sectors). The method assumes the production function (how outputs change within inputs) is unknown and compares each production unit against all other production units (Cooper et al., 2000). Here, we used year as the production unit within a country’s time series to compare against all other years and given a set of input and output variables. The approach identifies the “frontier” which represents the most efficient combination of various inputs (kW power, fishing days and number of vessels by country and year) and output variables (catches by country and year - total weight in tonnes) for the countries in question. All else being equal, any production year of similar characteristics should be able to achieve the same output. The process is deterministic and produces an efficiency index (score) for that year production unit. The DEA process is often criticized for being nonparametric, as it does not account for random error, resulting in the underestimation of the efficiency scores due to serial correlation. To avoid this, Simar and Wilson (1998) suggested applying a bootstrapping approach to provide bias-corrected deterministic technical efficiency scores to improve statistical validity, inference, and efficiency.
2.2 Global fishing activity data and predictor variables
We use the database for global fishing activity produced by Tidd et al. (2022) containing bias-corrected technical efficiency scores (dependent variable) derived from a Data Envelopment Analysis described above (see Farrell (1957)), by year, country, and sector (i.e., artisanal for 105 countries over the period 1950-2014). These data originate from reconstructed catch (Watson, 2016) and effort data (Rousseau et al., 2019) (see data availability section). The Price data is comprised of a large data set compiled by the Sea Around Us Project and described in: Swartz et al. (2012) and Sumaila et al. (2007). The database contains nominal price data from global ex-vessel prices for all commercially exploited marine fish stocks by country and year (1950-2014), as well as converted local inflation-adjusted real price in $US (used here) to the year (year base 2000) from the International Monetary Fund database.
Model predictors were chosen to avoid collinearity with the inputs into the DEA. The resulting model predictors included country-specific, inflation-adjusted average real price by year and taxonomic group (FAO International Standard Statistical Classification of Aquatic Animals and Plants) including marine molluscs (e.g. squids), crustacean (e.g. crabs), marine fish (e.g. demersal fishes such as flatfishes and cod), small pelagic fish (e.g. anchoveta), large pelagic fish (e.g. tunas), mixed pelagic fish (e.g. tunas and swordfish), elasmobranchs (e.g. sharks, skates and rays), diadromous fish (e.g. salmons and trouts), freshwater (e.g. carps, and pikes from capture catches in Baltic and Black sea regions – contains a mixture of freshwater and marine fauna) and other (e.g. aquatic plants and miscellaneous seafood products) (see Table 1). To reflect the cost of inputs, US crude oil prices ($US per barrel) were obtained from Western Texas Intermediate (WTI) spot prices per month (see Table 1). These cost values were averaged per year and inflation-adjusted using the raw consumer price index (CPI) for fuel from the US labour department for statistics found here (https://www.in2013dollars.com/Fuel-oil/price-inflation accessed February 22, 2022). This data was combined with the price data by year.
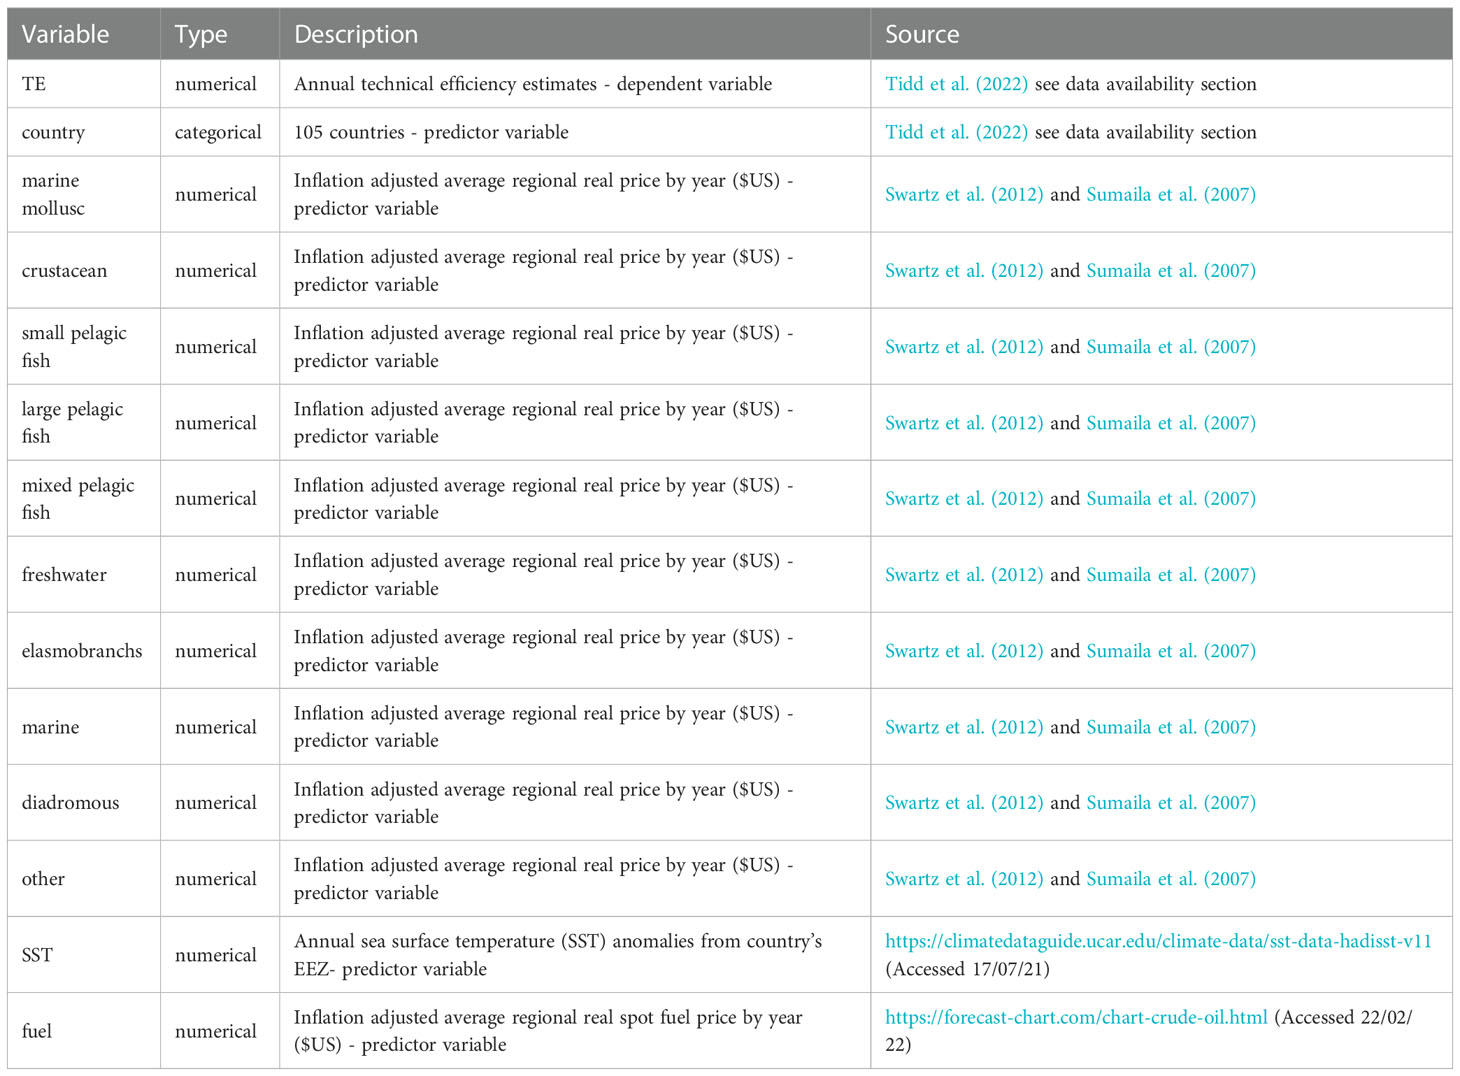
Table 1 Variable description and source.
Annual sea surface temperature (SST) anomalies were calculated for each of the artisanal country’s Economic Exclusive Zones (EEZs) (Flanders, 2014) from the 1-deg resolution, annual mean global sea surface temperature (SST) HadiSSTa v1.1 data set (Rayner et al., 2003) (see Table 1). EEZ anomalies were calculated by computing the average cell-wise differences between the annual means over the study period (1950-2014) and the overall mean SST for the baseline period (1981-2010). Anomalies are an important diagnostic tool to evaluate departures from long-term mean climatic conditions. Positive and negative anomalies indicate, respectively, years with above/below-average mean temperatures. Country specific fleet totals for engine horsepower (hp) were excluded from the analysis as they were highly correlated with country-specific kW power that was used in the primary DEA analysis to determine technical efficiency.
2.3 Regression model
Censored regression (Tobit model; Tobin, 1958) has been often used to explain differences in bias-corrected technical efficiency scores from DEA (e.g., Tingley et al., 2005). This type of model naturally allows for the estimation of linear relationships in cases where dependent variables are ‘censored’ at an upper and/or lower threshold value (i.e., efficiency scores values range between 0 and 1). However, there have been discussions in the literature as to whether the efficiency estimates are censored (e.g., fractional or normalized with a heteroskedasticity distribution i.e., the variability of the dependent variable widens or narrows with the increase in the predictor variables), and whether the Tobit regression is needed where Ordinary Least Squares (OLS) may suffice (e.g., Hoff, 2007; McDonald, 2009). McDonald (2009) argues that the Tobit may result in model mis-specified parameter estimates and that OLS is more appropriate. The results from the experiment comparing OLS and Tobit by Hoff, 2007 also re-emphasize the use of OLS over Tobit. Therefore, we use OLS to fit our statistical model.
To account for the censoring of the data (i.e., values close to 1) where parametric inference is impossible and there are heteroscedastic residuals to fit with small samples, we followed the two-stage bootstrap method suggested by Simar and Wilson (2007). The first stage involved bootstrapping (1000 replications) the efficiency scores to correct for their right-skewed distribution, and to bias-correct estimates of efficiency scores. These scores were then modelled in a second stage as the dependent variable with the predictor variable marginal effects to be estimated. At this stage, a second bootstrap (1000 replications) is applied to the empirical distribution of the bias-corrected efficiency scores via a regression. The resulting parameter estimates of the marginal effects are then bias-corrected.
Specifically, the overall procedure consisted of the following steps:
1. Calculate the bias-corrected DEA scores (θ) for each year (j) in each country by solving the DEA algorithm.
2. OLS was fitted to obtain estimates of beta of each predictor variable x ( and € (from the N(0,€)) from the regression of the efficiency scores calculated in Step 1.
3. Use the 1000 bootstrapped replicates (B) from Step 2 as a an approximation of the true distribution of the efficiency score.
4. Calculate bias-corrected estimates of the parameter estimates. Where bias [] =, and the bias-corrected estimate ~ = bias ]. Essentially when an estimator is known to be biased, it is possible to estimate the bias and then modify the estimator by subtracting the estimated bias from the original estimate (Step 2) with the intent of improving the accuracy of the estimate.
Model selection was performed by systematically fitting all possible combinations of available uncorrelated (i.e., variance inflation factor (VIF) ≤ 5; Rogerson, 2001) model predictor variables from the full OLS model specification using the R package ‘glmulti’ (Calcagno and de Mazancourt, 2010). The resulting set of candidate models was ranked by their Akaike Information Criterion (AIC) and the best model were selected using their AIC-model weights (Burnham and Anderson, 2002). Cross-validation was applied on the final model to test for overfitting by randomly selecting 70% of the data for model training and the remaining 30% for testing. Overfitting occurs when the model accuracy on predicting the training data is much higher than that from predicting the test set. The selected model was finally bootstrapped 1000 times as previously described to bias-correct the fixed-parameter estimates.
2.4 Elasticities
The elasticities marginal effects were calculated by country on the continuous predictor variables to understand their unit effect on technical efficiency (i.e., a 1% marginal effect change in X gives a % marginal effect change in Y) all other predictor variables held constant. E.g., see equation (1).
Where X is the maximum value and is the mean used to estimate the bias-corrected exogenous variable coefficient b plus the country coefficient c, and x is the elasticity for that variable. Maximum values are used instead of means to compare elasticities across countries. Often country effects are larger than the covariates due to unobserved country differences due to countries heterogeneity and therefore any meaningful difference will be small.
3 Results
3.1 Model validation
Model selection performed on the full OLS model (all predictors had VIF values ≤ 3.5) resulted in five competing models (ΔAIC ≤ 2 units) extracted from the total of 8,450 candidate models (Table 2). Given all competing models were statistically significant at the p < 0.001 level and there was no clear support for any of them, we chose the higher rank model based on the raw AIC and the Akaike weights. Cross-validation performed on the selected model showed very little difference in the predictive accuracies with an R2 of 0.46 (RMSE of 0.164) for the test set and 0.45 (RMSE 0.16) for the training set, suggesting overfitting was not an issue.
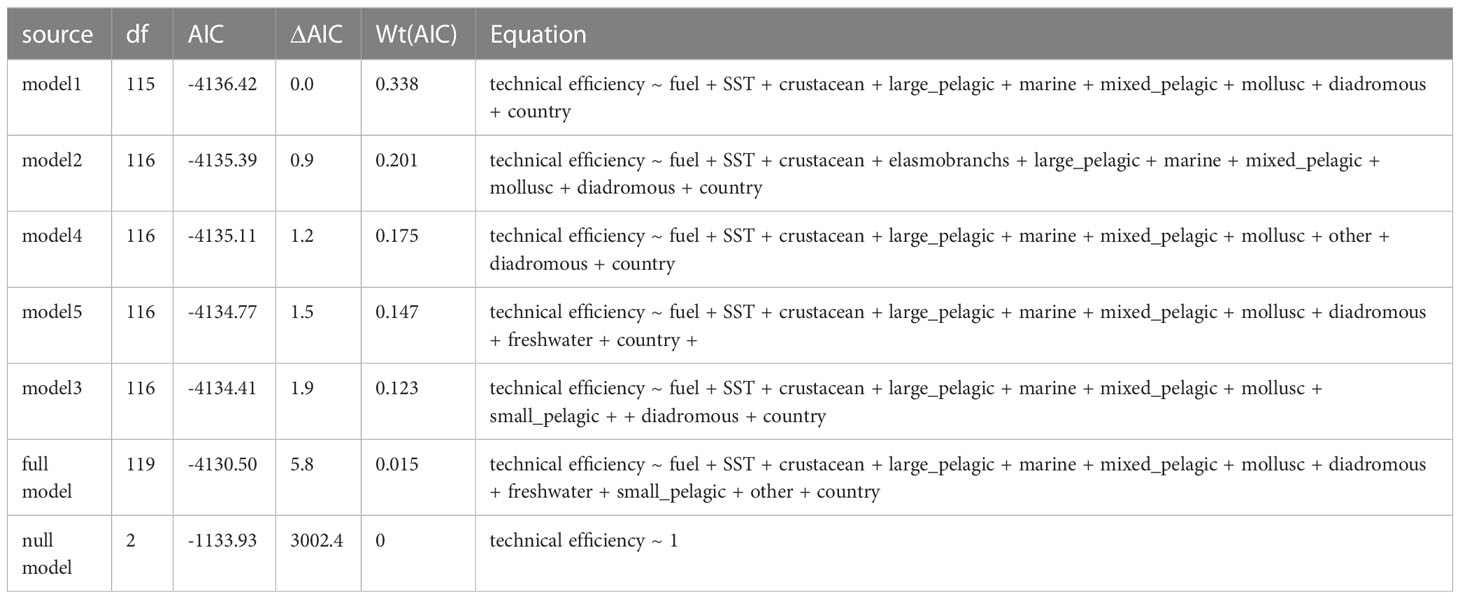
Table 2 Candidate models diagnostics.
Results from the model fit shown coefficients for all continuous exogenous covariates statistically significant at the 5% level (Table 3). Price-related regression coefficients displayed the expected positive signs apart from the marine fishes. In contrast, the coefficient for fuel price was positive suggesting that higher prices drive higher efficiencies. The positive coefficient for SST shows positive changes in technical efficiency to warmer-than-average years all else remaining equal. Results from the random stratified bootstrapped regression mean parameter estimates (Table 3), where the confidence intervals indicate the precision of the estimates, differed very slightly from those of the full OLS model strongly suggesting low error estimation and a good model fitting.
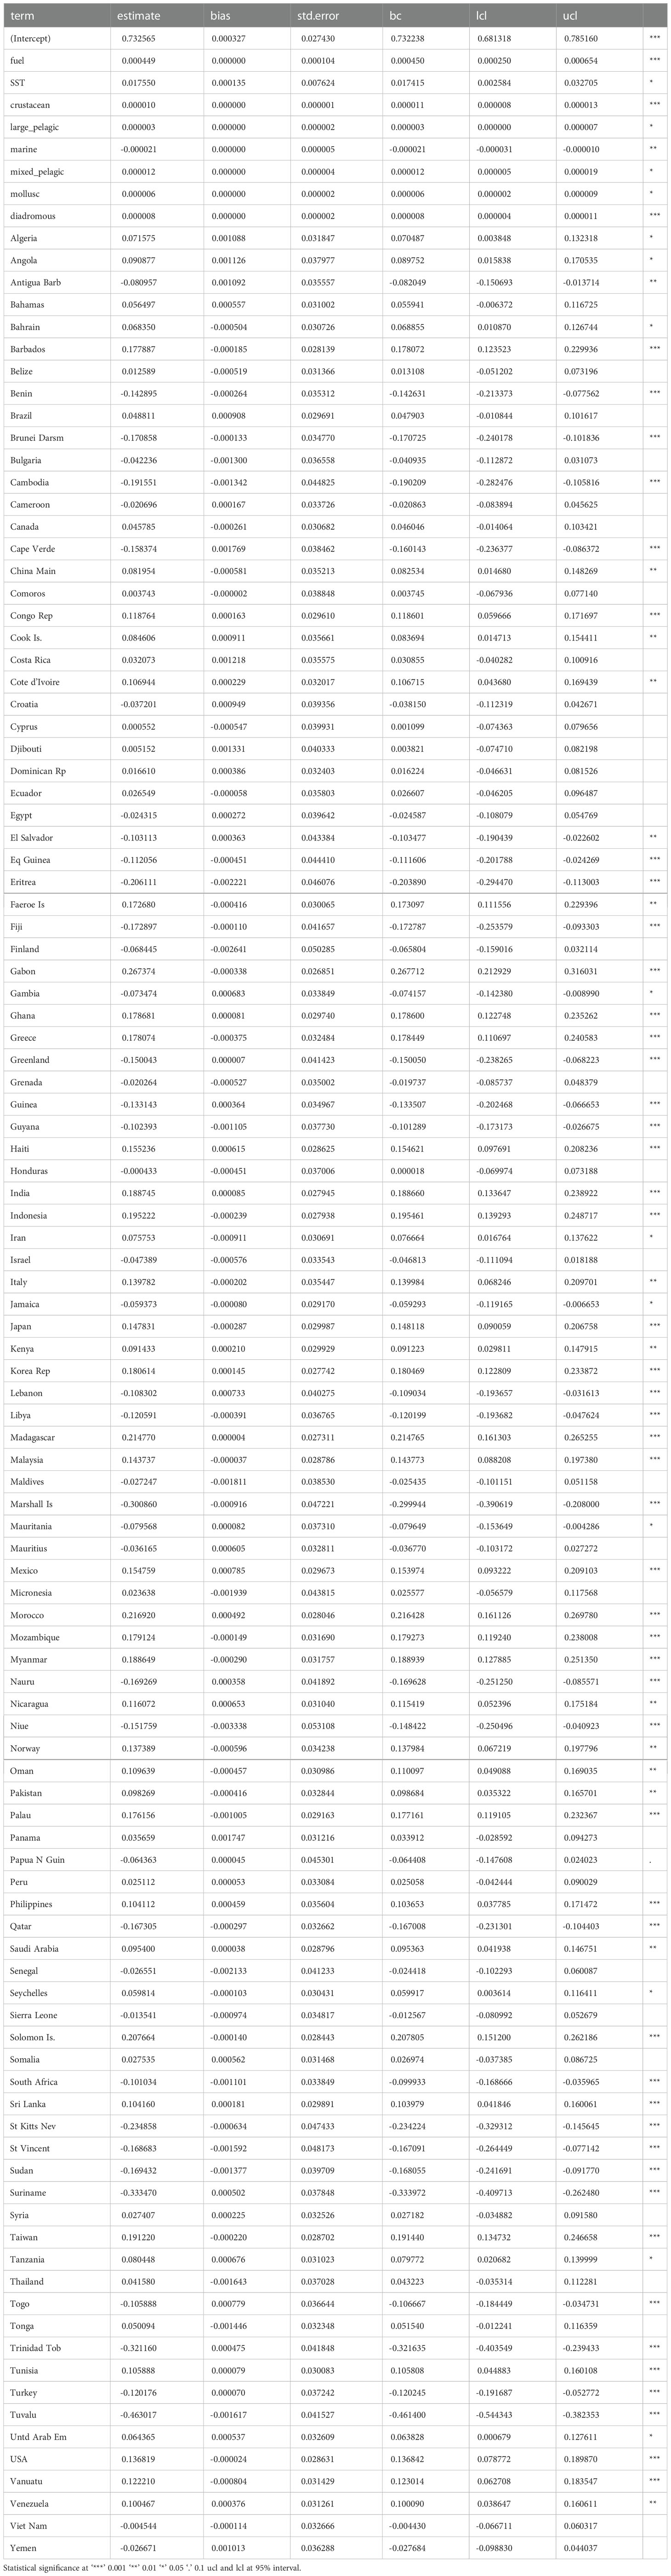
Table 3 Model 1 coefficient estimates for OLS and bootstrapped OLS (bias-corrected (bc)).
3.2 Exogenous effects on fishing efficiency
The predicted global artisanal fleets change in technical efficiency (i.e., elasticities) resulting from single percentage unit changes in each predictor variable (catch price, fuel costs and SST) varied widely depending on countries and regions (Figures 1, 2). All elasticities were found to be inelastic i.e., less than a 1% change in technical efficiency from a 1% change in exogenous predictor variables. This means that when, for example, the prices or costs go up there are small changes. The largest global negative effect ~ - 0.1% on technical efficiency (e.g., a 1% change in marine prices results in a 0.1% decrease in fishing efficiency) was found because of an increase in marine fish prices in Oceania and South America (Figures 1E, F) respectively) and other global mid-latitude countries (Figure 2E). Diadromous fishes and crustacean prices revealed the highest positive values of elasticities amongst the other taxonomic groups on average. Crustacean price dominated globally and generally had the largest positive effects on technical efficiency across all geographical regions (~0.1%; Figure 1) other than Oceania. Fuel price increases had a positive effect on the technical efficiency of artisanal fleets in most of the regions and for most countries (Figures 1, 2A). However, these fuel elasticities were smaller compared to the crustacean price covariate for most regions. The highest effect of fuel costs was observed in Europe (~0.12%) and, conversely, a negligible decline in efficiency was observed for the Oceania region.
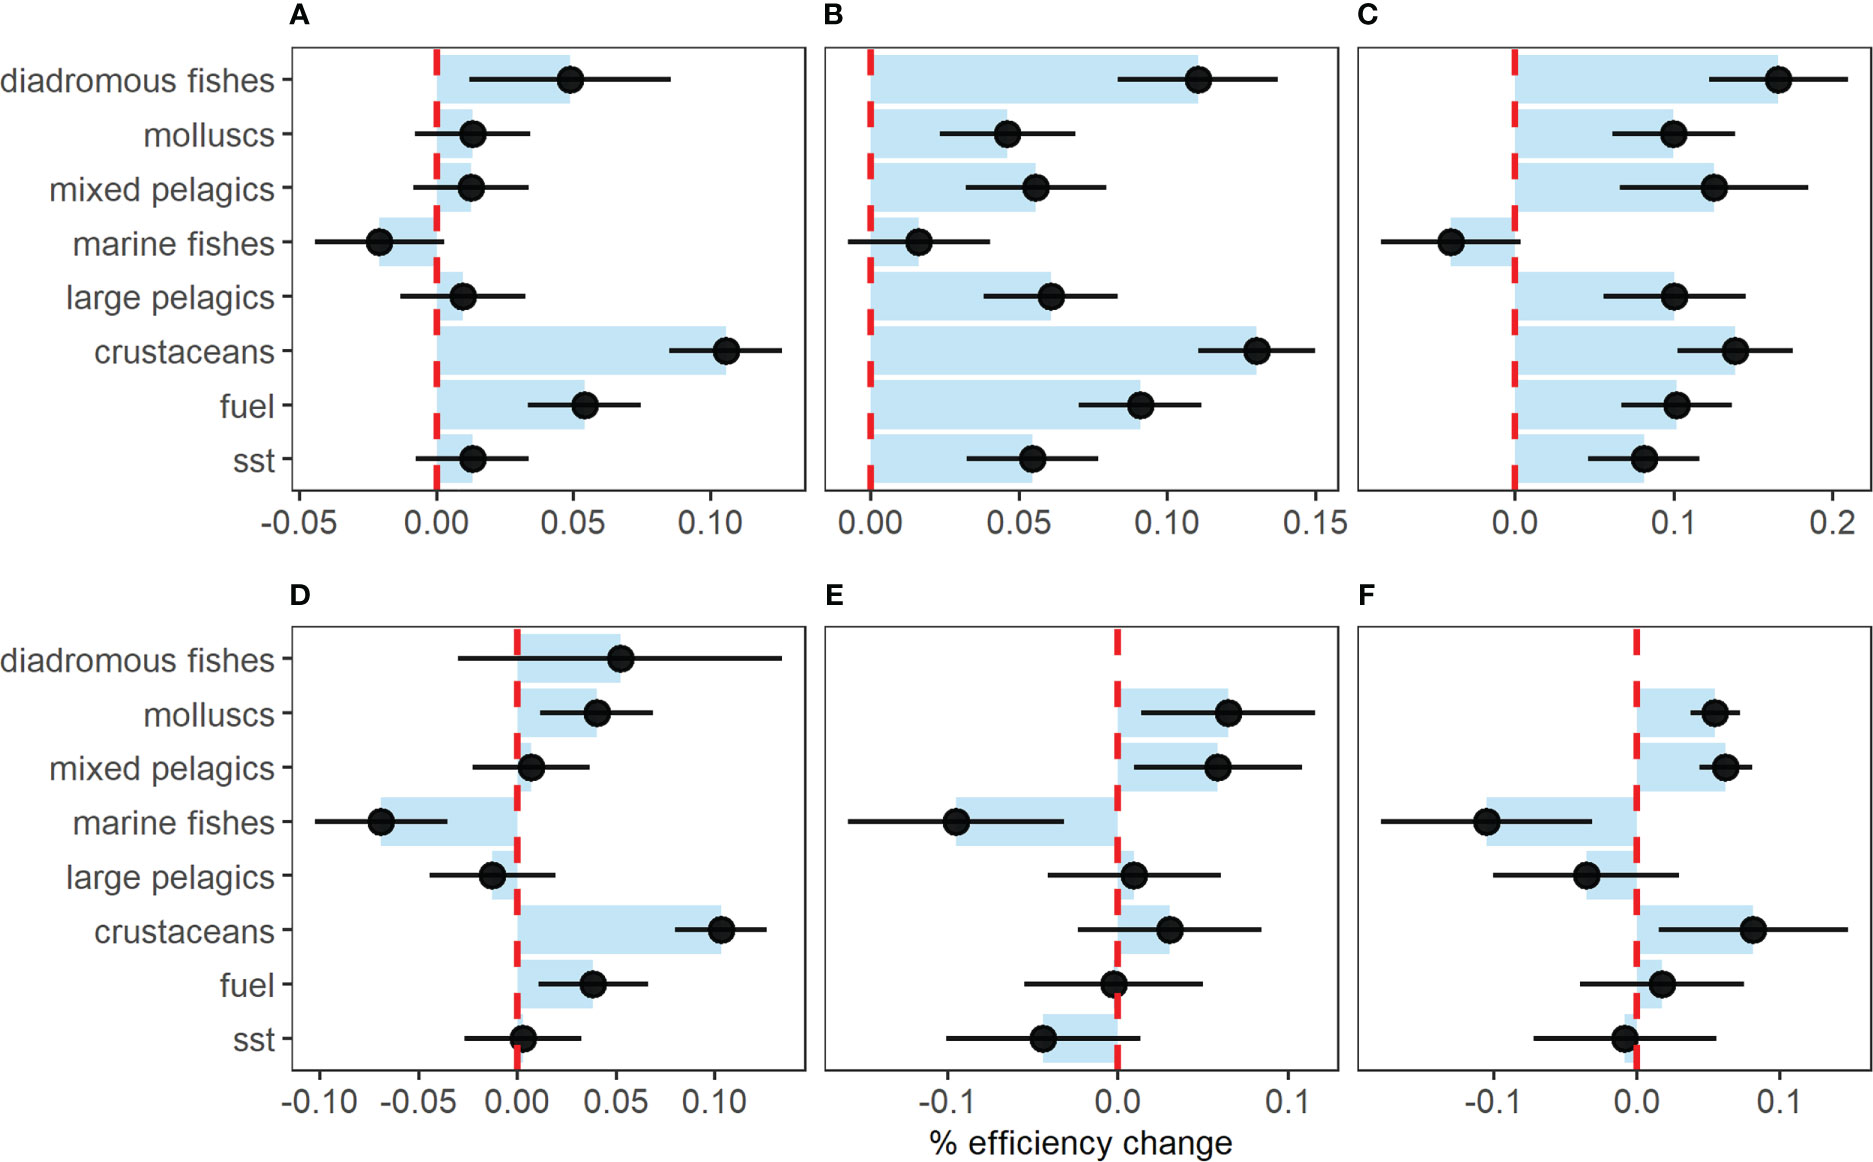
Figure 1 Maximum global elasticities by region. A 1% change in the exogenous predictor’s leads to a percentage change in technical efficiency (y-axis) (black standard error bars). Each panel represent a different region: (A–F) Africa, Asia, Europe, North America, Oceania, and South America, respectively.
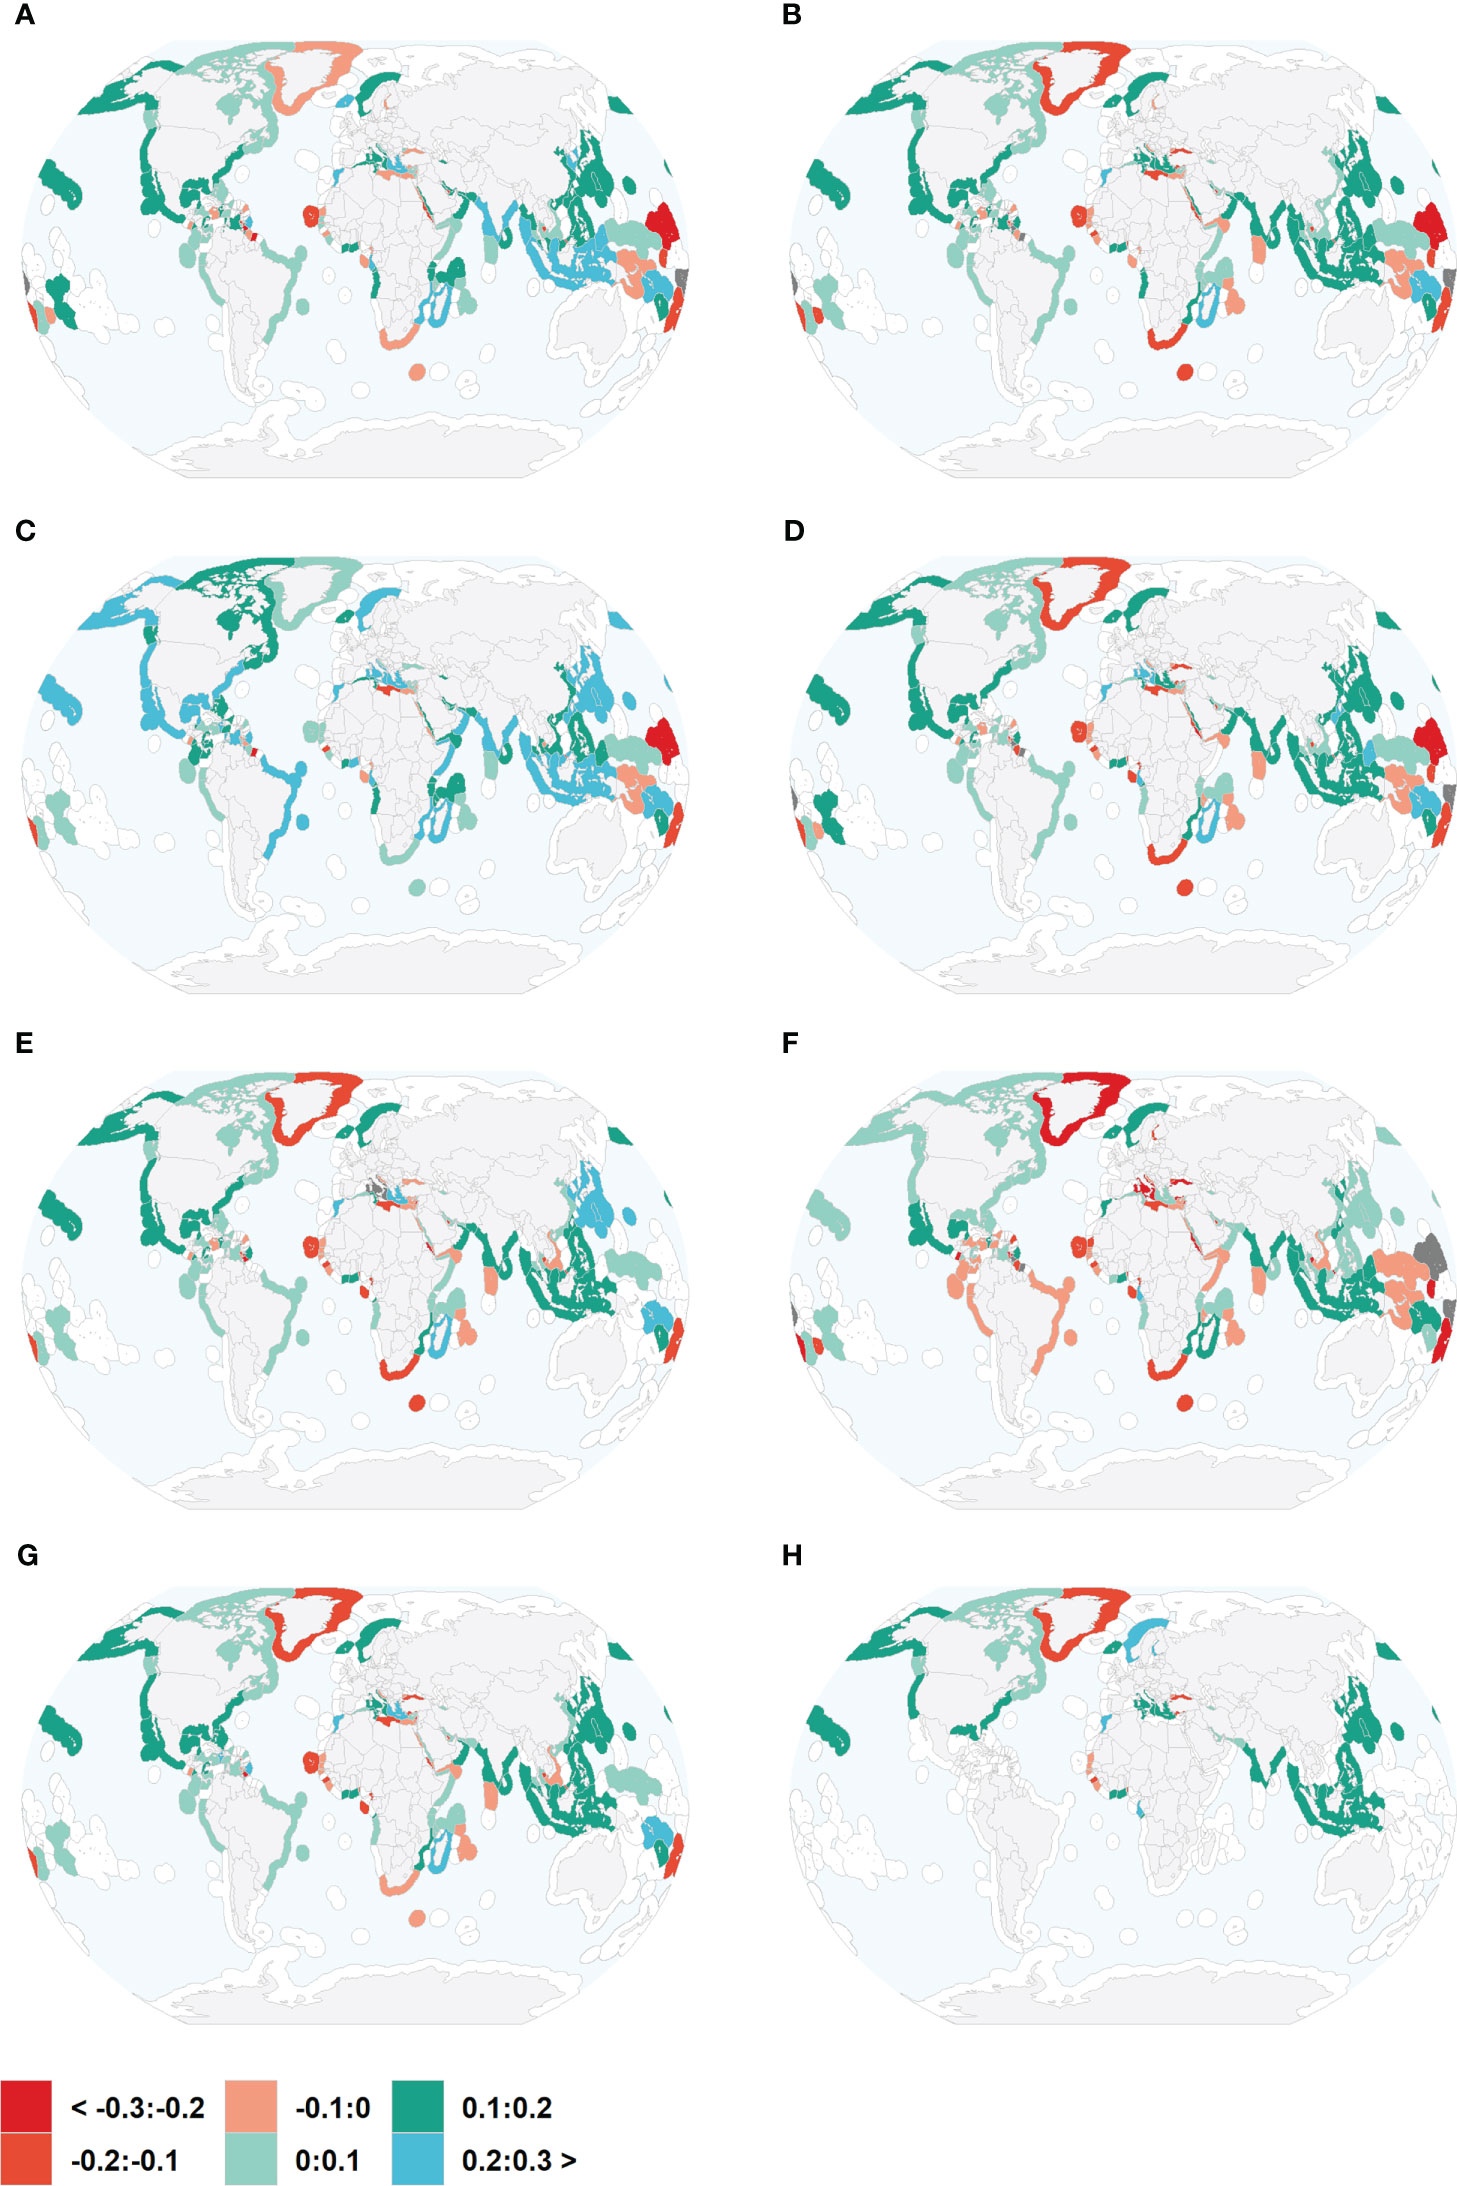
Figure 2 Country specific elasticities. Global maps providing the country-level marginal effect elasticities (a 1% change) calculated on the continuous predictor variables including: (A) fuel price, (B) SST, (C) crustaceans, (D) large pelagic, (E) mixed pelagic, (F) marine fishes, (G) molluscs, and (H) diadromous fishes. Colors represent percentage change in technical efficiency.
The effect of SST anomalies varied with the region (Figures 1, 2B) and the largest effects on technical efficiency increases were found concentrating in Europe and Africa and Asia. However, countries were SST anomalies were associated with a decrease in technical efficiency were found in Oceania and South America. These countries also exhibited large associated variability in their technical efficiency estimates (Figures 1E, F).
4 Discussion
Improving the sustainability of global artisanal fisheries requires the adoption of effective fisheries management standards and planning to ensure the vital supply to feed future generations. This is reflected by the United Nations Sustainable Development Goals in its SDG14 “Life below water” that urges countries to progress in ending perverse subsidies to fishing fleets and to recognizing and protecting access rights for small-scale fisheries globally, in terms of marine resources and markets. Advances in these fields will form a global picture of optimum levels of fishing activity by country and region. Acquiring new knowledge through performance indicators, and driving global forces can lead to improvements in fisheries management that could counterbalance the effects of external drivers of change, such as climate change and fluctuations in economic markets (Garcia and Rosenberg, 2010). Furthermore, technical progress needs to be considered. Squires and Vestergaard (2013) show that technical progress has been substantial in many fisheries. Differences in efficiency can be attributed to differences in technical efficiency with a lot of heterogeneity e.g., technological advancements, global positioning systems and sonar, vessel power and size, skipper and crew skill, changes to port side infrastructure and within the processing sectors, such as transportation, storage, and preservation. Fishers are always finding ways that are more efficient to process and harvest seafood to reduce costs and therefore maximise profits, this in turn results in differences in physical and economic efficiencies among fishers. Our study helps to bridge this research gap by providing novel evidence on how different climatic and economic exogenous drivers have influenced the global artisanal fleet technical efficiency over the last 6 decades.
4.1 Effects of SST increases on efficiency
The results of this analysis show some interesting findings. For instance, rising SST show similar negative elasticities concerning the maximum change in fishing efficiency of countries within the regions of Oceania, which should exacerbate the already observed and predicted impacts of climate change in catches and profits from fisheries for these regions (Free et al., 2020). The effect of temperature anomalies varies across regions where in some cases, we see a positive link to efficiencies (i.e. through resource productivity), while in other we see a negative link (i.e. due to reaching species thermal tolerances and productivity). Please see Figure 3 which represents a time series of SST anomalies, technical efficiency estimates, fish prices and cost indexes for the regions of (A) Africa, (B) Asia, (C) Europe, (D) North America, (E) Oceania, and (F) South America.
Oceanian countries are subjected to frequent extreme weather patterns (e.g., Hanich et al., 2018) and their waters have seen strong recent increases in temperature (Figure 3A). For example, the ocean acidification condition of Tuvalu’s waters has dramatically declined over recent years from overfishing, pollution, and climatic events such as sea surface temperature warming (Kuchinke et al., 2014), which has affected reef fishes’ quantity and size (McCubbin et al., 2017). Nowadays, Tuvalu’s fishers must travel further away from the islands surrounding the lagoon to target pelagic fish resulting in increased costs (McCubbin et al., 2017). We also note the global trend in fuel index increases (Figure 3E) in more recent times (the late 1990s to 2014), and the declines in fish price and efficiency, potentially driven by the accelerated expansion of the regional tuna fisheries (large pelagics) (Tidd et al., 2016). With the increase in costs in recent times (Figure 3A), competitive pricing of imported foods and the number of industrial tuna vessels offloading fish on the local markets may affect artisanal fisher efficiency. Artisanal vessels may be forced, due to internally driven changes in market forces, to alter their production strategies (James et al., 2018) (recent excess capacity in Oceania of ~ 40%; Figure 3E), e.g., exit fisheries, use for other purposes such as tourism, tie up or be sold and operate elsewhere. This also comes with its issues as it could lead to social and economic consequences to coastal communities that rely on fleets for employment (James et al., 2018).
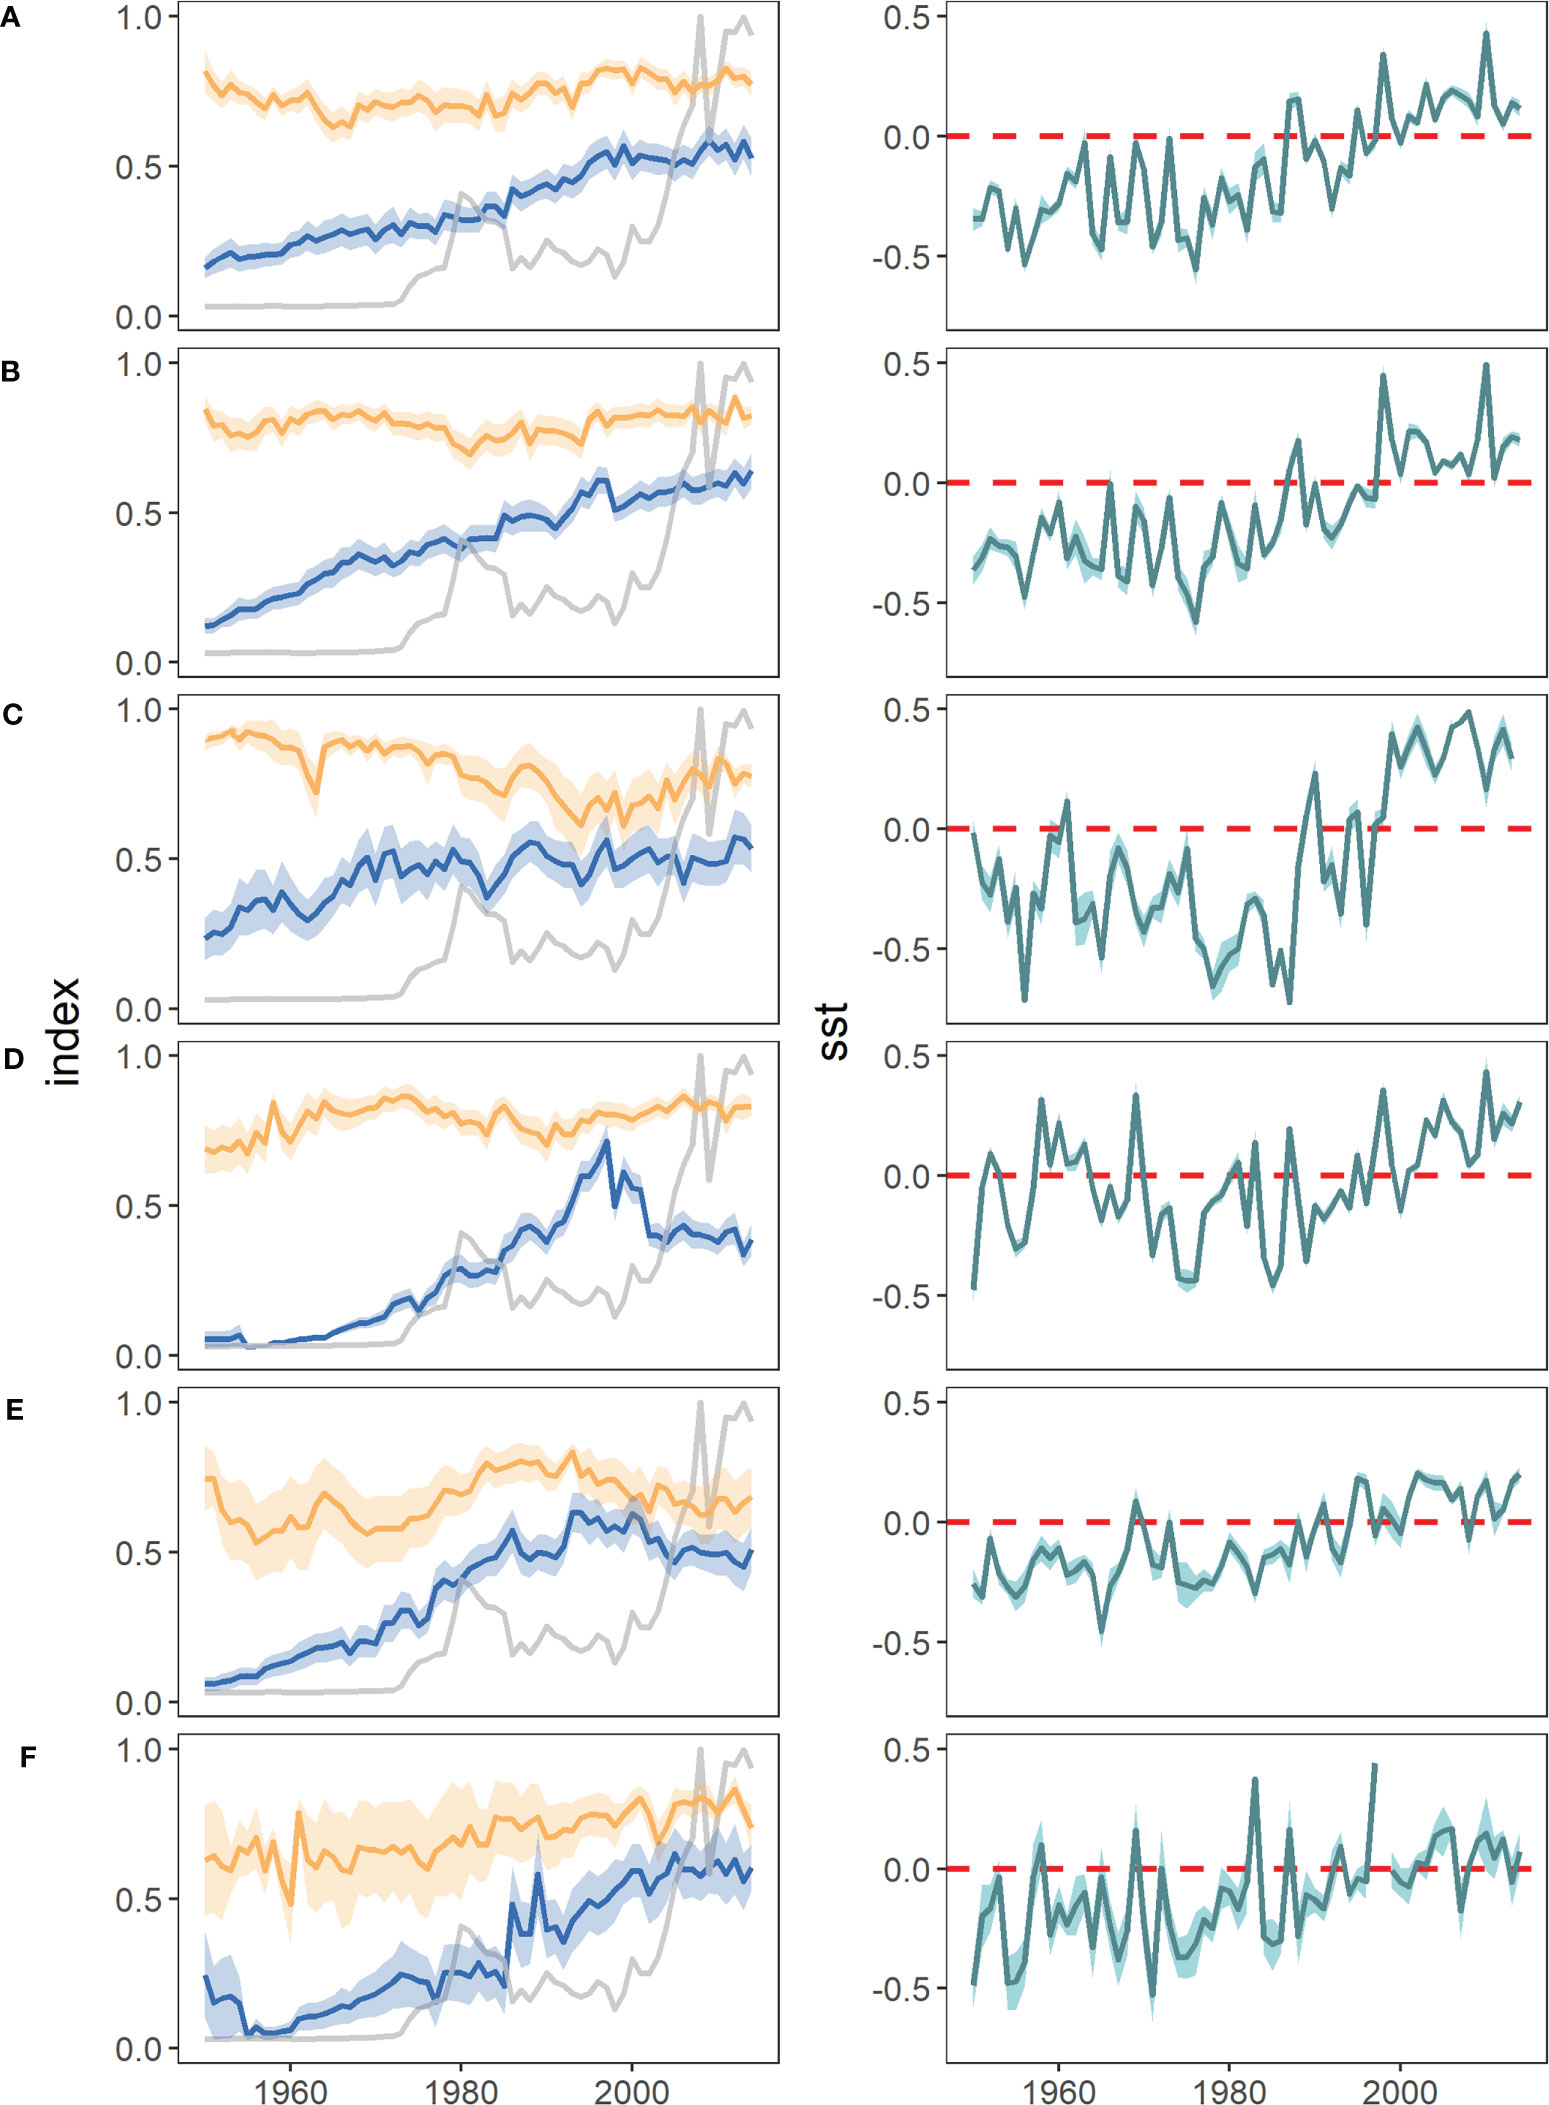
Figure 3 Time series for the predictor variables over the study period by region for (A) Africa, (B) Asia, (C) Europe, (D) North America, (E) Oceania, and (F) South America. Envelopes around the lines are ±1 standard errors for mean technical efficiency (orange lines), the scaled composite nominal price index by country (blue lines), and the mean SST (green lines). The solid grey lines correspond to the scaled nominal fuel price index. Nominal fuel price index scaled, (solid grey line). Mean SST (green line with standard errors).
The North American/Europe region has benefitted from SST and technical efficiency leading to increase fisheries, particularly since the 1990s when fuel costs were low and prices on the increase coupled with recent increases in the SST (see the general regional trends provided in Figures 3C, D). The artisanal fleet in these regions also benefits from the low cost to harvest shellfish (crustaceans) (Figure 1D). However, gradual SST warming is threatening shellfish abundance specifically in the Caribbean (Defeo and Castilla, 2012). Furthermore, with increasing climate variability and weather extremes in these regions (e.g., the Caribbean), changes to the growth and productivity of the fisheries are also anticipated according to their physiological thermal tolerances (Smale et al., 2019). These more extreme conditions expected in the future could result in distributional changes of species that would subsequently affect the allocation of catches between country EEZs (Pinsky et al., 2018). Furthermore, climate induced change may lead to changes in supply/demand and subsequently market prices (e.g., a negative environmental impact in stock biomass is likely to decrease supply and an increase fish market prices), decreasing quantity demand. Future studies incorporating other types of climate impacts not explored here, such as weather extreme events (e.g., heatwaves, extreme winds, storm surges), may offer further insights as these events may increase the risk on at-sea operations and potentially have a negative effect on the technical efficiency of the fishing fleets (Ojea et al., 2023). Although with improved education (e.g on-board safety training), communication (e.g. VHF, mobile phones), navigation (e.g. GPS, compasses, depth-finders) and physical changes to the fleet units, one could expect increases in technical efficiency overtime. The differences between the weather events affecting capacity utilization and also the technical efficiency could potentially be estimated via two different DEA models, and thus the ratio of the two models results in an unbiased estimate of capacity utilization (see Kirkley and Squires, 2003).
4.2 Economic effects influencing efficiency
One of the biggest causes of excess capacities is government grants or subsidies with many of the Asian fleets largely subsidized for fuel. For example, the government has subsidized the Chinese fleet, which has over one million vessels, for up to 6.5 billion US dollars in 2013, of which ~94% was in the form of fuel (Mallory, 2016). However, 4 million tonnes of China domestic catch are low-value fish for non-human consumption that are used primarily as fish feed for the expanding aquaculture industry (Greenpeace, 2017). Our analysis shows a positive coefficient for fuel price and a negative coefficient for marine fish price, which is non-intuitive in terms of the effects on technical efficiency. Although an increase in fuel prices would be expected to induce fishers to adapt their fishing strategies and change their technologies. While a decrease in fuel price may attract more entrants to the fishery and eventually lead to excess capacity and low efficiency. Since fishing technologies and skills develop over time, fishing can become more productive and efficient even with falling stock biomasses, the negative effect of the fuel price increases is compensated by the positive effect of technological creep, with a potentially positive net effect on catch per unit effort (Tidd et al., 2016). The negative global effect for marine fish catch (a broad classification aggregating many species) may be due to supply and demand, i.e., excessive supply can lead to a negative effect on the price of fish. Usually, a higher price will lead to increased production. However, an elastic price effect of demand may also occur, whereby a moderate increase in technical efficiency will result in a decrease in price (Chu and Kompas, 2014). High prices due to demand caused by falling biomasses, leading to the rarity of resources, can lead in turn to an increase in fishing effort and a large excess of capacity, especially in regions where regulation is lacking e.g., in most artisanal fisheries. We especially note the price increase effect for the iconic diadromous fish group (e.g., salmonids and eels) which are globally highly valued, and some are threatened by overfishing, habitat loss, pollution, and migration (Wilson and Veneranta, 2019).
There has been a general decline or constant stability in global finfish catches since the 1990s and a rise in invertebrate catches, i.e., shellfish (FAO, 2020). New markets for invertebrates have increased in response to the decline in finfish catches and high prices (Anderson et al., 2011). Furthermore, in 2000-2004, the largest of all the catches of invertebrates were found in the Yellow Sea and the East China Sea off the eastern coast of China (Anderson et al., 2011). Although all elasticities calculated here were relatively small percentage changes, the scale of the effects can be extremely large. For example, China landed ~9 million tonnes of seafood within its EEZ in 2010 (Pauly and Le Manach, 2015). Therefore, the overall impact of a positive or negative 1% shock on this scale in China could have dramatic effects on their seafood production, and thus could translate into not only a food security issue, but also in terms of economic security for maintaining jobs livelihoods and wellbeing.
4.3 Conclusions
This paper presents an initial examination of the global artisanal fleet to improve our understanding of the factors that have influenced fishing efficiency concerning resource users, market dynamics and climate change. Teasing apart these cause and effects parameters is a major challenge for scientists and any management policy. To address the problem of excess capacity in global fishing fleets we would need to understand the effects of these economic and environmental factors, especially for many of the world’s poorest countries that rely of fisheries for nutrition and food security.
A major challenge is how different artisanal fishing systems respond to dynamic global environmental and societal change, including economic cycles affecting fishing costs and demand, and ongoing global warming. While studies mostly focus on catches and profits, this analysis goes one step further to understand how the technical efficiency of the fisheries can be compromised or not by these global changes. Our results have demonstrated that economic (prices, costs) and environmental (SST anomalies) significantly explain past changes in global artisanal fleets technical efficiency. These effects vary regionally. Where some regions increase efficiency with higher prices of different species groups and with the SST anomalies, these same factors can decrease technical efficiency in other regions. The global artisanal fleet was estimated to account for over 34 million tonnes of global marine catches in 2012 (World Bank, 2012), although more recent estimates put this figure at 37 million tonnes (Infofish report accessed April 29, 2022). Therefore, any significant percentage marginal change in the exogenous dynamics could potentially have a pronounced effect on the efficiency of these fishers (see Tidd et al., 2022).
To extend these analyses, studies can further explore the mechanisms underlying such trends in order to help the artisanal fishing sector to face the forthcoming changes (and crises) of the global economy and climate extreme events in the sea.
Data availability statement
Publicly available datasets were analyzed in this study. This data can be found here: https://figshare.com/articles/dataset/vessel_effort_csv/12905930 and catch data are found here: https://doi.org/10.25959/5c522cadbea37.
Author contributions
Conception and design: AT, JG, RW, and EO. Analysis and interpretation of data: AT, JG, RW, SC, and EO. Acquisition of data: AT and RW. Modelling: AT and JG. Writing, reviewing and/or revision of the paper: AT, JG, RW, SC, and EO. All authors contributed to the article and approved the submitted version.
Funding
The research conducted here has received funding from the European Research Council under the European Union’s Horizon 2020 research and innovation program, ERC Starting Grant project CLOCK (Grant Agreement n.679812). Funding for open access charge: Universidade de Vigo/CISUG. JG was supported by the Japan Society for the Promotion of Science (KAKENHI 19H04322) and the Japanese Science and Technology Agency (JST SICORP Grant Number JPMJSC20E5).
Conflict of interest
The authors declare that the research was conducted in the absence of any commercial or financial relationships that could be construed as a potential conflict of interest.
Publisher’s note
All claims expressed in this article are solely those of the authors and do not necessarily represent those of their affiliated organizations, or those of the publisher, the editors and the reviewers. Any product that may be evaluated in this article, or claim that may be made by its manufacturer, is not guaranteed or endorsed by the publisher.
References
Agnew D. J., Pearce J., Pramod G., Peatman T., Watson R., Beddington J. R., et al. (2009). Estimating the worldwide extent of illegal fishing. PLoS One 4, e4570. doi: 10.1371/journal.pone.0004570
Anderson J. L., Anderson C. M., Chu J., Meredith J., Asche F., Sylvia G., et al. (2015). The fishery performance indicators: A management tool for triple bottom line outcomes. PLoS One 10 (5), e0122809. doi: 10.1371/journal.pone.0122809
Anderson S. C., Mills Flemming J., Watson R., Lotze H. K. (2011). Rapid global expansion of invertebrate fisheries: Trends, drivers, and ecosystem effects. PLoS One 6 (3), e14735. doi: 10.1371/journal.pone.0014735
Barange M., Merino G., Blanchard J. L., Scholtens J., Harle J., Allison E. H., et al. (2014). Impacts of climate change on marine ecosystem production in societies dependent on fisheries. Nat. Climate Change 4 (3), 211–216. doi: 10.1038/nclimate2119
Bezner Kerr R., Hasegawa T., Lasco R., Bhatt I., Deryng D., Farrell A., et al. (2022). “Food, fibre, and other ecosystem products,” in Climate change 2022: Impacts, adaptation and vulnerability. contribution of working group II to the sixth assessment report of the intergovernmental panel on climate change. Eds. Pörtner H.-O., Roberts D. C., Tignor M., Poloczanska E. S., Mintenbeck K., Alegría A., Craig M., Langsdorf S., Löschke S., Möller V., Okem A., Rama B. (Cambridge, UK and New York, NY, USA: Cambridge University Press), 713–906. doi: 10.1017/9781009325844.007
Burnham K. P., Anderson D. R. (2002). Model selection and multi-model inference: A practical information-theoretical approach. 2nd edition (Berlin: Springer). doi: 10.1007/b97636
Calcagno V., de Mazancourt C. (2010). Glmulti: An R package for easy automated model selection with (Generalized) linear models. J. Stat. Softw. 34 (12), 1–29. doi: 10.18637/jss.v034.i12
Cavole L. M., Demko A. M., Diner R. E., Giddings A., Koester I., Pagniello C. M. L. S., et al. (2016). Biological impacts of the 2013–2015 warm-water anomaly in the northeast pacific: Winners, losers, and the future. Oceanography 29, 273–285. doi: 10.5670/oceanog.2016.32
Chu L., Kompas T. (2014). Targets and fisheries management in the Asia and pacific region. Asia Pacific Policy Stud. 1 (3), 615–622. doi: 10.1002/app5.56
Cooley S., Schoeman D., Bopp L., Boyd P., Donner S., Ghebrehiwet D. Y., et al. (2022). “Oceans and coastal ecosystems and their services,” in Climate Change 2022: Impacts, Adaptation and Vulnerability. Contribution of Working Group II to the Sixth Assessment Report of the Intergovernmental Panel on Climate Change Pörtner H.-O., Roberts D. C., Tignor M., Poloczanska E. S., Mintenbeck K., Alegría A., et al (Cambridge, UK and New York, NY, USA: Cambridge University Press), pp. 379–550. doi: 10.1017/9781009325844.005
Cooper W. W., Seiford L. M., Tone K. (2000). Data Envelopment Analysis: A Comprehensive Text with Models, Applications, References and DEA-Solver Software (USA: Kluwer Academic Publishers). doi: 10.1007/978-0-387-45283-8
Costello C., Gaines S. D., Lynham J. (2008). Can catch shares prevent fisheries collapse? Science 321, 1678–1681. doi: 10.1126/science.1159478
Costello C., Ovando D., Clavelle T., Strauss C. K., Hilborn R., Melnychuk M. C. (2016). Global fishery prospects under contrasting management regimes. Proc. Natl. Acad. Sci. 113 (18), 5125–5129. doi: 10.1073/pnas.1520420113
Cunningham S., Gréboval D. (2001). Managing fishing capacity: A review of policy and technical issues. FAO fisheries technical paper no. 409 (Rome: FAO), 60.
Defeo O., Castilla J. C. (2012). Governance and governability of coastal shellfisheries in Latin America and the Caribbean: multi–scale emerging models and effects of globalization and climate change. Curr. Opin. Environ. Sustainability 4, 344–350. doi: 10.1016/j.cosust.2012.05.002
Ducharme-Barth N. D., Grüss A., Vincent M. T., Kiyofuji H., Aoki Y., Pilling G., et al. (2022). Impacts of fisheries-dependent spatial sampling patterns on catch-per-unit-effort standardisation: A simulation study and fishery application. Fisheries Res. 246, 106169. doi: 10.1016/j.fishres.2021.106169
FAO. (2020). The State of World Fisheries and Aquaculture 2020. Sustainability in action. Rome. doi: 10.4060/ca9229en
Farrell M. J. (1957). The measurement of productive efficiency. J. R. Stat. Soc. 120, 253–281. doi: 10.2307/2343100
Flanders Marine Institute (2014) Union of the ESRI country shapefile and the exclusive economic zones (version 2). Available at: http://www.marineregions.org/.
Free C. M., Mangin T., Molinos J. G., Ojea E., Burden M., Costello C., et al. (2020). Realistic fisheries management reforms could mitigate the impacts of climate change in most countries. PLoS One 15 (3), e0224347. doi: 10.1371/journal.pone.0224347
Gaines S. D., Costello C., Owashi B., Mangin T., Bone J., Molinos J. G., et al. (2018). Improved fisheries management could offset many negative effects of climate change. Sci. Adv. 4, eaao1378. doi: 10.1126/sciadv.aao1378
Garcia S. M., Grainger R. J. (2005). Gloom and doom? the future of marine capture fisheries. Philos. Trans. R Soc. Lond. B Biol. Sci. 360, 21–4615713587. doi: 10.1098/rstb.2004.1580
Garcia S. M., Rosenberg A. A. (2010). Food security and marine capture fisheries: characteristics, trends, drivers and future perspectives. philosophical transactions of the royal society of London. Ser. B Biol. Sci. 365 (1554), 2869–2880. doi: 10.1098/rstb.2010.0171
Golden C., Allison E. H., Cheung W. W., Dey M. M., Halpern B. S., McCauley D. J., et al. (2016). Fall in fish catch threatens human health. Nature 534, 317–320. doi: 10.1038/534317a
Greenpeace China (2017). Status of china’s marine trash fish and its revelatory implications for the sustainable development of china’s marine fisheries industry (Beijing, China). Available at: https://www.greenpeace.org/eastasia/press/1163/almost-one-third-of-chinas-annual-fisheries-catch-is-trash-fish-greenpeace/.
Hanich Q., Wabnitz C. C., Ota Y., Amos M., Donato–Hunt C., Hunt A. (2018). Small– scale fisheries under climate change in the pacific islands region. Mar. Policy 88, 279–284. doi: 10.1016/j.marpol.2017.11.011
Herrero I., Pascoe S. (2003). Value versus volume in the catch of the Spanish south–Atlantic trawl fishery. J. Agric. Econ 54 (2), 325–341. doi: 10.1111/j.1477-9552.2003.tb00066.x
Hilborn R., Walters C. J. (1992). Quantitative fisheries stock assessment: choice, dynamics and uncertainty. Chapman Hall New York, 570. doi: 10.1007/978-1-4615-3598-0
Hoff A. (2007). Second stage DEA: Comparison of approaches for modelling the DEA score. Eur. J. Operational Res. 181, 425–435. doi: 10.1016/j.ejor.2006.05.019
Ilosvay X.É.E., Molinos J. G., Ojea E. (2022). Stronger adaptive response among small-scale fishers experiencing greater climate change hazard exposure. Commun. Earth Environ. 3 (1), 246. doi: 10.1038/s43247-022-00577-5
James P. A. S., Tidd A. N., Kaitu L. P. (2018). The impact of industrial tuna fishing on small–scale fishers and economies in the pacific. Mar. Policy 95, 189–198. doi: 10.1016/j.marpol.2018.03.021
Júnior J. G. C. O., Silva L. P., Malhado A. C., Batista V. S., Fabré N. N., Ladle R. J. (2016). Artisanal fisheries research: A need for globalization? PLoS One 11 (3), e0150689. doi: 10.1371/journal.pone.0150689
Kirkley J. E., Squires D. (2003). “Capacity and capacity utilization in fishing industries. measuring capacity in fisheries,” in FAO fisheries technical paper 445. Eds. Pascoe S., Gre´boval D. (Rome: FAO), 2003 35–56.
Kuchinke M., Tilbrook B., Lenton A. (2014). Seasonal variability of aragonite saturation state in the Western pacific. Mar. Chem. 161, 1–13. doi: 10.1016/j.marchem.2014.01.001
Lam V., Cheung W., Reygondeau G., Sumaila U. R. (2016). Projected change in global fisheries revenues under climate change. Sci. Rep. 6, 32607. doi: 10.1038/srep32607
Lancker K., Fricke L., Schmidt J. O. (2019). Assessing the contribution of artisanal fisheries to food security: A bio-economic modeling approach. Food Policy 87, 101740. doi: 10.1016/j.foodpol.2019.101740
Lehodey P., Bertignac M., Hampton J., Lewis A., Picaut J. (1997). El Nino southern oscillation and tuna in the western pacific. Nature 389, 715–718. doi: 10.1038/39575
Leitão F., Roa-Ureta R. H., Cánovas F. (2020). Editorial: Vulnerability of fisheries to climate change. Front. Mar. Sci. 7, 613793. doi: 10.3389/fmars.2020.613793
Mallory T. G. (2016). Fisheries subsidies in China: Quantitative and qualitative assessment of policy coherence and effectiveness. Mar. Policy 68, 74–82. doi: 10.1016/j.marpol.2016.01.028
Mardani A., Streimikiene D., Balezentis T., Saman M. Z. M., Nor K. M., Khoshnava S. M. (2018). Data envelopment analysis in energy and environmental economics: An overview of the state–of–the–Art and recent development trends. Energies 2018, 11. doi: 10.3390/en11082002
McCubbin S., Pearce T., Ford J., Smit B. (2017). Social–ecological change and implications for food security in Funafuti, Tuvalu. Ecol. Soc. 22 (1), 53. doi: 10.5751/es-09129-220153
McDonald J. (2009). Using least squares and tobit in second stage DEA efficiency analyses. Eur. J. Operational Res. 197, 792–798. doi: 10.1016/j.ejor.2008.07.039
Neumann K., Neumann K., Verburg P. H., Stehfest E., Müller C. (2010). The yield gap of global grain production: A spatial analysis. Agric. Syst. 103, 316–326. doi: 10.1016/j.tree.2012.10.012
Ojea E., Ilosvay X. E., Salgueiro-Otero D., Rubio I., Tidd A. N., Caballero S. V., et al. (2023). Research priorities for seafood-dependent livelihoods under ocean climate change extreme events. Curr. Opin. Environ. Sustainability 61, 101264. doi: 10.1016/j.cosust.2023.101264
Oremus K. L., Bone J., Costello C., García Molinos J., Lee A., Mangin T., et al. (2020). Governance challenges for tropical nations losing fish species due to climate change. Nat. Sustainability 1, 1–4. doi: 10.1038/s41893-020-0476-y
Palanisamy H., Becker M., Meyssignac B., Henry O., Cazenave A. (2012). Regional sea level change and variability in the Caribbean Sea since 1950. J. Geodetic Sci. 2, 125–123. doi: 10.2478/v10156-011-0029-4
Pauly D., Le Manach F. (2015). Tentative adjustments of china’s marine fisheries catches, (1950–2010). fisheries centre working paper #2015– 28 (Vancouver: Fisheries Centre, University of British Columbia), 16.
Pinsky M. L., Reygondeau G., Caddell R., Palacios-Abrantes J., Spijkers J., Cheung W. W. L. (2018). Preparing ocean governance for species on the move. Science 360 (6394), 1189–1191. doi: 10.1126/science.aat2360
Rayner N. A., Parker D. E., Horton E. B., Folland C. K., Alexander L. V., Rowell D. P., et al. (2003). Global analyses of sea surface temperature, sea ice, and night marine air temperature since the late nineteenth century. J. Geo. Res. 108, 4407. doi: 10.1029/2002jd002670
Rousseau Y., Watson R. A., Blanchard J. L., Fulton E. A. (2019). Evolution of global marine fishing fleets and the response of fished resources. Proc. Natl. Acad. Sci. 116, 12238–12243. doi: 10.1073/pnas.1820344116
Rubio I., Ganzedo U., Hobday A. J., Ojea E. (2020). Southward re-distribution of tropical tuna fisheries activity can be explained by technological and management change. Fish Fisheries 21 (3), 511–521. doi: 10.1111/faf.12443
Sande H. A., Persson A., Mehl A., Devine J. A., dos Santos Schmidt T. C., Karlsen Ø., et al. (2019). Temperature and age effects on latitudinal growth dynamics of the commercially valuable gadoid northeast Arctic saithe (Pollachius virens). Fisheries Res. 213, 94–104. doi: 10.1016/j.fishres.2019.01.005
Schrobback P., Pascoe S., Coglan L. (2014). Shape up or ship out: Can we enhance productivity in coastal aquaculture to compete with other uses? PloS One 9 (12), e115912. doi: 10.1371/journal.pone.0115912
Simar L., Wilson P. W. (1998). Sensitivity analysis of efficiency scores: How to bootstrap in nonparametric frontier models. Manage. Sci. 44, 49–61. doi: 10.1287/mnsc.44.1.49
Simar L., Wilson P. W. (2007). Estimation and inference in two–sage semi–parametric models of production processes. J. Econom. 136, 31–64. doi: 10.1016/j.jeconom.2005.07.009
Skerritt D. J., Arthur R., Ebrahim N., Le Brenne V., Le Manach F., Schuhbauer A., et al. (2020). A 20-year retrospective on the provision of fisheries subsidies in the European union. ICES J. Mar. Sci. J. Conseil 77, 2741–2752. doi: 10.1093/icesjms/fsaa142
Smale D. A., Wernberg T., Oliver E. C., Thomsen M., Harvey B. P., Straub S. C., et al. (2019). Marine heatwaves threaten global biodiversity and the provision of ecosystem services. Nat. Climate Change 9 (4), 306–312. doi: 10.1038/s41558-019-0412-1
Squires D., Vestergaard N. (2013). Technical change and the commons. Rev. Econ. Stat. 95, 1769–1787. doi: 10.1162/REST_a_00346
Sumaila U. R., Ebrahim N., Schuhbauer A., Skerritt D., Li Y., Kim H. S., et al. (2019). Updated estimates and analysis of global fisheries subsidies. Mar. Policy 109, 104706. doi: 10.1016/j.marpol.2019.103695
Sumaila U. R., Marsden A. D., Watson R., Pauly D. (2007). A global ex–vessel fish price database: construction and applications. J. Bioeconomics 9 (1), 39–51. doi: 10.1007/s10818-007-9015-4
Swartz W., Sumaila R., Watson R. (2012). Global ex–vessel fish price database revisited: A new approach for estimating ‘missing’ prices. Environ. Resour. Econ. 56, 467–480. doi: 10.1007/s10640-012-9611-1
The Climate Data Guide SSTa data: HadiSSTa v1.1. Available at: https://climatedataguide.ucar.edu/climate-data/SSTa-data-hadiSSTa-v11.
Thiault L., Mora C., Cinner J. E., Cheung W. W. L., Graham N. A. J., Januchowski-hartley F. A., et al. (2019). Escaping the perfect storm of simultaneous climate change impacts on agriculture and marine fisheries. Science 5 (11), eaaw9976. doi: 10.1126/sciadv.aaw9976
Tidd A. N., Reid C., Pilling G. M., Harley S. J. (2016). Estimating productivity, technical and efficiency changes in the Western pacific purse–seine fleets. ICES J. Mar. Sci. J. Conseil 73, 1226–1234. doi: 10.1093/icesjms/fsv262
Tidd A. N., Rousseau Y., Ojea E., Watson R., Blanchard J. L. (2022). Food security challenged by declining efficiencies of artisanal fishing fleets: A global country-level analysis. Global Food Secur. 32, 100598. doi: 10.1016/j.gfs.2021.100598
Tingley D., Pascoe S., Coglan L. (2005). Factors affecting technical efficiency in fisheries: Stochastic production frontier versus data envelopment analysis approaches. Fisheries Res. 73, 363–376. doi: 10.1016/j.fishres.2005.01.008
Tittensor D. P., Mora C., Jetz W., Lotze H. K., Ricard D., Berghe E. V., et al. (2010). Global patterns and predictors of marine biodiversity across taxa. Nature 466, 1098–1101. doi: 10.1038/nature09329
Tobin J. (1958). Estimation of relationships for limited dependent variables. Econometrica 26 (1), 24–36. doi: 10.2307/1907382
Watson R. (2016). Institute for marine and Antarctic studies (Australia: University of Tasmania). doi: 10.25959/5c522cadbea37
Watson R., Tidd A. N. (2018). Mapping nearly a century and a half of global marine fishing: 1869 to 2015. Mar. Policy 93, 171–177. doi: 10.1016/j.marpol.2018.04.023
Weatherdon L. V., Magnan A. K., Rogers A. D., Sumaila U. R., Cheung W. W. L. (2016). Observed and projected impacts of climate change on marine fisheries, aquaculture, coastal tourism, and human health: An update. Front. Mar. Sci. 3. doi: 10.3389/fmars.2016.00048
Wilson K., Veneranta L. (2019). Data-limited diadromous species – review of European status. ICES Coop. Res. Rep. 348, 283. doi: 10.17895/ices.pub.5253
World Bank (2012). Hidden harvest: the global contribution of capture fisheries. report no. 66469-GLB Vol. 92 (Washington, DC: International Bank for Reconstruction and Development). Available at: http://hdl.handle.net/10986/11873.
Keywords: fisheries, climate adaptation, global change, sustainable goals, temperature anomaly, technical efficiency
Citation: Tidd AN, Caballero V, Ojea E, Watson RA and García Molinos J (2023) Estimating global artisanal fishing fleet responses in an era of rapid climate and economic change. Front. Mar. Sci. 10:997014. doi: 10.3389/fmars.2023.997014
Received: 18 July 2022; Accepted: 27 February 2023;
Published: 17 March 2023.
Edited by:
Sebastian Villasante, University of Santiago de Compostela, SpainReviewed by:
Francisco Leitão, University of Algarve, PortugalAndrea Lopez Cazorla, Bahía Blanca (CONICET), Argentina
Jörn Oliver Schmidt, International Council for the Exploration of the Sea (ICES), Denmark
Copyright © 2023 Tidd, Caballero, Ojea, Watson and García Molinos. This is an open-access article distributed under the terms of the Creative Commons Attribution License (CC BY). The use, distribution or reproduction in other forums is permitted, provided the original author(s) and the copyright owner(s) are credited and that the original publication in this journal is cited, in accordance with accepted academic practice. No use, distribution or reproduction is permitted which does not comply with these terms.
*Correspondence: Alex N. Tidd, alex.tidd@uvigo.es