 Benjamin Paul Mooney
 Morten Hvitfeldt Iversen
 Maria Fredrika Norrbin
94% of researchers rate our articles as excellent or good
Learn more about the work of our research integrity team to safeguard the quality of each article we publish.
Find out more
ORIGINAL RESEARCH article
Front. Mar. Sci., 13 July 2023
Sec. Marine Biogeochemistry
Volume 10 - 2023 | https://doi.org/10.3389/fmars.2023.996275
This article is part of the Research TopicZooplankton and Nekton: Gatekeepers of the Biological Pump - Volume IIView all 5 articles
It is known that Microsetella norvegica feed on phytoplankton and provide an important link to higher trophic levels in Arctic fjords, such as fish sprat (Sprattus sprattus) and three-spined stickleback (Gasterosteus aculeatus). It has recently been suggested that M. norvegica may also contribute substantially to carbon flux attenuation during periods of high abundance. However, we still know very little about how seasonal variations in abundance and vertical distribution of M. norvegica impact the efficiency of the biological carbon pump in Arctic fjords. We investigated the role of Microsetella norvegica, a small harpacticoid copepod, for particulate organic carbon flux attenuation via aggregate feeding in a subarctic fjord. We quantified the vertical distribution and abundance of M. norvegica, phytoplankton, and marine snow simultaneously with a Digital Autonomous Video Plankton Recorder in Porsangerfjord, northern Norway, between August 2013 and November 2014. We estimated the highest abundance of M. norvegica as 4.86x10⁶ individuals m-2 in October. Our results suggest that M. norvegica preferred diatoms over both marine snow and the prymnesiophyte Phaeocystis pouchetii during euphotic bloom conditions. However, during oligotrophic conditions when phytoplankton were scarce, M. norvegica switched to marine snow as a food source. M. norvegica has the potential to explain 1.4% and 0.29% of the total carbon flux attenuation in October and November, respectively. These results suggest that small copepods feed on settling detritus when no alternative food is available. Detritus feeding by M. norvegica may have an ecological impact during the polar night, both via direct carbon flux attenuation, but also as secondary producers in periods with low primary production. Currently small copepods such as M. norvegica are not included in carbon budgets or large-scale modelling, but considering their potentially high abundance they may represent an important but overlooked pathway in both the carbon cycle and trophic level interactions.
Marine snow is prevalent within the world’s oceans (Shanks and Trent, 1979; Gorsky et al., 2003), and represents the main form by which material is transported vertically in the water column (Fowler and Knauer, 1986). These organic aggregates may be comprised of dead phytoplankton and zooplankton, faecal pellets, copepod moults and ctenophore tentacles, in addition to mucus discarded by gelatinous and mucus-producing marine organisms, such as larvaceans and pteropods (Green and Dagg, 1997). Marine snow exists as a spectrum of shapes, sizes and composition of organic aggregates, which can constitute a rich food source for pelagic heterotrophs (Kiørboe and Hansen, 1993; Kiørboe et al., 1998; Stemmann et al., 2004; Iversen et al., 2010). Despite rates of marine snow formation in the ocean often being high (Kiørboe et al., 1998), multiple biologically mediated processes degrade and remineralize the organic matter so only a small fraction reaches the deep ocean. This is part of the biological carbon pump (Steinberg et al., 2008; Passow and Carlson, 2012), the role of which in sequestering carbon in the deep ocean is one of Earth’s most valuable ecosystem services in terms of global climate change mitigation (Boyd et al., 2019).
Previous research on the biological pump has focused on bacterial remineralisation (where organic matter is broken down into its simplest inorganic forms, e.g. Iversen and Ploug, 2010; Iversen and Ploug, 2013) and zooplankton particle fragmentation (Iversen and Poulsen, 2007; Iversen et al., 2016; Pauli et al., 2021) as the two main processes for carbon re-entering the food web, concluding that both contribute equally to flux attenuation of organic carbon with increasing depth (Koski et al., 2020). Beyond this, marine snow may be an important food source for some zooplankton (Banse, 1990; Steinberg et al., 1997; Steinberg et al., 2008; Wilson and Steinberg, 2010), and zooplankton can act as an intermediate between organic carbon falling to the ocean’s depths, where it would otherwise be sequestered, and higher trophic levels where this energy is recovered (Poulsen and Iversen, 2008). Quantifying the processes that control the transport of organic carbon from the surface to the deep ocean is fundamental in understanding the global cycling of carbon and energy sources for deep-sea food webs.
M. norvegica is known to feed on small marine phytoplankton, and has been highlighted as prey for several species of fish in high latitude fjords, including sprat (Sprattus sprattus) and three-spined stickleback (Gasterosteus aculeatus) (Svensen et al., 2018). It is evident that M. norvegica is an important link between lower and higher trophic levels in the food web (Hopkins et al., 1984; Turner, 1984; Uye et al., 2002; Koski et al., 2005). While it has been suggested that this species of pelagic harpacticoid copepod is not able to feed on small dispersed particles (Koski et al., 2005), it has been observed to be affiliated with organic aggregates (Alldredge, 1972; Ohtsuka et al., 1993; Green and Dagg, 1997; Uye et al., 2002), where it seems to feed on the aggregated organic matter (Banse, 1990; Steinberg et al., 1997; Koski et al., 2005; Koski et al., 2007; Steinberg et al., 2008; Koski et al., 2020). Koski et al. (2007) suggested that small differences in M. norvegica abundance may have substantial consequences for rates of organic carbon degradation. While it is known that M. norvegica does not exhibit diel vertical migration (Maar et al., 2006), there is a gap in our understanding of their overall abundance and distribution in the water column. Based on the habitat choice theory, it is logical to predict that foraging zooplankton will distribute themselves at a depth where food intake is maximised, while predation risk is minimised (Lima, 2002; Fossheim and Primicerio, 2008). In this study we contribute important data on abundance and distribution of M. norvegica in a sub-arctic fjord at high spatial resolution by using non-invasive optical imaging. Furthermore we provide insight into their seasonal changes of depth preference and potential impact on carbon flux attenuation.
Here we study the fine-scale seasonal depth distributions of M. norvegica, phytoplankton, and marine snow in a high latitude ecosystem in order to quantify the impact of M. norvegica on flux attenuation. The main objectives were to (i) investigate seasonal abundance of M. norvegica throughout three locations in Porsangerfjord, (ii) investigate the seasonal association of M. norvegica with marine snow, and to (iii) estimate M. norvegica’s potential contribution to organic carbon flux attenuation throughout the year.
Our study sites were located in Porsangerfjord (70°52.5′N). With its 100 km length and 10-15 km width, Porsangerfjord is the fourth longest fjord of Norway and located in the northernmost part of the Norwegian mainland. Porsangerfjord extends in a north-easterly direction and opens into the southern Barents Sea. Topographically, Porsangerfjord is divided into three regions, the inner fjord (0-30 km), the middle fjord (30-70 km) and the outer fjord (70-100 km) (Stramska et al., 2016). Each region is separated by a sill and as a result, the three regions have different water flow and exchange with the Barents Sea (Stramska et al., 2016; Figure 1). The inner fjord has little water exchange with the middle and the outer fjord. The outer fjord is strongly influenced by inflow of Atlantic water from the Barents Sea which impacts the middle fjord to a lesser degree. The middle fjord has a strong wind driven circulation that causes an eastern outflow and a western inflow. We sampled at Østerbotn in the inner fjord, at Midtre Øst in the middle fjord, and at Porsangnes Øst in the outer fjord (Figure 1). The inner station is strongly impacted by meltwater, river input, and rain water runoff, with sub-zero temperatures during the winter, and occasionally freezes over during cold periods (Christiansen and Fevolden, 2000). Porsangerfjord is an important site for commercial fisheries, and has recently been under scrutiny after an invasion of the Red King crab, which has altered the food web dynamics in the region (Pedersen et al., 2018).
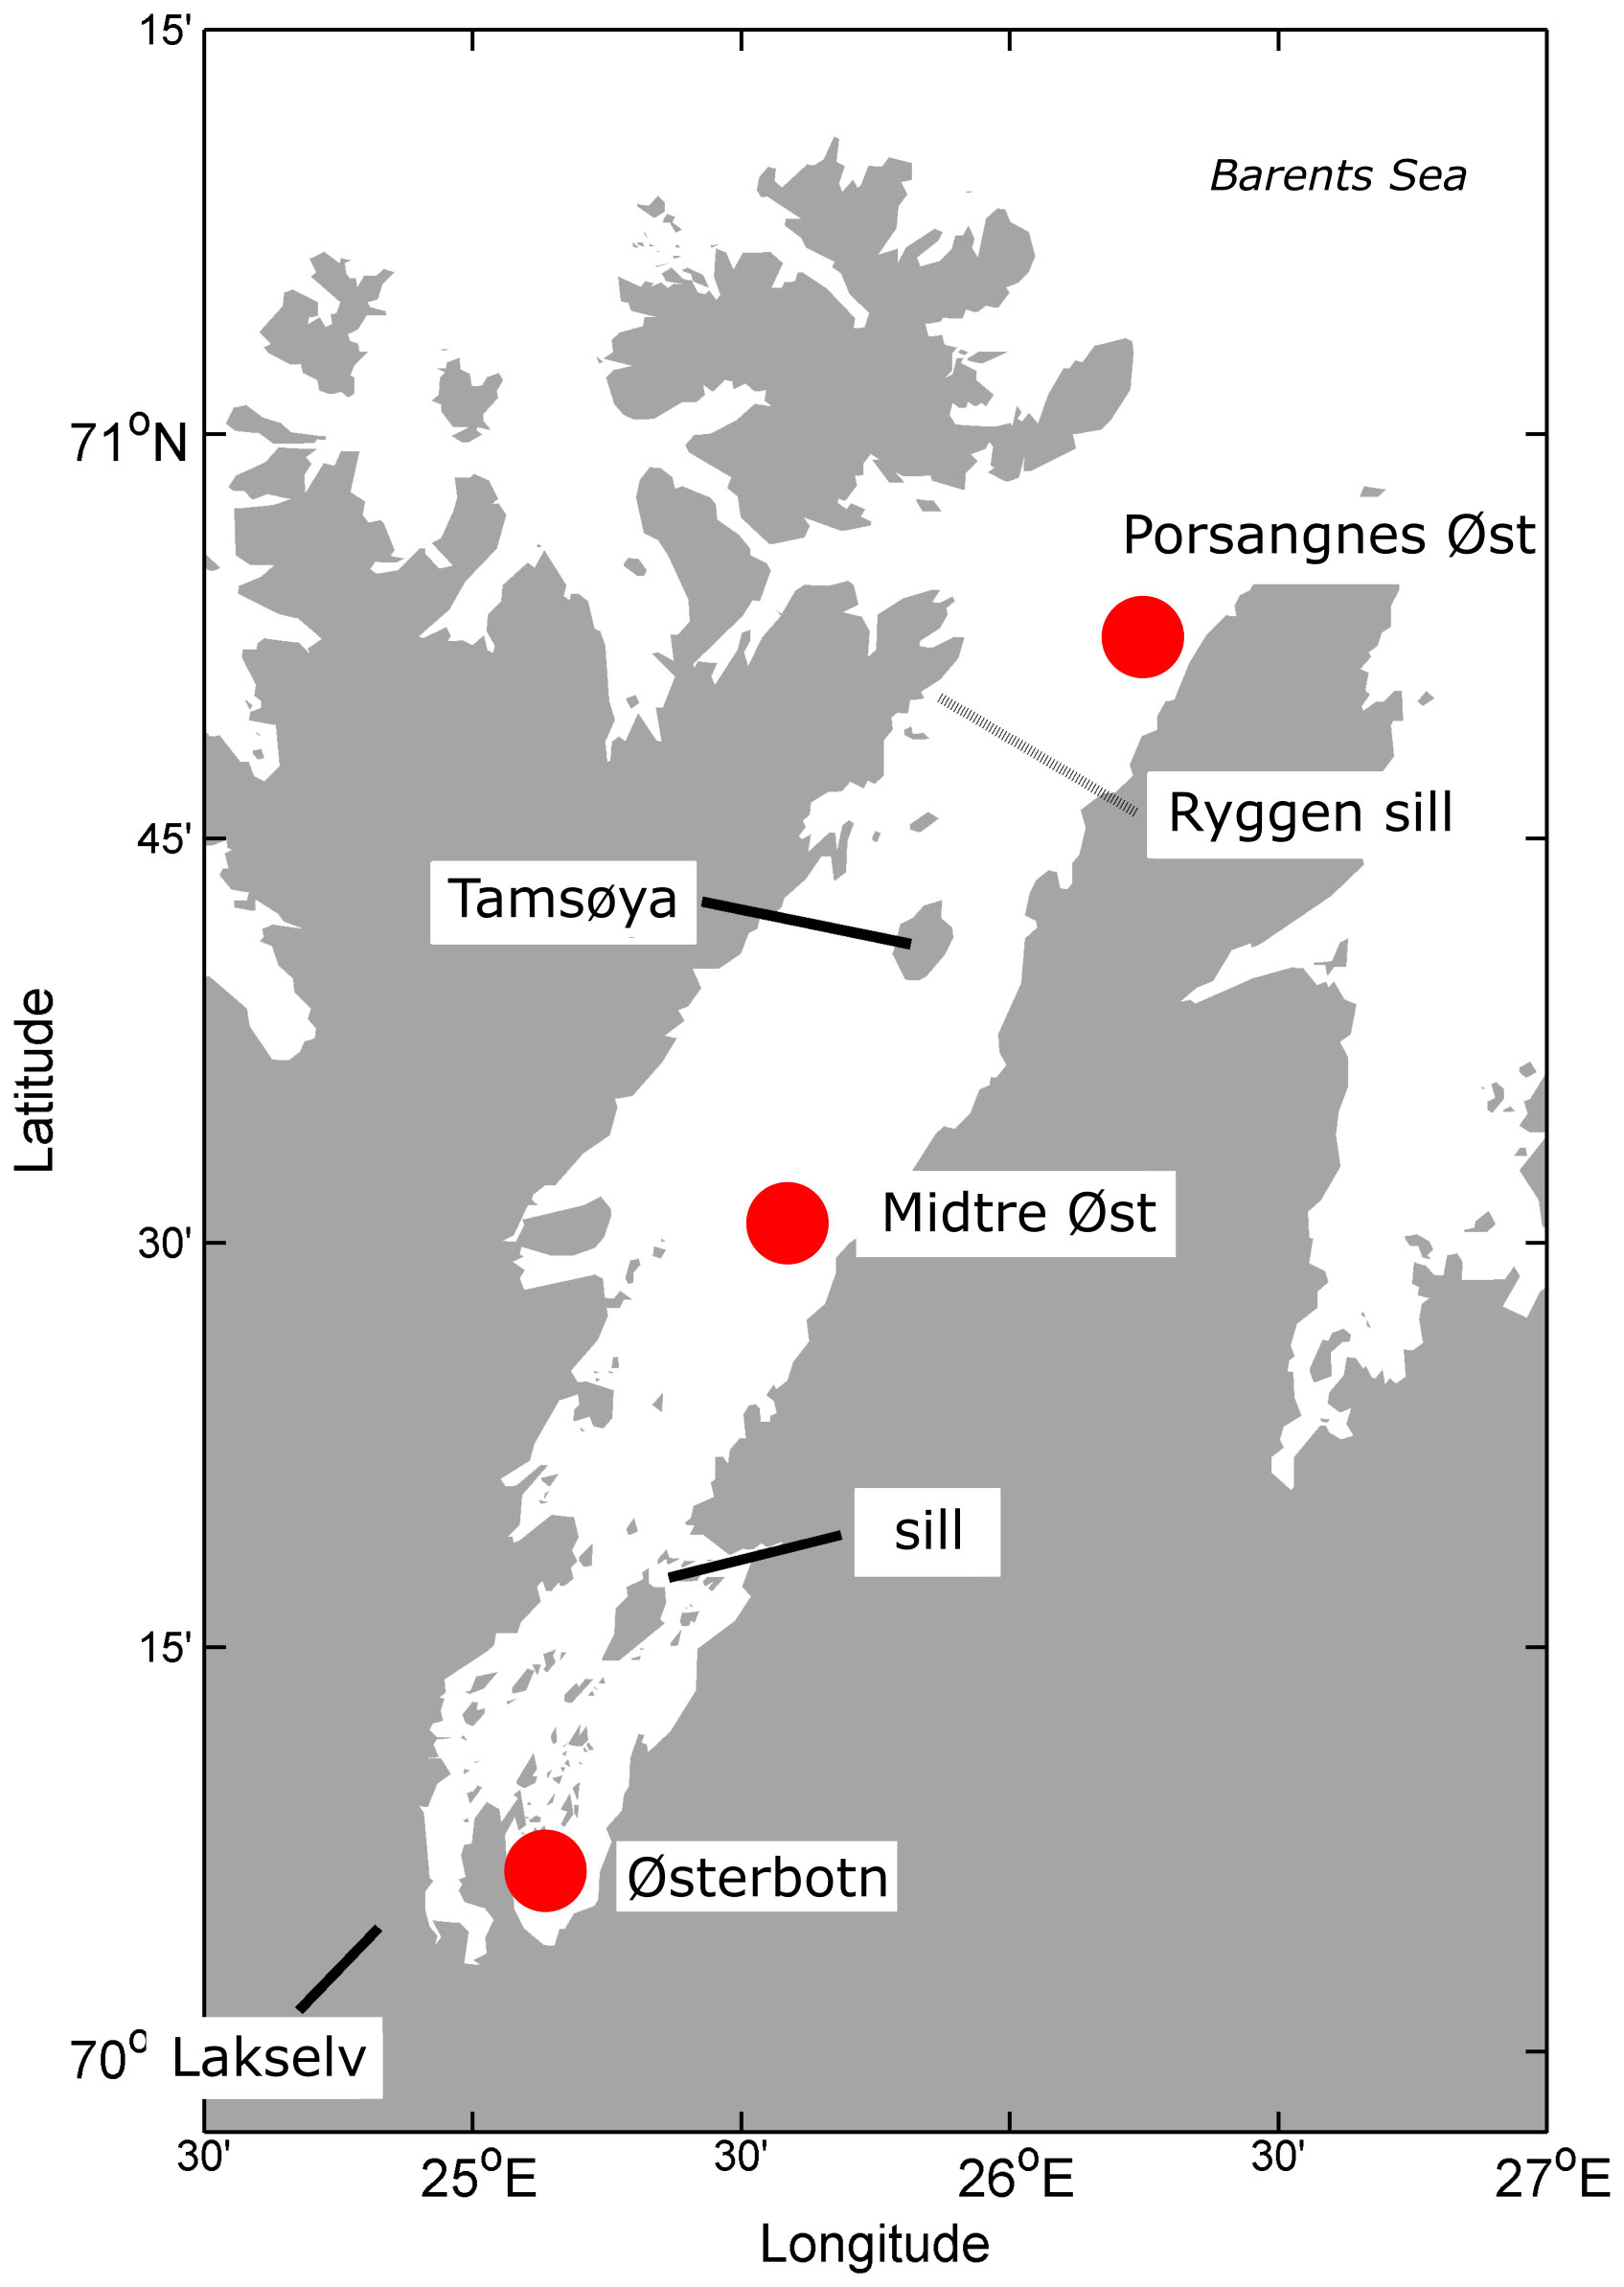
Figure 1 Map of Porsanger fjord. The red markers identify the sampling stations, Porsangnes Øst (outer fjord), Midtre Øst (middle fjord) and Østerbotn (inner fjord).
We collected vertical profiles of marine snow and the copepod Microsetella norvegica during four cruises with R/V Johan Ruud (UiT the Arctic University of Norway) between August 2013 and November 2014 (Table 1 and Figure 1). A digital autonomous video plankton recorder (VPR; Seascan Inc., USA) was used to collect 10-16 vertical profiles of zooplankton and aggregates. The VPR is a non-invasive in situ camera system (Figure 2) that captures on average 21 frames per second at a vertical speed of ~0.8 meter per second while being yo-yoed for ca one hour. The VPR was equipped with a 1.4 megapixel black and white camera that was illuminated by a Xenon strobe mounted opposite to the camera. The pixel-size was 24.1 µm per pixel and the water volume captured by each image frame was 26.3 ml in 2013, and 35.2 ml in 2014 (calibration was done in the lab using a grid with precisely spaced markings). The total imaged water volume per vertical profile was calculated by multiplying the number of images by the volume of each image (Table 1). The VPR was equipped with a 16 Hz CTD (SBE49, Seabird Electronics Inc., USA) and an 8 Hz fluorometer (ECO Puck, WET Labs Inc., USA). Fluorescence signals were converted to chlorophyll a concentration, Chl a (µg L-1) = 0.0125 (X – 55), where X = the registered value from the fluorometer.
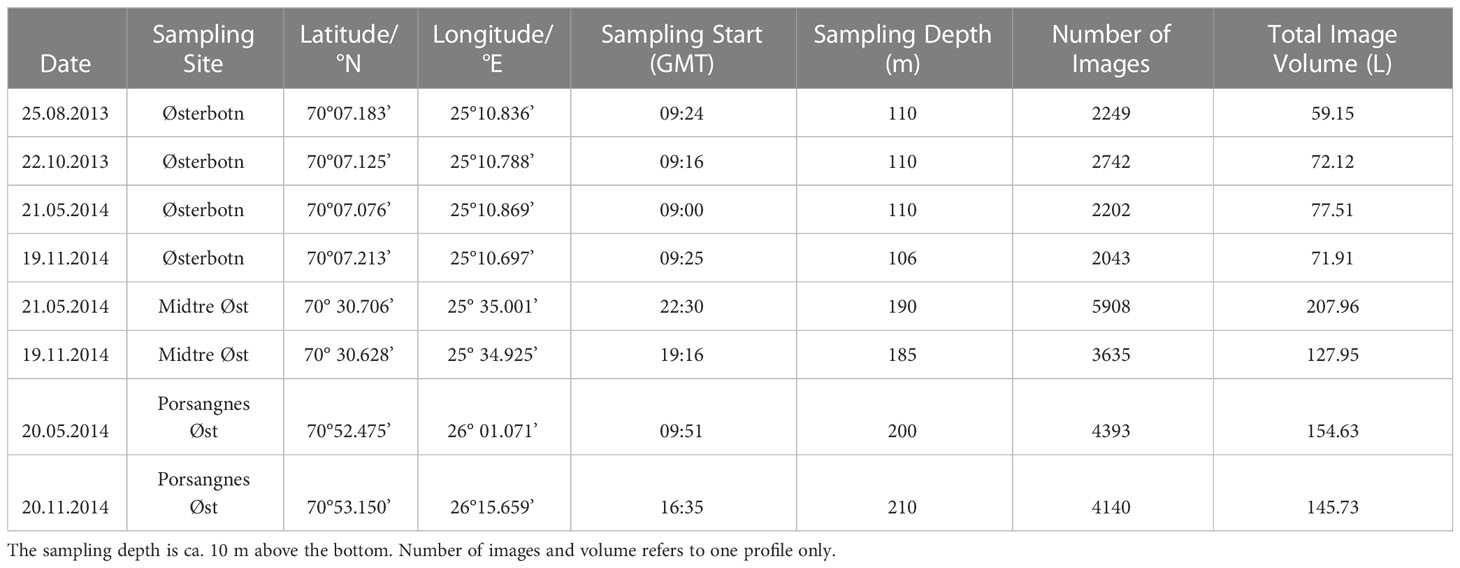
Table 1 Sampling details for the VPR tows.
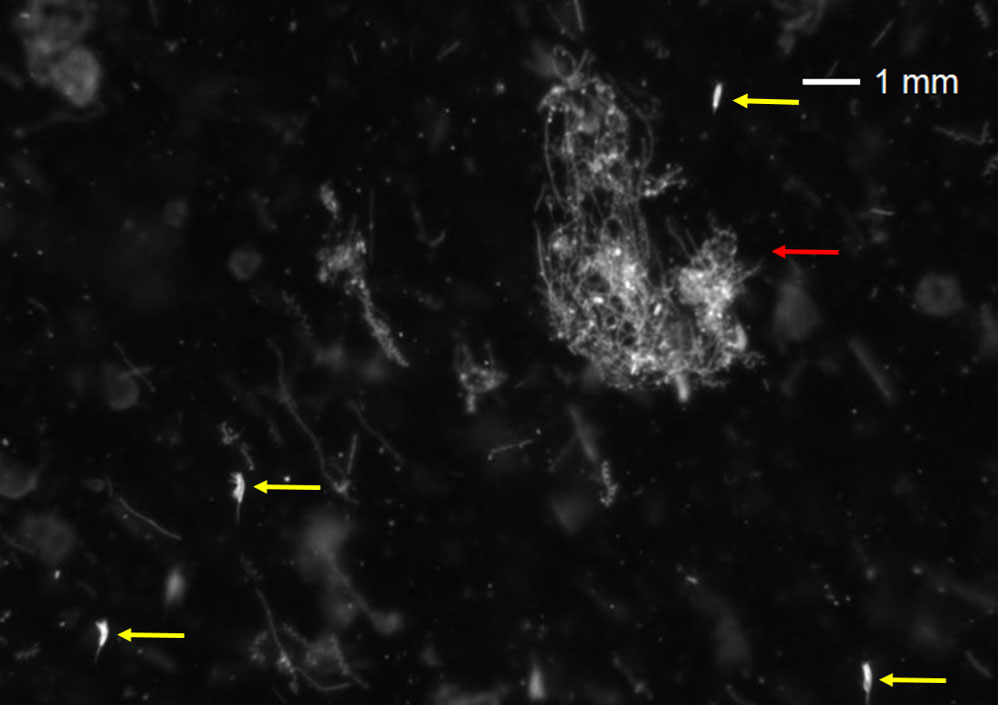
Figure 2 Part of a VPR image from Østerbotn, May 2014, showing diatom chains, a loose diatom aggregate (red) and several individuals of Microsetella norvegica (yellow).
Images and physical data were collected as compressed files on detachable flash drives, and later downloaded and decompressed using the Autodeck software (Seascan, Inc.), which detected and extracted in-focus regions of interest (ROIs) from each image based on contrast (Sobel) to the un-illuminated pelagic backdrop. Identification of ROIs was achieved using the Visual Plankton package (C.S. Davis, Woods Hole Oceanographic Institute, USA), where manually sorted images from each sampling period were used to train a season-specific classifier, of the COM-SVM (Co-occurrence Matrix with Support Vector Machine) type (Hu and Davis, 2005), which could automatically identify ROIs using feature extraction algorithms. Automatic classification was suitable for marine snow counts, which were manually validated, but since M. norvegica are small, auto classification for this species resulted in significantly underestimated abundances throughout VPR profiles. To achieve accurate abundance estimates for M. norvegica, data were used from a single vertical profile in each tow. Each frame of the entire second downward vertical profile was manually counted in each sampling period. Nonetheless, the automatic classification system was used to compare all vertical profiles. This allowed comparison between profiles to verify that the second downward vertical profile was representative of all vertical profiles. Of the objects visually observed in the full frame images, a large majority were M. norvegica, but other groups (such as Pseudocalanus, Oithona, Calanus and meroplankton) were also present. Additional zooplankton abundances are presented by Priou (2015) for the same deployments at the sample sites based on both VPR data and WP-2 counts.
The area of individual aggregates was obtained using the Visual Plankton Matlab package (C.S. Davis, Woods Hole Oceanographic Institute, USA) and the pixel-size from the VPR profile. The aggregate area was converted to equivalent spherical radius (ESR) (Eq. 1) and ESR was used to calculate the equivalent spherical volume (ESV) (Eq. 2).
Aggregates were binned into three logarithmically separated size-ranges; ESR 0 to 250 µm, 250 to 750 µm, and >750 µm. The sinking velocity (U; [m d-1]) of each radius range (a; [mm]) and POC content of aggregates were calculated based on their respective size categories using relationships for size-specific settling and POC content from van der Jagt et al. (2020); (Eq. 3 and 4).
To estimate the potential aggregate grazing by M. norvegica and have an indication of the impact from M. norvegica on flux attenuation, we used the behavioural trait values of M. norvegica from Koski et al. (2005). These behavioural traits were average residence time of M. norvegica on an aggregate (δ-1; [s]), average aggregate carbon-ingestion rate of M. norvegica (i; [µg C·individual-1·d-1]), average swimming speed of M. norvegica (ν; [cm s-1]), average duration of swimming events for M. norvegica (τ; [s]) and average duration of pause events of M. norvegica (ρ; [s]) (Koski et al., 2005), see Table 2. These trait values were used to calculate an equivalent diffusion coefficient (D; [cm2 s-1]) (Eq. 5, Koski et al., 2005), assuming a random isotropic motion pattern (Visser and Thygesen, 2003). As per Koski et al. (2005), we assume a constant residence time according to their estimates based on 2000 µm aggregates. van der Jagt et al. (2020) observed a difference in residence times for Calanus attached to aggregates of different sizes, so it is likely that the residence time of M. norvegica differs based on aggregate size. Furthermore, the harpacticoid copepod M. norvegica might be more adapted to mining aggregates and may have a much longer residence time attached to aggregates compared to the calanoid copepod Calanus.
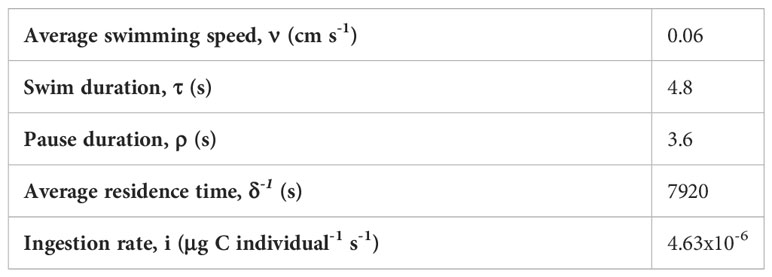
Table 2 Behavioural trait values of M. norvegica (Koski et al., 2005).
From the diffusion coefficient calculated for M. norvegica, the volume of water that an individual M. norvegica can search per unit time (β; [ml·d-1]) for a given aggregate radius (a; [cm]) was calculated (Eq. 6, Koski et al., 2005).
Using β and the in situ abundance of M. norvegica that we quantified with the VPR, we can then calculate the number of M. norvegica that a sinking aggregate with radius (a; [cm]) and a sinking rate (u(a); [cm·s-1]) will encounter (E) during its descent through a water column of depth h (Eq. 7, Koski et al., 2005).
Where C is the average ambient concentration of M. norvegica integrated per water volume (individuals·m-3) within the depth h, and Acop is the abundance of M. norvegica integrated over depth h. E was used to calculate the fractional degradation (k) caused by M. norvegica feeding on each sinking aggregate (Eq. 8, Koski et al., 2005).
k was calculated for each aggregate size-class, per 10 m depth bin. This gave an estimated fraction of aggregated POC that was degraded by M. norvegica for each aggregate size-class, per depth bin. This fraction was then subtracted from the POC content of each aggregate as it entered a new depth bin. This gave an estimate of the POC content of individual aggregates as they sank out of the previous depth bin. This was done for each depth bin throughout the water column, enabling us to estimate the POC export and POC loss due to M. norvegica of each aggregate size-class through the entire water column. Multiplying these results with the total abundance of aggregates in each respective size-class provided estimates of the total export and attenuation of POC, following grazing by M. norvegica.
The average number of observations in each VPR image for M. norvegica were low, so all data were integrated into 1 m depth bins by summing up individual frame counts. This also reduced the effects of any outlying data points. Using the total sampling volume for all images in each depth interval and the number of M. norvegica observed in each image, the number of individuals per m3 was calculated. Marine snow aggregate observations were also integrated and calculated as the number of aggregates per m3. Marine snow data had square root transformations applied for the purpose of visualisation, as the number of observations in May were drastically higher than in other sampling periods. The data used for calculations, however, was not transformed. VPR data were processed using Microsoft Excel, and analysed using RStudio 4.0.2 (RStudio Team, 2021).
To investigate differences in vertical distribution of M. norvegica during different sampling periods, the mean depth was calculated according to Frost and Bollens’ (1992) equation for weighted mean depth (WMD) (Eq. 9).
Where is the concentration of individual M. norvegica (individuals m-3), and is the water depth (m). The data was non-normally distributed and we used Spearman correlation coefficient (rs) (Eq 10) to assess the relationships between variables. Results were taken to be significant when rs was ≤ 0.05.
Where N is ranks, and Dx is the difference between the X and Y ranks for the xth case.
The innermost station, Østerbotn, stood out as a considerably colder site compared to both Midtre Øst in the middle fjord and Porsangnes Øst near the mouth of the fjord (Figure 3). Østerbotn was also more affected by freshwater input in the spring and summer months compared to the middle and outer fjord.
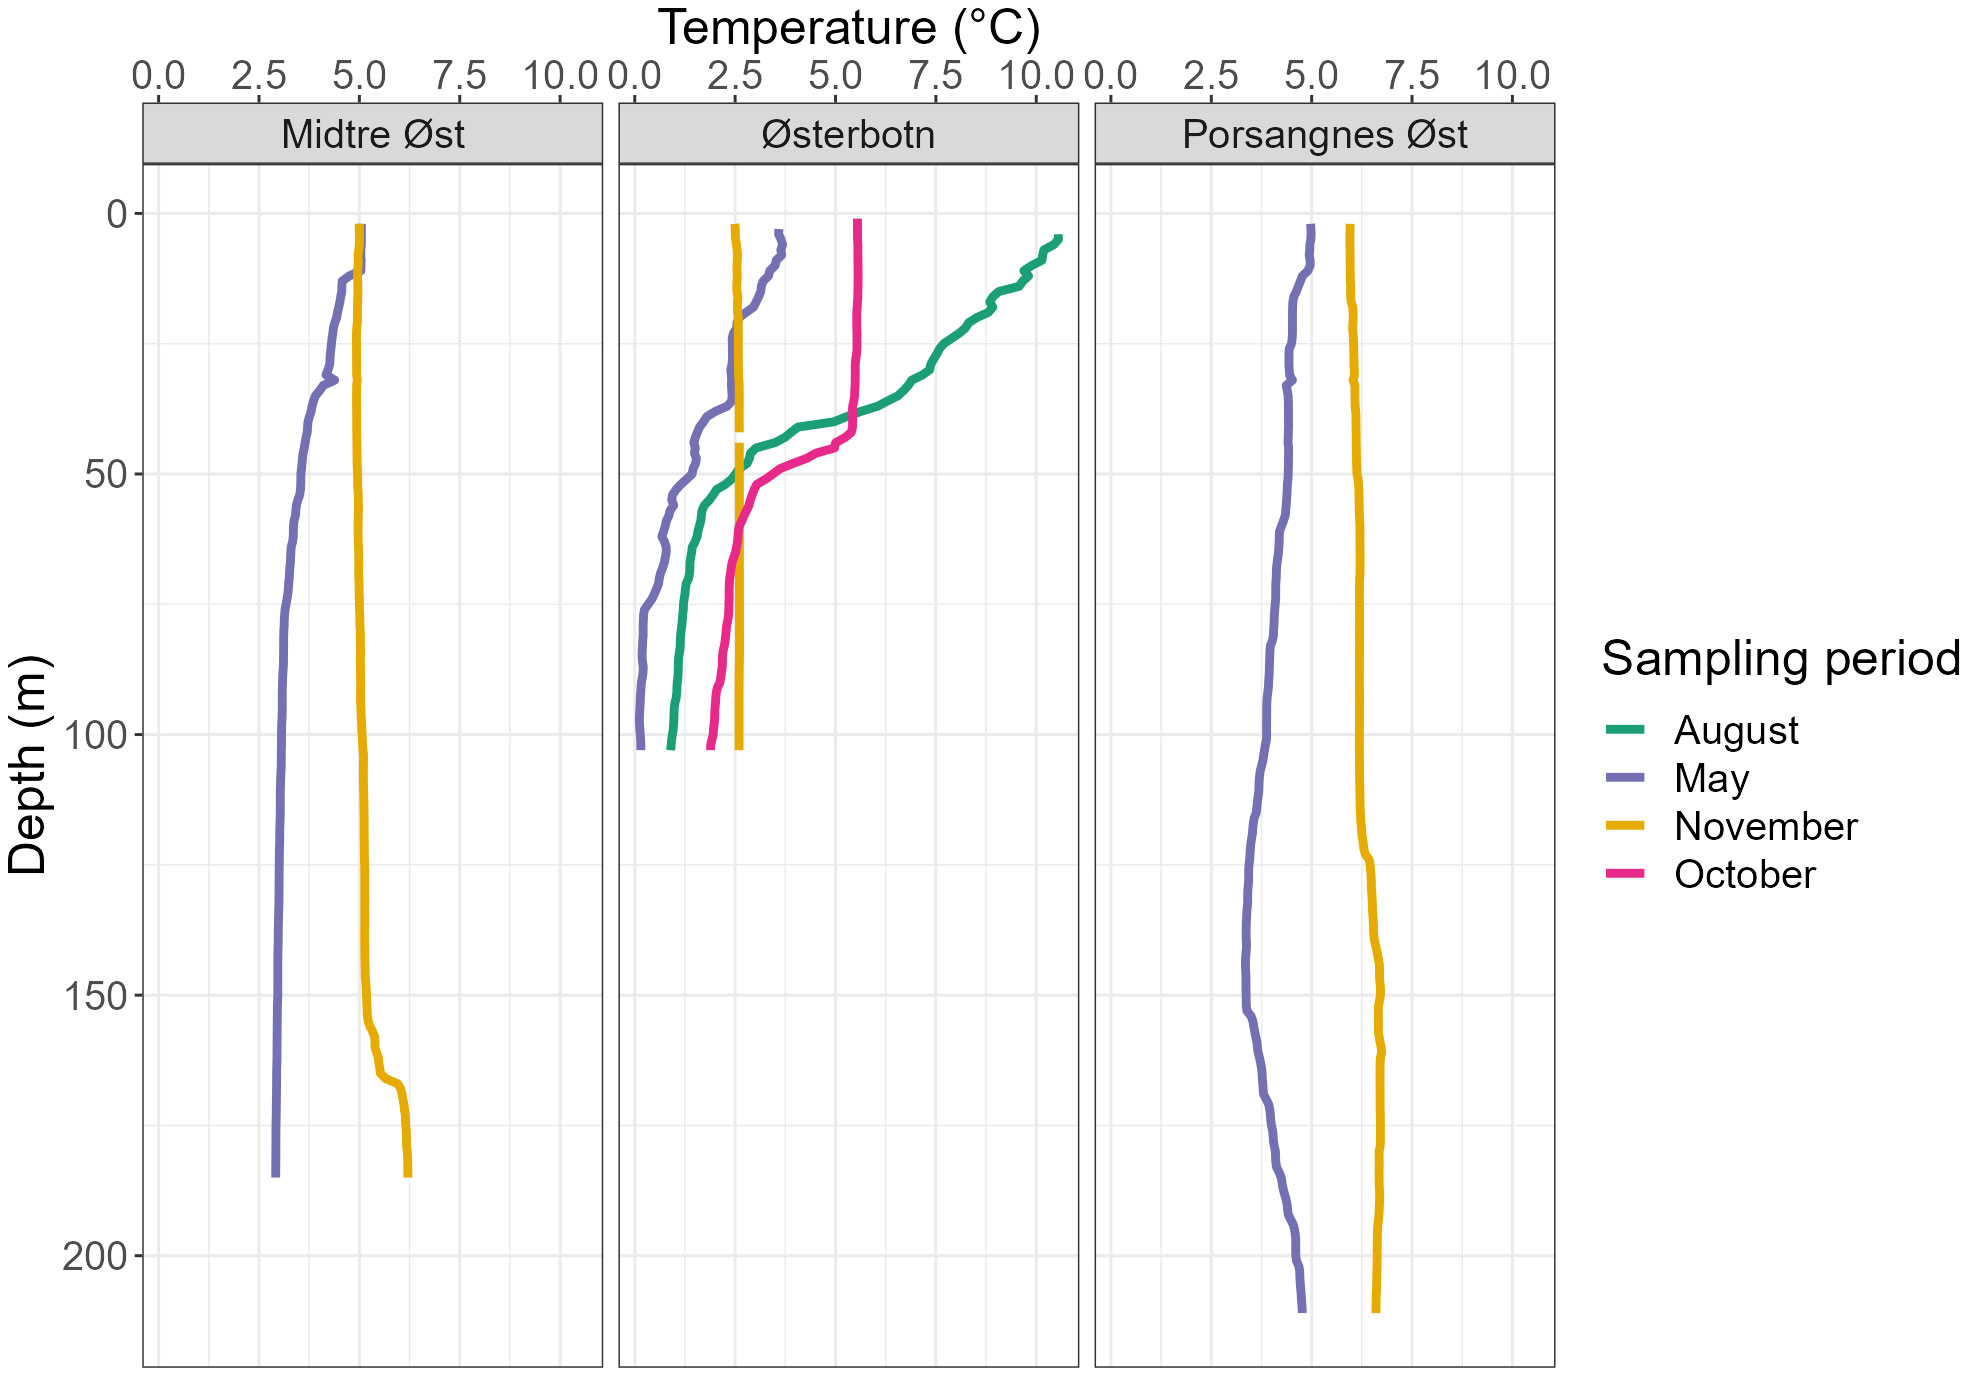
Figure 3 Temperature profiles during four sampling periods taken over three sampling stations, integrated into 1 m depth bins.
In May, temperatures were 2–2.5°C lower at Midtre Øst and Porsangnes Øst, with similar salinities to November (ca 34.0). Here, the water column was still quite well-mixed, with somewhat warmer temperatures above 10 m depth at both stations (5°C), and a slightly reduced salinity (34.1) at the outer station (Figures 3, 4). At Østerbotn, the temperature was barely above 0°C at 100 m (just above the bottom), increasing to ca 3.8°C near the surface. Salinity decreased from 33.8 in the deeper part of the water column to 33.6 at the surface. This was prior to the main freshwater input in June, and all three stations had weak pycnoclines. There were subsurface maxima of chlorophyll a concentrations at all stations, indicating a post-bloom phase (Figure 5). The chlorophyll a maxima were pronounced in Østerbotn (6.4 µg l-1 at 23 m) and Porsangnes Øst (5.6 µg L-1 at 20 m), while concentrations were 0.8-2.0 µg L-1 at Midtre Øst, with higher values found between 20–110 m (Figure 5).
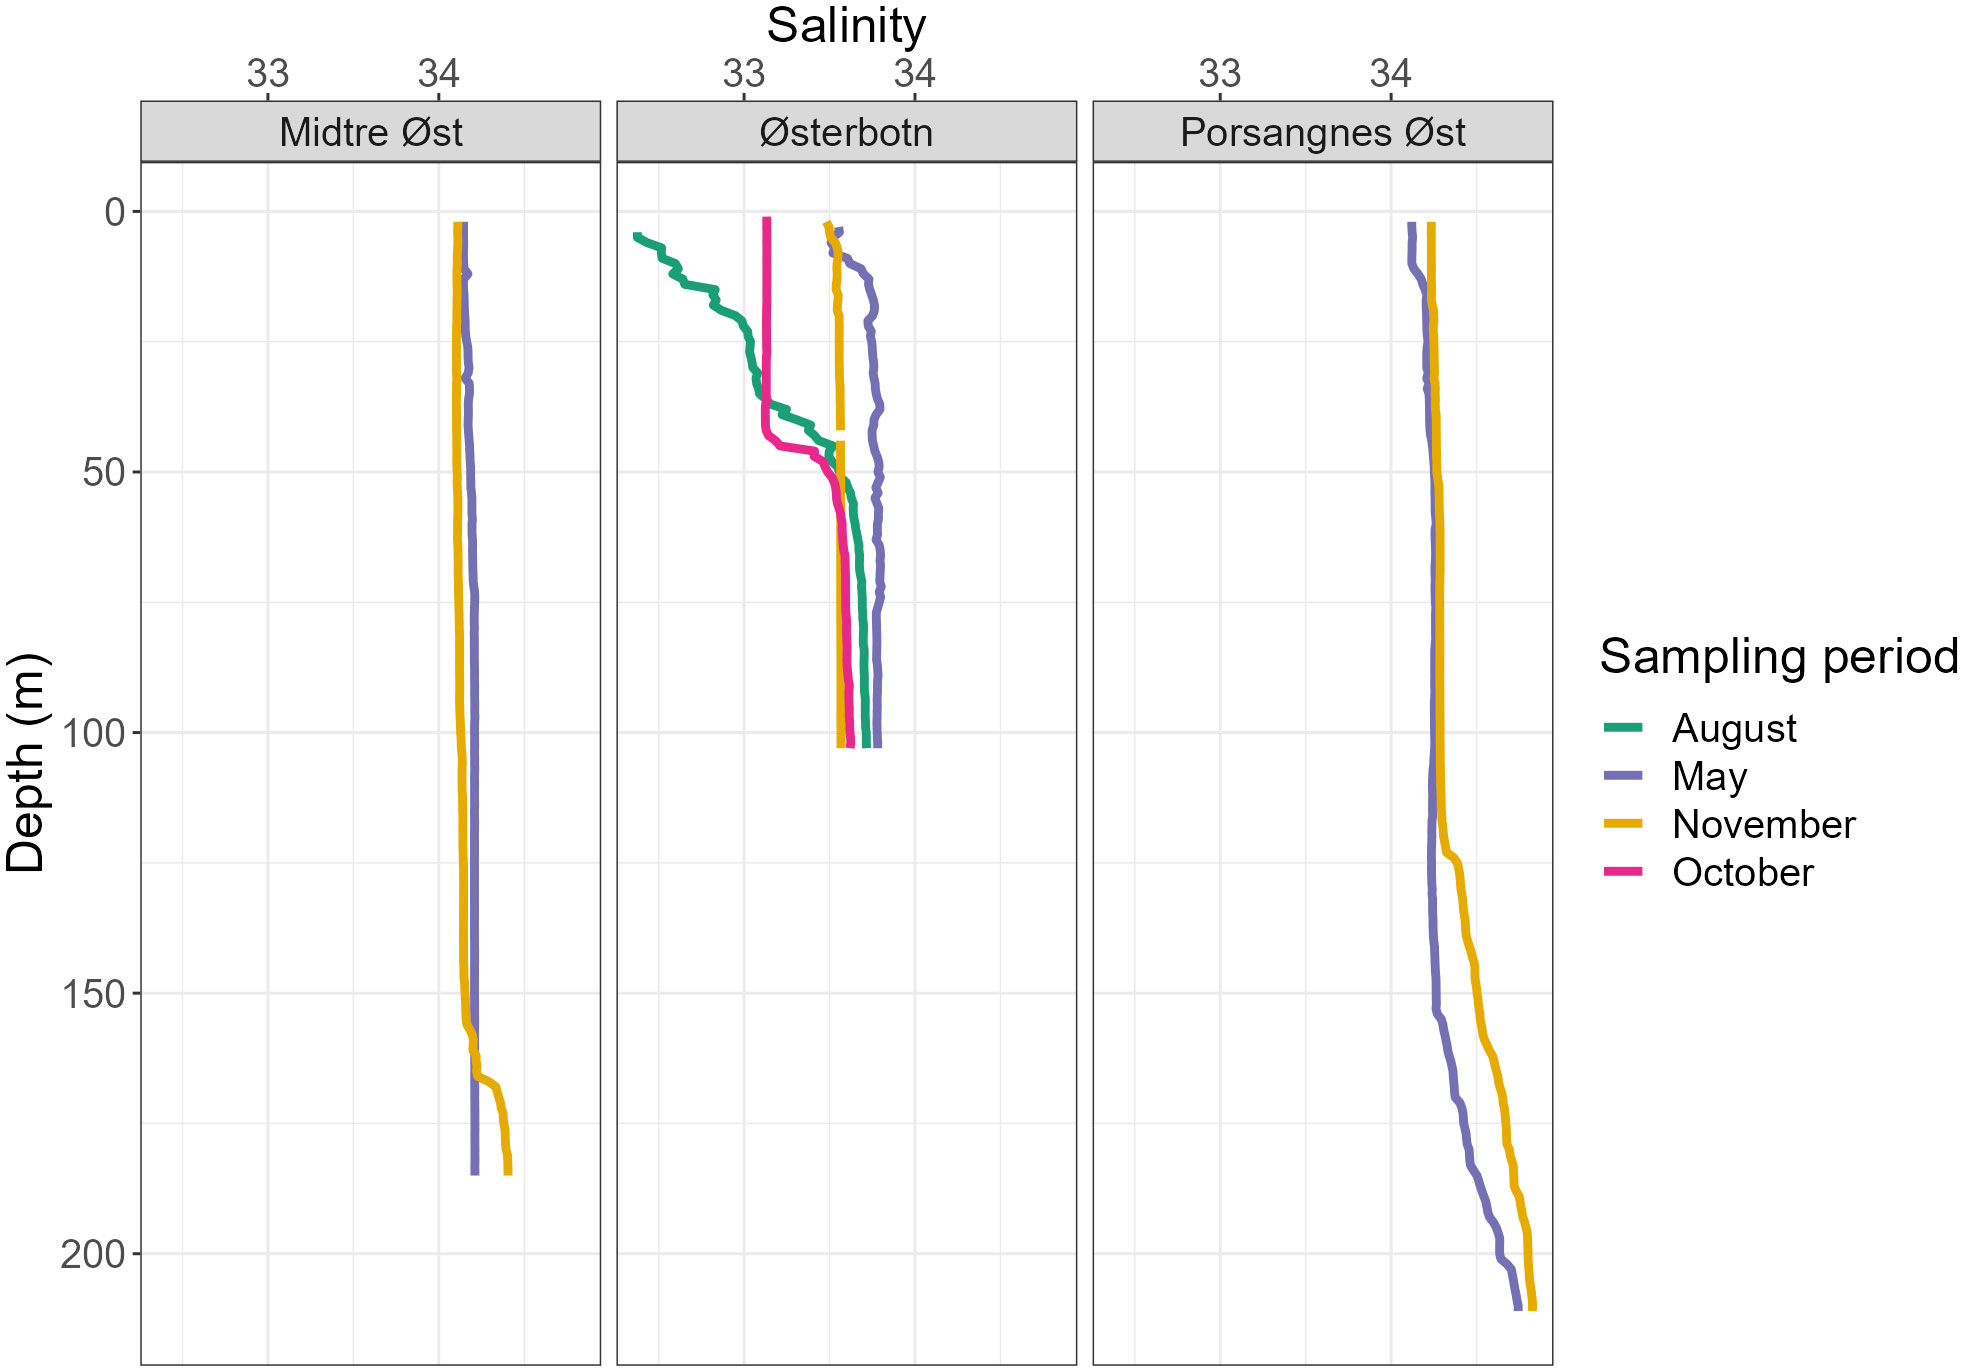
Figure 4 Salinity profiles during four sampling periods taken over three sampling stations, integrated into 1 m depth bins.
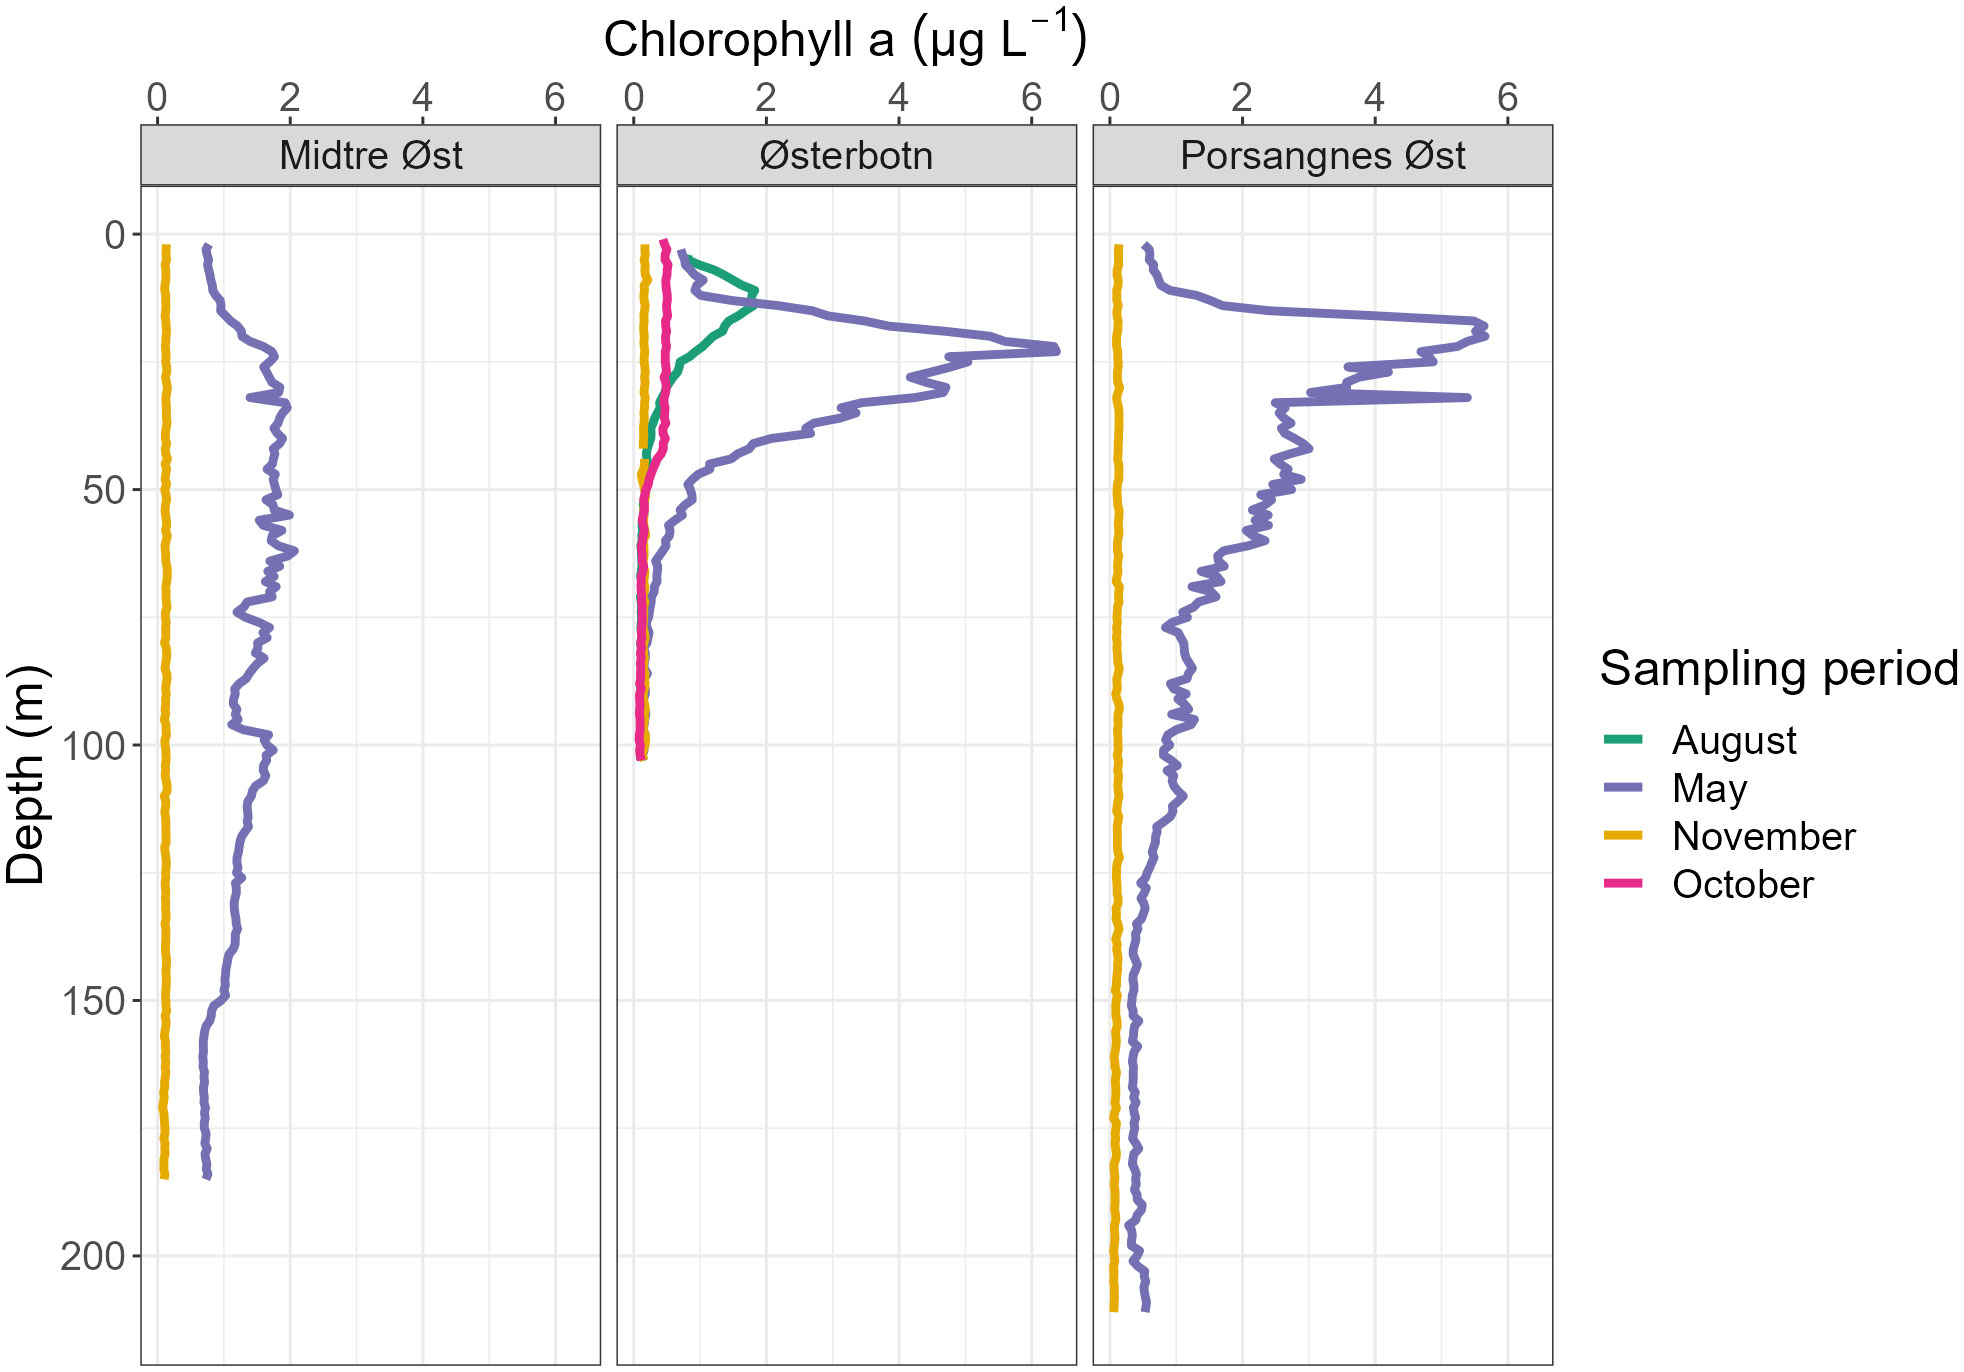
Figure 5 Average chlorophyll a concentration depth profiles during four sampling periods taken over three sampling stations, integrated into 1 m depth bins.
In August, surface waters in Østerbotn had warmed up to 10.4°C, gradually decreasing to 0.93°C at the bottom (Figures 3, 4). There was a broad pycnocline centred around 35 m, with salinity decreasing from 33.7 in the waters below 50 m to 32.4 in the surface. There was a subsurface chlorophyll a maximum at 11 m (1.8 µg L-1, Figure 5),
In October, the water column in Østerbotn was strongly stratified with a pycnocline at 42 m. Temperature changed from 5.4°C at 42 m to 3°C below 52 m depth, and salinity increased from 33.1 to 33.5 in the same interval (Figures 3, 4). Low chlorophyll a concentrations were measured above the pycnocline (Figure 5).
In November, Østerbotn had a well-mixed water column with ca 2.5°C and a salinity of 33.5, while Midtre Øst had ca 5°C and a salinity of 34.2 with a small incursion of slightly warmer and more saline water below 160 m, indicating coastal water of Atlantic origin (Figures 3, 4). At Porsangnes Øst, temperature and salinity were slightly higher (6.0°C and 34.5), with the coastal water intruding below 125 m. Chlorophyll a concentrations were negligible at all stations; this was at the beginning of the Polar Night in Porsangerfjord.
Østerbotn had the highest concentrations of marine snow as well as the highest abundances of M. norvegica of the three investigated locations.
In Østerbotn, the abundance of marine snow aggregates was 50 times higher in May than in any other sampling period, with a maximum aggregate density of 6.1x10⁵ aggregates m-3 at 42 m depth (Figure 6). The other sampling periods had more uniform abundances of marine snow throughout the water column, with the lowest abundance in November. Similarly, in Midtre Øst and Porsanges Øst, the abundance of marine snow peaked in May (Figure 6). A very low abundance of marine snow was observed in November, with the highest aggregate abundance observed toward the bottom of the water column.
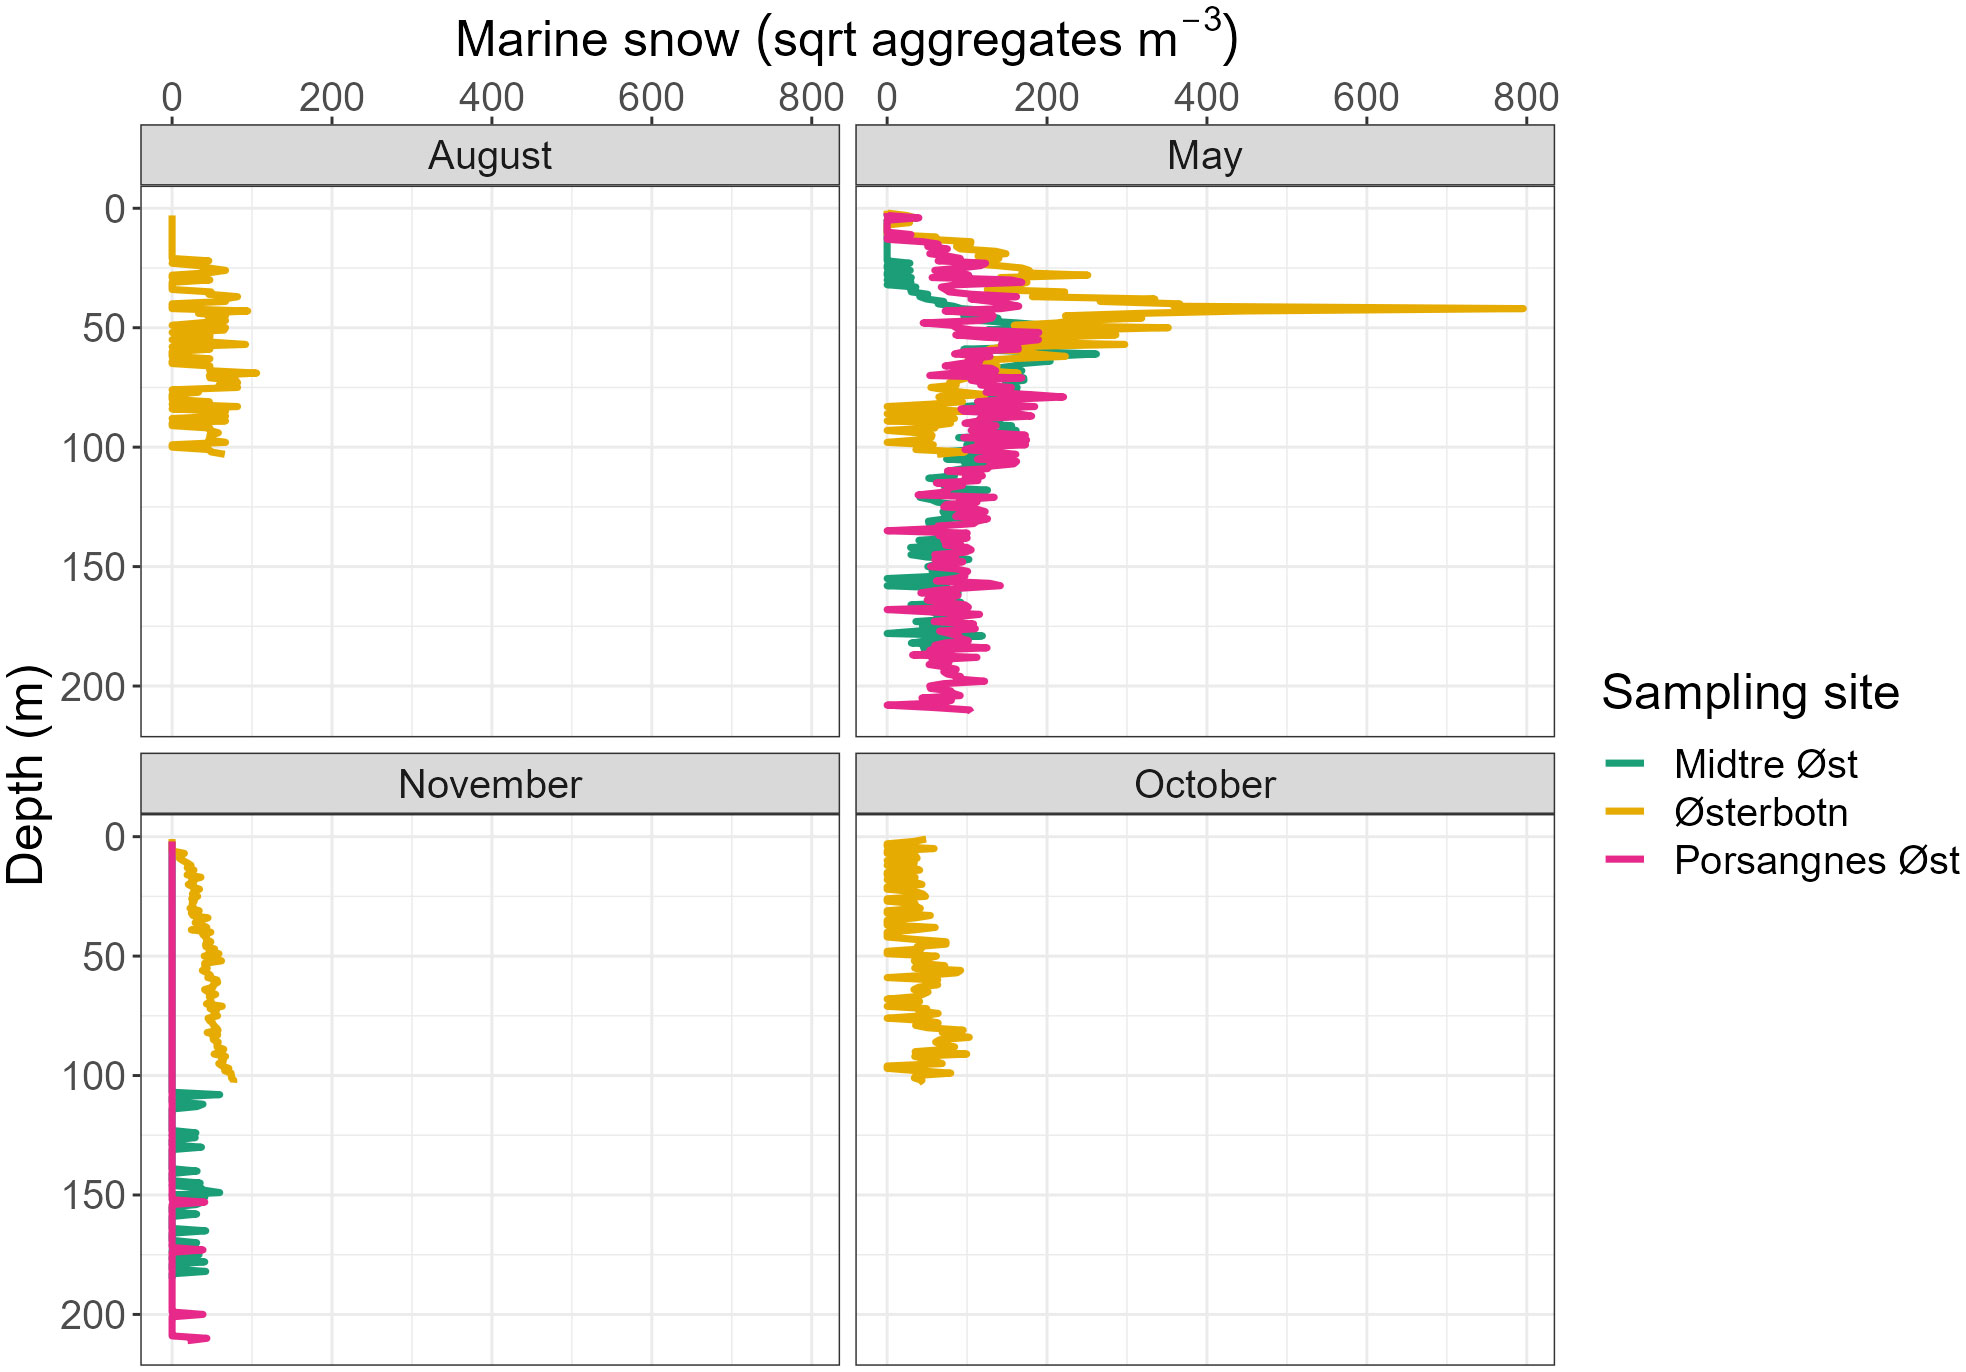
Figure 6 Vertical distribution of the square root of marine snow aggregates during four sampling periods, sampled using the Video Plankton Recorder and integrated into 1 m depth bins. Marine snow aggregates are presented as abundance (aggregates m-3).
The abundance and depth distribution of M. norvegica varied drastically throughout the year in Østerbotn (Figure 7). M. norvegica was most abundant in October, with a maximum estimated abundance of 2.31x10⁵ individuals m-3 at 87 m and a total abundance of 4.86x10⁶ individuals m-2. The WMD was shallower, at 78 m. This was similar to the depth at which the maximum concentration of marine snow was observed. The lowest abundance of M. norvegica was observed in November, with the highest density recorded as 5.01x10⁴ individuals m-3. During this sampling period, the concentration of M. norvegica increased with increasing depth from the surface to the bottom, hence the WMD was observed at a lower depth than the maximum concentration of M. norvegica (99 and 80.6 m, respectively; Table 3). In May and August, the maximum number of M. norvegica (1.4x10⁵ individuals m-3 and 1.3x10⁵ individuals m-3, respectively) was nearer the surface (14 and 13 m, respectively) than the observed WMD’s (23.6 and 25.8 m, respectively; Figure 7). The WMD’s were similar to the depths at which the chlorophyll a maximum was recorded during these months. At the locations Midtre Øst and Porsangnes Øst, more individuals of M. norvegica were observed during November than in May, but there was a low abundance of M. norvegica observed during both sampling periods (Figure 7). The WMD of M. norvegica was deeper in November than in May for both sampling periods (Table 3). There was no clear similarity between WMD of M. norvegica, chlorophyll a maximum or marine snow maximum.

Figure 7 Vertical distribution of the square root of M. norvegica individuals during four sampling periods, sampled using the Video Plankton Recorder and integrated into 1 m depth bins. M. norvegica individuals are presented as abundance (individuals m-3).
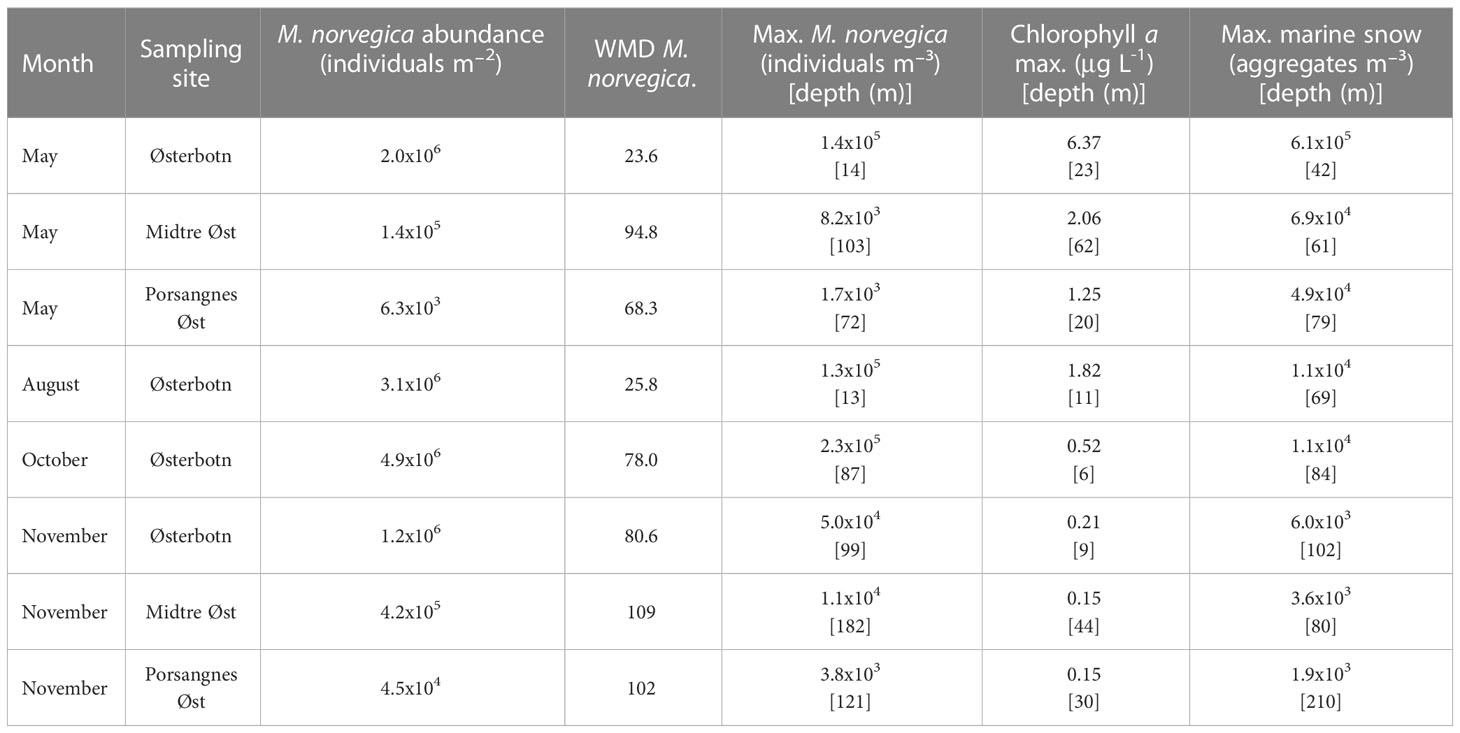
Table 3 Weighted mean depth (WMD) of Microsetella norvegica, abundance of M. norvegica in the entire water column, and estimated maximum values and depths for M. norvegica density, chlorophyll a maximum and marine snow density during eight sampling occasions.
In May and August in Østerbotn, there were statistically significant positive correlations between the distribution of chlorophyll a and M. norvegica (R2 = 0.76, p = 0.0000 and R2 = 0.94, p = 0.0000, respectively). The correlations between the distribution of marine snow and M. norvegica were negative. This was not statistically significant in May, but was in August (R2 = -0.07, p = 0.5025 and R2 = -0.37, p = 0.0002, respectively). In October and November, there were statistically significant positive correlations between the distribution of marine snow and M. norvegica (R2 = 0.49, p = 0.0000 and R2 = 0.86, p = 0.0000, respectively). In October, there was a statistically significant negative correlation between the distribution of chlorophyll a and M. norvegica (R2 = -0.71, p = 0.0000). In November, there was a weak statistically significant correlation between the distribution of chlorophyll a and M. norvegica (R2 = 0.16, p = 0.0205 (Table 4).
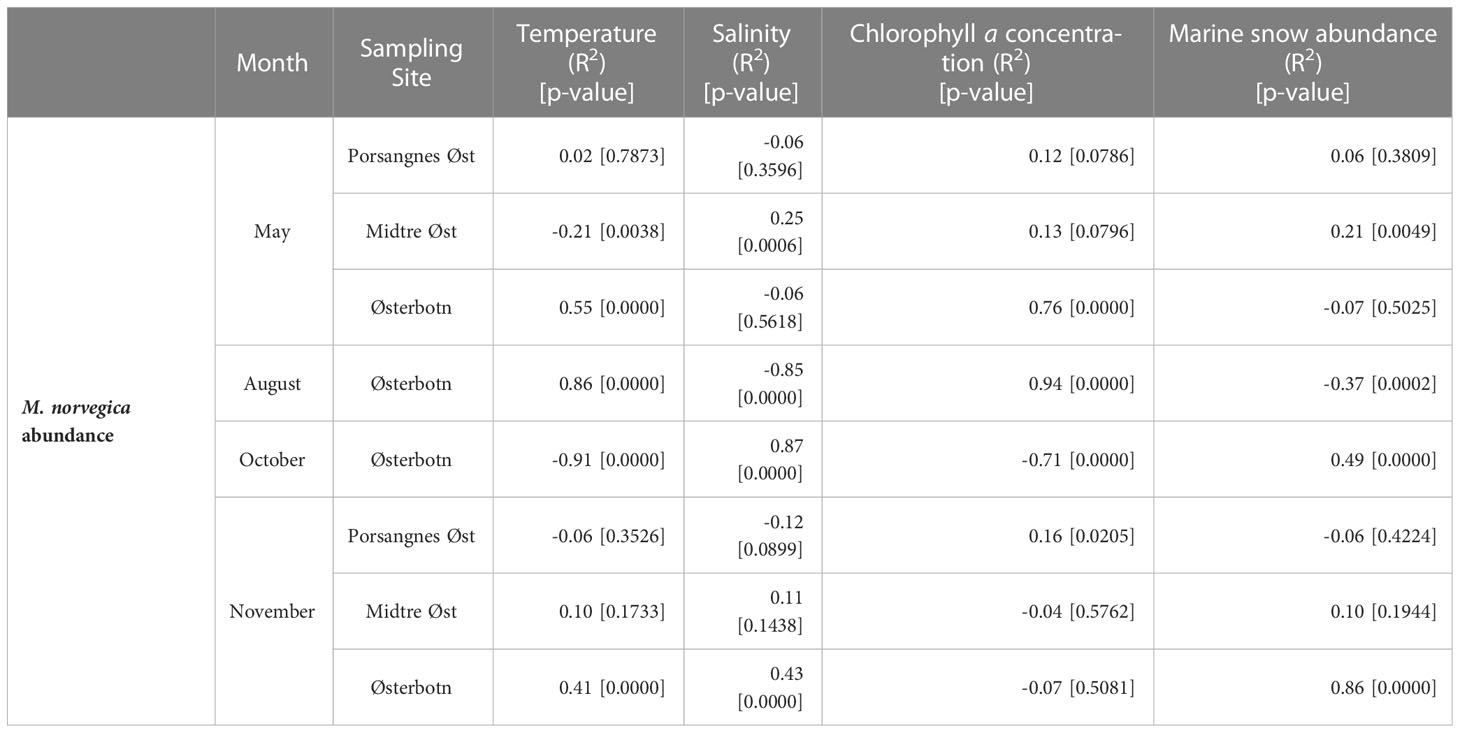
Table 4 Spearman correlation coefficients (R2) of Microsetella norvegica abundance versus chlorophyll a concentrations, marine snow abundance and marine snow aggregate size for four sampling periods.
To evaluate the potential impact of M. norvegica on the vertical POC flux, we estimated the fraction of aggregated POC that was ingested by M. norvegica for each aggregate size-class. The estimated degradation fraction (k) of aggregates varied with aggregate size, and with ambient abundance of M. norvegica. As such, the POC content of aggregates varied according to sampling period and depth. The overall fraction of POC that was consumed was largest in Østerbotn, and lower in Midtre Øst and Porsangnes Øst. In Østerbotn, we observed the highest aggregate grazing in October, and the lowest in August and November. In Midtre Øst and Porsangnes Øst, there were no significant differences in aggregate grazing by M. norvegica between the sampling periods.
The amount of aggregated POC varied with depth and between sampling periods and locations. The total aggregated POC that was consumed by M. norvegica was higher in Østerbotn than at the other locations for each sampling period (Table 5 and Figures 8–10). The most intense aggregate grazing by M. norvegica at Østerbotn was in October, where 1.4% (Table 5) of the total aggregated POC was consumed. The lowest aggregate grazing by M. norvegica was in May, at Porsangnes Øst. Here, 3.8x10⁻⁴% (Table 5) of the total aggregated POC was consumed.
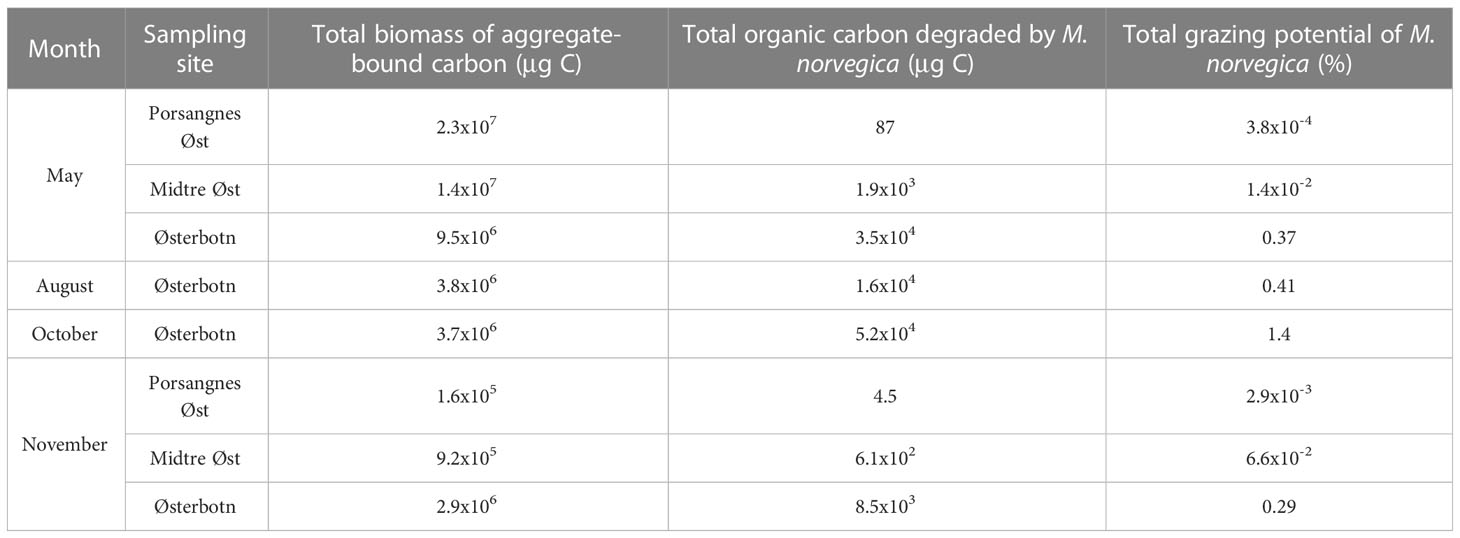
Table 5 Total organic carbon bound to aggregates in the entire water column, total organic carbon degraded from aggregates by Microsetella norvegica and the total grazing potential of M. norvegica on aggregate-bound organic carbon throughout the entire water column.
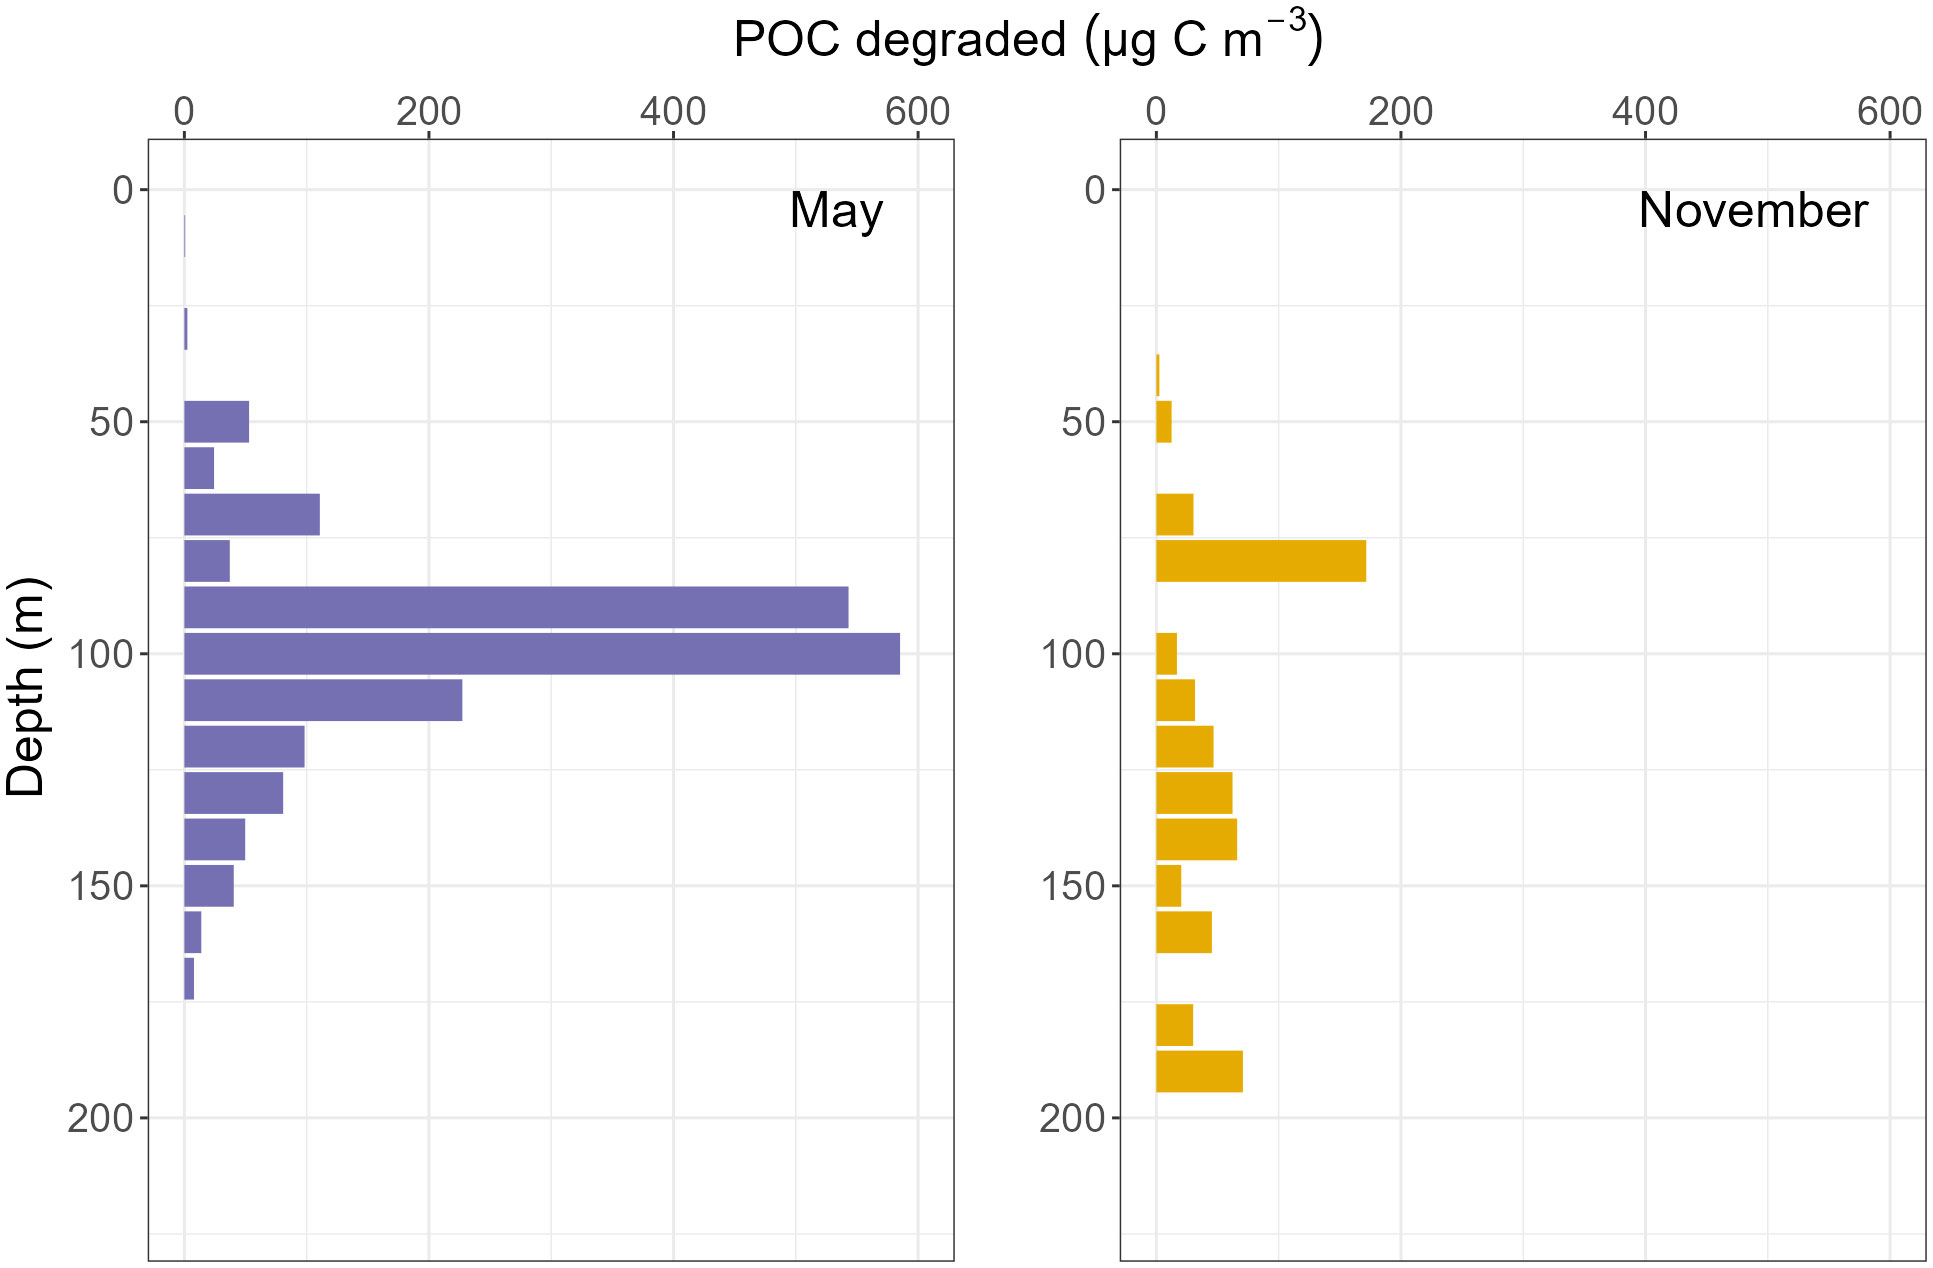
Figure 8 Total aggregate-bound particulate organic carbon degraded from organic aggregates by M. norvegica throughout the water column, per 10 m3, during four sampling periods in Midtre Øst.

Figure 9 Total aggregate-bound particulate organic carbon degraded from organic aggregates by M. norvegica throughout the water column, per 10 m3, during four sampling periods in Porsangnes Øst.
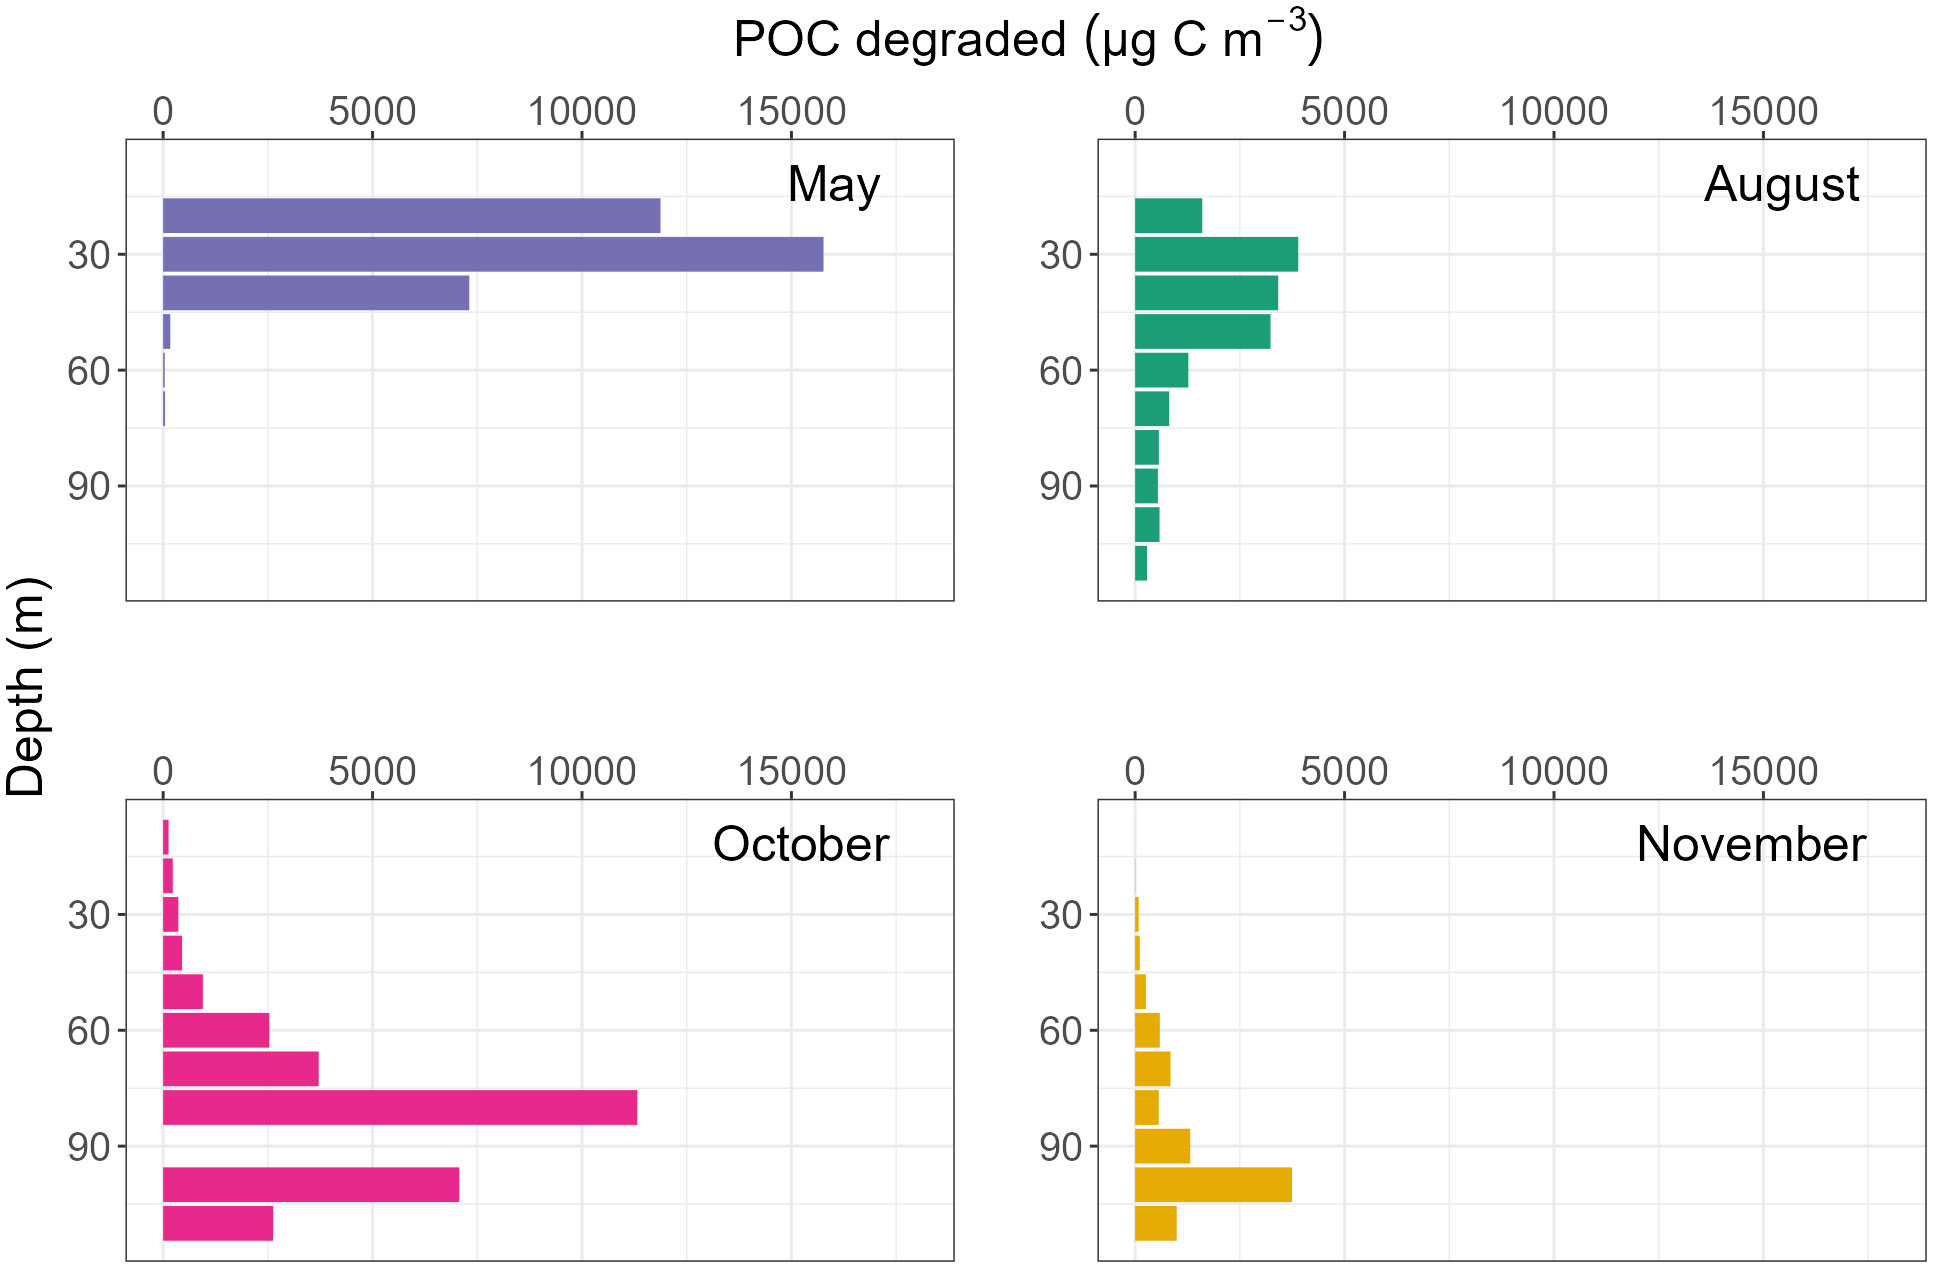
Figure 10 Total aggregate-bound particulate organic carbon degraded from organic aggregates by M. norvegica throughout the water column, per 10 m3, during four sampling periods in Østerbotn.
Comparisons can be made between all three stations for May and November. M. norvegica consumed more aggregated POC in May at Midtre Øst and Porsangnes Øst, but not at Østerbotn. Here, the most POC was instead consumed in October. However, there was a higher amount of aggregated POC available during May compared to November; this suggested that the higher aggregate grazing was not caused by increased fractional grazing of each aggregate, but due to more aggregate-copepod encounters during May compared to November (Table 5 and Figures 8–10).
Our study demonstrated the potential for M. norvegica to feed on settling aggregates and, thus, impact the amount of downward carbon flux in a sub-arctic North Norwegian fjord. In the following we will discuss the potential for, and possible factors influencing the role of, M. norvegica in affecting POC flux. We will focus on the geographical, seasonal and vertical distribution of aggregate grazing by M. norvegica and discuss the potential ecological impact from M. norvegica for flux attenuation in the ocean.
The amount of POC that falls through the water column towards the seafloor is a function of organic matter production rates and aggregate formation in the shallow, sunlit waters. Sub-arctic ecosystems exhibit strong seasonality in phytoplankton blooms, displaying significantly higher biomass during summer compared to the dark winter. The results of this study showed a clear seasonal variation in the abundance of M. norvegica in Porsangerfjord. Although abundances were high during May 2014 and August 2013, the highest abundance of M. norvegica in Østerbotn was observed during October 2013. This is a later seasonal peak in M. norvegica abundance compared to a previous study in Balsfjord in 2014, where M. norvegica abundance peaked during May and observed a population of older copepodite stages and adults until September (Svensen et al., 2018). Svensen et al. (2018) quantified M. norvegica using WP-2 nets and Go-Flow bottles, which allowed quantifications of nauplii and young copepodites, which were not easily identifiable in the VPR images. It should therefore be noted that our M. norvegica abundances from the VPR images are mainly based on older copepodite stages and adults. During October, this population may have been sustained by efficient water mixing, which could have caused resuspension of POC from the seafloor to the water column and provided a food source in the shallow Østerbotn. WP-2 net counts from the same study period showed that M. norvegica abundances also peaked during October in the other two fjord regions (Prat Varela, 2015; Priou, 2015). Here we assume that the water depth was too deep to have caused resuspension of POC and it seems more likely that the population development of M. norvegica was delayed in 2014 and M. norvegica peaked in late May or June, i.e. after our sampling campaign. Judging from previous studies, there seem to be strong variations in the population dynamics of M. norvegica between years; Svensen et al. (2018) observed very different abundances of M. norvegica between May 2013 and May 2014 in the North Norwegian Balsfjord. Despite the limitations in detecting nauplii and smaller copepodite stages by the VPR, the abundance of M. norvegica reported in this study is in line with previous observations. Studies using water bottles or zooplankton nets with appropriately small mesh sizes (≤100 μm) to sample M. norvegica have reported high abundances at different latitudes (34° N - 69° N), ranging from 2.0x10⁴ individuals m-3 to 5.0x10⁵ individuals m-3 (Uye et al., 2002; Arendt et al., 2013; Demchuk et al., 2015; Svensen et al., 2018). The maximum abundance recorded in this study was 2.3x10⁵ individuals m-3, suggesting that the VPR did provide accurate abundances of adult M. norvegica during our study.
The most obvious contrast in M. norvegica abundances was that between the inner fjord (Østerbotn) and the middle and outer fjord; the abundance per m-2 was approximately two orders of magnitude higher in Østerbotn than at the outer station, with the middle station intermediate. It is clear that M. norvegica thrived especially in the inner fjord, which is known to have a local diatom community emerging from overwintering spores each spring (Hegseth et al., 1995). This diatom bloom is restricted to the inner fjord by the shallow sill and the circulation of the waters within the middle fjord. The division between a diatom-dominated phytoplankton community (especially Chaetoceros socialis) in the inner fjord and a Phaeocystis pouchetii-dominated phytoplankton community in the outer fjord has been observed in earlier years during May (Hegseth et al., 1995; Priou, 2015). Diatoms are known to be a preferred food choice for M. norvegica (Uye et al., 2002), and they seem to prefer aggregates made up of diatoms (Koski and Lombard, 2022), which may explain the dominance of M. norvegica in the inner fjord.
The use of the video plankton recorder (VPR) allowed the fine scale vertical distribution of M. norvegica to be described for the first time. A strong seasonal variation in vertical distribution of M. norvegica was found throughout Porsangerfjord. Maar et al. (2006) suggested that M. norvegica is distributed within or just below pycnoclines. While aggregates have been observed to accumulate in these layers because of density gradients (Alldredge et al., 2002), this study did not identify any relationship between M. norvegica or marine snow depth distribution with any stratified layers in any sample period. Some correlations between temperature, salinity and M. norvegica abundance were significant (Table 4), but the only strong significant correlation was between temperature and M. norvegica abundance in August. These correlations are unlikely to be explained by either temperature or salinity driving the distribution of M. norvegica. Instead, it is more likely that covariances observed between M. norvegica and other factors, such as food availability from either phytoplankton or marine snow aggregates, drove their vertical distribution during our study.
Seasonal sampling provided insight into the role of M. norvegica in the ecosystem throughout the year. May and August are productive periods with high chlorophyll a concentrations in the surface water, indicating the occurrence of phytoplankton blooms. Comparing M. norvegica’s vertical distribution with chlorophyll a profiles revealed a statistically significant correlation in Østerbotn. Marine snow was also in high abundance here during May, but M. norvegica were not distributed at the same depths as the marine snow during May and August even though it has previously been observed to feed on marine snow (Koski et al., 2005; Koski et al., 2007; Steinberg et al., 2008). The distribution of M. norvegica in the upper euphotic zone during summer also highlights their importance as grazers of phytoplankton, serving as a trophic link between primary producers and higher levels of the food web.
During October and November, the amount of phytoplankton in the water was negligible at all sampling stations. At Østerbotn, M. norvegica was not found at shallow depths, but in deeper water where it was significantly positively correlated to the vertical distribution of marine snow. This suggests that M. norvegica preferred marine snow as a food source during October and November, when phytoplankton were scarce, while they were preferentially feeding on phytoplankton during bloom periods in May and August. Isari et al. (2013) suggested that copepods might choose more nutritious food items under conditions with high prey availability. From an evolutionary point of view, it is advantageous to be less selective when food is scarce (White, 1978) and to select nutritious food during times of plenty. Given that phytoplankton have a higher fatty acid, protein and particulate organic nitrogen content compared to organic detritus, such as marine snow (Roman, 1984), M. norvegica’s preference toward phytoplankton as a food source, when available, is not surprising. This supports the concept presented by Uye et al. (2002), where M. norvegica was found to be associated with and feeding on marine snow in oligotrophic environments, similar to our conditions during October and November.
At Midtre Øst and Porsangnes Øst, no significant correlation was found between the vertical distribution of M. norvegica, chlorophyll a, or marine snow. This may be explained by the low abundances of both M. norvegica and marine snow at both sampling stations in May and November, which reduces the difference between a presence and absence of objects from a statistical point of view.
If we assume that M. norvegica was indeed feeding on marine snow during October and November, we can use previously measured ingestion rates to evaluate the impact from aggregate grazing by M. norvegica on flux attenuation (Koski et al., 2005; van der Jagt et al., 2020). It is important to note that these are rough estimations and more accurate calculations would have been obtained if we had measured life-history traits directly on M. norvegica collected from the same site as the VPR samples were taken. Similarly, our estimates for POC content of marine snow aggregates are based on measurements taken from Hornsund, Svalbard. While also a arctic fjord similar to Porsangerfjord in depth, Hornsund is located at a higher latitude. However, our POC estimates for settling organic aggregates were similar to those measured by Walker et al. (2022). They took physical samples using sediment traps in Kaldfjord, Norway, which is similar to Porsangerfjord in latitude, climate and depth, and is also a north-south facing fjord. To improve estimates, properties of organic aggregates should be based on in situ experiments using sediment traps at the same site sampling takes place.
The majority of the potential POC consumption by M. norvegica occurred in the lower half of the water column during October and November since most of the marine snow was located at that depth. M. norvegica grazing on aggregates has the potential to explain 1.4% and 0.29% of the total carbon flux attenuation during October and November, respectively (Table 5). In comparison, 12% of total carbon flux attenuation is likely to be explained by microbial degradation at 15°C (Iversen and Ploug, 2010; Iversen et al., 2010). However, when temperature is lowered to 4°C, microbial degradation is reduced to explaining 2-3% of carbon flux attenuation (Iversen and Ploug, 2013; van der Jagt et al., 2020; Pauli et al., 2021).
Our estimates of carbon flux attenuation by M. norvegica are considerably more modest than those made by Koski et al. (2005), but with in situ measurements of life history traits and organic aggregates it might be the case that carbon flux attenuation is higher. We used a conservative estimate for the residence time of M. norvegica on the aggregates, which is directly proportional to the aggregate carbon ingestion and, hence, the flux attenuation. Often small copepods are ignored in carbon budgets and model studies, yet M. norvegica may play a role in the biological carbon pump, both via carbon turnover and as a link to higher trophic levels. Observations by Svensen et al. (2018) emphasised the importance of M. norvegica as an important prey for a variety of fish species. This suggests that M. norvegica may be an important species in many ecosystems throughout the year, especially due to its potential to feeding on marine snow during periods with low productivity and thereby convert detritus into eukaryotic biomass during oligotrophic conditions, such as arctic winters. This may explain how this small copepod without lipid storage is able to maintain a large overwintering population, which often exceeds that of calanoid copepods that are well documented to retain just a fraction of their summer population over the winter (Hind et al., 2000). M. norvegica’s relatively high population throughout the winter demonstrates their importance as secondary producers, especially when the abundance of primary producers becomes less in the autumn and winter months. In other words, M. norvegica represents an important source of food to higher trophic levels in times of otherwise scarce food supply. So, in addition to their, at times, modest, but still contributing role as gatekeepers for carbon flux, M. norvegica may be a key trophic link in Arctic ecosystems during the low-productive season. As the oceans warm, the impact of M. norvegica on flux attenuation is likely to increase owing to temperature dependant metabolic rates and carbon demand (Heinle, 1969; Heine et al., 2019).
The raw data supporting the conclusions of this article will be made available by the authors, without undue reservation.
BM and MN contributed to conception and design of the study. MN was involved with sampling and data acquisition. BM organized the database and performed statistical analysis. BM and MI contributed to modelling. BM wrote the first draft of the manuscript. MN wrote sections of the manuscript. All authors contributed to the article and approved the submitted version.
Funding was provided by the Fjord and Coast Flagship project Pelagic ecosystems in ice-covered and ice-free fjords under climate change (project number 2014-7), WP2.2 led by M. Norrbin (Fram Centre, Norway) and UiT the Arctic University of Norway. M. Iversen was supported by the Deutsche Forschungsgemeinschaft Research Center of Excellence “The Ocean Floor – Earth’s Uncharted Interface” (grant EXC-2077-390741603) and the framework of the Helmholtz-Gemeinschaft Deutscher Forschungszentren infrastructure program FRAM (Frontiers in Arctic Marine Monitoring) of the Alfred Wegener Institute, Helmholtz Center for Polar and Marine Research.
We wish to thank the crew of R/V Johan Ruud, former UiT research vessel, for excellent support during several research cruises to Porsangerfjord. Much of the field sampling and initial data processing was done by P. Priou and A. Prat Varela in connection with their M.Sc. projects, supervised by the senior author. We are grateful to T. Beroujon and H. K. Michelsen for doing parts of the full-frame counts of Microsetella. C. Svensen gave useful advice during early stages of the study on several aspects of flux and small copepod population dynamics.
The authors declare that the research was conducted in the absence of any commercial or financial relationships that could be construed as a potential conflict of interest.
All claims expressed in this article are solely those of the authors and do not necessarily represent those of their affiliated organizations, or those of the publisher, the editors and the reviewers. Any product that may be evaluated in this article, or claim that may be made by its manufacturer, is not guaranteed or endorsed by the publisher.
Alldredge A. L., Cowles T. J., MacIntyre S., Rines J. E. B., Donaghay P. L., Greenlaw C. F., et al. (2002). Occurrence and mechanisms of formation of a dramatic thin layer of marine snow in a shallow pacific fjord. Mar. Ecol. Prog. Ser. 233, 1–12. doi: 10.3354/meps233001
Alldredge A. L. (1972). Abandoned Larvacean Houses: A Unique Food Source in the Pelagic Environment. Science 177, 885–887. doi: 10.1126/science.177.4052.885
Arendt K. E., Juul-Pedersen T., Mortensen J., Blicher M. E., Rysgaard S. (2013). A 5-year study of seasonal patterns in mesozooplankton community structure in a sub-Arctic fjord reveals dominance of Microsetella norvegica (Crustacea, copepoda). J. Plankton Res. 35, 105–120. doi: 10.1093/plankt/fbs087
Banse K. (1990). New views on the degradation and disposition of organic particles as collected by sediment traps in the open sea. Deep Sea Res. Part A. Oceanographic Res. Papers 37, 1177–1195. doi: 10.1016/0198-0149(90)90058-4
Boyd P. W., Claustre H., Levy M., Siegel D. A., Weber T. (2019). Multi-faceted particle pumps drive carbon sequestration in the ocean. Nature 568, 327–335. doi: 10.1038/s41586-019-1098-2
Christiansen J. S., Fevolden S.-E. (2000). The polar cod of Porsangerfjorden, Norway; revisited. Sarsia 85, 189–193. doi: 10.1080/00364827.2000.10414571
Demchuk A., Ivanov M., Ivanova T., Polyakova N., Mas-Martí E., Lajus D. (2015). Feeding patterns in seagrass beds of three-spined stickleback gasterosteus aculeatus juveniles at different growth stages. J. Mar. Biol. Assoc. United Kingdom 95, 1635–1643. doi: 10.1017/S0025315415000569
Fossheim M., Primicerio R. (2008). Habitat choice by marine zooplankton in a high-latitude ecosystem. Mar. Ecol. Prog. Ser. 364, 47–56. doi: 10.3354/meps07483
Fowler S. W., Knauer G. A. (1986). Role of large particles in the transport of elements and organic compounds through the oceanic water column. Prog. Oceanography 16, 147–194. doi: 10.1016/0079-6611(86)90032-7
Frost B. W., Bollens S. M. (1992). Variability of diel vertical migration in the marine planktonic copepod Pseudocalanus newmani in relation to its predators. Can. J. Fisheries Aquat. Sci. 49, 1137–1141. doi: 10.1139/f92-126
Gorsky G., Le Borgne R., Picheral M., Stemmann L. (2003). Marine snow latitudinal distribution in the equatorial pacific along 180°. J. Geophysical Res. 108, 146–192. doi: 10.1029/2001JC001064
Green E. P., Dagg M. J. (1997). Mesozooplankton associations with medium to large marine snow aggregates in the northern gulf of Mexico. J. Plankton Res. 19, 435–447. doi: 10.1093/plankt/19.4.435
Hegseth E. N., Svendsen H., von Quillfeldt C. H. (1995). “Phytoplankton in fjords and coastal waters of northern Norway: environmental conditions and dynamics of the spring bloom,” in Ecology of fjords and coastal waters (Amsterdam: Elsevier Science), Pp 45–Pp 72.
Heine K. B., Abebe A., Wilson A. E., Hood W. R. (2019). Copepod respiration increases by 7% per °C increase in temperature: a meta-analysis. Limnology Oceanography Lett. 4 (3), 435–447. doi: 10.1002/lol2.10106
Hind A., Gurney W. S. C., Heath M., Bryant A. D. (2000). Overwintering strategies in Calanus finmarchicus. Mar. Ecol. Prog. Ser. 193, 95–107. doi: 10.3354/meps193095
Hopkins C. C. E., Tande K. S., Grønvik S., Sargent J. R. (1984). Ecological investigations of the zooplankton community of balsfjorden, northern Norway: an analysis of growth and overwintering tactics in relation to niche and environment in Metridia longa (Lubbock), Calanus finmarchicus (Gunnerus), Thysanoessa inermis (Krøyer) and T. raschi (M. sars). J. Exp. Mar. Biol. Ecol. 82, 77–99. doi: 10.1016/0022-0981(84)90140-0
Hu Q., Davis C. (2005). Automatic plankton image recognition with co-occurrence matrices and support vector machine. Mar. Ecol. Prog. Ser. 295, 21–31. doi: 10.3354/meps295021
Isari S., Antό M., Saiz E. (2013). Copepod foraging on the basis of food nutritional quality: can copepods really choose? PloS One 8, e84742. doi: 10.1371/journal.pone.0084742
Iversen M. H., Nowald N., Ploug H., Jackson G. A., Fischer G. (2010). High resolution profiles of vertical particulate organic matter export off cape blanc, Mauritania: degradation processes and ballasting effects. Deep-Sea Research part I: Oceanographic Research Papers. 57, 771–784. doi: 10.1016/j.dsr.2010.03.007
Iversen M. H., Pakhomov E. A., Hunt B. P., v Jagt H., Wolf-Gladrow D., Klaas C. (2016). Sinkers or floaters? contribution from salp pellets to the export flux during a large bloom event in the southern ocean. Deep-Sea Research part II: Topical Studies in Oceanography. 138, 116–125. doi: 10.1016/j.drs2.2016.12.004
Iversen M. H., Ploug H. (2010). Ballast minerals and the sinking carbon flux in the ocean: carbon-specific respiration rates and sinking velocities of macroscopic organic aggregates (marine snow). Biogeosciences 7, 1–30. doi: 10.5194/bg-7-2613-2010
Iversen M. H., Ploug H. (2013). Temperature effects on carbon-specific respiration rate and sinking velocity of diatom aggregates. potential implications for deep ocean export processes. Biogeosciences. 10, 4073–4085. doi: 10.5194/bg-5110-5191-2013
Iversen M. H., Poulsen L. K. (2007). Coprorhexy, coprophagy, and coprochaly in the copepods Calanus helgolandicus, Pseudocalanus elongatus, and Oithona similis. Mar. Ecol. Prog. Ser. 350, 79–89. doi: 10.3354/meps07095
Kiørboe T., Hansen J. L. S. (1993). Phytoplankton aggregate formation: observations of patterns and mechanisms of cell sticking and the significance of exopolymeric material. J. Plankton Res. 15, 993–1018. doi: 10.1093/plankt/15.9.993
Kiørboe T., Tiselius P., Mitchell-Innes B., Hansen J. L. S., Visser A. W., Mari X. (1998). Intensive aggregate formation with low vertical flux during an upwelling-induced diatom bloom. Limnology Oceanography 43, 104–116. doi: 10.4319/lo.1998.43.1.0104
Koski M., Kiørboe T., Takahashi K. (2005). Benthic life in the pelagic: aggregate encounter and degradation rates by pelagic harpacticoid copepods. Limnology Oceanography 50, 1254–1263. doi: 10.4319/lo.2005.50.4.1254
Koski M., Lombard F. (2022). Functional responses of aggregate-colonizing copepods. Limnology Oceanography 67, 2059–2072. doi: 10.1002/lno.12187
Koski M., Møller E., Maar M., Visser A. W. (2007). The fate of discarded appendicularian houses: degradation by the copepod, Microsetella norvegica, and other agents. J. Plankton Res. 29, 641–654. doi: 10.4319/lo.2005.50.4.1254
Koski M., Valencia B., Newstead R., Thiele C. (2020). The missing piece of the upper mesopelagic carbon budget? biomass, vertical distribution and feeding of aggregate-associated copepods at the PAP site. Prog. Oceanography 181, 102–243. doi: 10.1093/plankt/fbm046
Lima S. L. (2002). Putting predators back into behavioral predator–prey interactions. Trends Ecol. Evol. 17, 70–75. doi: 10.1016/S0169-5347(01)02393-X
Maar M., Visser A. W., Nielsen T. G., Stips A., Saito H. (2006). Turbulence and feeding behaviour affect the vertical distributions of Oithona similis and Microsetella norvegica. Mar. Ecol. Prog. Ser. 313, 157–172. doi: 10.3354/meps313157
Ohtsuka S., Kubo N., Okada M., Gushima K. (1993). Attachment and feeding of pelagic copepods on larvacean houses. Journal of Oceanography 49, 115–120. doi: 10.1007/BF02234012
Passow U., Carlson C. A. (2012). The biological pump in a high CO2 world. Mar. Ecol. Prog. Ser. 470, 249–272. doi: 10.3354/meps09985
Pauli N.-C., Flintrop C. M., Konrad C., Pakhomov E. A., Swoboda S., Koch F., et al. (2021). Krill and salp faecal pellets drive the carbon flux at the Antarctic peninsula. Nat. Communication. 12, 7168. doi: 10.1038/s41467-021-27436-9
Pedersen T., Fuhrmann M. M., Lindstrøm U., Nilssen E. M., Ivarjord T., Ramasco V., et al. (2018). Effects of the invasive red king crab on food web structure and ecosystem properties in an Atlantic fjord. Mar. Ecol. Prog. Ser. 596, 13–31. doi: 10.3354/meps12548
Poulsen L. K., Iversen M. H. (2008). Degradation of copepod fecal pellets: key role of protozooplankton. Mar. Ecol. Prog. Ser. 367, 1–13. doi: 10.3354/meps07611
Prat Varela A. (2015). Vertical distributions of zooplankton using the video plankton recorder in two high-latitude fjords. a case study on diel migration in Billefjorden, Svalbard, and seasonal migration in Porsangerfjord, northern Norway (Tromsø Norway: UiT Arctic University of Norway). Available at: https://hdl.handle.net/10037/8271. MSc thesis.
Priou P. (2015). Associations between herbivorous zooplankton, phytoplankton and hydrography in Porsangerfjord, northern Norway (Tromsø Norway: UiT Arctic University of Norway). Available at: https://hdl.handle.net/10037/8270. MSc thesis.
Roman M. R. (1984). Utilization of detritus by the copepod, Acartia tonsa. Limnology Oceanography 29, 949–959. doi: 10.4319/lo.1984.29.5.0949
RStudio Team (2021). RStudio: integrated development environment for r (Boston, MA: RStudio, PBC). Available at: http://www.rstudio.com/.
Shanks A. L., Trent J. D. (1979). Marine snow: microscale nutrient patches. Limnology Oceanography 24, 850–854. doi: 10.4319/lo.1979.24.5.0850
Steinberg D., Silver M. W., Pilskaln C. H. (1997). Role of mesopelagic zooplankton in the community metabolism of giant larvacean house detritus in Monterey bay, California, USA. Mar. Ecol. Prog. Ser. 147, 167–179. doi: 10.3354/meps147167
Steinberg D. K., Van Mooy B. A. S., Buesseler K. O., Boyd P. W., Kobari T., Karl D. M. (2008). Bacterial vs. zooplankton control of sinking particle flux in the ocean’s twilight zone. Limnology Oceanography 53, 1327–1338. doi: 10.4319/lo.2008.53.4.1327
Stemmann L., Jackson G. A., Gorsky G. (2004). A vertical model of particle size distributions and fluxes in the midwater column that includes biological and physical processes – part II: application to a three year survey in the NW Mediterranean Sea. Deep-Sea Res. I 51 (7), 885–908. doi: 10.1016/j.dsr.2004.03.002
Stramska M., Jankowski A. A., Cieszyńska A. A. (2016). Surface currents in the Porsanger fjord in northern Norway. Polish Polar Res. 37, 337–360. doi: 10.1515/popore-2016-0018
Svensen C., Antonsen M. T., Reigstad M. (2018). Small copepods matter: population dynamics of Microsetella norvegica in a high-latitude coastal ecosystem. J. Plankton Res. 40, 446–457. doi: 10.1093/plankt/fby019
Turner J. T. (1984). The feeding ecology of some zooplankters that are important prey items of larval fish. Natl. Oceanographic Atmospheric Administration 7:13–19.
Uye S., Aoto I., Onbé T. (2002). Seasonal population dynamics and production of Microsetella norvegica, a widely distributed but little-studied marine planktonic harpacticoid copepod. J. Plankton Res. 24, 143–153. doi: 10.1093/plankt/24.2.143
van der Jagt H., Wiedmann I., Hildebrandt N., Niehoff B., Iversen M. H. (2020). Aggregate feeding by the copepods Calanus and Pseudocalanus controls carbon flux attenuation in the Arctic shelf Sea during the productive period. Front. Mar. Sci. 7. doi: 10.3389/fmars.2020.543124
Visser A. W., Thygesen U. F. (2003). Random motility of plankton: diffusive and aggregative contributions. J. Plankton Res. 25, 1157–1168. doi: 10.1093/plankt/25.9.1157
Walker E. Z., Wiedmann I., Nikolopoulos A., Skarðhamar J., Jones E. M., Renner A. H. H. (2022). Pelagic ecosystem dynamics between late autumn and the post spring bloom in a sub-Arctic fjord. Elementa: Science of the Anthropocene 10, 00070. doi: 10.1525/elementa.2021.00070
White T. C. R. (1978). The importance of a relative shortage of food in animal ecology. Oecologia 33, 71–86. doi: 10.1007/BF00376997
Keywords: marine snow, aggregates, fjord ecology, vertical distribution, video plankton recorder, flux attenuation
Citation: Mooney BP, Iversen MH and Norrbin MF (2023) Impact of Microsetella norvegica on carbon flux attenuation and as a secondary producer during the polar night in the subarctic Porsangerfjord. Front. Mar. Sci. 10:996275. doi: 10.3389/fmars.2023.996275
Received: 17 July 2022; Accepted: 31 May 2023;
Published: 13 July 2023.
Edited by:
Alex J. Poulton, Heriot-Watt University, United KingdomReviewed by:
Hiroaki Saito, The University of Tokyo, JapanCopyright © 2023 Mooney, Iversen and Norrbin. This is an open-access article distributed under the terms of the Creative Commons Attribution License (CC BY). The use, distribution or reproduction in other forums is permitted, provided the original author(s) and the copyright owner(s) are credited and that the original publication in this journal is cited, in accordance with accepted academic practice. No use, distribution or reproduction is permitted which does not comply with these terms.
*Correspondence: Benjamin Paul Mooney, YmVuamFtaW4ubW9vbmV5QHNsdS5zZQ==
Disclaimer: All claims expressed in this article are solely those of the authors and do not necessarily represent those of their affiliated organizations, or those of the publisher, the editors and the reviewers. Any product that may be evaluated in this article or claim that may be made by its manufacturer is not guaranteed or endorsed by the publisher.
Research integrity at Frontiers
Learn more about the work of our research integrity team to safeguard the quality of each article we publish.