 Nora Diehl
 Niko Steiner
 Kai Bischof
 Ulf Karsten
 Svenja Heesch
- 1Marine Botany, Faculty of Biology and Chemistry & MARUM, University of Bremen, Bremen, Germany
- 2Alfred Wegener Institute, Helmholtz Centre for Polar and Marine Research, Bremerhaven, Germany
- 3Department of Applied Ecology and Phycology, Institute of Biological Sciences, University of Rostock, Rostock, Germany
Broadly distributed seaweeds, such as the boreal-temperate kelp species Saccharina latissima, contain a multitude of metabolites supporting acclimation to environmental changes, such as temperature and salinity. In Europe, S. latissima occurs along the coasts from Spitsbergen to Portugal, including the Baltic Sea, exhibiting great morphological plasticity. We investigated the morphological and biochemical traits of field-collected sporophytes from 16 different locations across the species entire distributional range in relation to local abiotic conditions (sea surface temperature, salinity). By statistically linking morphological and biochemical data to geographic information that also took into account the respective sampling depth, we aimed to obtain first insights into the site-specific adaptive features of this species. Frond length and width, mannitol and phlorotannin contents, and molar C:N ratio showed strong intraspecific variability among S. latissima sporophytes dependent on individual local abiotic drivers. Despite the conspicuous impact of local abiotic factors on specimens’ morphology, we could not determine habitat-specific signatures in the biochemical phenotypes. Even though our findings are based on a relative small sample size per site, they cover a broad biogeographical range and support a high plasticity of S. latissima sporophytes. The study provides a first base for studying separation processes of populations across latitudes and conservation ecology.
1 Introduction
Kelps are brown seaweeds of the order Laminariales, which are important primary producers and ecosystem engineers in coastal marine ecosystems around the globe (Dayton, 1985; Bartsch et al., 2008). Saccharina latissima (L.) Lane et al. is a boreal-temperate kelp species occurring from the Arctic to lower latitudes of ~ 40°N (Araújo et al., 2016). It grows on rocky shores and prefers sheltered conditions (Lüning, 1990) with a depth distribution from the upper subtidal to depths of 15–30 m (Pehlke and Bartsch, 2008; Bekkby and Moy, 2011; Bischof et al., 2019). This species generally tolerates large variations in environmental conditions (e.g. Bischof et al., 1998; Karsten, 2007; Nielsen et al., 2016a), and hence can be characterized as euryoecius and plastic. Its optimum growth ranges from 10 to 15°C (Bolton and Lüning, 1982), but S. latissima can survive temperatures between 0 and 23°C (Fortes and Lüning, 1980; Bolton and Lüning, 1982; Lüning, 1984). Recently, Diehl et al. (2021) revealed that field-collected sporophytes can even survive temperatures up to 25°C for at least short periods. Besides temperature, other abiotic drivers, such as salinity, light and nutrient availability, affect the distribution of S. latissima (Lüning, 1990). Regarding salinity, optimum growth occurs between an absolute salinity (SA) of 23 and 31, with strong declining growth rates below SA 16 and high mortality at SA < 8 (Gerard et al., 1987; Karsten, 2007). This trait allowed S. latissima to locally establish also in the Baltic Sea, which is characterized by a strong horizontal salinity gradient from west to east (Viktorsson, 2017). Indeed, stable populations of S. latissima are recorded from the Western Baltic Sea (Araújo et al., 2016), although from the Skagerrak eastwards, individuals descend to greater depths (Nielsen et al., 2016a). In the south-west, where salinity is around SA 10, S. latissima is only rarely found (Kautsky and Kautsky, 2000; Araújo et al., 2016).
Like other seaweeds, S. latissima produces a multitude of metabolites involved in defense, signaling and acclimation processes (Amsler, 2008). Mannitol, as organic osmolyte and ‘compatible solute’, maintains the intracellular functions under osmotic stress (Karsten, 2012), while phlorotannins are multifunctional as UV-sunscreens, anti-feeding substances and act as antioxidants under high light conditions (Amsler, 2008). The molar C:N ratio reflects the nutrient uptake and assimilation, concomitant with protein concentrations and nutrient supply (Hurd et al., 2014). The specific chemical profile of a specimen can mirror the environmental conditions of the sampling habitat (Martins et al., 2014; Monteiro et al., 2020) and, hence, reflect local adaptation on large geographical scales.
Along European shores, populations of S. latissima show pronounced differentiation, with genetically separated populations observed even within small geographical distances by using microsatellites or single-nucleotide polymorphism (SNPs) (Guzinski et al., 2016; Nielsen et al., 2016b; Luttikhuizen et al., 2018; Neiva et al., 2018; Guzinski et al., 2020; Ribeiro et al., 2022). However, populations along the east coast of the Atlantic can still be considered as one phylogenetic group (Neiva et al., 2018). Accordingly, intraspecific diversity and high plasticity of S. latissima could represent an intermediate stage of an ongoing speciation process facilitated by high phenotypic plasticity across large distances. Bolton (2010), (p 275f.) stated that “combined studies of the morphology, molecular systematics, and ecology of the speciation process will be important for our future understanding of kelp evolution”. By assessing the intraspecific variability on several levels, the process of ecotypic separation across Europe, as it is currently proposed, might be better understood.
In this study, we carefully evaluated morphological features and biochemical composition of S. latissima over a broad biogeographical range and related the data to the respective abiotic conditions of the 16 sampling sites across its entire distributional range in Europe. We aimed to reveal the respective variability as prerequisite for habitat-specific signatures in the species and hypothesized that the biochemical phenotypes of S. latissima reflect their biogeographical origin.
2 Material & methods
2.1 Sampling
Adult sporophytes of Saccharina latissima were collected from 16 different locations along the European Atlantic coast and the Baltic Sea in the summer periods of 2018, 2019 and 2020 (Figure 1A; Table 1). Individuals were collected at least 1 m apart by snorkeling or SCUBA diving. Our objective was to cover as large a distribution range of S. latissima as possible along the European coast. Since it was difficult to collect enough material at many locations, we had to decide on a small but broad sample pool. We thereby aimed to collect the largest specimens of equal size, at each location, if possible. Five specimens from each site were included in the study, except for RUN_r where only three individuals were found. The same individuals were used for all the phylogenetic, morphological and biochemical analyses (see Supplementary Table S.1).
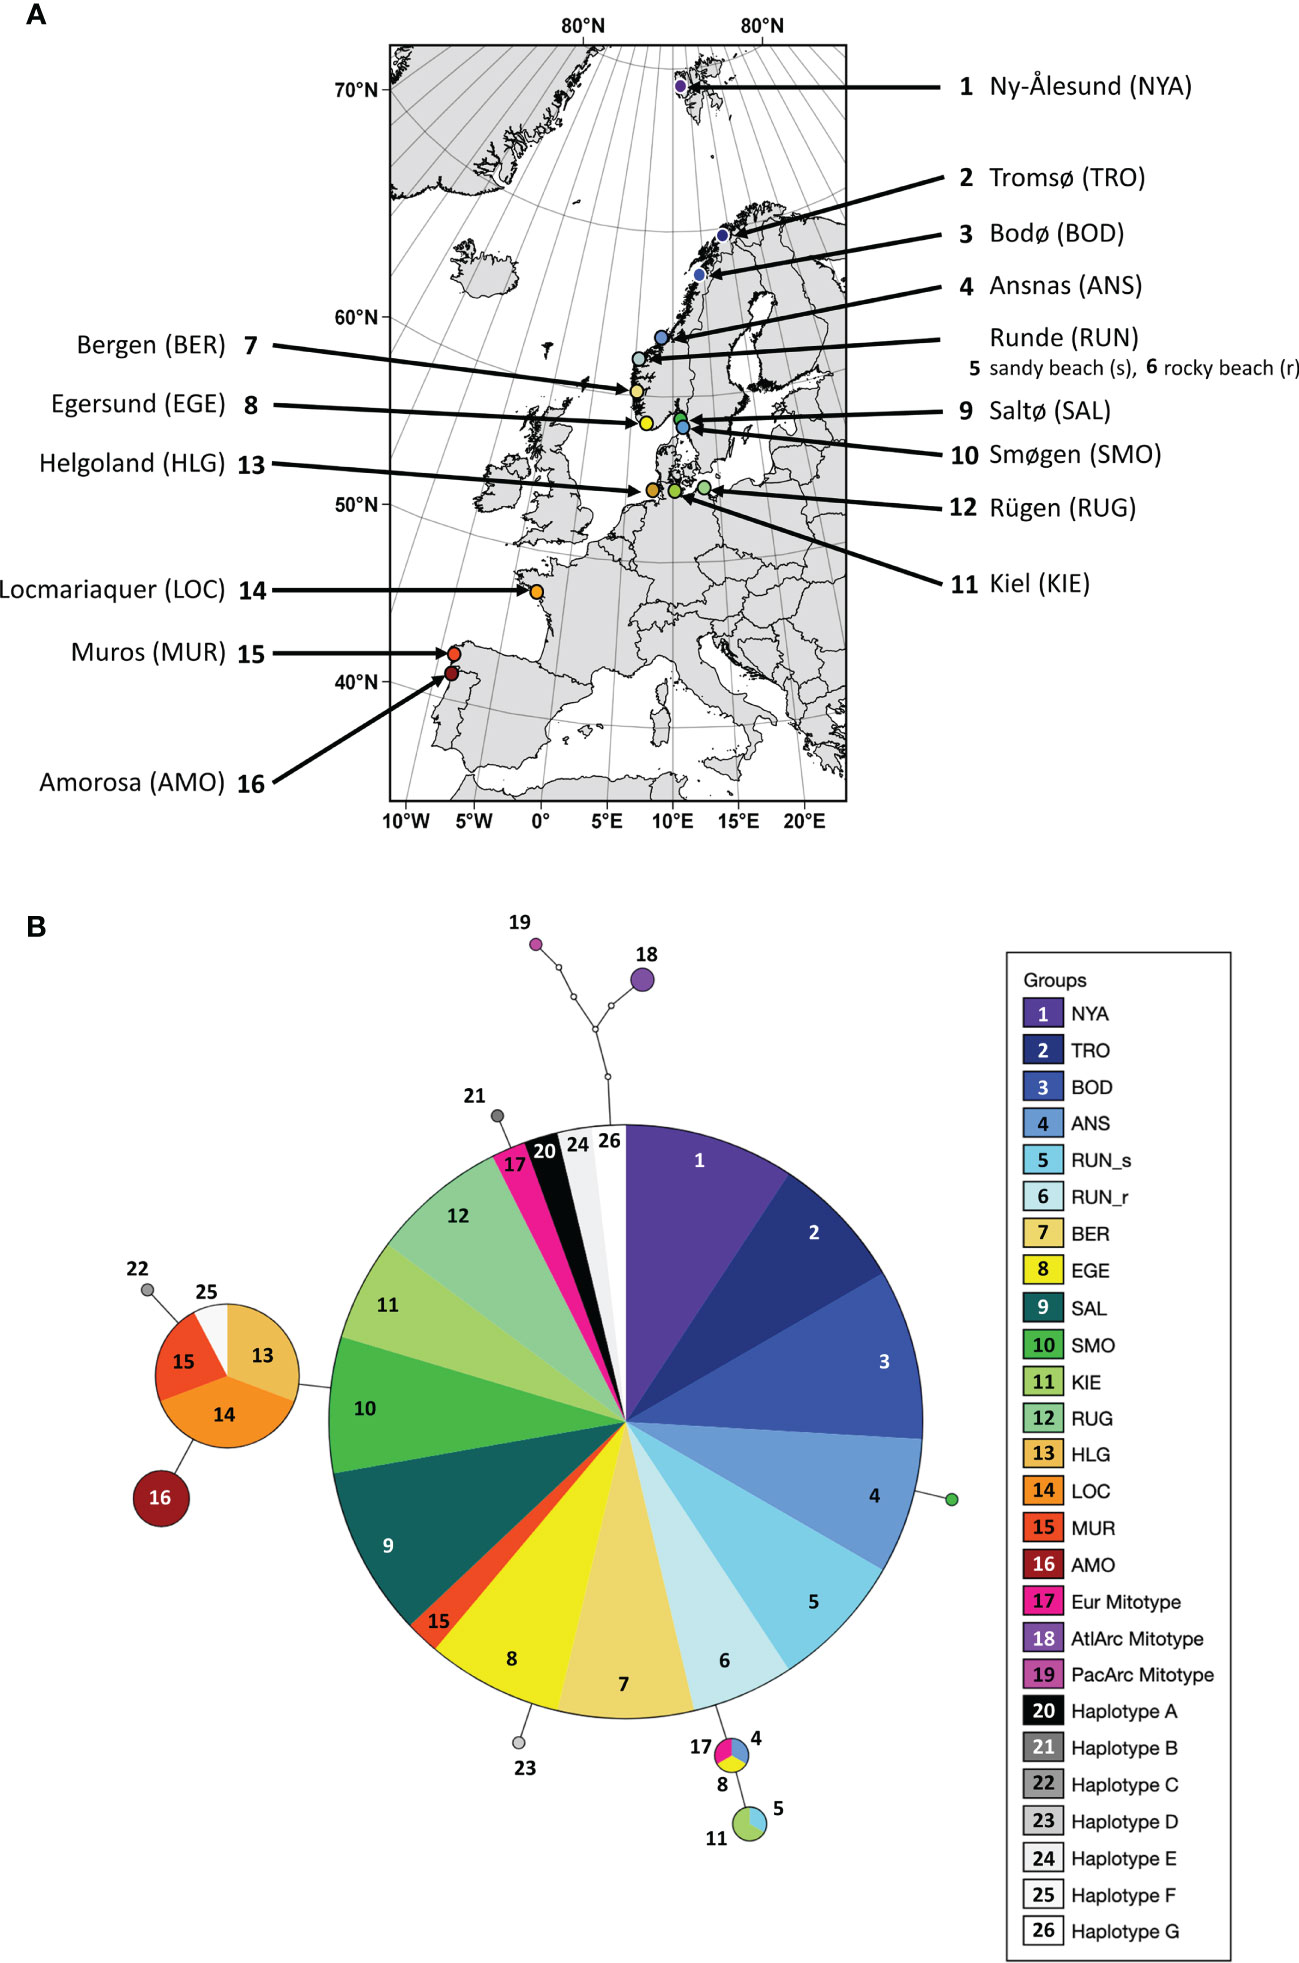
Figure 1 (A) Sampling locations of the kelp Saccharina latissima along the European coastline (map data: ©EuroGeographics for the administrative boundaries). (B) Haplotype network based on COI-5P sequences of Saccharina latissima. Open dots refer to base changes between encountered haplotypes (full circles); sizes of circles are proportional to numbers of sequences included. Haplotypes in grey scales are based on Luttikhuizen et al. (2018); light pink to light purple scales represent mitotypes based on McDevit and Saunders (2010); McDevit and Saunders (2009) (see (A) for references).
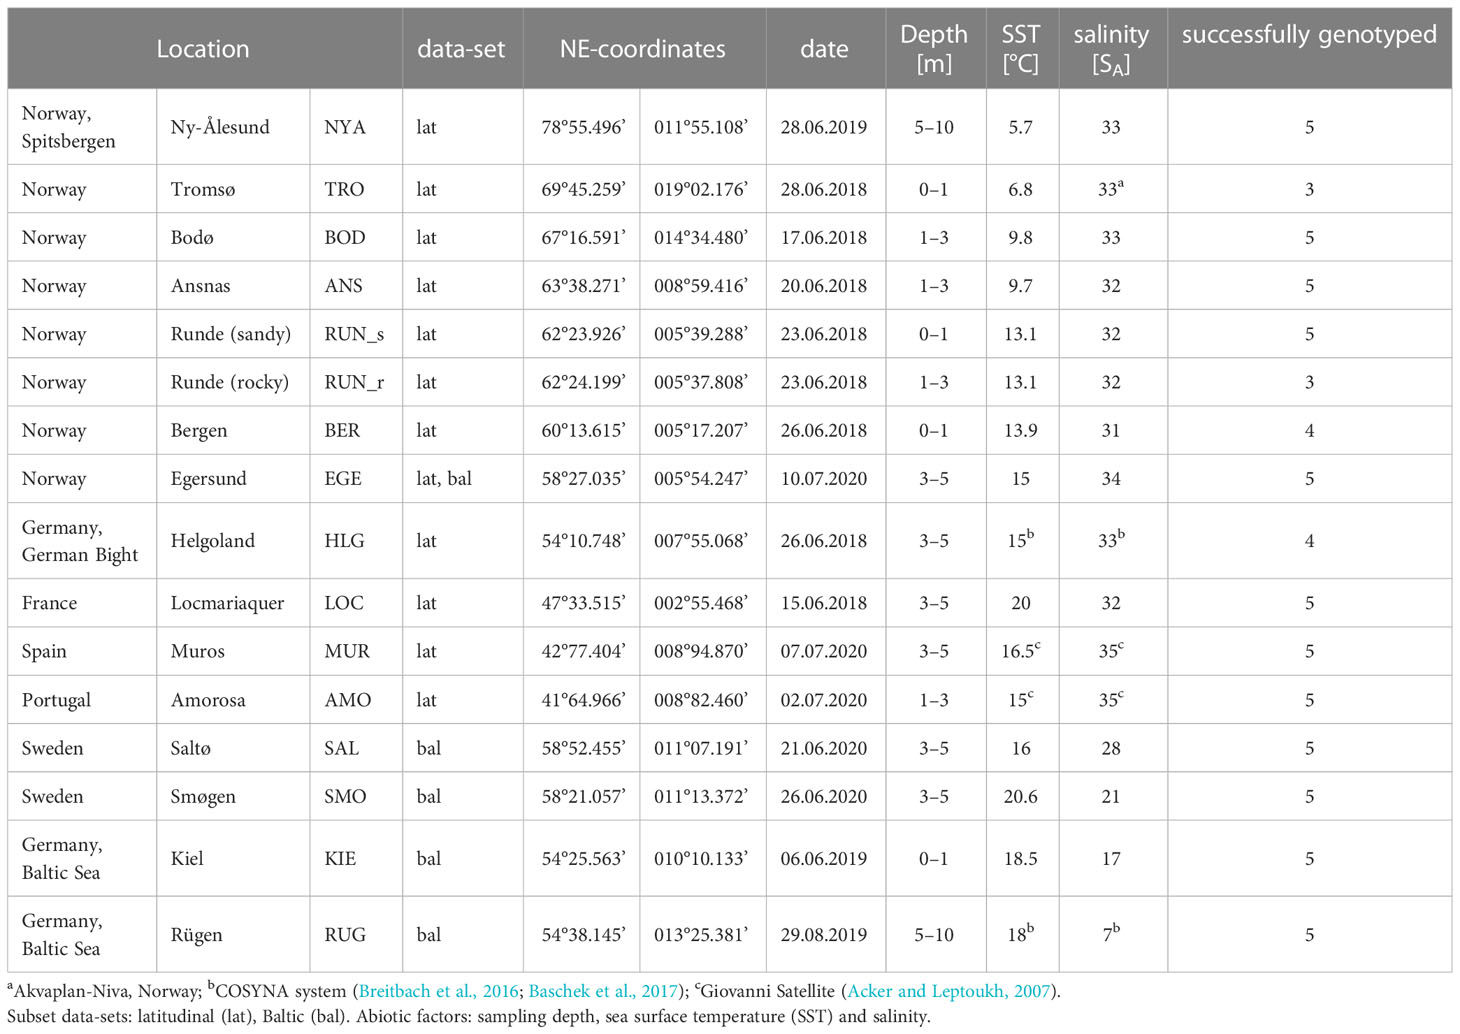
Table 1 Overview of the sampling details for Saccharina latissima.
The map of collection sites (copyrights: EuroGeographics for the administrative boundaries) was generated using QGIS 3.8.2-Zanzibar software (QGIS Development Team, 2019). The samples were gently dried depending on respective logistic facilities, either in drying cabinets at 40–45°C or in silica gel (Stévant et al., 2018).
2.2 Genetic analyses
2.2.1 DNA extraction, amplification and sequencing
DNA was extracted from dried tissue pieces of each individual of around 10–15 mm2 with the NucleoSpin® Plant II Kit (Macherey-Nagel, Germany), applying minor adaptations to the manufacturers’ protocol: The algal material was ground using dry silica sand and extra lysis buffer to dilute overly viscous samples. The cell lysis step was extended to a minimum of 1h to allow for maximum DNA recovery. Lastly, an additional centrifugation step at 11,000 g (3 min) was applied before elution of the DNA. Raw DNA extracts were stored at −20°C.
For sequence analysis, the mitochondrial cytochrome-c-oxidase I gene (COI-5P) was amplified with the forward primer GazF2 and the reverse pairing primer GazR2 (Lane et al., 2007). Primers were obtained from biomers.net (Germany).
Polymerase chain reaction mixtures (PCRs) contained 25 µL (12.5 µL MyTaq™ Mix (Bioline, Meridian Bioscience, Inc., USA), 8 µL of sterile H2O, 1 µL of each primer (10 µM) and 2.5 µL DNA extract). DNA extracts were diluted with sterile H2O at least to 1:10 or 1:100, to avoid inhibition of PCRs by high concentrations of impurities in the extract. The PCR program (Biometra® T Gradient thermocycler, Analytik Jana, Germany) was: 2 min at 94°C, followed by 35 cycles of denaturation at 94°C (30 s), annealing at 50°C (1 min) and elongation at 72°C (2 min), and a final extension step at 72°C for 10 min. For subsequent sequencing, PCR products were purified either with the PureLink™ PCR Purification Kit (Invitrogen, ThermoFischer Scientific, Germany) or the SureClean Plus Kit (Bioline, Meridian Bioscience, Inc., USA), following the manufacturers’ protocols. Purified products were sequenced commercially (Eurofins Genomics, Germany).
2.2.2 Phylogenetics
Sequences were manually checked in 4Peaks (Griekspoor and Tom Groothuis, 2015) and aligned with PhyDE-1 v0.9971 (Müller et al., 2010). Initial species identification was confirmed by BLAST® searches (https://blast.ncbi.nlm.nih.gov/Blast.cgi) and subsequent phylogenetic analysis of the COI-5P marker. The alignment comprised 618 bp and included published sequences of S. latissima as well as the close relative S. japonica (Areschoug) Lane et al. with sequences of the kelp genus Hedophyllum (Areschoug) Setchell serving as outgroup. A phylogenetic tree (Figure S1, including representative sequences and GenBank accession numbers) based on the Maximum Likelihood (ML) criterion, and a minimum spanning network among COI-5P haplotypes (Figure 1B) were constructed following the methods given in Heesch et al. (2020). COI-5P sequences were deposited in GenBank under the accession no.s ON661800-ON661872 (https://www.ncbi.nlm.nih.gov/nuccore/ON661800 to https://www.ncbi.nlm.nih.gov/nuccore/ON661872).
2.3 Principal component analysis
2.3.1 Data acquisition: abiotic data, morphology and biochemical parameters
Sea surface temperature (SST) and salinity were recorded on the sampling day at each location (Table 1). Missing SST and salinity data for HLG and RUG were provided by the COSYNA system (HEREON; Breitbach et al., 2016 and Baschek et al., 2017). Missing abiotic data for MUR and AMO were retrieved as weekly means from the Giovanni online data system, developed and maintained by NASA GES DISC (Acker and Leptoukh, 2007). The samples and abiotic data from TRO were provided by a local aquaculture company (S. Matsson, Akvaplan-Niva). Additionally, the sampling depth respective to mean high tide (in categories: 0–1 m; 1–3 m; 3–5 m; > 5 m) was noted. Since we could not always guarantee the same sample depth at the different locations, the respective sample depth was included in the analyzes in order to check its relevance for the biochemical composition of the individuals.
Frond morphology (length, width) was documented and the length to width ratio (length:width) was calculated for each individual. For all biochemical analyses, dried and ground meristematic material was used. Mannitol, molar C:N ratio and phlorotannins were measured as biochemical parameters, following the detailed methodological descriptions in Diehl and Bischof (2021). All data are summarized in the electronic Supplementary material Table S.1.
2.3.2 Statistics
The full data-set was split to analyze the morphological and biochemical diversity of S. latissima. To evaluate patterns across the entire latitudinal range, only fully marine sampling locations were subset (latitudinal data-set, Table 1). The impacts along a salinity gradient were analyzed with samples collected in the Baltic Sea (Baltic data-set). The population from EGE was added as marine control from similar latitude (Table 1).
Pearson correlations were calculated and visualized using R Studio (version 4.0.0, Boston, MA, USA), and interpreted after Cohen (1988) to further analyze the links between biochemical and morphological parameters and local abiotic conditions. Accordingly, a correlation coefficient (r) of 0.1 is considered a weak, 0.3 a moderate, and 0.5 or larger a strong correlation. Significance was set to p < 0.05. Multivariate patterns were visualized with Principle Component Analyses (PCA). The PCA was run using the prcomp-function in R Studio (version 4.0.0, Boston, MA, USA) and plotted as combined biplots and scatterplots with the ggbiplot function of the ggbiplot-package (Vu, 2011). Missing values in the data-set were estimated based on cross-validation, using the functions estim_ncpPCA and imputePCA of the missMDA-package (Josse and Husson, 2016). In order to visualize patterns in each biochemical parameter separately along the latitudinal and salinity gradient, heatmap graphs were constructed using the online software heatmapper (http://heatmapper.ca/) (Babicki et al., 2016).
3 Results
3.1 Morphology and genetic diversity of Saccharina latissima in Europe
3.1.1 Morphological variability
Strong variations in the morphological appearance of S. latissima were observed between the different sampling locations (Figure 2). For instance, specimens from KIE and RUG in the Baltic Sea and those collected along the Iberian Coast (MUR, AMO) were considerably smaller than those from the other sites. Many samples were ragged at the tip of the blade or started to decompose, hence, the actual length of the sporophyte was difficult to determine (Table S.1). Regardless, besides their overall size, also the length to width ratio (length:width) varied considerably between locations (1.4–23.4). Sporophytes from RUN_r (length:width 17.1 ± 4.0) and HLG (16.5 ± 2.3) were conspicuously long, narrow and thick. In contrast, the individuals collected in ANS (2.5 ± 0.4) were very wide, fragile and rigid. Even samples from very close locations showed marked differences in their morphologies: S. latissima specimens from the rocky shore in Runde (RUN_r) were – as mentioned above – very long and narrow, while samples from the same island, but collected at another shore (RUN_s), grew shorter and much wider (5.3 ± 1.7). Summarizing, no general effect of salinity or sampling depth could be determined for length or width of the sporophytes (Figure 3). Nonetheless, length:width increased with increasing sea surface temperature (SST), since samples grew significantly narrower in warmer regions.
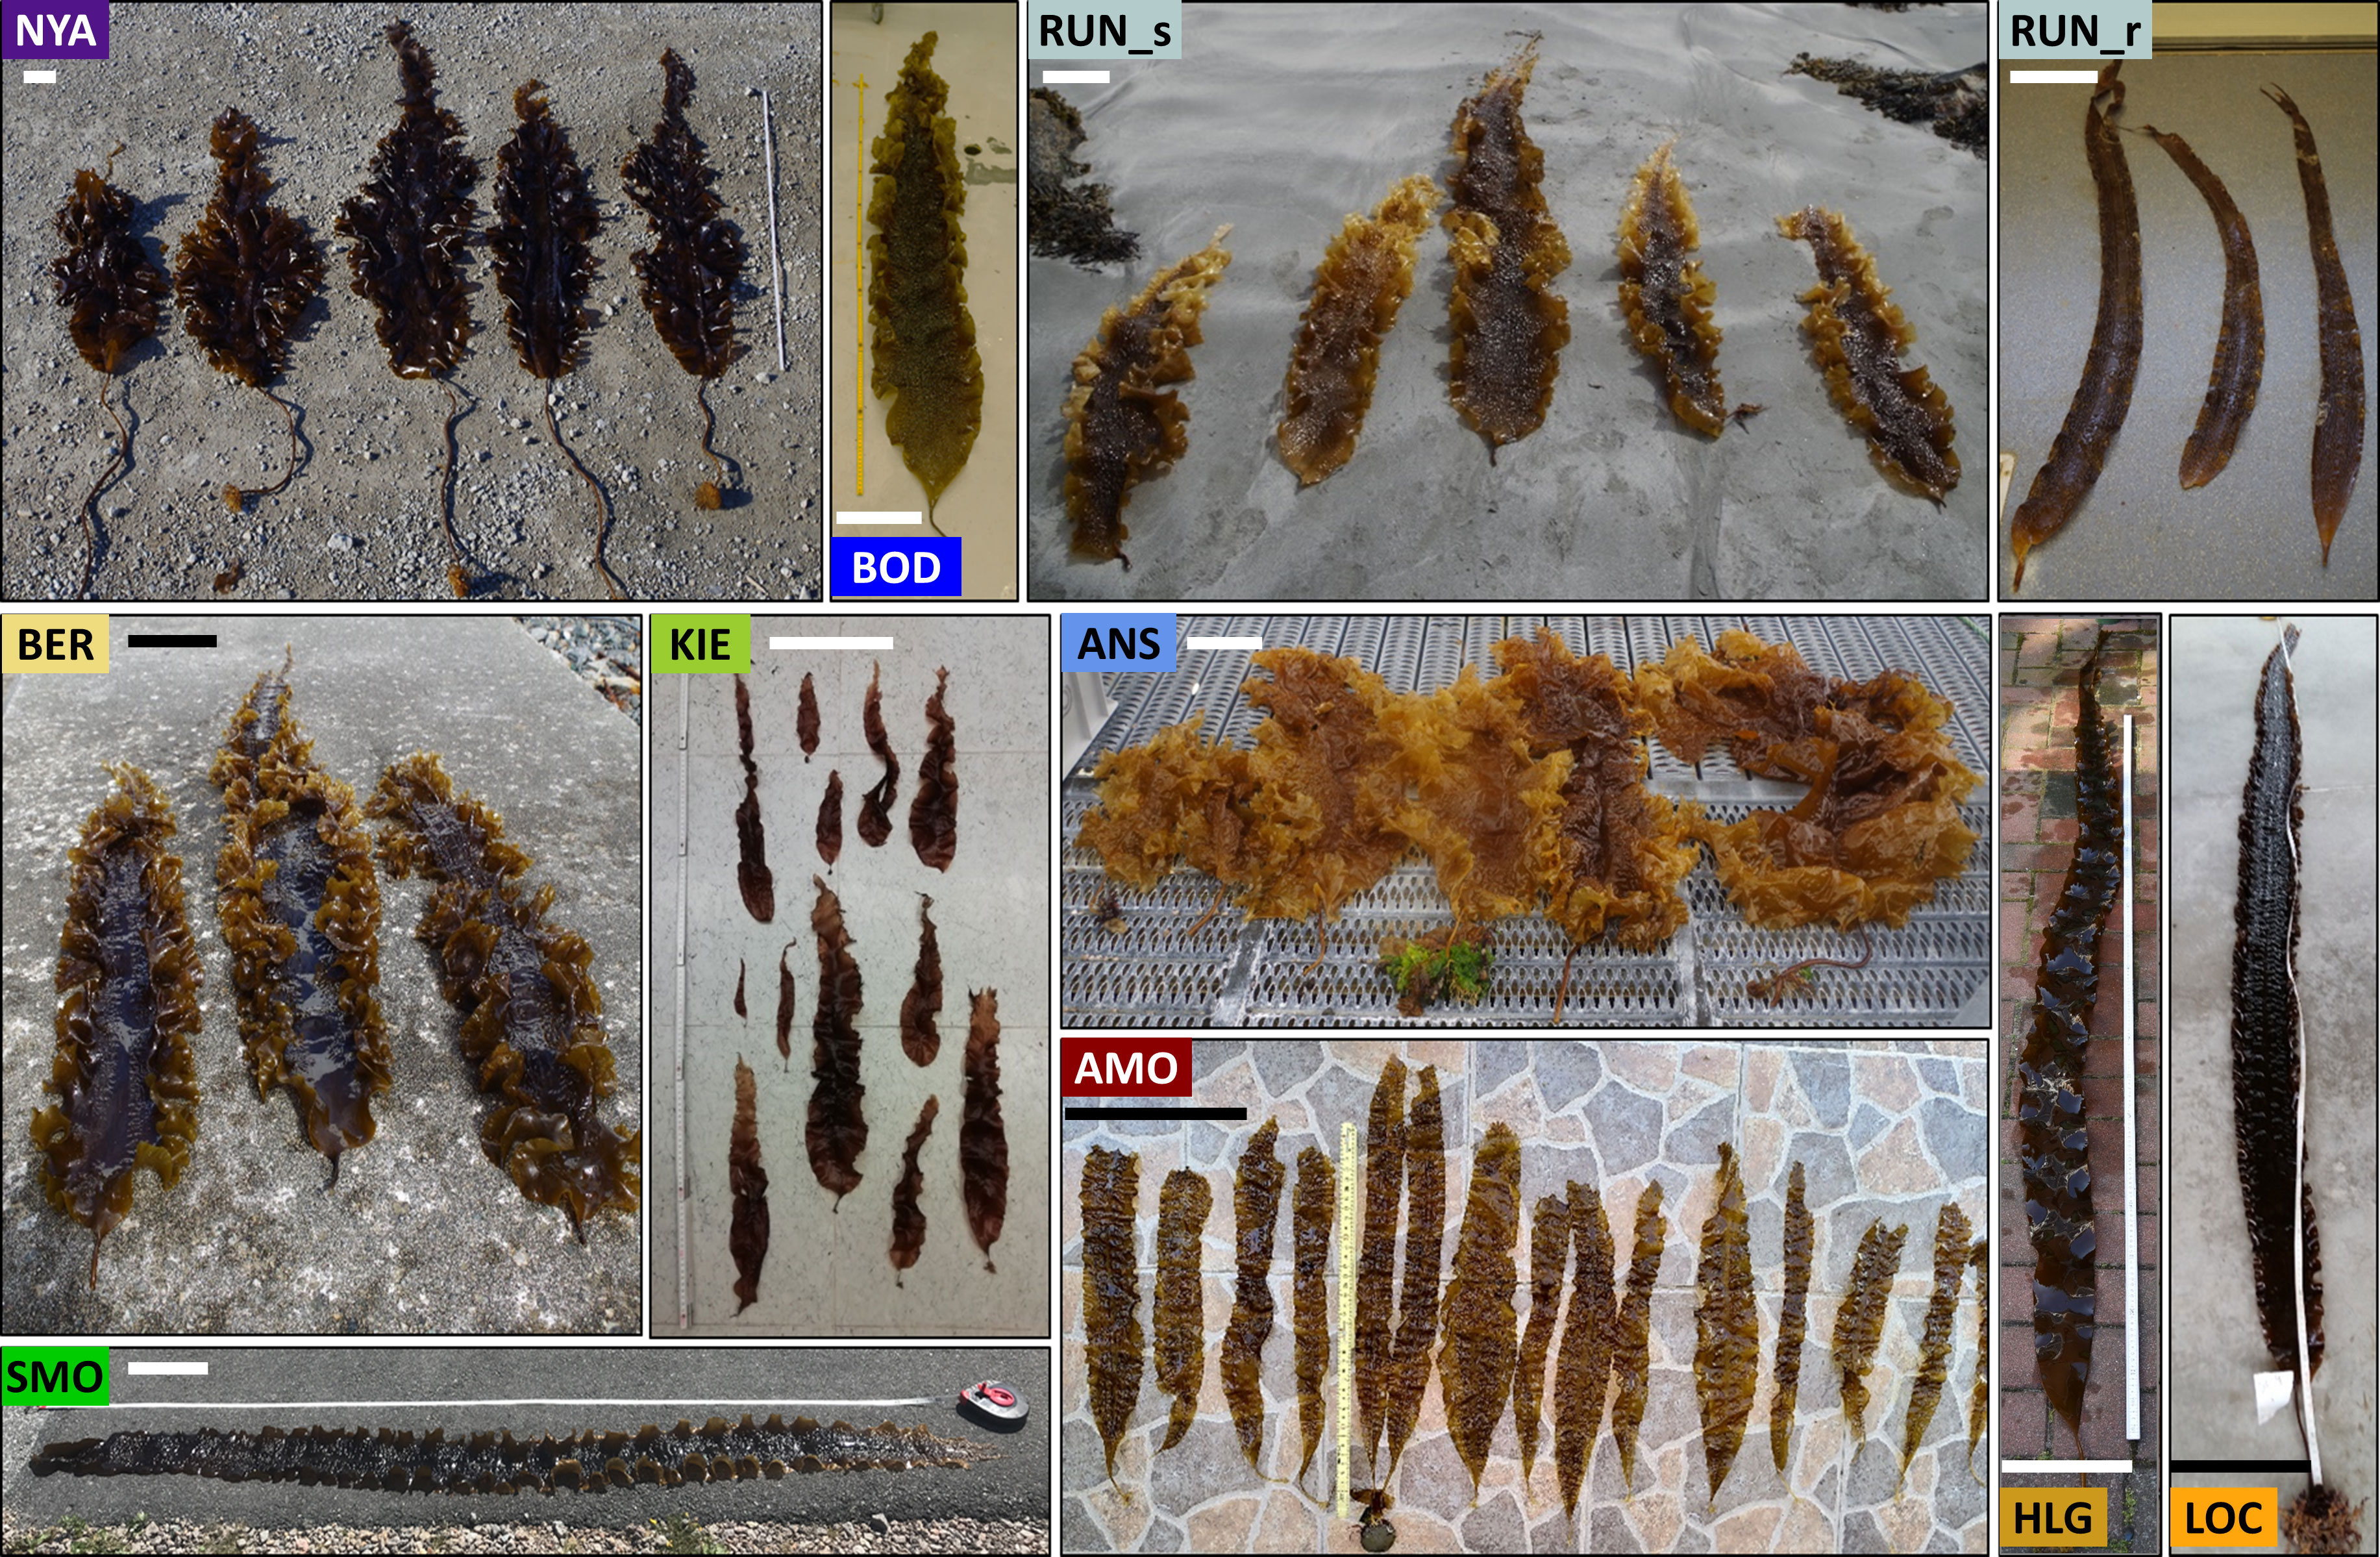
Figure 2 Morphological variability of representative Saccharina latissima sporophytes collected along the European coastline; for coding of collection sites see Figure 1A. Scale bar represents 20 cm. The ratio of length:width (L:W) of the phylloid is given as mean value for each site. NYA: collected from the Old Pier, 10 m depth, moderate exposure (Photo: N. Diehl). L:W 2.4; BOD: collected from rocky shores, 1-3 m depth, moderate exposure (Photo: N. Diehl). L:W 5.7; RUN_s: collected from rocks surrounded by sand, 1-2 m depth, moderate exposure (Photo: N. Diehl). L:W 5.2; RUN_r: collected in a Laminaria digitata forest, 1-3 m depth, exposed (Photo: N. Diehl). L:W 17.1; BER: collected in a harbor on smaller rocks, 0-1 m depth, moderate exposure (Photo: N. Diehl). L:W 3.1; KIE: collected on ponds in a harbor, 0-1 m depth, moderate exposure (Photo: N. Diehl). L:W 5.8; ANS: collected in a small bay, 1-2 m depth, protected (Photo: N. Diehl). L:W 2.5; SMO: collected from rocky shores, 4 m depth, exposed (Photo: S. Steinhagen). L:W 13.1; AMO: collected from rocky shores, 1-3 m depth, moderate exposure (Photo: Cátia Monteiro). L:W 7.3; HLG: collected from rocky shores, 5 m depth, exposed (Photo: A. Wagner). L:W 16.5; LOC: collected from rocky shores, high tidal range, 3-5 m depth, moderate exposure (Photo: L. Fouqueau). L:W 11.2.
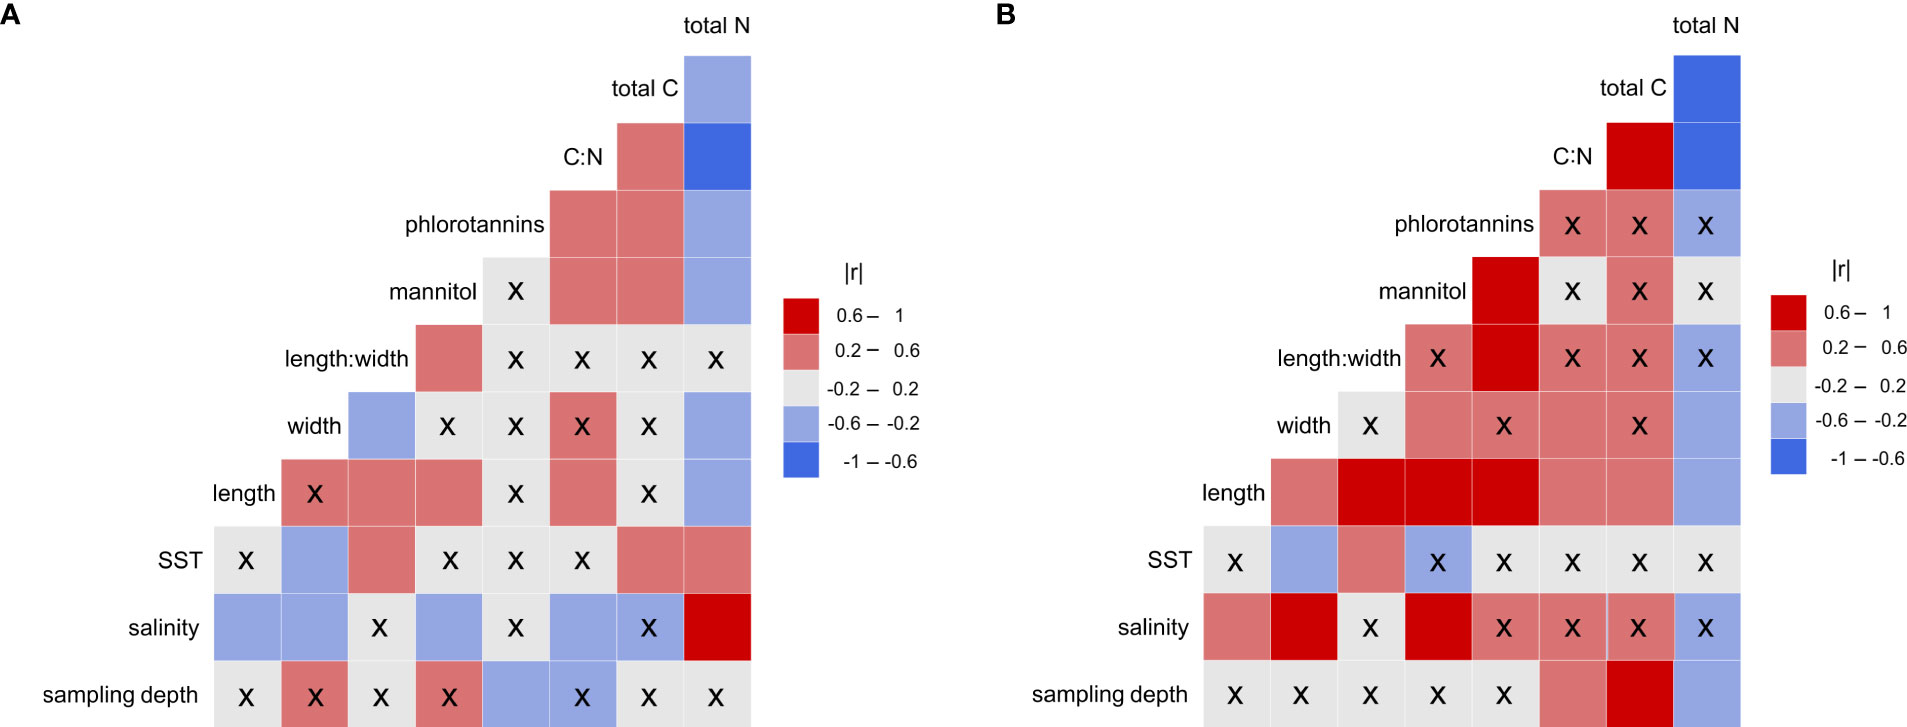
Figure 3 Correlation matrix plot showing Pearson’s correlation coefficient between the local abiotic parameters, and the morphological and biochemical characteristics of Saccharina latissima. (A) Latitudinal data-set. (B) Baltic data-set. The values are represented in the color bar: darker colors indicate stronger correlations. x = non-significant (p > 0.05).
3.1.2 Phylogentics
All sporophytes were genetically identified as Saccharina latissima, apart from four specimens (TRO3, TRO5, BER1 and HLG1; Tables 1, S.1), which consistently failed to amplify in PCRs and could not be genetically verified. Samples that were included in the phylogenetic analysis formed a well-supported clade with other S. latissima (Figure S1).
In the haplotype network (Figure 1B), no clear geographic clustering could be observed. Most samples belonged to one major haplotype closest to the European mitotype (in bright pink; reference) with one base pair difference. Some individuals from various locations differed from this main and the European mitotype by single substitutions, e.g. three samples from KIE and two from RUN. The southern samples, i.e. LOC and MUR including also all samples from HLG, formed a separate clade with one base pair difference to the major haplotype cluster. Yet another separation, i.e. two base pair difference, and thus a unique mitochondrial haplotype was exhibited by the southernmost population AMO. The Atlantic Arctic and Pacific Arctic mitotypes (McDevit and Saunders, 2010) differed from the main haplotype by four and five substitutions, respectively.
3.2 Saccharina latissima across latitudes
The results of all calculated correlations are summarized in Figure 3A. All statistical details can be found in the Supplementary (Table S.2).
3.2.1 Morphology vs. abiotic data
SST revealed a moderate positive correlation with length:width, since sporophytes grew overall wider in colder regions. The length:width ratio was not significantly affected by sampling depth or by salinity, although, the overall size (length and width) of the samples decreased with increasing salinity. The sporophytes sampled in MUR and AMO were considerably smaller than the other samples (Table S.1).
3.2.2 Biochemistry vs. abiotic data
Mannitol did not correlate with SST or sampling depth, but showed a moderate negative correlation with salinity, thus revealing lower mannitol concentrations at higher salinities. A moderate negative correlation between phlorotannin content and sampling depth was detected, with lower concentrations measured in samples from greater depth, but there was no correlation with salinity or SST. Higher SST led to enhanced total C as well as increased total nitrogen (N) concentrations, resulting in an unchanged C:N ratio. In contrast, C:N revealed a strong negative correlation with salinity, although this can be entirely ascribed to the remarkably high N concentrations (Table S.1) in the samples from MUR and AMO (SA 35). Neither C:N, nor total C or total N correlated with sampling depth.
3.2.3 Morphology vs. biochemistry
A moderate positive correlation was detected between mannitol content and length, but not width, resulting in a moderately positive correlation with length:width. For phlorotannins, no correlations with morphological parameters were detected across latitudes. C:N showed weak negative correlation with length, but not with width or length:width. Total C did not correlate with morphology, thus, any variation in C:N was entirely based on the reduced total N in larger sporophytes.
3.3 Saccharina latissima along a salinity gradient
The results of all calculated correlations are summarized in Figure 3B. All statistical details can be found in the Supplementary(Table S.2).
3.3.1 Morphology vs. abiotic data
Comparable to the latitudinal data, SST was strongly negatively correlated with the sporophyte width, with samples growing wider at lower temperatures, resulting in a moderate positive correlation of SST and length:width. Strong positive correlations were found between salinity and both length and width. Samples were considerably smaller at lower salinities, however, length:width did not change with salinity. The morphological appearance was not affected by different sampling depth along the salinity gradient.
3.3.2 Biochemistry vs. abiotic data
Mannitol did not correlate with SST or sampling depth, but showed a strong negative correlation with salinity. In contrast to the latitudinal data-set, mannitol was significantly lower in populations with low salinity such as the Baltic Sea. Phlorotannins were not significantly correlated to any of the three abiotic parameters. There was no correlation of C:N and SST or salinity, however, a strong positive correlation was found with sampling depth, since total C correlated strongly positively and total N correlated moderately negatively with depth.
3.3.3 Morphology vs. biochemistry
Strong positive correlations were detected between mannitol and both length and width, leading to comparable length:width ratios, even though the overall size significantly decreased along the salinity gradient. Phlorotannins revealed a strong positive correlation with length, but not width, which was reflected in the strong positive correlation with length:width. C:N correlated moderately positively with both length and width, and accordingly, no correlation with length:width was found. Comparable to the latitudinal data-set, total N increased with decreasing overall size of the sporophytes. Furthermore, a moderate positive correlation was found between length and total C. However, these differences were not reflected in a correlation between total N or total C and length:width.
3.4 Habitat-specificity of biochemical profiles
The above results clearly highlight that different abiotic conditions affect the morphology and also have a significant impact on the biochemical composition of S. latissima. Furthermore, we could show that some biochemical parameters revealed significant differences with their morphological appearance, which was not based on autocorrelation with the abiotic parameters. Individual effects of length and width were overall well reflected by the impact of length:width on the parameters. Thus, to exclude purely significant implications of morphology on the biochemical profile, we combined the morphological appearance (length:width) and the biochemical composition of S. latissima in the PCA plot (Figure 4). Most populations clustered closely together, but the dispersion within some of the populations was very high. No patterns reflecting the distribution across latitudes or along a salinity gradient were detectable, also not, when latitudinal and Baltic samples were plotted separately (Figures S2A, S3A). Although the size of the specimens considerably decreased along the Baltic Sea, the populations did not separate from the fully marine ones. Thus, morphological differences in size were not reflected in the overall biochemical signatures. Exclusively HLG and RUN_r, which were both conspicuously long and narrow (Figure 2), and RUN_s, collected at a sandy beach, slightly separated from the other populations. Additionally, each biochemical parameter was plotted separately (see Figures S2C, D, S3C, D), but no geographical patterns were detectable. Consequently, no distinction in the overall biochemical profiles of the populations in terms of their distribution could be determined.
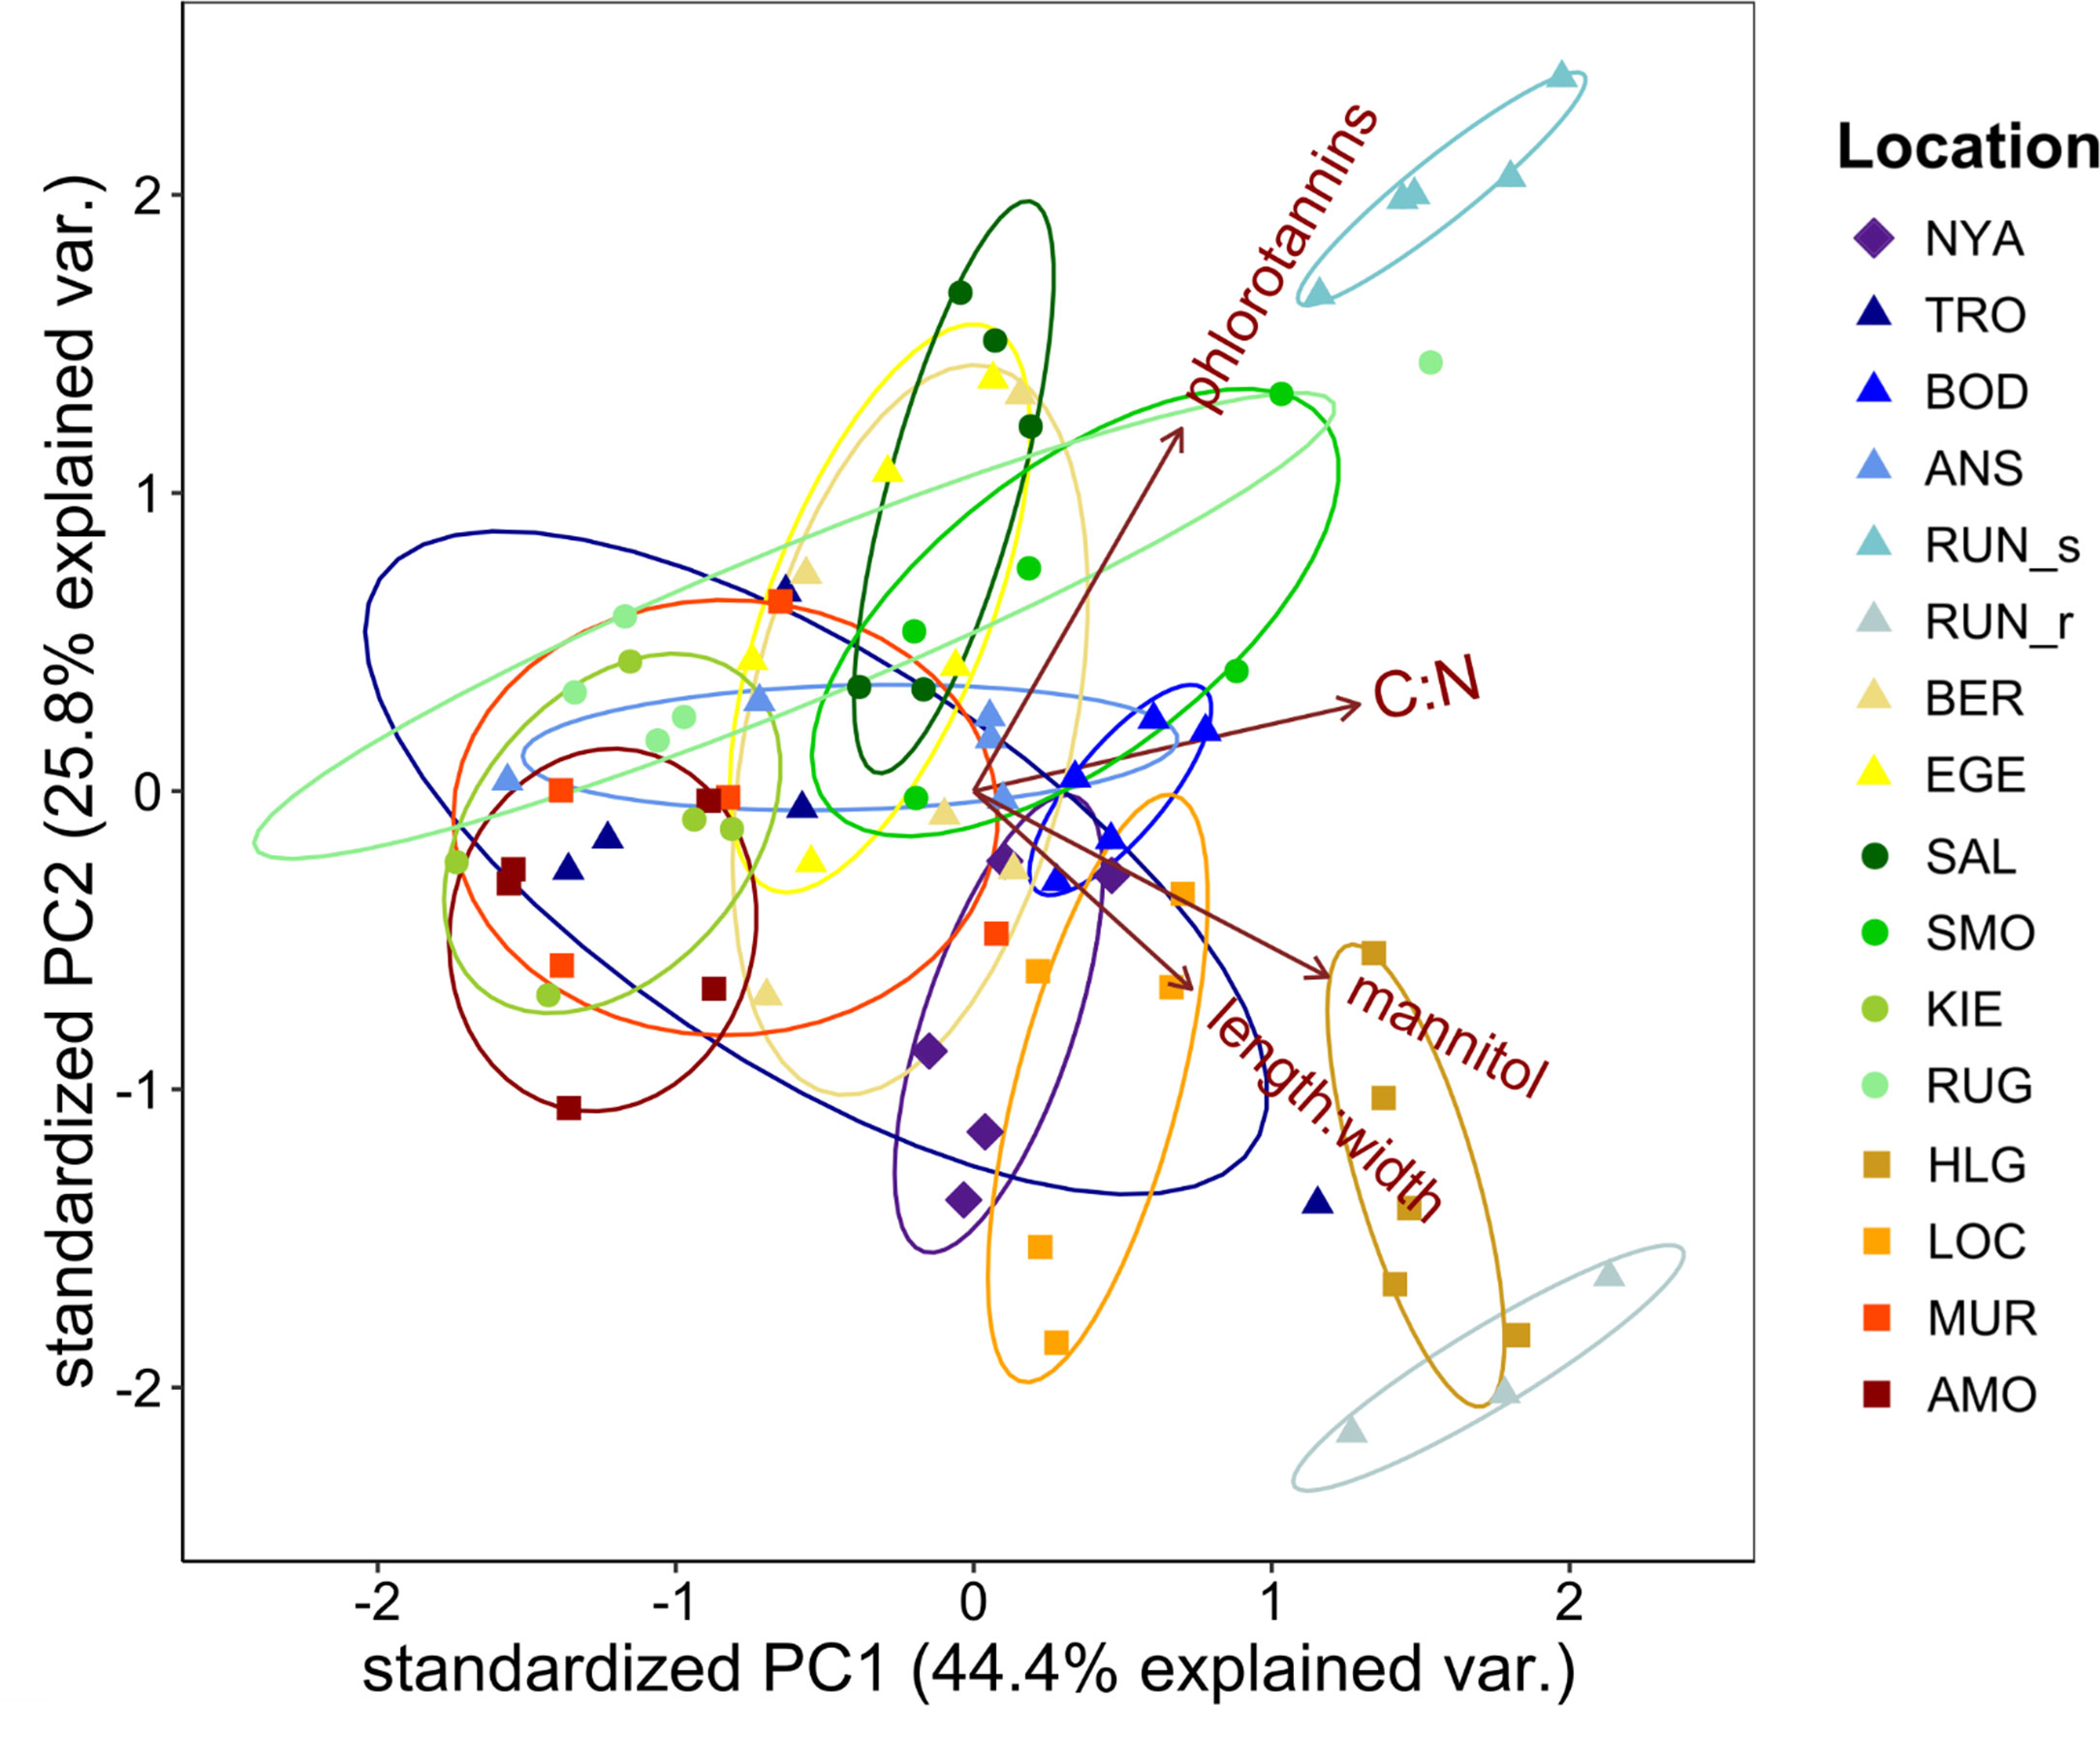
Figure 4 Combined score- & biplot of the first two principal components (PC) of the principal component analyses (PCA) performed on samples of Saccharina latissima from different sample locations along the European coast. Plotted are the length to width ratio (length:width) and biochemical compounds (mannitol, carbon to nitrogen ratio [C:N], phlorotannins). The arrows represent the loadings of each PCA. Sampling locations are indicated by different colors. Different shapes represent hydrographic regions of the samples: ♦ = Arctic (Spitsbergen), ▲ = Norwegian Sea, ■ = North Sea/North Atlantic, ● = Baltic Sea. Each point represents one individual. For coding of collection sites see Figure 1A.
We generated heatmaps, separately for each data-set, to reveal whether any of the biochemical parameters alone support site-specific differentiations (Figure 5). Neither of the three parameters of the latitudinal data-set displayed distinct patterns regarding distribution. Concerning the data-set for the Baltic Sea, no clear patterns could be identified for phlorotannins, C:N, total C or total N. Mannitol, however, revealed a clear pattern along the salinity gradient.
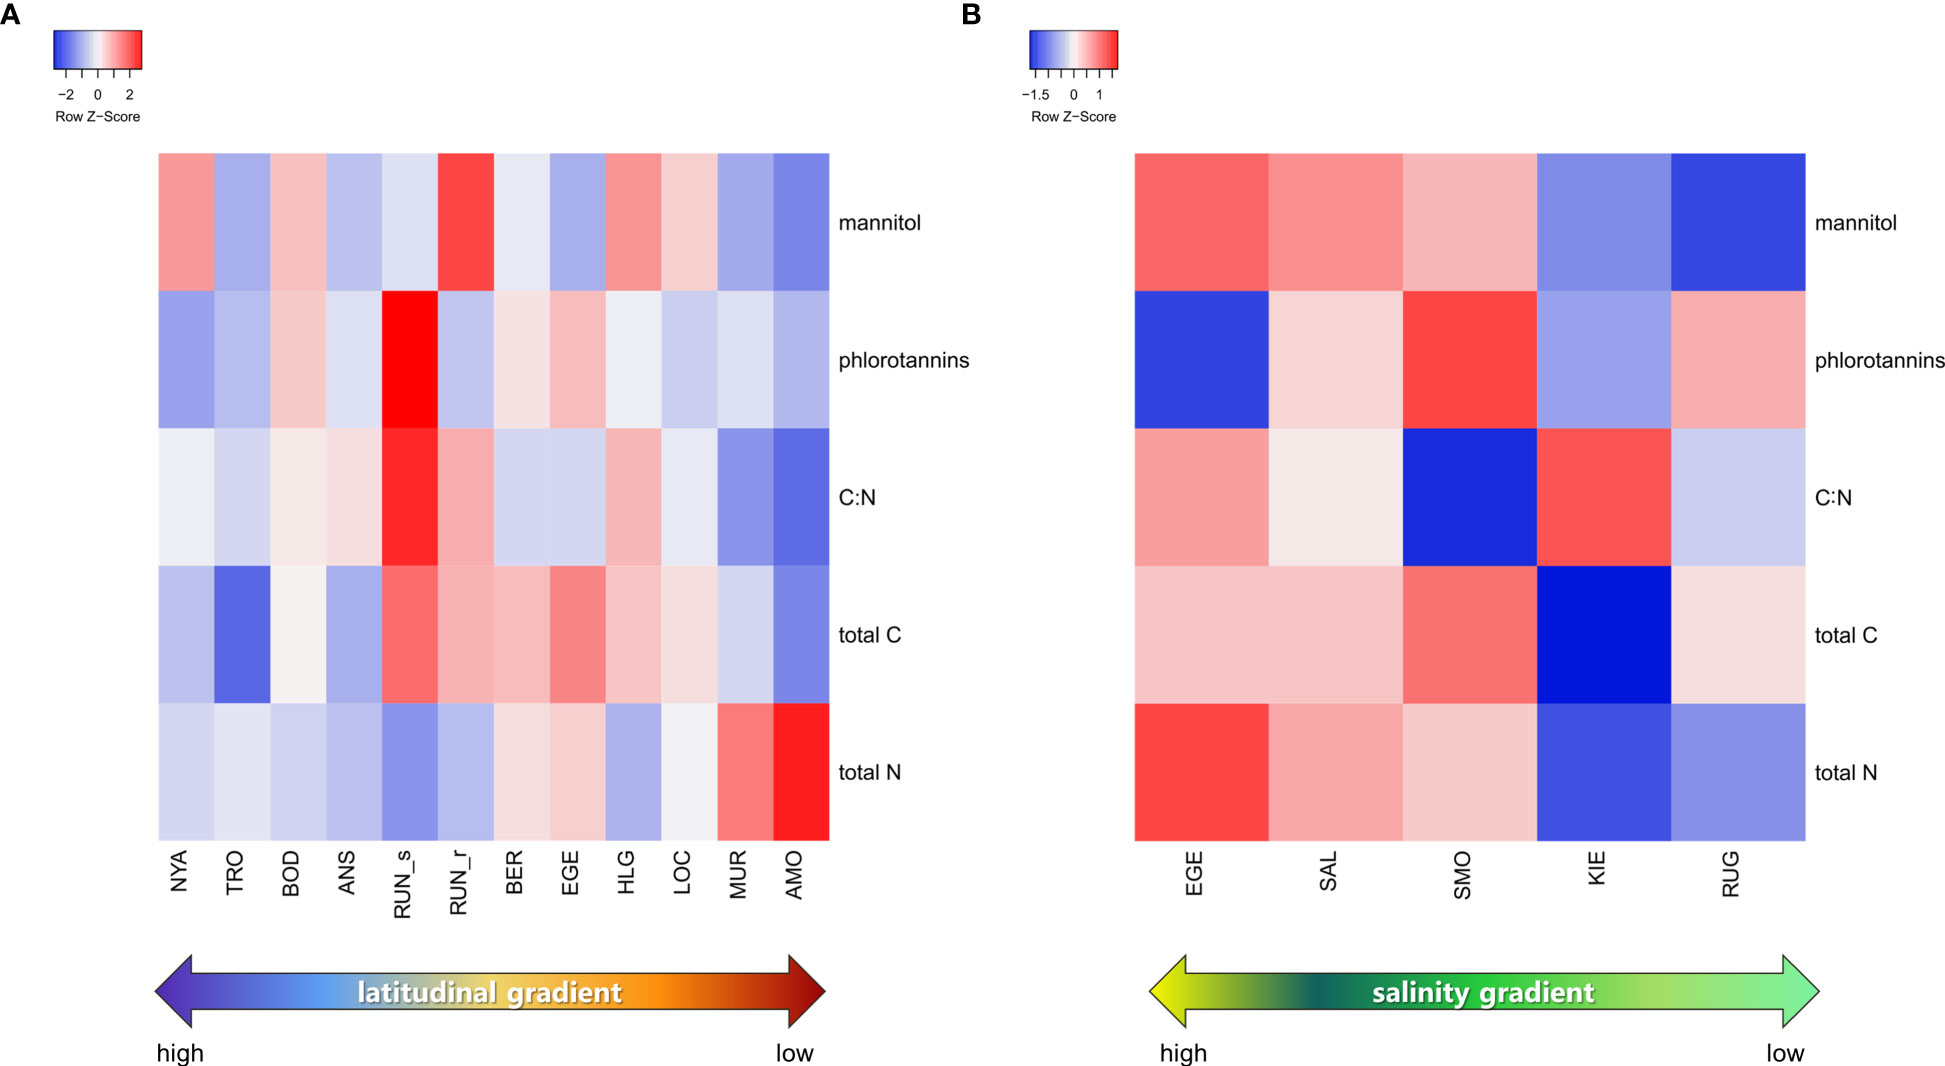
Figure 5 Heatmap graphs of the biochemical characteristics of Saccharina latissima plotted according to their geographical variation (A) along a latitudinal gradient and (B) along a salinity gradient. For coding of collection sites see Figure 1A.
4 Discussion
This pioneering study on kelps integrates for the first time morphological, biochemical, genetic and geographic data (Bolton, 2010), thereby providing important information on the intraspecific variability of the broadly distributed Saccharina latissima across European coastal waters. Considerable imprints of local abiotic conditions on the morphology and the biochemical composition of S. latissima were detected. However, for more profound comparison of geographical patterns, biochemical profiles, and genetic variability, comprehensive genetic analyses following the study designs outlined in Camus et al. (2018), Wernberg et al. (2018), Liesner et al. (2020), and Mao et al. (2020) have to be conducted.
4.1 Morphological profiles along gradients
The morphology of S. latissima was highly influenced by various abiotic conditions, such as salinity that strongly affected the size of the field sporophytes, since specimens got smaller across the Baltic Sea following the salinity gradient from West to East (Lüning, 1990; Nielsen et al., 2014; Bruhn et al., 2016). Also, an effect of SST on morphology was determined, both along latitudes and the salinity gradient. Higher temperatures increase biofouling of the distal part (e.g. Bruhn et al., 2016), and thus might also have affected the frond length in our study. Still, we observed that sporophytes grew wider in colder regions and therefore revealed smaller length:width. However, it has to be noted that different growth activity across latitudes (Diehl et al., 2021) and also seasonal timing and age (Sjøtun, 1993) might influence the morphological appearance. Even though sampling depth has been shown to affect frond length of cultivated S. latissima (Forbord et al., 2020), depth did not correlate with size in our study. Furthermore, wave exposure has long been known to strongly influence the morphology of S. latissima (e.g. Gerard, 1987; Lüning, 1990; Visch et al., 2020; Zhu et al., 2021). In more exposed habitats, sporophytes of S. latissima form narrow blades with solid stipes, while they exhibit broad blades with hollow stipes in more sheltered habitats. Our observations are in accordance with those descriptions, since, for example, the sampling location in ANS was situated in a protected bay, while HLG and RUN_r were both rather wind- and wave-exposed habitats. Regardless of their latitudinal distribution, it is reasonable to assume that the morphology of S. latissima appeared to be mostly affected by hydro-dynamic forces.
4.2 Biochemical profiles along gradients
The impacts of different abiotic factors on the morphology and biochemistry of kelps are well studied (Lüning, 1990; Bartsch et al., 2008; Karsten, 2008; Wiencke and Bischof, 2012; Hurd et al., 2014; and references therein). However, to our knowledge, this study is the first to investigate links between morphological appearance and biochemical composition across a large biogeographical range.
Mannitol, as the main photosynthetic product of Phaeophyceae is directly affected by light and temperature (Iwamoto and Shiraiwa, 2005; Gylle et al., 2009; Diehl et al., 2020; Monteiro et al., 2021). Still, we did not detect significant correlations between mannitol and SST or sampling depth, neither across latitudes nor in the Baltic data-set, but with salinity. In kelps, lower salinity leads to lower intracellular hyperosmotic stress, resulting in less synthesis and accumulation of the organic osmolyte and “compatible solute” mannitol (Kirst, 1989; Karsten, 2012; Diehl et al., 2020; Monteiro et al., 2021). We can confirm this effect along the strong salinity gradient across the Baltic Sea, but not along the different latitudes, where, however, mannitol concentrations were positively correlated with increasing blade length instead. The storage of carbohydrates is not only dependent on salinity but also on growth activity, i.e. during slow growth periods, fully-grown sporophytes may accumulate more mannitol compared to periods of high growth (Johnston et al., 1977; Schiener et al., 2015). Samples from MUR and AMO were comparatively small. Accordingly, the inverse correlation between mannitol and salinity can most likely be attributed to the size of these samples.
The C:N ratio reflects the nutrient status of seaweeds (Hurd et al., 2014), though impact of temperature (Graiff et al., 2015) and salinity (Jiménez and Niell, 1991; Gordillo et al., 2002) and their interaction (Mandal et al., 2015; Diehl et al., 2020) have been reported for brown algae and other seaweeds. In this study, C:N was not affected by the ambient SST, while salinity might have a small effect. In contrast to previous studies, we neither detected a decrease in total C at the higher salinities in the Baltic Sea (Nielsen et al., 2016a) nor an increase in total N under hyposaline conditions (Diehl et al., 2020). The nutrient concentration in the environment is a critical factor for the morphological appearance and biochemical composition of S. latissima (Lüning, 1990). While S. latissima showed acclimation to different temperature and salinity conditions within 24h (Li et al., 2020; Monteiro et al., 2021), nutrients can be intracellularly stored in high concentrations for times when they are limited. Summarizing, potential effects of salinity and SST in nature are excelled by nutrient conditions. Unfortunately, due to the geographical spread of our study sites, nutrient monitoring was beyond the scope of our study. C:N can also be affected by many other factors. Total C constitutes all carbohydrates, including alginate, cellulose and other cell wall polysaccharides, and is influenced by tissue structure and thus wave exposure (Peters et al., 2005; Amsler, 2008; Visch et al., 2020), while tissue N can be also affected by wave exposure (Visch et al., 2020). We observed varying amounts of mucilage in the sporophytes during sampling, suggesting differing polysaccharide contents. Nevertheless, C:N variations in our sampling campaign were mainly based on lower total N content and not on increased total C.
Phlorotannins are important components of cell walls (Schoenwaelder and Clayton, 1999), enhancing tissue strength (Simonson et al., 2015). This purpose could not be confirmed for specimens collected along the latitudinal gradient, although higher phlorotannins content was found in some larger and sturdier individuals from the Baltic Sea. Phlorotannins also serve as photo-protective compounds and anti-herbivory defense in brown algae (Amsler, 2008; Bartsch et al., 2008; and references therein). Irradiance and feeding pressure generally decrease with water depth, and a weak negative correlation regarding depth was found in the latitudinal data-set. We did not monitor for grazing on S. latissima populations, however, the collected samples showed no evidence of intense herbivory. It is however known that the light regime not only changes with water depth, it also varies across latitudes and is affected, for instance, by tidal range, sedimentation or day length (Morel, 1991; Hanelt et al., 2001; Rozema et al., 2002). Conspicuously higher phlorotannin concentrations were measured in samples from RUN_s, which were growing on solitary rocks in a sandy habitat. The albedo effect of sand surfaces might have exposed the individuals to higher, even stressful light conditions (Chadyšiene and Girgždys, 2008), resulting in increased phlorotannin content. Accordingly, individuals growing in dense shaded kelp forests, such as in RUN_r, HLG, or LOC, contained comparatively low levels of phlorotannins (Table S.1).
4.3 Phylogenetics
While genetic sequence comparisons consistently confirmed identity of our specimens as S. latissima, the haplotype network failed to separate distinct genetic clusters according to biogeographic distribution. Populations from the Baltic Sea did not separate from fully marine ones, yet the southern populations from HLG to AMO had a slightly different haplotype, even though still closely related, which is consistent with prior studies (Luttikhuizen et al., 2018). Luttikhuizen et al. (2018) reported close relationships among their different S. latissima populations but also slight differentiation between samples from southern Norway and Brittany within a haplotype network based on the mitochondrial COI marker. Also based on COI, Neiva et al. (2018) considered S. latissima along the North East Atlantic coast as one phylogenetic group. However, using more sensitive molecular markers such as microsatellites, let to differentiations along the North East Atlantic coast (northern and southern clusters; Neiva et al., 2018) as well as for populations from the Baltic Sea (Nielsen et al., 2016b). Nevertheless, no major genetic variations were detected along the coast of Norway (Ribeiro et al., 2022).
Using single nucleotide polymorphisms (SNPs), Guzinski et al. (2020) investigated genetic connectivity of S. latissima populations across the same latitudinal distribution range as in the present study. They did not observe significant variations in genetic diversity with latitude, but demonstrated a high degree of inter-population differentiation, indicating that this kind of marker is more suited to complement intraspecific studies on biochemical and morphological variability.
Although application of COI has some limitation, it revealed in our study for the Portuguese samples (AMO) a unique mitochondrial haplotype. These results are consistent with the genetic differentiation based on SNPs of the nearby population (CAS) given in Guzinski et al. (2020). Overall, the consistencies between SNPs and COI detected here indicate some deep evolutionary roots that emphasize the unique genetic composition of warm edge populations.
4.4 Habitat-specific signatures in Saccharina latissima?
Different populations are often treated as homogenous physiological units, independent of the species’ distribution (Reed et al., 2011). However, a direct comparison of different populations of the same kelp species is difficult as they exhibit habitat-specific physiological traits (King et al., 2018; Liesner et al., 2020; Martins et al., 2020; Diehl et al., 2021). For that reason, we aimed to characterize habitat-specific biochemical signatures in S. latissima.
Mannitol, C:N and phlorotannins are among the most important response variables reflecting stress responses in S. latissima and are strongly affected by the monitored abiotic parameters (Bartsch et al., 2008; Zhang and Thomsen, 2019; and references therein). We found dependencies of the different biochemical to the morphological and abiotic parameters, and of the morphologic to the abiotic parameters. Still, contrary to our hypothesis, the profiles in our study did not pinpoint the biogeographical origin, as S. latissima did not exhibit habitat-specific biochemical signatures. Consequently, to actually reveal habitat-specific signatures, corresponding to the geographical distribution, more specific biochemical traits may need to be studied, such as unique lipidomic profiles as observed in S. latissima from France, Great Britain and Norway (Monteiro et al., 2020).
While major impacts of salinity were determined for morphology and biochemical profiles of S. latissima, the Baltic samples did not separate from the fully marine populations, neither in their biochemical signature, nor in their haplotypes. Long-term selective effects can generate genetic diversity along gradients, eventually resulting in the emergence of ecotypes (Parmesan, 2006; Nicotra et al., 2010; King et al., 2018). These comprise populations that are locally adapted and thus phenotypically and genetically differentiated from specimens of other geographic regions (Conner and Hartl, 2004). Gene flow between populations generally depends on the dispersal capacity of a species, which is known to be limited in kelps compared to other marine organisms, for instance due to the absence of rocky substrates in potential new habitats and other dispersal barriers (Bolton, 2010; Valero et al., 2011). Luttikhuizen et al. (2018) suggested that intraspecific genetic differentiation of S. latissima in Europe is expected to increase, if population structures are left undisturbed, since the equilibrium of population differentiation is not yet reached. Hence, a further distinction of populations and the accomplishment of equilibrium would support the evolution of ecotypes or even further genetic differentiation within the species complex (Luttikhuizen et al., 2018). We did not detect distinct haplotypes in the sampled S. latissima populations, thus supporting the afore-mentioned hypothesis. Indeed, the fact that we could not identify habitat-specific traits and that the evaluated parameters were highly plastic and correlated with the abiotic conditions, rather than with geographical origin, suggest traits of high phenotypic plasticity in S. latissima instead of the existence of genetically fixed ecotypes. Nevertheless, traits of high plasticity might also be exhibited by ecotypically differentiated species, even though they are genetically fixed to a local optimum (de Jong, 2005). In fact, the separation of the southernmost populations in our haplotype network supports the assumption, that intraspecific separation of S. latissima is still an ongoing process and not completed yet (Luttikhuizen et al., 2018). Genetic and ecotypic differentiation could be intermitted by climatic changes, e.g. by rising temperatures and hyposaline conditions, which impose increasing threats on marine ecosystems (IPCC, 2019). The expected shift in macroalgal communities, as a result of changing habitats (Müller et al., 2009; Assis et al., 2018), will potentially disturb population structures and hence, speciation.
In summary, even though no habitat-specific biochemical profiles could be established in our study, marked imprints of abiotic conditions on the biochemical composition of S. latissima were detected. In the Baltic Sea, a separated phylogroup could not be detected. Differentiations have not manifested genetically, i.e. are not reflected in COI-5P diversity. While we are aware that our conclusions are based on small sampling sizes and single measurements at each location, we can still conclude that this study provides a basis for subsequent studies assessing the intraspecific diversity of S. latissima. For more comprehensive results, genetic analyses based on more sensitive markers and additional biochemical or environmental parameters are essential in future studies on combined genetic and phenotypic diversity. Our study demonstrates that morphological and biochemical traits of S. latissima are not strongly correlated with changing abiotic parameters across the broad latitudinal gradient. Accordingly, S. latissima along the European latitudinal gradient are well suited for Genotype-Environment Association (GEA) studies, including morphological and biochemical data for each genotyped individual.
Data availability statement
All raw data analyzed for this study can be found in the PANGAEA Database (https://doi.pangaea.de/10.1594/PANGAEA.947037). COI-5P sequences were deposited in GenBank under the accession no.s ON661800-ON661872.
Author contributions
ND, UK, KB and SH planned the study. ND conducted the biochemical analysis. ND, NS and SH conducted the molecular analyses. ND and NS run the statistical analyses. UK provided the facilities for the molecular and biochemical analyses. KB and SH supervised the project. All authors contributed to the data interpretation and discussion. ND and SH wrote the manuscript, which was reviewed, revised, and approved by all co-authors.
Funding
The genetic analyses were funded by the Kellner & Stoll – Stiftung für Klima und Umwelt. The study was further supported by the 2015–2016 BiodivERsA COFUND call for research proposals (program MARFOR), with the national funder German Research Foundation (DFG; grant no. VA 105/25-1), the DFG via the SPP 1158 Antarctic Research (Coordination; grant no. KA899/30-13 to UK, University of Rostock) and the project FACE-IT (The Future of Arctic Coastal Ecosystems – Identifying Transitions in Fjord Systems and Adjacent Coastal Areas). FACE-IT has received funding from the European Union’s Horizon 2020 research and innovation programme under grant agreement No 869154.
Acknowledgments
The authors are very grateful to the colleagues helping to collect Saccharina latissima all over Europe: S. Matsson (Akvaplan-Niva, Norway; with support from the MACROSEA project: RCN project254883) in Tromsø, M. Roleda in Bodø, S. Steinhagen in Egersund, Saltø und Smøgen, K. Romoth in Rügen, A. Wagner in Helgoland, M. Valero, C. Destombe and L. Fouqueau in Locmariaquer and C. Monteiro in Muro and Amorosa. Thank you for the support at the field stations in Runde, Bergen and Ny-Ålesund. All sampling was conducted in accordance with the legislations on the Access to Genetic Resources and Benefit-Sharing. Thank you to the Scientific Diving Teams in Ny-Ålesund and on Helgoland for the help in collecting. B. Iken (University of Bremen) supported the sampling campaign in Norway 2018 and the pigment analyses. J. Müller (University of Rostock) ran the C:N analyses. Thank you to Kellner & Stoll – Stiftung für Klima und Umwelt for funding the genetic analyses. This study was further supported by the 2015–2016 BiodivERsA COFUND call for research proposals (program MARFOR), with the national funder German Research Foundation (DFG; grant no. VA 105/25-1). SH acknowledges support from the DFG via the SPP 1158 Antarctic Research (Coordination; grant no. KA899/30-13 to UK, University of Rostock). This study was also conducted in the frame of the project FACE-IT (The Future of Arctic Coastal Ecosystems – Identifying Transitions in Fjord Systems and Adjacent Coastal Areas). FACE-IT has received funding from the European Union’s Horizon 2020 research and innovation programme under grant agreement No 869154.
Conflict of interest
The authors declare that the research was conducted in the absence of any commercial or financial relationships that could be construed as a potential conflict of interest.
Publisher’s note
All claims expressed in this article are solely those of the authors and do not necessarily represent those of their affiliated organizations, or those of the publisher, the editors and the reviewers. Any product that may be evaluated in this article, or claim that may be made by its manufacturer, is not guaranteed or endorsed by the publisher.
Supplementary material
The Supplementary Material for this article can be found online at: https://www.frontiersin.org/articles/10.3389/fmars.2023.995982/full#supplementary-material
References
Acker J. G., Leptoukh G. (2007). Online analysis enhances use of NASA earth science data. Eos Trans. Am. Geophys. Union 88, 14–17. Available at: https://giovanni.gsfc.nasa.gov/giovanni/.
Amsler C. D. (2008). Algal chemical ecology. Ed. Amsler C. D. (Berlin Heidelberg, Germany: Springer-Verlag Berlin Heidelberg).
Araújo R. M., Assis J., Aguillar R., Airoldi L., Bárbara I., Bartsch I., et al. (2016). Status, trends and drivers of kelp forests in Europe: an expert assessment. Biodivers. Conserv. 25, 1319–1348. doi: 10.1007/s10531-016-1141-7
Assis J., Araújo M. B., Serrão E. A. (2018). Projected climate changes threaten ancient refugia of kelp forests in the north Atlantic. Glob. Change Biol. 24, e55–e66. doi: 10.1111/gcb.13818
Babicki S., Arndt D., Marcu A., Liang Y., Grant J. R., Maciejewski A., et al. (2016). Heatmapper: web–enabled heat mapping for all. Nucleic Acids Res. 44, 147–153. doi: 10.1093/nar/gkw419
Bartsch I., Wiencke C., Bischof K., Buchholz C. M., Buck B. H., Eggert A., et al. (2008). The genus Laminaria sensu lato: recent insights and developments. Eur. J. Phycol. 43, 1–86. doi: 10.1080/09670260701711376
Baschek B., Schroeder F., Brix H., Riethmüller R., Badewien T. H., Breitbach G., et al. (2017). The coastal observing system for northern and Arctic seas (COSYNA). Ocean Sci. 13, 379–410.
Bekkby T., Moy F. E. (2011). Developing spatial models of sugar kelp (Saccharina latissima) potential distribution under natural conditions and areas of its disappearance in skagerrak. Estuar. Coast. Shelf Sci. 95, 477–483. doi: 10.1016/j.ecss.2011.10.029
Bischof K., Buschbaum C., Fredriksen S., Gordillo F. J. L., Heinrich S., Jiménez C., et al. (2019). “Kelps and environmental changes in kongsfjorden: stress perception and responses,” in The ecosystem of kongsfjorden, svalbard. advances in polar ecology. Eds. Hop H., Wiencke C. (Cham: Springer International, Published AG, Switzerland), 373–422. doi: 10.1007/978-3-319-46425-1_10
Bischof K., Hanelt D., Tüg H., Karsten U., Brouwer P. E. M., Wiencke C. (1998). Acclimation of brown algal photosynthesis to ultraviolet radiation in Arctic coastal waters (Spitsbergen, Norway). Polar Biol. 20, 388–395. doi: 10.1007/s003000050319
Bolton J. J. (2010). The biogeography of kelps (Laminariales, phaeophyceae): a global analysis with new insights from recent advances in molecular phylogenetics. Helgol. Mar. Res. 64, 263–279. doi: 10.1007/s10152-010-0211-6
Bolton J. J., Lüning K. (1982). Optimal growth and maximal survival temperatures of Atlantic Laminaria species (Phaeophyta) in culture. Mar. Biol. 66, 89–94. doi: 10.1007/BF00397259
Breitbach G., Krasemann H., Behr D., Beringer S., Lange U., Vo N., et al. (2016). Accessing diverse data comprehensively - CODM, the COSYNA data portal. Ocean Sci. 12, 909–923. doi: 10.5194/os-12-909-2016
Bruhn A., Tørring D. B., Thomsen M., Canal-Vergés P., Nielsen M. M., Rasmussen M. B., et al. (2016). Impact of environmental conditions on biomass yield , quality, and bio-mitigation capacity of Saccharina latissima. Aquac. Environ. Interact. 8, 619–636. doi: 10.3354/aei00200
Camus C., Faugeron S., Buschmann A. H. (2018). Assessment of genetic and phenotypic diversity of the giant kelp, Macrocystis pyrifera, to support breeding programs. Algal Res. 30, 101–112. doi: 10.1016/j.algal.2018.01.004
Chadyšiene R., Girgždys A. (2008). Ultraviolet radiation albedo of natural surfaces. J. Environ. Eng. Landsc. Manage. 16, 83–88. doi: 10.3846/1648-6897.2008.16.83-88
Cohen J. (1988). Statistical power analysis for the behavioral sciences. 2nd ed (New York: Lawrence Erlbaum Associates, United States of America).
Conner J. K., Hartl D. (2004). A primer of ecological genetics (Sunderland, USA: Sinauer Associates Incorporated).
Dayton P. K. (1985). Ecology of kelp communities. Annu. Rev. Ecol. Syst. 16, 215–245. doi: 10.1146/annurev.ecolsys.16.1.215
de Jong G. (2005). Evolution of phenotypic plasticity: patterns of plasticity and the emergence of ecotypes. New Phytol. 166, 101–118. doi: 10.1111/j.1469-8137.2005.01322.x
Diehl N., Bischof K. (2021). Coping with a changing Arctic: mechanisms of acclimation in the brown seaweed Saccharina latissima from spitsbergen. Mar. Ecol. Prog. Ser. 657, 43–57. doi: 10.3354/meps13532
Diehl N., Karsten U., Bischof K. (2020). Impacts of combined temperature and salinity stress on the endemic Arctic brown seaweed Laminaria solidungula j. agardh. Polar Biol. 43, 647–656. doi: 10.1007/s00300-020-02668-5
Diehl N., Roleda M. Y., Bartsch I., Karsten U., Bischof K. (2021). Summer heatwave impacts on the European kelp Saccharina latissima across its latitudinal distribution gradient. Front. Mar. Sci. 8. doi: 10.3389/fmars.2021.695821
Forbord S., Matsson S., Brodahl G. E., Bluhm B. A., Broch O. J., Handå A., et al. (2020). Latitudinal, seasonal and depth-dependent variation in growth, chemical composition and biofouling of cultivated Saccharina latissima (Phaeophyceae) along the Norwegian coast. J. Appl. Phycol. 32, 2215–2232. doi: 10.1007/s10811-020-02038-y
Fortes M. D., Lüning K. (1980). Growth rates of north Sea macroalgae in relation to temperature, irradiance and photoperiod. Helgoländer Meeresuntersuchungen 34, 15–29. doi: 10.1007/BF01983538
Gerard V. A. (1987). Hydrodynamic streamlining of Laminaria saccharina lamour. in response to mechanical stress. J. Exp. Mar. Bio. Ecol. 107, 237–244. doi: 10.1016/0022-0981(87)90040-2
Gerard V. A., DuBois K., Greene R. (1987). Growth responses of two Laminaria saccharina populations to environmental variation. Hydrobiologia, 229–232. doi: 10.1007/BF00046134
Gordillo F. J. L., Dring M. J., Savidge G. (2002). Nitrate and phosphate uptake characteristics of three species of brown algae cultured at low salinity. Mar. Ecol. Prog. Ser. 234, 111–118. doi: 10.3354/meps234111
Graiff A., Bartsch I., Ruth W., Wahl M., Karsten U. (2015). Season exerts differential effects of ocean acidification and warming on growth and carbon metabolism of the seaweed Fucus vesiculosus in the western Baltic Sea. Front. Mar. Sci. 2. doi: 10.3389/fmars.2015.00112
Griekspoor A., Tom Groothuis T. (2015) 4Peaks. Available at: https://www.nucleobytes.com/.
Guzinski J., Mauger S., Cock J. M., Valero M. (2016). Characterization of newly developed expressed sequence tag-derived microsatellite markers revealed low genetic diversity within and low connectivity between European Saccharina latissima populations. J. Appl. Phycol. 28, 3057–3070. doi: 10.1007/s10811-016-0806-7
Guzinski J., Ruggeri P., Ballenghien M., Mauger S., Jacquemin B., Jollivet C., et al. (2020). Seascape genomics of the sugar kelp Saccharina latissima along the north eastern Atlantic latitudinal gradient. Genes (Basel). 11, 1503. doi: 10.3390/genes11121503
Gylle A. M., Nygard C. A., Ekelund N. G. A. (2009). Desiccation and salinity effects on marine and brackish Fucus vesiculosus l. (Phaeophyceae). Phycologia 48, 156–164. doi: 10.2216/08-45.1
Hanelt D., Tüg H., Bischof K., Groß C., Lippert H., Sawall T., et al. (2001). Light regime in an Arctic fjord: a study related to stratospheric ozone depletion as a basis for determination of UV effects on algal growth. Mar. Biol. 138, 649–658. doi: 10.1007/s002270000481
Heesch S., Rindi F., Guiry M. D., Nelson W. A. (2020). Molecular phylogeny and taxonomic reassessment of the genus Cladostephus (Sphacelariales, phaeophyceae). Eur. J. Phycol. 55, 426–443. doi: 10.1080/09670262.2020.1740947
Hurd C. L., Harrison P. J., Bischof K., Lobban C. S. (2014). Seaweed ecology and physiology. 2nd ed. (Cambridge: Cambridge University Press).
IPCC (2019). “IPCC special report on the ocean and cryosphere in a changing climate,” in Intergovernmental panel on climate change. Eds. Pörtner H.-O., Roberts D. C., Masson-Delmotte V., Zhai P., Tignor M., Poloczanska E., et al. Available at: https://www.ipcc.ch/srocc/chapter/summary-for-policymakers/.
Iwamoto K., Shiraiwa Y. (2005). Salt-regulated mannitol metabolism in algae. Mar. Biotechnol. 7, 407–415. doi: 10.1007/s10126-005-0029-4
Jiménez C., Niell F. X. (1991). Influence of temperature and salinity on carbon and nitrogen content in Dunaliella viridis teodoresco under nitrogen sufficiency. Bioresour. Technol. 38, 91–94. doi: 10.1016/0960-8524(91)90136-8
Johnston C. S., Jones R. G., Hunt R. D. (1977). A seasonal carbon budget for a laminarian population in a Scottish sea-loch. Helgoländer wissenschaftliche Meeresuntersuchungen 30, 527–545.
Josse J., Husson F. (2016). missMDA: a package for handling missing values in multivariate data analysis. J. Stat. Software 70, 1–31. doi: 10.18637/jss.v070.i01
Karsten U. (2007). Salinity tolerance of Arctic kelps from spitsbergen. Phycol. Res. 55, 257–262. doi: 10.1111/j.1440-1835.2007.00468.x
Karsten U. (2008). “Defense strategies of algae and cyanobacteria against solar ultraviolet radiation,” in Algal chemical ecology. Ed. Amsler C. D. (Berlin Heidelberg, Germany: Springer Berlin Heidelberg), 273–296.
Karsten U. (2012). “Seaweed acclimation to salinity and desiccation stress,” in Seaweed biology - novel insights into ecophysiology, ecology and utilization. Eds. Wiencke C., Bischof K. (Berlin Heidelberg: Springer-Verlag Berlin Heidelberg), 87–107.
Kautsky L., Kautsky N. (2000). “The Baltic Sea, including bothnian Sea and bothnian bay,” in Seas at the millennium: an environmental evaluation. Ed. Sheppard C. R. C. (Elsevier Science Ltd).
King N. G., Mckeown N. J., Smale D. A., Moore P. J. (2018). The importance of phenotypic plasticity and local adaptation in driving intraspecific variability in thermal niches of marine macrophytes. Ecography (Cop.). 41, 1469–1484. doi: 10.1111/ecog.03186
Kirst G. O. (1989). Salinity tolerance of eukaryotic marine algae. Annu. Rev. Plant Physiol. Plant Mol. Biol. 40, 21–53. doi: 10.1146/annurev.pp.41.060190.000321
Lane C. E., Lindstrom S. C., Saunders G. W. (2007). A molecular assessment of northeast pacific Alaria species (Laminariales, phaeophyceae) with reference to the utility of DNA barcoding. Mol. Phylogenet. Evol. 44, 634–648. doi: 10.1016/j.ympev.2007.03.016
Li H., Monteiro C., Heinrich S., Bartsch I., Valentin K., Harms L., et al. (2020). Responses of the kelp Saccharina latissima (Phaeophyceae) to the warming Arctic: from physiology to transcriptomics. Physiol. Plant 168, 5–26. doi: 10.1111/ppl.13009
Liesner D., Fouqueau L., Valero M., Roleda M. Y., Pearson G. A., Bischof K., et al. (2020). Heat stress responses and population genetics of the kelp Laminaria digitata (Phaeophyceae) across latitudes reveal differentiation among north Atlantic populations. Ecol. Evol. 10, 9144–9177. doi: 10.1002/ece3.6569
Lüning K. (1984). Temperature tolerance and biogeography of seaweeds: the marine algal flora of helgoland (North Sea) as an example. Helgoländer Meeresuntersuchungen 38, 305–317. doi: 10.1007/BF01997486
Lüning K. (1990). Seaweeds - their environment, biogeography, and ecophysiology. Eds. Yarish C., Stuttgart H.K. (John Wiley & Sons, Inc).
Luttikhuizen P. C., van den Heuvel F. H. M. M., Rebours C., Witte H. J., van Bleijswijk J. D. L., Timmermans K., et al. (2018). Strong population structure but no equilibrium yet: genetic connectivity and phylogeography in the kelp Saccharina latissima (Laminariales, phaeophyta). Ecol. Evol. 8, 4265–4277. doi: 10.1002/ece3.3968
Mandal S. K., Ajay G., Monisha N., Malarvizhi J., Temkar G., Mantri V. A. (2015). Differential response of varying temperature and salinity regimes on nutrient uptake of drifting fragments of Kappaphycus alvarezii: implication on survival and growth. J. Appl. Phycol. 27, 1571–1581. doi: 10.1007/s10811-014-0469-1
Mao X., Augyte S., Huang M., Hare M. P., Bailey D., Umanzor S., et al. (2020). Population genetics of sugar kelp throughout the northeastern united states using genome-wide markers. Front. Mar. Sci. 7. doi: 10.3389/fmars.2020.00694
Martins C. D. L., Lhullier C., Ramlov F., Simonassi J. C., Gouvea L. P., Noernberg M., et al. (2014). Seaweed chemical diversity: an additional and efficient tool for coastal evaluation. J. Appl. Phycol. 26, 2037–2045. doi: 10.1007/s10811-014-0361-z
Martins N., Pearson G. A., Bernard J., Serrão E. A., Bartsch I. (2020). Thermal traits for reproduction and recruitment differ between Arctic and Atlantic kelp Laminaria digitata. PloS One 15, e0235388. doi: 10.1371/journal.pone.0235388
McDevit D. C., Saunders G. W. (2009). On the utility of DNA barcoding for species differentiation among brown macroalgae (Phaeophyceae) including a novel extraction protocol. Phycol. Res. 57, 131–141. doi: 10.1111/j.1440-1835.2009.00530.x
McDevit D. C., Saunders G. W. (2010). A DNA barcode examination of the laminariaceae (Phaeophyceae) in Canada reveals novel biogeographical and evolutionary insights. Phycologia 49, 235–248. doi: 10.2216/PH09-36.1
Monteiro C., Li H., Diehl N., Collén J., Heinrich S., Bischof K., et al. (2021). Modulation of physiological performance by temperature and salinity in the sugar kelp Saccharina latissima. Phycol. Res. 69, 48–57. doi: 10.1111/pre.12443
Monteiro J. P., Rey F., Melo T., Moreira A. S. P., Arbona J. F., Skjermo J., et al. (2020). The unique lipidomic signatures of Saccharina latissima can be used to pinpoint their geographic origin. Biomolecules 10, 107. doi: 10.3390/biom10010107
Morel A. (1991). Light and marine photosynthesis: a spectral model with geochemical and climatological implications. Prog. Oceanogr. 26, 263–306. doi: 10.1016/0079-6611(91)90004-6
Müller R., Laepple T., Bartsch I., Wiencke C. (2009). Impact of oceanic warming on the distribution of seaweeds in polar and cold-temperate waters. Bot. Mar. 52, 617–638. doi: 10.1515/BOT.2009.080
Müller J., Müller K., Neinhus C., Quandt D. (2010) PhyDE® (Phylogenetic data Editor). Available at: http://www.phyde.de/index.html.
Neiva J., Paulino C., Nielsen M. M., Krause-Jensen D., Saunders G. W., Assis J., et al. (2018). Glacial vicariance drives phylogeographic diversification in the amphi-boreal kelp Saccharina latissima. Sci. Rep. 8, 1112. doi: 10.1038/s41598-018-19620-7
Nicotra A. B., Atkin O. K., Bonser S. P., Davidson A. M., Finnegan E. J., Mathesius U., et al. (2010). Plant phenotypic plasticity in a changing climate. Trends Plant Sci. 15, 684–692. doi: 10.1016/j.tplants.2010.09.008
Nielsen M. M., Krause-Jensen D., Olesen B., Thinggaard R., Christensen P. B., Bruhn A. (2014). Growth dynamics of Saccharina latissima (Laminariales, phaeophyceae) in Aarhus bay, Denmark, and along the species’ distribution range. Mar. Biol. 161, 2011–2022. doi: 10.1007/s00227-014-2482-y
Nielsen M. M., Manns D., D’Este M., Krause-Jensen D., Rasmussen M. B., Larsen M. M., et al. (2016a). Variation in biochemical composition of Saccharina latissima and Laminaria digitata along an estuarine salinity gradient in inner Danish waters. Algal Res. 13, 235–245. doi: 10.1016/j.algal.2015.12.003
Nielsen M. M., Paulino C., Neiva J., Krause-Jensen D., Bruhn A., Serrão E. A. (2016b). Genetic diversity of Saccharina latissima (Phaeophyceae) along a salinity gradient in the north Sea-Baltic Sea transition zone. J. Phycol. 52, 523–531. doi: 10.1111/jpy.12428
Parmesan C. (2006). Ecological and evolutionary responses to recent climate change. Annu. Rev. Ecol. Evol. Syst. 37, 637–671. doi: 10.1146/annurev.ecolsys.37.091305.110100
Pehlke C., Bartsch I. (2008). Changes in depth distribution and biomass of sublittoral seaweeds at helgoland (North Sea) between 1970 and 2005. Clim. Res. 37, 135–147. doi: 10.3354/cr00767
Peters K. J., Amsler C. D., Amsler M. O., McClintock J. B., Dunbar R. B., Baker B. J. (2005). A comparative analysis of the nutritional and elemental composition of macroalgae from the western Antarctic peninsula. Phycologia 44, 453–463. doi: 10.2216/0031-8884(2005)44[453:ACAOTN]2.0.CO;2
QGIS Development Team (2019) QGIS 3.8.2-Zanzibar software. Available at: http://qgis.osgeo.org.
Reed T. E., Schindler D. E., Waples R. S. (2011). Interacting effects of phenotypic plasticity and evolution on population persistence in a changing climate. Conserv. Biol. 25, 56–63. doi: 10.1111/j.1523-1739.2010.01552.x
Ribeiro P. A., Næss T., Dahle G., Asplin L., Meland K., Fredriksen S., et al. (2022). Going with the flow – population genetics of the kelp Saccharina latissima (Phaeophyceae, laminariales). Front. Mar. Sci. 9. doi: 10.3389/fmars.2022.876420
Rozema J., Björn L. O., Bornman J. F., Gaberscik A., Häder D. P., Trost T., et al. (2002). The role of UV-b radiation in aquatic and terrestrial ecosystems - an experimental and functional analysis of the evolution of UV-absorbing compounds. J. Photochem. Photobiol. B Biol. 66, 2–12. doi: 10.1016/S1011-1344(01)00269-X
Schiener P., Black K. D., Stanley M. S., Green D. H. (2015). The seasonal variation in the chemical composition of the kelp species Laminaria digitata, Laminaria hyperborea, Saccharina latissima and Alaria esculenta. J. Appl. Phycol. 27, 363–373. doi: 10.1007/s10811-014-0327-1
Schoenwaelder M. E. A., Clayton M. N. (1999). The presence of phenolic compounds in isolated cell walls of brown algae. Phycologia 38, 161–166. doi: 10.2216/i0031-8884-38-3-161.1
Simonson E. J., Scheibling R. E., Metaxas A. (2015). Kelp in hot water: i. warming seawater temperature induces weakening and loss of kelp tissue. Mar. Ecol. Prog. Ser. 537, 89–104. doi: 10.3354/meps11438
Sjøtun K. (1993). Seasonal lamina growth in two age groups of Laminaria saccharina (L.) lamour. in Western Norway. Bot. Mar. 36, 433–442. doi: 10.1515/botm.1993.36.5.433
Stévant P., Indergård E., Ólafsdóttir A., Marfaing H., Larssen W. E., Fleurence J., et al. (2018). Effects of drying on the nutrient content and physico-chemical and sensory characteristics of the edible kelp Saccharina latissima. J. Appl. Phycol. 30, 2587–2599. doi: 10.1007/s10811-018-1451-0
Valero M., Destombe C., Mauger S., Ribout C., Engel C. R., Daguin-Thiebaut C., et al. (2011). Using genetic tools for sustainable management of kelps: a literature review and the example of Laminaria digitata. Cah. Biol. Mar. 52, 467–483. doi: 10.21411/cbm.a.a57922dd
Visch W., Nylund G. M., Pavia H. (2020). Growth and biofouling in kelp aquaculture (Saccharina latissima): the effect of location and wave exposure. J. Appl. Phycol. 32, 3199–3209. doi: 10.1007/s10811-020-02201-5
Wernberg T., Coleman M. A., Bennett S., Thomsen M. S., Tuya F., Kelaher B. P. (2018). Genetic diversity and kelp forest vulnerability to climatic stress. Sci. Rep. 8, 1851. doi: 10.1038/s41598-018-20009-9
Wiencke C., Bischof K. (2012). Seaweed biology - novel insights into ecophysiology, ecology and utilization (Heidelberg New York Dodrecht London: Springer).
Wiencke C., Vögele B., Kovaltchouk N. A., Hop H. (2004). “Species composition and zonation of marine benthic macroalgae at hansneset in kongsfjorden, Svalbard,” in The coastal ecosystem of kongsfjorden, svalbard. synopsis of biological research performed at the koldewey station in the years 1991 - 2003. Ed. Wiencke C. (Germany: Alfred Wegener Institute for Polar and Marine Research, Bremerhaven), 55–62.
Zhang X., Thomsen M. (2019). Biomolecular composition and revenue explained by interactions between extrinsic factors and endogenous rhythms of Saccharina latissima. Mar. Drugs 17, 107. doi: 10.3390/md17020107
Keywords: abiotic factors, diversity, haplotype network, PCA, phenotype, salinity, speciation, variety
Citation: Diehl N, Steiner N, Bischof K, Karsten U and Heesch S (2023) Exploring intraspecific variability – biochemical and morphological traits of the sugar kelp Saccharina latissima along latitudinal and salinity gradients in Europe. Front. Mar. Sci. 10:995982. doi: 10.3389/fmars.2023.995982
Received: 16 July 2022; Accepted: 25 May 2023;
Published: 13 June 2023.
Edited by:
Thomas Wernberg, University of Western Australia, AustraliaCopyright © 2023 Diehl, Steiner, Bischof, Karsten and Heesch. This is an open-access article distributed under the terms of the Creative Commons Attribution License (CC BY). The use, distribution or reproduction in other forums is permitted, provided the original author(s) and the copyright owner(s) are credited and that the original publication in this journal is cited, in accordance with accepted academic practice. No use, distribution or reproduction is permitted which does not comply with these terms.
*Correspondence: Nora Diehl, bmRpZWhsQHVuaS1icmVtZW4uZGU=
†ORCID: Nora Diehl, orcid.org/0000-0002-7245-340X
Niko Steiner, orcid.org/0000-0003-2559-5891
Kai Bischof, orcid.org/0000-0002-4497-1920
Ulf Karsten, orcid.org/0000-0002-2955-0757
Svenja Heesch, orcid.org/0000-0002-4531-0921