 Manuel O. Nevárez-Martínez1
 Enrique Morales-Bojórquez2*
 María de los Ángeles Martínez-Zavala1
 Héctor Villalobos3
 Marlene A. Luquin-Covarrubias2Violeta E. González-Máynez1
 Juana López-Martínez4J. Pablo Santos-Molina1
 Arelly Ornelas-Vargas3
 Francisco Delgado-Vences5
- 1Instituto Nacional de Pesca y Acuacultura, Centro Regional de Investigación Acuícola y Pesquera (CRIAP), Guaymas, Sonora, México
- 2Centro de Investigaciones Biológicas del Noroeste, La Paz, Baja California Sur, México
- 3Instituto Politécnico Nacional, Centro Interdisciplinario de Ciencias Marinas (CICIMAR), La Paz, Baja California Sur, México
- 4Programa de Ecología Pesquera, Centro de Investigaciones Biológicas del Noroeste, Guaymas, Sonora, México
- 5Universidad Nacional Autónoma de México, Instituto de Matemáticas, Oaxaca, México
Knowledge of the population dynamics and changes in the abundance of Pacific sardine fishery is relevant for fishery management. In this study, an integrated catch-at-age model (ASAP) was performed on 47 fishing seasons (1971−2018) of Sardinops sagax in the Gulf of California, including five indices of relative abundance (survey catch rate, acoustic surveys, egg and larvae, spawning probability, and bird diet index). The ASAP model showed the importance of age group 0 (recruits); this is the most important age group in the Pacific sardine fishery, and its abundance has consequences for the variability of the total abundance of the species. In this study, the spawning and acoustic indices denoted the changes in abundance of Pacific sardine population better than the survey catch rate and bird diet ratio. Historically, the total biomass is estimated to have varied from 461 thousand to 4.82 million t. In the 1970s and 1980s, a peak biomass close to three million tons was reached, and in the second peak from the mid-1990s to the late 2000s, the total biomass varied between 3.26 and 4.82 million t. When the spawning biomass was at least 750 x 103 t, the recruitment (age group 0) showed high values, promoting high catches in the subsequent years. The annual fishing mortality estimates did not show a rise related to the periods of high harvestable biomass; therefore, the catch records were low in comparison to the harvestable biomass estimated from ASAP, and the annual fishing mortalities were less than 0.22 during periods of high abundance. The changes in biomass and the variability observed in the Pacific sardine fishery were validated for the model diagnostics; the retrospective patterns did not identify poor fits to data, therefore the robustness of the model can be used for management purposes. According to the Kobe phase plot, the Pacific sardine fishery in the Gulf of California has been fully exploited with an apparent stable level of harvest.
Introduction
The Pacific sardine Sardinops sagax is distributed from Alaska, USA to Gulf of California, Mexico; and exhibits temporal variability depending on the environmental conditions, mainly the sea surface temperature (Lluch-Belda et al., 1989). In the Gulf of California, the population may be susceptible to two environmental mechanisms that could affect the fishery; the first may be continuous modification of habitat, and the second may be caused by episodic environmental events that trigger changes in populations and ecosystem (e.g. El Niño, La Niña) (Nevárez-Martínez et al., 2001). Consequently, the species has showed dramatic and sudden changes in distribution, abundance, and availability for the fishing fleets of Canada, USA and Mexico. The species plays a key ecological role in coastal ecosystems, transferring energy from plankton to upper trophic levels.
Since 1929, the Pacific sardine fishery began off the west coast of Ensenada, Baja California, Mexico. The fishing fleet was limited with a reduced number of purse seine vessels and a low harvest rate (Murphy, 1966). Later, in the mid-1960s the sardine population in the region suffered a collapse; therefore, a new core of distribution of Pacific sardine was located around Isla Cedros, Baja California and Bahía Magdalena, Baja California Sur (Quiñonez-Velázquez et al., 2002). However, the low yield of Pacific sardine obtained in these new areas caused the movement of the fishing fleet toward the Gulf of California, this new region offered new opportunities for developing the Pacific sardine fishery, such that the ports of Guaymas and Yavaros, Sonora, Mexico are actually the most important landing sites, with processing plants and the largest fishing fleet (Figure 1) (Cisneros-Mata et al., 1995). In Mexican waters, there are several hypotheses about its core of distribution, the first hypothesis indicates that the species is located in the north-central part of the Gulf of California and known as The Great Islands region, including from Isla Ángel de la Guarda to Isla San Pedro Mártir and including Isla Tiburón (the largest island in the Gulf of California). The second hypothesis indicates to Punta Eugenia located in the west coast of the Baja California Peninsula (DOF, 2012). Recently, the hypothesis of three stocks on the west coast of the Baja California Peninsula has been accepted, the stocks can be overlapped, since all stocks move toward the north or the south synchronically, with slight exchange among them; and their abundance and distribution depend of the sea surface temperature (Félix-Uraga et al., 2004; Félix-Uraga et al., 2005).
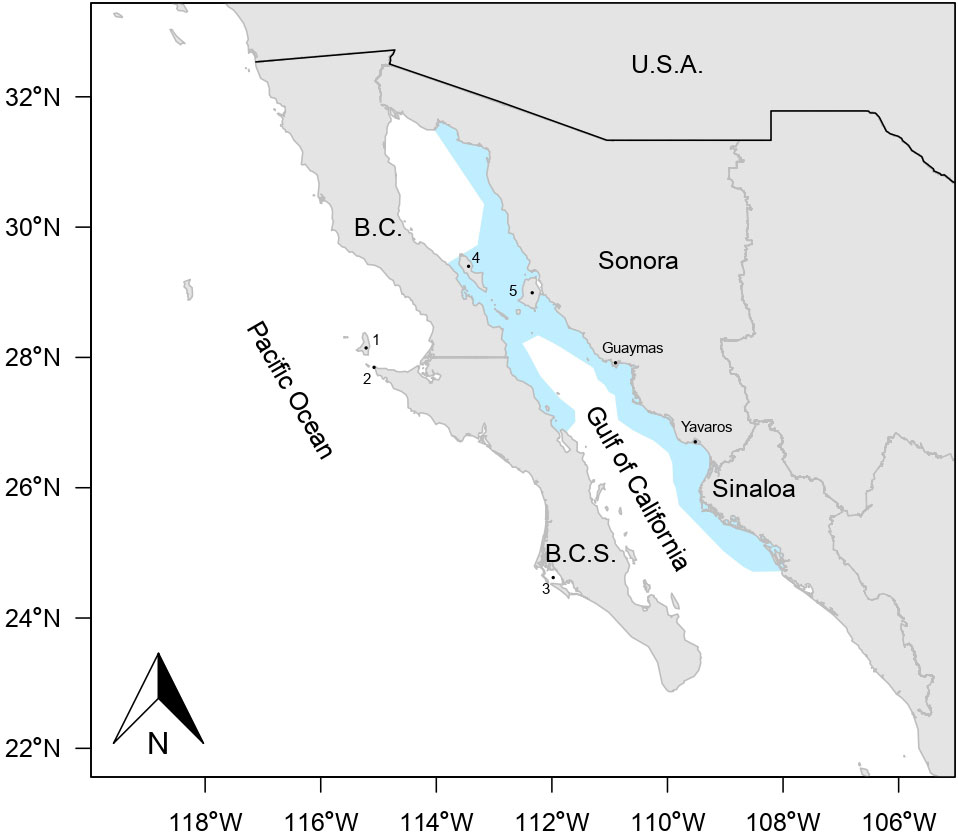
Figure 1 Study area for Pacific sardine (Sardinops sagax) caught in the Gulf of California, Mexico (blue area). The main fishing ground is located off Sonora and Sinaloa states. 1. Isla Cedros, 2. Punta Eugenia, 3. Bahía Magdalena, 4. Isla Ángel de la Guarda, 5. Isla Tiburón.
According to Nevárez-Martínez et al. (2001), the small pelagic fishery in the Gulf of California is multispecific; the target species is Pacific sardine. On average, the species accounts for 80% of the total landings, although eight other small pelagic species are also harvested in minor proportions, with a predominance of Pacific thread herring (Opisthonema libertate), chub mackerel (Scomber japonicus), northern anchovy (Engraulis mordax), round herring (Etrumeus teres), Pacific anchovy (Cetengraulis mysticetus), and leatherjacket (Oligoplites sp). The size structure of the Pacific sardine in the catch varies from a standard length of 83 to 213 mm, with an average standard length of 156 mm ( 12 mm); the species shows short longevity (7 years) and inhabits the pelagic ecosystem in the Gulf of California, mainly distributed into shoreline areas of the states of Sonora, the Baja California Peninsula, and Sinaloa. Between 1972 and 2006, the fishing season was implemented with annual cycles beginning in October and finishing in September; during 2007 the fishing season was modified from October to July (DOF, 2012).
The Pacific sardine in the Gulf of California is assumed as one stock without interactions with the stocks documented in the eastern North Mexican Pacific Ocean, where three subpopulations of Pacific sardine were identified as warm, temperate and cold stocks (Félix-Uraga et al., 2004; Félix-Uraga et al., 2005). In the Gulf of California, the species spawns mainly between autumn and early spring, with peaks from November to February. The spawning occurs along Sonora coasts, although the presence of eggs is also evident in the Central Gulf of California (Nevárez-Martínez, 1990; Hammann et al., 1998; Martínez-Zavala et al., 2010). The length at maturity is 130 mm standard length, the length at first reproduction was 120 mm standard length, and the mean length at first capture is 150 mm. In the Gulf of California, the recruitment to the fishery is defined by age class 0, it is commonly observed during June and July, although during some years the recruitment period has changed its temporality from May to June, or between July and August (DOF, 2012). The growth pattern for Pacific sardine has been modeled using the von Bertalanffy equation (Nevárez-Martínez et al., 2019).
The high variability in small pelagic species has been widely documented; possibly the iconic paper about this issue was reported by Baumgartner et al. (1992). They analyzed the anaerobic sediments of the Santa Barbara Basin off southern California, and spectral analysis of the scale-deposition series indicated that sardines and anchovies both tend to vary over a period of approximately 60 years. The scale-deposition record exhibited nine major recoveries and subsequent collapses of the sardine population over 1,700 years. In the Gulf of California, the variability observed in the catches of Pacific sardine indicated four falls followed by four recoveries (Figure 2). Thus, the sardine fishery began its growth phase from 1969 to 1989 recording the first catch record with almost 300,000 t. Later, from 1990 to 1992-1993 the catch fell dramatically ( 7,500 t); however, a new recovery was observed between 1994 and 1997 where the catch increased by 200,000 t. Unfortunately, for 1998 a new fall close to 50,000 t was recorded; over the course of two years the catch increased, such that for 2001 the catch was 200,000 t; the cycle between 1993 and 2000 was particularly anomalous because two recovery events were observed within a short time From 2004 to 2005 the catch again fell with a value of approximately 100,000 t. During the following four years (2006-2009) an abrupt increase in the catch was recorded, the highest peak in the time series was harvested ( 520,000 t), while for 2014-2015 the catch suffered its fourth decline (it was less than 5,000 t). Finally, from 2016 to 2020 a slow recovery in the catch is been recorded, the most recent year has indicated a yield of 170,000 t (Figure 2). The mechanisms of these fluctuations have been attributable to the environmental variability in the Gulf of California, density dependence, and failures in recruitment (Cisneros-Mata et al., 1995; Cisneros-Mata et al., 1996a); however, these changes in availability are still studied and analyzed, for having a more comprehensive background about the sudden responses of the sardine population.
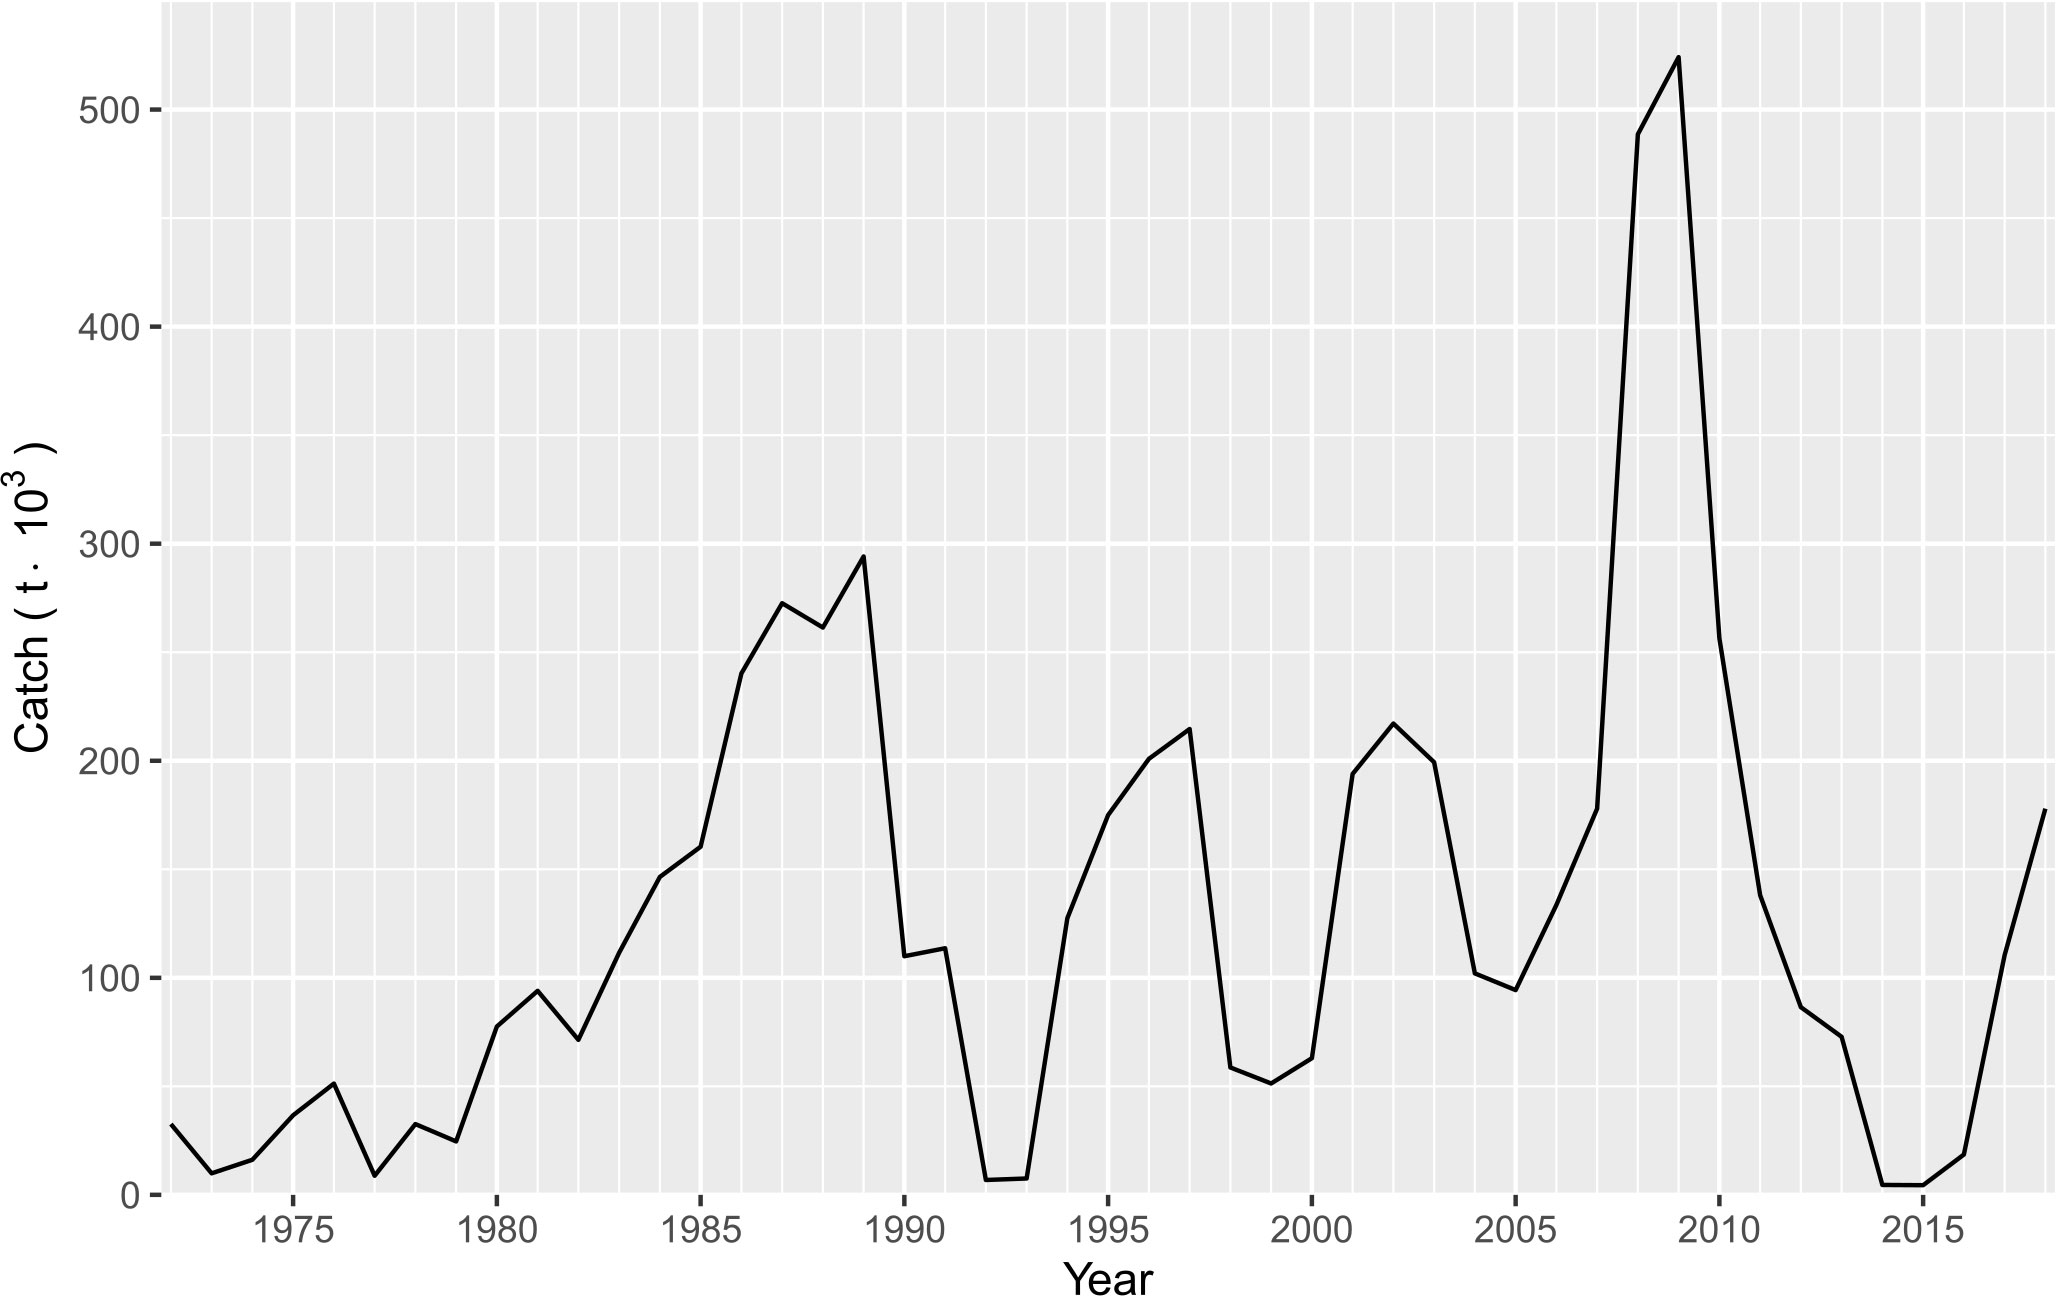
Figure 2 Historical catch records for Pacific sardine (Sardinops sagax) caught in the Gulf of California, Mexico.
Over the past 30 years, several studies have been published analyzing the changes in population dynamics and abundance of Pacific sardine fishery in the Gulf of California, Mexico. Thus, the variability in biomass and availability of the Pacific sardine population in the region have been explained through environmental stochasticity or density-dependent processes (Cisneros-Mata et al., 1995; Cisneros-Mata et al., 1996a; Nevárez-Martínez et al., 1999; Nevárez-Martínez et al., 2001). For both cases, the application of stock assessment models is key because they provide information on demographic processes, such as birth, natural and fishing mortality, growth, maturation, and movement. In summary, the fishery stock assessment models are demographic analyses designed to determine the effects of fishing on fish populations and to evaluate the potential consequences of alternative harvest policies. However, these studies have been based upon virtual population analysis or sequential population analysis (Cisneros-Mata et al., 1995; Nevárez-Martínez et al., 1999; Morales-Bojórquez and Nevárez-Martínez, 2005). These analyses have limitations because only one data source can be used as input (catch-at-age data), and it may not be sufficient in itself to provide a complete picture of the changes in biomass and the impact of fishing on the Pacific sardine stock. Conversely, integrated analysis must be preferred; it differs from the past practice of analyzing each data set separately and comparing the results. When integrated stock assessment models are used, different kinds of data can be included, providing complementary information about the status of the stock; even the use of environmental data could improve the population dynamics model (Methot and Wetzel, 2013).
Specific stock assessment models can vary by region depending on data availability; however, when the data are analyzed separately, some information on the stock condition can be ignored. Specifically, for Pacific sardine in the study area, the changes in biomass explaining the rise and fall of Pacific sardine were estimated from the catch-at-age data (Cisneros-Mata et al., 1995), and a pattern of hyperstability was also identified for the population (Martínez-Aguilar et al., 2009). Both outputs are valuable information for stakeholders, and the conclusions derived from these studies improve the Pacific sardine fishery management; unfortunately, where one data source is continuously used, the biological information from the stock will be partial and incomplete for fishery management purposes. An advantage of integrated analysis for fisheries’ stock assessment is that it can make full use of both age- and size-specific information, including factors important for describing population dynamics, such as maturity, fecundity, natural mortality, and gear selectivity, and all of them may be functions of age or size for the species in question (Savereide and Quinn, 2004; Cope, 2013; Maunder and Punt, 2013). When integrated analysis are used, they provide estimates of population parameters based on processes like recruitment, catchability, the adult stock–recruitment relationship, and fishing and natural mortality. Deriso et al. (1985) showed that the addition of auxiliary information (e.g., fishing effort) is typically required to constrain the analysis; therefore, the inclusion of fishery-dependent and fishery-independent data can be used for obtaining reliable population parameter estimates. The stock assessment is relevant for management purposes, because in Mexico, the Small Pelagic Species Fishery Management Plan establishes as reference point the maximum sustainable yield for Pacific sardine, and the control rule is defined according to this management quantity (DOF, 2012).
Recognizing the high variability in biomass and availability of the Pacific sardine in the Gulf of California, continuous updates on the stock condition are necessary (Lluch-Belda et al., 1989; Gaughan et al., 2004). In this study, an integrated stock assessment model for Pacific sardine fishery was applied. There are sufficient biological and statistical data for representing the population dynamics; additionally, the data are available over the time period during which a fishery has affected the stock. In this approach, relevant biological information was jointly used with fishery data, improving the biomass, recruitment, and mortality estimations. Thus, the objective in this paper is to improve Pacific sardine stock assessment by increasing biological realism in analyzing key life history and fishery processes.
Material and methods
Statistical and biological data
We used monthly catch at age data during 47 fishing seasons, the sampling design included two opposite landing sites where Pacific sardine is harvested, this allowed to collect the biological samples through the entire distribution area for this species; in contrast, the fishery-independent data were temporally limited during the survey research, consequently, the age composition and biological samples could be biased or skewed (e.g., large or small individuals). For avoiding this situation, biological data were obtained from two fishery ports known as Yavaros (South region) Guaymas (North Central region), Sonora; both are the most important ports for the sardine industry in the Gulf of California. The biological data were collected every month during fishing seasons. Systematic random sampling was carried out in both ports where different purse seines of the commercial fleet were sampled, and approximately 100 individuals were taken in the holds. The length frequency distribution data were collected using a length class of 5 mm. These individuals were also used for collecting data about weight (g), sex, saggita otoliths, and maturity stage based on the maturity scale proposed by Cisneros-Mata et al. (1988); the maturity curve was modeled using a logistic model and maturity data of females (DOF, 2012). The annual catch records were obtained from the commercial fisheries statistics provided by Comisión Nacional de Pesca y Acuacultura (https://www.gob.mx/conapesca). The stock assessment for the Pacific sardine was implemented with an annual time step for age classes from 0 to 6 years; within this age range, the otolith readings were available, therefore the catch-at-age data (by one fleet) were used. The mean standard length (mm) and standard deviation (sd) by age of the Pacific sardine were reported as follows: i) Age 0, 101.2 mm (3.2); ii) Age 1, 138.9 mm (8.7); iii) Age 2, 159.7 (9.0); iv) Age 3, 179.5 (7.3); v) Age 4, 189.2 (5.4); vi) Age 5, 196.8 mm (4.3); and vii) Age 6, 200.7 mm (3.8) (Nevárez-Martínez et al., 2019).
Readings were repeated at least two times with a reasonable time lapse and compared later on, using a stereomicroscope. According to Campana et al. (1995) the coefficient of variation (CV), and the index of average percent error (IAPE) must be calculated to assess the reliability of the counts, the CV values varied between 6% and 7%, and IAPE was less than 4.5%; these values were assumed as plausible, therefore ageing error or bias were not included in the stock assessment. The age compositions were available across the entire modeling time period (1971−2018); such that the otholits were collected and read per year. The maturity and growth data were used as input data in the integrated catch-at-age model.
The time series involved an extensive statistical and biological database over 47 fishing seasons (1971−2018). This analysis included five fishery-independent abundance indices; they consisted of indices of relative abundance covering a subset of recent years, as well as biological sampling. According to Hilborn and Walters (1992), there is proportionality between the index of relative abundance and abundance therefore, the model of proportionality was assumed as , where is the catchability. The stock assessment requires indices of relative abundance for estimating biomass and other management quantities. For small pelagic fisheries, several indices have been evaluated, e.g., CalCOFI egg and larvae, spawning area, aerial spotter, and spawning biomass (daily egg production method). They are used frequently in the catch-at-age analysis for small pelagic species in the California Current; additionally, other indices of relative abundance were used and later discarded, mainly due to their low statistical contribution to catch-at-age model (e.g., the number of positive stations, indicating the presence of sardines in the marine station sampled during survey research) (Jacobson et al., 1994a; Jacobson et al., 1994b; Deriso et al., 1996). Details about input data used for maturity at age, and selectivity at age are included in Supplementary Material (Table S1).
The indices of relative abundance used in this study were estimated from different methodologies, and these are included in the citation for each index as follows: (i) survey catch rate between 1990 and 2018 was estimated during May every year, in this study the catch rate values were expressed as the average annual catch rate by survey (Nevárez-Martínez et al., 2001), the coefficient of variation for this index was 0.5; (ii) indices from acoustic surveys from 2008 to 2017 were estimated during May every year, expressed as annual tons (Simmonds and MacLennan, 2005), the coefficient of variation for this index was 0.2; (iii) indices from egg and larvae between 1972 and 1988 were estimated during winter every year, indicating the number of Pacific sardine eggs and larvae standardize to 10 m2 of sea surface (Hernández-Vázquez, 1994; Lo et al., 1996; Hammann et al., 1998; Lluch-Cota et al., 1999) the coefficient of variation for this index was 0.3; (iv) index of spawning probability from 1979 to 1996 was estimated during winter every year (Hammann et al., 1998; Lluch-Cota et al., 1999), the coefficient of variation for this index was 0.3; and (v) index based on feeding of marine birds between 1990 and 2012, the data were collected between March and June every year, representing the proportion of Pacific sardine in the diet of Heermann’s gulls (Larus heermanni) and Elegant terns (Thalasseus elegans) estimated from seabird regurgitations (expressed as percentage), thus each bird was assumed to be a sample unit; the coefficient of variation for this index was 0.8. However, this index of relative abundance was spatially limited to a few km2 around Isla Rasa, in the Gulf of California (28° 49′ 22″ N, 112° 58′ 47″ W) (Velarde et al., 1994; Velarde et al., 2013). Table 1 shows specific details on the temporality of the fishery-independent abundance indices. The Figure F1 (Supplementary Material) indicates the spatial coverage of the study area, where the catch rate, acoustic surveys, indices from egg and larvae, and index of spawning probability were collected.
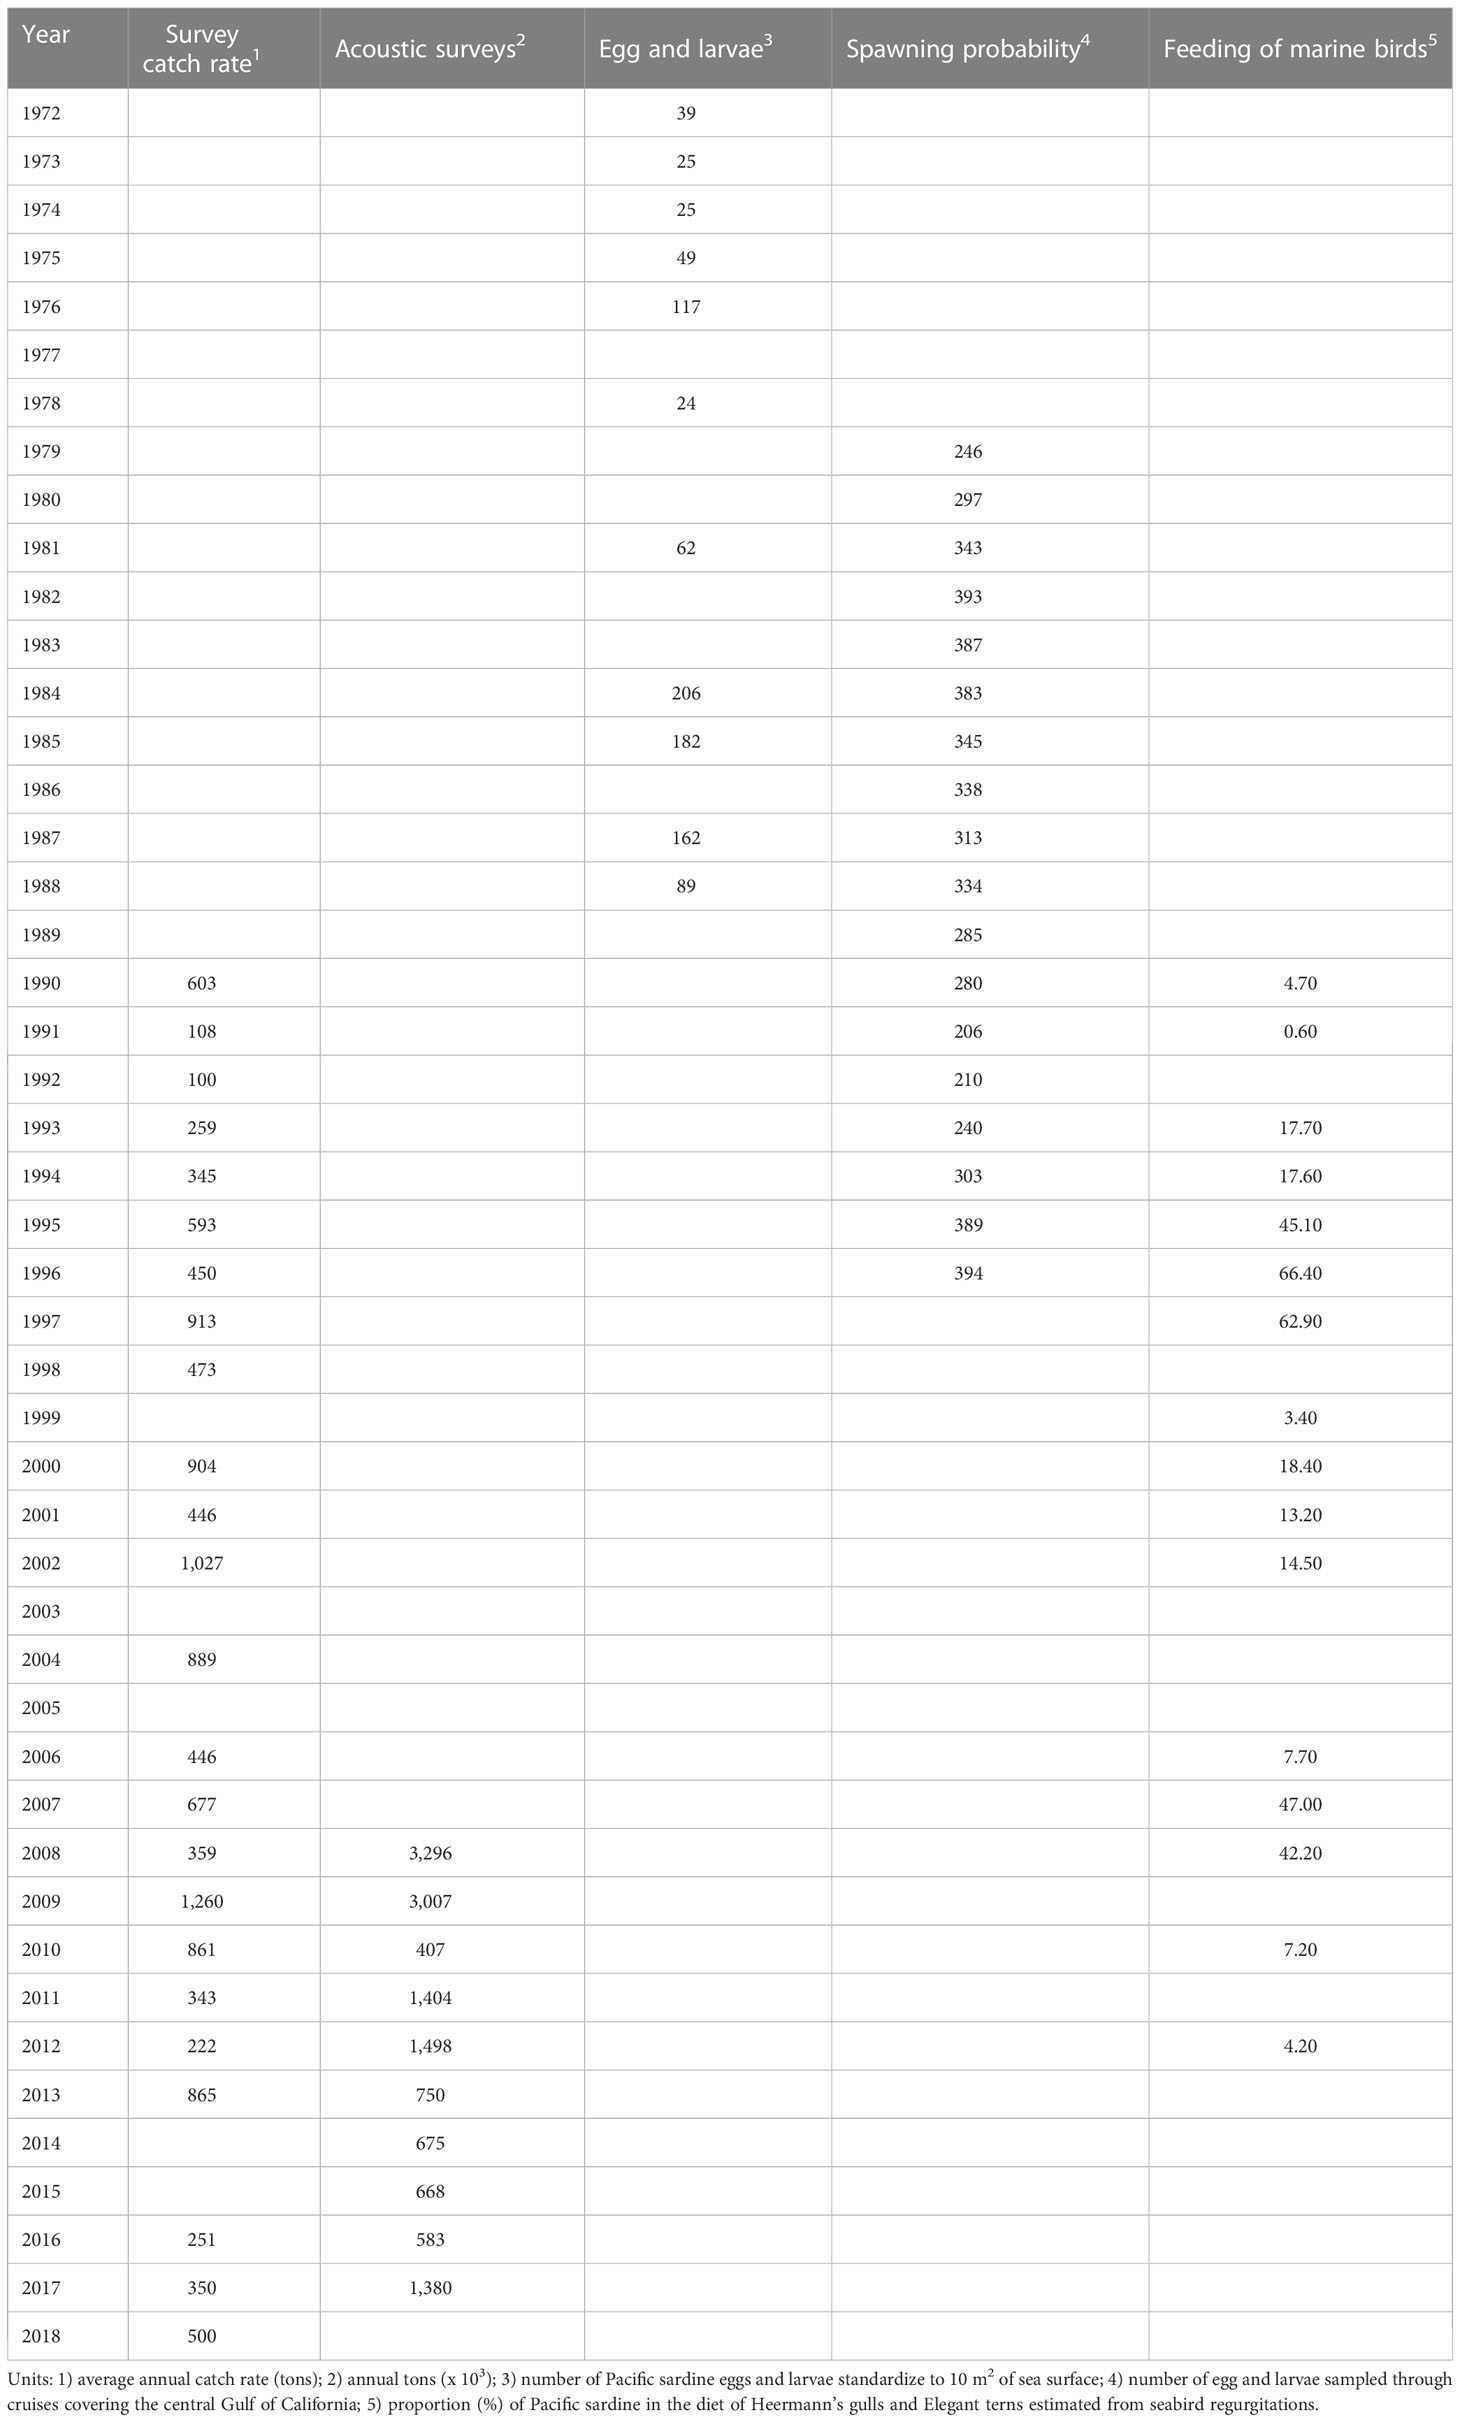
Table 1 Indices of relative abundance used by ASAP for modeling abundance of Pacific sardine (Sardinops sagax) from the Gulf of California.
According to Legault and Restrepo (1998), the predicted indices of relative abundance are associated with the abundance , catchability coefficients and selectivity at age , such that each index of relative abundance was estimated as follows:
where a = age, y = year, and u = time series of the indices of relative abundance. Finally, the catchability coefficients were estimated as , assuming that follows a random walk, where . This means that the catchability coefficient is variable among years, avoiding assumptions of average catchability for the time series analyzed (NOAA, 2012).
Model description
Stock assessment of the Pacific sardine was performed using the age-structured assessment program (ASAP); this package is correctly coded and documented, therefore its use is highly recommended (Dichmont et al., 2016a; Dichmont et al., 2016b). It is a likelihood-based statistical catch-at-age modeling environment allowing multiple data sources to be used to characterize population dynamics over time (Legault and Restrepo, 1998; Moustahfid et al., 2009; Guan et al., 2013). ASAP has been used as a stock assessment tool for some marine species, such as the Pacific sardine and mackerel (Conser et al., 2002; Hill et al., 2006; Crone et al., 2019), the Atlantic herring (Deroba, 2015), and the summer flounder (Terceiro, 2016). ASAP is available through the NOAA Fisheries Toolbox Project (https://nmfs-fish-tools.github.io/ASAP/). ASAP is an integrated analysis that offers an excellent option, using a framework of biologically plausible simplified equations, with both fixed and estimated parameters.
Population dynamics
ASAP is a forward-projection method following the standard and known equations of population dynamics proposed by Fournier and Archibald (1982); Deriso et al. (1985), and Methot (1989) for statistical catch-at-age analysis. The basic equations describing the population dynamics implemented in ASAP are contained in Table 2. ASAP is a multi-fleet stock assessment model; therefore, the catches and fishing mortalities can be fleet-specific. In this study, only one fleet was modeled, therefore the subindex “g” denoting the number of fishing fleets (g =1) was included in the nomenclature. The selectivity was estimated for the age classes observed in the Pacific sardine population. The fishing mortality is separable, such that it was computed as the product of selectivity-at-age and a year- and fleet-specific multiplier; therefore, the total fishing mortality (F) is the sum of fleet-specific fishing mortalities (Megrey, 1989; MacCall and Teo, 2013). The natural mortality (M) can be age-specific, although in this study M = 0.7 was expressed as rate per year (Nevárez-Martínez et al., 1999); the total mortality (Z) was the summation of F and M. Catch is then calculated using Baranov’s equation (number by age-year-fleet, if required) (Fournier and Archibald, 1982). ASAP assumes a Beverton−Holt spawner−recruitment relationship. Finally, biomass is the product of abundance- and weight at age (Legault and Restrepo, 1998; NOAA, 2012).
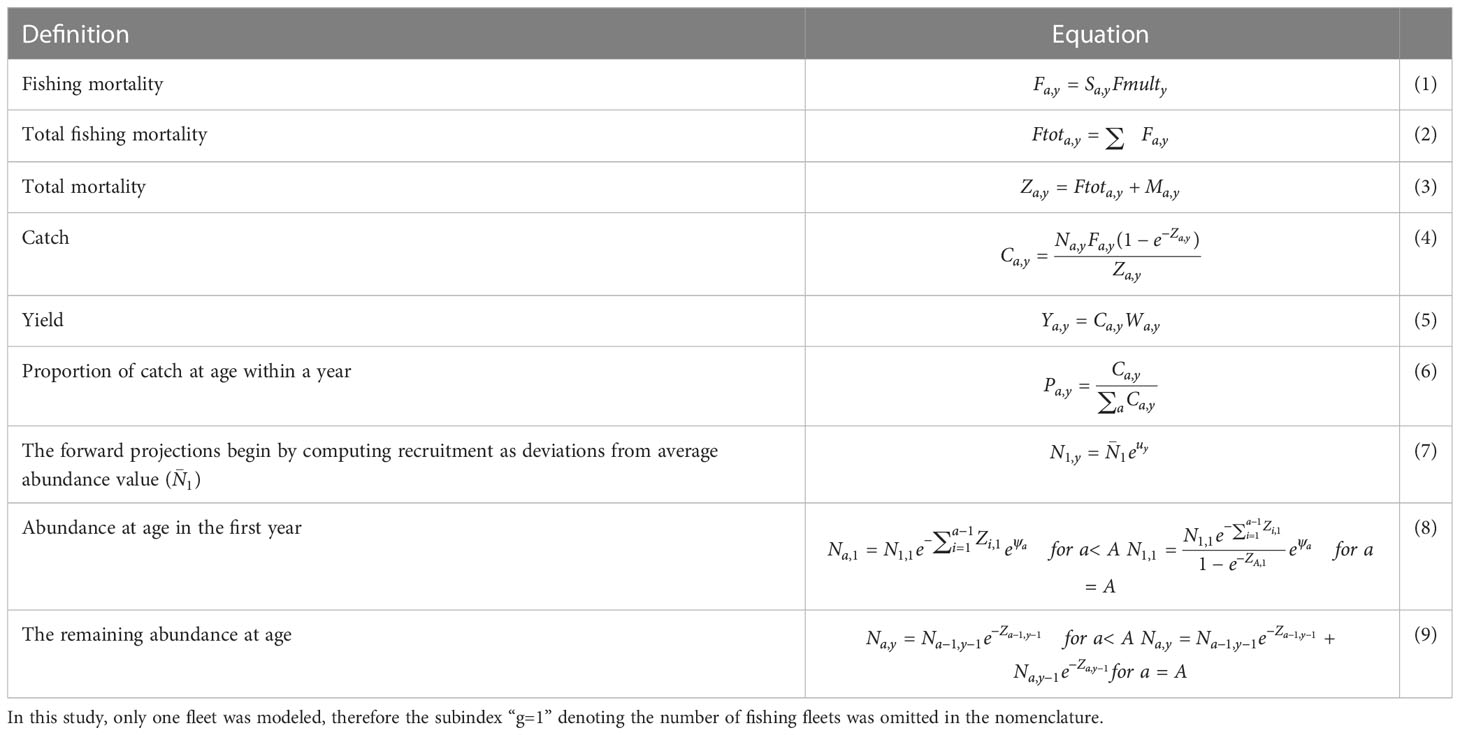
Table 2 Basic equations representing the population dynamics implemented in ASAP.
Objective function
Parameter estimation occurs via the maximum likelihood method (Legault and Restrepo, 1998; Cao et al., 2014); given that ASAP includes the final estimation of several parameters, the objective function is the joint negative log likelihood of nine components indicating the population dynamics (), and two optional penalty functions can be used to determine the amount of curvature allowed in the fleet selectivity pattern, both at age and over time (Legault and Restrepo, 1998; NOAA, 2012; Francis, 2017). The joint objective function was expressed as follows:
where represents the weight assigned to each partial negative log likelihood function ( it was estimated as the inverse of the variance associated with each component. According to NOAA (2012), the basic equations contained in ASAP are expressed as follows:
where is the objective function for catch-at-age proportions assuming a multinomial distribution. The following partial negative log likelihood functions (eqns. 14−21) associated with the joint negative log likelihood were assumed with log normal distribution and multiplicative residuals (NOAA, 2012). The mathematical expression used for these components was as follows:
where denotes observed data, indicates predicted data, and is the standard deviation for each data set . Therefore, the negative log likelihood components, assuming the previous distribution, were the total catch in weight by fleet (14), indices of relative abundance (subindex g indicates number of fleets, in this study g = 1) (Moustahfid et al., 2009) (15), selectivity (16), catchability (17), F-multiplier (18), numbers at age (age-zero abundance) (19), N-at-age in year 1 (20), and stock−recruitment relationship (21). They were expressed in a simplified way as follows:
where quadratic multiplicative residuals contained in Equation 13 were expressed as , , , , and , is the spawning stock biomass at time , denotes the number of recruits at time , and are parameters in the stock−recruitment relationship. The α and β parameters estimated as follows:
where is unexploited spawning stock biomass and represents steepness. Thus, , where is unexploited recruitment (NOAA, 2012).
Parameter estimation
The parameters were estimated when the joint negative log likelihood (Eqn. 11) was minimized; the optimization was conducted using AD Model Builder (NOAA, 2012). The process is based on “model sculpting” (Fournier et al., 2012); given that the number of parameters can be large and highly nonlinear, it can be difficult to estimate all parameters simultaneously in one run of the model. Therefore, the minimization occurs in phases, where groups of parameters are estimated simultaneously, while the remaining parameters are maintained at their initially assigned values. Once the joint negative log likelihood is minimized for a particular phase, more parameters are added, including those from previous phases, so they are all included and evaluated progressively. The estimation within additional phases continues until all parameters are estimated. The variance of the parameters was estimated through the Hessian matrix; if some parameters were fixed, then the delta method was preferred (MacCall, 2013). Thus, the parameterization approach used in ASAP is a flexible forward simulation that allows for an efficient and reliable estimation of a large number of parameters (Legault and Restrepo, 1998; NOAA, 2012; Dichmont et al., 2016a).
Model diagnostics
According to Perreault et al. (2020) and Perretti et al. (2020), the model diagnostics can be analyzed from the analysis of retrospective patterns. These indicate systematic inconsistency among a series of estimates of population size or other assessment variables when years of data are removed from the stock assessment model (Mohn, 1999). The retrospective patterns are usually quantified using the Mohn’s ρ statistic (Hurtado-Ferro et al., 2015), which measures the relative difference between an estimated quantity from an assessment based on the full time series and the same quantity estimated from a reduced time series. The appearance of a retrospective pattern suggests that an assessment will over- or under-estimate spawning stock biomass or fishing mortality in the terminal year of the stock assessment and could provide unsustainable or sub-optimal harvesting advice (Deroba, 2014; Hurtado-Ferro et al., 2015; Szuwalski et al., 2018). The Mohn’s ρ statistic is not a goodness-of-fit; therefore, there are not criteria based on statistical significance, thus the relative difference expressed through Mohn’s ρ statistic for small pelagic should be in the range from -0.22< < 0.30, indicating an acceptable stock assessment for Pacific sardine fishery in the Gulf of California (Hurtado-Ferro et al., 2015). The model diagnostics were based on the trajectories of spawning stock biomass, recruitment, and fishing mortality (Miller et al., 2016; Miller and Legault, 2017; Huynh et al., 2022; Legault et al., 2023). These outcomes estimated through the ASAP model are commonly reported by the management agencies, and they are useful for providing information on the uncertainty in these management quantities to the stakeholders. Therefore, the trajectories of these outcomes are typically reported in the literature whether an integrated stock assessment model is used (e.g. ASAP, WHAM, SSM). In this way, the three most important outcomes for fishery management are expressed through ASAP: i) stock size (the number of fish by age group at a particular point in time), ii) stock productivity (usually defined by the number of recruits), and iii) stock mortality (frequently referred through fishing mortality). The Mohn’s statistic was estimated as follows:
where indicates the terminal year of the data time series; is the number of years peeled off from the terminal year; is the number of total years peeled off from terminal year, in this study = 6; indicates the estimate of a parameter for year from fitting the ASAP model to data with terminal year.
Sensitivity analysis
A sensitivity analysis was performed for ASAP model using four scenarios, they changed assuming different time periods and natural mortality, such that the scenarios were configured as follows: a) From 1979 to 2018 and M = 0.7; b) From 1990 to 2018 and M = 0.7; c) From 1972 to 2018 and M = 0.6; and d) From 1972 to 2018 and M = 0.8. The modification in the time series for each scenario influenced in the use of the data (indices of relative abundance, Table 1), assumptions, and structural uncertainty on important model results, mainly recruitment, spawning biomass and fishing mortality (Conser et al., 2002; Crone et al., 2019). In this way, the sensitivity analysis provided a measure of the uncertainty associated with results obtained from final base model (defined from 1972 to 2018 and M = 0.7).
Status of the Pacific sardine in the Gulf of California
The historical status of the Pacific sardine in the Gulf of California was shown using the Kobe phase plot (Carvalho et al., 2018). In this study, the reference points (RP) used were: the FMSY and BMSY. The FMSY is an RP that indicates the fishing mortality corresponding to the maximum sustainable yield, and BMSY indicates the biomass at maximum sustainable yield (Hilborn and Walters, 1992). The Kobe phase plot provides four zones where the status stock can be identified: i) the green panel showing the target zone for Pacific sardine fishery management (Bt/BMSY > 1, Ft/FMSY< 1); ii) the orange panel indicating a threshold zone, where the stock was exposed to overfishing (not-overfished) (Bt/BMSY > 1, Ft/FMSY > 1); iii) the yellow panel indicating the stock was overfished (not-overfishing) outside safe biological limits (Bt/BMSY< 1, Ft/FMSY< 1); and iv) the red panel representing the risk zone (Bt/BMSY< 1, Ft/FMSY > 1) (Echazabal-Salazar et al., 2021).
Results
ASAP requires indices of relative abundance for estimating different outputs, therefore these data were useful in determining the trajectories of abundance, biomass, and fishing mortality. The indices showed different temporal scales, and the most extensive time series was the survey catch rate (1990−2018). Comparatively, the indices of spawning probability and acoustic survey showed a better fit to the data (Figure 3); the index of survey catch rate showed an acceptable fit, while the egg and larvae index and the bird diet ratio showed a poor fit to the observed data. The bird data ratio could even be assumed to be non-informative regarding the abundance of the Pacific sardine. Commonly, several data sources exhibit different tendencies over time, and the information contained in the indices of relative abundance could even be contradictory. For example, between 2000 and 2004, the survey catch rate showed high values with an increasing trend, varying between 446 and 1,027 t, whilst the bird diet ratio showed low values (13.2% and 18.4%), with this index falling dramatically during 1996 and 1997 (Figure 3). Between 2000 and 2004, the catch of Pacific sardine increased with a significant peak in the catch time series. The discrepancy in both indices can be explained by the spatial scale covering birds during feeding, limited to a few nautical miles around Isla Rasa, in comparison to a catch rate survey covering the extensive fishing ground in the Gulf of California where Pacific sardine is distributed and harvested. Finally, the indices of relative abundance of the survey catch rate and spawning probability, coincided with low values from 1990 to 1993, and the acoustic survey and survey catch rate also coincided with low values during the period of 2012−2016 (Figure 3).
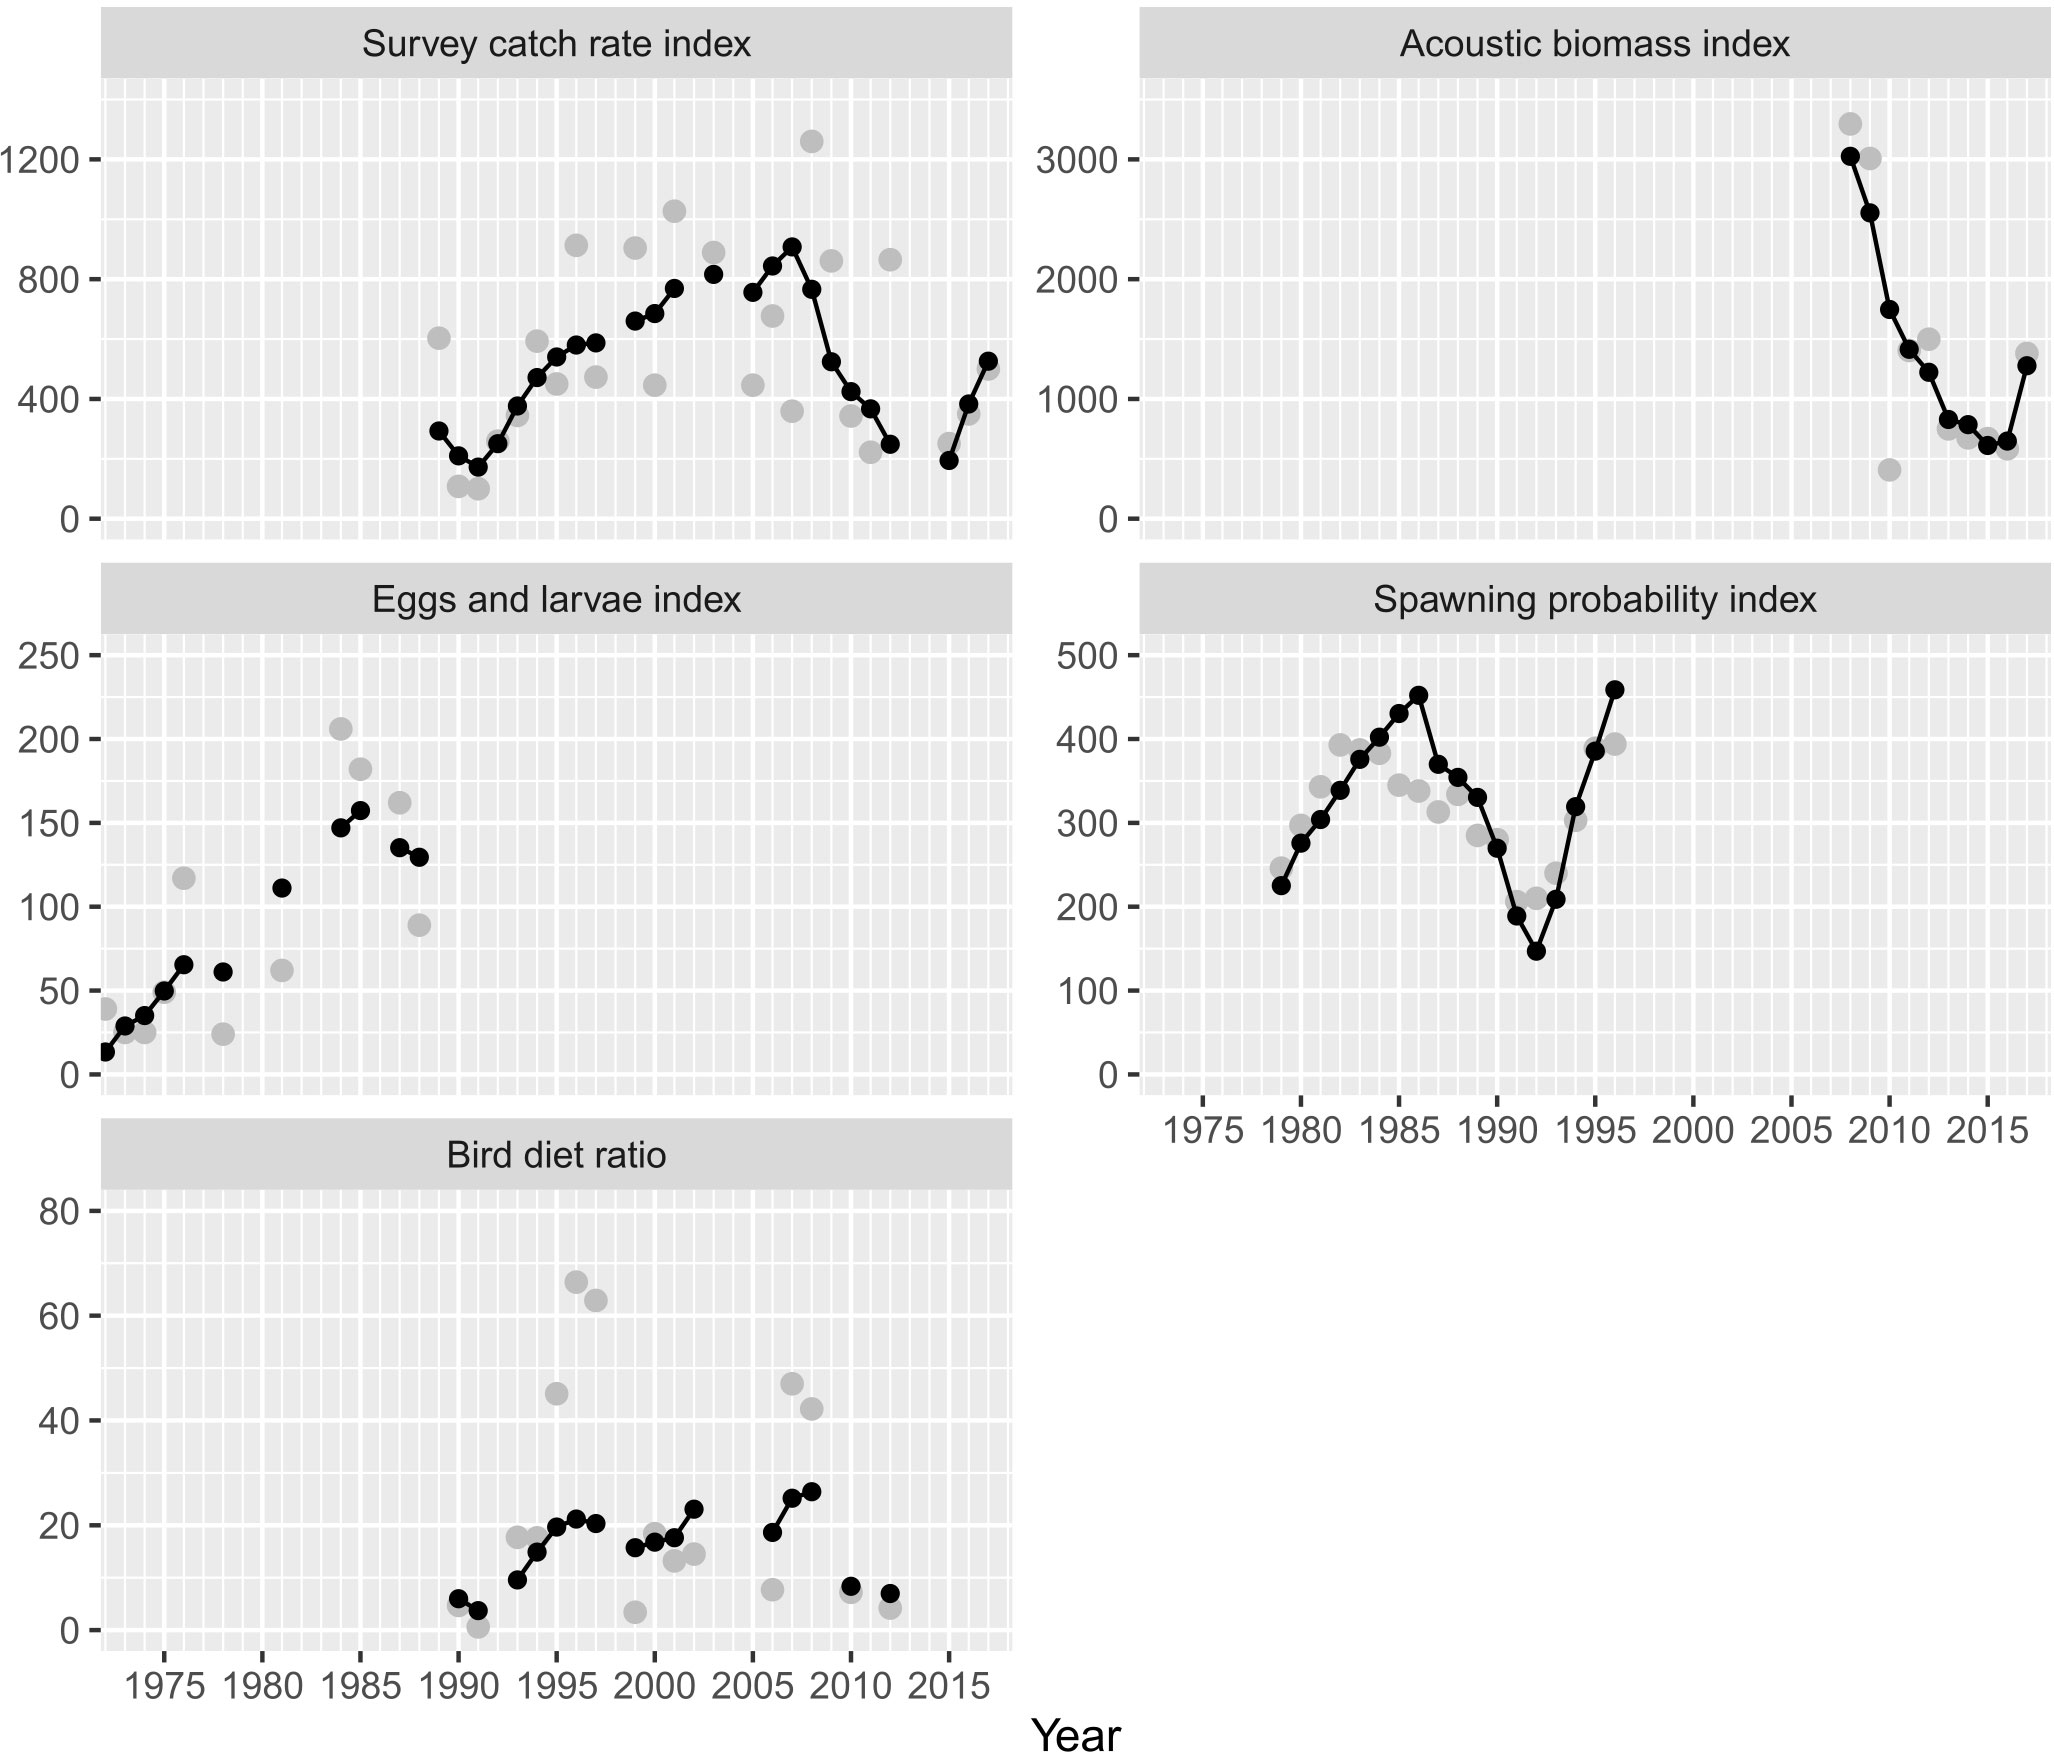
Figure 3 Indices of relative abundance used for tuning the integrated catch-at-age model (ASAP). The continuous line shows the model fitted to the observed data (gray points).
The abundance-at-age estimates are shown in Figure 4. Thus, age classes 0 (recruits) and 1 were the most abundant. From 1972 to 2018, the recruits varied between 5 x 10⁹ and 61 x 109 individuals, and two periods with high abundance were identified. The first was from 1979 to 1998, where the recruits increase up to a peak of 33.2 x 10⁹ individuals. A second period was observed during the period of 1995−2008, where recruitment fluctuated between 29.7 x 10⁹ and 61 x 109 individuals, and a temporal peak of 52.6 x 10⁹ individuals was observed during 2017. The lowest recruitments were estimated during the time periods of 1990−1992 and 2012−2016, and in 2018 (Figure 4). A similar pattern of abundance was observed for age classes 1 and 2, although the abundance-at-age in the time series was less than those estimated for recruits, with the variation being between 0.53 x 10⁹ and 29.4 x 10⁹ individuals for age class 1 and 0.21 x 10⁹ and 11.9 x 10⁹ individuals for age class 2. Finally, the abundance-at-age for individuals aged from 3 to 6 years was less than 6 x 10⁹ individuals, and the changes in abundance for these age classes were not as dramatic as the abundance of recruits for age class 1 (Figure 4). The variability in abundance of spawners was expressed as the summation of individuals estimated for age classes 1 to 6, and the interannual variability showed a similar pattern to the previous description of changes in recruitment. Thus, the abundance of spawners also fell during 1992 and from 2013 to 2015, and over 12 years (1998−2009), the abundance of spawners was relatively stable, showing a slight increase from 28.6 x 10⁹ to 44.3 x 10⁹ individuals. The abundances of recruits and spawners changed noticeably in a similar phase, influencing the interannual variability in total abundance (Figure 5).
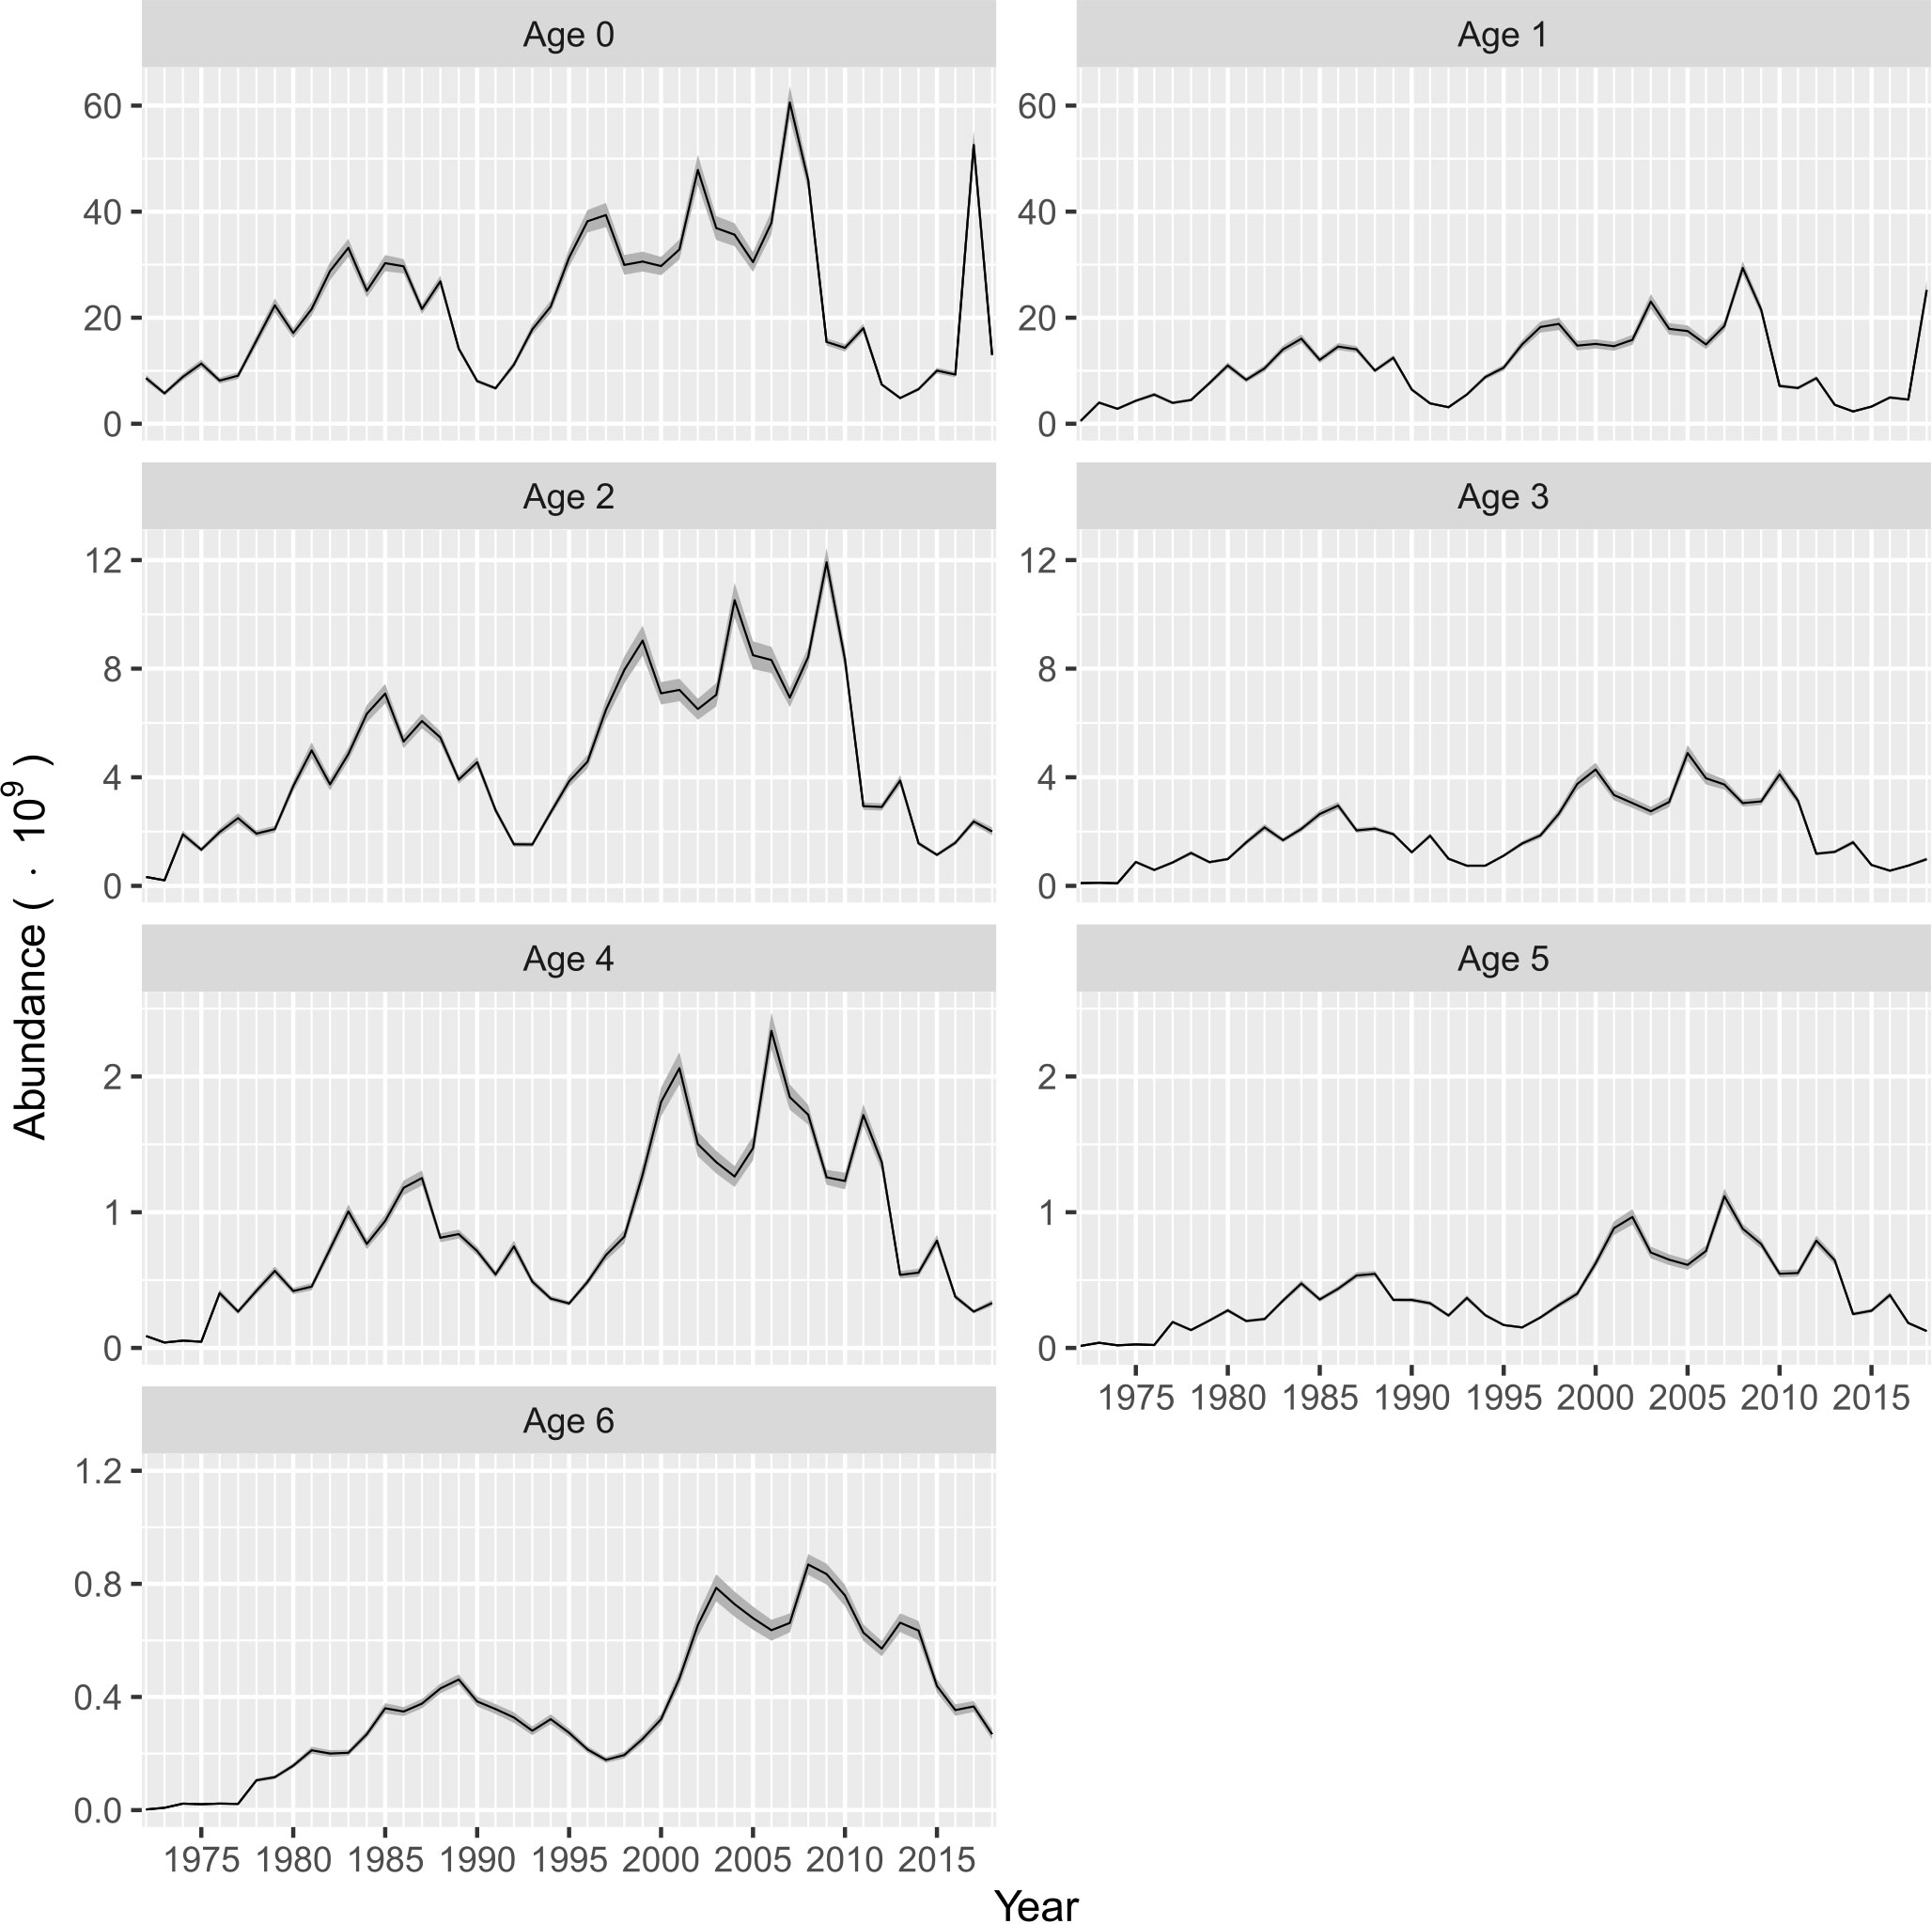
Figure 4 Abundance at age estimated from ASAP for Pacific sardine (Sardinops sagax) from the Gulf of California, Mexico. The shaded area indicates the confidence interval (P< 0.05).
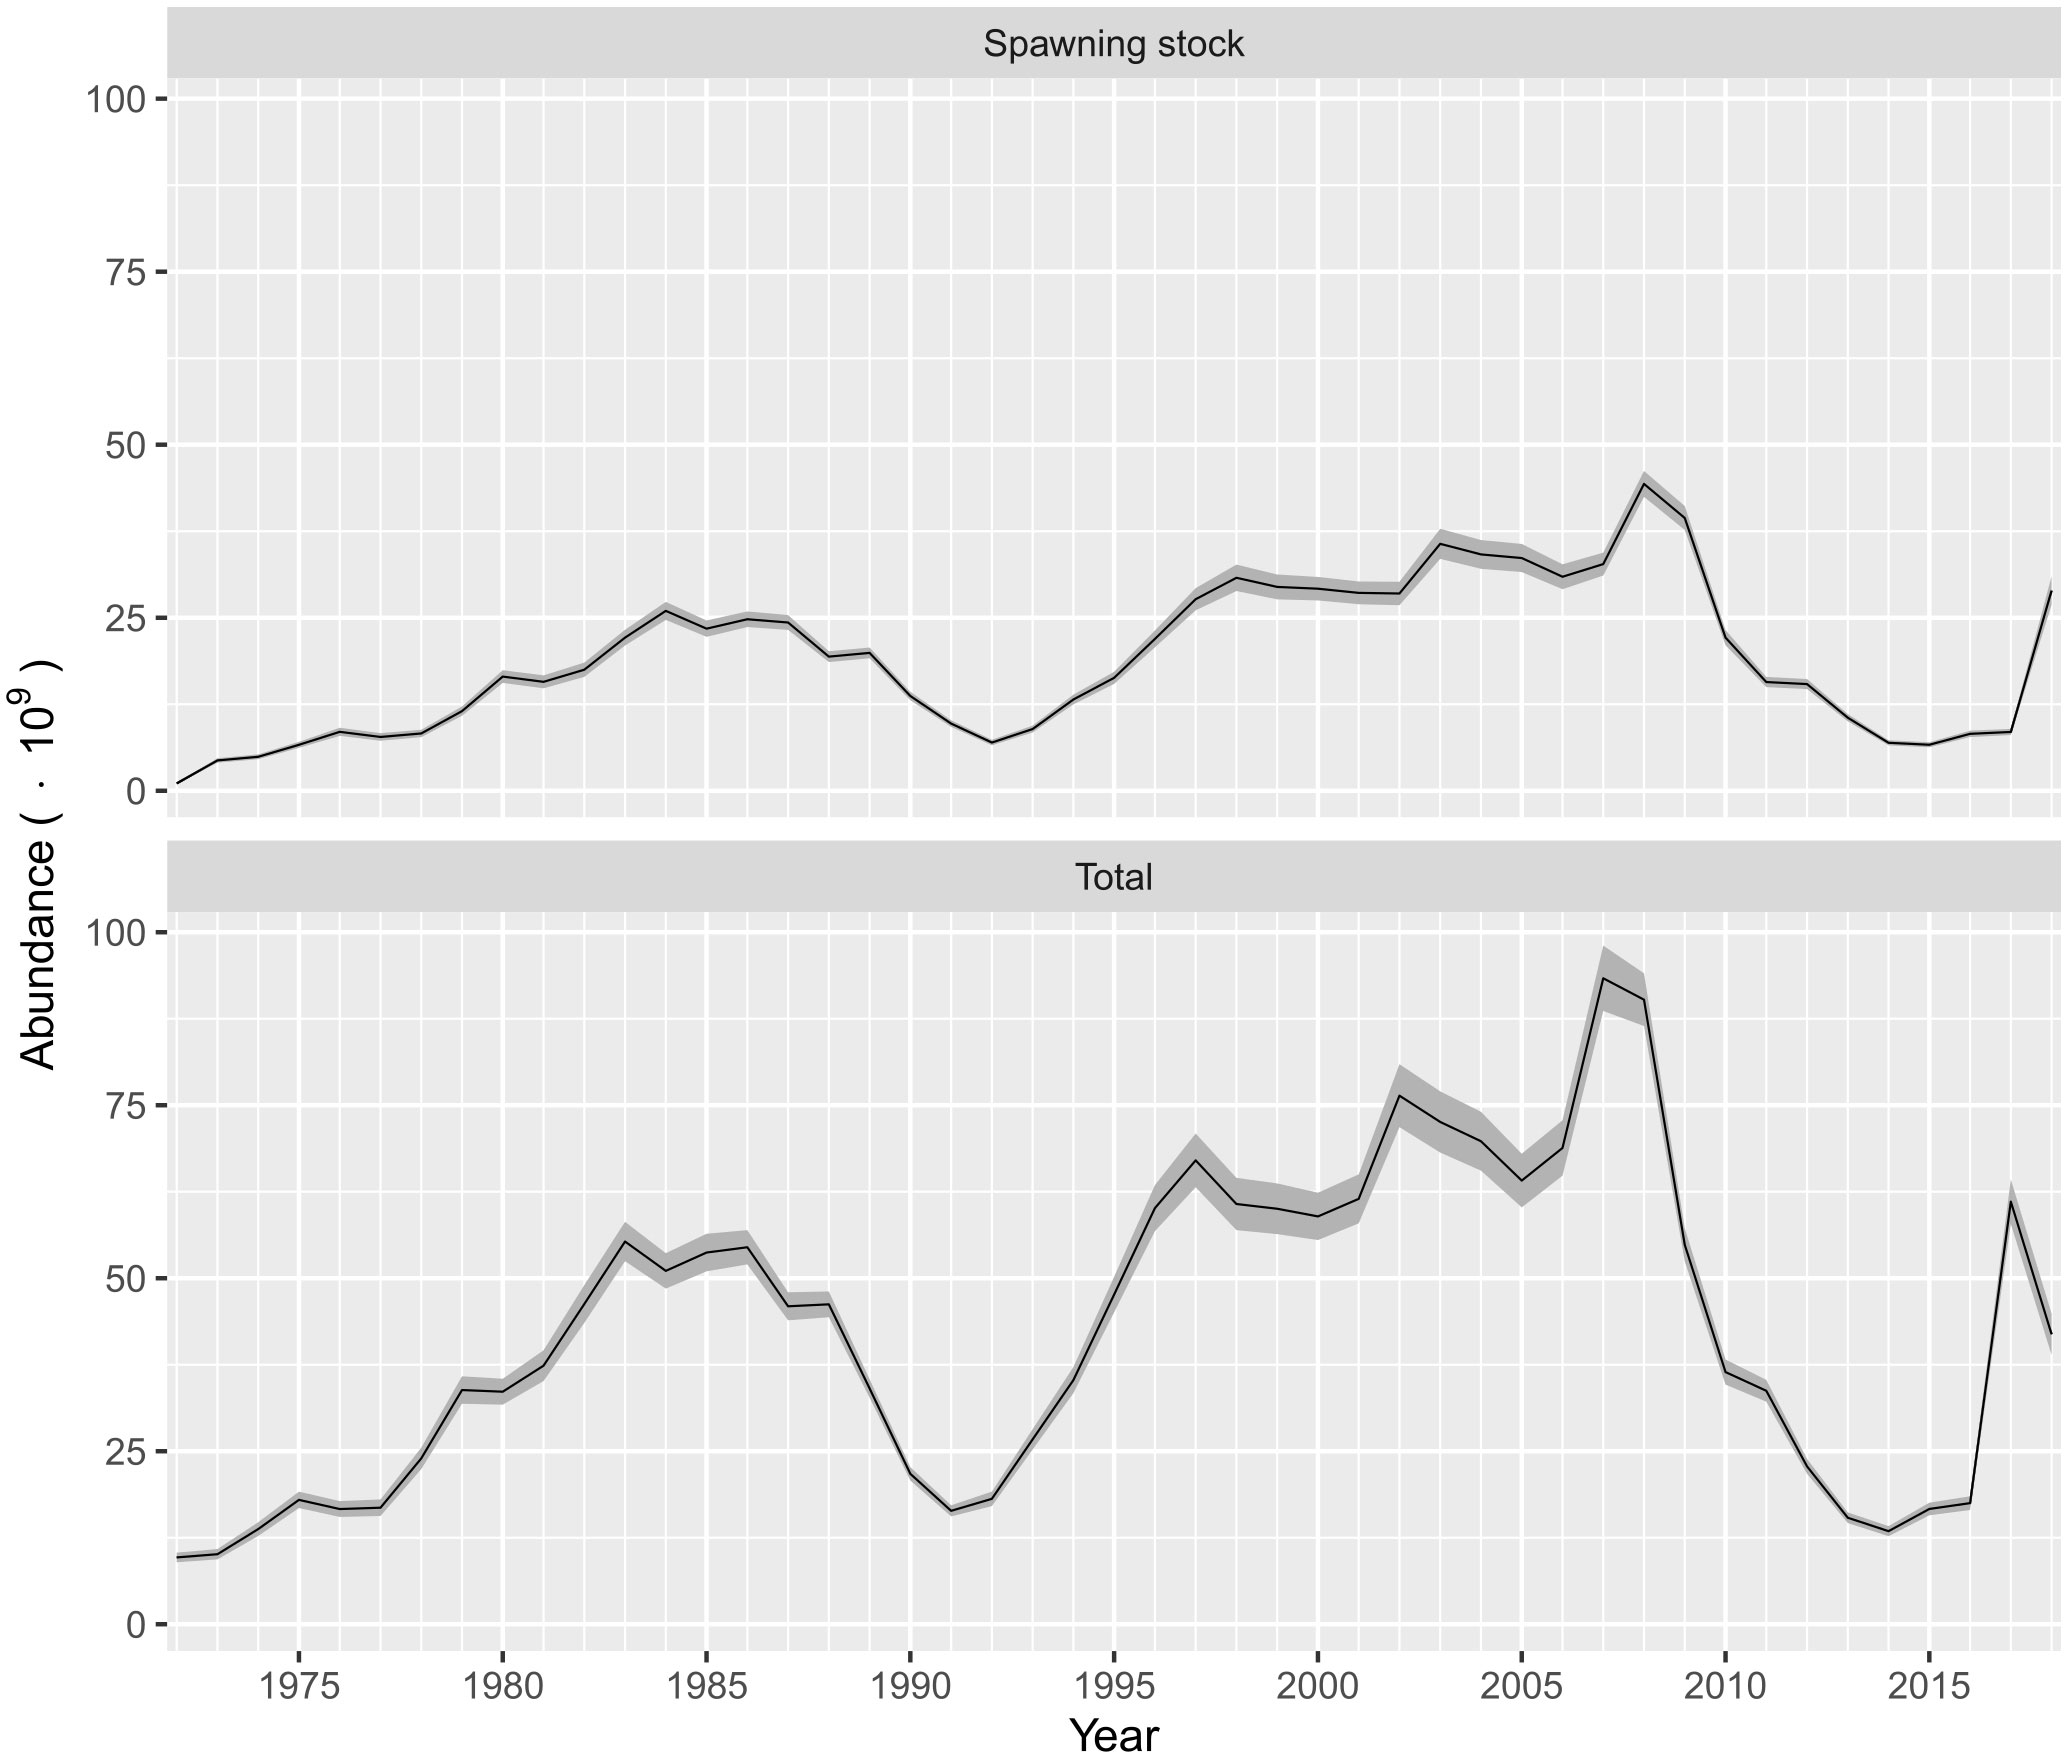
Figure 5 Interannual variability for spawning stock abundance and total abundance of Pacific sardine (Sardinops sagax) from the Gulf of California, Mexico. The shaded area indicates the confidence interval (P< 0.05).
The spawning stock-recruitment relationship fitted to the data of the Pacific sardine fishery in the Gulf of California is shown in Figure 6. The highest recruitment in the Pacific sardine fishery was estimated during 2007 with a value of 606 x 108 individuals; this recruitment was produced when the spawning stock biomass (SSB) was almost 1.8 million t. The spawning stock-recruitment relationship suggested the that highest recruitments were associated with an SSB exceeding 1.0 million t, and recruitments greater than 23 x 108 individuals occurred when the SSB varied between 0.8 and 1.0 million t (Figure 6). However, during 2012, the variability in the spawning stock-recruitment relationship estimated low recruitment associated to an SSB of 0.91 million t. When the SSB was in low biomasses, in general, any up-growth in SSB was also reflected in an increase in recruitment (Figure 6) (Supplementary Material, Table S2).
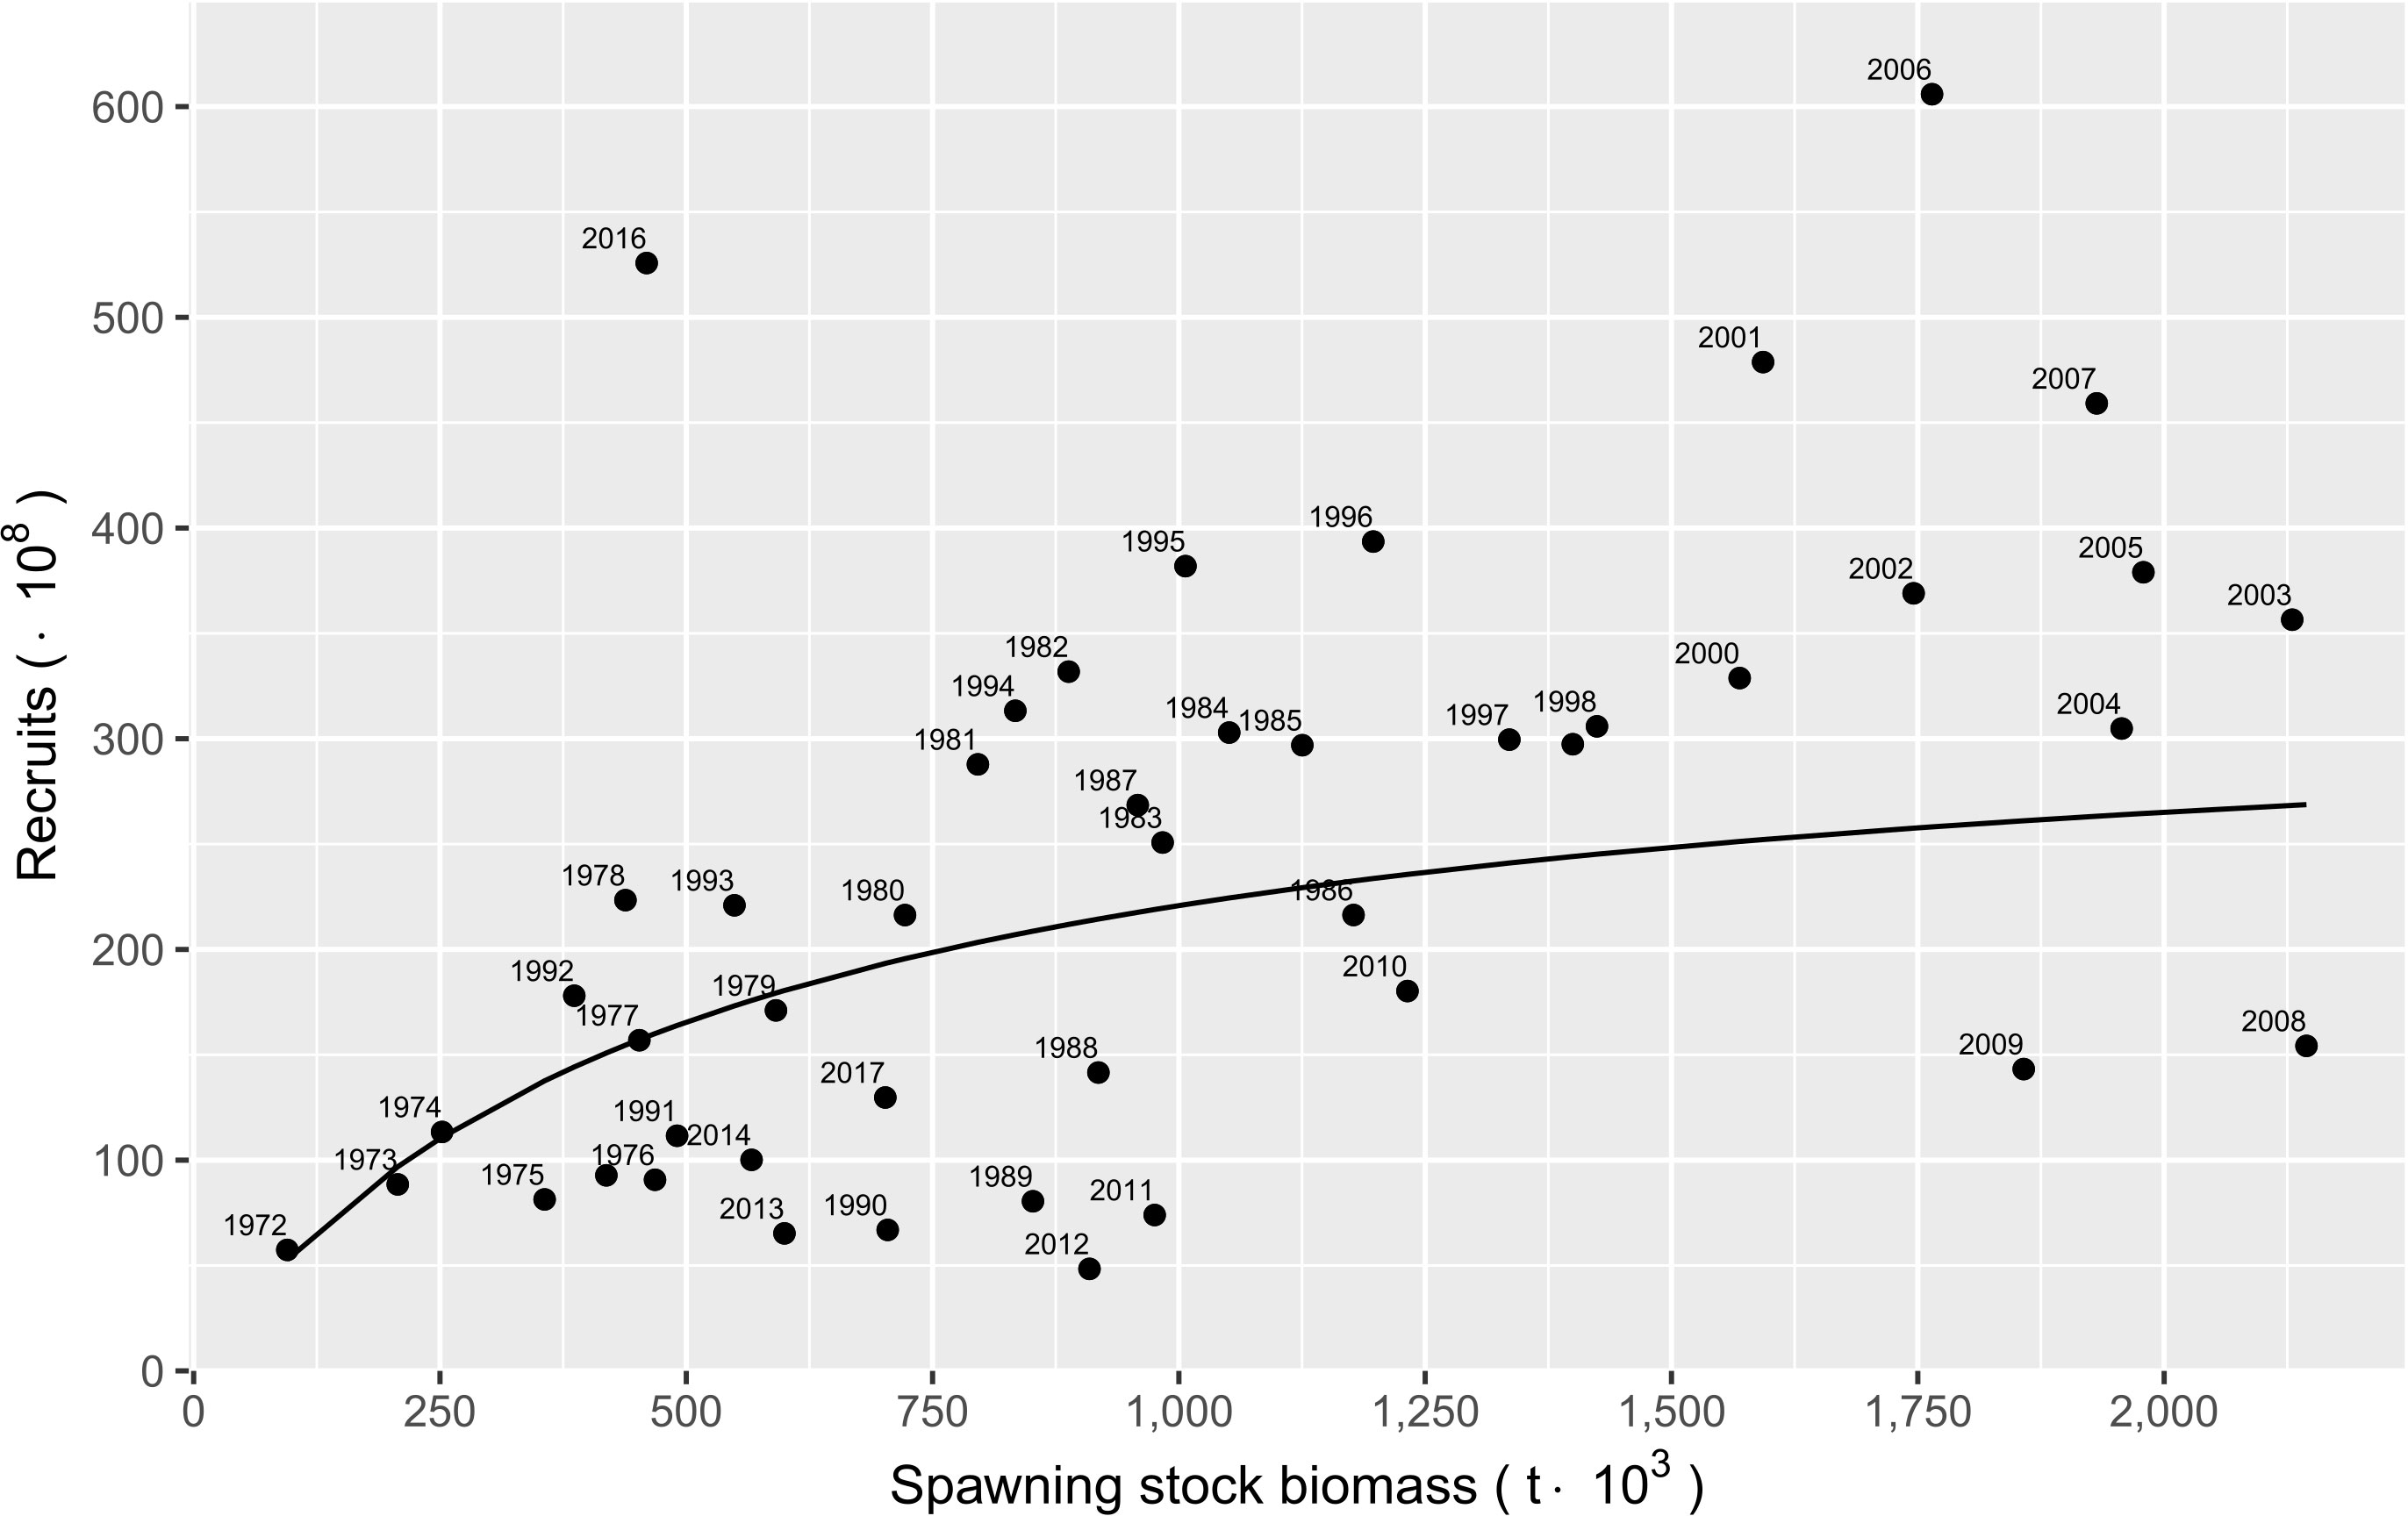
Figure 6 Spawning stock biomass−recruitment relationship for Pacific sardine (Sardinops sagax) from the Gulf of California, Mexico. The solid line represents the stock−recruitment model fitted to the observed data (black points).
The changes in fishing mortality have shown low variability since the 1970s. Its value was estimated to have remained below 0.25 over time. During the 1970s, the fishing mortality was less than 0.1, except in 1972 when the Pacific sardine fishery began the harvest (0.18). Later, in the mid-1980s, the fishing mortality increased from 0.07 to 0.23, with values falling below 0.11 from 1992 to 2007 (Figure 7A). The next peak in fishing mortality occurred in 2010, when it was about 0.14 then below 0.10 afterwards, with a minimum from 2014–2016. Finally, the last peak with fishing mortalities of 0.09 and 0.08 were estimated for 2017 and 2018, respectively (Figure 7A). The results of F at age over time series indicated that highest fishing mortalities occurred for age groups 1, 2 and 3, with averages values of 0.11 (SD = 0.11), 0.16 (SD = 0.11) and 0.10 (SD = 0.07); respectively (Supplementary Material, Table S3).
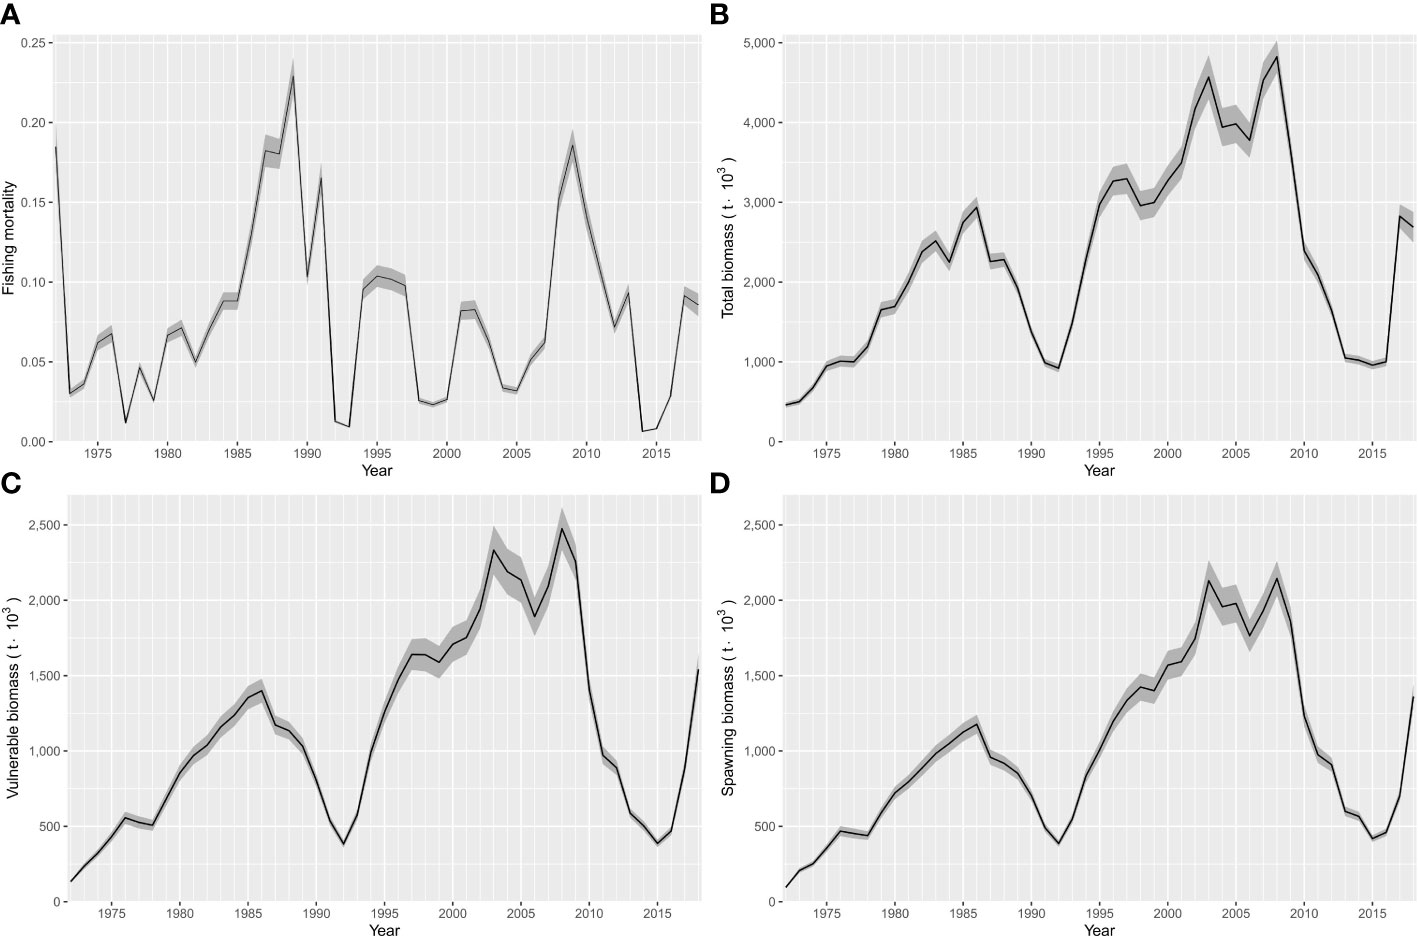
Figure 7 Outcomes estimated from ASAP for Pacific sardine (Sardinops sagax) from the Gulf of California, Mexico. (A) Interannual variability in fishing mortality, (B) Interannual variability of total biomass, (C) Interannual variability of vulnerable biomass, and (D) Interannual variability of spawning biomass. The shaded areas indicate the confidence interval (P< 0.05).
The changes in total biomass from 1972 to 2018 are shown in Figure 7B. Historically, the total biomass varied from 461 thousand to 4.82 million t during 1972 and 2008, respectively. In the 1970s and 1980s, a maximum biomass close to 2.9 million t was reached, and the second peak from the mid-1990s to the late 2000s showed that the total biomass varied between 2.9 and 4.8 x 10³ t. Only two declines were estimated in the time series of total biomass, the first during the early 1990s and the second during the early 2010s. The changes in vulnerable biomass (Figure 7C) and spawning biomass (Figure 7D) followed a similar trend in variability. Age classes from 1 to 6 years structured the spawning biomass; therefore, these annual classes were completely recruited to the fishery and harvested. Thus, the vulnerable biomass depends on the abundance of spawners and the recruits during each year (Supplementary Material, Table S4).
In this study, a 6-year retrospective analysis was performed on recruitment (ρ = 0.115), spawning stock biomass (ρ = -0.015), and fishing mortality (ρ = 0.017). In general, the retrospective patterns assessed through were acceptable, with low values inside its previously established range () (Figure 8). These results indicated a low risk of model misspecification; therefore, the stock assessment model for the Pacific sardine in the Gulf of California is suitable for management advice. The historical status of the Pacific sardine over the years showed only trajectories into the zones identified as outside safe biological limits (Bt/BMSY< 1, Ft/FMSY< 1) and the target zone for fishery management (Bt/BMSY > 1, Ft/FMSY< 1). The time periods indicating that the Pacific sardine fishery was outside safe biological limits were 1972–1978, 1991–1993, 2015–2016. Comparatively, the Pacific sardine fishery has mainly remained in the target zone for fishery management without temporal incursions toward the overfishing (Bt/BMSY > 1, Ft/FMSY > 1) or risk zones (Bt/BMSY< 1, Ft/FMSY > 1) (Figure 9).
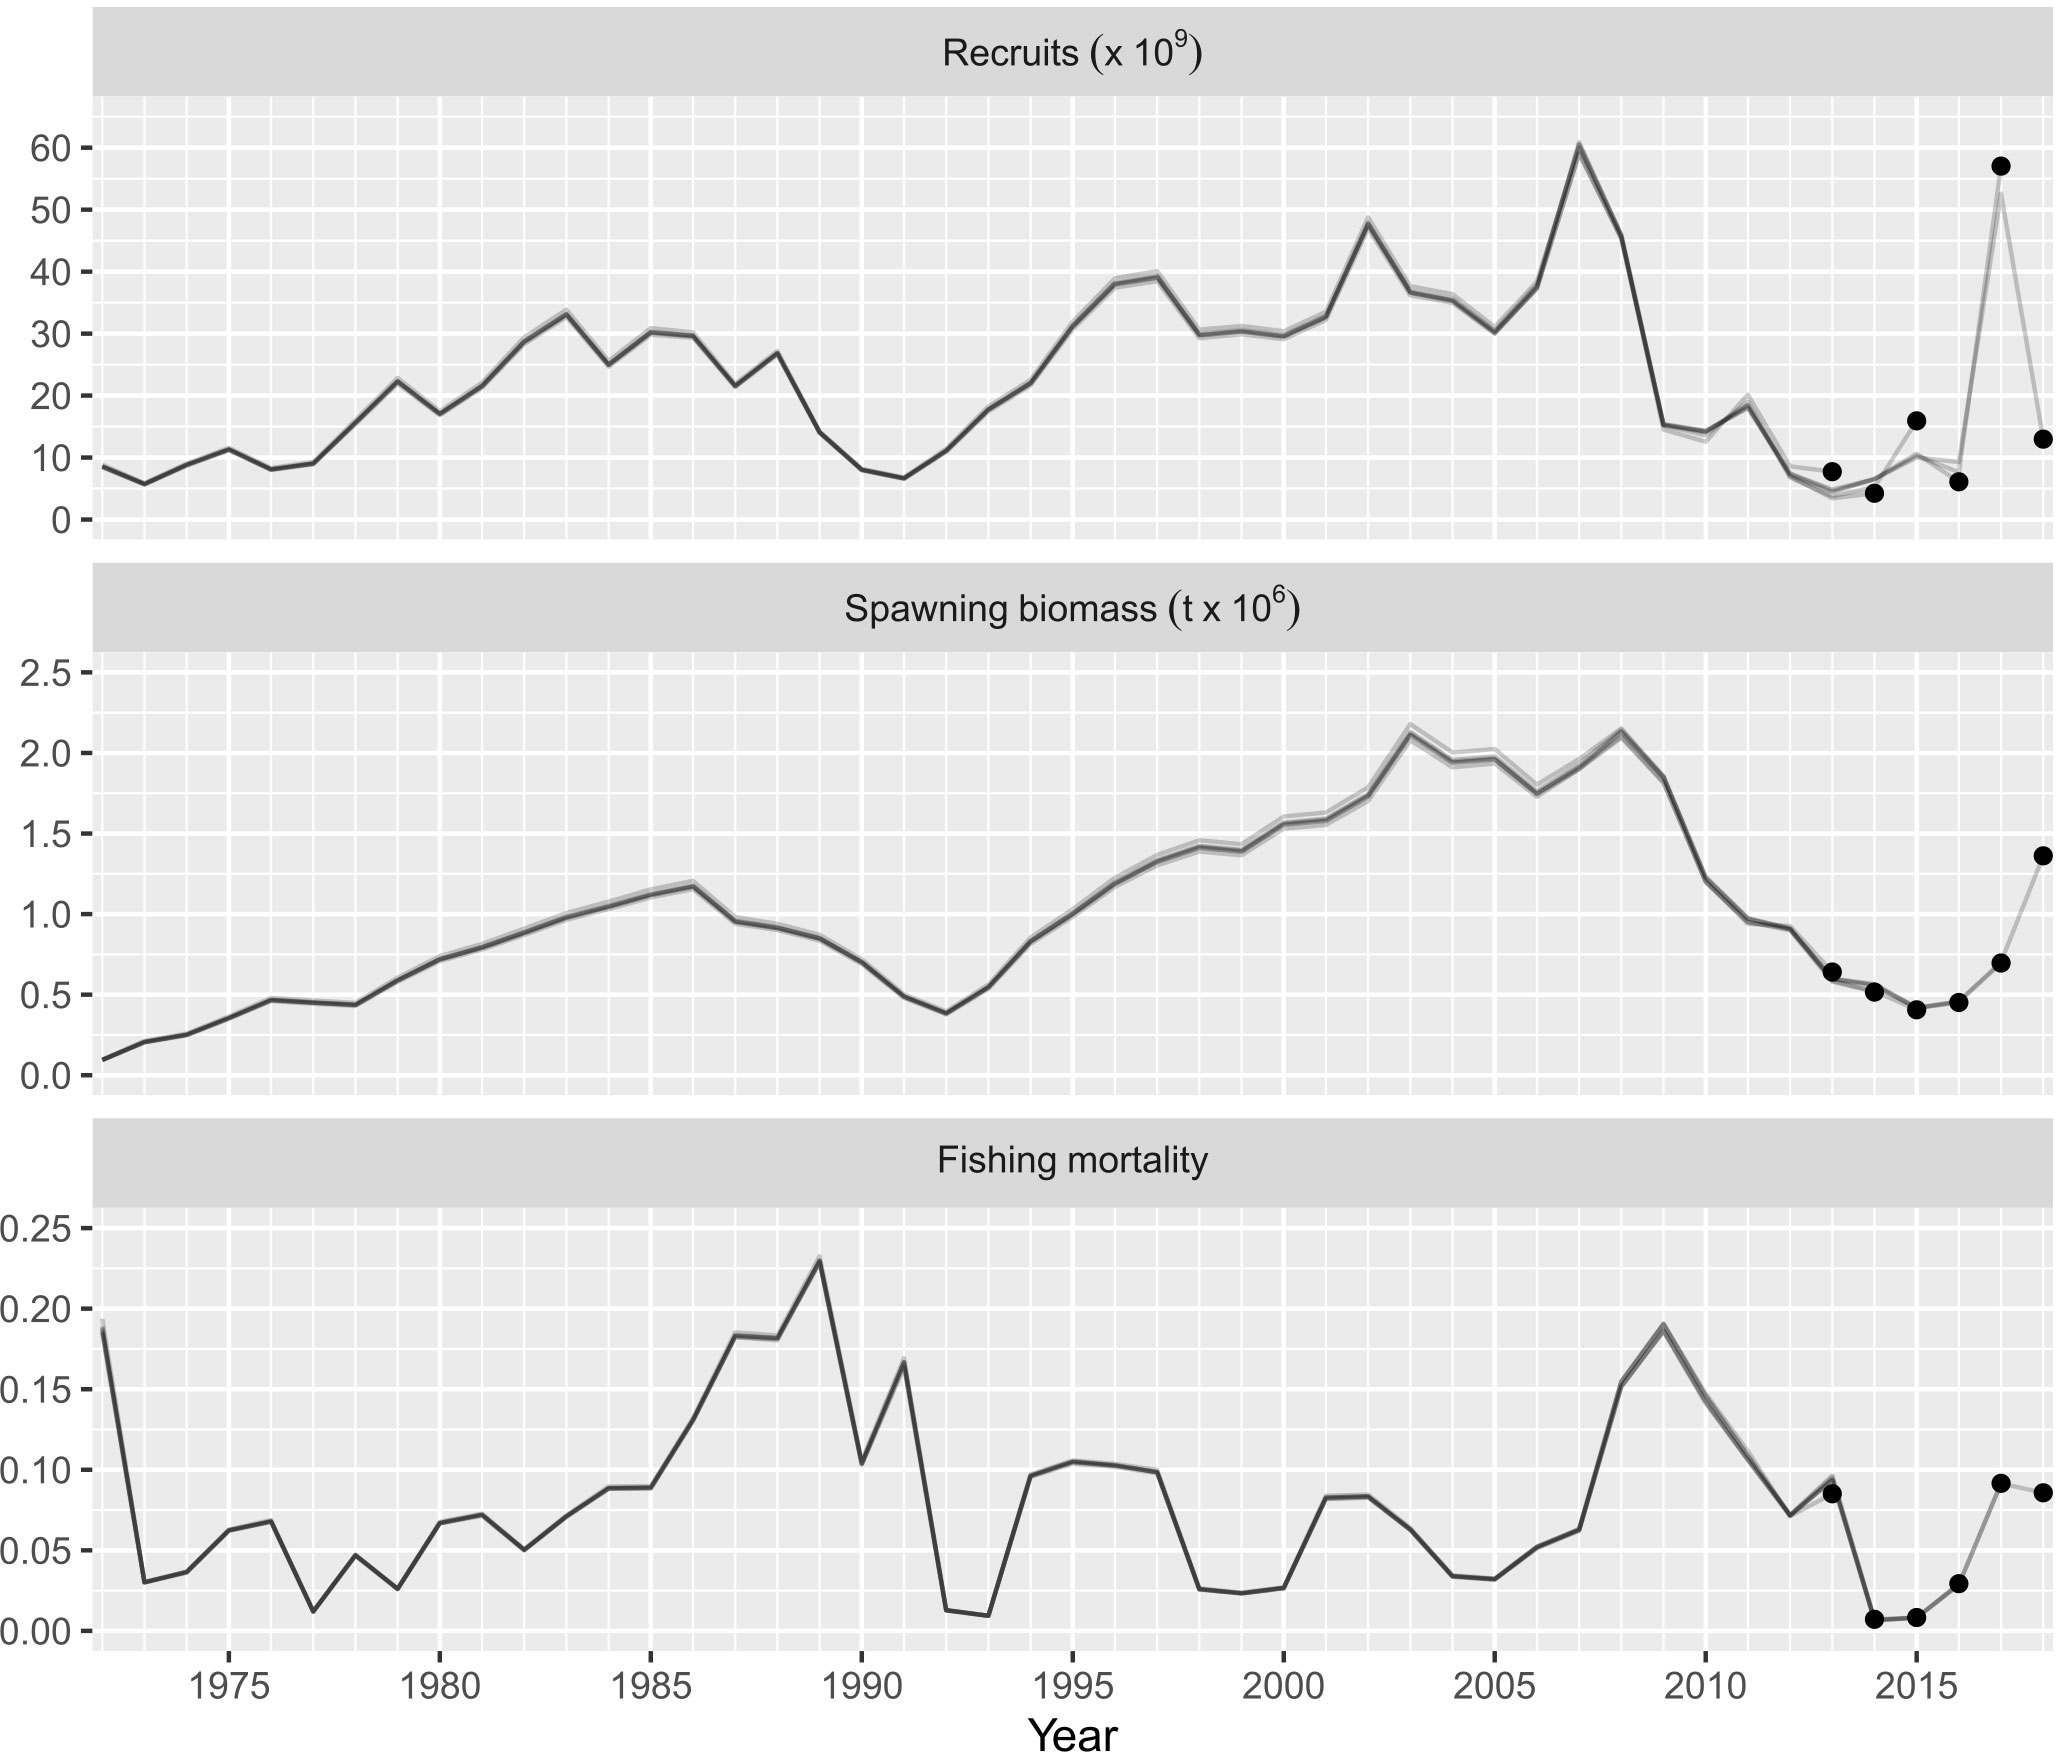
Figure 8 Relative difference for retrospective patterns analysis (Mohn’s values) for the recruitment, spawning stock biomass, and fully-selected F of Pacific sardine (Sardinops sagax) from the Gulf of California, Mexico; their corresponding Mohn’s ρ values using the ASAP model are included.
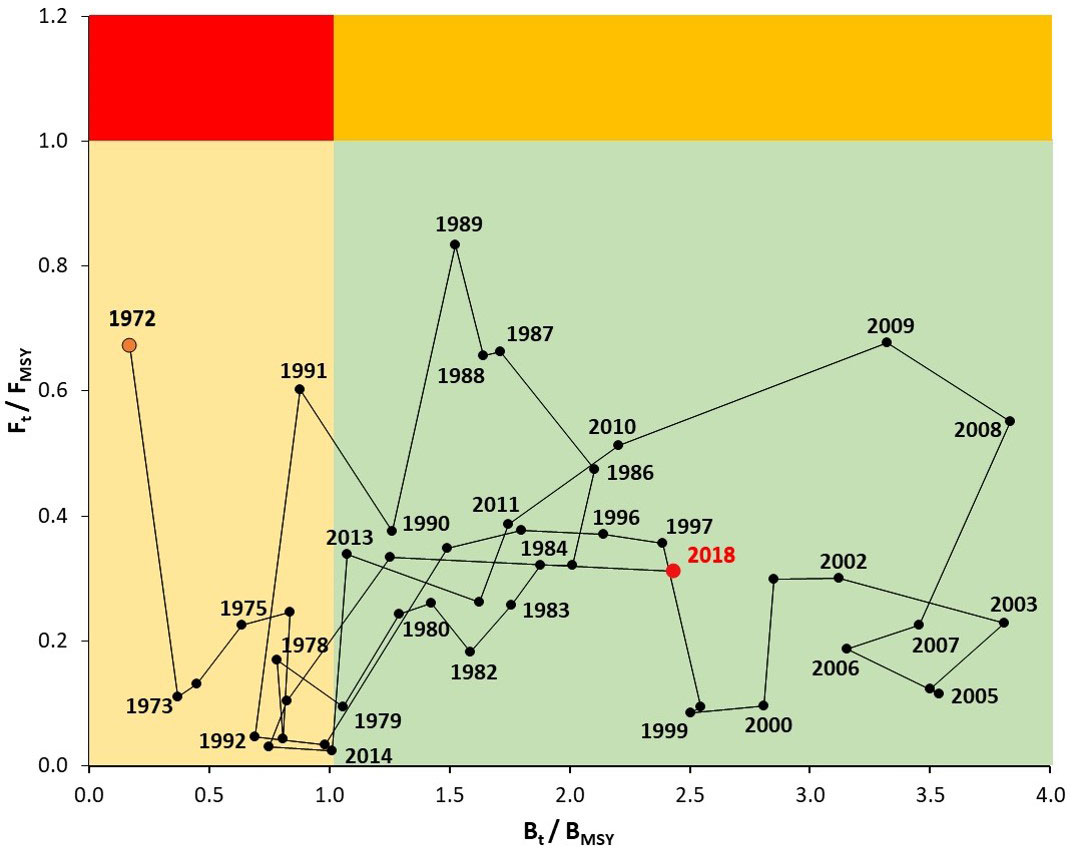
Figure 9 Kobe phases plot for Pacific sardine (Sardinops sagax) from the Gulf of California, Mexico. The time series of annual estimates of biomass (Bt) and fishing mortality (Ft) relative to the reference points of BMSY and FMSY are shown.
The sensitivity analysis for the four scenarios analyzed showed differences in the magnitude of the spawning stock biomass, the highest values were estimated for the time series from 1972 to 2018 and M = 0.8; conversely the lower biomass was computed using the time series from 1990 to 2018 and M = 0.7; this indicated the spawning stock biomass outcomes provided from ASAP are influenced through the survey time series, and the M values assumed in the model. Comparatively, the times series from 1979 to 2018 and 1972 to 2018, using M = 0.7 and 0.6; respectively, both analyses indicated similar trajectories of spawning stock biomass. Although the changes in spawning stock biomass were evident for each combination of time series and natural mortality; the different analyses showed similar trend in the rise and fall of biomass; highlighting the peaks of 1986, 1998, 2003, 2008 and 2018; while the lower values of spawning stock biomass were estimated during 1972-1974, 1992, and 2016 (Figure 10A). The changes in recruitment were also evident when the time series and M were modified. The highest recruitments were computed using M = 0.8, while the number of recruits estimated using M = 0.6 and 0.7 were lower, exhibiting similar trajectories and closer among them. Despite, the differences previously described in the magnitude of the number of recruits, the four scenarios analyzed indicated the same peaks of abundance of recruits in the time series, a similar pattern was also observed for the declines in recruitment (Figure 10C). Finally, along time series, similar outputs were estimated for the values of annual fishing mortality. In this case, the time series from 1972 to 2018 and 1979 to 2018 exhibited similar and closer values of fishing mortality. Comparatively, the times series from 1990 to 2018 using M = 0.7 provided high values of fishing mortality, even during 1990-1992 and 2009-2010 were higher than 0.3. In contrast, the time series from 1972 to 2018 using M = 0.8 computed low values of fishing mortality, predominating along time series values lower than 0.1 (Figure 10B). The configurations of uncertainty derived from sensitivity analysis and values estimated for the analysis of retrospective patterns, including recruitment parameters and management quantities are shown in Table 3. Specifically, the values of Mohn’s ρ statistic ranged from -0.22< < 0.30, indicating an acceptable stock assessment for Pacific sardine fishery in the Gulf of California for each scenario where the sensitivity analysis was computed.
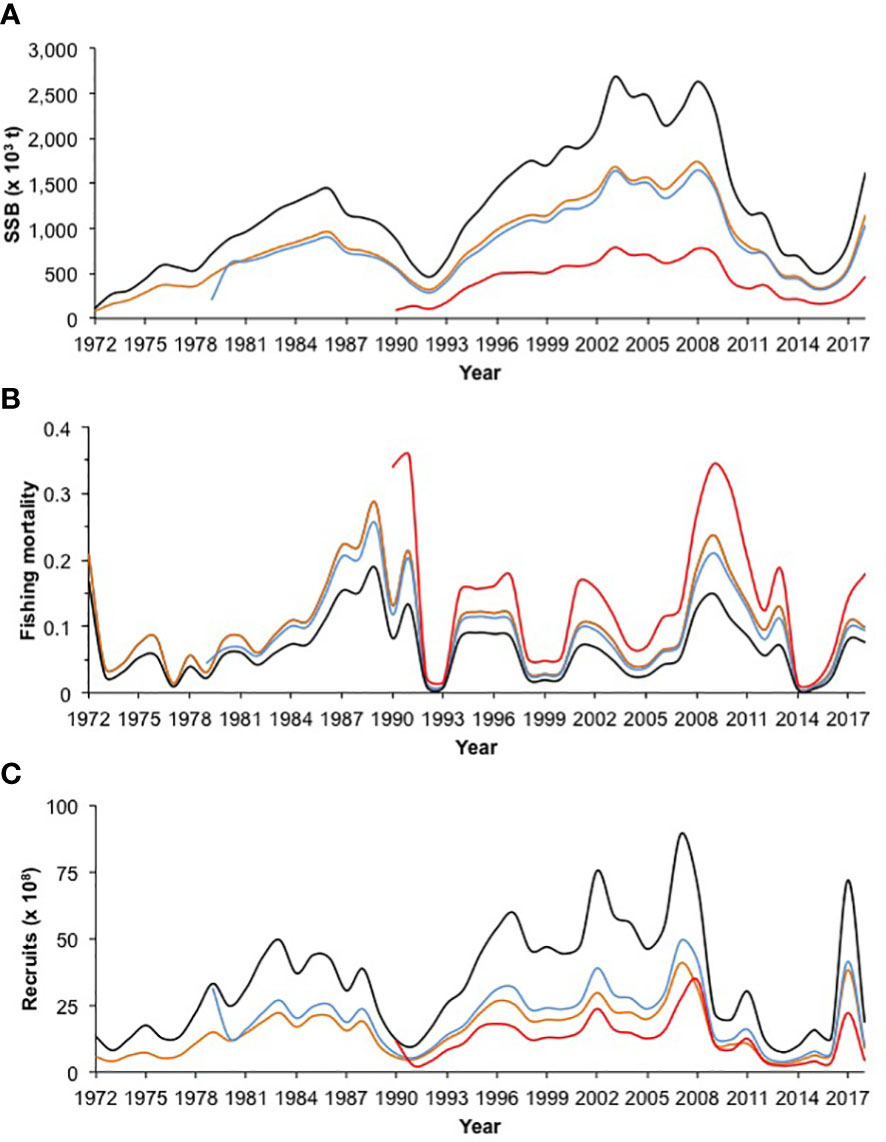
Figure 10 (A) Spawning stock biomass (SSB), (B) fishing mortality, and (C) recruits estimated from the sensitivity analysis of Pacific sardine fishery in the Gulf of California. The configurations in the sensitivity analysis were as follows: i) 1972-2018, M = 0.8 (black line); ii) 1972-2018, M = 0.6 (orange line); iii) 1979-2018, M = 0.7 (blue line); and iv) 1990-2018, M = 0.7 (red line).
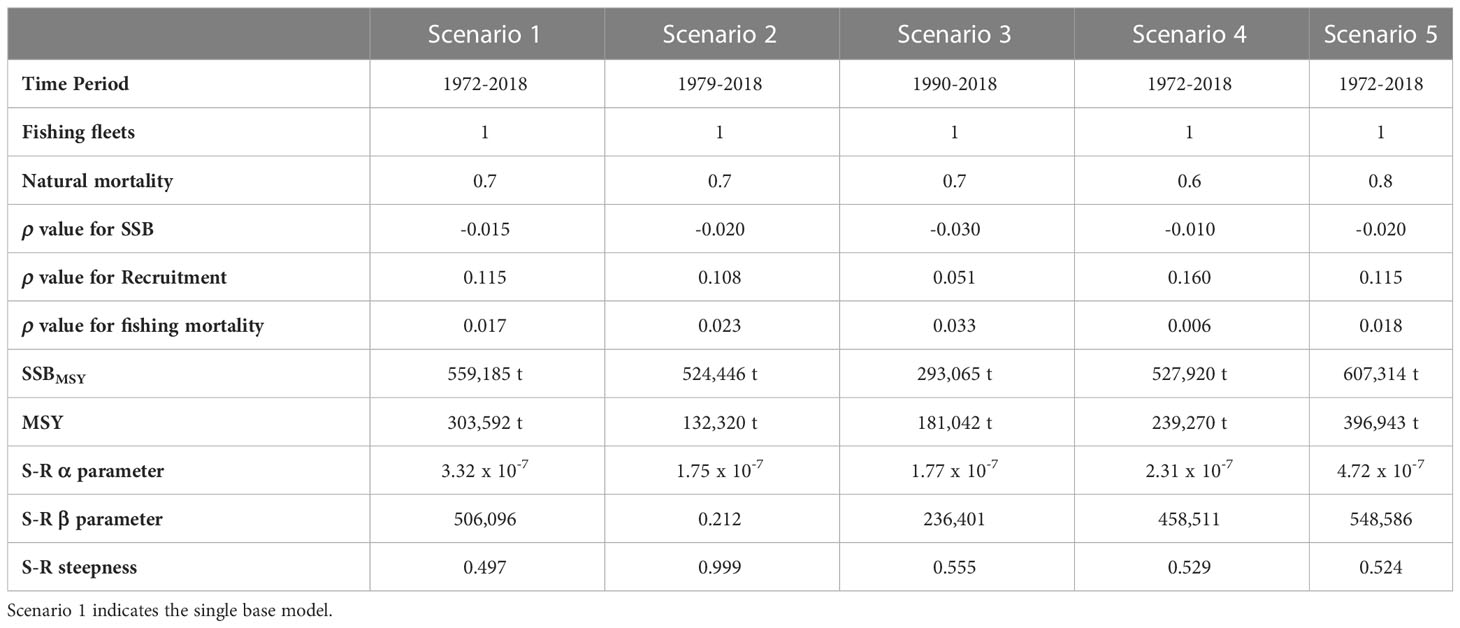
Table 3 Configurations of uncertainty for the sensitivity analysis of Pacific sardine fishery in the Gulf of California, including values estimated for the analysis of retrospective patterns, recruitment parameters and management quantities.
Discussion
Twenty-five years ago, the first attempts to explain the interannual variability in catches and availability of biomass of the Pacific sardine in the Gulf of California were analyzed and documented (Cisneros-Mata et al., 1995; Cisneros-Mata et al., 1996b; Nevárez-Martínez et al., 1999; Nevárez-Martínez et al., 2001). The high and sudden fluctuations in Pacific sardine abundance are a challenge, and the hypotheses studied indicate two possibilities: the environmental stochasticity affected the abundance (Nevárez-Martínez et al., 2001) or density-dependent effects, where a mechanism of overcompensation in the Pacific sardine population could be operating (e.g., increasing cannibalism) (Cisneros-Mata et al., 1995). Since 1972, the Pacific sardine has suffered four declines, including an unusual recovery with a historic Pacific sardine catch record (2008−2009). This periodicity in the apparent productivity of the stock was identified in the estimates of the indices of relative abundance used in this study (survey catch rate index); the data indicated that during the periods of 1990−1993 and 2012−2015, the indices of relative abundance of the survey catch rate, acoustic survey, and spawning probability were coincident, suggesting a fall in the abundance of the Pacific sardine. The estimates of the bird diet index showed a tendency to stay relatively stable; only a slight decline during 2012 was computed, indicating a potential change in Pacific sardine abundance, while the estimated egg and larvae index values showed the changes in Pacific sardine abundance between 1972 and 1988, mainly from 1984 to 1986 when the Pacific sardine fishery reached its first historic peak of abundance and catch.
The harvest of Pacific sardine occurs with annual cycles excepting August and September; therefore the indices of relative abundance used in this study were estimated in-season. In this way, there was not availability of information preseason for obtaining biological knowledge on the Pacific sardine stock condition before harvest. Given that this study is the first to analyze the changes in the abundance of Pacific sardine based on an integrated stock assessment model, the inclusion of different data sources was necessary, particularly five available indices of relative abundance. The main assumption is that each index of relative abundance is proportional to the abundance (Hilborn and Walters, 1992). However, the statistical methods for the tuning of catch-at-age analysis using indices of relative abundance are particularly sensitive to observation error; consequently, when several indices of relative abundance are used, all of the available indices are prone to this statistical error (Shepherd, 1999; Linton and Bence, 2008). Therefore, the observed indices of relative abundance analyzed through ASAP are typically assumed to have multiplicative errors that are lognormally distributed; this assumption is used because theoretically, the logarithm transformation can transform the data to a normal distribution and stabilize the variances, and therefore the indices make an improved contribution to the stock assessment (Quinn and Deriso, 1999; Dichmont et al., 2016a). Thus, the expectation is that the indices can be informative about Pacific sardine abundance; however, the bird diet ratio index showed a contradictory tendency to those indicated by the survey catch rate index, with the main difference being between 2000 and 2004, where the bird diet ratio index had low values in comparison to the high values of the survey catch rate. Given that Heermann’s gulls and Elegant terns have a spatial range limited to a few km2 around Isla Rasa, in the Gulf of California, there is a possibility that this index reflects changes in the spatial distribution of Pacific sardine fishery during the study period rather than changes in stock abundance. So, the bird diet ratio index has not consistently indexed the entire Pacific sardine stock, resulting in biased annual indices. Conversely, survey catch rate, acoustic survey, spawning, and egg and larvae indices had a wide spatial coverage in the Gulf of California, and they were more informative about changes in Pacific sardine abundance in the region.
The changes in abundance of Pacific sardine could be influenced by the variability in the age structure over time. During 1970s the population exhibited seven age classes, with the highest abundance for age classes of 3 and 4 years (Sokolov and Wong, l972). During early 1980s, the presence of recruits (age class 0) was drastically diminished, and the age composition showed only 4 age classes, where age classes 2 and 3 were the most abundant; however during late 1980s the age composition showed 7 age classes (from 0 to 6 years), with high abundance for age classes 1, 2, and 3. Recently, the age structure has remained relatively stable with presence of age classes between 0 and 5 years, where the age classes most abundant were 0, 1, and 2, conversely the age classes 3, 4, and 5 were less abundant (Nevárez-Martínez et al., 2019). This condition in the sardine population could suggest a potential failure in the productivity of the spawning stock; comparatively during 1972-1997 the spawning biomass declines did not affect the population dynamics of Pacific sardine and the minimum spawning stock size was not reached ( 287 million spawning adults) (Morales-Bojórquez and Nevárez-Martínez, 2005). However, from 1998 to 2020 dramatic changes occurred in abundance, mainly from 2006 to 2014, therefore to analyze if the spawning stock has been affected by fishing pressure, environmental variability or both is necessary for understanding the responses of the sardine stock in the Gulf of California.
In this way, one sensitivity analysis was performed with the model starting in 1979, when the spawning probability data began, such that the impacts on recruitment, spawning biomass, and fishing mortality were assessed through the influence and contrast in the temporal change of this index. Additionally, an alternative scenario was analyzed with the model starting in 1990, in this way, the egg and larvae index was excluded, therefore the influence in the long-term (1990-2018) of the survey catch rate and bird diet ratio was assessed. These scenarios and comparisons allowed us to observe changes in the magnitude of recruits, spawning biomass, and fishing mortality, such that their comparison with the final base model provided cues about the uncertainty in the stock assessment results. In this way, the three most important outcomes for fishery management are expressed through ASAP: i) stock size (the number of fish by age group at a particular point in time), ii) stock productivity (usually defined by the number of recruits), and iii) stock mortality (frequently the fishing mortality).
The use of different indices of relative abundance to investigate the current sardine abundance has been a recurrent issue in the stock assessment of Pacific sardine fishery (Barnes et al., 1992; Deriso et al., 1996; Simmonds, 2003). Depending on the stock analyzed, the indices have exhibited different results in estimating the changes in biomass. For small pelagic species, the ichthyoplankton survey provides important data on daily egg production and spawning sardine biomass supported by the daily egg production method (Bentley et al., 1994; Lo et al., 1996). Although these estimates can be compared with outputs derived from conventional stock assessment models, the comparison cannot be strictly valid, unless an integrated method of stock assessment that combines fishery-dependent and fishery-independent data was used (Maunder, 2003). For Pacific sardine fishery in the California Current, the data from the ichthyoplankton survey were sufficiently informative on the stock status; however, historically several indices of relative abundance have been included, analyzed, and discarded (e.g. reproduction area, number of marine stations with presence of egg or larvae), therefore the update on the indices is conditional on spatial coverage reflecting the Pacific sardine stock distribution, the availability in the time series, and the accuracy of the indices, mainly associated with random and systematic errors (Jacobson and MacCall, 1995; Lo et al., 1996; Richards and Schnute, 1998; Simmonds and MacLennan, 2005). Another index of relative abundance that is sufficiently informative on the stock condition of small pelagic populations is the acoustic survey, which was found to be the most reliable for the North Sea herring (Simmonds, 2003). Similarly, Hampton (1996) compared 10-year time series of acoustic and egg surveys of the anchovy Engraulis capensis, and both data sources reflected the same major changes in abundance. In this study, the spawning and acoustic indices denoted the changes in abundance of Pacific sardine better than the survey catch rate and bird diet ratio.
The ASAP model showed the importance of age group 0 (recruits); this was the most important age group in the Pacific sardine fishery, and the contribution to abundance in this age group has consequences for the variability of the total abundance of the species. Thus, the importance of the recruitment in this fishery is widely recognized (Jacobson and MacCall, 1995; Morales-Bojórquez and Nevárez-Martínez, 2005). The contribution to the abundance of age group 1 was relatively important, but individuals older than 2 years were low in abundance; thus, the Pacific sardine fishery depends mainly on the abundance of recruits. The total abundance showed two peaks of high availability, the first during the 1980s and the second from the mid-1990s to 2009, with the second peak being even more abundant and temporally more extended. Similarly, the Pacific sardine of California showed an early recovery between 1986 and 1991 (Wolf, 1992), and a period of stock recovery was observed from 1994 to 2010 (Hill et al., 2006; Dorval et al., 2015). This pattern in variability is the same observed in our analysis. The fall in abundance estimated from 2009 to 2015 in the sardine population in the Gulf of California was also forecasted off California; the change was inferred from indices of the sardine spawning stock biomass, the daily egg production method, annual survey reports, and acoustic-trawl surveys, all indicators indicating that the northern Pacific sardine stock off the west coast of North America was declining (Zwolinski and Demer, 2012). Quantitatively, the spawning stock biomass for the Pacific sardine in the Gulf of California has been managed based on a biological reference point able to identify depensation in the Pacific sardine population, thus depensation could occur when a spawning biomass of less than 287 million individuals is reached (Morales-Bojórquez and Nevárez-Martínez, 2005). Although this reference point is useful for indicating failures in recruitment, it does not allow definition of a spawning biomass that positively influences high recruitments and harvest.
Finally, the changes in vulnerable biomass indicated that the Pacific sardine could be harvested along time series. The apparent high biomass levels during the periods of 1982−1989 and 1994−2011 and in 2018 suggested sufficient annual harvestable biomass; however, the yields were low. The annual fishing mortality estimates did not show increments related to the periods of high harvestable biomass; therefore, the catch records were low in comparison to the harvestable biomass estimated from ASAP. According to Nevárez-Martínez et al. (1999), the fishing mortality reduces the spawning biomass, causing very strong density dependence, in turn increasing the risk of low recruitment. This could occur with an annual fishing mortality close to 0.47 or greater; however, this study estimated annual fishing mortalities were less than 0.22 during periods of high abundance. Consequently, the variability in the annual fishing mortality does not completely explain the changes in biomass. An explanation of this could be associated with the availability of the Pacific sardine to the fishing fleet; the environmental stochasticity plays an important role in the spatial distribution of the Pacific sardine, affecting its abundance, survival, growth, and spawning success (Huato-Soberanis and Lluch-Belda, 1987; Cisneros-Mata et al., 1996b; Lluch-Cota et al., 1999; Nevárez-Martínez et al., 2001; Dorval et al., 2015). Although this issue is particularly relevant, the environment−sardine population relationship is beyond the scope of this study, which is based on an integrated catch-at-age analysis for modeling the temporal changes in abundance, biomass, and recruitment. Further analyses are necessary to understand jointly the effects of fishing mortality and the environment on the population dynamics of the Pacific sardine.
The changes in biomass and the variability observed in the Pacific sardine fishery were validated for the model diagnostics; the retrospective patterns did not identify poor fits to data and determine the robustness of estimates for management purposes. Mohn’s values were estimated in the expected range (-0.22< < 0.30) (Hurtado-Ferro et al., 2015). According to previous background, the current status of the Pacific sardine fishery in the Gulf of California is in the target zone. This condition has occurred 75% of the time throughout the time series (1972–2018), while the fishery has been outside safe biological limits (Bt/BMSY< 1, Ft/FMSY< 1) during 12 years. The time period 1972–1978 could be identified as the pre-development phase in the Pacific sardine fishery, therefore the catches were relatively low impact for the biomass estimates. The time period from 1991 to 1993 is known due to the fall in recruitment and adult stock influenced by the El Ninão event in the California Current (Hayward, 1993; Hayward et al., 1994; Morales-Bojórquez and Nevárez-Martínez, 2005); when the California Current returned to a typical circulation pattern during 1994 (Hayward et al., 1995), the Pacific sardine population had a rapid recovery (Morales-Bojórquez and Nevárez-Martínez, 2005). Additionally, during 2015–2016, the Pacific sardine fishery was also outside the safe biological limits (although with values very close to unity); and in these years the marine ecosystem was also influenced by the 2015/2016 El Niño event, in addition to the abundance of other pelagic species is observed, mainly Pacific thread herring (Opisthonema spp.), chub mackerel (Scomber japonicus), and Pacific anchovy (Cetengraulis mysticetus).
The Pacific sardine fishery in the Gulf of California has been fully exploited with an apparent stable level of harvest (Bt/BMSY > 1, Ft/FMSY< 1), excluding years where the environment is clearly identified as a force factor causing changes in biomass and availability of the Pacific sardine. This study suggested that the implementation of the strategies used in the fishery have avoided the risk of overharvest in the Pacific sardine population, mainly the application of a low effort level (limited to 60 fishing vessels as the maximum number of vessels registered in the fishery), minimum legal size of 150 mm standard length, and closure fishing season in the summer months (Mexican Official Standard NOM-003-SAG/PESC-2018). Currently, the Pacific sardine fishery is sustainable, and historically with a relatively low possibility to belong to the risk zone (Bt/BMSY< 1, Ft/FMSY > 1), although this situation must be constantly analyzed for the stock assessment group and the Mexican stakeholders.
The variability observed in the management quantities were influenced of two main factors; the first, the changes in natural mortality, which had effect on the values of abundance and/or biomass, where the increasing in M caused overestimation of abundance, and viceversa; such as was observed for the sensitivity analysis from 1972 to 2018 using M = 0.8 providing the highest spawning stock biomass along time series. In this study, for the single base model a value of M = 0.7 was used, this estimation was supported by previous reports, where the natural mortality for recruits and adults of Pacific sardine varied between 0.6 and 0.8 (Murphy, 1966; Smith et al., 1992; Cisneros-Mata et al., 1997; Morales-Bojórquez et al., 2003; Martínez-Aguilar et al., 2005).
The second factor was associated with the influence of the indices of relative abundance used in this study, the single base model used five indices, and this configuration was used for two options of natural mortality (0.6 and 0.8); while the configuration from 1979 to 2018 and M = 0.7 mainly used four indices of relative abundance, partially excluding the values of egg and larvae, therefore the variance weightings were estimated for the indices of survey catch rate, acoustic survey, spawning probability, and feeding of marine birds. The time series did not show changes in recruits, spawning stock biomass or fishing mortality in comparison to the estimates provided through single base model. However, when the sensitivity analysis was computed for the time series from 1990 to 2018 and M = 0.7, the spawning stock biomass and recruits showed underestimation; in contrast the fishing mortality exhibited overestimation along time series, such that the results were different to the single base model. The configuration of the ASAP model for the time series 1990-2018 partially used the spawning probability, excluding the values of egg and larvae, and used the indices of relative abundance of survey catch rate, acoustic survey, and feeding of marine birds.
The sensitivity analysis for the four scenarios indicated different levels of spawning stock biomass, recruitment and fishing mortality, therefore these management quantities and their variability are associated with the uncertainty for Pacific sardine fishery management, recognizing that a single base model does not explicitly account for alternative assumptions for Pacific sardine population dynamics and fishery processes (i.e. time series from 1972 to 2018 and M = 0.7); jointly these included the error estimate as a measure of statistical uncertainty within ASAP that is conditioned on all the structural assumptions embedded within the model. Therefore, the accuracy of the parameterization depends on how well the joint negative log-likelihood surface at its maximum can be numerically approximated, considering the proper specification of the partial negative log-likelihood components, including appropriate probabilistic density functions, the error distributions, and variance weightings. For Pacific sardine in the Gulf of California, the final base model is including the best available scientific information with almost half century of data, the assumptions about the Pacific sardine biology are plausible from the configuration used in the ASAP model. In this way, a reasonable parameterization was computed and the management quantities were statistically robust, such as was exhibited from the analysis of retrospective patterns. In this sense, although the of retrospective patterns were estimated as -0.22< < 0.30 for the four configurations in the sensitivity analysis (Hurtado-Ferro et al., 2015); the configuration using the time series from 1990 to 2018 and M = 0.7 could not be feasible, because the comparison with the fishery independent data (acoustic survey) showed that the Pacific sardine biomass has varied between 407 thousand and 3.29 million t, while the configuration using the time series from 1990 to 2018 and M = 0.7 provided biomass values slightly higher that 500 thousand t, with SSBMSY = 181,042 t; this scenario is not realistic; Cisneros-Mata et al. (1996a) and Morales-Bojórquez and Nevárez-Martínez (2005) showed the Pacific sardine biomass in the Gulf of California was during several years greater than 500 thousand t.
The results showed that Pacific sardine fishery in the Gulf of California has had changes and transitions in its abundance, biomass, recruitment and fishing mortality, although the natural variability in the Pacific sardine population is unavoidable (Baumgartner et al., 1992); this study indicated that the Pacific sardine fishery has been managed for long-term sustainability, the results of the analysis of retrospective patterns, Kobe plot, and sensitivity analysis provided evidences about the best scientific management, and provided a perspective of the uncertainty around of the final base model. Nonetheless, future scenarios of sensitivity evaluations for final base model could be included, mainly for analyzing the effects of the survey catchability uncertainty, and assumptions of recruitment variability. The purpose is to provide the best scientific advice to the stakeholders for maintaining the long-term sustainability of Pacific sardine fishery in the region.
Data availability statement
The raw data supporting the conclusions of this article will be made available by the authors, without undue reservation.
Ethics statement
The animal study was reviewed and approved by INAPESCA, CONAPESCA Mexico.
Author contributions
MN-M, MM-Z, EM-B, HV and JS-M contributed to the data acquisition and analysis and data interpretation. MN-M, EM-B and ML-C wrote the first draft of the manuscript. EM-B, MN-M, ML-C, AO-V, FD-V and HV contributed to the preparation of figures and drafting of the manuscript. MN-M, EM-B, JL-M and HV contributed to the data analysis and figure preparation. MN-M, HV, VG-M and MM-Z contributed to the design and conception of the sampling. MN-M and EM-B were responsible for the conceptualization, methodology, and supervision. All authors contributed to the article and approved the submitted version.
Funding
The authors thank INAPESCA-CRIAP (National Fishing and 1881 Aquaculture Institute − Regional Centers for Aquaculture and Fisheries Research) from Guaymas for the materials and financial support given to this research. HV would like to thank the support from COFAA-IPN and EDI-IPN. JL-M thanks the financial funding to CONACyT México through the project number SEMARNAT- 2017-2018-01-A3-S-77965. AO-V and FD-V would like to thank the support from CONAYT.
Acknowledgments
We thank all the researchers for their contributions to this and past Pacific sardine stock assessments group, mainly from CRIAP Ensenada, CRIAP Mazatlán, CRIAP Guaymas and IPN-CICIMAR. The scientific results and conclusions, as well as any views and opinions expressed herein, are those of the authors and do not necessarily reflect those of INAPESCA. The authors thank to seven reviewers and Associate Editor Andrea Belgrano who offered valuable suggestions that greatly improved the presentation and readability of this study.
Conflict of interest
The authors declare that the research was conducted in the absence of any commercial or financial relationships that could be construed as a potential conflict of interest.
Publisher’s note
All claims expressed in this article are solely those of the authors and do not necessarily represent those of their affiliated organizations, or those of the publisher, the editors and the reviewers. Any product that may be evaluated in this article, or claim that may be made by its manufacturer, is not guaranteed or endorsed by the publisher.
Supplementary material
The Supplementary Material for this article can be found online at: https://www.frontiersin.org/articles/10.3389/fmars.2023.940083/full#supplementary-material
Supplementary Figure 1 | Study area for Pacific sardine (Sardinops sagax) where surveys were conducted for obtaining the indices of relative abundance used in this study (i.e., catch rate, acoustic data, egg and larvae data, and spawning data). The zigzag transects are indicated in the Gulf of California, Mexico.
References
Barnes J., Jacobson L. D., MacCall A. D., Wolf P. (1992). Recent population trends and abundance estimates for sardine (Sardinops sagax). Calif. Coop. Oceanic Fish. Invest. Rep. 33, 60–75.
Baumgartner T. R., Soutar A., Ferreira-Bartrina V. (1992). Reconstruction of the history of the Pacific sardine and northern anchovy populations over the past two millennia from sediments of the Santa Barbara basin, California. Calif. Coop. Oceanic Fish. Invest. Rep. 33, 24–40.
Bentley P., Emmet J., Lo N. C. H., Moser G. (1994). Egg production of Pacific sardine (Sardinops sagax) off Oregon in 1994. Calif. Coop. Oceanic Fish. Invest. Rep. 37, 193–200.
Campana S. E., Annand M. C., McMillan J. I. (1995). Graphical and statistical methods for determining the consistency of age determinations. Trans. Am. Fish. Soc 124, 131–138. doi: 10.1577/1548-8659(1995)124<0131:GASMFD>2.3.CO;2
Cao J., Truesdell S. B., Chen Y. (2014). Impacts of seasonal stock mixing on the assessment of Atlantic cod in the gulf of Maine. ICES J. Mar. Sci. 71, 1443–1457. doi: 10.1093/icesjms/fsu066
Carvalho F., Lee H. H., Piner K. R., Kapur M., Clarke S. C. (2018). Can the status of pelagic shark populations be determined using simple fishery indicators? Biol. Cons. 228, 195–204. doi: 10.1016/j.biocon.2018.09.034
Cisneros-Mata M. A., Brey T., Jarre-Teichman A., García-Franco W., Montemayor-López G. (1996b). Artificial neural networks to forecast biomass of Pacific sardine and its environment. Cienc. Mar. 22, 427–442.
Cisneros-Mata M. A., De Anda-Montañez J. A., Estrada-García J. J., Páez-Barrera F., Quiroz-Solís A. (1988). Pesquería de sardina del golfo de California y costa de sinaloa: informe 1986/87 y diagnóstico (Guaymas, Sonora: SEPESCA, Instituto Nacional de la Pesca, Centro Regional de Investigaciones Pesqueras-Guaymas), 68.
Cisneros-Mata M. A., Montemayor-López G., Nevárez-Martínez M. O. (1996a). Modeling deterministic effects of age structure, density dependence, environmental forcing, and fishing on the population dynamics of Sardinops sagax caeruleus in the gulf of California. Calif. Coop. Oceanic Fish. Invest. Rep. 37, 201–208.
Cisneros-Mata M. A., Nevárez-Martínez M. O., Hamman G. (1995). The rise and fall of the Pacific sardine, Sardinops sagax caeruleus girard, in the gulf of California, Mexico. Calif. Coop. Oceanic Fish. Invest. Rep. 36, 136–143.
Cisneros-Mata M. A., Nevárez-Martínez M. O., Martínez-Zavala M. A., Anguiano M. L., Santos-Molina J. P., Godínez-Cota A. R., et al. (1997). Diagnosis de la pesquería de pelágicos menores del golfo de California de 1991/1992-1995/1996 (Guaymas, Sonora: SEPESCA, Instituto Nacional de la Pesca, Centro Regional de Investigaciones Pesqueras-Guaymas), 59.
Conser R., Hill K. T., Crone P. R., Lo N. C. H., Bergen D. (2002). “Stock assessment of Pacific sardine with management recommendations for 2003,” in Executive summary (Portland, OR: US Department of Commerce. NOAA Technical Memorandum).
Cope J. M. (2013). Implementing a statistical catch-at-age model (Stock synthesis) as a tool for deriving overfishing limits in data-limited situations. Fish. Res. 142, 3–14. doi: 10.1016/j.fishres.2012.03.006
Crone P. R., Hill K. T., Zwolinski J. P., Kinney M. J. (2019). Pacific mackerel (Scomber japonicus) stock assessment for U.S. management in the 2019-20 and 2020-21 fishing years (USA: NOAA Fisheries Southwest Fisheries Science Center 8901), 92037. La Jolla Shores DR. La Jolla, CA.
Deriso R. B., Barnes J. T., Jacobson L. D., Arenas P. (1996). Catch-at-age analysis for Pacific sardine (Sardinops sagax), 1983-1995. Calif. Coop. Oceanic Fish. Invest. Rep. 37, 175–187.
Deriso R. B., Quinn I. I. T. J., Neal P. R. (1985). Catch-age analysis with auxiliary information. Can. J. Fish. Aquat. Sci. 42, 815–824. doi: 10.1139/f85-104
Deroba J. J. (2014). Evaluating the consequences of adjusting fish stock assessment estimates of biomass for retrospective patterns using mohn’s rho. N. Amer. J. Fish. Manage. 34, 380–390. doi: 10.1080/02755947.2014.882452
Deroba J. (2015). Atlantic Herring operational assessment report 2015 (Woods Hole, MA: US Dept. Commer., Northeast Fisheries Science Center), 15–16. Ref Doc.
Dichmont C. M., Deng R. A., Punt A. E. (2016b). How many of australia's stock assessments can be conducted using stock assessment packages? Mar. Pol. 74, 279–287. doi: 10.1016/j.marpol.2016.09.033
Dichmont C. M., Deng R. A., Punt A. E., Brodziak J., Chang Y. J., Cope J. M., et al. (2016a). A review of stock assessment packages in the united states. Fish. Res. 183, 447–460. doi: 10.1016/j.fishres.2016.07.001
DOF (2012) Plan de manejo pesquero para la pesquería de pelágicos menores (sardinas, anchovetas, macarela y afines) del noroeste de méxico. Available at: https://dof.gob.mx/nota_detalle.php?codigo=5276945&fecha=08/11/2012#gsc.tab=0 (Accessed September 9, 2022).
Dorval E., McDaniel J. M., Macewicz B. J., Porzio D. L. (2015). Changes in growth and maturation parameters of Pacific sardine Sardinops sagax collected off California during a period of stock recovery from 1994 to 2010. J. Fish Biol. 8, 286–310. doi: 10.1111/jfb.12718
Echazabal-Salazar O., Morales-Bojórquez E., Arreguín-Sánchez F. (2021). Biomass dynamic model for multiple data series: an improved approach for the management of the red grouper (Epinephelus morio) fishery of the campeche bank, Mexico. Reg. Stud. Mar. Sci. 47, 101962. doi: 10.1016/j.rsma.2021.101962
Félix-Uraga R., Gómez-Muñoz V. M., Quiñónez-Velázquez C., Melo-Barrera F. N., García-Franco W. (2004). On the existence of Pacific sardine groups off the west coast of Baja California and southern California. Calif. Coop. Oceanic Fish. Invest. Rep. 45, 146–151.
Félix-Uraga R., Gómez-Muñoz V. M., Quiñónez-Velázquez C., Melo-Barrera F. N., Hill K. T., García-Franco W. (2005). Pacific sardine (Sardinops sagax) stock discrimination off the west coast of Baja California and southern California using otolith mophometry. Calif. Coop. Oceanic Fish. Invest. Rep. 46, 113–121.
Fournier D. A., Archibald C. P. (1982). A general theory for analyzing catch at age data. Can. J. Fish. Aquat. Sci. 39, 1195–1207. doi: 10.1139/f82-157
Fournier D. A., Skaug H. J., Ancheta J., Ianelli J., Magnusson A., Maunder M. N., et al. (2012). AD model builder: using automatic differentiation for statistical inference of highly parameterized complex nonlinear models. Optim. Methods Software 27, 233–249. doi: 10.1080/10556788.2011.597854
Francis R. I. C. C. (2017). Revisiting data weighting in fisheries stock assessment models. Fish. Res. 192, 5–15. doi: 10.1016/j.fishres.2016.06.006
Gaughan D. J., Leary T. I., Mitchell R. W., Wright I. W. (2004). A sudden collapse in distribution of Pacific sardine (Sardinops sagax) off southwestern Australia enables an objective re-assessment of biomass estimates. Fish. Bull. 102, 617–633.
Guan W., Cao J., Chen Y., Cieri M. (2013). Impacts of population and fishery spatial structures on fishery stock assessment. Can. J. Fish. Aquat. Sci. 70, 1178–1189. doi: 10.1139/cjfas-2012-0364
Hammann M. G., Nevárez-Martínez M. O., Green-Ruiz Y. (1998). Spawning habitat of the Pacific sardine (Sardinops sagax) in the gulf of California: egg and larval distribution 1956-1957 and 1971-1991. Calif. Coop. Oceanic Fish. Invest. Rep. 39, 169–179.
Hampton I. (1996). Acoustic and egg-production estimates of south African anchovy biomass over a decade: comparisons, accuracy, and utility. ICES J. Mar. Sci. 53, 493–500. doi: 10.1006/jmsc.1996.0071
Hayward T. L. (1993). Preliminary observations of the 1991–1992 El Ninão in the California current. Calif. Coop. Oceanic Fish. Invest. Rep. 34, 21–29.
Hayward T. L., Cayan D., Franks P. J. S., Lynn R., Mantyla A. W., McGowan J. A., et al. (1994). The state of the California current in 1993–1994. Calif. Coop. Oceanic Fish. Invest. Rep. 35, 19–35.
Hayward T. L., Mantyla A. W., Lynn R., Smith P., Chereskin T. K. (1995). The state of the California current in 1994–1995: a period of transition. Calif. Coop. Oceanic Fish. Invest. Rep. 36, 19–39.
Hernández-Vázquez S. (1994). Distribution of eggs and larvae from sardine and anchovy off California and Baja california 1951-1989. Calif. Coop. Oceanic Fish. Invest. Rep. 35, 94–107.
Hilborn R., Walters C. J. (1992). Quantitative fisheries stock assessment: choice, dynamics, and uncertainty (New York: Chapman and Hall).
Hill K. T., Lo N. C. H., Macewicz B. J., Félix-Uraga R. (2006). Assessment of the Pacific sardine (Sardinops sagax caerulea) population for U.S. management in 2007 (La Jolla, CA: US Department of Commerce. NOAA Technical Memorandum NMFS-SWFSC).
Huato-Soberanis L., Lluch-Belda D. (1987). Mesoscale cycles in the series of environmental indices related to the sardine fishery in the gulf of California. Calif. Coop. Oceanic Fish. Invest. Rep. 28, 128–134.
Hurtado-Ferro F., Szuwalski C. S., Valero J. L., Anderson S. C., Cunningham C. J., Johnson K. F., et al. (2015). Looking in the rear-view mirror: bias and retrospective patterns in integrated, age-structured stock assessment models. ICES J. Mar. Sci. 72, 99–110. doi: 10.1093/icesjms/fsu198
Huynh Q. C., Legault C. M., Hordyk A. R., Carruthers T. R. (2022). A closed-loop simulation framework and indicator approach for evaluating impacts of retrospective patterns in stock assessments. ICES J. Mar. Sci. 79 (7), 2003–2016. doi: 10.1093/icesjms/fsac066
Jacobson L. D., Konno E. S., Pertierra J. P. (1994a). Status of Pacific mackerel and trends in biomass 1978-1993. Calif. Coop. Oceanic Fish. Invest. Rep. 35, 36–39.
Jacobson L. D., Lo N. C. H., Barnes J. T. (1994b). A biomass-based assessment model for northern anchovy, Engraulis mordax. Fish. Bull. 92, 711–724.
Jacobson L. D., MacCall A. D. (1995). Stock recruitment models for Pacific sardine Sardinops sagax. Can. J. Fish. Aquat. Sci. 52, 566–577. doi: 10.1139/f95-057
Legault C. M., Restrepo V. R. (1998). A flexible forward age-structured assessment program. international commission for the conservation of Atlantic tunas col. Vol. Sci. Pap. 49, 246–253.
Legault C. M., Wiedenmann J., Deroba J. J., Fay G., Miller T., Brooks E. N., et al. (2022). Data-rich but model-resistant: an evaluation of data-limited methods to manage fisheries with failed age-based stock assessments. Can. J. Fish. Aquat. Sci. 80, 27–42. doi: 10.1139/cjfas-2022-0045
Linton B. C., Bence J. R. (2008). Evaluating methods for estimating process and observation error variances in statistical catch-at-age analysis. Fish. Res. 94, 26–35. doi: 10.1016/j.fishres.2008.06.014
Lluch-Belda D., Crawford R. J. M., Kawasaki T., MacCall A. D., Parrish R. H., Schwartzlose R. A., et al. (1989). World-wide fluctuations of sardine and anchovy stocks: the regime problem. South Afr. J. Mar. Sci. 8, 195–205. doi: 10.2989/02577618909504561
Lluch-Cota S. E., Lluch-Cota D. B., Nevárez-Martínez M. O., Lluch-Belda D., Hernández-Vázquez S. (1999). Variability of sardine catch as related to enrichment, concentration, and retention processes in the central gulf of California. Calif. Coop. Oceanic Fish. Invest. Rep. 40, 184–190.
Lo N. C. H., Green Ruiz Y. A., Cervantes M. J., Moser H. G., Lynn R. J. (1996). Egg production and spawning biomass of Pacific sardine (Sardinops sagax) in 1994, determined by the daily egg production method. Calif. Coop. Oceanic Fish. Invest. Rep. 37, 160–174.
MacCall A. D. (2013). Use of the delta method to evaluate the precision of assessments that fix parameter values. Fish. Res. 145, 56–60. doi: 10.1016/j.fishres.2012.07.018
MacCall A. D., Teo S. L. H. (2013). A hybrid stock synthesis-virtual population analysis model of Pacific bluefin tuna. Fish. Res. 142, 22–26. doi: 10.1016/j.fishres.2012.05.001
Martínez-Aguilar S., Arreguín-Sánchez F., Morales-Bojórquez E. (2005). Natural mortality and life stage duration of Pacific sardine (Sardinops caeruleus) based on gnomonic time divisions. Fish. Res. 71, 103–114. doi: 10.1016/j.fishres.2004.04.008
Martínez-Aguilar S., de Anda-Montañez J. A., Arreguín-Sánchez F., Cisneros-Mata M. A. (2009). Constant harvest rate for the Pacific sardine (Sardinops caeruleus) fishery in the gulf of California based on catchability-at-length estimations. Fish. Res. 99, 74–82. doi: 10.1016/j.fishres.2009.05.002
Martínez-Zavala M. A., Nevárez-Martínez M. O., Anguiano-Carrazco M. L., Santos-Molina J. P., Godínez-Cota A. R. (2010). Captura de peces pelágicos menores en el golfo de California, temporada de pesca 2007-2008. Cienc. Pesq. 18, 5–18.
Maunder M. N. (2003). Paradigm shifts in fisheries stock assessment: from integrated analysis to Bayesian analysis and back again. Nat. Res. Mod. 16, 465–475. doi: 10.1111/j.1939-7445.2003.tb00123.x
Maunder M., Punt A. E. (2013). A review of integrated analysis in fisheries stock assessment. Fish. Res. 142, 61–74. doi: 10.1016/j.fishres.2012.07.025
Megrey B. A. (1989). Review and comparison of age-structured stock assessment models from theoretical and applied points of view. Amer. Fish. Soc Symp 6, 8–48.
Methot R. D. (1989). Synthetic estimates of historical abundance and mortality for northern anchovy. Amer. Fish. Soc Symp. 6, 66–82.
Methot Jr. R.D., Wetzel C. R. (2013). Stock synthesis: a biological and statistical framework for fish stock assessment and fishery management. Fish. Res. 142, 86–99. doi: 10.1016/j.fishres.2012.10.012
Miller T. J., Hare J. A., Alade L. A. (2016). A state-space approach to incorporating environmental effects on recruitment in an age-structured assessment model with an application to southern new England yellowtail flounder. Can. J. Fish. Aquat. Sci. 73, 1261–1270. doi: 10.1139/cjfas-2015-0339
Miller T. J., Legault C. M. (2017). Statistical behavior of retrospective patterns and their effects on estimation of stock and harvest status. Fish. Res. 186, 109–120. doi: 10.1016/j.fishres.2016.08.002
Mohn R. (1999). The retrospective problem in sequential population analysis: an investigation using cod fishery and simulated data, in. ICES J. Mar. Sci. 56 (4), 473–488. doi: 10.1006/jmsc.1999.0481
Morales-Bojórquez E., Gómez-Muñoz V. M., Félix-Uraga R., Alvarado-Castillo R. M. (2003). Relation between recruitment, sea surface temperature, and density-independent mortality of the Pacific sardine (Sardinops caeruleus) off the western coast of the Baja California peninsula. Sci. Mar. 67 (1), 25–32. doi: 10.3989/scimar.2003.67n125
Morales-Bojórquez E., Nevárez-Martínez M. O. (2005). Spawner-recruit patterns and investigation of allee effect in Pacific sardine (Sardinops sagax) in the gulf of California, Mexico. Calif. Coop. Oceanic Fish. Invest. Rep. 46, 161–174.
Moustahfid H., Link J. S., Overholtz W. J., Tyrrell M. C. (2009). The advantage of explicitly incorporating predation mortality into age structured stock assessment models: an application for Atlantic mackerel. ICES J. Mar. Sci. 66, 445–454. doi: 10.1093/icesjms/fsn217
Murphy G. I. (1966). Population biology of the Pacific sardine (Sardinops caerulea). Proc. Calif. Acad. Sci. Ser. 34, 1–84.
Nevárez-Martínez M. O. (1990). Producción de huevos de la sardina monterrey (Sardinops sagax caeruleus) en el golfo de California: una evaluación y crítica. [dissertation/master’s thesis] (Ensenada. Baja California: CICESE).
Nevárez-Martínez M. O., Arzola-Sotelo E. A., López-Martínez J., Santos-Molina J. P., Martínez-Zavala M. A. (2019). Modeling growth of the Pacific sardine, Sardinops caeruleus, in the gulf of California, Mexico, using the multimodel inference approach. Calif. Coop. Oceanic Fish. Invest. Rep. 60, 66–78.
Nevárez-Martínez M. O., Chávez E. A., Cisneros-Mata M. A., Lluch-Belda D. (1999). Modeling of the Pacific sardine Sardinops caeruleus fishery of the gulf of California, Mexico. Fish. Res. 41, 273–283. doi: 10.1016/S0165-7836(99)00023-5
Nevárez-Martínez M. O., Lluch-Belda D., Cisneros-Mata M. A., Santos-Molina J. P., Martínez-Zavala M. A., Lluch-Cota S. E. (2001). Distribution and abundance of the Pacific sardine (Sardinops sagax) in the gulf of California and their relation with the environment. Progr. Oceanog. 49, 565–580. doi: 10.1016/S0079-6611(01)00041-6
NOAA (2012) Technical documentation for ASAP version 3.0. NOAA fisheries toolbox. Available at: https://repository.library.noaa.gov/view/noaa/5027 (Accessed March 11, 2022).
Perreault A. M. J., Wheeland L. J., Morgan M., Cadigan N. G. (2020). A state-space stock assessment model for American plaice on the grand bank of Newfoundland. J. Northw. Atlantic Fish. Sci. 51, 45–104. doi: 10.2960/J.v51.m727
Perretti C. T., Deroba J. J., Legault C. M. (2020). Simulation testing methods for estimating misreported catch in a state-space stock assessment model. ICES J. Mar. Sci. 77, 911–920. doi: 10.1093/icesjms/fsaa034
Quinn I. I. T. J., Deriso R. B. (1999). Quantitative fish dynamics (New York: Oxford University Press).
Quiñonez-Velázquez C., Alvarado-Castillo R. M., Félix-Uraga R. (2002). Relación entre el crecimiento individual y la abundancia de la población de la sardina del pacífico Sardinops caeruleus (Pisces: clupeidae) (GIRARD 1856) en isla de cedros, Baja California, méxico. Rev. Biol. Mar. Oceanogr. 37 (1), 1–8. doi: 10.4067/S0718-19572002000100002
Richards L. J., Schnute J. T. (1998). Model complexity and catch-age analysis. Can. J. Fish. Aquat. Sci. 55, 949–957. doi: 10.1139/f98-005
Savereide J. W., Quinn I. I. T. J. (2004). An age-structured assessment model for Chinook salmon (Oncorhynchus tshawytscha). Can. J. Fish. Aquat. Sci. 61, 974–985. doi: 10.1139/f04-039
Shepherd J. G. (1999). Extended survivors analysis: an improved method for the analysis of catch-at-age data and abundance indices. ICES J. Mar. Sci. 56, 584–591. doi: 10.1006/jmsc.1999.0498
Simmonds E. J. (2003). Weighting of acoustic- and trawl-survey indices for the assessment of north Sea herring. ICES J. Mar. Sci. 60, 463–471. doi: 10.1016/S1054-3139(03)00028-6
Simmonds J., MacLennan D. (2005). “Fisheries acoustics,” in Theory and practice (Great Britain: Blackwell Science).
Smith P. E., Lo N. C. H., Butler J. L. (1992). Life-stage duration and survival parameters as related to interdecadal population variability in Pacific sardine. Calif. Coop. Oceanic Fish. Invest. Rep. 33, 41–49.
Szuwalski C. S., Ianelli J. N., Punt A. E. (2018). Reducing retrospective patterns in stock assessment and impacts on management performance. ICES J. Mar. Sci. 75, 596–609. doi: 10.1093/icesjms/fsx159
Terceiro M. (2016). Stock assessment of summer flounder for 2016 (Woods Hole, MA: US Dept. Commer., Northeast Fisheries Science Center Ref Doc), 16–15.
Velarde E., Ezcurra E., Anderson D. (2013). Seabird diets provide early warning of sardine fishery declines in the gulf of California. Sci. Rep. 3, 1332. doi: 10.1038/srep01332
Velarde E., Tordesillas M. S., Vieyra L., Esquivel R. (1994). Seabirds as indicators of important fish populations in the gulf of California. Calif. Coop. Oceanic Fish. Invest. Rep. 35, 137–143.
Wolf P. (1992). Recovery of the Pacific sardine and the California sardine fishery. Calif. Coop. Oceanic Fish. Invest. Rep. 33, 76–86.
Keywords: Pacific sardine, stock assessment, management, Kobe plot, biomass, fishery
Citation: Nevárez-Martínez MO, Morales-Bojórquez E, Martínez-Zavala MdlÁ, Villalobos H, Luquin-Covarrubias MA, González-Máynez VE, López-Martínez J, Santos-Molina JP, Ornelas-Vargas A and Delgado-Vences F (2023) An integrated catch-at-age model for analyzing the variability in biomass of Pacific sardine (Sardinops sagax) from the Gulf of California, Mexico. Front. Mar. Sci. 10:940083. doi: 10.3389/fmars.2023.940083
Received: 09 May 2022; Accepted: 17 April 2023;
Published: 05 May 2023.
Edited by:
Andrea Belgrano, Swedish University of Agricultural Sciences, SwedenReviewed by:
Gabriela Galindo-Cortes, Universidad Veracruzana, MexicoSimon Dedman, Florida International University, United States
Copyright © 2023 Nevárez-Martínez, Morales-Bojórquez, Martínez-Zavala, Villalobos, Luquin-Covarrubias, González-Máynez, López-Martínez, Santos-Molina, Ornelas-Vargas and Delgado-Vences. This is an open-access article distributed under the terms of the Creative Commons Attribution License (CC BY). The use, distribution or reproduction in other forums is permitted, provided the original author(s) and the copyright owner(s) are credited and that the original publication in this journal is cited, in accordance with accepted academic practice. No use, distribution or reproduction is permitted which does not comply with these terms.
*Correspondence: Enrique Morales-Bojórquez, ZW1vcmFsZXNAY2libm9yLm14