 Ning Yang
 Xiaohai Zou1*
 Tao Wang
94% of researchers rate our articles as excellent or good
Learn more about the work of our research integrity team to safeguard the quality of each article we publish.
Find out more
ORIGINAL RESEARCH article
Front. Mar. Sci., 15 January 2024
Sec. Physical Oceanography
Volume 10 - 2023 | https://doi.org/10.3389/fmars.2023.1326975
The non-uniformity of the evaporation duct has a significant impact on the propagation of electromagnetic waves. Based on the near real-time dataset from the China Meteorological Administration Land Data Assimilation System (CLDAS) and the National Centers for Environmental Prediction (NCEP) Climate Forecast System Reanalysis (CFSR) datasets, the non-uniformity characteristics of evaporation duct height (EDH) in the South China Sea (SCS) region at different distances of electromagnetic propagation and the main influencing factors of EDH non-uniformity are analyzed. The findings are given as follows. First, the SCS monsoon has a significant impact on the spatial and temporal distribution of EDH, particularly in the western coastal areas of Luzon Island and the eastern coastal areas of the Indochina Peninsula. Secondly, the non-uniformity of EDH is more pronounced in the western part of Luzon Island, the eastern coast of the Indochina Peninsula, and the sea-land boundary area of the Beibu Gulf. Besides, the non-uniformity of EDH in the western part of Luzon Island and the eastern part of the Indochinese Peninsula is greatly influenced by air-sea temperature difference and relative humidity. Finally, it is advisable to consider the influence of the non-uniformity of EDH when the distance of electromagnetic propagation in coastal areas exceeds 50 km. However, it can be disregarded within a range of 100 km on the broad ocean.
● The significant impact of monsoons on the spatiotemporal distribution of EDH at the sea-land boundary in the South China Sea.
● The non-uniformity of EDH in the South China Sea from afternoon to evening is relatively obvious, while it is relatively small at night.
● The non-uniformity of EDH in the western part of Luzon Island, the eastern coast of the Indochina Peninsula, and the sea-land boundary area of the Beibu Gulf is relatively clear.
The variation of refractive index in the marine atmospheric boundary layer has a significant impact on the propagation of radio waves in coastal and marine environments. Specifically, the atmospheric duct is a stronger super-refractive propagation condition that occurs at sea (Pozderac et al., 2015). The atmospheric duct is a unique layer structure formed in the atmosphere under specific temperature and humidity gradient conditions. It can be classified into three types based on their height in relation to the duct layer structure and surface of the earth: evaporation duct, surface duct, and elevated duct. Studies have shown that evaporation duct is the most common type in the South China Sea (SCS), with a probability of occurrence exceeding 80% (Cheng et al., 2012; Wang et al., 2019; Zhang et al., 2020; Cheng et al., 2021).The evaporation duct exerts a notable influence on the transmission of electromagnetic waves emitted by radar or communication equipment (Xu et al., 2022; Wang et al., 2023a; Wang et al., 2023b; Zhang et al., 2023). On the one hand, it can lead to increased errors in radar ranging, angle measurement, and velocity measurement, as well as heightened radar clutter. More importantly, the evaporation duct can cause radar to detect and receive signals beyond the line of sight (Wang et al., 2018). However, when it comes to communication, evaporation duct communication presents a novel approach for high-speed data transmission near the sea surface. This method offers several advantages, including high reliability, stable transmission characteristics, and a supernal data rate in the order of magnitude of Mbps (Ergin and Ozgur, 2014; Ma et al., 2022).
The evaporation duct is influenced closely by meteorological elements, such as atmospheric temperature (AT), relative humidity (RH), wind speed (WS), and sea surface temperature (SST). Its formation primarily arises from the uneven thermal structure of the marine atmospheric boundary layer. That is because the seawater evaporates bringing a significant amount of water vapor that accumulates on the surface of the sea. With the assistance of wind, this water vapor disperses to a certain altitude, leading to a rapid decline of atmospheric humidity and a diminishment of the atmospheric refractive index as the altitude rises. The evaporation duct typically occurs in the near-sea atmosphere below the height of 40 m. Its height varies depending on geographic latitude, season, and time of day scale (Shi et al., 2015b; Zhang et al., 2016; Huang et al., 2022; Yang et al., 2023). The daily variation of the evaporation duct height (EDH) is primarily influenced by thermal differences between land and sea. This variation is more pronounced in coastal areas, with RH and near-surface WS being the main influencing factors, the temperature difference between the air and sea also plays a key role (Huang et al., 2022).
The EDH can be directly measured using meteorological sounding or meteorological gradient instruments. However, due to the unique climate environment and surface types of the ocean, there is a severe lack of meteorological observation stations, making it difficult to achieve regional and high temporal resolution meteorological detection. As a result, the most widely used approach currently is to predict based on the models developed from the Monin-Obukhov similarity theory (MOST) by measuring maritime meteorological parameters and sea surface temperature (Zhang et al., 2020; Zhao et al., 2023) or using reanalysis data (von Engeln and João, 2004; Shi et al., 2015b; Sirkova, 2015; Cheng et al., 2021; Huang et al., 2022; Yang et al., 2023). The commonly used diagnostic models for EDH include the Paulus-Jeske (P-J) model (Guo et al., 2018), Musson-Gauthier-Bruth (MGB) (Zhao et al., 2021), Babin-Young-Carton (BYC) model (Zhao et al., 2019), and Naval Postgraduate School (NPS) model (Zhao et al., 2021). Among these, the NPS model is currently one of the most widely used models. Numerous researchers have employed this model to study EDH in various sea areas (Ding et al., 2015; Shi et al., 2017; Guo et al., 2019; Zhao et al., 2021; Huang et al., 2022), confirming its effectiveness. The existing evaporation duct diagnostic models primarily rely on AT, RH, and WS at various heights above the sea surface and SST as input parameters for calculating EDH. As a result, the meteorological data employed in this article predominantly comprise AT of 2 m, specific humidity (SH) of 2 m, WS of 10 m, air pressure (AP), and SST.
The non-uniformity of the evaporation duct has a momentous prompt on electromagnetic propagation, exceptionally at low frequencies (Shi et al., 2015a). When the height of the evaporation duct at the receiving end is lower than that at the transmitting end. This results in a significantly higher path loss compared to the conditions where the evaporation duct is horizontally uniform. Conversely, when the height of the evaporation duct at the receiving end is higher than that at the transmitting end, the horizontal non-uniformity of the evaporation duct has a smaller effect (Shi et al., 2015a). So, In communication systems where the transmitter and receiver share a common antenna, there is a phenomenon known as unidirectional data transmission, wherein only one party can receive the signal when the distance between them exceeds a certain threshold. Therefore, when considering the transmission of electromagnetic waves beyond the line of sight in an evaporation duct environment, it is crucial to consider the non-uniformity of EDH characteristics.
The SCS serves as a vital sea route connecting Western Europe, the Middle East, and the Far East, accounting for over half of the sea transportation in the world (Rosenberg and Chung, 2008). There is currently no statistical analysis conducted on the spatiotemporal heterogeneity of EDH in the region. To address this gap, this paper utilizes the near real-time dataset of the China Meteorological Administration Land Data Assimilation System (CLDAS) and the Climate Forecast System Reanalysis (CFSR) datasets from the National Centers for Environmental Prediction (NCEP) of the United States to analyze the monthly and daily variation characteristics of EDH non-uniformity in the SCS region based on the NPS model. Furthermore, the main influencing factors of EDH non-uniformity were explored based on partial correlation analysis.
The CLDAS dataset is developed using a variety of ground, satellite, and other observational data sources, and employs techniques such as multi-grid variational assimilation, optimal interpolation (OI), probability density function matching, physical inversion, terrain correction, and more. This dataset includes high-precision data on WS, AT, RH, and AP from the waters near China (0-65° N, 60-160° E). The data used in this paper covers the period from January 19, 2017, to December 31, 2022, spanning a spatial range of 104° E to 123° E and 2° N to 25° N (refer to Table 1 for specific data information, with the starting time for open data being January 19, 2017). This dataset demonstrates superior quality and more reasonable and accurate spatiotemporal distribution characteristics within the Chinese region when compared to similar international and domestic products (Qiu et al., 2023).
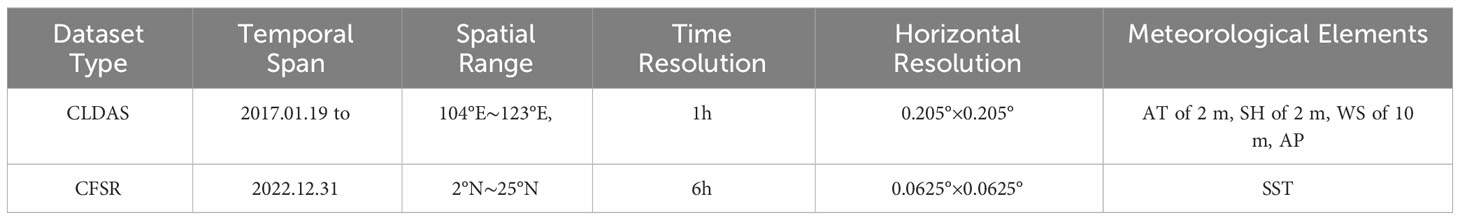
Table 1 Specific information on the reanalysis data used in this article.
Unfortunately, the CLDAS dataset does not include SST data. The SST data from the CFSR dataset is used in this article. This dataset has been validated by numerous scholars and has been widely used to analyze the spatiotemporal distribution characteristics of evaporation ducts in various sea areas (Shi et al., 2015b; Huang et al., 2022; Yang et al., 2023). Due to the different temporal and spatial resolutions between the CLDAS and the CFSR, the bilinear interpolation and nearest neighbor interpolation to obtain the temporal and spatial resolutions of SST to 1 h and 0.0625° respectively in this article.
The NPS model, which was published by the United States Navy Graduate School in 2000, is primarily based on the Monin-Obukhov similarity theory and Liu-Katsaros-Businger theory (van der Laan et al., 2017). It aims to model the refractive index profile of offshore evaporation ducts. What’s more, this model utilizes AT, RH, WS, and AP at a specific or varying altitude above the sea surface, along with SST, as input parameters. The model first obtains the profiles of temperature, humidity, and water vapor pressure. Then the modified refractivity profile (Equation 1) of the evaporation duct is calculated by:
where M is usually called modified refractivity and its unit is M-unit, T is the atmospheric temperature in Kelvin, P is the atmospheric pressure (hPa), and e is water vapor pressure (hPa), Re is the average radius of the earth (taken as 6371 km), and h is the altitude above sea level (m). Consequently, The EDH is then determined by correcting the position of the minimum value of M.
The profiles of AT (Equation 2), SH (Equation 3), and water vapor pressure e(z) (Equation 4) varying with height z can be represented as (Zhao et al., 2021):
where T(z), q(z), P(z) are the AT, SH, and AP at height z, respectively; T0 and q0 are the SST and SH when considering the influence of seawater salinity on SH; q0 = 0.98qs(T0), qs(T0) are the sea surface saturation SH calculated based on the SST; θ* and q* are the characteristic scales of potential temperature θ and q, respectively; κ is the Karman constant; z0t is the temperature roughness height; ψh is the temperature universal function; ηd is the dry adiabatic lapse rate, approximately equal to 0.00976 K/m; L represents the Obukhov length and is a constant (usually 0.622).
To better illustrate the trend of electromagnetic propagation loss under non-uniformity EDH conditions, this article assumes the existence of two points: A and B (the red pentagram in Figure 1), both located within the duct layer. At point A, the antenna height is 6 m, and the EDH is 10 m. Meanwhile, the distance between point B and point A is 210 km, with an antenna height of 8 m and an EDH ranging from 10 m to 20 m in increments of 1 m. Therefore, the EDH at point A remains unchanged, and there are eleven cases where the EDH at point B is 10 m, 11 m,…, 20 m. The EDH at distances of 30, 60, 90, 120, 150, and 180 km from emission point A increases to point B on an equal scale. For example, in Figure 1, the purple, red, and orange lines represent the EDH between points A and B at increasing amplitudes of 0.5 m, 1 m, and 1.5 m in the distance interval, respectively.
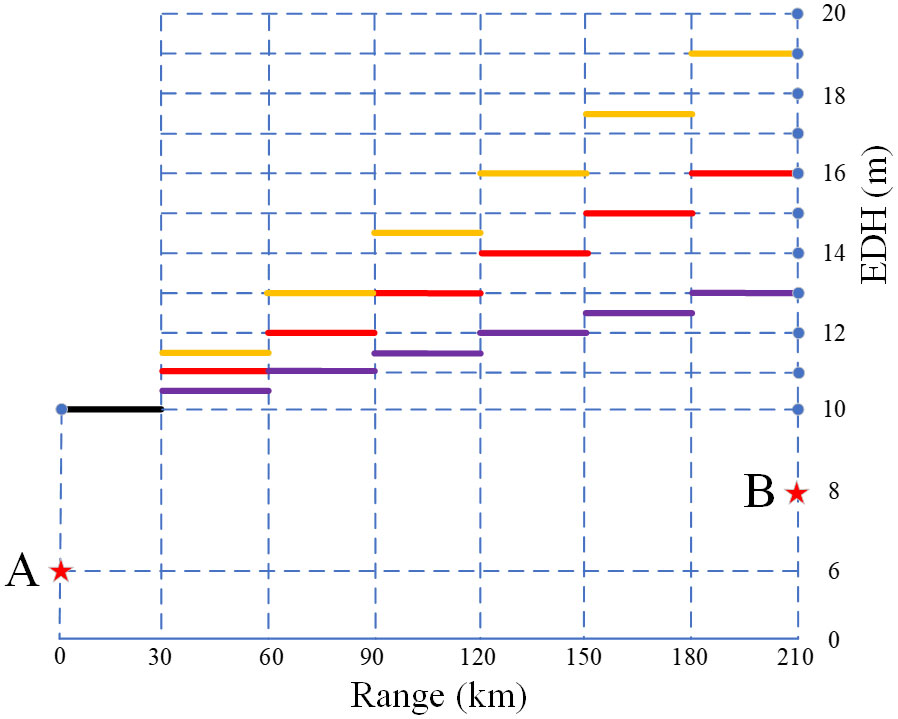
Figure 1 Assumption of scenario under non-uniform EDH environment. The red pentagram represents the antenna position. The purple, red, and orange lines represent the EDH between points A and B at increasing amplitudes of 0.5 m, 1 m, and 1.5 m, respectively.
When calculating electromagnetic propagation losses, this article sets up two scenarios for electromagnetic wave transmission and reception: radiation source emission at point A and reception at point B; radiation source emission at point B and reception at point A. The variation of electromagnetic propagation loss difference with distance in non-uniformity environments with different EDH under two different radiation source positions is shown in Figure 2.
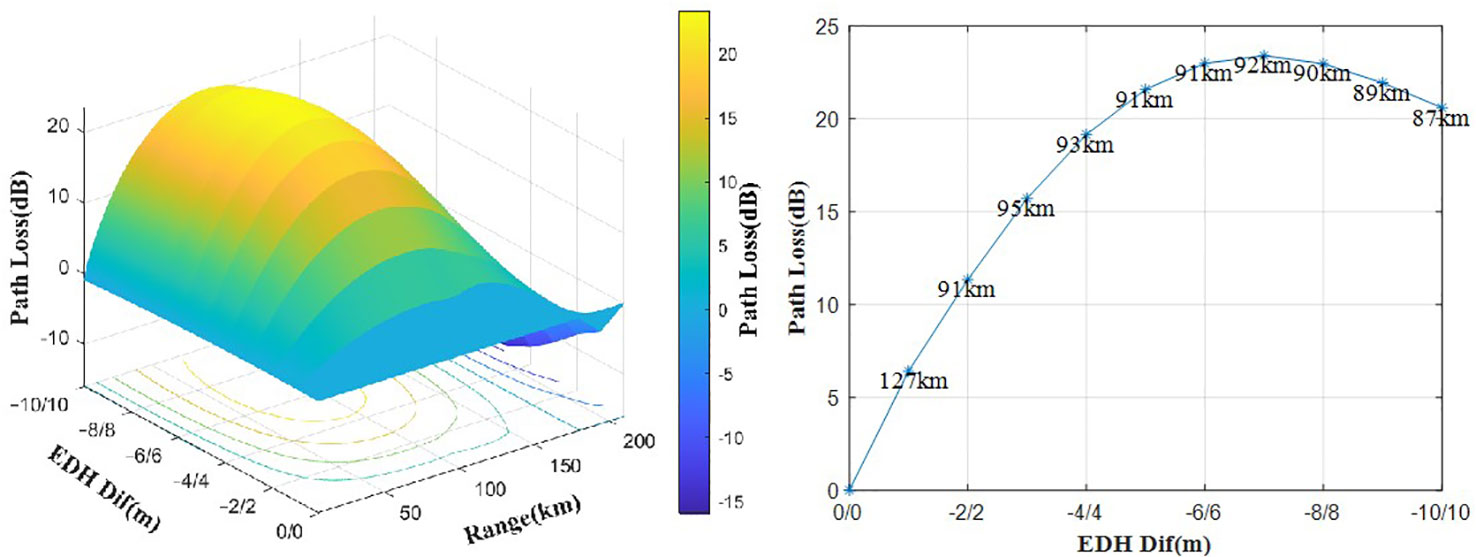
Figure 2 Differences in electromagnetic propagation losses in non-uniformity EDH environments.
In Figure 2, the “EDH Dif” indicates the difference in EDH at signal transmission and reception positions. A negative “EDH Dif” value indicates A radiation, while a positive value indicates B radiation. For example, when the EDH at point B is 12 m, “-2” represents the EDH difference between point A (transmitting) and point B (receiving), and “2” represents the EDH difference between point B (transmitting) and point A (receiving). The “Path Loss Dif” indicates the difference in electromagnetic propagation loss in the two scenarios at the same distance from the radiation source (“Path Loss Dif” = “A transmitting” – “B transmitting”).
Further, on the right side of Figure 2, the graph represents the maximum loss difference corresponding to the left side. The numbers on this graph represent the distance between the maximum loss difference and the transmission end. From Figure 2, it is evident that as the difference in EDH between the receiving and transmitting positions increases, the propagation loss difference initially increases and then decreases. The point of the maximum loss difference (92 km, 23.4 dB) occurs when the EDH difference is 7 m. Even when the EDH difference is as low as 1 m, there is still a propagation loss difference of 6.4 dB. So, the non-uniformity of the evaporation duct has a significant impact on the propagation of electromagnetic waves.
To describe the uneven nature of EDH, this article adopts the concept of terrain undulation, which encompasses the overall elevation and surface-cutting degree of a region. In other words, the non-uniformity of the EDH is interpreted as the undulating characteristics of EDH. (Niu and William, 1996) defines the surface roughness of China as follows:
In this equation (Equation 5), Max(H) represents the highest elevation of the region, Min(H) represents the lowest elevation, P(A) represents the flat area , and A represents the total land area. Multiple scholars have shown that the model overestimates EDH in stable atmospheric stratification due to differences in the diagnostic accuracy of the NPS model for EDH under stable and unstable atmospheric conditions (Huang et al., 2022; Zhao et al., 2023). To reduce errors, the non-uniformity of EDH as the proportion of non-flat area to total area is defined in this article.
From Figure 2, it can be seen that the propagation loss difference is greater than 10 dB when the EDH difference is 2 m, so this paper chooses 2 m as the threshold value, and searches for grids with radii of 20 km, 50 km, 100 km, and 200 km respectively (Figure 3) that have an EDH difference of less than or equal to 2 m from the grid point. So, when the (i,j)th grid point (i-th longitude grid, j-th latitude grid) is used as a reference point (Equation 6), the non-uniformity of EDH can be expressed as:
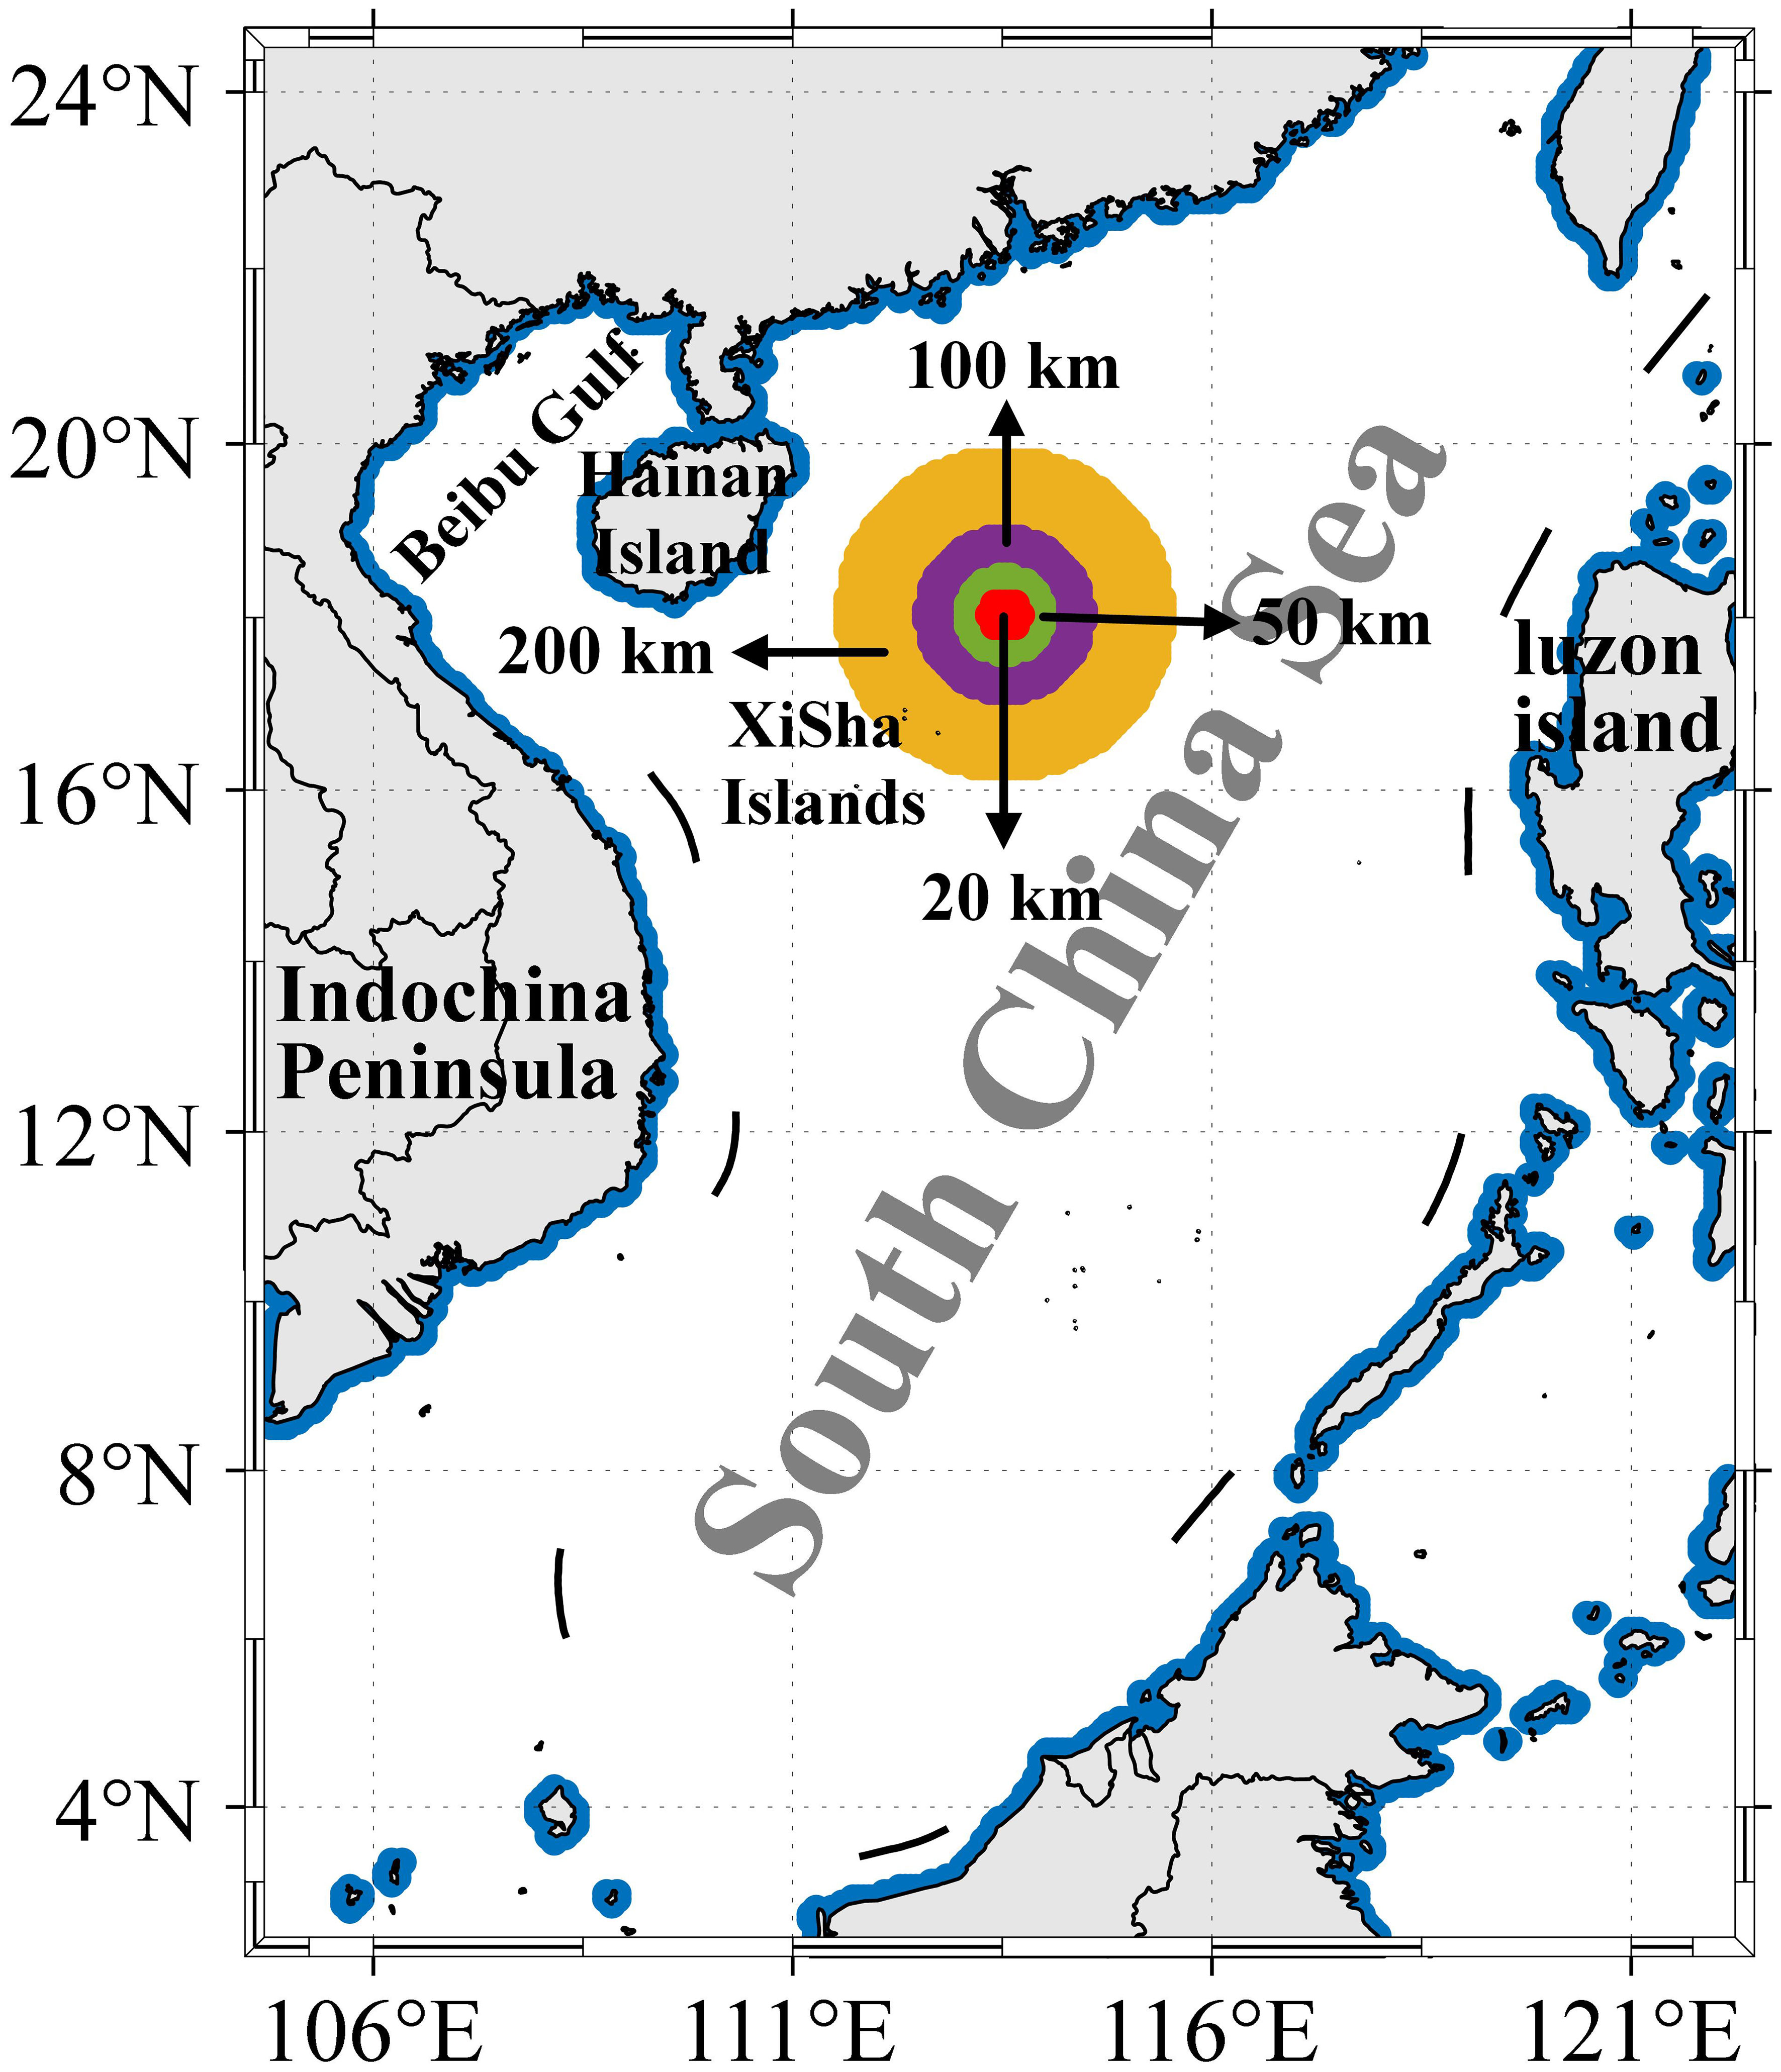
Figure 3 Study area. The blue dots represent the grid at the coastal junction, and the colored circles represent the ranges included in the calculation of RDLS_EDH with radii of 20 km, 50 km, 100 km, and 200 km, respectively.
where Ni,j is the number of grids that meet the condition, and Si,j is the total number of grids.
This paper conducted calculations to determine the monthly average distribution (Figure 4) and daily distribution characteristics (Figure 5) of the EDH in the SCS from 2017 to 2022 based on data from CLDAS and CFSR. It is detailed that the daily distribution represents the three-hour average of a given day, with specific time points at 00:00, 06:00, 12:00, and 18:00 in Universal Time (For example, 06:00 is the average of 05:00, 06:00, and 07:00). Then, the monthly average based on these daily distributions is calculated in this paper.
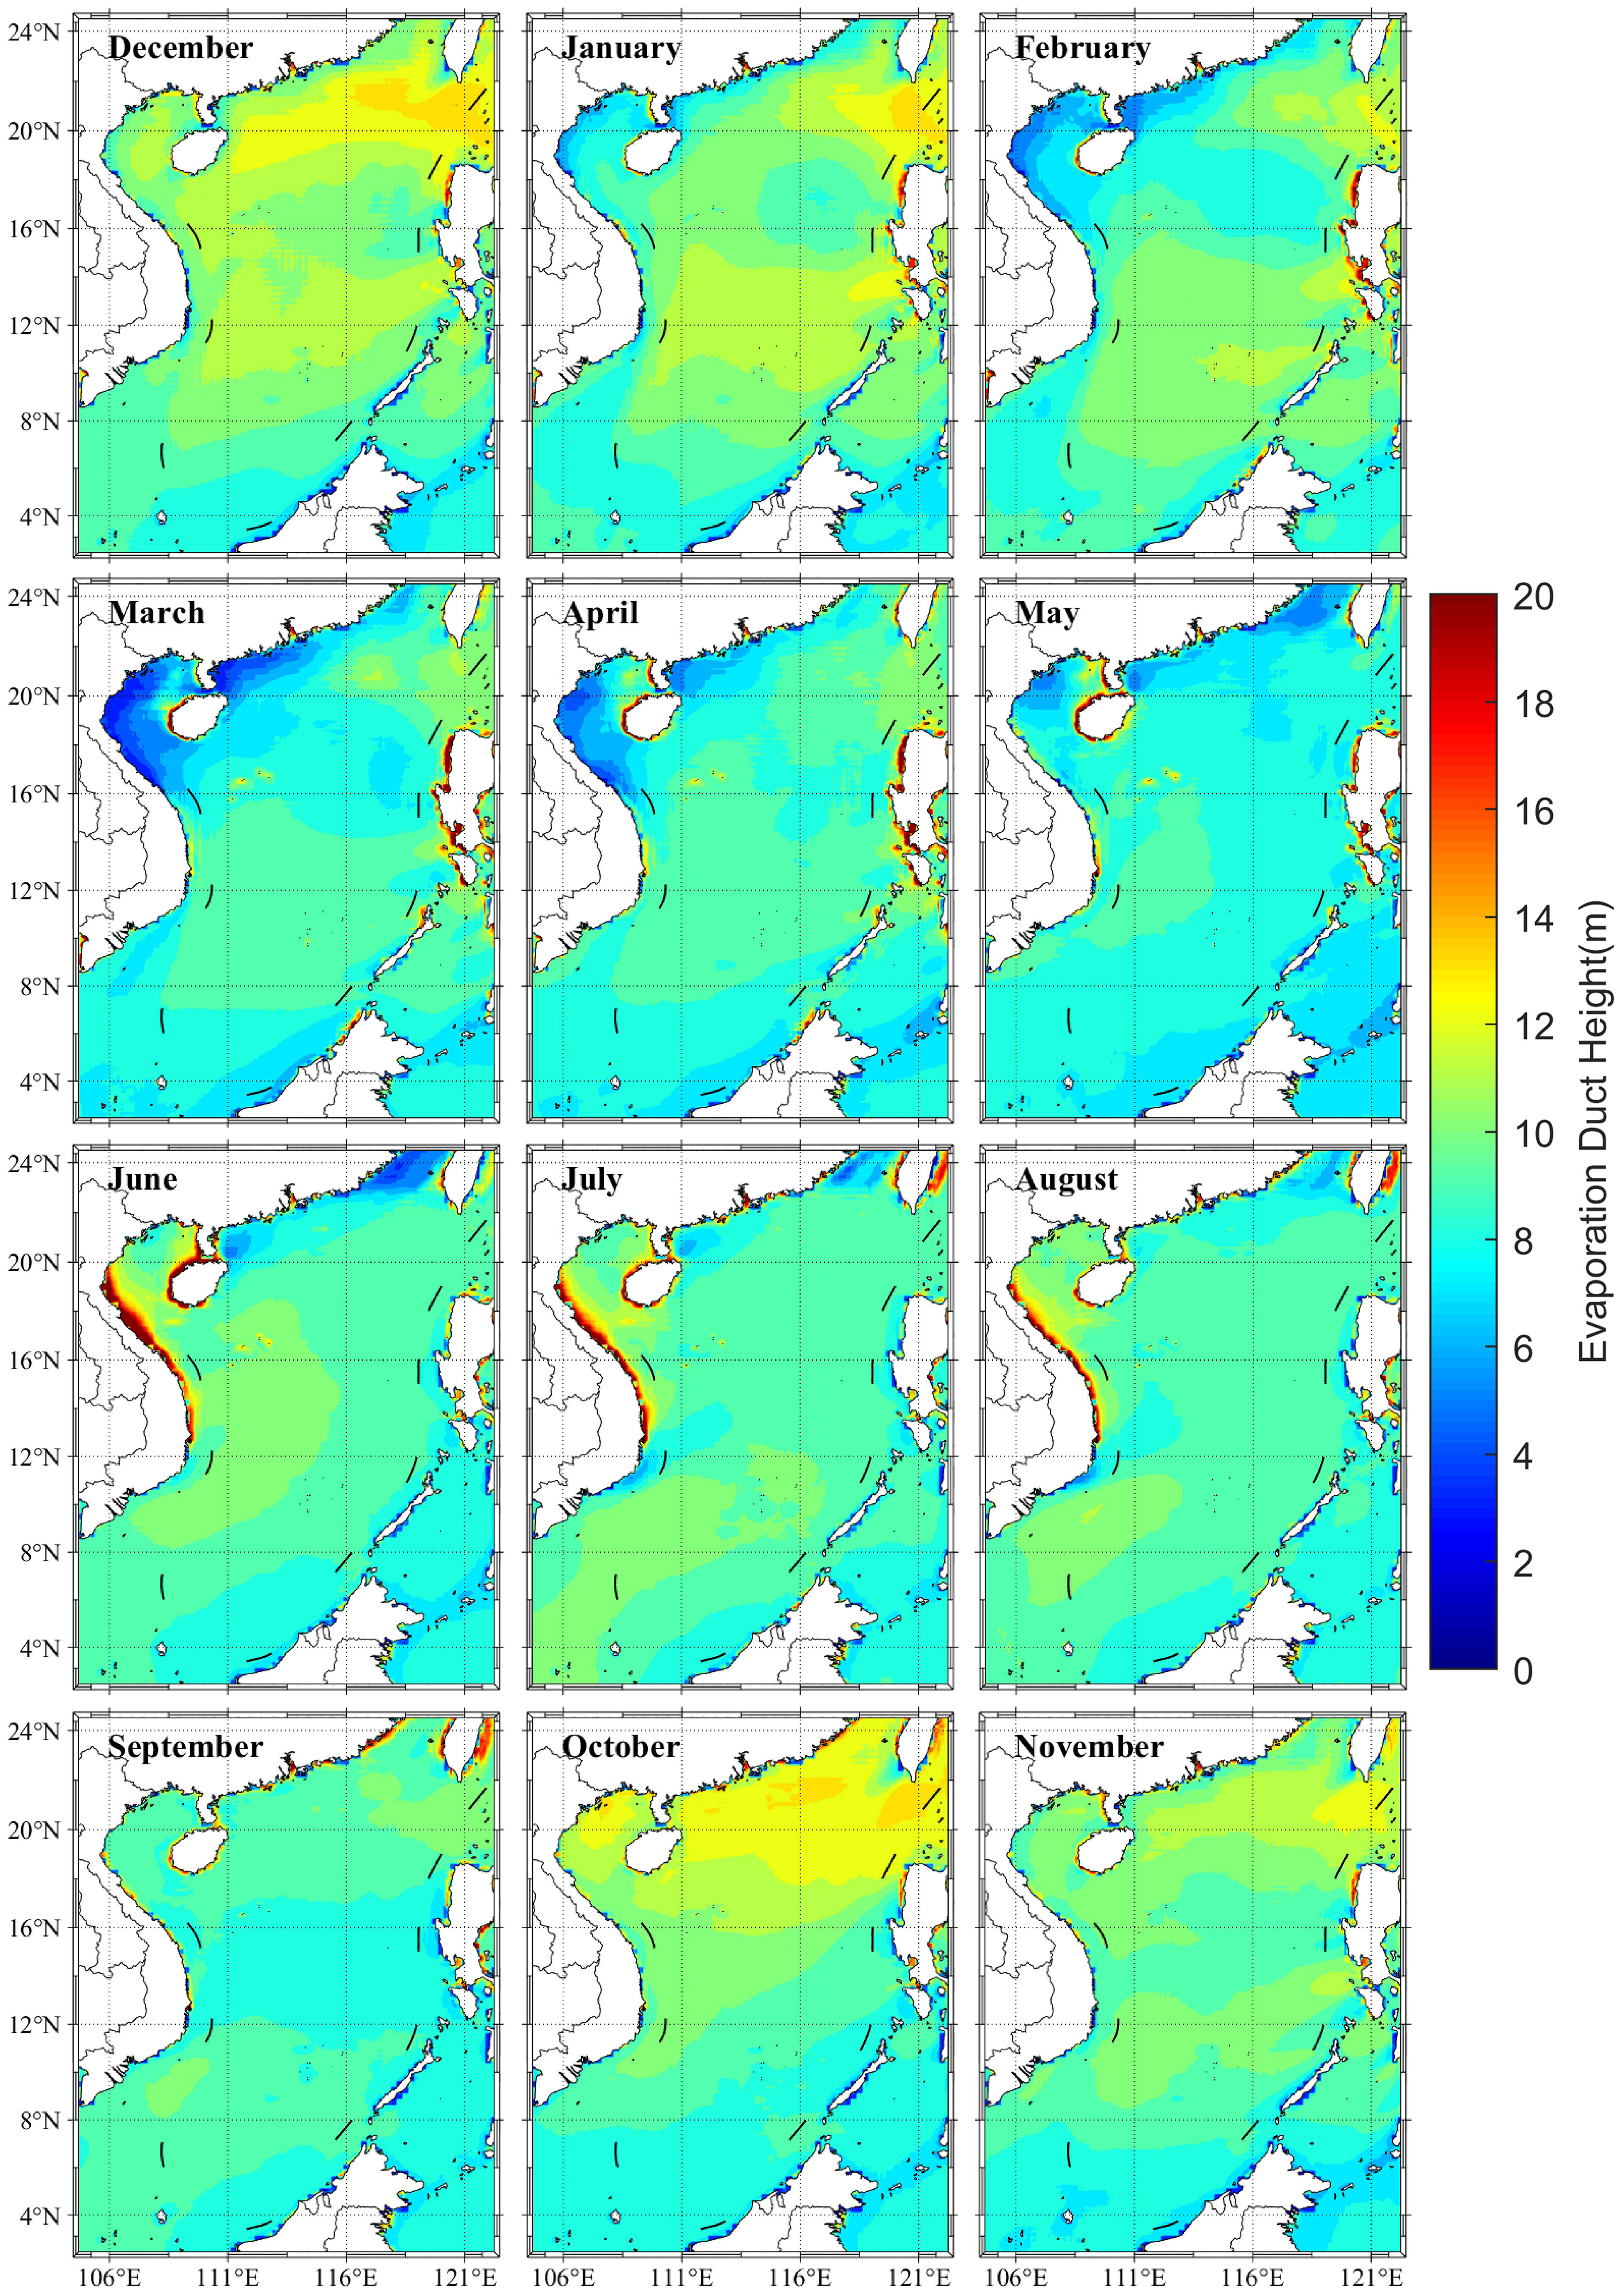
Figure 4 Monthly spatial distribution of the average EDH in the SCS.
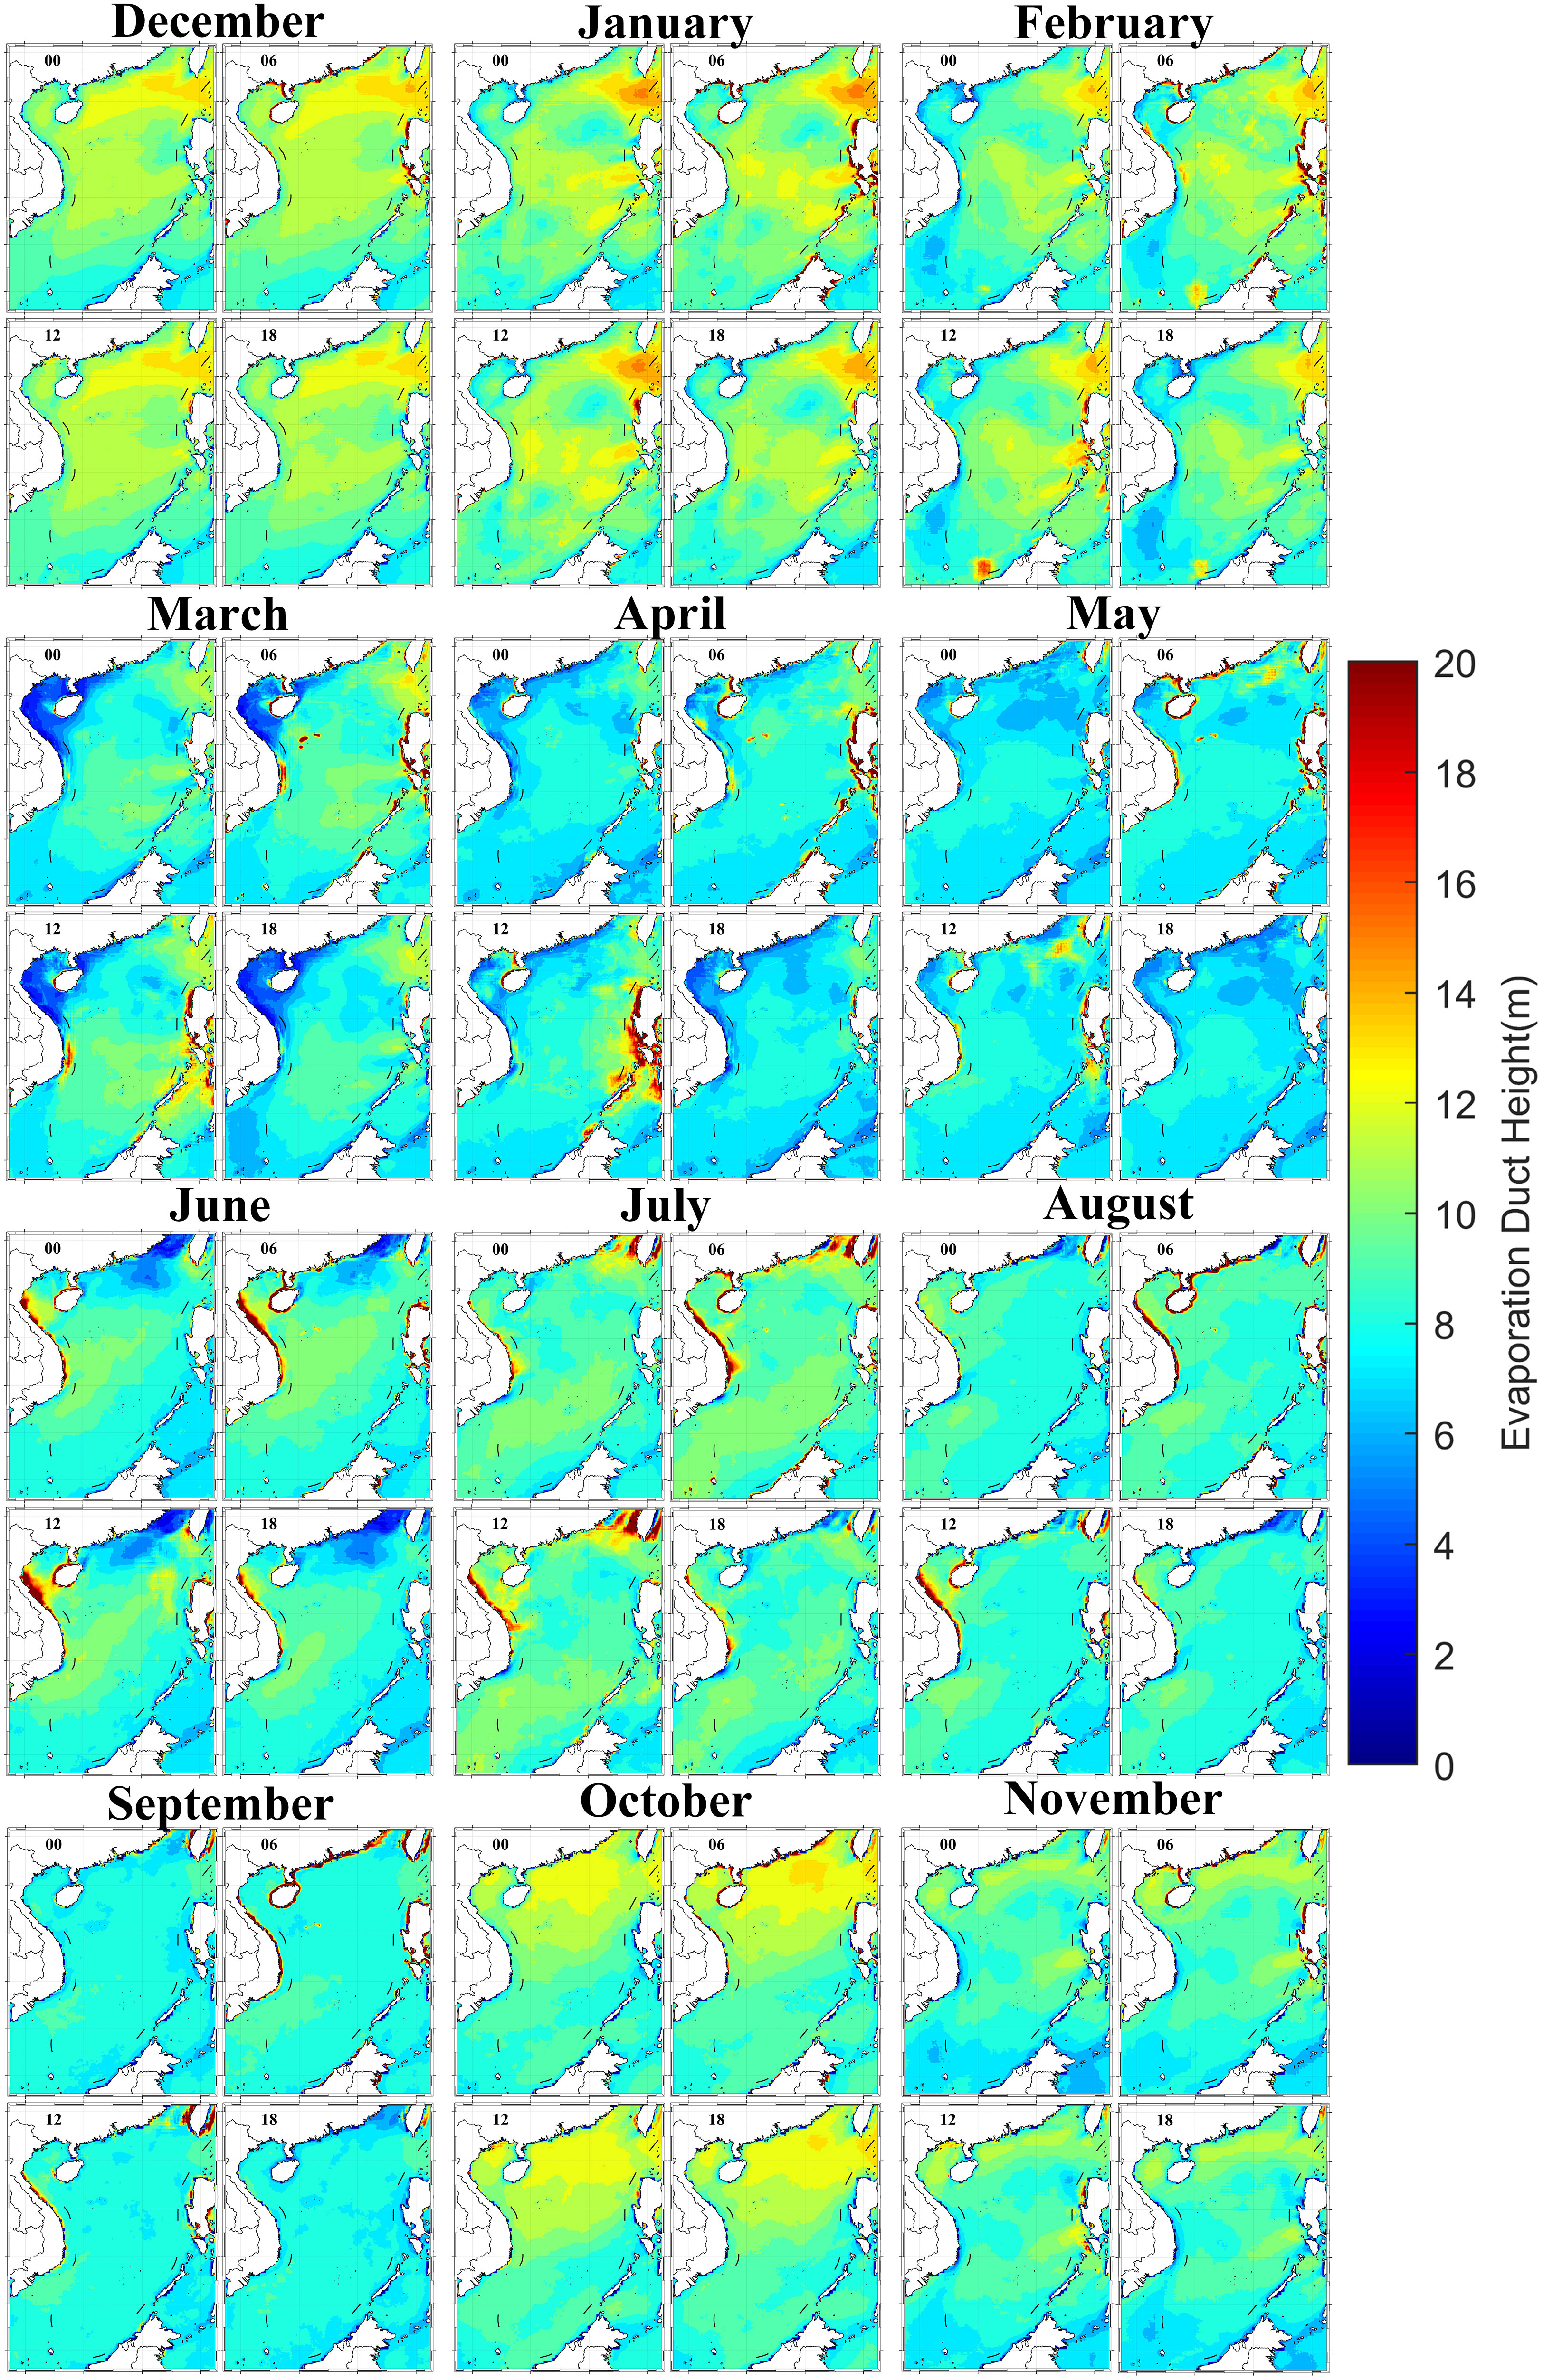
Figure 5 Monthly and hourly spatial distribution of the average EDH in the SCS (00:00,06:00,12:00,18:00 UTC) (3-hour average).
From a monthly perspective, it is obvious that the overall EDH in the SCS gradually decreased from December to April of the following year. This trend is particularly pronounced in the Beibu Gulf region, where the height decreases from 12 m to less than 4m during the period from December to March. However, the height in this region gradually increases from April onwards. During this period, the center of high EDH values is located in the Bashi Strait region. Additionally, there is a low EDH area in the western part of Luzon Island. Moving from the Bashi Strait to the southern SCS, EDH exhibits a high-low-high spatial distribution characteristic. From April to October, the area of high EDH value gradually shifts from the south to the north of the SCS. Nevertheless, the highest value of the EDH in the north of the SCS is reached in October, while the EDH from the north to the south of the SCS continues to decrease.
In terms of daily distribution, It is noticed that the EDH at 06:00 and 12:00 is larger than at 00:00 and 18:00, indicating a trend of first increasing and then decreasing during a day. The maximum value of the EDH is reached around 06:00, but the overall difference between 06:00 and 12:00 is not significant. This suggests that the EDH in the SCS remains relatively stable and undergoes minimal changes during this time. Regarding spatial distribution, the areas with EDH greater than 20 m are primarily located in coastal areas, while the lowest heights occur on the western coast of the Beibu Gulf. By considering March as the time boundary, the results observed a gradual increase in the EDH along the western coast of Luzon Island from September to March of the following year. From April to August, the EDH gradually decreases. Similarly, the eastern coastal area of the Indochina Peninsula exhibits a gradual increase in EDH from March to June, reaching its peak in June, and subsequently decreasing. In addition, the same pattern is also observed in the western part of Hainan Island.
The summer monsoon in the SCS typically begins in May (Li and Luo, 2021). From 2017 to 2022, the onset of the summer monsoon occurred is pentad 28, pentad 31, pentad 26, pentad 28, pentad 28, pentad 27, specifically on May 16-20, June 1-5, May 6-10, and May 11-15, respectively. Based on the spatial and temporal distribution of EDH and the onset of the summer monsoon, it can be concluded that before the arrival of the summer monsoon, the western coast of Luzon Island experienced higher EDH values, while the eastern coast of the Indochina Peninsula had lower EDH values. During this period, winds prevailed easterly in the SCS. On the western part of Luzon Island, winds blew from the land towards the ocean. Near sea level, the encounter of dry and cold air from land with humid and hot air currents from the sea led to a relatively stable atmospheric stratification in the coastal area, resulting in a sharp reduction in vertical water vapor and an increase in the EDH value. On the other hand, the Indochina Peninsula experienced winds blowing from the ocean towards the mainland and cannot form a vertical atmospheric structure with a sharp decrease in water vapor, so the eastern part of the Indochinese Peninsula has a smaller EDH.
After the summer monsoon, the EDH on the western coast of Luzon Island gradually decreased, while the EDH on the eastern coast of the Indochina Peninsula gradually increased. The changes in the western part of Luzon Island and the eastern part of the Indochina Peninsula are similar to those before the summer monsoon outbreak. On the western part of Luzon Island, winds blew from the ocean towards the land. However, on the Indochina Peninsula, the wind blows from the mainland towards the ocean. So, the wind blowing from the land to the ocean causes a sharp change in the vertical gradient of water vapor on the sea surface, resulting in a large EDH value. In addition, the EDH of overall SCS also shows an increasing trend, but the increase is not significant.
The outbreak of the winter monsoon in the SCS has a significant impact on the northern part, mainly reflected in the increase of EDH in the northern part of the SCS. In other words, during spring and winter, the northern part of the SCS experiences a higher EDH. At this time, the northeast wind prevails, first affecting the northern part of the SCS, and then gradually expanding to the central part, also leading to an increase in EDH in the central region. The northeast wind prevails in the SCS, which carries cold and dry air. When this air meets the warm and humid air of the SCS, it easily causes a sharp reduction in humidity in the atmospheric structure, leading to a higher EDH value.
In summary, EDH values greater than 10 m are mainly concentrated in the northern part of the SCS during the spring and winter seasons. At this time, the center of high EDH values is located in the Bashi Strait area, and high SST and high evaporation rate are not the main factors affecting EDH changes. In terms of daily distribution, the highest EDH values occur at 06:00, with EDH values being higher during the day than at night. Before the summer monsoon, the area with EDH values greater than 20 m in the SCS is mainly located along the western coast of Luzon Island, and the Beibu Gulf is the center of low EDH values in the SCS region. After the onset of the summer monsoon, the area with EDH values greater than 20 m is mainly located along the eastern coast of the Indochinese Peninsula. Therefore, the change in sea-land breeze caused by the transition of the SCS monsoon is the main factor influencing the EDH changes along the western coast of Luzon Island and the eastern coast of the Indochinese Peninsula.
We calculated the spatiotemporal distribution characteristics of the non-uniformity characteristics of EDH at radii of 20 km, 50 km, 100 km, and 200 km based on RDLS_EDH. Figures 6 and 7 show the RDLS_EDH of the SCS at a radius of 100 km. Among them, Figure 6 is the monthly spatial distribution of RDLS_EDH, and Figure 7 is the daily spatial distribution of RDLS_EDH. The monthly spatial distribution of RDLS_EDH in the SCS at 20 km, 50 km, and 200 km can be found in the Supplementary Document.

Figure 6 Monthly spatial distribution of RDLS_EDH in the SCS at 100 km.
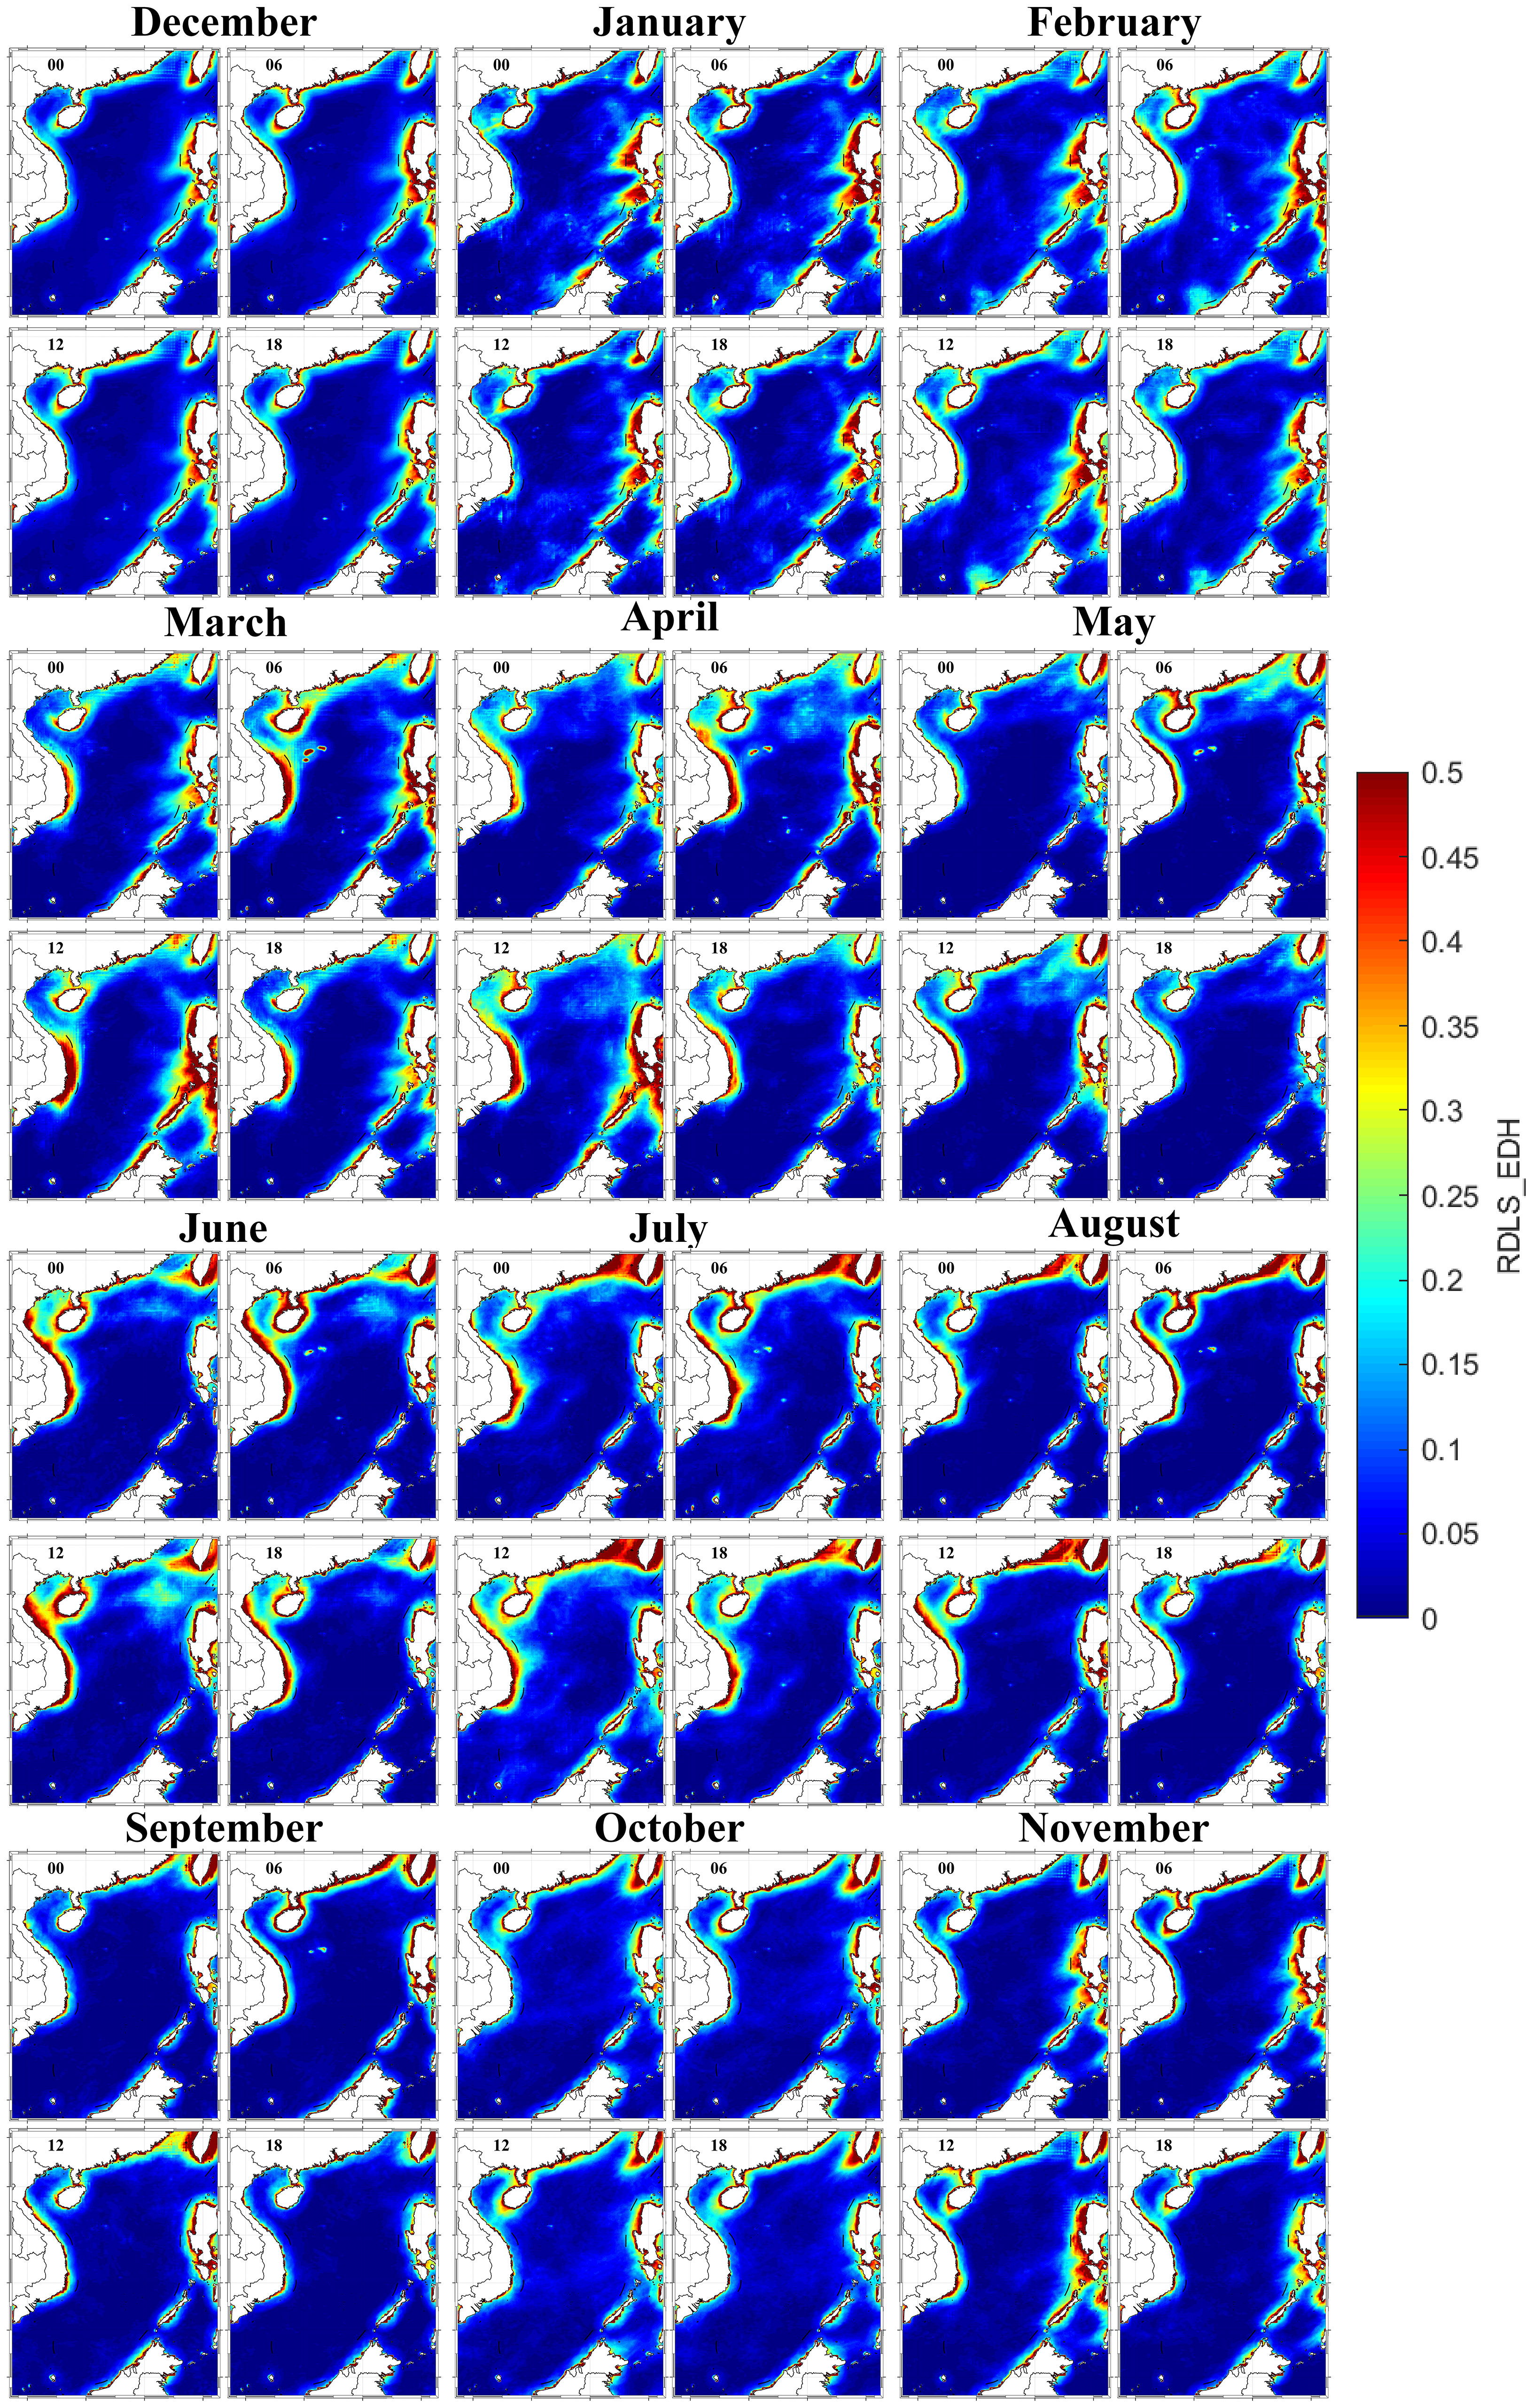
Figure 7 Monthly and hourly spatial distribution of RDLS_EDH in the SCS at 100 km (3-hour average).
When the radius is 20 km, the RDLS_EDH of the coastal areas of the Indochina Peninsula gradually increases from January to June, then decreases after June. The RDLS_EDH of the entire SCS region is relatively low. Therefore, when conducting evaporation duct communication over the SCS, the non-uniformity of EDH can be disregarded.
When the radius is 50 km, the RDLS_EDH in the western area of the Beibu Gulf and the coastal areas of the Indochina Peninsula is larger from March to August. At the same time, there are also obvious non-uniform characteristics of EDH in the Xisha Islands area. From December to March of the following year, the RDLS_EDH value in the western part of Luzon Island is more prominent. When communicating over the sea, the non-uniformity of EDH should be considered in the Beibu Gulf area from March to May, while it can be ignored in the SCS.
When the radius is 100 km (Figure 6), the RDLS_EDH values at the land-sea boundary in the SCS show an overall increase compared to the 50 km radius. The large RDLS_EDH values are particularly prominent in the western coastal areas of Luzon Island from October to April of the following year, in the eastern coastal areas of the Indochina Peninsula from March to August, and in the Beibu Gulf from November to June of the following year, gradually decreasing after June. Additionally, the EDH in the northern part of the SCS shows significant non-uniformity from April to June.
When the radius is 200 km, the large RDLS_EDH values remain prominent in the western coastal areas of Luzon Island, the eastern coastal areas of the Indochina Peninsula, and the Beibu Gulf region. Furthermore, the non-uniformity of the EDH in the coastal areas of Hainan Island in China is also noticeable from March to July.
Combining Figures 4 and 6, it can be seen that the RDLS_EDH values in the eastern coastal areas of the Indochina Peninsula are relatively large from January to May, and the corresponding EDH mainly shows that the values in the eastern coastal areas of the Indochina Peninsula are small, while the EDH values in the ocean are relatively large, that is, the EDH from coastal to sea is an increasing trend. In addition, the reason why the RDLS_EDH value is large in the western coastal area of Luzon Island during this period is exactly the opposite of that in the eastern coastal area of the Indochina Peninsula, and the EDH from coastal to sea is a decreasing trend. However, in the eastern part of the Indochina Peninsula from June to August, the EDH in its coastal area increases, and the non-uniformity is also more obvious, mainly because the EDH gradually decreases from coastal to sea, resulting in a relatively large RDLS_EDH in the coastal area. As for the northern part of the SCS, the EDH in this area is generally large from October to December, but the RDLS_EDH is small, that is, the EDH in this area shows a good uniformity feature.
From the daily distribution (Figure 7), it can be seen that the RDLS_EDH values in the coastal areas are relatively high at 06:00 and 12:00 (mainly at 12:00 from March to June). This indicates that the non-uniformity of EDH in the SCS region is most pronounced during these times. The next highest values of RDLS_EDH occur at 00:00, and the lowest is at 18:00. In other words, the RDLS_EDH values show an increasing and then decreasing trend throughout the day. From the perspective of Beijing time, the non-uniformity of EDH is most pronounced in the afternoon to evening, and relatively smaller at night. At 00:00, the RDLS_EDH values are higher along the western coast of Luzon Island from November to April of the following year, while the non-uniformity of EDH in the eastern part of the Indochinese Peninsula is more pronounced from February to August. At 06:00 and 12:00, the RDLS_EDH values are relatively high in the eastern part of the Indochinese Peninsula and along the western coast of Luzon Island from March to May. Notably, the EDH at 06:00 in the Xisha Islands from March to July exhibits distinct non-uniform characteristics, while the RDLS_EDH values for this region at other times are relatively low. Furthermore, the variation trend of the RDLS_EDH values over the course of a day is consistent with the monthly distribution of EDH.
As we all know, environmental variables mainly influencing the EDH were the SST, the AT, the RH, the near-surface WS, and the air-sea temperature difference (ASTD). According to Huang et al. (2022), based on the spatial patterns of the two-hourly mean SST and AT in different seasons, the SST and the AT diurnal variation is small, and the variation zones do not correspond to that of the EDH. Therefore, to explain the RDLS_EDH month variation, the RH, the WS, and the ASTD are mainly taken into consideration. To analyze the RDLS_EDH relationship with the three variables quantitatively, partial correlation analysis on the time series of each variable is performed (Figure 8).
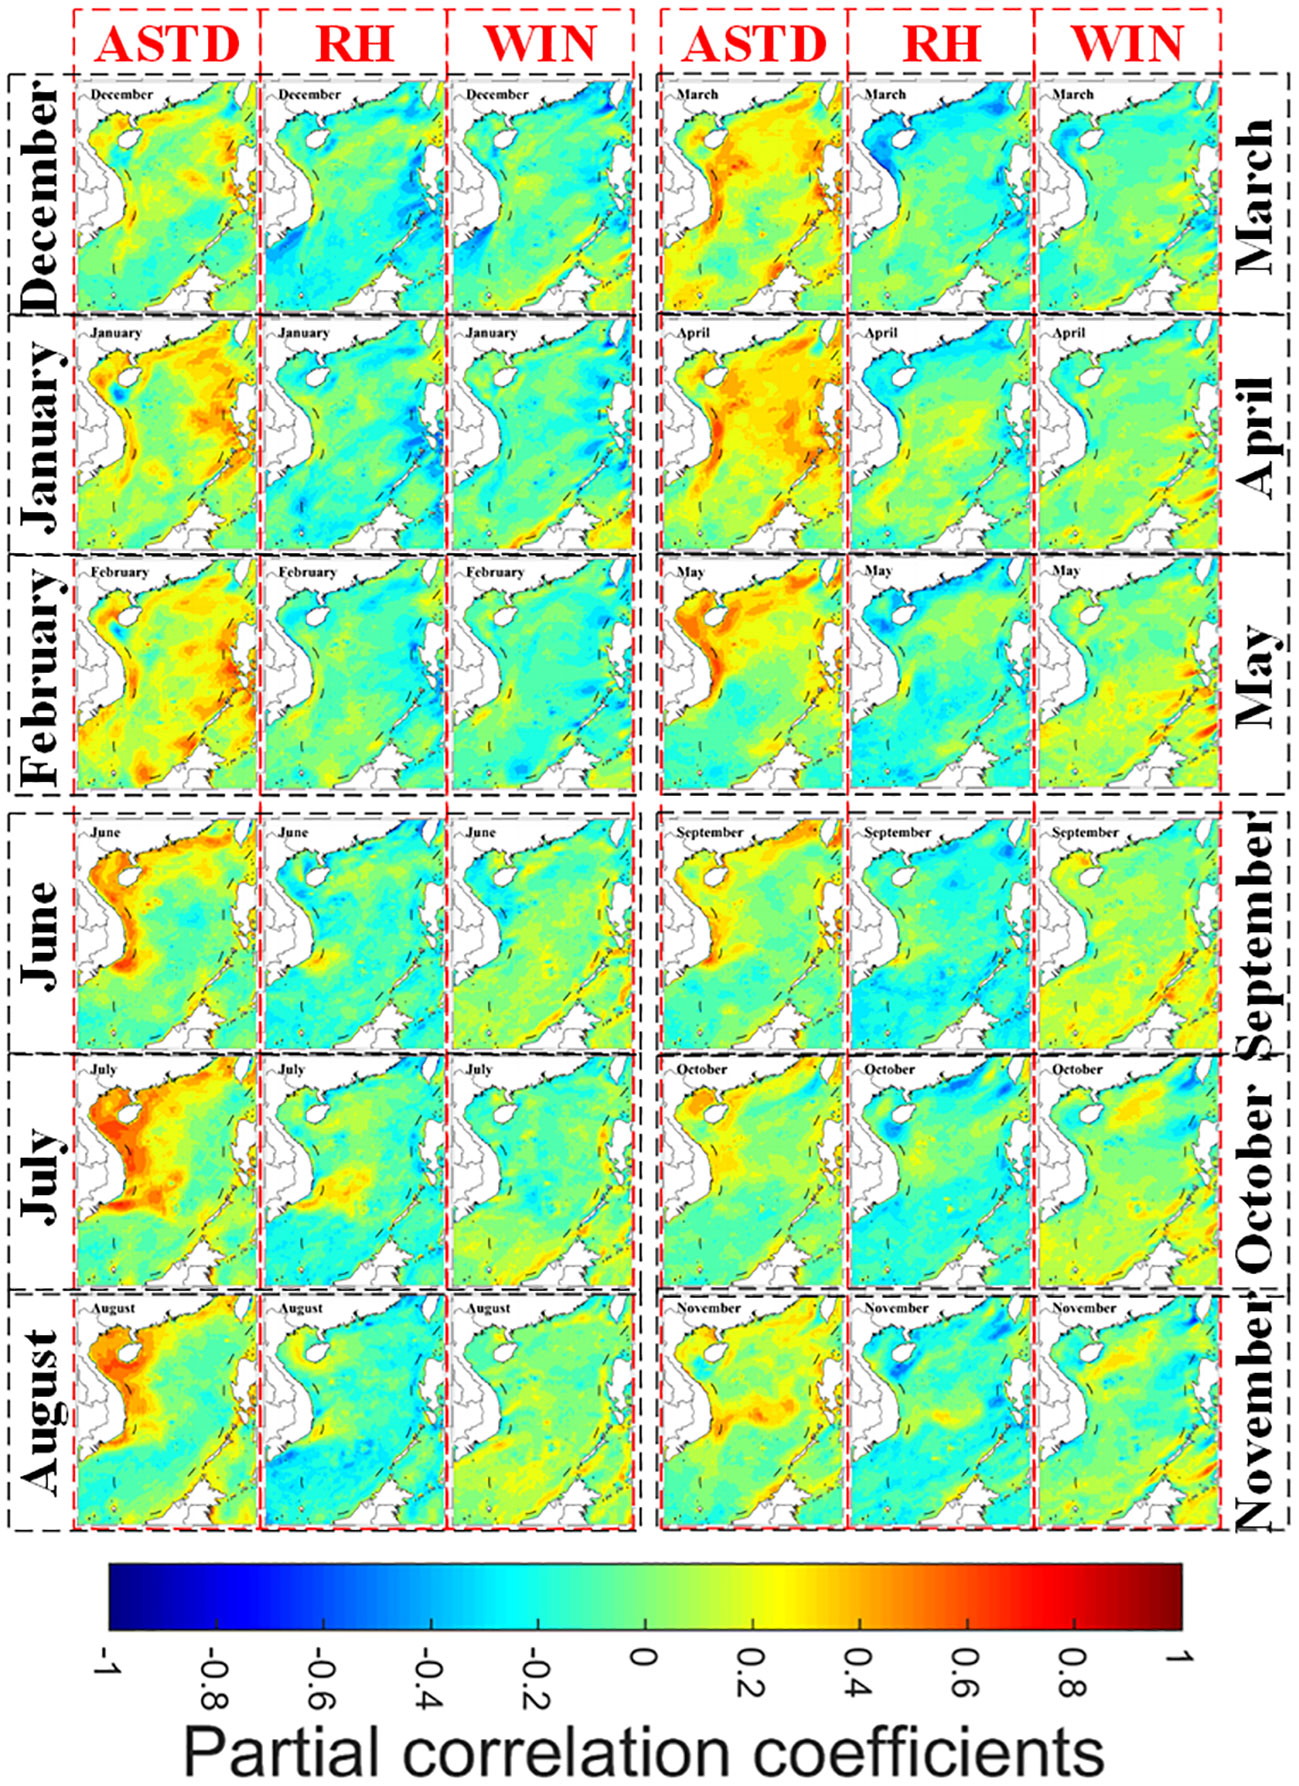
Figure 8 Partial correlation coefficients between the RDLS_EDH (radius is 100 km) and the 2 m RH, 10 m WS, and the ASTD.
Firstly, from Figure 8, the partial correlation coefficient between RH and RDLS_EDH is relatively low, followed by WS; ASTD shows the highest partial correlation coefficient with RDLS_EDH. In addition, with the change of months, the partial correlation coefficients of various meteorological elements with RDLS_EDH also exhibit distinct spatial variations. Secondly, the high values of the partial correlation coefficient between ASTD and RDLS_EDH are mainly concentrated in the western part of Luzon Island and the eastern part of the Indochinese Peninsula. The low-value area of the partial correlation coefficient between RH and RDLS_EDH is mainly concentrated in the southwest of Luzon Island and the coastal area of the northern part of the SCS. In contrast, the partial correlation coefficient between WS and RDLS_EDH is no obvious high-value area. However, the partial correlation coefficient in the southern part of the SCS is mostly positive, with negative partial correlation coefficients being predominant in the northern part of the SCS. Therefore, RDLS_EDH in the western part of Luzon Island and the eastern part of the Indochinese Peninsula is greatly influenced by ASTD and RH.
This article utilizes the AP, AT of 2 m, SH of 2 m, and WS of 10 m from the CLDAS near real-time dataset, along with the SST from the CFSR dataset, as inputs to the NPS model. Statistical analysis is conducted on the monthly and daily distribution of EDH in the SCS, revealing the significant impact of monsoons on the spatiotemporal distribution of EDH at the sea-land boundary of the SCS. Subsequently, the non-uniformity characteristics of EDH in the SCS region are statistically analyzed based on the non-uniformity parameter of EDH, considering electromagnetic propagation distances of 20 km, 50 km, 100 km, and 200 km, respectively, and based on partial correlation analysis, the main influencing factors of EDH non-uniformity were explored. These results indicate that the non-uniformity of EDH is more pronounced in the western part of Luzon Island from October to April of the following year, the eastern coast of the Indochina Peninsula from March to August, and the sea-land boundary area of the Beibu Gulf during this time. In the time scale of daily distribution, the non-uniformity of EDH in the SCS is more prominent from afternoon to evening and relatively small at night. Moreover, the non-uniformity of EDH in the western part of Luzon Island and the eastern part of the Indochinese Peninsula is greatly influenced by ASTD and RH. Furthermore, it is recommended to consider the impact of EDH non-uniformity characteristics when the electromagnetic propagation distance exceeds 50 km in coastal. However, the impact of EDH non-uniformity can be disregarded for distances less than 100 km on the broad ocean. In practical applications, the height of communication antennas should be adjusted appropriately based on changes in EDH between the ocean and land.
Overall, this study provides the first elucidation of the spatiotemporal distribution characteristics of the non-uniformity of EDH in the range of SCS, based on the analysis of its spatiotemporal changes. These findings offer a basis for maritime communication and ship traffic. However, despite obtaining certain results from existing data, there are still shortcomings. Further research is needed to explore the physical mechanism behind the spatiotemporal characteristics of EDH non-uniformity based on observation data.
The CLDAS data used in this study can be retrieved from the following website: http://data.cma.cn/data/detail/dataCode/NAFP_CLDAS2.0_NRT.html. The SST grid data can be downloaded from the Climate Forecast System Reanalysis (CFSR) and Climate Forecast System Reanalysis Version 2 (CFSv2)reanalysis data products (https://rda.ucar.edu/).
NY: Conceptualization, Investigation, Methodology, Writing – original draft. XZ: Funding acquisition, Investigation, Project administration, Writing – review & editing. LS: Investigation, Writing – review & editing. DS: Formal analysis, Writing – review & editing. TW: Conceptualization, Funding acquisition, Methodology, Writing – review & editing.
The author(s) declare financial support was received for the research, authorship, and/or publication of this article. This work was supported in part by Shenzhen Science and Technology Program under Grant KQTD20190929172704911.
We acknowledge the use of data from NCAR (https://rda.ucar.edu/, accessed on May 2023) and CLDAS (http://data.cma.cn, accessed on March 2023); we thank all the editors and reviewers for their valuable comments, which greatly improved the presentation of this article.
The authors declare that the research was conducted in the absence of any commercial or financial relationships that could be construed as a potential conflict of interest.
All claims expressed in this article are solely those of the authors and do not necessarily represent those of their affiliated organizations, or those of the publisher, the editors and the reviewers. Any product that may be evaluated in this article, or claim that may be made by its manufacturer, is not guaranteed or endorsed by the publisher.
The Supplementary Material for this article can be found online at: https://www.frontiersin.org/articles/10.3389/fmars.2023.1326975/full#supplementary-material
Cheng Y., Zha M., You Z., Zhang Y. (2021). Duct climatology over the South China Sea based on European Center for Medium Range Weather Forecast reanalysis data. J. Atmos. Solar Terrestrial Phys. 222, 105720. doi: 10.13443/j.cjors.2012.02.002
Cheng Y., Zhao Z., Zhang Y. (2012). Statistical analysis of the lower atmospheric ducts during monsoon period over the South China Sea. Chin. J. Radio Sci. 27, 268. doi: 10.1016/j.jastp.2015.10.017
Ding J., Fei J., Huang X., Cheng X., Hu X., Ji L. (2015). Development and validation of an evaporation duct model. Part I: Model establishment and sensitivity experiments. J. Meteorol. Res. 29, 467–481. doi: 10.1007/s13351-015-3238-4
Ergin D., Ozgur A. (2014). Beyond-line-of-sight communications with ducting layer. IEEE Commun. Magazine 52, 37–43. doi: 10.1109/MCOM.2014.6917399
Guo X., Wu J., Zhang J., Han J. (2018). Deep learning for solving inversion problem of atmospheric refractivity estimation. Sustain. Cities Soc. 43, 524–531. doi: 10.1016/j.scs.2018.09.009
Guo X., Zhao D., Zhang L., Wang H., Kang S. (2019). A comparison study of sensitivity on pj and nps models in China seas. J. Ocean Univ. China 18, 1022–1030. doi: 10.1007/s11802-019-3971-x
Huang L., Zhao X., Liu Y., Yang P., Ding J., Zhou Z. (2022). The diurnal variation of the evaporation duct height and its relationship with environmental variables in the South China Sea. IEEE Trans. Antennas Propagation 70 (11), 10865–10875. doi: 10.1109/TAP.2022.3191160
Li Z., Luo Y. (2021). Statistical characteristics of pre-summer rainfall over South China before and after South China Sea monsoon onset from 1980 to 2017. Torrential Rain Disasters 40, (101–110). doi: 10.3969/j.issn.1004-9045.2021.02.001
Ma J., Wang J., Yang C. (2022). Long-range microwave links guided by evaporation ducts. IEEE Commun. Magazine 60, 68–72. doi: 10.1109/MCOM.002.00508
Niu W., William M. (1996). The forecast of its environmental situation in the 21st century. J. Environ. Manage. 47, 101–114. doi: 10.1006/jema.1996.0039
Pozderac J., Johnson J., Yardim C. (2015). X-band beacon-receiver array evaporation duct height estimation. 2015 IEEE International Symposium on Antennas and Propagation & USNC/URSI National Radio Science Meeting. 916–917. doi: 10.1109/APS.2015.7304845
Qiu Z., Zhang C., Wang B., Hu T., Zou J., Li Z., et al. (2023). Analysis of the accuracy of using ERA5 reanalysis data for diagnosis of evaporation ducts in the East China Sea. Front. Mar. Sci. 9. doi: 10.3389/fmars.2022.1108600
Rosenberg D., Chung C. (2008). Maritime security in the South China Sea: Coordinating coastal and user state priorities. Ocean Dev. Int. Law 39, 51–68. doi: 10.1080/00908320701641602
Shi Y., Li X., Chao W., He X., Zhong Y. (2017). Application of the PJ and NPS evaporation duct models over the South China Sea (SCS) in winter. PloS One 12, e0172284. doi: 10.1371/journal.pone.0172284
Shi Y., Yang K., Yang Y., Ma Y. (2015a). Experimental verification of effect of horizontal inhomogeneity of evaporation duct on electromagnetic wave propagation. Chin. Phys. B 24, 044102. doi: 10.1088/1674-1056/24/4/044102
Shi Y., Yang K., Yang Y., Ma Y. (2015b). A new evaporation duct climatology over the South China Sea. J. Meteorol. Res. 29 (20150505), 764–778. doi: 10.1007/s13351-015-4127-6
Sirkova I. (2015). Duct occurrence and characteristics for Bulgarian Black sea shore derived from ECMWF data. J. Atmos. Solar Terrestrial Phys. 135, 107–117. doi: 10.1016/j.jastp.2015.10.017
van der Laan P., Kelly C., M. N., S. N. (2017). A new k-epsilon model consistent with Monin-Obukhov similarity theory. Wind Energy 20, 479–489. doi: 10.1002/we.2017
von Engeln A., João T. (2004). A ducting climatology derived from the European Centre for Medium-Range Weather Forecasts global analysis fields. J. Geophys. Res.: Atmos. 109 (D18). doi: 10.1029/2003JD004380
Wang Q., Alappattu D. P., Billingsley S., Blomquist B., Burkholder R. J., Christman A. J., et al. (2018). CASPER: coupled air–sea processes and electromagnetic ducting research. Bull. Am. Meteorol. Soc. 99 (7), 1449–1471. doi: 10.1175/BAMS-D-16-0046.1
Wang S., Yang K., Shi Y., Yang F., Zhang H. (2023a). Observed over-the-horizon propagation characteristics and evaporation duct inversion during the entire process of tropical cyclone Mulan, (202207). IEEE Trans. Antennas Propagation 71 (6), 5322–5334. doi: 10.1109/TAP.2023.3263212
Wang S., Yang K., Shi Y., Yang F., Zhang H., Ma Y. (2023b). Prediction of over-the-horizon electromagnetic wave propagation in evaporation ducts based on the gated recurrent unit network model. IEEE Trans. Antennas Propagation 71 (4), 3485–3496. doi: 10.1109/TAP.2023.3240998
Wang H., Zhang L., Wang H. (2019). The climatological analysis of the lower atmospheric ducts in South China Sea. Chin. J. Radio Sci. 34 (1005-0388(2019), 633. doi: 10.13443/j.cjors.2019010701
Xu L., Yardim C., Mukherjee S., Burkholder R. J., Wang Q., Fernando H. J. S. (2022). Frequency diversity in electromagnetic remote sensing of lower atmospheric refractivity. IEEE Trans. Antennas Propagation 70 (1), 547–558. doi: 10.1109/TAP.2021.3090828
Yang N., Su D., Wang T. (2023). Atmospheric ducts and their electromagnetic propagation characteristics in the Northwestern South China Sea. Remote Sens. 15, (13). doi: 10.3390/rs15133317
Zhang J., Ding J., Zhao X. (2020). Statistical analysis of atmospheric ducts in the South China Sea based on GPS sounding. Chin. J. Radio Sci. 484 35 (1005-0388(2020), 841. doi: 10.13443/j.cjors.2020071501
Zhang Q., Wang S., Shi Y., Yang K. (2023). Measurements and analysis of maritime wireless channel at 8 GHz in the South China Sea region. IEEE Trans. Antennas Propagation 71 (3), 2674–2681. doi: 10.1109/TAP.2022.3209664
Zhang Q., Yang K., Shi Y. (2016). Spatial and temporal variability of the evaporation duct in the Gulf of Aden. Tellus A: Dyn. Meteorol. Oceanogr. 68 (1), 29792. doi: 10.3402/tellusa.v68.29792
Zhao W., Li J., Zhao J., Zhao D., Zhu X. (2019). PDD GBR: research on evaporation duct height prediction based on gradient boosting regression algorithm. Radio Sci. 54, 949–962. doi: 10.1029/2019RS006882
Zhao X., Yang P., Zhou F., Zhou Z. (2023). Comparison of evaporation duct height statistics based on surface bulk measurements over Yongxing island. IEEE Antennas Wireless Propagation Lett. 22 (6), 1306–1310. doi: 10.1109/LAWP.2023.3241159
Keywords: evaporation duct, non-uniformity, electromagnetic propagation, South China Sea, CLDAS
Citation: Yang N, Zou X, Sun L, Su D and Wang T (2024) The non-uniformity characteristics of the evaporation duct in the South China Sea based on CLDAS data. Front. Mar. Sci. 10:1326975. doi: 10.3389/fmars.2023.1326975
Received: 24 October 2023; Accepted: 22 December 2023;
Published: 15 January 2024.
Edited by:
Shaowei Zhang, Chinese Academy of Sciences (CAS), ChinaReviewed by:
Zhijin Qiu, Qilu University of Technology, ChinaCopyright © 2024 Yang, Zou, Sun, Su and Wang. This is an open-access article distributed under the terms of the Creative Commons Attribution License (CC BY). The use, distribution or reproduction in other forums is permitted, provided the original author(s) and the copyright owner(s) are credited and that the original publication in this journal is cited, in accordance with accepted academic practice. No use, distribution or reproduction is permitted which does not comply with these terms.
*Correspondence: Xiaohai Zou, em91eGgyM0BtYWlsLnN5c3UuZWR1LmNu
Disclaimer: All claims expressed in this article are solely those of the authors and do not necessarily represent those of their affiliated organizations, or those of the publisher, the editors and the reviewers. Any product that may be evaluated in this article or claim that may be made by its manufacturer is not guaranteed or endorsed by the publisher.
Research integrity at Frontiers
Learn more about the work of our research integrity team to safeguard the quality of each article we publish.