
94% of researchers rate our articles as excellent or good
Learn more about the work of our research integrity team to safeguard the quality of each article we publish.
Find out more
ORIGINAL RESEARCH article
Front. Mar. Sci. , 31 January 2024
Sec. Marine Biotechnology and Bioproducts
Volume 10 - 2023 | https://doi.org/10.3389/fmars.2023.1322744
This article is part of the Research Topic Advances in crustacean research from the 10th International Crustacean Congress View all 12 articles
 Gurucharan Sudarshan1
 Simy Weil1
 Rivka Manor1Oron Goldstein2,3
 Eliya Sultan3
 Eliahu D. Aflalo1,4
 Rivka Ofir3,5
 Sean V. Zimin1
 Benyamin Rosental2,3
 Amir Sagi1,6*†
This study describes our attempts to generate a sustainable cell culture of Macrobrachium rosenbergii. We present here a continuous longitudinal study on the embryonic primary cell culture of freshwater prawn M. rosenbergii that was uniquely monitored for up to 90 days with regard to its morphology, metabolic activity, and cell-cycle parameters. The daily monitoring of cells’ wellbeing and morphology showed seeded cells to be changing from attached singular diverse-sized cells after days 4–10 to interconnected clusters of cells, which apparently increased in number as detected by their density in the well. Moreover, the cultures demonstrated an autonomous transition during days 7–10, from completely two-dimensional (2D) morphology to a combination of 2D and three-dimensional (3D) growing structures, leading to the formation of multilayered spheroid-like cell masses. The metabolic activity of cultures showed a non-linear elevated pattern peaking on day 26, demonstrating proliferation and increment in the number of cells, retaining statistically significant elevated metabolic activity up to 40 days, and thereafter gradually declining. In parallel, cell-cycle analyses performed through florescence-activated cell sorting (FACS) showed that the G0/G1 and S phases were inversely proportional to each other. Proliferation, based on metabolic activity, in the cultures was sustained by a significant increase in the portion of cells arrested in the S phase, from day 4 up to day 24, and then a decrease between days 45 and 90. Sorting the populations in the M. rosenbergii primary embryonic cell culture on days 3 and 24 revealed eight seeded populations, most of them expressing the putative proliferation markers MrMYC and MrPCNA, while six of them expressed also the putative stem-cell markers MrOct-4 and MrSox-2/3. Therefore, assuming the increment in cell density and metabolic activity and the reduction in G0/G1 distribution toward S, as well as the increment in G2/M, all pointing toward proliferation, we further hypothesized that splitting the cultures along the experiment at the high-proliferating mitotic ratio peaks would enable successful passages. Indeed, in prawn embryonic primary cell culture, we succeeded in executing two consecutive passages: the first after 8 days in culture and the second 4 days following the first passage. Cells after both passages expressed the species-specific Mr18S, along with the proliferative markers MrMYC and MrPCNA and the stem-cell markers MrOct-4 and MrSox-2/3. After several decades of research efforts to establish a crustacean cell line—with no published success—here, we present M. rosenbergii cultures composed of putative proliferating/stem-cell subpopulations or appearing like clones. These mix-population prawn embryonic primary cell cultures could serve as a basic platform for immortalization and contribute to the long-term goal of establishing sustainable cell-culture lines.
Despite several decades of research, a prawn cell line is still not available, and the optimal conditions for successful crustacean in vitro cell cultures are yet to be established. In vitro primary cell culture proliferation and passage achievements have gained attention in crustacean research as tools to manage and conserve valuable genetic resources, develop sustainable aquaculture practices, and support scientific investigations (Ma et al., 2017). Researchers have made notable progress in developing primary cell cultures and organ explants for various crustacean species (Jayesh et al., 2012; Anoop et al., 2021). However, maintaining the delicate balance between cell proliferation, differentiation, and cell–cell-interaction microenvironment still requires continuous efforts to refine culture media and conditions. Addressing critical factors such as optimal osmolality, vital-pathway metabolites as nutrient additives, and adequate addition of both growth and mitogenic factors still constitutes major challenges. In the present work, we adapted the commercial Opti-MEM medium (MEM-based medium) to optimal salinity for cells of the prawn Macrobrachium rosenbergii (420 mOsm; Frerichs, 1996). We also included metabolic precursors that facilitate the growth of adherent epithelial, smooth muscle, and primary fibroblast human cells including the selected medium used for stem cell research (Lee et al., 1996). In our previous study, the effectiveness of Opti-MEM in embryonic primary cell cultures was demonstrated for up to 14 days of culture (Sudarshan et al., 2023a). A disinfection protocol developed for fertilized eggs prior to cell isolation (Molcho et al., 2022) enabled the continuation of culture for longer periods. As a source of growth and attachment factors, lipids, hormones, and binding and transfer proteins, fetal bovine serum was adjusted up to 10% of the medium (Jochems et al., 2002).
In general, primary cell cultures have a limitation: they lose their ability to divide and proliferate after a certain number of divisions (Grimes and Chandra, 2009). Immortality can be achieved only when cells retain the ability to continuously and indefinitely divide, without undergoing senescence or cell death—a hallmark of cancer cells. Stem cells exhibit a phenomenon known as neoplasticity: the ability to self-renew independently. They show extended life spans and continue to divide for longer periods compared to differentiated cells, which stop dividing once differentiated (Hanahan and Weinberg, 2011). Upon continuous repetition of the complex animal cell cycle under optimal balance of nutrition and growth factors, genes like MYC, which upregulates Cyclin B, take center stage in orchestrating the rhythm of proliferation, while PCNA ensures precision in DNA replication (Shivji et al., 1992; Porter and Donoghue, 2003). Meanwhile, in the world of stem cells, Oct4 and Sox2 perform a delicate duet, harmonizing the balance between self-renewal and differentiation, thereby guiding the cell’s destiny (Boyer et al., 2005). The expression of transcription factors like OCT4 and SOX3 is commonly associated with the maintenance of pluripotency in vertebrate embryonic stem cells (ESCs) (Archer et al., 2011). These two transcription factors work together in a complex to regulate genes important for maintaining the undifferentiated state of stem cells. When undergoing differentiation, they exhibit a dynamic change in markers (downregulation of OCT4 and SOX2) as they progress toward their specialized cell fates (Swain et al., 2020). These stem-cell markers are expressed in the early stages of embryo development, much before the development and differentiation of lineages. Other than the genes above, MYC is known to be expressed in a variety of cancers. MYCN, a MYC paralog widely known as a proto-oncogene, is expressed in neuroblastoma (Ahmadi et al., 2021). MYC also supports high proliferation rates in mesenchymal stem cells. However, it is also involved in differentiation, cell-cycle progression, and cellular transformation (Melnik et al., 2019).
In the present work, we checked for the presence of the stem-cell markers listed above in an embryonic M. rosenbergii primary cell culture, showing supportive evidence from our embryonic M. rosenbergii transcriptomic libraries (Sharabi et al., 2016; Abayed et al., 2019; Grinshpan et al., 2022). We hypothesized that harvesting embryonic primary cells for culture, with both high proliferative properties and including populations that originated from embryonic stem cells from all germ layers, presents an opportunity to obtain prolonged in vitro culture and even achieve a few passages before the culture reaches senescence.
M. rosenbergii prawns were grown to maturity in artificial ponds at Ben-Gurion University of the Negev, Beer Sheva, Israel. Thereafter, to ensure a constant supply of embryos for primary embryonic cell isolation, gravid females were obtained by housing four to six mature females with a blue-claw male in 500-L tanks. The tanks were checked daily for the typical male reproductive guarding behavior to identify fertilized females (Molcho et al., 2022). Experiments were performed on embryos 10–16 days post-fertilization.
Data from three transcriptomic libraries, all of which were established in our laboratory, were used. One of the transcriptomic libraries includes various embryonic developmental stages (Abayed et al., 2019; Wahl et al., 2022), and the other includes larvae, post-larvae, and specific adult tissues (Sharabi et al., 2016; Abayed et al., 2019; Grinshpan et al., 2022). Homologs were mined from the libraries using a tBLASTn search using the amino acid sequence of OCT-4 from Oreochromis mossambicus (ALM89054.1), SOX-2/3 from Penaeus mondon (XP_037784358.1), MYC from Homarus americanus (XP_042210132.1), and PCNA from Drosophila melanogaster. mRNA sequences were aligned to the transcriptomic libraries, and putative protein sequences were compared using various NCBI BLAST algorithms (accessed during March and April 2023, https://blast.ncbi.nlm.nih.gov/Blast.cgi).
In our laboratory, a highly effective protocol for isolating primary cells from prawn embryonic primary cell cultures was developed. This well-established method ensures the reliable harvesting of these vital cells for further research and experimentation (Molcho et al., 2022; Sudarshan et al., 2023a; Sudarshan et al., 2023b). Briefly, gravid females holding laid eggs on their swimming legs were disinfected for surface sterilization by submerging the animals in an aqueous solution of methylene blue (3 ppm) overnight, prior to cell isolation. On the following day, the embryos were removed from the females’ swimming legs using forceps, washed with a sterile saline solution (420 mOsm), and supplemented with antibiotics penicillin–streptomycin solution (PS; 1 mg/ml, Cat. No. 03-031-1B, Biological Industries, Beit HaEmek, Israel) and tetracycline (T; 25 µg/ml, Cat. No. T-9823, Merck, Rahway, NJ, USA) and antimycotic reagent voriconazole (V; 0.5 µg/ml, Cat. No. PZ0005, Merck, USA)—referred henceforth as salineX1. The separated eggs were further disinfected in salineX1 with formalin (1%, Cat. No. 252549, 420 mOsm, Sigma-Aldrich, St. Louis, MO, USA) for 1 min followed by iodophor (1 ppm polydine, Dr. Fisher, Israel) for 3 min, then rinsed again with fresh salineX1, and rotated for 10 min at room temperature (RT). The embryonic cells were obtained by short homogenization of fertilized eggs in PSTV containing a protease and phosphatase inhibitor cocktail (Halt™ Protease Inhibitor, Cat. No. 87785, Thermo Fisher Scientific, Waltham, MA, USA). The total homogenate obtained, which consisted of whole embryo tissue, dispersed cells, and yolk protein, was passed through a 70-μm cell strainer to separate the egg envelopes and non-broken eggs from the dispersed cells. The filtrate was then pelleted by centrifugation at 850 g for 6 min at 18°C. The residue remaining in the cell strainer was transferred to Eppendorf tubes, each containing 1 mg/ml collagenase type I and 1 mg/ml collagenase IV (Cat. No. C0130 and C5138, respectively, Sigma-Aldrich, USA) and incubated for 30 min at room temperature (Waterhouse et al., 2009) with constant rotation. The extracellular matrix digestion was stopped by centrifugation as above, and the pellet was washed with medium containing 10% fetal bovine serum (FBS; Cat. No. F7524, Gibco, Grand Island, NY, USA) and combined with a filtrated cell pellet. The total cell pellet was resuspended in 2 ml of salineX1, slowly poured into an animal physiological Percoll step gradient (Cat. No. 17-0891-01, GE Healthcare Bio-Sciences AB, Uppsala, Sweden) prepared with crustacean salineX1 for osmolarity (100%, 1.062 g/ml; 50%, 0.565 g/ml; 25%, 0.282 g/ml; and 12.5%, 0.141 g/ml) and centrifuged again at 1,000 g for 15 min at 18°C with minimal deceleration. The Percoll gradient was used to separate the different embryonic cell types from the bulky yolk proteins (early embryonic nutrition). The yolk proteins appeared at 12.5% Percoll, while the cells migrated down the gradient and spread between 12.5% and 50% Percoll. All cell types were pooled and used for culture, transferred to a new 15-ml tube, centrifuged, and washed from Percoll with up to 10 ml of salineX1. The cells obtained were reconstituted in 1 ml Opti-MEM medium (Cat. No. 31985-047, Gibco, USA) supplemented as described above for salineX1, then visualized by trypan blue exclusion (0.2% final concentration, Cat. No. 03-102-1B, Biological Industries, Israel), and counted using a hemocytometer.
Freshly isolated cells were seeded at a density of 106 cells/well in 24-well plates. The cells were cultured overnight in Dulbecco’s modified Eagle medium (DMEM) high glucose (supplemented with PSTV, 10% FBS, non-essential amino acids (Cat. No. M7145, Sigma-Aldrich, Darmstadt, Germany) sodium pyruvate (Cat. No. S8636, Sigma-Aldrich, Germany), and glutamax (Cat. No. 35050061, Thermo Fisher Scientific, Oxford, UK)) at 28°C with 5% CO2, our upgrading to the published protocol, to facilitate the attachment of higher numbers of cells to the plate (Sudarshan et al., 2023b). On day 1, the culture media were gently changed to Opti-MEM supplemented with 10% FBS and salineX1 PSTV and osmolarity-adjusted to 420 mOsm—referred to as growing medium (Frerichs, 1996). The culture plates were incubated in a 75% humidified incubator at 28°C with 5% CO2 with 200 µl of growing medium overnight. The medium was then gently removed and refreshed with 200 µl of fresh growing medium to retain only the attached populations. Cells were monitored using an inverted microscope (Olympus CK40, Tokyo, Japan) and imaged using a digital eyepiece camera (Dino-Eye AM4023) and imaging software (DinoCapture 2.0, Dino-Lite, Netherlands) at each time point for morphological difference. The metabolic rate of the cultured cells was measured using a CCK-8 proliferation kit (Cat. No. 96992, Merck, Darmstadt, Germany) according to the manufacturer’s protocol. The CCK-8 kit is based on the bio-reduction of WST-8(2-(2-methoxy-4-nitrophenyl)-3-(4-nitrophenyl)-5-(2,4-disulfophenyl)-2H-tetrazolium, monosodium salt by cellular dehydrogenases to an orange formazan product that is directly proportional to the number of living cells (correlated to [3H]-thymidine incorporation assay). After 3 h of incubation in an incubator, the absorbance was read at 450 nm using a Tecan spectrophotometer (Tecan, Männedorf, Switzerland) and analyzed using Magellan software (Tecan, Switzerland). Significance between specific time points was determined using generalized additive models (GAMs) (Mundo et al., 2022), which are used in data analysis for understanding (especially non-linear) relationships between variables, resulting in smooths marking the confidence interval. For each time of metabolic activity, the cells were stored for cell-cycle analysis (CCA).
For CCA, cells from the plate were detached using Accutase (Cat. No. 00-4555-56, Sigma-Aldrich, USA) for 15 min at 28°C, pipetted gently to detach from the plate, then transferred to Eppendorf tubes, centrifuged at 850 g for 5 min, and eluted with growing medium. Cells were washed twice with salineX1, pelleted, and fixed in 4% paraformaldehyde (PFA). Post-fixation, the cells were washed twice with fresh salineX1 and stored in a cryo-preservative (10% dimethyl sulfoxide (DMSO), 90% FBS). Later, cells were pelleted and permeabilized using permeabilization buffer X1 (Cat. No. 00-8333-56, Thermo Fisher Scientific, USA) for 20 min, stained with propidium iodide (PI; 50 µg/ml; Cat. No. 81845, Merck, Germany), and analyzed using a flow cytometer (Gallios, Beckman Coulter, Brea, CA, USA). To analyze the phases of CCA, the events were gated based on PI positives into three separate phases. The flow cytometry results were displayed using CytExpert v2.5 software (Beckman Coulter, USA). Each cell-cycle phase of the parent population was normalized to 100% in every biological triplicate at each time point. The significance between the cell-cycle phases along specific time points was determined using GAM (Mundo et al., 2022).
RNA was extracted using TRI reagent (Cat. No. T3934, Sigma-Aldrich, USA), and 1 µg of total RNA was converted into cDNA by following the protocol of the qScript cDNA synthesis kit (Cat. No. 95047-100, Quantabio, Beverly, MA, USA). PCR was performed using the following primers for stem-cell markers: MrOCT-4 F: CTGGTGGGTGTAAGTGGGAT, MrOCT-4 R: CCAGGGAAGGAAACGCAAAA (57°C), MrSOX-2/3 F: CGTGTTAGTTAGCGCTGGTC, MrSOX-2/3 R: ACACTTCGGATTTTGGGCAC (56°C) and for proliferating gene markers: MrPCNA F: TGTCTCCCTCGTCTCTCTCA, Mr PCNA R: GCTGCTGAGAATTTCACCCC (56°C), MrMYC F: GCAGTTTGCCTGAAGACCTC and MrMYC R: ACAGGAGGTCGGATATGTGC (58°C) using cDNA as templates. For the sorted cell populations, when the available number of cells ranged between 15 and 30 K, the TRI reagent kit was used for RNA extraction, and the cDNA reaction was performed using 0.5 µg of total RNA.
Freshly isolated cells were seeded at a density of 106 cells/well in 24-well plates. The cells were cultured in DMEM high glucose (supplemented with PSTV, 10% FBS, non-essential amino acids, sodium pyruvate, and glutamax) overnight at 28°C with 5% CO2 to facilitate the attachment of higher numbers of cells to the plate. DMEM high glucose was then gently removed along with non-attached cells and debris and refreshed with 500 µl of fresh growing medium to retain only the attached populations. Cells were cultured up to two time points, 3 days and 24 days, for comparison of population content in the fast-growing metabolic-activity phase in culture. For subjecting the cultured cells to florescence-activated cell sorting (FACS), the cells were harvested by enzymatic treatment using Accutase as described above. As opposed to 3 days in culture, after 24 days, with elevated numbers of clusters of interconnected cells, the enzymatic protocol was prolonged for harvesting single detached cells, as required for FACS. The cells were stained with PI to estimate cell viability and sorted through FACS (SH800S, Sony, Tokyo, Japan). The cells were sorted into distinct populations in separate tubes containing either Opti-MEM for morphology or TRI reagent for RNA isolation.
Newly isolated embryonic primary cells were seeded at a density of 106 cells/well in 24-well plates with DMEM high glucose. On the next day, non-attached cells were removed and fed overnight with a growing medium. After 8 days in culture, the density reached approximately 80% confluency. The cells were treated with Accutase for 15 min at 28°C and pipetted gently to detach from the plate, transferred to Eppendorf tubes, and centrifuged at 850 g for 5 min. This was followed by washing with 100 µl growing medium, centrifugation, and reconstitution with 100 µl Opti-MEM, with 5 µl saved for trypan-blue exclusion staining. For RNA extraction, 106 cells were saved, and for CCA, 300 K were fixed as described earlier. The remaining cells were reseeded at a density of 106 cells/well in 24-well plates as passage 1—the same original density. After 4 days in culture as passage 1, when the wells were almost confluent, a new passage was performed, and the attached cell’s extracellular matrix was enzymatically digested. A short incubation of 7 min at 28°C with Accutase was effective in obtaining single dispersed cells detached from the plate. The cells were transferred to Eppendorf tubes, centrifuged at 850 g for 5 min, washed with growing medium, centrifuged again, reconstituted with 100 µl Opti-MEM, and counted using trypan blue. The harvested cells were reseeded in a new 24-well plate at a 106 cells/well density and cultured at the same conditions as passage 2. Both passages 1 and 2 were further analyzed through FACS after 8 days and 4 days after passage, respectively. The sorted cells were separated into different populations and directly added to the TRI reagent for RNA isolation as described above.
On the day of seeding, cells were allowed to settle and attach to the plate. Most cells were isolated and round in morphology (Figure 1A). On the following day, after removing the debris, aggregates and clusters of diverse sizes were already visible (Figure 1B). A notable presence of extracellular vesicle-like structures was observed among the cultures, mostly crowdedly located surrounding the elongated cell–cell connections. From day 4 onward, the connections between the cell clusters formed a net-like structure of intercellular bridges (Figures 1C–H) and thinner single connection (black bracket) or, alternatively, groups (yellow bracket) of finger-like projections (Figures 1C–H). Additionally, cells embedded in apparent connective-tissue-like morphology were noted from 60 days in culture (Figure 1G). Interestingly, the culture was mainly spread as two-dimensional (2D) on day 4, but from day 16 onward (till day 90), it assumed a three-dimensional (3D) spheroid-like architecture (Figures 1B–H).

Figure 1 Morphology of long-term Macrobrachium rosenbergii embryonic primary cell culture. Representative days in culture: (A) day 1, (B) day 4, (C) day 16, (D) zoomed-in images of day 16 depicting extracellular vesicle-like morphology, (E) day 26, (F) day 45, (G) day 60, and (H) day 90. Black brackets denote prominent connections between clusters that look like intercellular bridges. The oval box denotes extracellular vesicle-like structures. The yellow bracket shows cells embedded in apparent connective-tissue-like morphology. Bar = 50 µm, (A–C) and (E–H). Bar = 125 µm, (D).
Spikes in the metabolic activity of the cells were detected on days 4, 12, and 26. The highest metabolic activity was seen on day 26, followed by a gradual decline until day 90, at which point it was still higher than on day 1. Based on OD values, the metabolic activity was significantly higher in the first 33 days of the culture, reaching more than 10 times the seeded culture’s OD. After 3 months, a fivefold metabolic activity was measured as compared to the seeded culture (Figure 2A). The metabolic activity was significantly higher in the first month of the culture based on the GAM statistical analysis (upper yellow mark). A significant decline was observed between days 50 and 75 (lower yellow mark) and until the end of the experiment (Figure 2B).
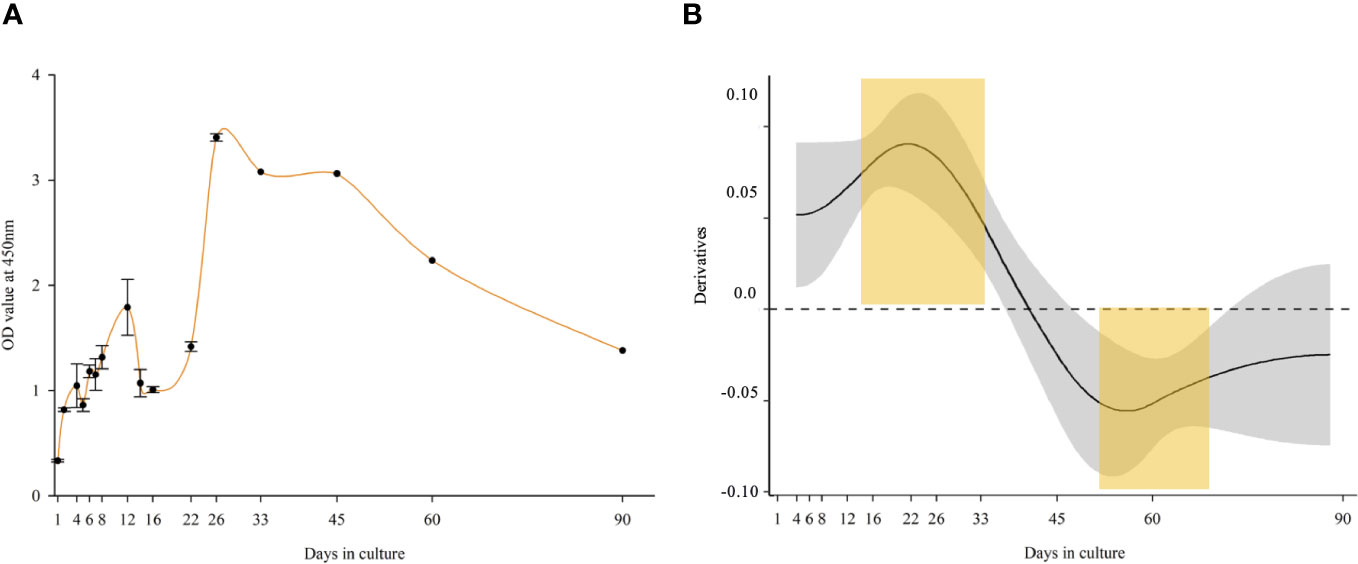
Figure 2 Metabolic activity of long-term Macrobrachium rosenbergii embryonic primary cell culture. (A) OD values (CCK-8 proliferation kit) of Opti-MEM culture up to 90 days. (B) Derivatives of a GAM-smooth fitted for OD values (p < 0.001), indicating a significant (CI excluding zero) positive trend up to Day 33, and a significant negative one from Day 45. Statistically significant different time points are marked in yellow regions.
Higher metabolic activity is directly proportional to the number of living cells. FACS-mediated cell-cycle analysis allows us to determine the portion of cells arrested in each phase, in turn allowing us to determine the mitotic ratio. The FACS gating is depicted in Figure 3A, indicating that at the seeding point, the ratio between G0/G1 and S+G2+M was 75:25. The portion of cells in G0/G1 ranged between 51% and 78% throughout the experiment, showing a significant decrease between 2 and 22 days. The S phase ratio increased between days 12 and 33, peaked on day 26, and gradually decreased until day 90. G2/M cells were at 10% on the seeding day and maintained a steady ratio with minor fluctuations, and in the last two time points, they dropped to 3% (Figure 3B). GAM analyses applied to the cell-cycle phases showed an inverted mirror image between the statistical significance patterns of the G0/G1 and S phases of the cells (Supplementary Figure 1, left and middle). The distribution of cells at G0/G1 decreased significantly during the start of the culture, while the S phase was highly increased, and vice versa between days 50 and 90. Toward the end of the experiment, the ratio was inversed: the cells at the S phase decreased, while cells at G0/G1 increased significantly. Statistically, cells at G2/M (the shortest time period of the cell cycle) showed no significant difference throughout the culture (Supplementary Figure 1, right). In order to determine the changes in the proliferation pattern of the cells during the experiment, we calculated the mitotic ratio (the sum of the S, G2, and M phases divided by the sum of the G0 and G1 phases) of the cells from the CCA results. On day 1, the mitotic ratio was 35, increasing on days 2, 8, 16, 22–26, and 45, and then gradually declining toward day 90 to a lower value than on seeding day (~20) (Figure 3C).
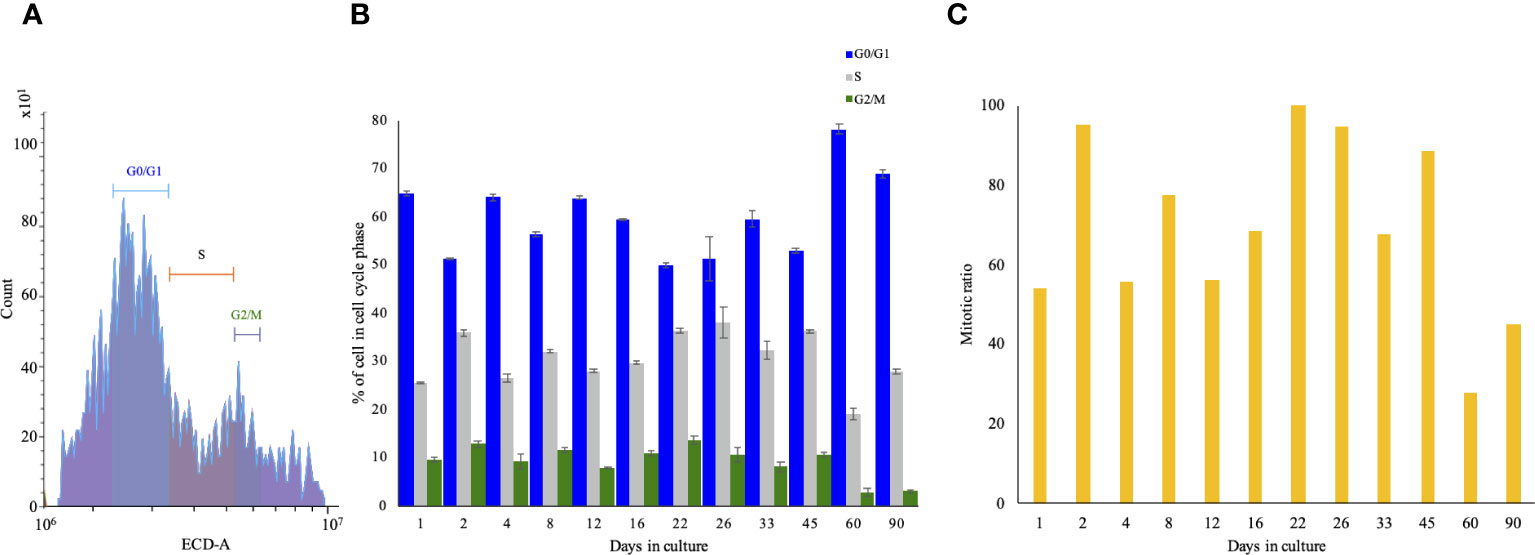
Figure 3 Cell-cycle analysis of long-term Macrobrachium rosenbergii embryonic primary cell culture through FACS. (A) Gating strategy of cell-cycle phases. The x-axis denotes the intensity of PI, and the y-axis denotes the count of events. (B) Normalized cell-cycle-phase distribution during the study. (C) Calculated cell-cycle mitotic ratio (S+G2+M)/(G0+G1) of cells at specific time points. FACS, florescence-activated cell sorting; PI, propidium iodide.
Both metabolic activity and CCA show evidence for proliferation in this long-lasting culture. However, it is still an open question whether this culture contained putative stem-cell clones with the potential to become sustainable in culture in the future. To address this, we performed FACS for live cells on days 3 and 24 (Figures 4A–D). Survival of cells according to PI staining was 70% and 35% on days 3 and 24, respectively. The gating strategy was based on different cell sizes and granularity, resulting in eight different populations detected for day 3 or 24 (Figures 4B, C). As shown in Figure 4D, there was no dramatic change in the percentage distribution of populations 1, 3A, 5, 6, and 7 between culture days 3 and 24. However, populations 2 and 4 were almost twice as high on day 24 as compared to day 3, and population 3B was higher on day 3 compared to day 24. The morphology of the different populations of cells after sorting did not differ between day 3 and day 24 (Supplementary Figure 2).
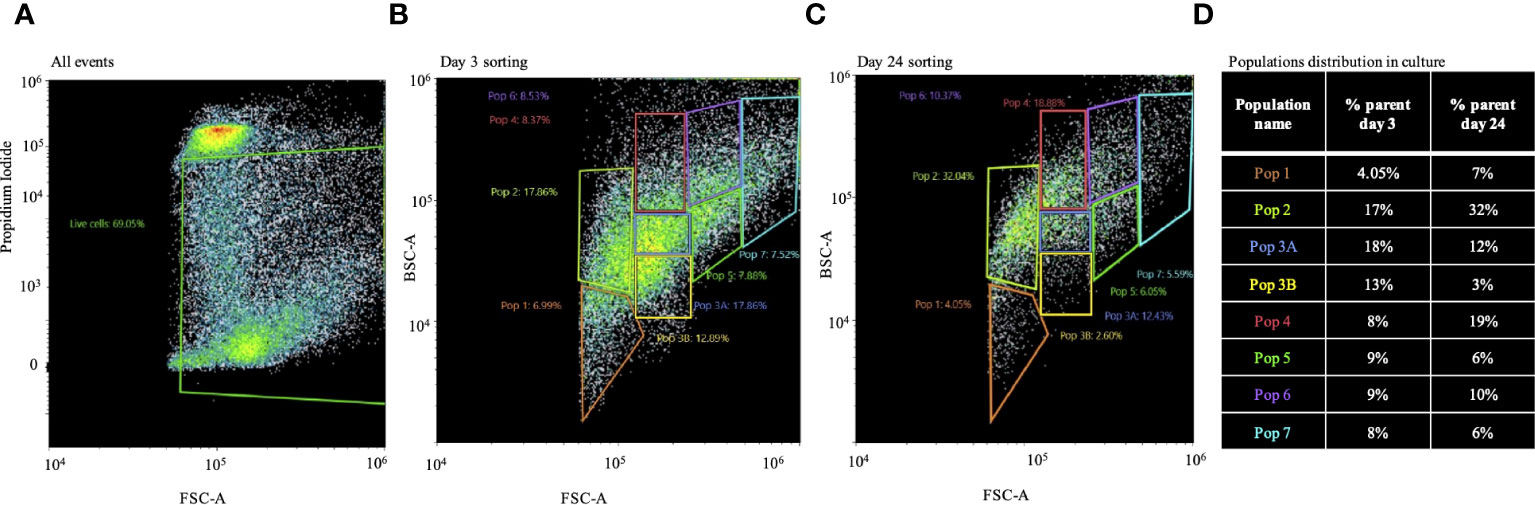
Figure 4 Population distribution of long-term Macrobrachium rosenbergii embryonic primary cell cultures. (A) FACS of live cells based on PI negatives and gating strategy based on cell size and granularity. (B) Distribution of populations 1–7 from 3-day cultured cells. (C) Same as in panel B, but from 24-day cultured cells. (D) Table describing changes in population distribution in cultures on day 3 and day 24 as percentages of sorted cell populations. FACS, florescence-activated cell sorting; PI, propidium iodide.
Mining the M. rosenbergii transcriptomic libraries for expression of putative stem-cell and proliferation markers resulted in identifying orthologs of MrSOX-2/3, MrOCT-4, MrMYC, and MrPCNA. The putative stem-cell markers were expressed in the early stages of embryo development, much before the development and differentiation of lineages. Proliferative genes MYC and PCNA were also expressed at the early embryonic developmental stages at very high levels, thus giving us the liberty to use them as embryonic stem-cell proliferation marker genes (Supplementary Figure 3). The sorted cell populations were checked for the expression of MrSOX-2/3 and MrOCT-4 putative stem-cell markers and MrMYC and MrPCNA proliferation markers. cDNA from embryos aged 1 and 12 days and cultured cells at isolation days 0 and 1 served as positive control. As shown in the PCR agarose gel (Figure 5), all cells expressed both putative stem-cell and proliferative genes. Mr18S served as a housekeeping gene for the RNA content of samples and species identification, being expressed in all samples.
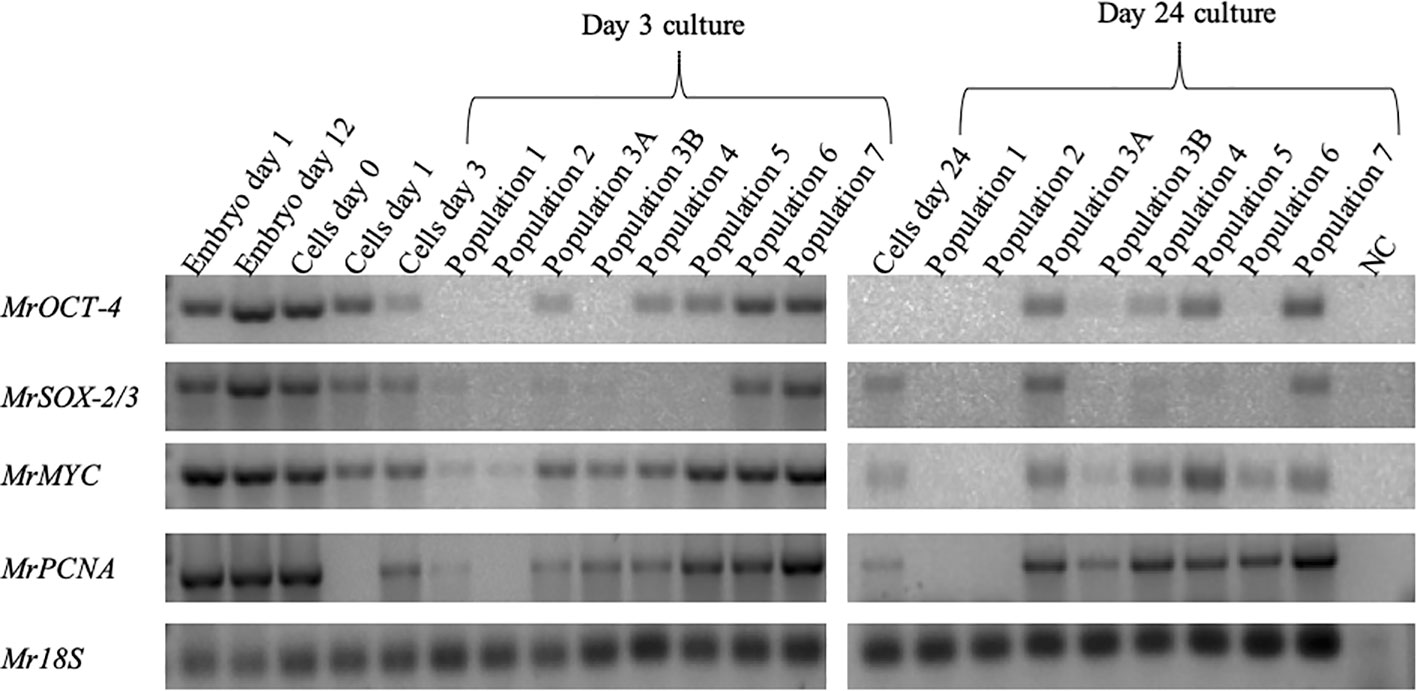
Figure 5 Identification of putative stem-cell and proliferative-cell populations in cultured cells. Agarose gels showing expression of stem-cell pluripotency markers (MrSOX-2/3, 316 bp; MrOCT-4, 327 bp) and proliferation genes (MrMYC, 330 bp; MrPCNA, 384 bp; Mr18S, 124 bp) served as housekeeping gene for RNA extraction and species identification.
In the 3-day group, we found MrOCT-4 expression in some specific sets of cells: 3A, 4, 5, 6, and 7. However, in the 24-day group, MrOCT-4 appeared in slightly different sets: 3A, 3B, 4, 5, and 7. MrSOX-2/3 was present in several groups of cells in the 3-day group: 1, 2, 3A, 3B, 6, and 7; in the 24-day group, it was only in groups 3A, 4, 5, and 7. MrMYC was expressed in all populations on day 3; on day 24, it was not present only in populations 1 and 2. Another proliferation marker, MrPCNA, was not expressed in cells on day 1 and in population 2 of the sorted cells on day 3. On day 24, the sorted population expressed a similar pattern as MrMYC.
Cultures on day 8 exhibited a morphology of 2D and 3D clusters of interconnected cells (Figure 6A). Before passage splitting, the number of cells counted was 1.9 × 10⁶ per well. After 2 days of passage 1, the reseeded cells retained the same morphology as before the passage (Figure 6A, middle). The second passage of cells had a count of 1.3 × 10⁶ per well. After 12 days from the first passage, attached round cells were noted, and over time, they became crowded in the center of the well but were not confluent in the contour of the well (Figure 6A, right). After sorting the cultures, the majority of the cells were in population 2 (almost 50%), and population 4 was the second most abundant (20%–23%). The less abundant populations were 1 and 6 (8%–4% and 6%–7%, respectively) (Figure 6B). Cells at both consecutive passages expressed the species-specific Mr18S (Figure 6C). MrOCT-4 was expressed in almost all populations of both passages except for populations 1 and 2, while MrSOX-2/3 was expressed only in populations 3A, 3B, 5, and 7 of passage 1 and in 3B, 6, and 7 of passage 2 (Figure 6C).
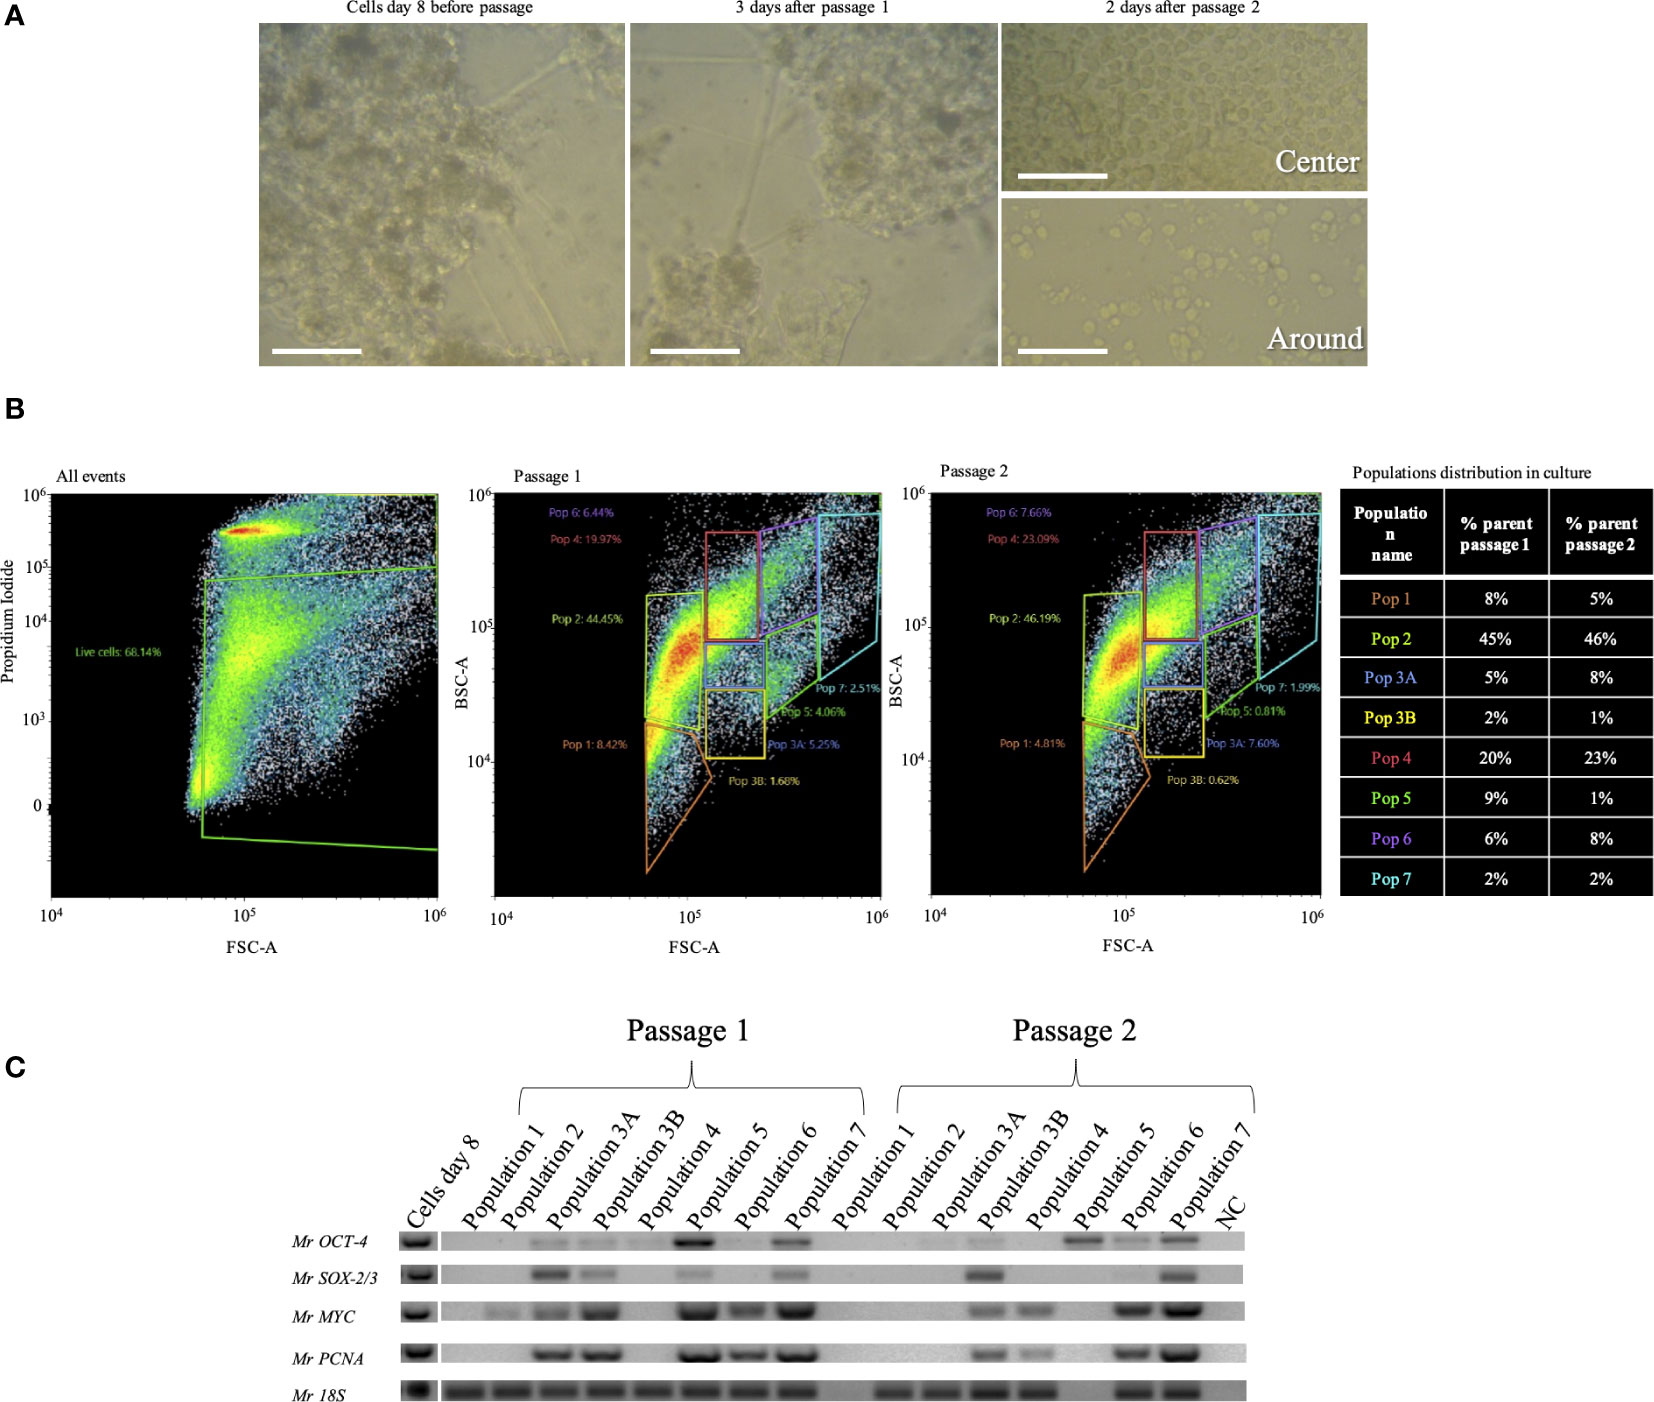
Figure 6 Two consecutive passages of Macrobrachium rosenbergii embryonic primary cell cultures. (A) Morphology of the culture on day 1 (left), 3 days into passage 1 (middle), and 2 days into passage 2. Above: image from the center of the well; below: image from the contour of the well. (B) Population distribution of M. rosenbergii embryonic primary cell subcultures, passages 1 and 2 through FACS of live cells, based on PI negatives and gating strategy based on cell size and granularity (left). Distribution of populations 1–7 from passages 1 and 2 (middle). Table describing changes in population distribution in passages, presented as percentage of PI-stained cells from total stained events (% parents, right). (C) Agarose gels showing expression of putative stem-cell pluripotency markers (MrSOX-2/3, 316 bp; MrOCT-4, 327 bp) and proliferation genes (MrMYC, 330 bp; MrPCNA, 384 bp). Mr18S (124 bp) served as a housekeeping gene for RNA extraction and species identification. FACS, florescence-activated cell sorting; PI, propidium iodide.
With the longstanding aim of establishing a sustainable crustacean cell line, we reached a long-term primary culture of 90 days and two consecutive passages using an M. rosenbergii primary embryonic cell culture. Such processes are generally initiated by the establishment of adherent 2D cultures in which cells grow as a monolayer in a culture flask or a flat well plate, attached to a plastic surface as depicted in the initial step of our culture after removing the dead and non-attached cells. The later-emerging interconnected morphology of cell clusters featured a combination of 2D and 3D growing structures that led to the formation of multilayered spheroid-like cell masses, mimicking aspects of tumor architecture (Zani and Edelman, 2010; Mattes and Scholpp, 2018; Pizon et al., 2022). Under these optimized conditions, the 3D sphere-like morphology was retained for the first time (to the best of our knowledge of the peer-reviewed literature) for such a long period in an M. rosenbergii primary embryonic cell culture.
The elongated cell connections formed could be related to cell-signaling traffic enabling the transport of vital elements for sustainability and growth (Zani and Edelman, 2010; Mattes and Scholpp, 2018). As cells proliferate, they tend to make use of the intricate connections as pathways, to move from one cluster to another, or for the exchange of growth factors and essential elements (Bagheri et al., 2020). The cells that formed 3D patterns growing like mushrooms look similar to HER2-positive breast cancer cell lines cultured in 3D (Breslin and O’Driscoll, 2016). We suspect that cells in the innermost part of our observed clusters might not receive as much nutrients as those on the outer edges. The outer cells, being more exposed to the culture medium, tend to divide and multiply rapidly, while the inner cells remain less active, similar to cancer tumors (Bowden et al., 2020). Moreover, the notable presence of extracellular vesicle (EV)-like structures located mostly surrounding the elongated cell–cell cluster connections are suggested to be derived from the different types of embryonic stem cells, carrying cargo that influences the differentiation of target cells as described in vertebrates (Gong et al., 2021). EV research in crustaceans revealed their roles in intercellular communication, immune responses, and reproductive processes (Bowden et al., 2020). The presence of EV might suggest signaling-molecule transport, but this remains to be further studied.
The non-linear elevated fluctuation pattern in the metabolic activity can be related to energetic pathways exhibited by the cells. Cells can switch between different metabolic pathways based on their microenvironment and needs. Cancer cells at certain periods used aerobic glycolysis to convert glucose into energy (Tripathi et al., 2022). Based on the drop-in metabolic activity of cells in culture, such a process might occur on days 4, 8, 12, and 26 in the prawn embryonic primary cell culture. At these higher peaks, high proliferation of cells is suggested; hence, more efficient oxidative-phosphorylation respiration is needed to facilitate the uptake and incorporation of nutrients into biomass. Nucleotides, amino acids, and lipids are needed to produce new cells in culture, cell membranes, and other components (Vander Heiden et al., 2009). This aligns with the peak in metabolic activity, suggesting that the latter might represent an optimal state for cell growth and proliferation. We suggest that the abundant extracellular vesicles we showed in our culture could explain the increment in phosphatidylcholine, phosphatidylserine, and palmitate detected in the culture media correlating with the peak in metabolic activity (Sudarshan et al., 2023b). Organic solvents used for metabolic extraction could easily solubilize the extracellular vesicle membrane and elute the metabolites in the extracellular vesicle’s cargo, suggesting that these metabolites are involved in inducing proliferation.
As mentioned earlier, our cells formed 3D mushroom-like structures. Cells in the inner mass need to rely on aerobic glycolysis to produce energy and are not stimulated by growth factors or inducers available in the medium. In contrast, cells in the outer layer are in direct contact with the medium and are hence supplied with the necessary growth hormones, inducers, and mitogenic factors and might be in a constant state of proliferation (Fontana et al., 2020; Zanoni et al., 2020). This allows us to determine the phase of the cell by morphological appearance. The peak in metabolic activity on days 12 to 26 was found to be associated with the peak in the S phase from days 8 to 33 based on cell-cycle analysis, thus providing insights into cell-division dynamics within the culture. The rise in the abundance of S-phase cells indicates active DNA synthesis, followed by a gradual decrease. This evidence suggests a burst of cell proliferation followed by stabilization, exhibiting a high mitotic ratio for a relatively long time in culture. The proliferation potential of the primary cell culture is suggested by the results to be similar to that of cancerous cell lines like HT-29 colorectal adenocarcinoma, Jurkat cells, and lung carcinoma epithelial cells A549 (Begum et al., 2013).
We infer that whenever a sorted cell population does not express putative stem-cell markers, it is in a state of differentiation. From the sorted 3-day M. rosenbergii primary culture results, it seems that populations 3A, 6, and 7 are probably self-renewing putative stem cells in nature, as was supported by their gene-expression patterns, which are similar to populations 3A, 4, 5, and 7 in 24-day sorted cultures. Studies in humans have shown that when Sox-3 is expressed alone in a cell, it can bind to specific DNA sequences called Sox-binding sites and regulate the expression of target genes. Sox-3 is known to be involved in various cellular processes, including embryonic development and neural differentiation (Archer et al., 2011). Nevertheless, the expression of Sox-3 alone in our cultures may suggest that these cell populations are already differentiated (Wang et al., 2006). Future work, using specific cell markers, may make it possible to point toward the exact types of differentiated cells, e.g., differentiated neural cells like in humans.
In our culture, almost all sorted populations were in a state of proliferation on days 3 and 24. This suggests that our conditioning of the medium (Sudarshan et al., 2023a) supported the culture of M. rosenbergii cells in sustaining the stemness of the embryonic cells by self-renewing and differentiation of specific lineages. The only populations that expressed neither stem-cell markers nor typical proliferation genes had the smallest (7–10 µm) size compared to other populations, which might suggest that they originated from the hematopoietic lineage, which does not proliferate and contains the smallest cells of the organism (Matozzo and Marin, 2010).
We hypothesized that interfering along the experiment at points of high-proliferating mitotic-ratio peaks, for example, after 8 days, would result in a successful passage. Diluting cell densities for the first and second subculturing passages resulted in increased embryonic subpopulations that expressed the M. rosenbergii-specific Mr18S gene and which proliferated and also expressed putative stem-cell markers. Other than a study on M. rosenbergii heart cell explants, which, to the best of our knowledge, did not mature into a continuous cell line (Goswami et al., 2010), and a patent application of a commercial company (SHIOK meats) that was not scientifically published, our report seems to have a promising potential in reaching immortalization and contributing to the long-time goal of establishing sustainable crustacean cell-culture lines (Sriram and Ling, 2020).
In conclusion, the results of the present study suggest that our M. rosenbergii primary embryonic cell culture undergoes significant changes in morphology, metabolic activity, and cell-cycle dynamics over time. Understanding these changes and their implications can be valuable for further studies and applications involving M. rosenbergii primary embryonic cell cultures.
The datasets presented in this study can be found in online repositories. The names of the repository/repositories and accession number(s) can be found in the article/Supplementary Material.
The manuscript presents research on animals that do not require ethical approval for their study.
GS: Conceptualization, Data curation, Formal analysis, Methodology, Validation, Visualization, Writing – original draft, Writing – review & editing. SW: Conceptualization, Investigation, Methodology, Project administration, Resources, Supervision, Validation, Visualization, Writing – review & editing. RM: Investigation, Project administration, Resources, Software, Supervision, Validation, Visualization, Writing – review & editing. OG: Methodology, Software, Supervision, Validation, Writing – review & editing. ES: Formal analysis, Methodology, Software, Writing – review & editing. EA: Conceptualization, Formal analysis, Investigation, Methodology, Project administration, Software, Supervision, Writing – review & editing. RO: Conceptualization, Investigation, Project administration, Supervision, Visualization, Writing – review & editing. SZ: Data curation, Formal analysis, Methodology, Software, Writing – review & editing. BR: Formal analysis, Investigation, Methodology, Project administration, Supervision, Validation, Visualization, Writing – review & editing. AS: Conceptualization, Funding acquisition, Project administration, Resources, Supervision, Visualization, Writing – review & editing.
The author(s) declare financial support was received for the research, authorship, and/or publication of this article. Funding for this study was granted by the Ministry of Science and Technology, Israel-Taiwan collaboration 00019994. The work of BR was supported by the Israel Science Foundation (ISF, Grants Nos. 1416/19 and 2841/19). The authors declare no competing financial interests.
We would like to thank Enzootic Ltd. and Colors Farm for the supply of embryos for the study. We would like to thank Prof. Ofer Ovadia, Dept. of Life Sciences, BGU, for the discussion regarding statistical analyses.
The authors declare that the research was conducted in the absence of any commercial or financial relationships that could be construed as a potential conflict of interest.
All claims expressed in this article are solely those of the authors and do not necessarily represent those of their affiliated organizations, or those of the publisher, the editors and the reviewers. Any product that may be evaluated in this article, or claim that may be made by its manufacturer, is not guaranteed or endorsed by the publisher.
The Supplementary Material for this article can be found online at: https://www.frontiersin.org/articles/10.3389/fmars.2023.1322744/full#supplementary-material
Abayed F. A. A., Manor R., Aflalo E. D., Sagi A. (2019). Screening for Dmrt genes from embryo to mature Macrobrachium rosenbergii prawns. Gen. Comp. Endocrinol. 282, 113205. doi: 10.1016/j.ygcen.2019.06.009
Ahmadi S. E., Rahimi S., Zarandi B., Chegeni R., Safa M. (2021). MYC: a multipurpose oncogene with prognostic and therapeutic implications in blood Malignancies. J. Hematol. Oncol. 14, 121. doi: 10.1186/s13045-021-01111-4
Anoop B. S., Puthumana J., Vazhappilly C. G., Kombiyil S., Philip R., Abdulaziz A., et al. (2021). Immortalization of shrimp lymphoid cells by hybridizing with the continuous cell line Sf9 leading to the development of ‘PmLyO-Sf9‘. Fish Shellfish Immunol. 113, 196–207. doi: 10.1016/j.fsi.2021.03.023
Archer T. C., Jin J., Casey E. S. (2011). Interaction of Sox1, Sox2, Sox3 and Oct4 during primary neurogenesis. Dev. Biol. 350, 429–440. doi: 10.1016/j.ydbio.2010.12.013
Bagheri H. S., Bani F., Tasoglu S., Zarebkohan A., Rahbarghazi R., Sokullu E. (2020). Mitochondrial donation in translational medicine; from imagination to reality. J. Trans. Med. 18, 367. doi: 10.1186/s12967-020-02529-z
Begum J., Day W., Henderson C., Purewal S., Cerveira J., Summers H., et al. (2013). A method for evaluating the use of fluorescent dyes to track proliferation in cell lines by dye dilution. Cytometry. Part A, 83 (12), 1085–1095.
Bowden T. J., Kraev I., Lange S. (2020). Extracellular vesicles and post-translational protein deimination signatures in haemolymph of the American lobster (Homarus americanus). Fish Shellfish Immunol. 106, 79–102. doi: 10.1016/j.fsi.2020.06.053
Boyer L. A., Lee T. I., Cole M. F., Johnstone S. E., Levine S. S., Zucker J. P., et al. (2005). Core transcriptional regulatory circuitry in human embryonic stem cells. Cell 122, 947–956. doi: 10.1016/j.cell.2005.08.020
Breslin S., O’Driscoll L. (2016). The relevance of using 3D cell cultures, in addition to 2D monolayer cultures, when evaluating breast cancer drug sensitivity and resistance. Oncotarget 7, 45745–45756. doi: 10.18632/oncotarget.9935
Fontana F., Raimondi M., Marzagalli M., Sommariva M., Gagliano N., Limonta P. (2020). Three-dimensional cell cultures as an in vitro tool for prostate cancer modeling and drug discovery. Int. J. Mol. Sci. 21, 6806. doi: 10.3390/ijms21186806
Frerichs G. N. (1996). In vitro culture of embryonic cells from the freshwater prawn Macrobrachium rosenbergii. Aquaculture 143, 227–232. doi: 10.1016/0044-8486(96)01281-1
Gong Y., Wei X., Sun W., Ren X., Chen J., Aweya J. J., et al. (2021). Exosomal miR-224 contributes to hemolymph microbiota homeostasis during bacterial infection in crustacean. PloS Pathog. 17, e1009837. doi: 10.1371/journal.ppat.1009837
Goswami M., Lakra W. S., Rajaswaminathan T., Rathore G. (2010). Development of cell culture system from the giant freshwater prawn Macrobrachium rosenbergii (de Man). Mol. Biol. Rep. 37, 2043–2048. doi: 10.1007/s11033-009-9659-3
Grimes A., Chandra S. B. (2009). Significance of cellular senescence in aging and cancer. Cancer Res. Treat 41, 187–195. doi: 10.4143/crt.2009.41.4.187
Grinshpan N., Abayed F. A. A., Wahl M., Ner-Gaon H., Manor R., Sagi A., et al. (2022). The transcriptional landscape of the giant freshwater prawn: Embryonic development and early sexual differentiation mechanisms. Front. Endocrinol. 13. doi: 10.3389/fendo.2022.1059936
Hanahan D., Weinberg R. A. (2011). Hallmarks of cancer: the next generation. Cell 144, 646–674. doi: 10.1016/j.cell.2011.02.013
Jayesh P., Seena J., Singh I. S. (2012). Establishment of shrimp cell lines: perception and orientation. Indian J. Virol. 23, 244–251. doi: 10.1007/s13337-012-0089-9
Jochems C. E. A., van Der Valk J. B. F., Stafleu F. R., Baumans V. (2002). The use of fetal bovine serum: ethical or scientific problem? Alternatives to Lab. Anim. 30, 219–227.
Lee J. H., Jang S. I., Yang J. M., Markova N. G., Steinert P. M. (1996). The proximal promoter of the human transglutaminase 3 gene. Stratified squamous epithelial-specific expression in cultured cells is mediated by binding of Sp1 and ets transcription factors to a proximal promoter element. J. Biol. Chem. 271, 4561–4568. doi: 10.1074/jbc.271.8.4561
Ma J., Zeng L., Lu Y. (2017). Penaeid shrimp cell culture and its applications. Rev. Aquaculture 9, 88–98. doi: 10.1111/raq.12106
Matozzo V., Marin M. G. (2010). First cytochemical study of haemocytes from the crab Carcinus aestuarii (Crustacea, Decapoda). Eur. J. Histochem. 54, e9. doi: 10.4081/ejh.2010.e9
Mattes B., Scholpp S. (2018). Emerging role of contact-mediated cell communication in tissue development and diseases. Histochem. Cell Biol. 150, 431–442. doi: 10.1007/s00418-018-1732-3
Melnik S., Werth N., Boeuf S., Hahn E.-M., Gotterbarm T., Anton M., et al. (2019). Impact of c-MYC expression on proliferation, differentiation, and risk of neoplastic transformation of human mesenchymal stromal cells. Stem Cell Res. Ther. 10, 73. doi: 10.1186/s13287-019-1187-z
Molcho J., Manor R., Shamsian M., Sudarshan G., Ofir R., Parker D., et al. (2022). On genome editing in embryos and cells of the freshwater prawn Macrobrachium rosenbergii. Aquaculture 558, 738391. doi: 10.1016/j.aquaculture.2022.738391
Mundo A. I., Tipton J. R., Muldoon T. J. (2022). Generalized additive models to analyze nonlinear trends in biomedical longitudinal data using R: Beyond repeated measures ANOVA and linear mixed models. Stat Med. 41, 4266–4283. doi: 10.1002/sim.9505
Pizon M., Schott D., Pachmann U., Schobert R., Pizon M., Wozniak M., et al. (2022). Chick chorioallantoic membrane (CAM) assays as a model of patient-derived xenografts from circulating cancer stem cells (cCSCs) in breast cancer patients. Cancers (Basel) 14. doi: 10.3390/cancers14061476
Porter L. A., Donoghue D. J. (2003). Cyclin B1 and CDK1: nuclear localization and upstream regulators. Prog. Cell Cycle Res. 5, 335–347.
Sharabi O., Manor R., Weil S., Aflalo E. D., Lezer Y., Levy T., et al. (2016). Identification and characterization of an insulin-like receptor involved in crustacean reproduction. Endocrinology 157, 928–941. doi: 10.1210/en.2015-1391
Shivji M. K. K., Kenny M. K., Wood R. D. (1992). Proliferating cell nuclear antigen is required for DNA excision repair. Cell 69, 367–374. doi: 10.1016/0092-8674(92)90416-A
Sriram S., Ling K. Y. (2020). Isolation and cultivation of muscle and fat cells from crustaceans. International patent WO 2020/149791 A1, filled and issued. (Singapore).
Sudarshan G., Weil S., Jasińska W., Manor R., Goldstein O., Aflalo E. D., et al. (2023a). Correlation between metabolomic profile and proliferation of Macrobrachium rosenbergii primary embryonic cell culture. Front. Mar. Sci. 10. doi: 10.3389/fmars.2023.1270491
Sudarshan G., Weil S., Rotem-Dai N., Manor R., Greenshpan Y., Goldstein O., et al. (2023b). Enhanced proliferation in a prawn embryonic primary cell culture ectopically expressing mutated Ras. Front. Mar. Sci. 9. doi: 10.3389/fmars.2022.1100971
Swain N., Thakur M., Pathak J., Swain B. (2020). SOX2, OCT4 and NANOG: The core embryonic stem cell pluripotency regulators in oral carcinogenesis. J. Oral. Maxillofac. Pathol. 24, 368–373. doi: 10.4103/jomfp.JOMFP_22_20
Tripathi S., Park J. H., Pudakalakatti S., Bhattacharya P. K., Kaipparettu B. A., Levine H. (2022). A mechanistic modeling framework reveals the key principles underlying tumor metabolism. PloS Comput. Biol. 18, e1009841. doi: 10.1371/journal.pcbi.1009841
Vander Heiden M. G., Cantley L. C., Thompson C. B. (2009). Understanding the Warburg effect: the metabolic requirements of cell proliferation. Science 324, 1029–1033. doi: 10.1126/science.1160809
Wahl M., Levy T., Manor R., Aflalo E. D., Sagi A., Aizen J. (2022). Genes encoding the glycoprotein hormone GPA2/GPB5 and the receptor LGR1 in a female prawn. Front. Endocrinol. 13. doi: 10.3389/fendo.2022.823818
Wang T. W., Stromberg G. P., Whitney J. T., Brower N. W., Klymkowsky M. W., Parent J. M. (2006). Sox3 expression identifies neural progenitors in persistent neonatal and adult mouse forebrain germinative zones. J. Comp. Neurol. 497, 88–100. doi: 10.1002/cne.20984
Waterhouse A. M., Procter J. B., Martin D. M., Clamp M., Barton G. J. (2009). Jalview Version 2–a multiple sequence alignment editor and analysis workbench. Bioinformatics 25, 1189–1191. doi: 10.1093/bioinformatics/btp033
Zani B. G., Edelman E. R. (2010). Cellular bridges: Routes for intercellular communication and cell migration. Communicative Integr. Biol. 3, 215–220. doi: 10.4161/cib.3.3.11659
Keywords: cell cycle analysis, Macrobrachium rosenbergii, metabolic activity, passages, primary embryonic cell culture
Citation: Sudarshan G, Weil S, Manor R, Goldstein O, Sultan E, Aflalo ED, Ofir R, Zimin SV, Rosental B and Sagi A (2024) Development of long-term primary cell culture of Macrobrachium rosenbergii: morphology, metabolic activity, and cell-cycle analysis. Front. Mar. Sci. 10:1322744. doi: 10.3389/fmars.2023.1322744
Received: 17 October 2023; Accepted: 18 December 2023;
Published: 31 January 2024.
Edited by:
Giovanna Romano, Anton Dohrn Zoological Station, ItalyReviewed by:
Filomena Ristoratore, Zoological Station Anton Dohrn, ItalyCopyright © 2024 Sudarshan, Weil, Manor, Goldstein, Sultan, Aflalo, Ofir, Zimin, Rosental and Sagi. This is an open-access article distributed under the terms of the Creative Commons Attribution License (CC BY). The use, distribution or reproduction in other forums is permitted, provided the original author(s) and the copyright owner(s) are credited and that the original publication in this journal is cited, in accordance with accepted academic practice. No use, distribution or reproduction is permitted which does not comply with these terms.
*Correspondence: Amir Sagi, c2FnaWFAYmd1LmFjLmls
†ORCID: Amir Sagi, orcid.org/0000-0002-4229-1059
Disclaimer: All claims expressed in this article are solely those of the authors and do not necessarily represent those of their affiliated organizations, or those of the publisher, the editors and the reviewers. Any product that may be evaluated in this article or claim that may be made by its manufacturer is not guaranteed or endorsed by the publisher.
Research integrity at Frontiers
Learn more about the work of our research integrity team to safeguard the quality of each article we publish.