
94% of researchers rate our articles as excellent or good
Learn more about the work of our research integrity team to safeguard the quality of each article we publish.
Find out more
ORIGINAL RESEARCH article
Front. Mar. Sci. , 12 December 2023
Sec. Marine Biogeochemistry
Volume 10 - 2023 | https://doi.org/10.3389/fmars.2023.1306278
 Veronica Arnone1
 J. Magdalena Santana-Casiano1
 Melchor González-Dávila1
 Hélène Planquette2
 Géraldine Sarthou2
 Loes J. A. Gerringa3
 Aridane G. González1*
The Arctic Ocean is a unique biogeochemical environment characterized by low salinity surface waters, extensive sea-ice coverage, high riverine inputs, large shelf extension and the long residence time of deep waters. These characteristics determine the distribution of dissolved bio-essential trace metals, such as copper (Cu), and the dissolved organic-binding ligands capable of complexing it. This work reports the concentrations and conditional stability constants of dissolved Cu-binding ligands (LCu and log KcondCu2+L) measured in samples from the Polarstern (PS94) expedition, as part of the international GEOTRACES program (cruise GN04). Full-depth profile stations from the Barents Sea, Nansen Basin, Amundsen Basin and Makarov Basin were analysed by competitive ligand exchange-adsorptive cathodic stripping voltammetry (CLE-AdCSV). The basins and water masses presented a wide range of LCu concentrations (range: 1.40 – 7.91 nM) and log KcondCu2+L values (range: 13.83 – 16.01). The highest variability of Cu-binding ligand concentrations was observed in surface waters (≤200 m), and mean concentrations increased from the Barents Sea and Nansen Basin (2.15 ± 0.31 nM and 1.93 ± 0.35 nM, respectively) to the Amundsen (3.84 ± 1.69 nM) and Makarov Basins (4.40± 2.03 nM). The influence of the Transpolar Drift (TDP) flow path was observed in the Amundsen and Makarov Basins, especially on Cu-binding ligand concentrations (LCu range: 3.96 – 7.91 nM). In contrast, deep waters (>200 m) showed no significant differences between basins and water masses in terms of LCu concentrations (range: 1.45 – 2.78 nM) and log KcondCu2+L (range: 14.02 – 15.46). The presence of strong Cu-binding ligands (log KcondCu2+L>13) in surface waters stabilises the excess of dissolved copper (dCu) transported in the TPD and favours its export to the Fram Strait and Nordic Seas.
The Arctic Ocean is characterized by a perennial sea-ice coverage and presents one of the most extensive continental shelf areas, with important consequences for ocean chemistry. The shelf covers more than 50% of the total area (Jakobsson, 2002) and is associated with a strong release of terrestrial freshwater (Opsahl et al., 1999). Around 10% of global riverine discharge arrives in the Arctic (Benner et al., 2005) and introduces macronutrients (Cauwet and Sidorov, 1996), trace metals (Middag et al., 2011; Colombo et al., 2019; Charette et al., 2020; Gerringa et al., 2021a; Jensen et al., 2022), dissolved organic matter (DOM, Opsahl et al., 1999; Stedmon et al., 2011) and dissolved metal-binding ligands (Slagter et al., 2017; Laglera et al., 2019). These substances, together with sediments, can be retained in sea-ice and released during its melting (Dethleff et al., 2000; Tovar-Sánchez et al., 2010; Anderson and Amon, 2015; Jensen et al., 2021). The surface Arctic Ocean is also affected by the water input from the Nordic Seas, Atlantic Ocean, and Pacific Ocean with a complex circulation pattern (Bluhm et al., 2015). The Transpolar Drift (TPD) is a significant surface current that allows the transport of riverine and shelf-derived material, along with sea-ice, from the Eurasian shelves to the central Arctic (Amundsen and Makarov Basins, Charette et al., 2020). Additionally, it allows for the export of these materials to the Nordic Seas and North Atlantic Ocean through the Fram Strait (Gordienko and Laktionov, 1969). The circulation and properties of intermediate and deep Arctic waters are conditioned by the system of ridges and shelves. The ventilation of deep waters is limited, and the exchange only occurs via Fram Strait (Schauer, 2004). The export of Arctic waters and sea-ice to the Nordic Seas stimulates biological activity (Amon, 2003). Subsequently, changes in the Arctic water properties due to climate change may impact the biogeochemistry of other adjacent oceanic regions.
Climate change has already caused significant modifications in Arctic conditions. The observed temperature increases (0.6°C per decade between 1981 and 2020) in the Arctic Ocean were associated with the decrease of sea-ice coverage and higher light penetration (IPCC, 2022), can enhance the phytoplankton growth (Arrigo et al., 2008). Then, under ice-free conditions, the CO2 uptake and sequestrations increase (Arrigo et al., 2008). The increased input of freshwater is also modifying the hydrodynamics of the currents in the area and the potential export of Arctic waters (Krumpen et al., 2019). In addition, the permafrost thawing (Schuur et al., 2013; Schuur et al., 2015) and the higher freshwater inputs (Peterson et al., 2002) increase the discharge of DOM (Frey and McClelland, 2009; Stedmon et al., 2011), including dissolved metal-binding ligands (Slagter et al., 2017; Laglera et al., 2019), and dissolved trace metals in the Arctic basins (Guieu et al., 1996).
The bioavailability of trace metals is one of the limiting factors that determine primary production in the ocean. Copper (Cu) is required in different biological processes essential for phytoplankton growth (Twining and Baines, 2013), and can be assimilated as free cupric ion (Cu2+) and through complexes with strong binding ligands (Sunda and Lewis, 1978; Semeniuk et al., 2015). However, elevated concentrations of Cu2+ can be toxic for certain phytoplankton species (Brand et al., 1986). In seawater, Cu bioavailability and toxicity are controlled by the formation of complexes with dissolved organic binding ligands (Brand et al., 1986). Copper-binding ligands (LCu) are a heterogeneous group of compounds (e.g., thiols, humic substances, exopolysaccharides, and methanobactins), that remain largely unidentified. Ligands are classified according to their conditional stability constant respect to the Cu2+ ion (log KcondCu2+L) into strong (L1 class) or weak ligands (L2 class), being 13 the value that differentiates the two groups (Bruland et al., 2000; Buck and Bruland, 2005), that are in a good agreement with Ruacho et al. (2022). The biogeochemical cycle of Cu in the Arctic Ocean is still largely unexplored. While riverine runoff was proposed as the primary source of dissolved Cu (dCu) in the Arctic Ocean (Charette et al., 2020; Gerringa et al., 2021a; Jensen et al., 2022), the existing knowledge about Cu organic speciation in the study region and nearby areas are limited (Kramer, 1986; Moffett and Dupont, 2007; Whitby et al., 2018; Nixon et al., 2019; Gourain, 2020; Wong et al., 2021, Arnone et al., 2023). Information about LCu concentrations was reported for the Canadian Arctic waters (Nixon et al., 2019), the sub-arctic North Pacific (Moffett and Dupont, 2007; Whitby et al., 2018; Wong et al., 2021), the Fram Strait and Greenland shelf (Arnone et al., 2023), and for nearby areas in the North Atlantic Ocean (Kramer, 1986; Gourain, 2020).
To characterize the Cu organic speciation in the central Arctic Ocean, this study evaluates for the first time the dissolved Cu-binding ligand concentrations and the conditional stability constants (LCu and log KcondCu2+L) in this oceanographic region. Samples were collected during the TransArcII expedition (GEOTRACES GN04), between August 15th and October 17th 2015, onboard the RV Polarstern (PS94). Information about Cu-binding ligands in the Arctic Ocean improve our knowledge about the Cu biogeochemical cycle and the potential export to other oceanic areas.
During the PS94 TransArc II cruise (GEOTRACES GN04), onboard the icebreaker R/V Polarstern, a total of 23 stations were sampled between August 15th and October 17th, 2015 (Figure 1A). The cruise covered several basins, including the Barents Sea, Nansen Basin, Amundsen Basin and Makarov Basin, where water samples were collected through full-depth profiles (Schauer, 2016). An ultra-clean CTD (UCCTD) rosette (Rijkenberg et al., 2015) was employed for sample collection, following the GEOTRACES protocols (Cutter et al., 2014). After recovery, the UCCTD system was pushed into an ISO Class 6 clean room container, where samples were filtered over<0.2 μm Sartobran 300 cartridges (Sartorius), under pressure of filtered N2 (0.7 bar). The sampled 125 mL low-density polyethylene (LDPE) bottles, which were cleaned with hydrochloric acid (HCl) according to the GEOTRACES protocols (Cutter et al., 2014), were rinsed 3-4 times with seawater before filling. After filling, they were stored at -20°C.
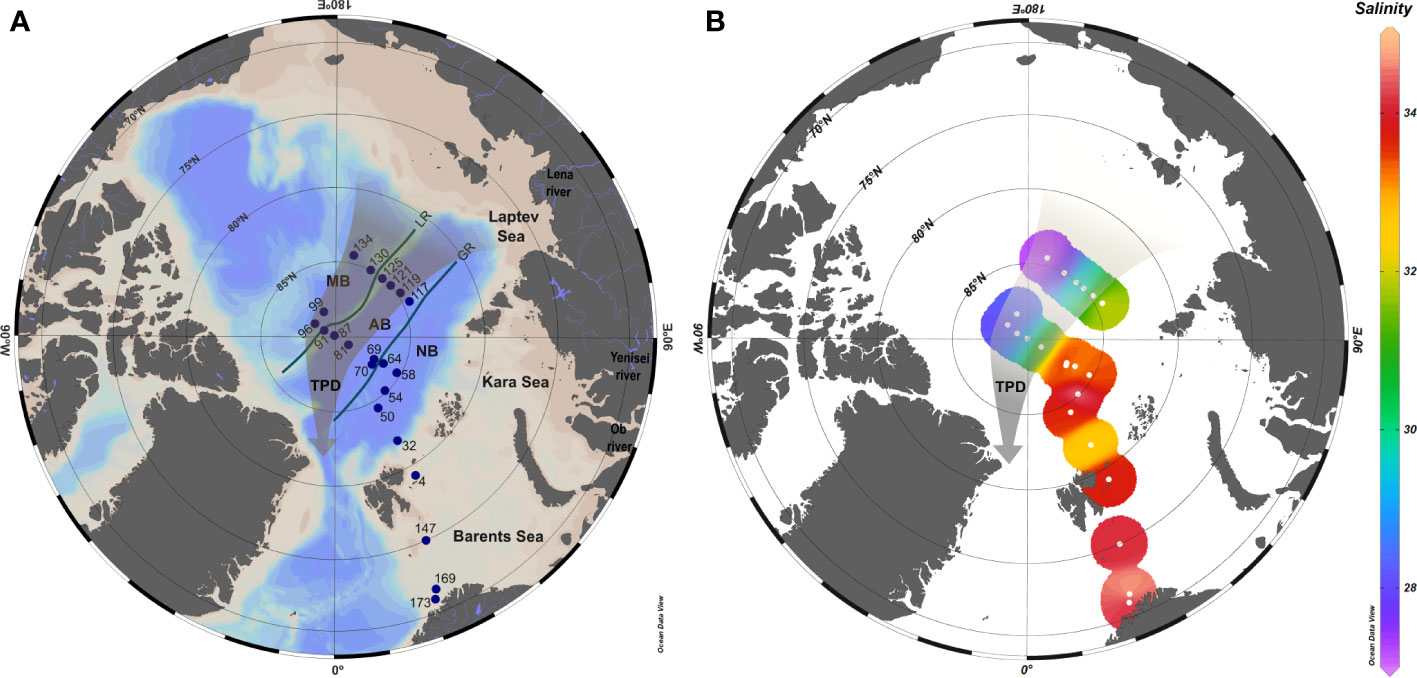
Figure 1 (A) Map of the study area with the station positions (blue dots). The central Arctic basins crossed during the cruise were indicated as: Nansen Basin (NB), Amundsen Basin (AB) and Makarov Basin (MB). The Gakkel Ridge (GR) divides the NB from the AB while the Lomonosov Ridge (LR) divides the AB form the MB, both of them depicted with solid lines. (B) Surface salinity distribution. The brownish arrow indicates the approximate location of the Transpolar Drift (TPD).
Data of conductivity, temperature and depth, measured with a SEABIRD 911 CTD, can be found in PANGAEA for both UCCTD (Ober et al., 2016) and CTD data (Rabe et al., 2016). A standard rosette sampling system (CTD), equipped with a fluorometer for chlorophyll-a fluorescence, was also deployed at the same stations than the UCCTD.
Unfiltered seawater for macronutrient analysis was sampled from the UCCTD. The analysis of nitrate, phosphate and silicate was performed onboard with a Technicon TRAACS 800 continuous flow auto analyzer as described by (Slagter et al., 2017; Rijkenberg et al., 2018). Data were reported by van Ooijen et al. (2016).
The concentration of dCu was measured with a high-resolution inductively coupled plasma-mass spectrometry (HR-ICPMS element 2, Thermo Finnigan) after pre-concentration (seaFAST) and matrix removal. The analytical error in the determination of dCu range from 0.004 to 0.02 nM (Gerringa et al., 2021a). More information about dissolved trace metal analysis and results can be found in Gerringa et al. (2021a), as well as, in the PANGAEA database (Gerringa et al., 2021b).
The LCu concentration and log KcondCu2+L values were determined by competitive ligand exchange-adsorptive cathodic stripping voltammetry (CLE-AdCSV) using salicylaldoxime (SA) as competing ligand (Campos and van den Berg, 1994). The 0.01 M SA was prepared in 0.1 M suprapure HCl. The buffer, 1 M boric acid (H3BO3) prepared in 0.3 M ammonia (NH3) and adjusted at pH 8.2, was cleaned with an overnight equilibration with 100 μM manganese dioxide (MnO2, Sigma-Aldrich) and then filtered by 0.2 μm filter (van den Berg, 1982). Copper stock solutions (Fluka) were made in 0.1% suprapure HCl. To ensure the chemical properties, the reagents were prepared weakly and kept in the fridge (at 8°C and in darkness) when they were not in use.
For titration procedure, 10 mL seawater aliquots were pipetted into 11 PTFE vials (22 mL volume), and 100 µL of buffer (final concentration 10-2 M) was added before discrete Cu(II) additions (0, 0.1, 0.3, 0.6, 0.9, 1.4, 2.3, 4, 6 and 8 nM of Cu). After 1 hour of equilibration, 10 µL of SA (final concentration 10 µM) was added. A minimum of 8 hours of equilibration was allowed before analysis. Few samples were analysed with higher Cu addition, up to 20 nM, but no differences were found in the Cu-binding ligand determination. Titrations were measured with a Hanging Mercury Drop Electrode (VA663 stand Metrohm), a Ag/AgCl reference electrode with a KCl salt bridge (3 M) and a glassy carbon counter electrode. Briefly, a 120s nitrogen purge was employed to remove oxygen interference, a deposition potential of – 0.2 V was applied for 60 s. After 10 s of equilibration, a differential pulse scan was applied from – 0.2 to – 0.5 V, with a step potential 4 mV, modulation amplitude 49.95 mV, interval time 0.1 s and modulation time of 0.04 s. Data fitting was performed with PromCC software (Omanović et al., 2015) using the “complete fitting” for one ligand class and the sensitivity was determined by internal calibration from the last titration points (4 or 5) which presented linearity. This method assumed that in the linear portion of the titration curve, all ligands were titrated within the detection window (D) of the method (Equation 1). To confirm complete titration of all ligands in certain samples, two Cu additions were made at the final titration point (with either 4 or 8 nM of Cu) and promptly measured. It is important to note that these supplemental additions were excluded from data analysis. One ligand class model was fitted the experimental values.
The side reaction coefficient for the Cu and SA complexes (αCuSA) establishes the centre of D (Equation 1), and it depends on the concentration of SA and the salinity of the sample (Campos and van den Berg, 1994). For each sample the αCuSA and its conditional stability constants were estimated as follows:
In this study, the value of log αCuSA ranged from 5.10 to 5.16, which represents the centre of D. The window extended one to two orders of magnitude above and below the centre (Apte et al., 1988), and included values between 3.10 and 7.16. The side reaction coefficient for inorganic metal (αCu’) also varies with the salinity (range between 26 and 30). It was calculated considering the major seawater ions (Xi) concentrations and stability constants (βcondCuXi) and the acidity Cu constant (βcondCu(OH)i) at seawater ionic strength (Campos and van den Berg, 1994), as expressed below:
For data treatment with PromCC, αCu´, log KcondCuSA and log βcondCu(SA)2 values were considered for each sample due to the high variability of salinity between depths and stations.
Using the concentration of dCu and the PromCC results (Cu2+, LCu, and the log KcondCu2+L) different parameters were estimated, such as the concentrations of labile Cu (Cu’= Cu2+ · αCu´, sum of all inorganic species), labile ligand (Cu’L = dCu – Cu’) and excess ligand (eLCu = LCu – Cu’L, concentration of ligand not bound to Cu). The reactivity between LCu and dCu (fCu2+L) is calculated by the product between LCu and KcondCu2+L (Gledhill and Gerringa, 2017; Arnone et al., 2022). For an accurate detection of ligands, this reactivity needs to be within the D range. The analytical error reported for LCu and log KcondCu2+L, based on seawater voltammetry test, were 0.092 nM and 0.054, respectively.
Significant differences between physical properties (temperature and salinity), macronutrient concentrations (nitrate, phosphate and silicate), dCu concentrations and Cu-binding ligands parameters (concentrations of LCu, eLCu, Cu’ and Cu2+, as well as log KcondCu2+L and log fCu2+L) were determined. A Kruskal-Wallis test (Kruskal and Wallis, 1952) coupled with a Conover test (Conover and Iman, 1979) was applied to investigate differences between groups (basins, water masses), considering p-values< 0.05 as significant. This test was chosen due to the non-normal distribution and heteroscedasticity properties observed in Cu-speciation data.
The Cu-binding ligand distribution in the Arctic Ocean must be understood in the context of the hydrographic conditions. Therefore, the content and characteristics of LCu were discussed for each water mass and basin. Arctic Ocean hydrography was described elsewhere (Bluhm et al., 2015; Rudels, 2019), and summarized in other works from PS94 cruise (Slagter et al., 2017; Rijkenberg et al., 2018; Gerringa et al., 2021a). Seven different water masses were identified (Figure 2 caption) according to Rudels (2019): Polar Surface Water (PSW), Atlantic Water (AW), Arctic Atlantic Water (AAW), Arctic Atlantic Water (dAAW), Arctic Intermediate Water (AIW), Canadian Basin Deep Water (CBDW) and Eurasian Basin Deep Water (EBDW). The PSW in the central Arctic Ocean is strongly influenced by the TPD, whose boundary was defined based on in-situ Chromophoric Dissolved Organic Matter (CDOM) fluorescence characteristics. Following the definition of the TPD made by Slagter et al. (2017) for the same cruise, surface waters (<55 or 77 m) from St. 81 to 99 and from St. 119 to 134 were inside the TPD (in-situ CDOM fluorescence>0.5 a.u.), both downstream and upstream, respectively. On the other side, waters up to 200 m depth from St. 58 to 99 and from St. 117 to 134 (in-situ CDOM fluorescence<0.5 a.u.) were outside the TPD.

Figure 2 Distribution of (A) potential temperature (θ, in °C) and (B) copper-binding ligands concentration (LCu) in the Arctic Ocean, including all stations. The temperature transect contains isolines for θ at 0°C and 2°C (white solid line), potential density anomaly (σθ, 0 dbar) 27.97 (black solid line), and potential density anomaly (σ0.5, 500 dbar) 30.444 (black dashed line). Seven water masses were defined following Rudels (2019): Polar Surface Water (PSW, θ<0°C, σ0<27.97 kg m-3), Atlantic Water (AW), Arctic Atlantic Water (AAW, 0<θ≤2°C, 27.7<σ0<29.97 kg m-3), Arctic Atlantic Water (dAAW, θ>0°C, σ0>29.97 kg m-3, σ0.5<30.444 kg m-3), Arctic Intermediate Water (AIW, θ<0°C, σ0>29.97 kg m-3, σ0.5<30.444 kg m-3),Canadian Basin Deep Water (CBDW, σ0.5>30.444 kg m-3, σ1.5<30.142 kg m-3) and Eurasian Basin Deep Water (EBDW, σ1.5>30.142 kg m-3).
Surface waters in the central Arctic were covered by sea-ice. Different ice arrangements were observed in terms of thickness and age (Supplementary Figure 1, König-Langlo, 2015). Close-pack ice conditions were observed between St. 32 and 134 with different stage development. First-year ice with a thickness of less than 70 cm was observed at St. 32 and with thicknesses between 70 and 120 cm between St. 50 and 58 and at St. 117 and 134. From St. 64 to 96 medium and thick ice was observed, corresponding with a first-year with some old ice (>2m thick). Station 99 presented medium first-year ice.
Along the cruise track, the temperature (Supplementary Figure 2) varied between -1.81 and 8.94°C. Its profile changed between basins; temperatures higher than 2.78°C, corresponding to AW, were restricted to the Barents Sea and increased further toward the south. The profiles in Nansen, Amundsen and Makarov Basins were similar, the surface minimum was followed by increasing temperatures until ~250 m depth after which the temperature decreased from 250 m to 1500 m. Finally, temperatures below 1500 m were constant (mean temperature: -0.65 ± 0.13°C). The maximum temperature in the Nansen Basin at ~250 m (AW temperature 2.78°C) was higher than in the Amundsen and Makarov Basins (AAW temperature 1.21°C and 1.11°C, respectively). The salinity also exhibited surface minima Figure 1B; Supplementary Figure 2) increasing until ~ 250 m, after which it remained constant (34.92 ± 0.04). The surface salinity decreases from the Barents Sea (33.75) via the Nansen and Amundsen Basins to the Makarov Basin (27.18).
The macronutrient (phosphate, nitrate and silicate) distribution was described elsewhere (Slagter et al., 2017; Rijkenberg et al., 2018) and briefly summarized here. Macronutrients presented typical nutrient profiles (Supplementary Figure 2), with a rapid increase in concentrations from 0 to 200 m depth, followed by a comparatively gradual increase from 200 to 2000 m. Below 2000 m depth, concentrations remained relatively constant. Phosphate concentrations ranged from 0.08 to 1.04 μM, silicate varied between 0.3 and 1.04 μM, while nitrate ranged from 0.04 to 15.06 μM. The basins showed a similar distribution and concentration range without significant differences, except for the first 200 m depth in the Amundsen and Makarov basins, where concentrations (between 6 and 13.58 μM) were higher than in the other basins.
The vertical profiles of LCu and dCu (Figures 2B, 3) presented similar patterns with higher variability at surface waters (≤200 m) and more constant concentrations below 200 m (deep waters), with some subsurface maximums. The LCu concentrations varied between 1.40 and 7.91 nM (Table 1) in the first 200 m depth and between 1.45 and 2.78 nM in deeper waters (Figure 2B). The concentration of dCu ranged from 1.20 to 7.34 nM in surface waters and from 1.34 to 1.93 nM in deeper waters (Supplementary Figure 3A, Gerringa et al. (2021a). The LCu concentrations always exceed the dCu with more the 99.52% of dCu complexed (Figure 3). Only strong or L1 ligands were detected using the classification of Bruland et al. (2000) and Buck and Bruland (2005), where L1 class present log KcondCu2+L >13 (Supplementary Figure 4). In the surface waters log KcondCu2+L variability was higher (13.83 – 16.01) than those in deeper waters (14.02 – 15.46). The detection window applied strongly influences the LCu and log KcondCu2+L detected. The detection window employed in the current investigation was the same one used in other oceanic publications, where both weak and strong ligands were detected (Laglera and van den Berg, 2003; Bundy et al., 2013; Abualhaija et al., 2015; Whitby and van den Berg, 2015; Whitby et al., 2018; Hollister et al., 2021; Wiwit et al., 2021). The presence of Cu-binding ligands keeps the free cupric ion (Cu2+) concentrations between 0.0008 and 0.42 pM, that is below the toxic levels (10 pM, Sunda and Lewis, 1978; Brand et al., 1986). The reactivity of the ligands, represented by log fCu2+L, varied between 5.31 and 7.25 at the surface and between 5.39 and 6.75 in deeper waters.
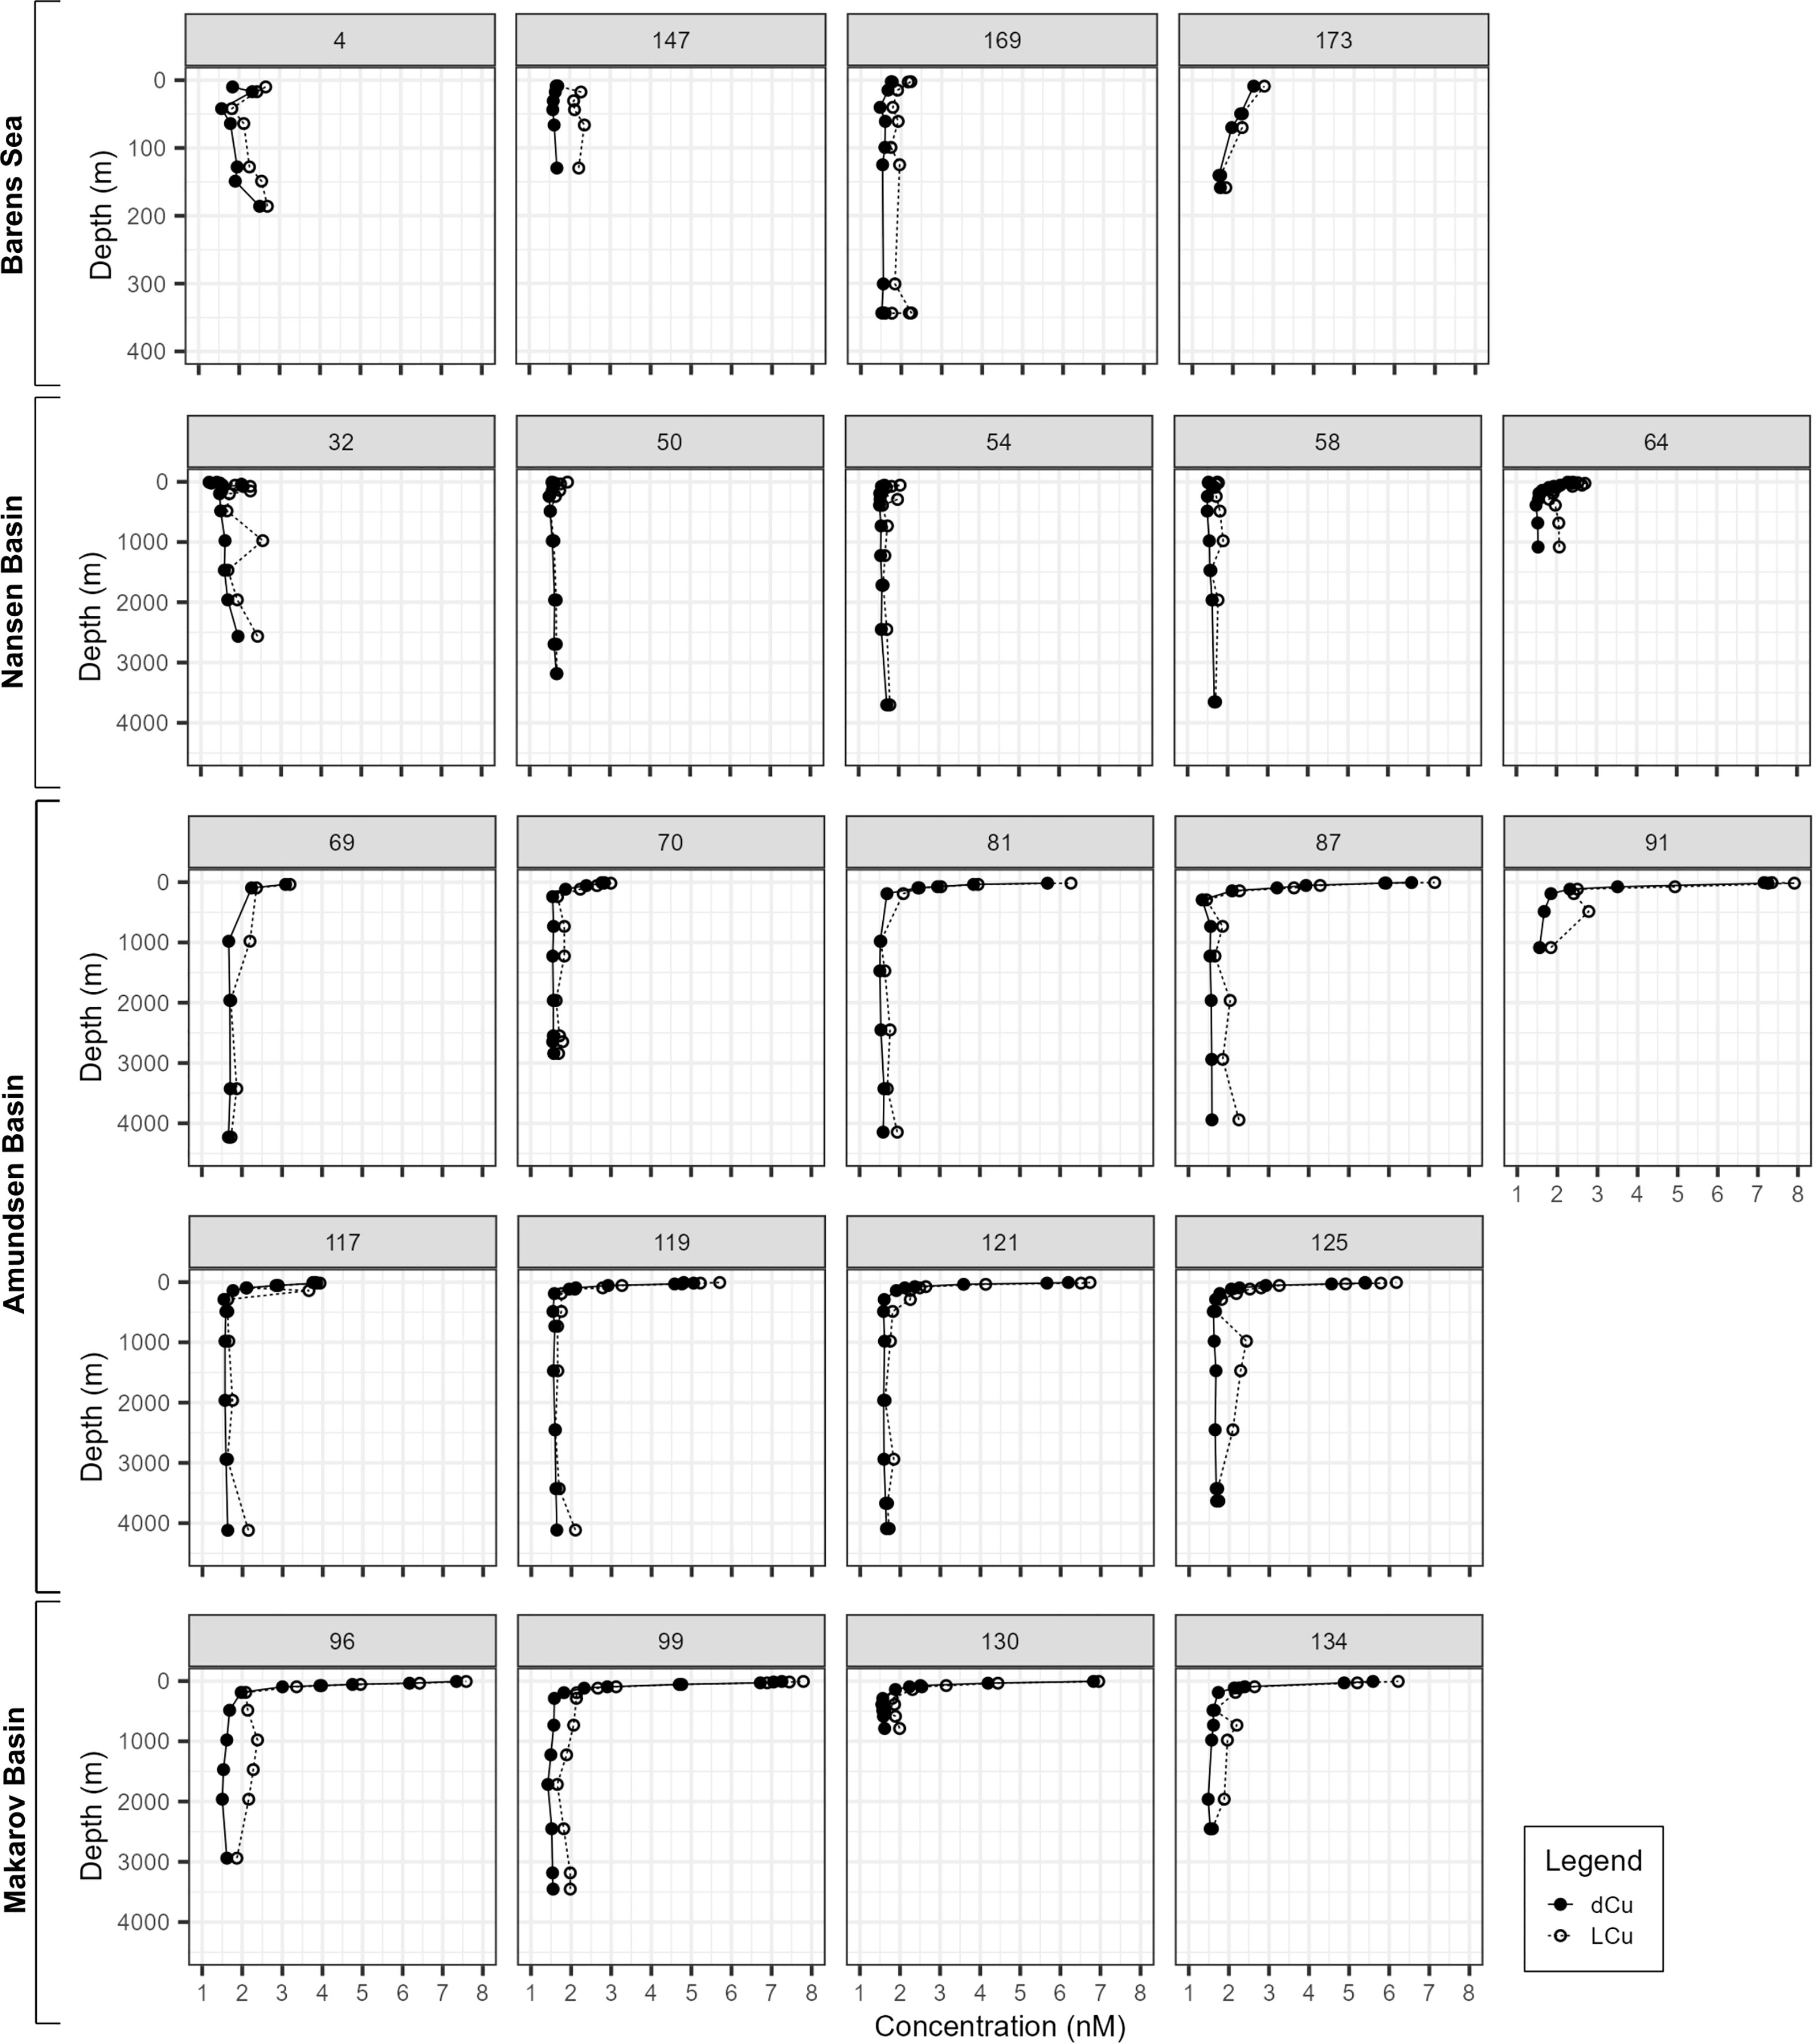
Figure 3 Depth profile of dissolved Cu (dCu, black circles with solid lines) and Cu-binding ligand concentrations (LCu, open circles with dashed lines) depicted per station and grouped by seas and basins. Both parameters represented in nM units. Barents Sea profiles represented with a different vertical scale. Dissolved Cu data were reported by Gerringa et al. (2021b).
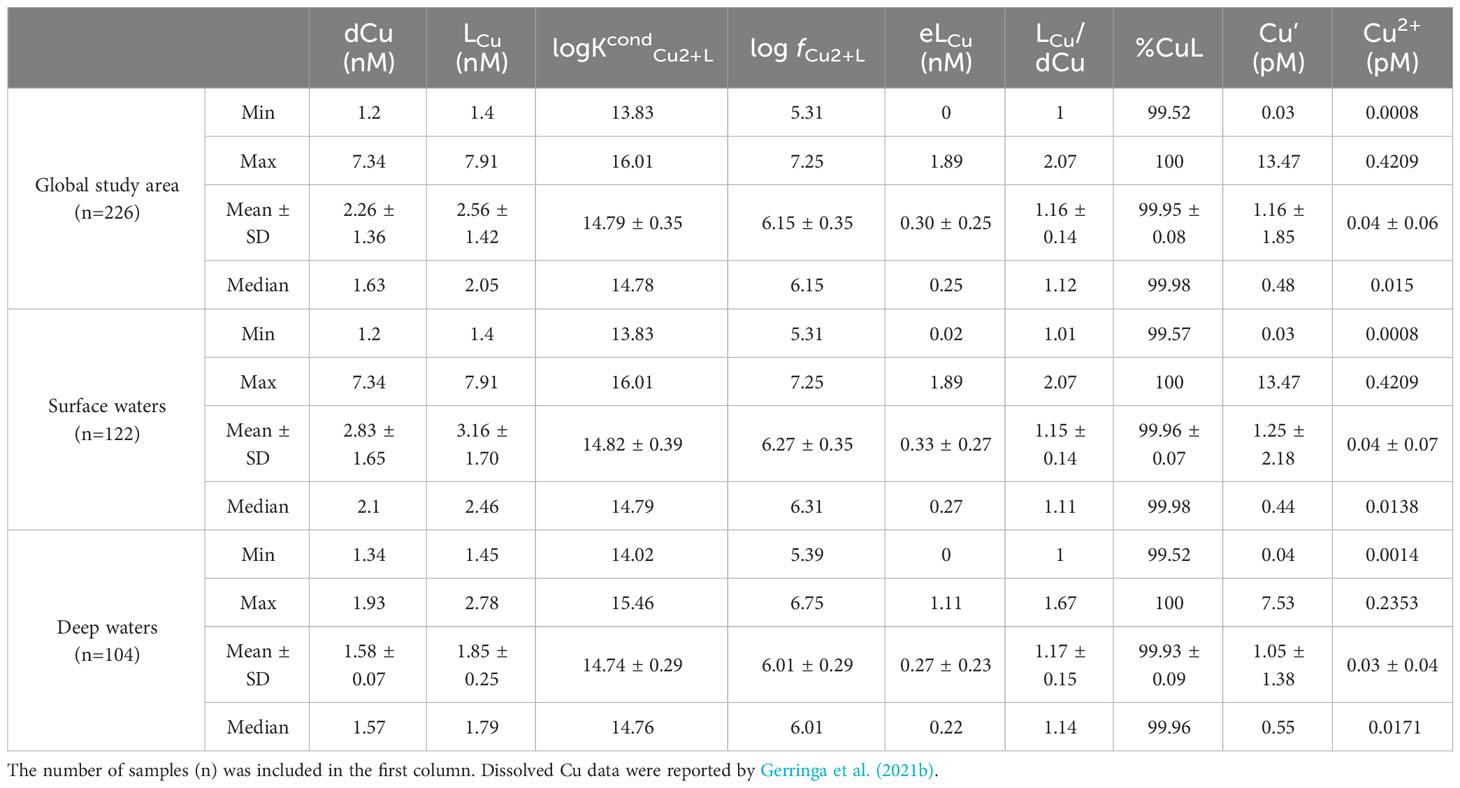
Table 1 Summary of range (minimum and maximum), mean and standard deviation (SD) and median of Cu speciation parameters considering the full depth profile (“Global study area”), surface waters (≤ 200 m) and deep waters (> 200 m).
To understand the potential impact of regional variabilities, such as hydrography and water properties (physical, chemical, and biological), on Cu speciation, we evaluate the variation in LCu across different basins, both in the presence of the TPD and within water masses (both surface and deep waters).
Surface waters of the Arctic Ocean presented the higher LCu variability (Figure 4 and Table 2) with concentrations increasing from the Barents Sea and Nansen Basin (mean LCu 2.15 ± 0.31 nM and 1.93 ± 0.35 nM, respectively) toward the Amundsen and Makarov Basins (mean LCu 3.84 ± 1.69 nM and 4.40 ± 2.03 nM, respectively). Barents Sea stations were located above a shallow shelf (bottom depth range: 152 – 358 m) and did not show significant vertical LCu variations. The Nansen Basin exhibited uniform LCu concentrations (range: 1.71 – 2.23 nM), except for St 64 which showed relatively high surface concentrations (maximum 2.71 nM).. The Amundsen and Makarov Basins showed the widest LCu concentration range (1.75 – 7.91 nM and 2.09 – 7.79 nM, respectively), with more than 7 nM observed at stations 87, 91, 96 and 99. In surface waters, the log KcondCu2+L ranged from 13.83 to 16.01 but values higher than 15.44 were only observed along the Barents Sea (range: 13.96 – 1601). The other basins showed a log KcondCu2+L range from 13.83 to 15.44. The statistical analysis of LCu concentrations between basins revealed that differences between the Barents Sea and the Nansen Basin, as well as between Amundsen and Makarov Basins, were not statistically significant (p-value>0.05, Table 3A). However, significant differences (p-value<0.05, Table 3A) were observed when comparing LCu concentrations from Barents Sea to Amundsen and Makarov Basins, as well as when comparing LCu concentrations from the Nansen Basin to Amundsen and Makarov Basins.
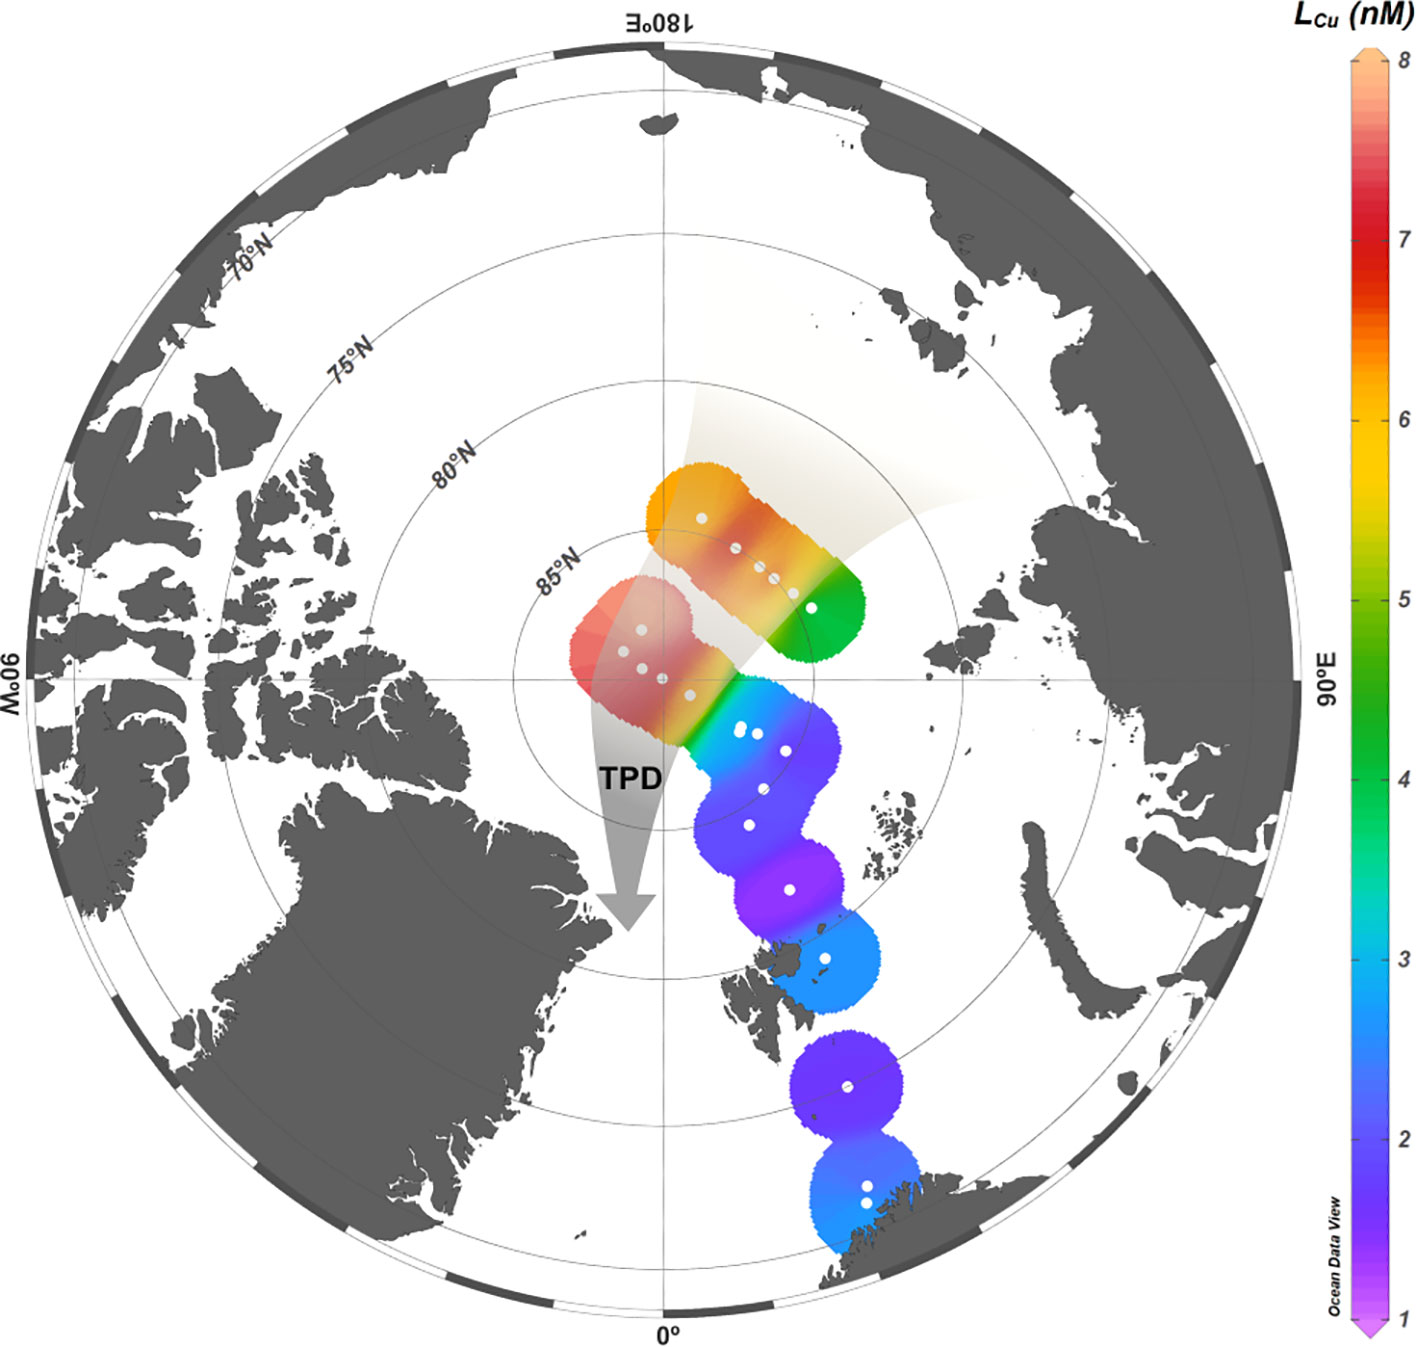
Figure 4 Surface distribution of copper binding ligands (LCu) concentrations (nM) in the first 10 m depth. The TPD path depicted with the brownish arrow.
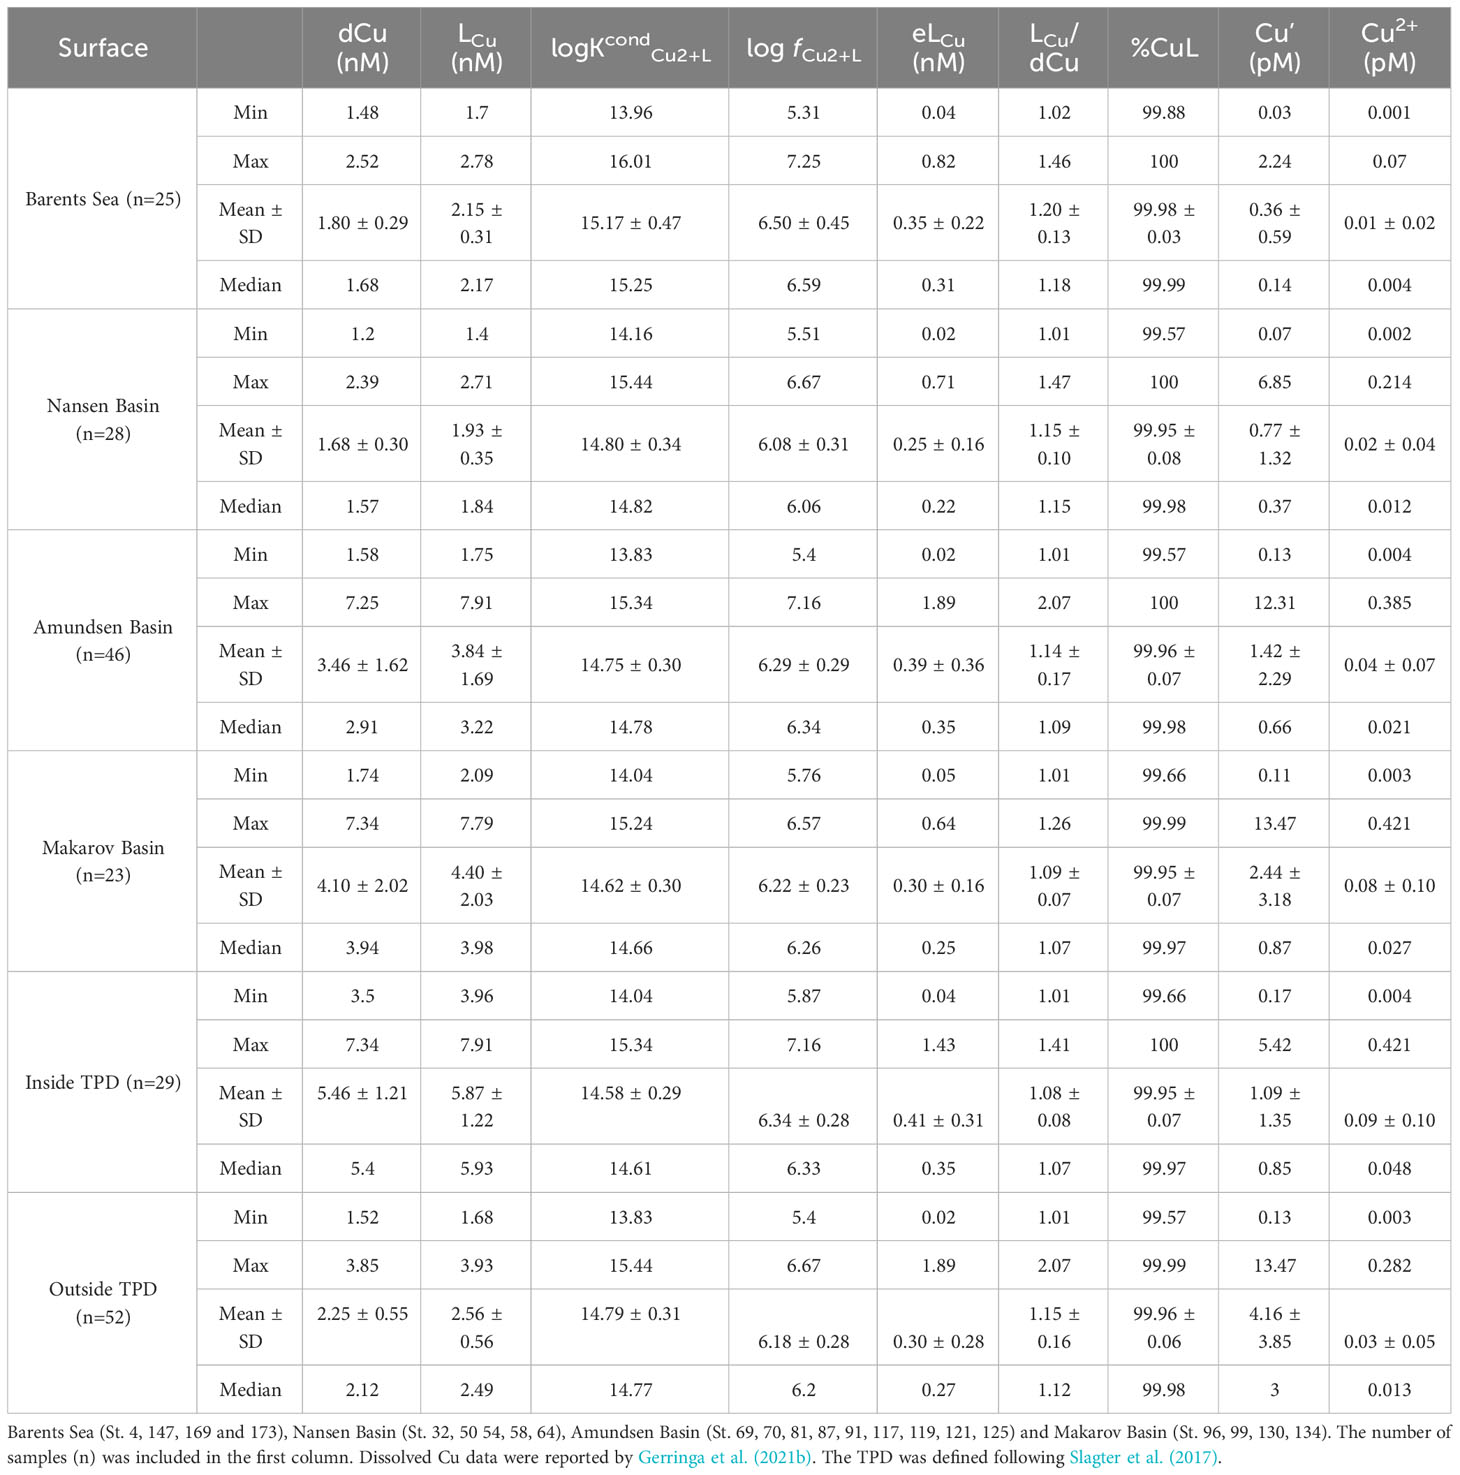
Table 2 Summary of range (minimum and maximum), mean and standard deviation (SD) and median of Cu speciation parameters for surface samples (≤ 200 m) of different basins.
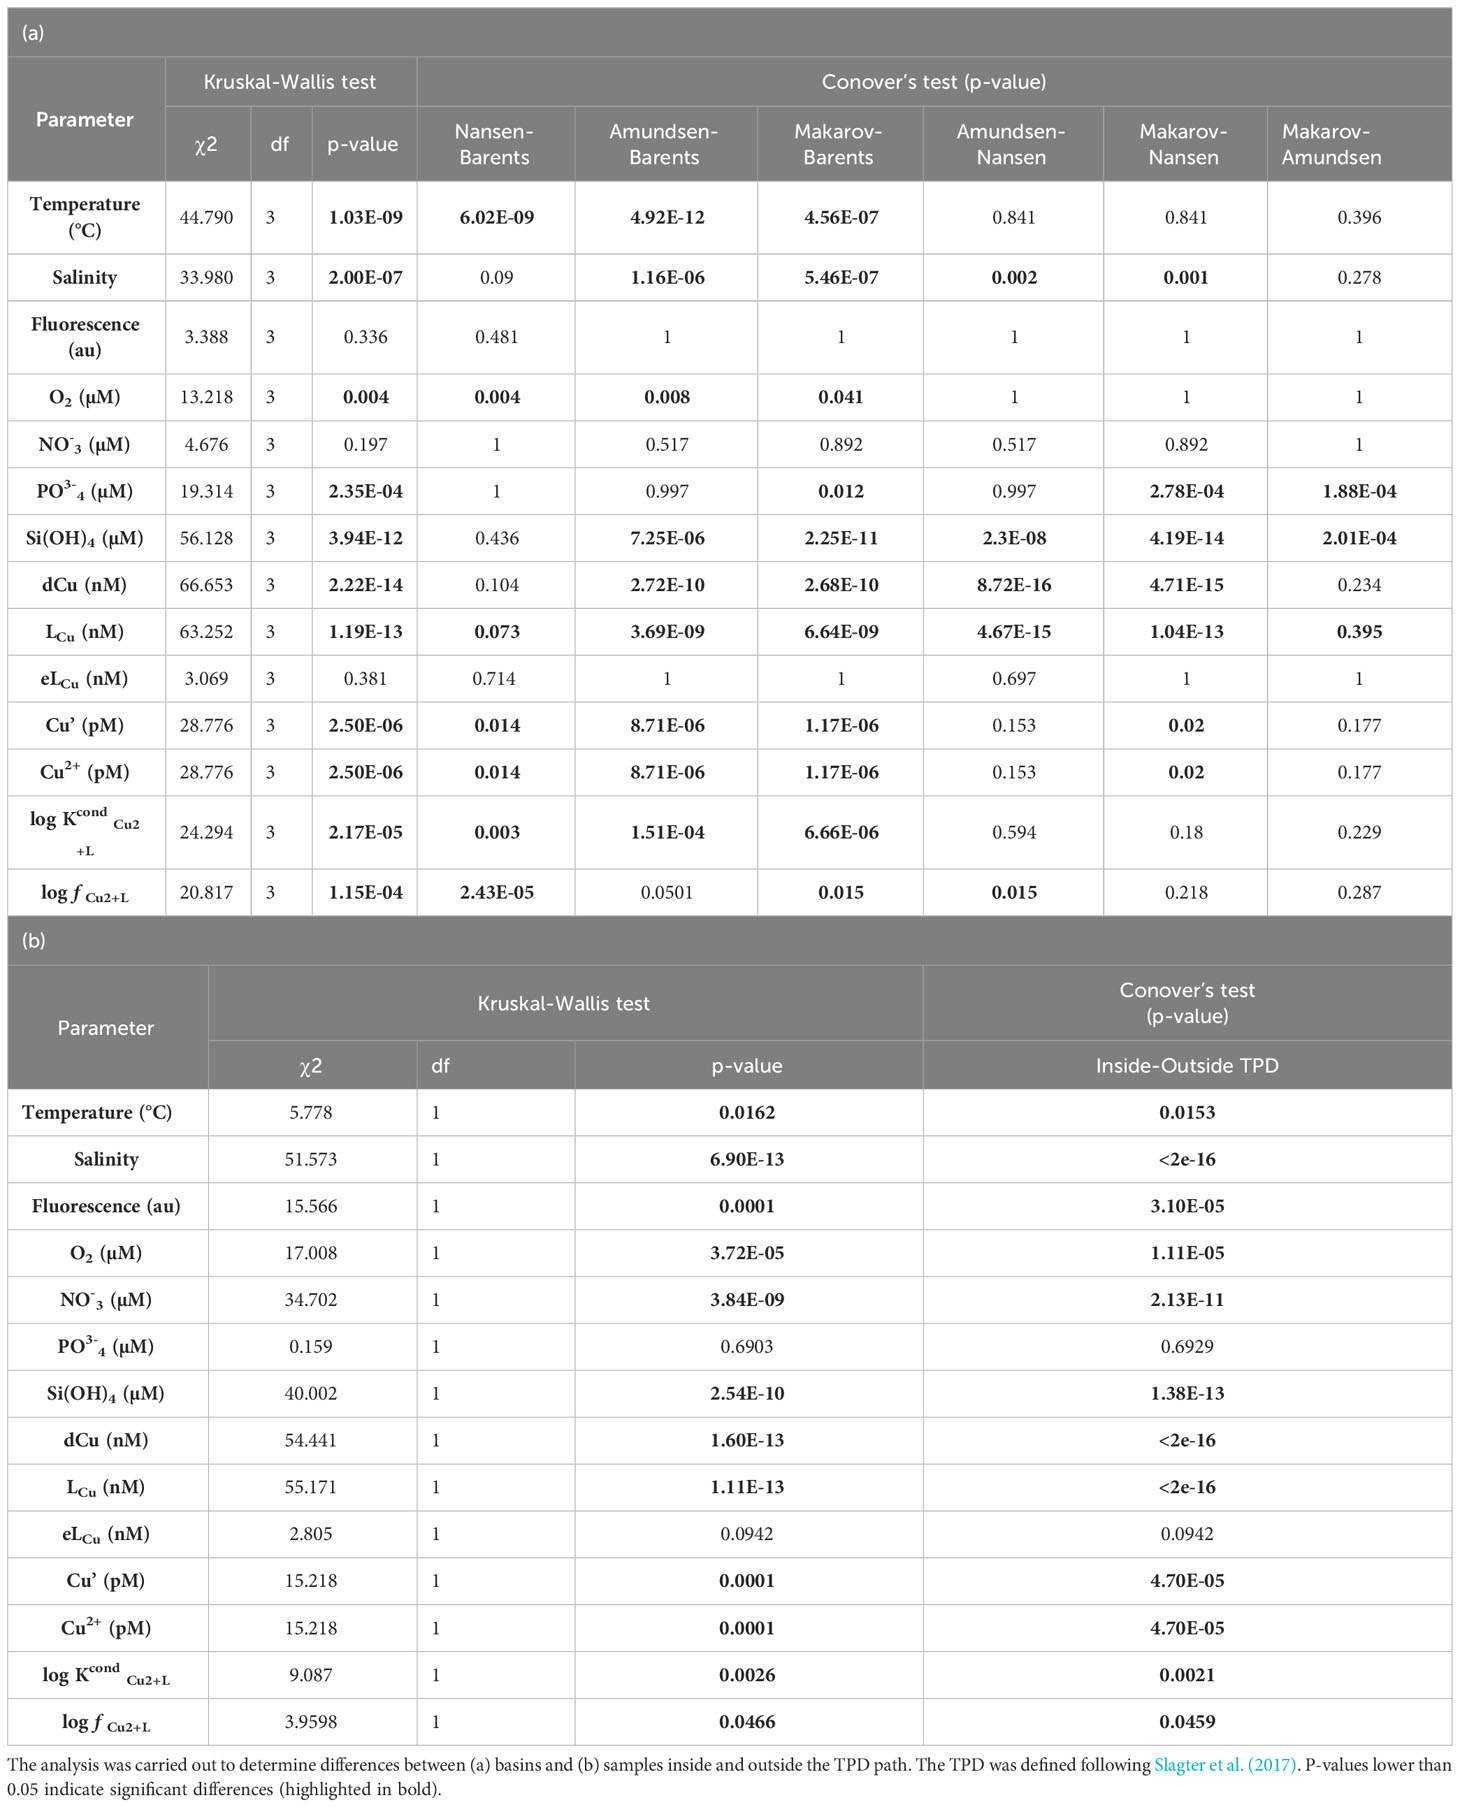
Table 3 Statistical analysis. Significant differences in surface waters (≤ 200 m) were determined with a Kruskal-Wallis analysis and a Conover test.
According to the definition of Rudels (2019), three water masses (Figure 2) were identified in the surface waters of the Arctic Ocean that are interesting to understand the LCu distribution. The PSW and AAW were observed along the whole cruise track, while the AW was restricted to the Barents Sea and Nansen Basin. The highest concentrations of LCu (Table 1; Supplementary Figure 5) were measured in PSW (range: 1.40 – 7.91 nM, mean: 3.60 ± 1.85 nM) and the lowest in AW (range: 1.70 – 2.78 nM, mean: 2.09 ± 0.31 nM). However, log KcondCu2+L and log fCu2+L values were higher in AW (15.21± 0.45 and 6.53± 0.44, respectively) than in PSW (14.74 ± 0.32 and 6.24 ± 0.29). This produced a higher concentration range of Cu2+ in PSW (0.002 – 0.421 pM) than in AW (0.001 – 0.056 pM, Supplementary Table 1). The LCu concentrations in AAW (range: 1.58 – 3.65 nM, mean: 2.22 ± 0.47 nM), stability constants (14.79 ± 0.40) and log fCu2+L values (6.13 ± 0.37 nM) were intermediate between those of the PSW and AW. Inside the PSW, lower LCu concentrations were observed in the Nansen Basin (LCu=1.94 ± 0.38 nM) and higher in the Amundsen Basin (LCu= 4.02 ± 1.69 nM) and the Makarov Basin (LCu= 4.74± 1.96 nM).
Based on in-situ CDOM fluorescence characteristics, the pathway of TPD can be differentiated in the PSW (Slagter et al., 2017). It is unclear whether station 134 is inside or outside the TPD (Slagter et al., 2017; Gerringa et al., 2021a). However, since the observed LCu and dCu concentrations are similar to the stations certainly affected by the TPD, station 134 has been included within the TPD pathway. Significant LCu differences (p-value<0.05, Table 3B) were observed among waters inside and outside the TPD. The LCu concentrations (Table 2) inside the TPD (mean: 5.87 ± 1.22 nM) were higher than outside (mean: 2.56 ± 0.56 nM). The same significant difference was observed for dCu inside (mean: 5.46 ± 1.21 nM) and outside the path (mean: 2.25 ± 0.55 nM). The concentrations of dCu y LCu showed a linear relationship in surface waters inside and outside the TPD, together with surface coastal samples from stations 4 and 173 (Figure 5A). The differences in log KcondCu2+L and Cu2+ concentrations inside and outside the TPD were small but significant (Tables 2, 3B). Other parameters, such as log fCu2+L (range: 5.40 – 7.16) and the eLCu concentrations (range: 0.02 – 1.89 nM) did not show significant variations between inside and outside the TPD. The correlation between LCu and eLCu observed in surface waters inside and outside the TPD, including coastal samples, did not follow the linear relationship observed in deep and Barents Sea waters (both shallow and deep, Figure 5B). No differences were observed inside the TPD between upstream and downstream stations (Supplementary Figure 6).
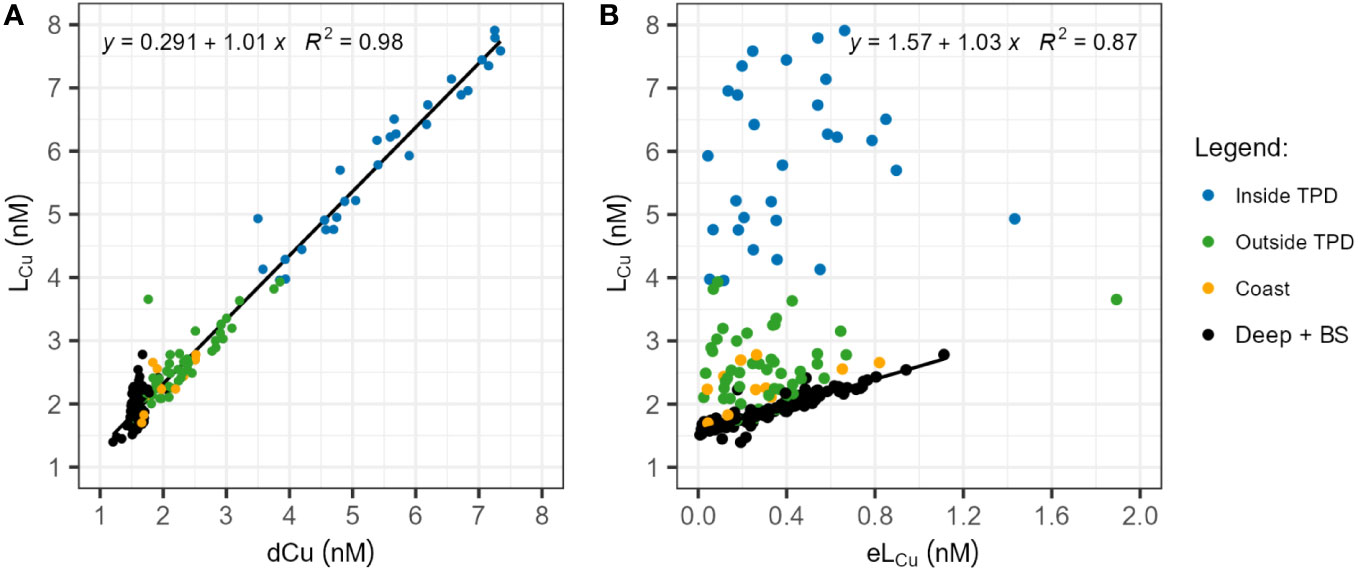
Figure 5 (A) Correlation between dissolved Cu (dCu) and Cu-binding ligands (LCu) concentrations in nM. The solid line indicates a linear relationship observed in surface waters, encompassing coastal, inside and outside TPD samples. (B) Correlation between LCu and the excess ligand (eLCu = LCu - Cu’L) concentrations in nM. The solid line depicts the linear relationship observed in deep and Barents Sea waters, both surface and deep, excluding St. 4 and 173. Data from all basins and seas were included in each figure and both relationships were significant (p-value< 2.2e-16). Different sample groups are color-coded, considering depth, basins, and influences from the TPD and coastal areas. Blue dots represent surface water samples taken inside the TPD from St. 81 to 99 and St. 119 to 134. Green dots denote samples taken outside the TPD (≤200 meters depth) from St. 58 to 99 and St. 117 to 134, including water below the TPD pathway. Yellow bots indicate coastal samples (≤200 meters depth) from St. 4 and 173. Black dots encapsulate deep waters (>200 meters depth) from all basins and Barents Sea samples, excluding St. 4 and 173.
Surface waters LCu concentrations in Amundsen and Makarov Basins presented significant (p-value<0.05) linear negative relationships with salinity and nitrate concentrations (Figure 6). A positive relationship was observed with silicate concentrations. A correlation was also observed between LCu concentrations, the absorbance parameters of Chromophoric and Fluorescence Dissolved Organic Matter (CDOM and FDOM, respectively) in surface waters (Figure 7). For that, the absorbance at 254 nm and 300 nm was collected from data reported by Slagter et al. (2017) and available in PANGAEA (Gerringa et al., 2021b). In surface waters, no linear relationships were observed between LCu and other parameters such as phosphates, temperature or fluorescence (data not shown).
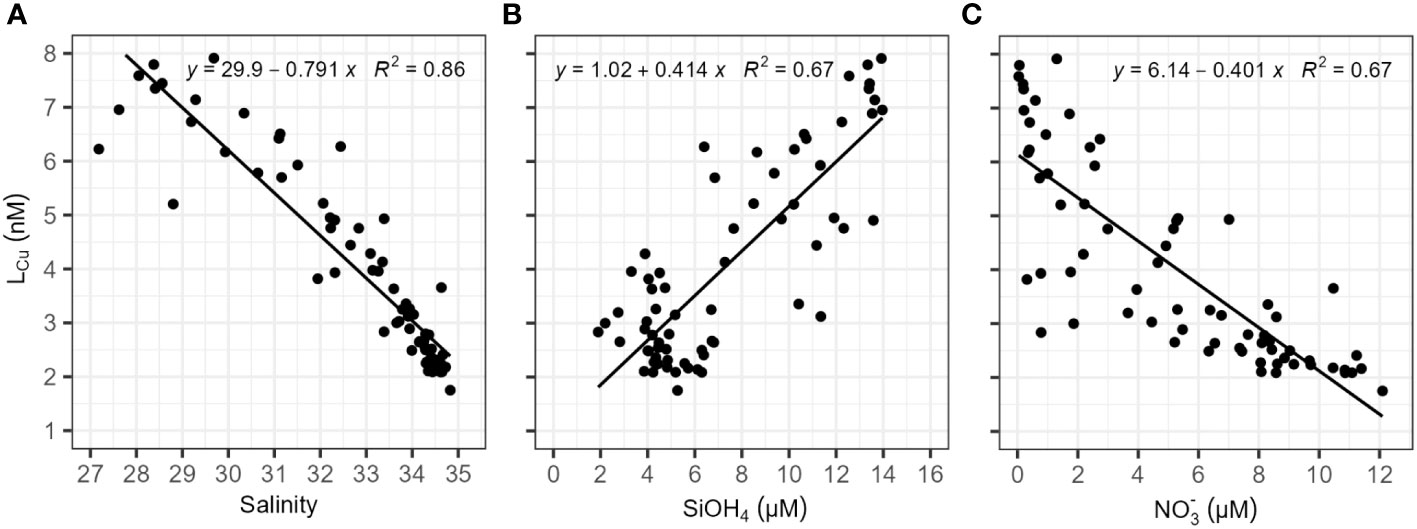
Figure 6 copper-binding ligand (LCu) concentration (nM) against (A) salinity, (B) silicate (SiOH4, in μM) and (C) nitrate (NO3-, in μM) for surface samples (≤200 m) located in the Amundsen and Makarov Basins. Waters inside and outside the TPD were included. The chart area includes the linear fitting applied for each couple of parameters, the relationships established were significant (p-value< 2.2e-16). Silicate and nitrate concentration data were reported by van Ooijen et al. (2016).
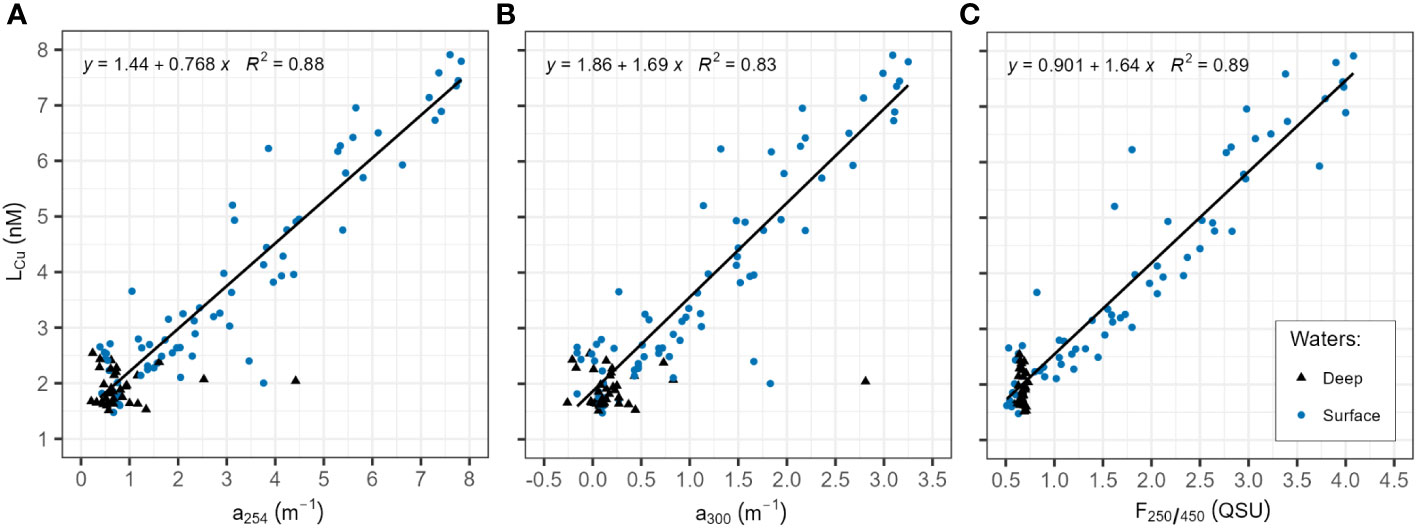
Figure 7 Correlation between dissolved copper-binding ligands (LCu) concentration (nM) and different Chromophoric Dissolved Organic Matter (CDOM) absorbances, at 1 nm resolution with a Spectramax M2 multimode spectrophotometer (Molecular Devices), equipped with a 1 cm path length quartz cell (SUPRASIL®, Hellma Analytics). Data and methodology description can be found in Slagter et al. (2017). The LCu concentrations were depicted against (A) the absorption measured at 254 nm (a254, in m-1); (B) the absorption measured at 300 nm (a300, in m-1); and (C) the fluorescent fraction of DOM (FDOM), measured at 450 nm under excitation in 250 nm (F250/450, expressed in Quinine Sulphate Units QSU).
Copper complexation showed less variability in deeper waters that in surface ones. No significant differences were detected in deep waters between water masses or basins, and no significant relationships existed between LCu and temperature, salinity or macronutrient concentrations. In deep waters (Table 1; Supplementary Figure 5), the concentrations of LCu varied between 1.45 and 2.78 nM (mean: 1.85 ± 0.25 nM) similar to the variability of dCu (range: 1.34 - 1.93 nM, mean: 1.58 ± 0.07 nM). However, the relationship between LCu and dCu in deep water is not linear (Figure 5). The LCu concentration only showed a linear relationship with eLCu concentration (Figure 5), this correlation was not observed in surface waters. The mean value of log KcondCu2+L was 14.74 ± 0.29 while log fCu2+L was 6.01 ± 0.29. The concentrations of Cu2+ varied between 0.001 and 0.24 pM.
In deep waters, LCu concentrations generally decrease with depth, with some exceptions. Stations 32, 91, 96 and 125 exhibited relatively higher concentrations between 500 and 1000 m depth compared to the rest of deep waters (Figures 2, 3).
A linear regression model (R2 = 0.94, p-value<2.2e-16) was developed to estimate how the LCu concentrations vary with other parameters. Different combinations of variables were evaluated (temperature, salinity, oxygen, fluorescence, nitrate, silicate and phosphate) considering all basins and depths. The models presented only good correlations in PSW (equation 5) in surface waters inside and outside the TPD path (from station 58 to 134). Therefore, Barents Sea and part of Nansen Basin stations were excluded from model development and the proposed model is contributing to the estimation of Cu-binding ligands in the areas with the presence of PSW. The model was tested with different parameter combinations (Supplementary Tables 2, 3), where the Equation 5 was obtained as the best fitting according to the Bayesian Information Criterion (Sakamoto et al., 1986). Then, LCu concentration can be estimated by:
where the silicate (SiOH4) and nitrate (NO-3) were in μM. Accordingly, this equation estimate the concentration of LCu in the PSW of the central Arctic Ocean. The predicted and measured LCu concentrations were represented in Figure 8.
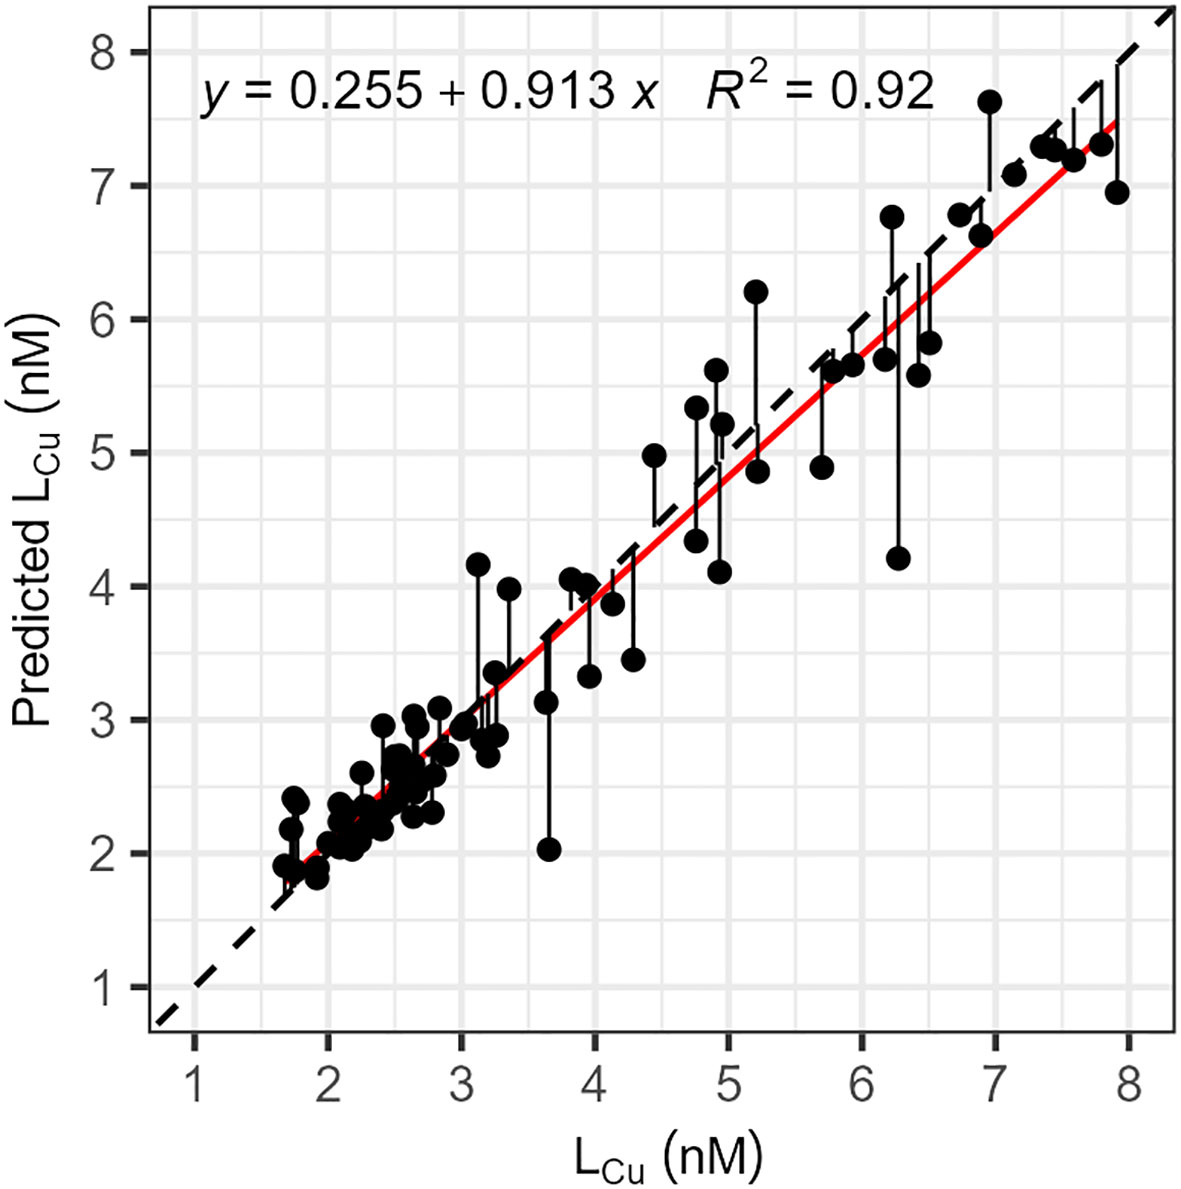
Figure 8 Relationship between the concentrations, in nM, of copper-binding ligands (LCu) measured in seawater and predicted (Predicted LCu) with equation 5. Predicted concentrations were calculated considering temperature, silicate and nitrate concentrations measured during the cruise. The black dashed line represents the 1:1 relationship between the two parameters and deviations from the perfect fitting were indicated by solid black line. The linear relation between the two parameters was indicated by the red solid line (R2 = 0.94, p-value< 2.2e-16).
To provide an idea of how, on the basis of the model, LCu would be distributed in the Central Arctic, macronutrient and salinity surface data (≤ 200 m) from four cruises between 1995 and 2015 (PANGAEA database) were considered, including the study at hand (Wisotzki and Bakker, 2008; Kattner, 2011; Bakker, 2014). To ensure consistency among the samples collected during various oceanographic cruises, i.e. to confirm that the variables used were affected by the same processes, the dispersion of salinity with that of temperature and nutrients was checked (Supplementary Figure 7). Furthermore, water masses different than the PSW were identified and removed. The data were collected under ice-coverage conditions and were used to calculate LCu concentrations. The predicted surface concentration of LCu ranged between 1.12 and 7.76 nM. High predicted concentrations (between 6 and 7 nM) resulted in all cruises that covered the shelf area, while in the central Arctic LCu up to 7 nM were observed only in 2015.
During the PS94 cruise, the distribution of LCu in the Amundsen and Makarov Basins was found to differ significantly between surface and deep waters. This study found that the TPD was a substantial source of LCu for the central Arctic surface waters (Tables 1, 2). Overall, the surface LCu concentrations were higher than the average concentration for open ocean surface waters (~1 nM, Ruacho et al., 2022).
In the Barents Sea and Nansen Basin, the surface LCu concentrations (0.8 – 5 nM) were within the range observed in the surface North Atlantic waters (2 – 2.5 μM of SA, Jacquot and Moffett, 2015; Gourain, 2020). The Barents Sea presented relatively low salinities and temperatures (Supplementary Figure 2), which indicate a freshwater input from precipitation, coastal runoff, and sea-ice melt (Rudels, 2012). This input of freshwater may increased the AW LCu concentrations and, at the same time, act as a source of trace metals, such as dCu, dCo, dMn and dNi (Gerringa et al., 2021a). The input of LCu trough coastal freshwater explains the relatively higher content of LCu observed at Stations 4 and 173 (Figures 3, 4). The shelf sediments also act as a source of trace metals, while the primary production and the scavenging are the main removal mechanisms (Gerringa et al., 2021a), which may also impact the LCu concentrations. Strong similarities were observed with the AW of the eastern Fram Strait (mean LCu=1.99 ± 0.34 nM, Arnone et al., 2023). Both regions could have a similar contribution of freshwater from the Svalbard coasts that modify the surface water characteristics. In terms of conditional stability constants, strong Cu-binding ligands were measured (log KcondCu2+L >13), or L1 class (Bruland et al., 2000; Buck and Bruland, 2005). The Barents Sea log KcondCu2+L (mean: 15.17 ± 0.47) was more similar to the eastern Fram Strait (mean log KcondCu2+L=15.60 ± 0.26, Arnone et al., 2023) than the North Atlantic Ocean (range log KcondCu2+L=12 – 14.5, Jacquot and Moffett, 2015; Gourain, 2020). The similarities between the Barents Sea and the eastern Fram Strait indicate a common source of ligands, possibly originating from the shelf or phytoplankton exudates. Furthermore, the applied detection window was the same in both regions, facilitating comparison and contributing to the observed similarities.
In the Nansen Basin, LCu concentrations were similar to those of the Barents Sea and the relatively lower log KcondCu2+L was possibly resulted from the influence of PSW. The maximum surface LCu concentrations observed in the PSW of Amundsen and Makarov Basins (6 – 7 nM) were higher than the maximum surface concentration (<5 nM) reported for strong ligands in the North Atlantic and North Pacific Oceans (Jacquot and Moffett, 2015; Whitby et al., 2018; Gourain, 2020; Wong et al., 2021). However, a similar surface maximum was reported for PSW in coastal and shelf Greenland waters (LCu = 7 – 8 nM, Arnone et al., 2023). High surface LCu concentrations (up to 33 nM) exist in estuarine environments where greater concentrations, were observed in fresher waters (Laglera and van den Berg, 2003; Muller and Batchelli, 2013). The surface waters log KcondCu2+L detected in the Amundsen and Makarov Basins (range: 13.83 – 15.34) were higher than in the North Atlantic Ocean (range: 12 – 14.5, Jacquot and Moffett, 2015; Gourain, 2020) and generally lower than in the Centre and Northeast Pacific (range: 15 and 16.5, Whitby et al., 2018; Wong et al., 2021). More similar values were reported for the PSW in the coastal and shelf Greenland (range: 14.45 and 15.72, Arnone et al., 2023).
In the Makarov Basin, Pacific waters were reported as a source of dCu that comes from the Bering shelf sediments (Jensen et al., 2022). Furthermore, Pacific waters also act as a minor source of marine CDOM to the Arctic Ocean (Guéguen et al., 2007; Anderson and Amon, 2015). Then, the maximum concentrations of LCu and dCu reported in the Makarov Basin can be due to a contribution from Pacific waters. The input of DOM through Pacific water was reported in the Canadian Arctic Archipelago and Baffing Bay. In this area, a maximum surface concentration of LCu around 4 nM was observed and was associated with a coastal and a biological source (Nixon et al., 2019). However, the class of these ligands is unknown as the technique applied by Nixon et al. (2019) is chromatographic and does not report the binding strengths.
The maximum concentration of concentration of Cu2+ (up to 0.42 pM) was observed in surface water, which was higher than those observed in Fram Strait and Greenland shelf (0.003 – 12.45 fM, Arnone et al., 2023) and comparable to the reported in the North Atlantic Ocean (0.02 – 0.74 pM, Gourain, 2020). These maximum concentrations remained below the toxicity limit established for cyanobacteria, coccolithophores, and diatoms (10 pM, Sunda and Lewis, 1978; Brand et al., 1986). Concentrations of Cu2+ below 0.016 pM may not support the growth and reproduction rates of phytoplankton (Annett et al., 2008). However, complexed Cu can also be assimilated (Semeniuk et al., 2015). The phytoplankton growth limitation of Cu2+ can become more significant in regions with Fe-limitation, such as the Nansen Basin (Rijkenberg et al., 2018), due to the higher Cu-demand of phytoplankton (Annett et al., 2008). The biological utilization of free and complexed Cu can also explain why the maximum concentrations in AW were lower than in PSW, as the phytoplankton growth in the Atlantic Ocean was higher than in the Arctic ice-covered zone (Vernet et al., 2019).
The LCu distribution is related to the TPD flow path, whose core was above the Amundsen and Makarov Basins (Slagter et al., 2017). The TPD played a crucial role in the lateral transport of riverine and shelf-derived material within the Arctic Ocean and influenced water chemistry (Figures 4, 5). In surface waters, the concentrations of LCu inside the TPD (mean: 5.87 ± 1.22 nM) were higher than that outside the TPD (mean: 2.56 ± 0.56 nM), and these, in turn, was higher than the ones recorded in deep waters (mean: 1.85 ± 0.25 nM). This indicates that the TPD transports high concentrations of LCu to the central Arctic, particularly in the first 55 – 80 m depth. However, there is a vertical extension of the TPD effect that impacts up to 200 m depth (Figure 5A). The TPD also transport high concentrations of trace metals (dCu, dFe, dNi, dCo, dZn and dMn), silicate, phosphate, CDOM and Fe-binding ligands (Charette et al. (2020); Slagter et al., 2017; Rijkenberg et al., 2018; Gerringa et al., 2021a). The absence of LCu differences between samples upstream and downstream of the TPD could be related to the high stability and the limited removal and modification processes. The sea-ice coverage, the relatively low biological activity and the low temperatures may contribute to the longer stability of the LCu ligands which facilitate their export towards the Fram Strait and Nordic Seas.
The salinity and nutrient content of the water masses (Figure 6) were used to clarify possible sources of LCu. As mentioned, the TPD water come from the Siberian Shelves and may receive LCu from rivers, coastal processes and ice-melting. The riverine source of LCu in the PSW and the TPD is confirmed by the significant negative relationship with salinity. This relationship indicates a conservative mixing behaviour, which was generally observed in estuarine environment (Laglera and van den Berg, 2003; Shank et al., 2004; Hollister et al., 2021). Siberian rivers introduce large amounts of silicates into the shelf waters, which explains the positive relationship established between LCu and silicate concentrations. However, the waters of the Siberian Shelf are characterized by low nitrate concentrations due to high biological activity and lower nitrate input from rivers during summer (Kattner et al., 1999). The contribution of Siberian rivers to the water chemistry in the central Arctic was found to vary between stations and depths (Paffrath et al., 2021), potentially accounting for the observed differences in metal and ligands concentrations. At stations 81, 96, 117, and 125 a significant influence from the Lena River was observed within the first 30 meters of depth, followed by the detection of influences from the Yenisei and/or Ob Rivers below this depth (Paffrath et al., 2021). The highest surface LCu (>6 nM) and dCu (>5.6 nM) concentrations observed in the Amundsen and Makarov Basins can be related to the Lena River influence. Compared to other polar environments, the LCu concentrations inside the TPD (3.96 – 7.91 nM) were higher than the values obtained on the Antarctic Peninsula (25 μM SA, Bundy et al., 2013). There, strong ligands showed maximum concentrations generally below 5 nM, except for ice (~16 nM) and algal sea ice (~26 nM) measurements.
The TPD also influence the Cu2+, the concentration range inside was higher than outside the TPD (Table 2). The saturation state of LCu can explain this difference, inside the TPD the concentration of LCu was higher that outside but these were more saturated, which favours the higher concentration of Cu2+.
Surface waters in the Central Arctic, with high levels of complexed Cu, can be transported to southern regions by TPD. Previous studies have demonstrated that the TPD transports trace metals (Chen et al., 2022; Krisch et al., 2022), terrigenous DOM (Benner et al., 2005), and Fe-binding ligands (Ardiningsih et al., 2020; Ardiningsih et al., 2021) to the Fram Strait and the Nordic Seas. The export of LCu and dCu to the Nordic Seas may explain the high LCu concentrations measured in surface waters over the Greenland shelf (Arnone et al., 2023). The export is favored by high LCu concentrations and ligand strength, and this process may be crucial in the southern areas of Greenland and the Irminger Basin where iron limitation exists (Hopwood et al., 2018). This is because certain organisms, such as diatoms, have higher Cu requirements in Fe-limited conditions (Maldonado et al., 2006). Then the LCu export could support the phytoplankton growth.
Deep waters in the Amundsen and Makarov Basins seem isolated from the surface; LCu and dCu transport into the deep waters appears to be absent. This is confirmed by the significant differences between surface and deep dCu and LCu concentrations, and log f values and can be explained by the strong water stratification and deep scavenging. Similar behavior was observed in the Si cycle and was associated with a limited export of particles from surface waters (Liguori et al., 2020).
The LCu concentrations and properties in deep waters did not differ significantly in deep waters results from the hydrographic characteristics, including oceanic ridges and extensive continental shelves, which limit deep water renewal. In the central Arctic Ocean the exchange of deep water only occurs through the Fram Strait (Tomczak and Godfrey, 2001). For this reason, deep waters in the Eurasian and Canadian Basin present very long residence times (250 – 450 years, Schlosser et al., 1997), which significantly influence the properties of seawater. Prolonged residence times extend scavenging durations, which potentially decrease the concentrations of LCu and dCu in deep waters. Furthermore, deep waters presented lower complexation, binding strength, and reactivity than surface waters, which favour scavenging and removal of dCu. At the same time, inputs from bottom sediments were limited. This may explain why deep waters did not present an increase in LCu and dCu concentrations with depth, as observed in other oceans (Ruacho et al., 2022). Scavenging could remove more dCu than LCu, as observed in the loss of linearity between the two parameters observed in the deep water (Figure 5B). Low concentrations of dFe, dMn, and Fe-binding ligands were observed in deep Arctic waters associated with long exposure to scavenging processes, together with limited deep sources The effect of prolonged deep scavenging in the central Arctic Ocean was described for dFe, Fe-binding ligands, and dMn (Middag et al., 2011; Thuróczy et al., 2011; Klunder et al., 2012; Slagter et al., 2017; Rijkenberg et al., 2018; Gerringa et al., 2021a).
The deep water LCu concentrations (range: 1.45 – 2.78 nM, mean: 1.85 ± 0.25 nM) were lower than the concentrations of up to 7 nM observed in other oceans deep waters (Ruacho et al., 2022). A good agreement was observed with the LCu reported in deep waters of the eastern Fram Strait (1.6 – 3.4 nM, Arnone et al., 2023) and the concentration range for the deep North Atlantic Ocean (Jacquot and Moffett, 2015). These authors measured concentrations of LCu in the deep Atlantic waters between 1 and 3 nM, with a local bottom maximum (~5 nM) associated with hydrothermal or bottom sediment sources. In the North Atlantic between 40°N and 60°N, the LCu concentrations mostly fall below 4 nM with a maximum of around 8 nM associated with bottom sources (Gourain, 2020). Along the Mid-Atlantic ridge concentrations below 5 nM were observed without hydrothermal sources (Gourain, 2020). The local deep maximum (around 1000 m) observed along the cruise track (Stations 32, 91, 96 and 125) can be related to sediment resuspension from the continental slope or ridges. These maxima were not related to hydrothermal activity, which was observed at greater depths (3000 m) along the Gakkel Ridge (Rijkenberg et al., 2018). The concentration of strong LCu in deep subarctic Pacific waters was relatively low (3 nM, Coale and Bruland, 1990; Whitby et al., 2018; Wong et al., 2021). However, the entrance of deep Pacific waters through the Bering Strait is not expected.
The voltammetric method does not allows the identification of metal-binding ligands chemical structures, in turn ligands are classified based on log KcondCu2+L values. Strong LCu (log KcondCu2+L > 13, Buck and Bruland, 2005) were detected throughout the study region and can be attributed to various compounds including humics, thiols, methanobactins and exopolysaccharides (Ruacho et al., 2022, and references therein).
The log KcondCu2+L values observed in the study area (range: 13.83 – 16.01, Table 1) were close to the range of terrestrial humic substances reported in estuaries (range: 14.9 – 15.9, Muller and Batchelli, 2013). Humics substances with riverine origin were detected in the central Arctic waters (Gao and Guéguen, 2018; Gamrani et al., 2023) and described as part of the Fe-binding ligands pool in the central Arctic and Fram Strait waters (Slagter et al., 2017; Rijkenberg et al., 2018; Laglera et al., 2019; Slagter et al., 2019; Ardiningsih et al., 2020). Since humics can complex both Fe and Cu (Abualhaija et al., 2015), it is reasonable to propose that a fraction of the LCu pool in the study area comprises humic substances, as suggested for Fram Strait and Greenland shelf waters (Arnone et al., 2023). The presence of humic-like substances in the study area was reflected in the different CDOM absorbances (absorbances at 254 and 300 nm), particularly in surface waters in the Makarov and Amundsen basins (Slagter et al., 2017). The positive relationship observed between LCu concentrations and absorbance parameters in surface waters (Figure 7) confirms the contribution of humic substances to the LCu pool. These organic compounds have a riverine origin (Stedmon et al., 2011), but can be also produced in situ as has been indicated for the case of Fe-binding ligands in the same region (Slagter et al., 2017) via microbial action, local DOM production, deposition by ice rafted sediments, etc. Thiols could also account for LCu, as they were identified in Arctic waters (Gao and Guéguen, 2018) and described as Cu-binding ligands in estuarine environments with log KcondCu2+L values between 12 and 15 (Laglera and van den Berg, 2003; Whitby et al., 2017).
In the study region, a contribution of LCu from the biological activity may also occur. In Arctic surface waters, diatoms dominate the phytoplankton community (Uhlig et al., 2019), which can release Cu-binding ligands (Davis and Benner, 2005; Nixon et al., 2019; Williford et al., 2022). Cultures experiments revealed that diatoms produce weak LCu (log KcondCu2+L = 8 – 12, Lorenzo et al., 2007, and references therein), and, in field measurements made in Arctic sea-ice, exopolymer substances (EPS) were identified as sea-ice diatoms LCu exudates (Krembs et al., 2002; Lin et al., 2020). EPS substances were suggested as Cu and Fe-binding ligands in the Greenland shelf (Ardiningsih et al., 2020; Arnone et al., 2023). However, these weak ligands were not observed along the cruise track. The algal sea-ice community can also release high concentrations (26.15 ± 3.88 nM) of strong LCu (log KcondCu2+L =15.15 ± 0.25), as observed in the Antarctic Peninsula (Bundy et al., 2013). Bacteria were also suggested as LCu producers, in particular methanotrophic bacteria can produce strong binding strengths (log KcondCu2+L>14), which can be present below the sea-ice inside the TPD where high methane concentrations were observed (Damm et al., 2018).
As TPD acts as the main source of LCu in the central Arctic Ocean, the composition of the ligands should presented riverine organic matter. Therefore, a large part of the LCu pool could be humic substances or thiols. During the transport from the Siberian shelves to the central Arctic processes the photodegradation and microbial degradation may transform LCu and decrease their log fCu2+L (Davis and Benner, 2005; Shank et al., 2006; Paulsen et al., 2019). The role of hydrography in LCu distributions can even be greater than that of biological and/or photochemical processes, as observed for CDOM (Anderson and Amon, 2015). A small contribution of LCu may come from Atlantic and Pacific waters. Cu-binding ligands in the North Atlantic Ocean were mainly related to biological production and hydrothermal inputs (Jacquot and Moffett, 2015; Gourain, 2020), while in the Pacific Ocean were associated with marine exudates, organic matter degradation and riverine inputs (Semeniuk et al., 2015; Whitby et al., 2018).
The parameters included in the linear model correlate the water properties with their origin and enable the description of LCu concentrations in surface waters influenced by the TPD. The waters transported by the TPD comes mainly from the Siberian shelves and are characterized by low salinity, high silicate and low nitrate concentrations due to the influence of riverine discharge and biological uptake (Kattner et al., 1999).
The predicted concentrations of LCu exhibited a strong correlation with the measured LCu values (Figure 8). Deviations from the 1:1 relationship indicate the influence of other processes affecting the distribution of LCu, which were not accounted for in equation 5. These processes include biological production and utilization, microbial degradation, ice sequestrations and release of organic matter, among others. While more complex models would provide a more accurate description of the study area, they could compromise overall generality and applicability, especially in the Arctic Ocean, where multiple sources significantly contribute to each basin or water mass. It must be noted that the model was developed with data collected under the ice coverage and affected by the TPD, resulting in certain consequences. At first, the presence of sea-ice can modify the salinity and influence the biological activity, impacting nitrate and silicate concentrations. Secondly, as in the TPD the majority of ligands come from coastal regions, making this model is not suitable for areas where in-situ ligand production is prevalent. Therefore, it is important to proceed carefully when applying the model in ice-free waters or with bloom conditions, as this could lead to errors in estimating ligand concentrations.
The predicted LCu concentrations (Figure 9) were consistent with the previous organic matter studies conducted in the central Arctic Ocean. The shelves contain high organic matter concentrations due to the influence of riverine inputs (Opsahl et al., 1999; Anderson and Amon, 2015), which can explain the high LCu concentrations (between 6 and 7 nM). While the high LCu concentrations in the central Arctic (up to 7 nM) were associated with the transport through the TPD (Gordienko and Laktionov, 1969). The variability in LCu concentrations between 1995 and 2015 can be attributed to natural alterations in water characteristics linked to years with varying river discharges and TPD velocities. Conversely, it may be due to amplified river discharges (Peterson et al., 2002; Schuur et al., 2013; Schuur et al., 2015; Feng et al., 2021) and TPD velocities (Krumpen et al., 2019) linked to climate change, resulting in higher ligand inputs that are then transported to the central Arctic Ocean by the TPD.

Figure 9 Surface distribution of LCu concentration in the Arctic Ocean estimated with equation 5 with data from PANGAEA. Data from three different cruises were compiled: (A) PS36 (Kattner, 2011), (B) PS70 (Wisotzki and Bakker, 2008), (C) PS80 (Bakker, 2014) and (D) PS94 (the current study). All of them were conducted between July and September onboard the RV Polarstern.
The proposed equation provides an estimate of the Cu-binding ligands present in surface water and could offers insight into their temporal evolution of ligands transported by the TPD, if the model is applied to historical data from the Central Arctic surface water. However, the equation require validation and different LCu concentrations measured in the TPD are necessary. Furthermore, this model could be improved by incorporating other seawater variables (such as pH) and biological activity (such as chlorophyll concentration), which require good data resolution and coverage. Finally, data and parameters associated with rivers, estuaries and continental shelves should be incorporated and validated to extrapolate the model to other Arctic areas.
The effect of climate change on the Arctic Ocean (IPCC, 2022) and the global trace metal biogeochemistry have been reported (Hoffmann et al., 2012). However, little is known about the effect on Cu speciation in the Arctic environment. In seawater, the pH and temperature affect trace metal speciation, altering the solubility, the adsorption onto particles and the reaction rates (Hoffmann et al., 2012). Changes in seawater pH, associated with higher CO2 concentrations, decrease the organic Cu complexation and favours the inorganic species, with an increase in Cu2+ (Millero et al., 2009; Gledhill et al., 2015). The results indicate that the toxicity limit established for different phytoplankton species was not reached (10 pM, Sunda and Lewis, 1978; Brand et al., 1986). However, according to the projected changes in pH and the assumed effect on Cu2+ availability (Stockdale et al., 2016; Fransner et al., 2022), in the Arctic waters more Cu2+ will be bioavailable and the toxicity limits are not expected to be exceeded as the concentration of LCu will also increase.
The temperature increase leads to permafrost thawing (Schuur et al., 2013; Schuur et al., 2015) and strengthening riverine discharge (Peterson et al., 2002; Feng et al., 2021). Higher inputs of riverine freshwater, trace metals, organic matter, and strong binding ligands will arrive at surface Arctic waters (Guieu et al., 1996; Frey and McClelland, 2009; Stedmon et al., 2011; Slagter et al., 2017; Laglera et al., 2019; Charette et al., 2020). Therefore, more dCu and LCu could be released. Simultaneously, sea-ice thickness and coverage will decrease due to increased temperature and AW contributions in the Arctic Ocean (Belter et al., 2021). As a result, at first, higher solar irradiance produces photo-oxidation processes (Bélanger et al., 2006) which could degrade ligands, decrease their complexing capacity and increase the Cu2+ concentrations (Shank et al., 2006). The effects of Cu bioavailability and assimilation can be the opposite. Increasing Cu2+ concentrations may either improve its acquisition or cause toxicity, while a reduction in complexing capacity could negatively impact organisms that obtain Cu from strong complexes (Semeniuk et al., 2015). Secondly, the enhanced light penetration could lead to longer growing seasons and a higher primary production (Arrigo et al., 2008), which can alter the amount of LCu and dCu in surface waters (due to assimilation or release). Changes in phytoplankton community composition could also alter the nature of the ligands excreted.
As reported by Krumpen et al. (2019) and the references therein, the ice dynamic in the Arctic has already changed. Less sea-ice is formed in the Siberian shelves, the ice coverage is getting thinner, the TPD speed increases, and more melting occurs in marginal areas and the central Arctic. At the same time, there is less export of ice to the Fram Strait and much of ice-rafted materials are lost during the transport, which could affect the transport dCu and LCu. The melting leads to an accumulation of material (e.g., sediments, organic matter and contaminants) in the central Arctic. Finally, decreased sea-ice thickness facilitates the proliferation of phytoplankton beneath, because sediment loading decreases and light availability increases, with potential impact on dCu and LCu.
Due to the presence of opposite mechanisms capable of increasing or decreasing Cu-binding ligands, a comprehensive exploration of the distribution and characteristics of these compounds in the Arctic Ocean becomes imperative to understand the impact of climate change on Cu-organic speciation. Moreover, as it remains unclear which of these mechanisms will dominate in the future, the magnitude of these processes must be meticulously evaluated in future modelling.
In the Arctic Ocean, the Cu-organic speciation is clearly influenced by the hydrography. A strong vertical and longitudinal variability of LCu and log KcondCu2+L was observed in surface waters (≤ 200 m), with maximum concentrations in the first few metres of depth and toward the central Arctic Ocean. Surface waters differ significantly from deep waters, and maximum LCu concentrations were constrained into the PSW. This water mass is transported from the Siberian shelves to the central Arctic by the TPD and receives large inputs of terrestrial riverine organic matter and trace metals. The TPD act as the main source of LCu in the Amundsen and Makarov Basins and determines its distribution in the Arctic Ocean.
In the Amundsen and Makarov Basins, deep Arctic waters appear to be isolated from the surface, as much lower concentrations were observed than at the surface. This phenomenon can be attributed to the pronounced stratification of surface waters, constraining vertical mixing, and the scavenging processes within deep waters.
Strong Cu-binding ligands, L1 class, were detected in the Arctic Ocean, mainly associated with terrestrial organic matter released from Siberian rivers. Terrestrial humic substances and thiols were suggested as the main component of the LCu pool detected; however, the nature of the ligands cannot be determined with voltammetric techniques. A small input of ligands by phytoplankton and bacterial production was also suggested inside and outside the TPD path. The high concentrations of these strong ligands maintain Cu2+ concentrations at pM levels, not exceeding toxicity levels but may produce a Cu deficit in organisms with higher requirements or under Fe-limiting conditions.
TPD plays a key role in organic Cu speciation in the Arctic Ocean. The presence of strong complexes facilitates the transport of Cu towards the Fram Strait and the North Atlantic Ocean, potentially supporting primary production in surface waters with limited bioavailable Cu. However, the effect of climate change on Cu speciation in the Arctic is complex. To understand future scenarios, more research is needed on the biogeochemical cycle of Cu in the region. This study presents the baseline for future Cu organic complexation studies in the Arctic Ocean.
The raw data supporting the conclusions of this article will be made available by the authors, without undue reservation.
VA: Formal Analysis, Investigation, Methodology, Writing – original draft. JC: Funding acquisition, Investigation, Project administration, Supervision, Writing – review & editing. MG: Funding acquisition, Investigation, Project administration, Writing – review & editing. HP: Funding acquisition, Writing – review & editing. GS: Funding acquisition, Writing – review & editing. LG: Investigation, Writing – review & editing. AG: Investigation, Supervision, Writing – review & editing.
The author(s) declare financial support was received for the research, authorship, and/or publication of this article. We also acknowledge the financial support for the ATOPFe project (CTM2017-83476-P) from the Ministerio de Ciencia e Innovación (Spain). VA participation was funded by the PhD grant (PRE 2018-084476). The analysis of samples was supported by ISblue project, Interdisciplinary graduate school for the blue planet (ANR-17-EURE-0015) and co-funded by a grant from the French government under the program “Investissements d’Avenir” embedded in France 2030. Our participation in this GEOTRACES expedition was funded by Netherlands Organization for Scientific Research (NOW) under contract number 822.01.018 to LG.
The authors would like to thank the captain Schwarze and the crew of the RV Polarstern on expedition PS94, the chief scientist Ursula Schauer and all other cruise participants.
The authors declare that the research was conducted in the absence of any commercial or financial relationships that could be construed as a potential conflict of interest.
All claims expressed in this article are solely those of the authors and do not necessarily represent those of their affiliated organizations, or those of the publisher, the editors and the reviewers. Any product that may be evaluated in this article, or claim that may be made by its manufacturer, is not guaranteed or endorsed by the publisher.
The Supplementary Material for this article can be found online at: https://www.frontiersin.org/articles/10.3389/fmars.2023.1306278/full#supplementary-material
Abualhaija M. M., Whitby H., van den Berg C. M. G. (2015). Competition between copper and iron for humic ligands in estuarine waters. Mar. Chem. 172, 46–56. doi: 10.1016/j.marchem.2015.03.010
Amon R. M. W. (2003). Dissolved organic carbon distribution and origin in the Nordic Seas: Exchanges with the Arctic Ocean and the North Atlantic. J. Geophys Res. 108, 3221. doi: 10.1029/2002JC001594
Anderson L. G., Amon R. M. W. (2015). “DOM in the Arctic Ocean,” in Biogeochemistry of Marine Dissolved Organic Matter (Second Edition), eds. Hansell D. A., Carlson C. A. (Boston: Elsevier), 609–633. doi: 10.1016/B978-0-12-405940-5.00014-5
Annett A. L., Lapi S., Ruth T. J., Maldonado M. T. (2008). The effects of Cu and Fe availability on the growth and Cu:C ratios of marine diatoms. Limnol Oceanogr 53, 2451–2461. doi: 10.4319/lo.2008.53.6.2451
Apte S. C., Gardner M. J., Ravenscroft J. E. (1988). An evaluation of voltammetric titration procedures for the determination of trace metal complexation in natural waters by use of computers simulation. Anal. Chim. Acta 212, 1–21. doi: 10.1016/S0003-2670(00)84124-0
Ardiningsih I., Krisch S., Lodeiro P., Reichart G. J., Achterberg E. P., Gledhill M., et al. (2020). Natural Fe-binding organic ligands in Fram Strait and over the northeast Greenland shelf. Mar. Chem. 224, 103815. doi: 10.1016/j.marchem.2020.103815
Ardiningsih I., Zhu K., Lodeiro P., Gledhill M., Reichart G.-J., Achterberg E. P., et al. (2021). Iron speciation in fram strait and over the northeast Greenland shelf: an inter-comparison study of voltammetric methods. Front. Mar. Sci. 7. doi: 10.3389/fmars.2020.609379
Arnone V., González-Santana D., González-Dávila M., González A. G., Santana-Casiano J. M. (2022). Iron and copper complexation in Macaronesian coastal waters. Mar. Chem. 240, 104087. doi: 10.1016/j.marchem.2022.104087
Arnone V., Santana-Casiano J. M., González-Dávila M., Sarthou G., Krisch S., Lodeiro P., et al. (2023). Distribution of copper-binding ligands in Fram Strait and influences from the Greenland Shelf (GEOTRACES GN05). Science of The Total Environment, 168162. doi: 10.1016/j.scitotenv.2023.168162
Arrigo K. R., van Dijken G., Pabi S. (2008). Impact of a shrinking Arctic ice cover on marine primary production. Geophys Res. Lett. 35, L19603. doi: 10.1029/2008GL035028
Bakker K. (2014). Nutrients measured on water bottle samples during POLARSTERN cruise ARK-XXVII/3 (IceArc) in 2012. doi: 10.1594/PANGAEA.834081
Bélanger S., Xie H., Krotkov N., Larouche P., Vincent W. F., Babin M. (2006). Photomineralization of terrigenous dissolved organic matter in Arctic coastal waters from 1979 to 2003: Interannual variability and implications of climate change. Global Biogeochem Cycles 20. doi: 10.1029/2006GB002708
Belter H. J., Krumpen T., von Albedyll L., Alekseeva T. A., Birnbaum G., Frolov S. V., et al. (2021). Interannual variability in Transpolar Drift summer sea ice thickness and potential impact of Atlantification. Cryosphere 15, 2575–2591. doi: 10.5194/tc-15-2575-2021
Benner R., Louchouarn P., Amon R. M. W. (2005). Terrigenous dissolved organic matter in the Arctic Ocean and its transport to surface and deep waters of the North Atlantic. Global Biogeochem Cycles 19. doi: 10.1029/2004GB002398
Bluhm B. A., Kosobokova K. N., Carmack E. C. (2015). A tale of two basins: An integrated physical and biological perspective of the deep Arctic Ocean. Prog. Oceanogr 139, 89–121. doi: 10.1016/j.pocean.2015.07.011
Brand L. E., Sunda W. G., Guillard R. R. L. (1986). Reduction of marine phytoplankton reproduction rates by copper and cadmium. J. Exp. Mar. Biol. Ecol. 96, 225–250. doi: 10.1016/0022-0981(86)90205-4
Bruland K. W., Rue E. L., Donat J. R., Skrabal S. A., and Moffett J. W. (2000). Intercomparison of voltammetric techniques to determine the chemical speciation of dissolved copper in a coastal seawater sample. Anal. Chim. Acta 405, 99–113. doi: 10.1016/S0003-2670(99)00675-3
Buck K. N., Bruland K. W. (2005). Copper speciation in San Francisco Bay: A novel approach using multiple analytical windows. Mar. Chem. 96, 185–198. doi: 10.1016/j.marchem.2005.01.001
Bundy R. M., Barbeau K. A., Buck K. N. (2013). Sources of strong copper-binding ligands in Antarctic Peninsula surface waters. Deep Sea Res. Part II: Topical Stud. Oceanography 90, 134–146. doi: 10.1016/j.dsr2.2012.07.023
Campos M. L. A. M., van den Berg C. M. G. (1994). Determination of copper complexation in sea water by cathodic stripping voltammetry and ligand competition with salicylaldoxime. Anal. Chim. Acta 284, 481–496. doi: 10.1016/0003-2670(94)85055-0
Cauwet G., Sidorov I. (1996). The biogeochemistry of Lena River: organic carbon and nutrients distribution. Mar. Chem. 53, 211–227. doi: 10.1016/0304-4203(95)00090-9
Charette M. A., Kipp L. E., Jensen L. T., Dabrowski J. S., Whitmore L. M., Fitzsimmons J. N., et al. (2020). The transpolar drift as a source of riverine and shelf-derived trace elements to the central arctic ocean. J. Geophys Res. Oceans 125, 1–34. doi: 10.1029/2019JC015920
Chen X., Krisch S., Al-Hashem A., Hopwood M. J., Rutgers van der Loeff M. M., Huhn O., et al. (2022). Dissolved, labile, and total particulate trace metal dynamics on the northeast Greenland shelf. Global Biogeochem Cycles 36. doi: 10.1029/2022GB007528
Coale K. H., Bruland K. W. (1990). Spatial and temporal variability in copper complexation in the North Pacific. Deep Sea Res. Part A. Oceanographic Res. Papers 37, 317–336. doi: 10.1016/0198-0149(90)90130-N
Colombo M., Brown K. A., De Vera J., Bergquist B. A., and Orians K. J. (2019). Trace metal geochemistry of remote rivers in the Canadian Arctic Archipelago. Chem. Geol 525, 479–491. doi: 10.1016/j.chemgeo.2019.08.006
Conover W. J., Iman R. L. (1979). On multiple-comparisons procedures. Los Alamos Sci. Lab. Tech. Rep. LA-7677-MS 1, 14. doi: 10.2172/6057803
Cutter G., Andersson P., Codispoti L., Croot P., Francois R., Lohan M., et al. (2014) Sampling and Sample-Handing Protocols for GEOTRACES cruises. Available at: http://www.geotraces.org/images/stories/documents/intercalibration/Cookbook_v2.pdf.
Damm E., Bauch D., Krumpen T., Rabe B., Korhonen M., Vinogradova E., et al. (2018). The Transpolar Drift conveys methane from the Siberian Shelf to the central Arctic Ocean. Sci. Rep. 8, 4515. doi: 10.1038/s41598-018-22801-z
Davis J., Benner R. (2005). Seasonal trends in the abundance, composition and bioavailability of particulate and dissolved organic matter in the Chukchi/Beaufort Seas and western Canada Basin. Deep Sea Res. Part II: Topical Stud. Oceanography 52, 3396–3410. doi: 10.1016/j.dsr2.2005.09.006
Dethleff D., Rachold V., Tintelnot M., Antonow M. (2000). Sea-ice transport of riverine particles from the Laptev Sea to Fram Strait based on clay mineral studies. Int. J. Earth Sci. 89, 496–502. doi: 10.1007/s005310000109
Feng D., Gleason C. J., Lin P., Yang X., Pan M., Ishitsuka Y. (2021). Recent changes to Arctic river discharge. Nat. Commun. 12, 6917. doi: 10.1038/s41467-021-27228-1
Fransner F., Fröb F., Tjiputra J., Goris N., Lauvset S. K., Skjelvan I., et al. (2022). Acidification of the nordic seas. Biogeosciences 19, 979–1012. doi: 10.5194/bg-19-979-2022
Frey K. E., McClelland J. W. (2009). Impacts of permafrost degradation on arctic river biogeochemistry. Hydrol Process 23, 169–182. doi: 10.1002/hyp.7196
Gamrani M., Eert J., Williams W. J., Guéguen C. (2023). A river of terrestrial dissolved organic matter in the upper waters of the central Arctic Ocean. Deep Sea Res. Part I: Oceanographic Res. Papers 196, 104016. doi: 10.1016/j.dsr.2023.104016
Gao Z., Guéguen C. (2018). Distribution of thiol, humic substances and colored dissolved organic matter during the 2015 Canadian Arctic GEOTRACES cruises. Mar. Chem. 203, 1–9. doi: 10.1016/j.marchem.2018.04.001
Gerringa L., Rijkenberg M., Laan P., Middag R., Rutgers van der Loeff M. M. (2021b). Dissolved trace metals cadmium (Cd), cobalt (Co), copper (Cu), iron (Fe), manganese (Mn), nickel (Ni), zinc (Zn) measured in samples from the Polarstern cruise PS94 to the Arctic Ocean from August to October 2015. PANGAEA doi: 10.1594/PANGAEA.932797
Gerringa L. J. A., Rijkenberg M. J. A., Slagter H. A., Laan P., Paffrath R., Bauch D., et al. (2021a). Dissolved cd, co, cu, fe, mn, ni, and zn in the arctic ocean. J. Geophys Res. Oceans 126. doi: 10.1029/2021JC017323
Gledhill M., Achterberg E. P., Li K., Mohamed K. N., rijkenberg M. J. A. (2015). Influence of ocean acidification on the complexation of iron and copper by organic ligands in estuarine waters. Mar. Chem. 177, 421–433. doi: 10.1016/j.marchem.2015.03.016
Gledhill M., Gerringa L. J. A. (2017). The effect of metal concentration on the parameters derived from complexometric titrations of trace elements in seawater—A model study. Front. Mar. Sci. 4. doi: 10.3389/fmars.2017.00254
Gordienko P. A., Laktionov A. F. (1969). “Circulation and Physics of the Arctic Basin waters,” in Oceanography. Eds. Gordon A. L., Baker F. W. G. (London: Pergamon), 94–112.
Gourain C. G. (2020). Copper biogeochemical cycle and the organic complexation of dissolved copper in the North Atlantic. Doctor of Philosophy Thesis. (Liverpool (UK): University of Liverpool). doi: 10.17638/03083646
Guéguen C., Guo L., Yamamoto-Kawai M., Tanaka N. (2007). Colored dissolved organic matter dynamics across the shelf-basin interface in the western Arctic Ocean. J. Geophys Res. 112, C05038. doi: 10.1029/2006JC003584
Guieu C., Huang W. W., Martin J.-M., Yong Y. Y. (1996). Outflow of trace metals into the Laptev Sea by the Lena River. Mar. Chem. 53, 255–267. doi: 10.1016/0304-4203(95)00093-3
Hoffmann L., Breitbarth E., Boyd P., Hunter K. (2012). Influence of ocean warming and acidification on trace metal biogeochemistry. Mar. Ecol. Prog. Ser. 470, 191–205. doi: 10.3354/meps10082
Hollister A. P., Whitby H., Seidel M., Lodeiro P., Gledhill M., Koschinsky A. (2021). Dissolved concentrations and organic speciation of copper in the Amazon River estuary and mixing plume. Mar. Chem. 234, 104005. doi: 10.1016/j.marchem.2021.104005
Hopwood M. J., Carroll D., Browning T. J., Meire L., Mortensen J., Krisch S., et al. (2018). Non-linear response of summertime marine productivity to increased meltwater discharge around Greenland. Nat. Commun. 9, 3256. doi: 10.1038/s41467-018-05488-8
IPCC (2022). “Impacts of 1.5°C Global Warming on Natural and Human Systems,” in Global Warming of 1.5°C: IPCC Special Report on Impacts of Global Warming of 1.5°C above Pre-industrial Levels in Context of Strengthening Response to Climate Change, Sustainable Development, and Efforts to Eradicate Poverty (Cambridge: Cambridge University Press). doi: 10.1017/9781009157940
Jacquot J. E., Moffett J. W. (2015). Copper distribution and speciation across the International GEOTRACES Section GA03. Deep Sea Res. Part II: Topical Stud. Oceanography 116, 187–207. doi: 10.1016/j.dsr2.2014.11.013
Jakobsson M. (2002). Hypsometry and volume of the Arctic Ocean and its constituent seas. Geochemistry Geophysics Geosystems 3, 1–18. doi: 10.1029/2001GC000302
Jensen L. T., Cullen J. T., Jackson S. L., Gerringa L. J. A., Bauch D., Middag R., et al. (2022). A refinement of the processes controlling dissolved copper and nickel biogeochemistry: insights from the pan-arctic. J. Geophys Res. Oceans 127. doi: 10.1029/2021JC018087
Jensen L. T., Lanning N. T., Marsay C. M., Buck C. S., Aguilar-Islas A. M., Rember R., et al. (2021). Biogeochemical cycling of colloidal trace metals in the arctic cryosphere. J. Geophys Res. Oceans 126. doi: 10.1029/2021JC017394
Kattner G. (2014). Nutrients measured on water bottle samples during POLARSTERN cruise ARK-XXVII/3 (IceArc) in 2012. PANGAEA. doi: 10.1594/PANGAEA.834081
Kattner G., Lobbes J. M., Fitznar H. P., Engbrodt R., Nöthig E.-M., Lara R. J. (1999). Tracing dissolved organic substances and nutrients from the Lena River through Laptev Sea (Arctic). Mar. Chem. 65, 25–39. doi: 10.1016/S0304-4203(99)00008-0
Klunder M. B., Laan P., Middag R., De Baar H. J. W., Bakker K. (2012). Dissolved iron in the Arctic Ocean: Important role of hydrothermal sources, shelf input and scavenging removal. J. Geophys Res. Oceans 117, 1–17. doi: 10.1029/2011JC007135
König-Langlo G. (2015). Meteorological Observations During POLARSTERN cruise PS94 (ARK-XXIX/3) (Bremerhaven: Alfred Wegener Institute, Helmholtz Centre for Polar and Marine Research). doi: 10.1594/PANGAEA.854304
Kramer C. J. M. (1986). Apparent copper complexation capacity and conditional stability constants in north atlantic waters. Mar. Chem. 18, 335–349. doi: 10.1016/0304-4203(86)90016-2
Krembs C., Eicken H., Junge K., Deming J. W. (2002). High concentrations of exopolymeric substances in Arctic winter sea ice: implications for the polar ocean carbon cycle and cryoprotection of diatoms. Deep Sea Res. Part I: Oceanographic Res. Papers 49, 2163–2181. doi: 10.1016/S0967-0637(02)00122-X
Krisch S., Hopwood M. J., Roig S., Gerringa L. J. A., Middag R., Rutgers van der Loeff M. M., et al. (2022). Arctic – atlantic exchange of the dissolved micronutrients iron, manganese, cobalt, nickel, copper and zinc with a focus on fram strait. Global Biogeochem Cycles 36. doi: 10.1029/2021GB007191
Krumpen T., Belter H. J., Boetius A., Damm E., Haas C., Hendricks S., et al. (2019). Arctic warming interrupts the Transpolar Drift and affects long-range transport of sea ice and ice-rafted matter. Sci. Rep. 9, 5459. doi: 10.1038/s41598-019-41456-y
Kruskal W. H., Wallis W. A. (1952). Use of ranks in one-criterion variance analysis. J. Am. Stat. Assoc. 47, 583–621. doi: 10.1080/01621459.1952.10483441
Laglera L. M., Sukekava C., Slagter H. A., Downes J., Aparicio-Gonzalez A., Gerringa L. J. A. (2019). First quantification of the controlling role of humic substances in the transport of iron across the surface of the arctic ocean. Environ. Sci. Technol. 53, 13136–13145. doi: 10.1021/acs.est.9b04240
Laglera L. M., van den Berg C. M. G. (2003). Copper complexation by thiol compounds in estuarine waters. Mar. Chem. 82, 71–89. doi: 10.1016/S0304-4203(03)00053-7
Liguori B. T. P., Ehlert C., Pahnke K. (2020). The influence of water mass mixing and particle dissolution on the silicon cycle in the central arctic ocean. Front. Mar. Sci. 7. doi: 10.3389/fmars.2020.00202
Lin H., Wang C., Zhao H., Chen G., Chen X. (2020). A subcellular level study of copper speciation reveals the synergistic mechanism of microbial cells and EPS involved in copper binding in bacterial biofilms. Environ. pollut. 263, 114485. doi: 10.1016/j.envpol.2020.114485
Lorenzo J. I., Nieto-Cid M., Álvarez-Salgado X. A., Pérez P., Beiras R. (2007). Contrasting complexing capacity of dissolved organic matter produced during the onset, development and decay of a simulated bloom of the marine diatom Skeletonema costatum. Mar. Chem. 103, 61–75. doi: 10.1016/j.marchem.2006.05.009
Maldonado M. T., Allen A. E., Chong J. S., Lin K., Leus D., Karpenko N., et al. (2006). Copper-dependent iron transport in coastal and oceanic diatoms. Limnol Oceanogr 51, 1729–1743. doi: 10.4319/lo.2006.51.4.1729
Middag R., de Baar H. J. W., Laan P., Klunder M. B. (2011). Fluvial and hydrothermal input of manganese into the Arctic Ocean. Geochim Cosmochim Acta 75, 2393–2408. doi: 10.1016/j.gca.2011.02.011
Millero F. J., Woosley R., Ditrolio B., Waters J. (2009). Effect of ocean acidification on the speciation of metals in seawater. Oceanography 22, 72–85. doi: 10.2307/24861025
Moffett J. W., Dupont C. (2007). Cu complexation by organic ligands in the sub-arctic NW Pacific and Bering Sea. Deep-Sea Res. I 54, 586–595. doi: 10.1016/j.dsr.2006.12.013
Muller F. L. L., Batchelli S. (2013). Copper binding by terrestrial versus marine organic ligands in the coastal plume of River Thurso, North Scotland. Estuar. Coast. Shelf Sci. 133, 137–146. doi: 10.1016/j.ecss.2013.08.024
Nixon R. L., Jackson S. L., Cullen J. T., Ross A. R. S. (2019). Distribution of copper-complexing ligands in Canadian Arctic waters as determined by immobilized copper(II)-ion affinity chromatography. Mar. Chem. 103673. doi: 10.1016/j.marchem.2019.103673
Ober S., Rijkenberg M. J. A., Gerringa L. J. A. (2016). Physical oceanography measured on water bottle samples with ultra clean CTD/Water sampler-system during POLARSTERN cruise PS94 (ARK-XXIX/3). PANGAEA. doi: 10.1594/PANGAEA.859561
Omanović D., Garnier C., Pižeta I. (2015). ProMCC: An all-in-one tool for trace metal complexation studies. Mar. Chem. 173, 25–39. doi: 10.1016/j.marchem.2014.10.011
Opsahl S., Benner R., Amon R. M. W. (1999). Major flux of terrigenous dissolved organic matter through the Arctic Ocean. Limnol Oceanogr 44, 2017–2023. doi: 10.4319/lo.1999.44.8.2017
Paffrath R., Laukert G., Bauch D., Rutgers van der Loeff M., Pahnke K. (2021). Separating individual contributions of major Siberian rivers in the Transpolar Drift of the Arctic Ocean. Sci. Rep. 11, 8216. doi: 10.1038/s41598-021-86948-y
Paulsen M. L., Müller O., Larsen A., Møller E. F., Middelboe M., Sejr M. K., et al. (2019). Biological transformation of Arctic dissolved organic matter in a NE Greenland fjord. Limnol Oceanogr 64, 1014–1033. doi: 10.1002/lno.11091
Peterson B. J., Holmes R. M., McClelland J. W., Võrõsmarty C. J., Lammers R. B., Shiklomanov A. I., et al. (2002). Increasing river discharge to the arctic ocean. Sci. (1979) 298, 2171–2173. doi: 10.1126/science.1077445
Rabe B., Schauer U., Ober S., Horn M., Hoppmann M., Korhonen M., et al. (2016). Physical oceanography during POLARSTERN cruise PS94 (ARK-XXIX/3). PANGAEA. doi: 10.1594/PANGAEA.859558
Rijkenberg M. J. A., de Baar H. J. W., Bakker K., Gerringa L. J. A., Keijzer E., Laan M., et al. (2015). PRISTINE”, a new high volume sampler for ultraclean sampling of trace metals and isotopes. Mar. Chem. 177, 501–509. doi: 10.1016/j.marchem.2015.07.001
Rijkenberg M. J. A., Slagter H. A., van der Loeff M. R., van Ooijen J., Gerringa L. J. A. (2018). Dissolved Fe in the deep and upper Arctic Ocean with a focus on Fe Limitation in the Nansen Basin. Front. Mar. Sci. 5. doi: 10.3389/fmars.2018.00088
Ruacho A., Richon C., Whitby H., Bundy R. M. (2022). Sources, sinks, and cycling of dissolved organic copper binding ligands in the ocean. Commun. Earth Environ. 3, 263. doi: 10.1038/s43247-022-00597-1
Rudels B. (2012). Arctic Ocean circulation and variability – advection and external forcing encounter constraints and local processes. Ocean Sci. 8, 261–286. doi: 10.5194/os-8-261-2012
Rudels B. (2019). “Arctic ocean circulation,” in Encyclopedia of Ocean Sciences (Third Edition), eds. Cochran J. K., Bokuniewicz H. J., Yager P. L. (Oxford: Elsevier), 262–277. doi: 10.1016/B978-0-12-409548-9.11209-6
Sakamoto Y., Ishiguro M., Kitagawa G. (1986). Akaike information criterion statistics. Dordrecht Netherlands: D. Reidel 81, 26853.
Schauer U. (2004). Arctic warming through the Fram Strait: Oceanic heat transport from 3 years of measurements. J. Geophys Res. 109, C06026. doi: 10.1029/2003JC001823
Schauer U. (2016). The expedition PS94 of the research vessel POLARSTERN to the central arctic ocean in 2015. Berichte zur Polar-und Meeresforschung= Rep. polar Mar. Res. 703. doi: 10.2312/BzPM_0703_2016
Schlosser P., Kromer B., Ekwurzel B., Bönisch G., McNichol A., Schneider R., et al. (1997). The first trans-Arctic 14C section: comparison of the mean ages of the deep waters in the Eurasian and Canadian basins of the Arctic Ocean. Nucl. Instrum Methods Phys. Res. B 123, 431–437. doi: 10.1016/S0168-583X(96)00677-5
Schuur E. A. G., Abbott B. W., Bowden W. B., Brovkin V., Camill P., Canadell J. G., et al. (2013). Expert assessment of vulnerability of permafrost carbon to climate change. Clim Change 119, 359–374. doi: 10.1007/s10584-013-0730-7
Schuur E. A. G., McGuire A. D., Schädel C., Grosse G., Harden J. W., Hayes D. J., et al. (2015). Climate change and the permafrost carbon feedback. Nature 520, 171–179. doi: 10.1038/nature14338
Semeniuk D. M., Bundy R. M., Payne C. D., Barbeau K. A., Maldonado M. T. (2015). Acquisition of organically complexed copper by marine phytoplankton and bacteria in the northeast subarctic Pacific Ocean. Mar. Chem. 173, 222–233. doi: 10.1016/j.marchem.2015.01.005
Shank G. C., Skrabal S. A., Whitehead R. F., Kieber R. J. (2004). Strong copper complexation in an organic-rich estuary: the importance of allochthonous dissolved organic matter. Mar. Chem. 88, 21–39. doi: 10.1016/j.marchem.2004.03.001
Shank G. C., Whitehead R. F., Smith M. L., Skrabal S. A., Kieber R. J. (2006). Photodegradation of strong copper-complexing ligands in organic-rich estuarine waters. Limnol Oceanogr 51, 884–892. doi: 10.4319/lo.2006.51.2.0884
Slagter H. A., Laglera L. M., Sukekava C., Gerringa L. J. A. (2019). Fe-binding organic ligands in the humic-rich transPolar drift in the surface arctic ocean using multiple voltammetric methods. J. Geophys Res. Oceans 124, 1491–1508. doi: 10.1029/2018JC014576
Slagter H. A., Reader H. E., Rijkenberg M. J. A., Rutgers van der Loeff M., de Baar H. J. W., Gerringa L. J. A. (2017). Organic Fe speciation in the Eurasian Basins of the Arctic Ocean and its relation to terrestrial DOM. Mar. Chem. 197, 11–25. doi: 10.1016/j.marchem.2017.10.005
Stedmon C. A., Amon R. M. W., Rinehart A. J., Walker S. A. (2011). The supply and characteristics of colored dissolved organic matter (CDOM) in the Arctic Ocean: Pan Arctic trends and differences. Mar. Chem. 124, 108–118. doi: 10.1016/j.marchem.2010.12.007
Stockdale A., Tipping E., Lofts S., Mortimer R. J. G. (2016). Effect of ocean acidification on organic and inorganic speciation of trace metals. Environ. Sci. Technol. 50, 1906–1913. doi: 10.1021/acs.est.5b05624
Sunda W. G., Lewis J. A. M. (1978). Effect of complexation by natural organic ligands on the toxicity of copper to a unicellular alga, Monochrysis lutheri. Limnol Oceanogr 23, 870–876. doi: 10.4319/lo.1978.23.5.0870
Thuróczy C. E., Gerringa L. J. A., Klunder M., Laan P., Le Guitton M., de Baar H. J. W. (2011). Distinct trends in the speciation of iron between the shallow shelf seas and the deep basins of the Arctic Ocean. J. Geophys Res. 116, C10009. doi: 10.1029/2010JC006835
Tomczak M., Godfrey J. S. (2001). “Arctic oceanography; the Path of North Atlantic Deep Water,” in Regional Oceanography: an Introduction. Eds. Tomczak M., Godfrey J. S. (Oxford: Pergamon), 83–103.
Tovar-Sánchez A., Duarte C. M., Alonso J. C., Lacorte S., Tauler R., Galbán-Malagón C. (2010). Impacts of metals and nutrients released from melting multiyear Arctic sea ice. J. Geophys Res. 115, C07003. doi: 10.1029/2009JC005685
Twining B. S., Baines S. B. (2013). The trace metal composition of marine phytoplankton. Ann. Rev. Mar. Sci. 5, 191–215. doi: 10.1146/annurev-marine-121211-172322
Uhlig C., Damm E., Peeken I., Krumpen T., Rabe B., Korhonen M., et al. (2019). Sea ice and water mass influence dimethylsulfide concentrations in the central arctic ocean. Front. Earth Sci. (Lausanne) 7. doi: 10.3389/feart.2019.00179
van den Berg C. M. G. (1982). Determination of copper complexation with natural organic ligands in seawater by equilibration with MnO2 II. Experimental procedures and application to surface seawater. Mar. Chem. 11, 323–342. doi: 10.1016/0304-4203(82)90029-9
van Ooijen J. C., Rijkenberg M. J. A., Gerringa L. J. A., Rabe B., Rutgers van der Loeff M. M. (2016). Inorganic nutrients measured on water bottle samples during POLARSTERN cruise PS94 (ARK-XXIX/3). PANGAEA. doi: 10.1594/PANGAEA.868396
Vernet M., Ellingsen I. H., Seuthe L., Slagstad D., Cape M. R., Matrai, P. A. (2019). Influence of phytoplankton advection on the productivity along the atlantic water inflow to the arctic ocean. Front. Mar. Sci. 6. doi: 10.3389/fmars.2019.00583
Whitby H., Hollibaugh J. T., van den Berg C. M. G. (2017). Chemical speciation of copper in a salt marsh estuary and bioavailability to thaumarchaeota. Front. Mar. Sci. 4. doi: 10.3389/fmars.2017.00178
Whitby H., Posacka A. M., Maldonado M. T., van den Berg C. M. G. (2018). Copper-binding ligands in the NE pacific. Mar. Chem. 204, 36–48. doi: 10.1016/j.marchem.2018.05.008
Whitby H., van den Berg C. M. G. (2015). Evidence for copper-binding humic substances in seawater. Mar. Chem. 173, 282–290. doi: 10.1016/j.marchem.2014.09.011
Williford T., Amon R. M. W., Kaiser K., Benner R., Stedmon C., Bauch D., et al. (2022). Spatial complexity in dissolved organic matter and trace elements driven by hydrography and freshwater input across the arctic ocean during 2015 arctic GEOTRACES expeditions. J. Geophys Res. Oceans 127. doi: 10.1029/2022JC018917
Wisotzki A., Bakker K. (2008). Hydrochemistry Measured on Water Bottle Samples During POLARSTERN cruise ARK-XXII/2. PANGAEA. doi: 10.1594/PANGAEA.759286
Wiwit, Wong K. H., Fukuda H., Ogawa H., Mashio A. S., Kondo Y., et al. (2021). Wide-range detection of Cu-binding organic ligands in seawater using reverse titration. Mar. Chem. 230, 103927. doi: 10.1016/j.marchem.2021.103927
Keywords: copper, copper-binding ligands, voltammetric method, Arctic Ocean, Transpolar Drift
Citation: Arnone V, Santana-Casiano JM, González-Dávila M, Planquette H, Sarthou G, Gerringa LJA and González AG (2023) Natural copper-binding ligands in the Arctic Ocean. The influence of the Transpolar Drift (GEOTRACES GN04). Front. Mar. Sci. 10:1306278. doi: 10.3389/fmars.2023.1306278
Received: 03 October 2023; Accepted: 07 November 2023;
Published: 12 December 2023.
Edited by:
Antonio Cobelo-Garcia, Spanish National Research Council (CSIC), SpainReviewed by:
Dario Omanovic, Rudjer Boskovic Institute, CroatiaCopyright © 2023 Arnone, Santana-Casiano, González-Dávila, Planquette, Sarthou, Gerringa and González. This is an open-access article distributed under the terms of the Creative Commons Attribution License (CC BY). The use, distribution or reproduction in other forums is permitted, provided the original author(s) and the copyright owner(s) are credited and that the original publication in this journal is cited, in accordance with accepted academic practice. No use, distribution or reproduction is permitted which does not comply with these terms.
*Correspondence: Aridane G. Gonzá;lez, YXJpZGFuZS5nb256YWxlekB1bHBnYy5lcw==
Disclaimer: All claims expressed in this article are solely those of the authors and do not necessarily represent those of their affiliated organizations, or those of the publisher, the editors and the reviewers. Any product that may be evaluated in this article or claim that may be made by its manufacturer is not guaranteed or endorsed by the publisher.
Research integrity at Frontiers
Learn more about the work of our research integrity team to safeguard the quality of each article we publish.