 Austin L. Fox
 John H. Trefry
- Department of Ocean Engineering and Marine Sciences, Florida Institute of Technology, Melbourne, FL, United States
Nutrient fluxes from fine-grained, organic-rich sediments in estuaries can hasten the onset and progression of eutrophication and harmful algal blooms. Targeted efforts to manage degraded sediments and improve estuarine water quality require a better understanding of physicochemical controls and the relative importance of benthic fluxes. Toward that end, we determined fluxes from organic-rich, high porosity sediments deposited during the past 5-6 decades along 60 km of the Indian River Lagoon, a barrier island lagoon in Florida, USA. Highly bioavailable ammonium and phosphate were the predominant chemical forms of interstitial nitrogen and phosphorus in these highly-reducing sediments. Median fluxes of ammonium and phosphate were 320 µmol m-2 h-1 and 11 µmol m-2 h-1, respectively. Fluxes were 3-10 times greater when sediment temperatures were >28°C and interstitial sulfide concentrations were >1 mM. Temperature-compensated fluxes of ammonium and phosphate were significantly correlated with sediment organic matter content; total organic carbon averaged 5.3 ± 2.4% and the maximum was 12.4% for the sediments studied. Fine-scale physical probing, plus lidar data, showed that these organic-rich sediments covered <10% of our study area; however, fluxes from these sediments were estimated to supply 20-40% of internal + external annual loads of nitrogen and phosphorus. Furthermore, 60% of nitrogen and phosphorus fluxes from sediments in the northern Indian River Lagoon came from just 22% of the total surface area. Lagoon segments with high benthic fluxes overlapped in part with areas prone to harmful algal blooms. Effective strategies to manage degraded sediments in the Indian River Lagoon depend on knowing the relative magnitude of internal loading of nutrients as well as appropriate techniques to mitigate sediment fluxes.
1 Introduction
Benthic nutrient fluxes are an integral component of benthic-pelagic coupling, a process that links remineralization of organic matter (OM) in sediments with primary productivity in the water column (Burdidge, 2012; Rodil et al., 2020). Both external (allochthonous) and internal (autochthonous) sources of OM help sustain this coupling (Twilley et al., 1999; Kristensen et al., 2014). The relative importance of benthic fluxes (internal sources) to photosynthetic activity is highly variable (Nixon, 1981; Fisher et al., 1982; Mortazavi et al., 2000; DiDonato et al., 2006). In one extreme case, >90% of the nitrogen (N) required to support phytoplankton productivity in Corpus Christi Bay, Texas, was recycled from sediments during 11 years of low rainfall, low freshwater inflow, limited flushing and high evaporation (Flint, 1985). By comparison, benthic fluxes of N were insignificant to photosynthetic activity in Apalachicola Bay, Florida, where >85% of total dissolved nitrogen (TDN) inputs came from river inflow and exchanges with the Gulf of Mexico (Mortazavi et al., 2000). Therefore, estimates of both internal and external loads are needed to optimize and focus mitigation and restoration techniques in estuaries (Wang et al., 2022).
Factors that control benthic fluxes, including OM content, temperature and redox conditions, vary among estuaries in response to differences in physical and biogeochemical characteristics (Twilley et al., 1999; Burdidge, 2012). With respect to physical features, deeper estuaries with large seasonal changes in temperature and strong tidal influences have more variable and much lower fluxes than shallow, warmer estuaries with limited circulation (DiDonato et al., 2006; Engle et al., 2007). Biogeochemical factors, especially high concentrations of OM plus anaerobic sediments and bottom water, can yield substantial benthic fluxes of ammonium and phosphate and increase the relative importance of internal loading (Klump and Martens, 1989; Cowan and Boynton, 1996; Boynton et al., 2017).
In chronically eutrophic estuaries, benthic-pelagic coupling supports a cycle of algal growth, deposition of labile OM and subsequent remineralization (decomposition) in sediments (Ferguson et al., 2004; Kemp et al., 2009). High rates of remineralization consume oxygen and promote preferential generation of reduced N (Seitzinger, 1991; Decleyre et al., 2015). A shift to more bioavailable forms of N and phosphorus (P) can promote fast growing algae that generate high cell counts and cause adverse ecological impacts (Kang et al., 2015). Prolonged hypoxia/anoxia also influences sorption-desorption of P from sediments (Pant and Reddy, 2001). Interactions among processes that regulate releases of N and P from sediments in eutrophic estuaries have led to wide ranges in N/P ratios for benthic fluxes (Cowan et al., 1996; Boynton et al., 2017). Less than optimal N/P ratios have been blamed for more frequent harmful algal blooms (HABs) and shifts in the composition of algal communities (Heisler et al., 2008). As eutrophication progresses, sediment remineralization becomes an increasingly important source of nutrients that can sustain primary productivity in the absence of external inputs of nutrients, thereby altering N/P ratios and the trophic state of estuaries (DiDonato et al., 2006; Kemp et al., 2009).
Extended periods of eutrophication can shift ecosystems dominated by seagrass to systems dominated by phytoplankton (Livingston, 2000; Phlips et al., 2021). During recent decades, catastrophic losses of seagrass beds have been reported worldwide (Burkholder et al., 2007; Waycott et al., 2009; Phlips et al., 2020; Dunic et al., 2021). Macroalgae also can be adversely affected by phytoplankton blooms (Hall et al., 2022). Ecosystem changes can modify nutrient uptake to favor more frequent HABs and potentially more variable algal communities, especially when hurricanes and El Niño events enhance nutrient loading (Phlips et al., 2020; Phlips et al., 2021).
Eutrophication has adversely affected the Indian River Lagoon (IRL), a barrier island lagoon along the central east coast of Florida. The lagoon has experienced diverse HABs, poor water quality, decline of seagrass and macroalgae, anoxia/hypoxia, fish kills and manatee mortality (Lapointe et al., 2020; Phlips et al, 2020; Lopez et al., 2021; Landsberg et al., 2022; Morris et al., 2022). Less obvious changes have been anthropogenic increases in the spatial extent and volume of fine-grained, organic-rich sediments (Trefry and Trocine, 2011). Such sediments, presently estimated to cover <10% of the IRL, and are characterized by >3% total organic carbon (TOC), >60 silt + clay and >75% water by weight (i.e., porosity >0.9) (Trefry and Trocine, 2011). Most fine-grained, organic-rich sediments were deposited in the IRL since the 1950s as anthropogenic outcomes of intense population growth and development (Trefry and Trocine, 2011). These sediments are an internal source of N and P via diffusive benthic fluxes that have been linked to decreased biodiversity and macro faunal abundance (Fox and Trefry, 2018; Fuller et al., 2021; Mallick et al., 2023). Previous studies of similar sediments have shown that advection is not a significant component of fluxes from such sediments (Charbonnier et al., 2023).
Given the potential importance of benthic-pelagic coupling in the IRL, the goals of this study were to determine (1) the magnitude of fluxes of N and P from organic-rich sediments, (2) the relative degree of control exerted by sediment TOC, N, P, porosity, temperature, redox conditions and other variables on the magnitude of benthic fluxes of N and P from organic-rich sediments and (3) the relative importance of benthic fluxes (internal loads) of N and P versus external loads. We focused on highly reducing, organic-rich sediments because of their presumed importance to net benthic fluxes in the lagoon. The resulting data will help resource managers target areas or types of sediment that yield large fluxes. Moreover, the results can guide the search for practical techniques to mitigate existing and contributing inputs of organic-rich sediments and subsequent eutrophication.
2 Materials and methods
2.1 Study area and project overview
The IRL system extends ~250 km along the central east coast of Florida (Figure 1). The average depth of the lagoon is ~1.7 m and width ranges from 0.8 to 8 km (Indian River Lagoon National Estuary Program [IRLNEP], 2007; Smith, 2007). Areas of the lagoon system sampled during our study have a subtropical climate and are poorly flushed with no inlets to the ocean along a 140-km stretch, including the entire area chosen for this study (Figure 1). Calculated renewal times for water in our study area range from ~100−300 days (Smith, 1993; Rosario-Llantin and Zarillo, 2021). Human development and addition of causeways over the past century have subdivided the estuary and further restricted circulation (Indian River Lagoon National Estuary Program [IRLNEP], 2007). Moreover, sand dredged from the lagoon to build causeways and raise areas for expanding infrastructure created discrete bathymetric depressions referred to as borrow pits. In our study area, the Intracoastal Waterway (ICW), with a width of ~46 m and average depth of ~3.7 m, extends for ~78 km through the IRL from Haulover Canal to US 192 (Melbourne Causeway, Figure 1). A companion series of navigational channels extend ~44 km in Banana River Lagoon (BRL) from the latitudes of State Route (SR) 405 (NASA Causeway) to SR 518 (Eau Gallie Causeway, Figure 1). Fine-grained, organic-rich sediments that accumulated in natural basins, borrow pits, channels and other parts of the lagoon were the focus of this study because of their capacity to flux large quantities of N and P into the overlying water.
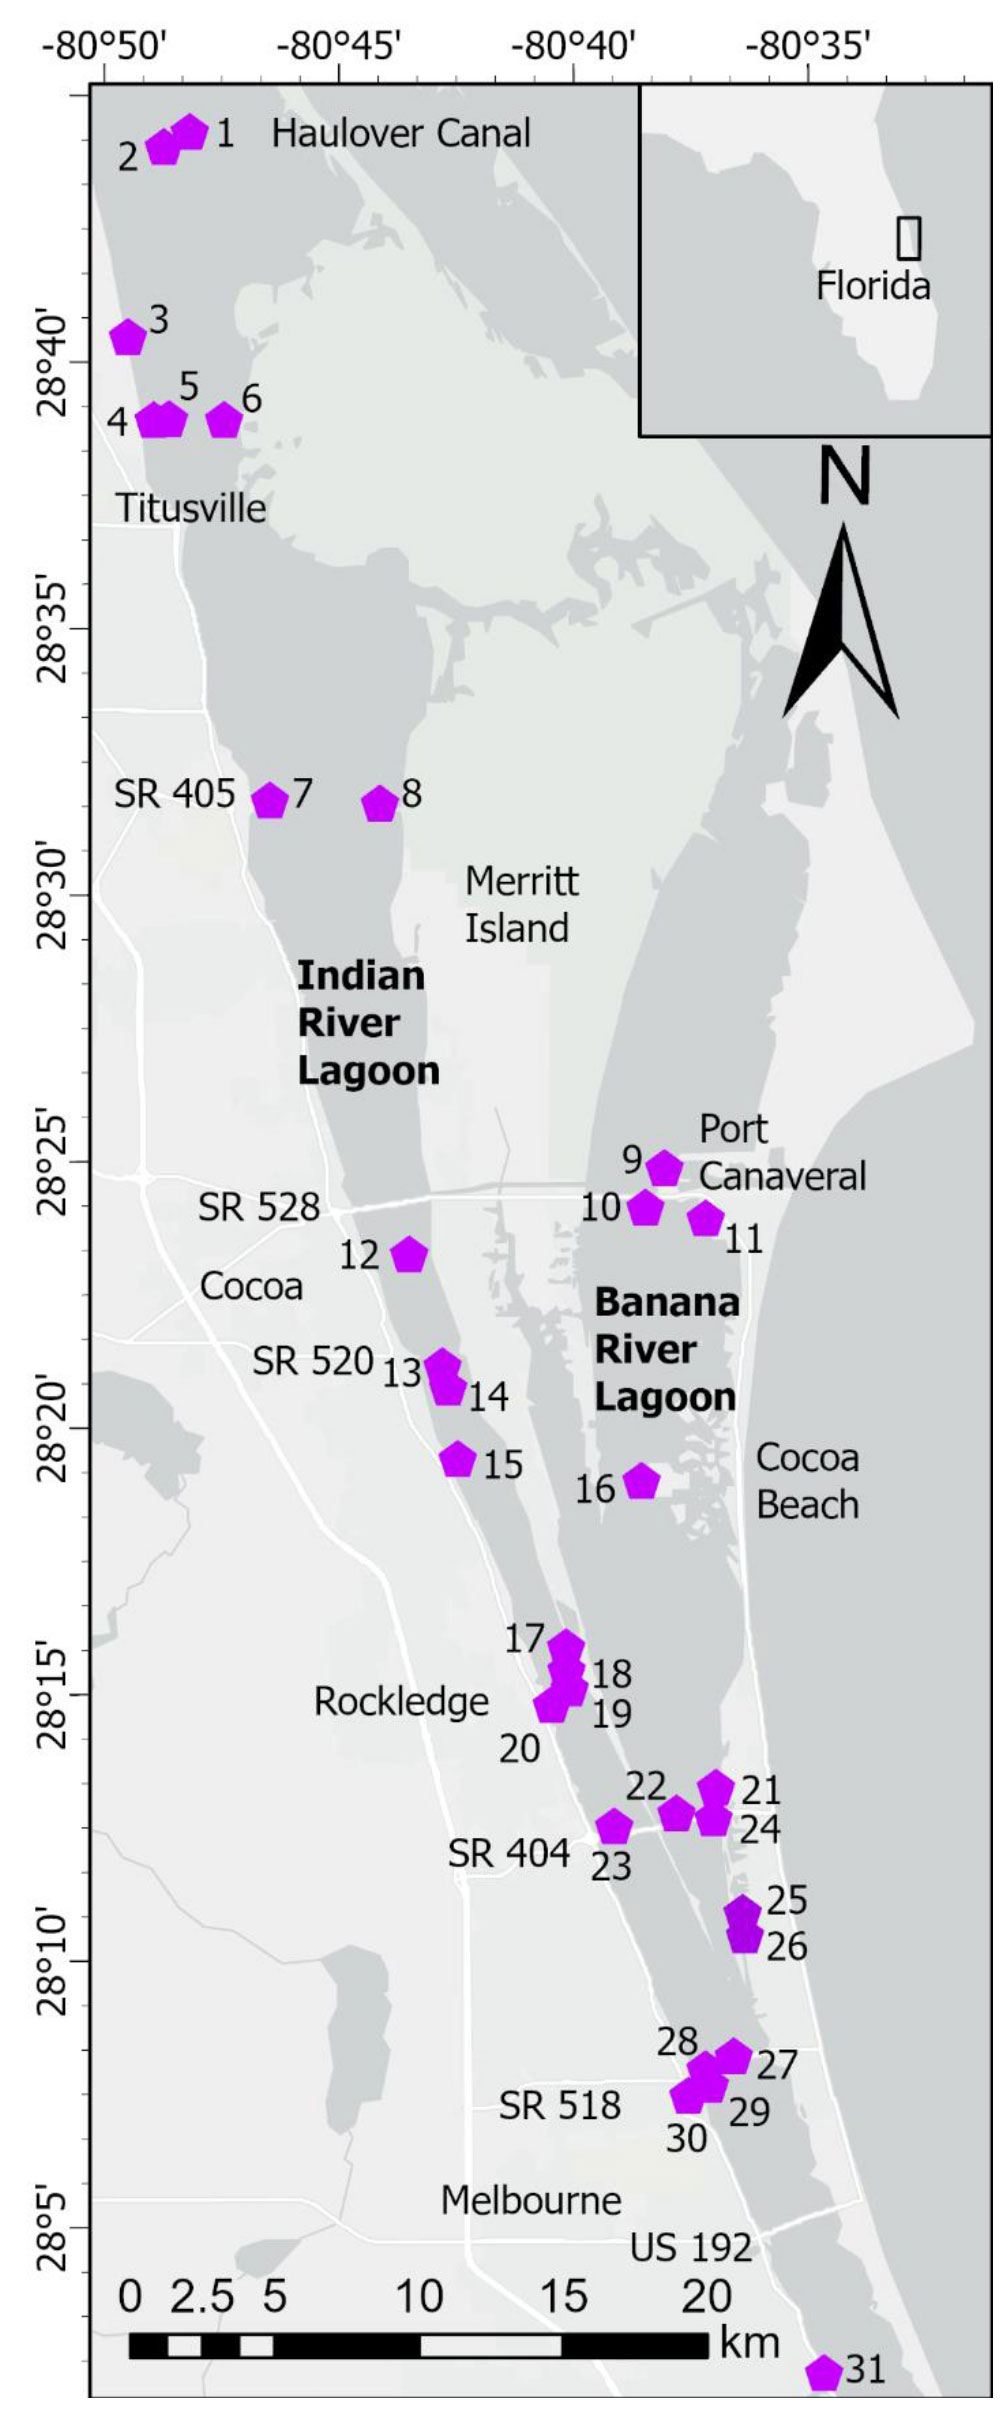
Figure 1 Map showing stations in North Indian River Lagoon (NIRL) and Banana River Lagoon (BRL). Station coordinates in Supplementary Table 1. Inset map shows location of lagoon along central east coast of Florida. Stations 25 and 26 were in residential canals. Stations 30 and 31 were in tributaries.
Sampling was conducted along a 60-km section of the lagoon system that included the North IRL (NIRL) and BRL, residential canals and selected tributary outfalls (Figure 1). We define NIRL from Turnbull Creek (~10 km NNW of station 1) to Route US 192 in Melbourne and BRL from Merritt Island to SR 518 (Figure 1). Our study was carried out from May 2014-June 2018 with two components, Phase 1 (May 2014-June 2016) to investigate the magnitude and controls of benthic N and P fluxes and Phase 2 (September 2015-June 2018) to obtain a detailed data set for the distribution of fine-grained, organic-rich sediment and determine the relative importance of benthic fluxes (internal inputs) from these highly-reducing sediments versus external nutrient inputs.
During Phase 1, sediment cores were collected for detailed analysis of sediment and interstitial water and to calculate diffusive fluxes of nutrients from fine-grained, organic-rich IRL sediments that were deposited during the past 60 years of intense land development (Trefry and Trocine, 2011). Diffusion was the dominant transport mechanism for nutrients from these fine-grained (>60% silt + clay), organic-rich (median 16% organic matter), high porosity (ɸ>0.92), low permeability, low hydraulic conductivity sediments that were the focus of our study (Trefry and Trocine, 2011; Pain et al., 2021). These parameters are consistent with other fine-grained lagoonal and coastal sediments wherein advection is not a significant component of total fluxes (Schultz and Ruppel, 2002; Charbonnier et al., 2023). Furthermore, tidal ranges in our study area were <1-5 cm (Smith, 1993) and bioturbation was minimal in these organism-poor sediments (Fuller et al., 2021).
Sampling during Phase 1 was a joint effort with the University of Florida to quantify nutrients in benthic fluxes (this study) and submarine groundwater discharges (Pain et al., 2021) and then identify key variables controlling these processes. Groundwater discharges were extremely low in surface layers of fine-grained, organic-rich sediments (Pain et al., 2021). Fifteen stations in NIRL and BRL were occupied (Figure 1; coordinates in Supplementary Table 1). Sampling was repeated on 6-7 occasions at 4 of the 15 stations (17, 20, 29, 30; Figure 1). The remaining stations were sampled once.
During Phase 2, physical probing, acoustic surveys and lidar data were used to find and characterize deposits of organic-rich sediments in NIRL and BRL (Trefry et al., 1990; Foster et al., 2018; National Oceanic and Atmospheric Administration [NOAA], 2022). Initially, 53 deposits were selected and sediments were sampled from 2-5 stations in each deposit (locations in Trefry et al., 2019). Then, 20 of the 53 deposits were prioritized for more detailed probing using a gridded approach at 15 to >100 locations within each deposit to determine the thickness of the high porosity, organic-rich sediments. Surface sediments were collected at 3-5 stations in each deposit with an area >100 m2. Overall, Phase 2 included 112 stations and 352 measurements of benthic fluxes of ammonium and phosphate as well as LOI and porosity (stations shown in Trefry et al., 2019; central locations in Figure 1).
Data from Turkey Creek (station 31, Figure 1), one of the largest tributaries to the IRL, also were included in this study because the creek provided a valuable example of fluxes from a freshwater-saltwater mixing zone. Turkey Creek is located 5 km south of the southern boundary of NIRL. Flux data for Turkey Creek were not included with any summary data for NIRL.
2.2 Sampling
Vertical profiles for salinity, temperature, pH and dissolved oxygen in the water column were obtained using a YSI 6600 V2 sonde at each station prior to sampling during Phase 1, and in the center of each deposit during Phase 2. The sonde was calibrated each day following manufacturer’s specifications and successfully intercalibrated with a YSI ProDSS when it replaced the 6000 V2 in 2017. Surface water for nutrient analysis was collected directly and cleanly from our pontoon boat or by diver. Samples were immediately filtered through 0.45-µm, polypropylene syringe filters and stored on ice until returned to the laboratory.
Thicknesses of fine-grained, organic-rich sediments overlying ubiquitous sand were determined at each station using a 4-cm diameter, capped polyvinyl chloride pole with centimeter graduations and holes at half-meter intervals to maintain neutral buoyancy. The pole was lowered to the sediment surface to determine water depth and then pushed into the soft sediment until a firm surface, usually sand, was encountered; the difference between the two measurements equaled the thickness of high porosity, organic-rich sediment (Fox and Trefry, 2018).
Sediment cores for interstitial water were carefully collected during Phase 1 by divers using 60-cm long, 7-cm diameter cellulose acetate butyrate tubing. The tubes were capped during collection; a 10- to 15-cm layer of water was retained at the top of each core. Surface sediments were collected using a 0.1-m2 Ekman grab during each survey. Sediments from the top 2 cm of each grab were placed in 70-mL polycarbonate vials for other chemical analysis. During Phase 2, samples were carefully collected from grabs using mini-piston corers made from modified 30-mL syringes. All samples were stored on ice until returned to the laboratory.
2.3 Laboratory methods
Interstitial water was obtained during Phase 1 using whole-core squeezers (Bender et al., 1987; Jahnke, 1988). Samples were obtained when a piston inside the base of the core tube compressed the sediment and squeezed interstitial water through porous Teflon rods into syringes attached at intervals of 0.5-2.0 cm. Interstitial water was collected from 14-16 depths along 30-cm long cores, thereby providing vertical profiles with seasonal and spatial perspectives on sediment reactions that drive nutrient fluxes. The extruded water was filtered through 0.4-µm polycarbonate filters into low density polyethylene vials. Samples for sulfide analysis were taken <10 seconds after filtration and analyzed using the methylene blue method (Hach method 8131) using a Hach DR2800 spectrophotometer with a precision of 10% and a detection limit of 6 µM. The remaining water was then dispensed into glass vials for analysis of dissolved organic carbon (DOC) and low-density polypropylene bottles for nutrient analysis. Profiles of sediment oxygen concentrations for interstitial water were created using a 5-cm long microprobe (Microelectrodes, Inc. MI-730 micro-oxygen electrode) mounted on a microscope stage that allowed it to be lowered in 1-mm intervals from the top of the core (Diaz and Trefry, 2006).
During comparison of methods in Phase 1, and throughout Phase 2, interstitial water was obtained by extruding the top 3 cm of sediment from mini-piston cores into N2-purged tubes. The sediment was then centrifuged at ~2,000 rpm for 5 minutes. Sulfide analysis was conducted immediately as described above. The supernatant was filtered through 0.45-µM polypropylene filters into low-density polyethylene vials. This general method has been used successfully by other investigators (Paulson et al., 2006; Zhao et al., 2021).
Concentrations of ammonium, nitrate + nitrite, total dissolved N (TDN), dissolved inorganic P (DIP), and total dissolved P (TDP) were determined using a SEAL AA3 HR Continuous Segmented Flow AutoAnalyzer following manufacturer’s methods. TDN was determined after persulfate digestion of organic N under UV light plus subsequent oxidation of ammonium to nitrate and reduction of nitrate to nitrite using a cadmium column. Concentrations were determined by UV-visible spectrometry. TDP was determined with the SEAL system by persulfate digestion of organic P under UV light to free organically-bound P for analysis as phosphate by UV-visible spectrometry. The National Institute of Standards and Technology (NIST) traceable Dionex 5-Anion Standard was analyzed as a reference standard with each batch of samples to ensure accuracy; results were within established 95% confidence limits. Values for analytical precision as relative standard deviation (RSD) were as follows: ammonium (3%), nitrate + nitrite (6%), TDN (2%), DIP (3%) and TDP (3%). Procedural blanks were processed with each batch of samples. Concentrations of dissolved organic N (DON) and dissolved organic P (DOP) were calculated by subtracting the inorganic forms of each element from TDN and TDP, respectively. Precision as RSD was 4% for DON and 16% for DOP. Precision for DOP was weaker when TDP was predominantly DIP. Detection limits (μM) were as follows: ammonium (0.3), nitrate + nitrite (0.2), TDN and DON (0.7), DIP (0.04), TDP and DOP (0.04).
Concentrations of dissolved carbon were determined using a Shimadzu TOC-5050A instrument with nondispersive infrared detection. Concentrations of DOC were calculated by subtracting inorganic carbon from total carbon. Accuracy was determined using an NIST-traceable standard solution of potassium hydrogen phthalate (83.3 μM) from Inorganic Ventures; results were within 95% confidence limits. Precision averaged 1.9% (RSD) and the detection limit was 10 μM.
A variety of analyses were used to characterize sediments. All sediment samples were weighed, freeze dried using a Labconco FreeZone 6 system, and reweighed to determine water content. Freeze-dried samples were then powdered using a SPEX Model 8000 Mixer/Mill. Concentrations of TOC and total N (TN) in sediments were determined by treating the sample with 10% (v/v) hydrochloric acid to remove any inorganic carbon. Organic N was not lost during this process based on our laboratory testing. Sediment was dried and weighed into ceramic boats and combusted with pure oxygen at 950°C using a LECO TruMac C/N/S system. Quantification of the resultant CO2 and N2 gases was via infrared and thermal conductivity detectors, respectively. Concentrations of C and N measured in sediment SRM #2704 (NIST) and LECO reference sample 502-309 were within 95% confidence intervals around certified values. Analytical precision as RSD was 1.5% for TOC and 2% for TN; detection limits were 0.2% for TOC and 0.05% for TN.
Loss on Ignition (LOI) at 550°C was determined following the method of Heiri et al. (2001). Values for LOI estimate the fraction of OM in the sample. Concentrations of CaCO3 were determined by heating the sediment treated for LOI at 550°C to 950°C following the method of Heiri et al. (2001). Analysis of sediments for total Al, Si, Fe and TP was by atomic absorption spectrometry (Al, Si, Fe) and inductively-coupled plasma mass spectrometry (P) following complete dissolution with high purity HF and HNO3 (Fox and Trefry, 2018).
Values for δ13C and δ15N were determined for a subset of sediments at the University of Florida Isotope Mass Spectrometry Laboratory using a VG Isogas PRISM Series II stable isotope ratio mass spectrometer (IRMS) with triple collector and H/D spur. Samples were retreated with 10% phosphoric acid to remove inorganic carbon, rinsed with water (HPLC grade) and dried prior to analysis. δ15N values for ammonium in interstitial water and the overlying water column were determined at the Center for Applied Isotope Studies at the University of Georgia using Thermo 253 IRMS coupled to a Thermo Trace 1310 GC and combustion interface.
2.4 Calculations and data interpretation
Data and graphical analyses were carried out using SigmaPlot 10 (Systat Software, Inc.), Excel 2016 (Microsoft), XLSTAT (Lumivero, LLC, Denver, Colorado), and ArcGIS Pro (Version 2.9.0, Esri, Redlands, California). An alpha value to define statistical significance was set at 0.05 for statistical tests and regressions. Linear least squares regressions were calculated to determine relationships between individual pairs of parameters. Equations, 95% prediction intervals, correlation coefficients (r) and p values were determined for each relationship. General descriptors used for r values were as follows: >0.4-0.6 (moderate), >0.6-0.8 (moderately strong), >0.8-0.9 (strong) and >0.9 (very strong). Comparisons of two independent groups of data were conducted using two-tailed t-tests assuming equal variance. Independent groups of data with p-values >0.05 were considered not significantly different from one another. A stepwise regression was conducted to identify proximal influences of sediment parameters on benthic fluxes.
Diffusive fluxes (F) were calculated during Phase 1 using vertical profiles of ammonium and phosphate in interstitial water and Fick’s first law of diffusion (Berner, 1974; Boudreau and Scott, 1978). Data for these calculations included the linear portion of the concentration gradients (dc/dz in g cm-4) for dissolved species in interstitial water, site-specific sediment diffusion coefficients (Ds) and the equation for Fickian diffusion (Equation 1). Values for Ds were calculated using (Equation 2) with the molecular diffusion coefficients (Dm in cm2 sec-1; Li and Gregory, 1974) modified for use in sediments by accounting for variations in porosity (ɸ, unitless) and the increased path length for diffusion around sediment grains (tortuosity, unitless) (Presley and Trefry, 1980).
Values for Dm were corrected for temperature and viscosity using (Equation 3).
where η = viscosity of seawater (centipoise) at a given temperature (T, Kelvin).
The same equations were used to calculate fluxes during Phase 2; however, gradients were determined using concentrations in bottom water and interstitial water from a mixed 3-5 cm layer of sediment collected using syringe cores. Linearity in the top 3-5 cm of sediment was confirmed by results from whole-core squeezers. Samples from the open lagoon, tributaries and canals were used to validate the syringe mini-core technique. Diffusive fluxes calculated with data from whole-core squeezers and mini-cores correlated very strongly for N (r = 0.96) and strongly for P (r = 0.84) with slopes of 0.94 and 0.72, respectively (Supplementary Figure 1).
Bacterially mediated fluxes of N and P have been shown to vary with sediment temperature (Boynton et al., 2017). Therefore, fluxes determined at a variety of temperatures have sometimes been normalized to a constant sediment temperature of 25°C using a temperature coefficient (Boynton and Bailey, 2008). Bailey (2005) calculated temperature coefficients (Q10) using Equation 4. Fluxes at in-situ sediment temperatures (F1 and T1) were normalized to a constant sediment temperature of 25°C using Q10 temperature coefficients in Equation 5 (Bailey, 2005).
We calculated average Q10 values of 1.8 ± 0.8 and 2.0 ± 2.5 for ammonium and phosphate, respectively, at sediment temperatures of 16-32°C. Our values for Q10 corresponded with ~6% and 7% increases per 1°C increase in temperature for ammonium and phosphate, respectively. These values were lower than average coefficients of 2.9 and 3.0 for ammonium and phosphate, respectively, for other estuaries (Boynton and Bailey, 2008). Higher Q10 values by previous investigators have been attributed to wide ranges of sediment temperatures often observed in estuaries at higher latitudes (Twilley et al., 1999).
For our study, flux data are typically presented at the ambient temperature of the sediment when collected. Temperature-corrected values (to 25° C) were used to (1) compare fluxes among stations and (2) calculate annual fluxes because some stations were sampled only at temperatures that differed from 25°C by >3°C. To help account for lags between changes in sediment temperature and shifts in benthic fluxes, sediment temperatures at 30-days prior to flux determinations were used to calculate Q10 values.
Mapping the distribution of organic-rich sediments in the IRL was conducted using data from physical probing and lidar (light detection and ranging). Remote sensing of coastal estuaries via lidar has become a valuable resource for mapping vegetation, coral reefs, channels, mud banks and other features (Brock and Purkis, 2009; Proisy et al., 2009). For example, surveys in Mont-Saint-Michel Bay from 2002-2017 helped trace sediment import and export over time (Levoy et al., 2019). Such success in other estuaries motivated us to use ground-truthed lidar data in our research.
The natural neighbor tool in ArcGIS was used for spatial analysis of data for >1000 probed locations. Surface areas of major deposits were calculated using the surface volume tool in ArcGIS. Using these data and the depth of overlying water, unique bathymetric thresholds (-2 to -4m) were identified. These thresholds were then applied to lidar data using the surface volume tool to identify bathymetric features likely to contain discrete (well-defined boundaries) or continuous (no sharp boundaries) deposits. This technique was validated by comparing surface areas determined using the two methods; overall, surface areas determined from probing averaged 1.03 ± 0.18% surface areas determined via lidar.
3 Results
3.1 Sediment composition
The downcore composition of sediments in cores collected during Phase 1 was dominated by organic-rich sediment (Table 1). The mass percent of TOC in Phase 1 sediments averaged 5.3%. LOI at 550°C, an approximation of OM content, correlated very strongly with TOC (r = 0.96, p <0.0001). Where observed in some cores, large ranges for TOC and LOI in cores were due to mixtures of fine-grained, organic-rich sediment with shell and sand. Shell fragments averaged 20.5% (as CaCO3) of dry sediment and peaked at 65.2%. Atomic ratios for Si/Al ranged from 2.9-41; the highest ratios were in Si-rich quartz sand that contained <1% Al. Despite intermittent sand and shell components, ~80% of the sediment samples had >3% TOC (>10% LOI). Mass percents of TN and TP averaged 0.53% and 0.092%, respectively, with ranges of 30-fold for TN and 9-fold for TP. This diverse suite of samples facilitated our assessment of the relative importance of sediment composition to the magnitude of benthic fluxes of ammonium and phosphate.
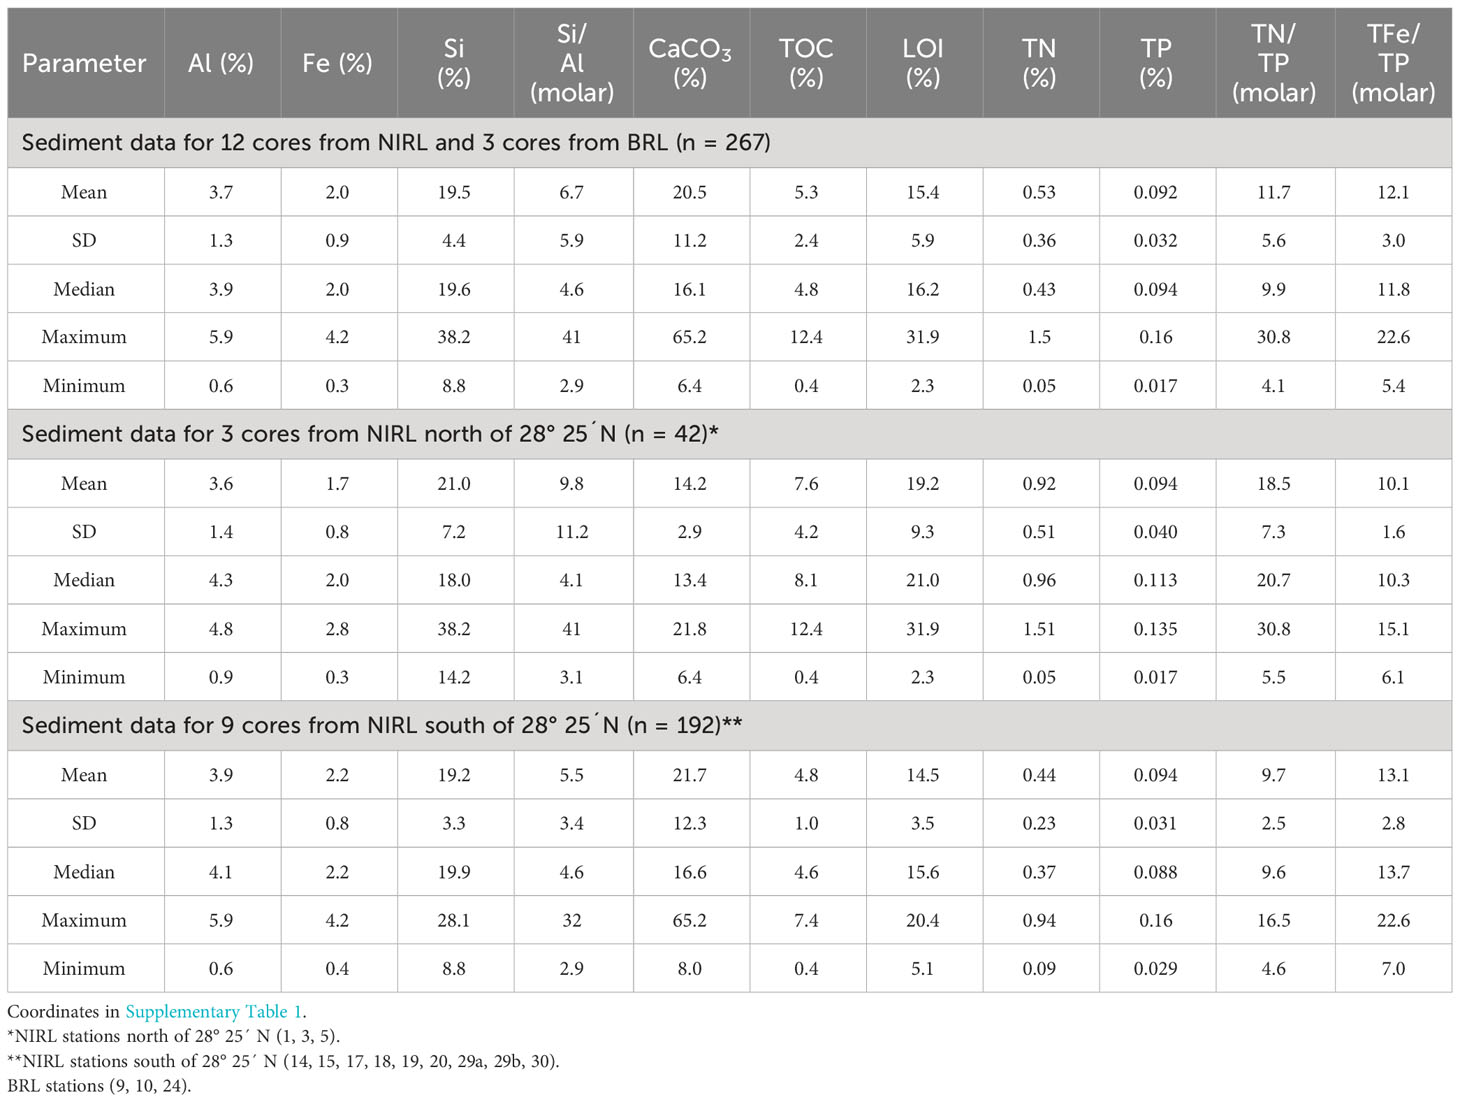
Table 1 Means, standard deviations (SD), medians, maxima and minima for chemical parameters for sediment cores collected throughout our study area in North Indian River Lagoon (NIRL) and Banana River Lagoon (BRL) plus data for stations in NIRL north of 28° 25´ N and stations in NIRL south of 28° 25´ N (Figure 1).
Chemical data from Phase 1 sediments provided a representative overview for organic-rich sediments in the NIRL and BRL. Mass percents of TOC and LOI paralleled Al downcore at all four stations because adsorption of OM is favored on fine-grained, Al-rich aluminosilicates (Figures 2A–D). TOC values were uniform downcore for stations 20 and 30 with overall averages of 4.8 ± 0.4% and 6.1 ± 0.4% respectively (Figures 2B, D). In contrast, average TOC values in cores from stations 17 and 29 decreased from 5.6% and 4.6%, respectively, at the surface to <4% at the base of the cores where more sand and shell were present (Figures 2A, C, E, G). Downcore trends for TN and TP followed results for TOC at all four stations (Figure 2). Ranges for TOC, TN and TP in sediment cores foreshadowed corresponding differences in interstitial water profiles and benthic fluxes of ammonium and phosphate.
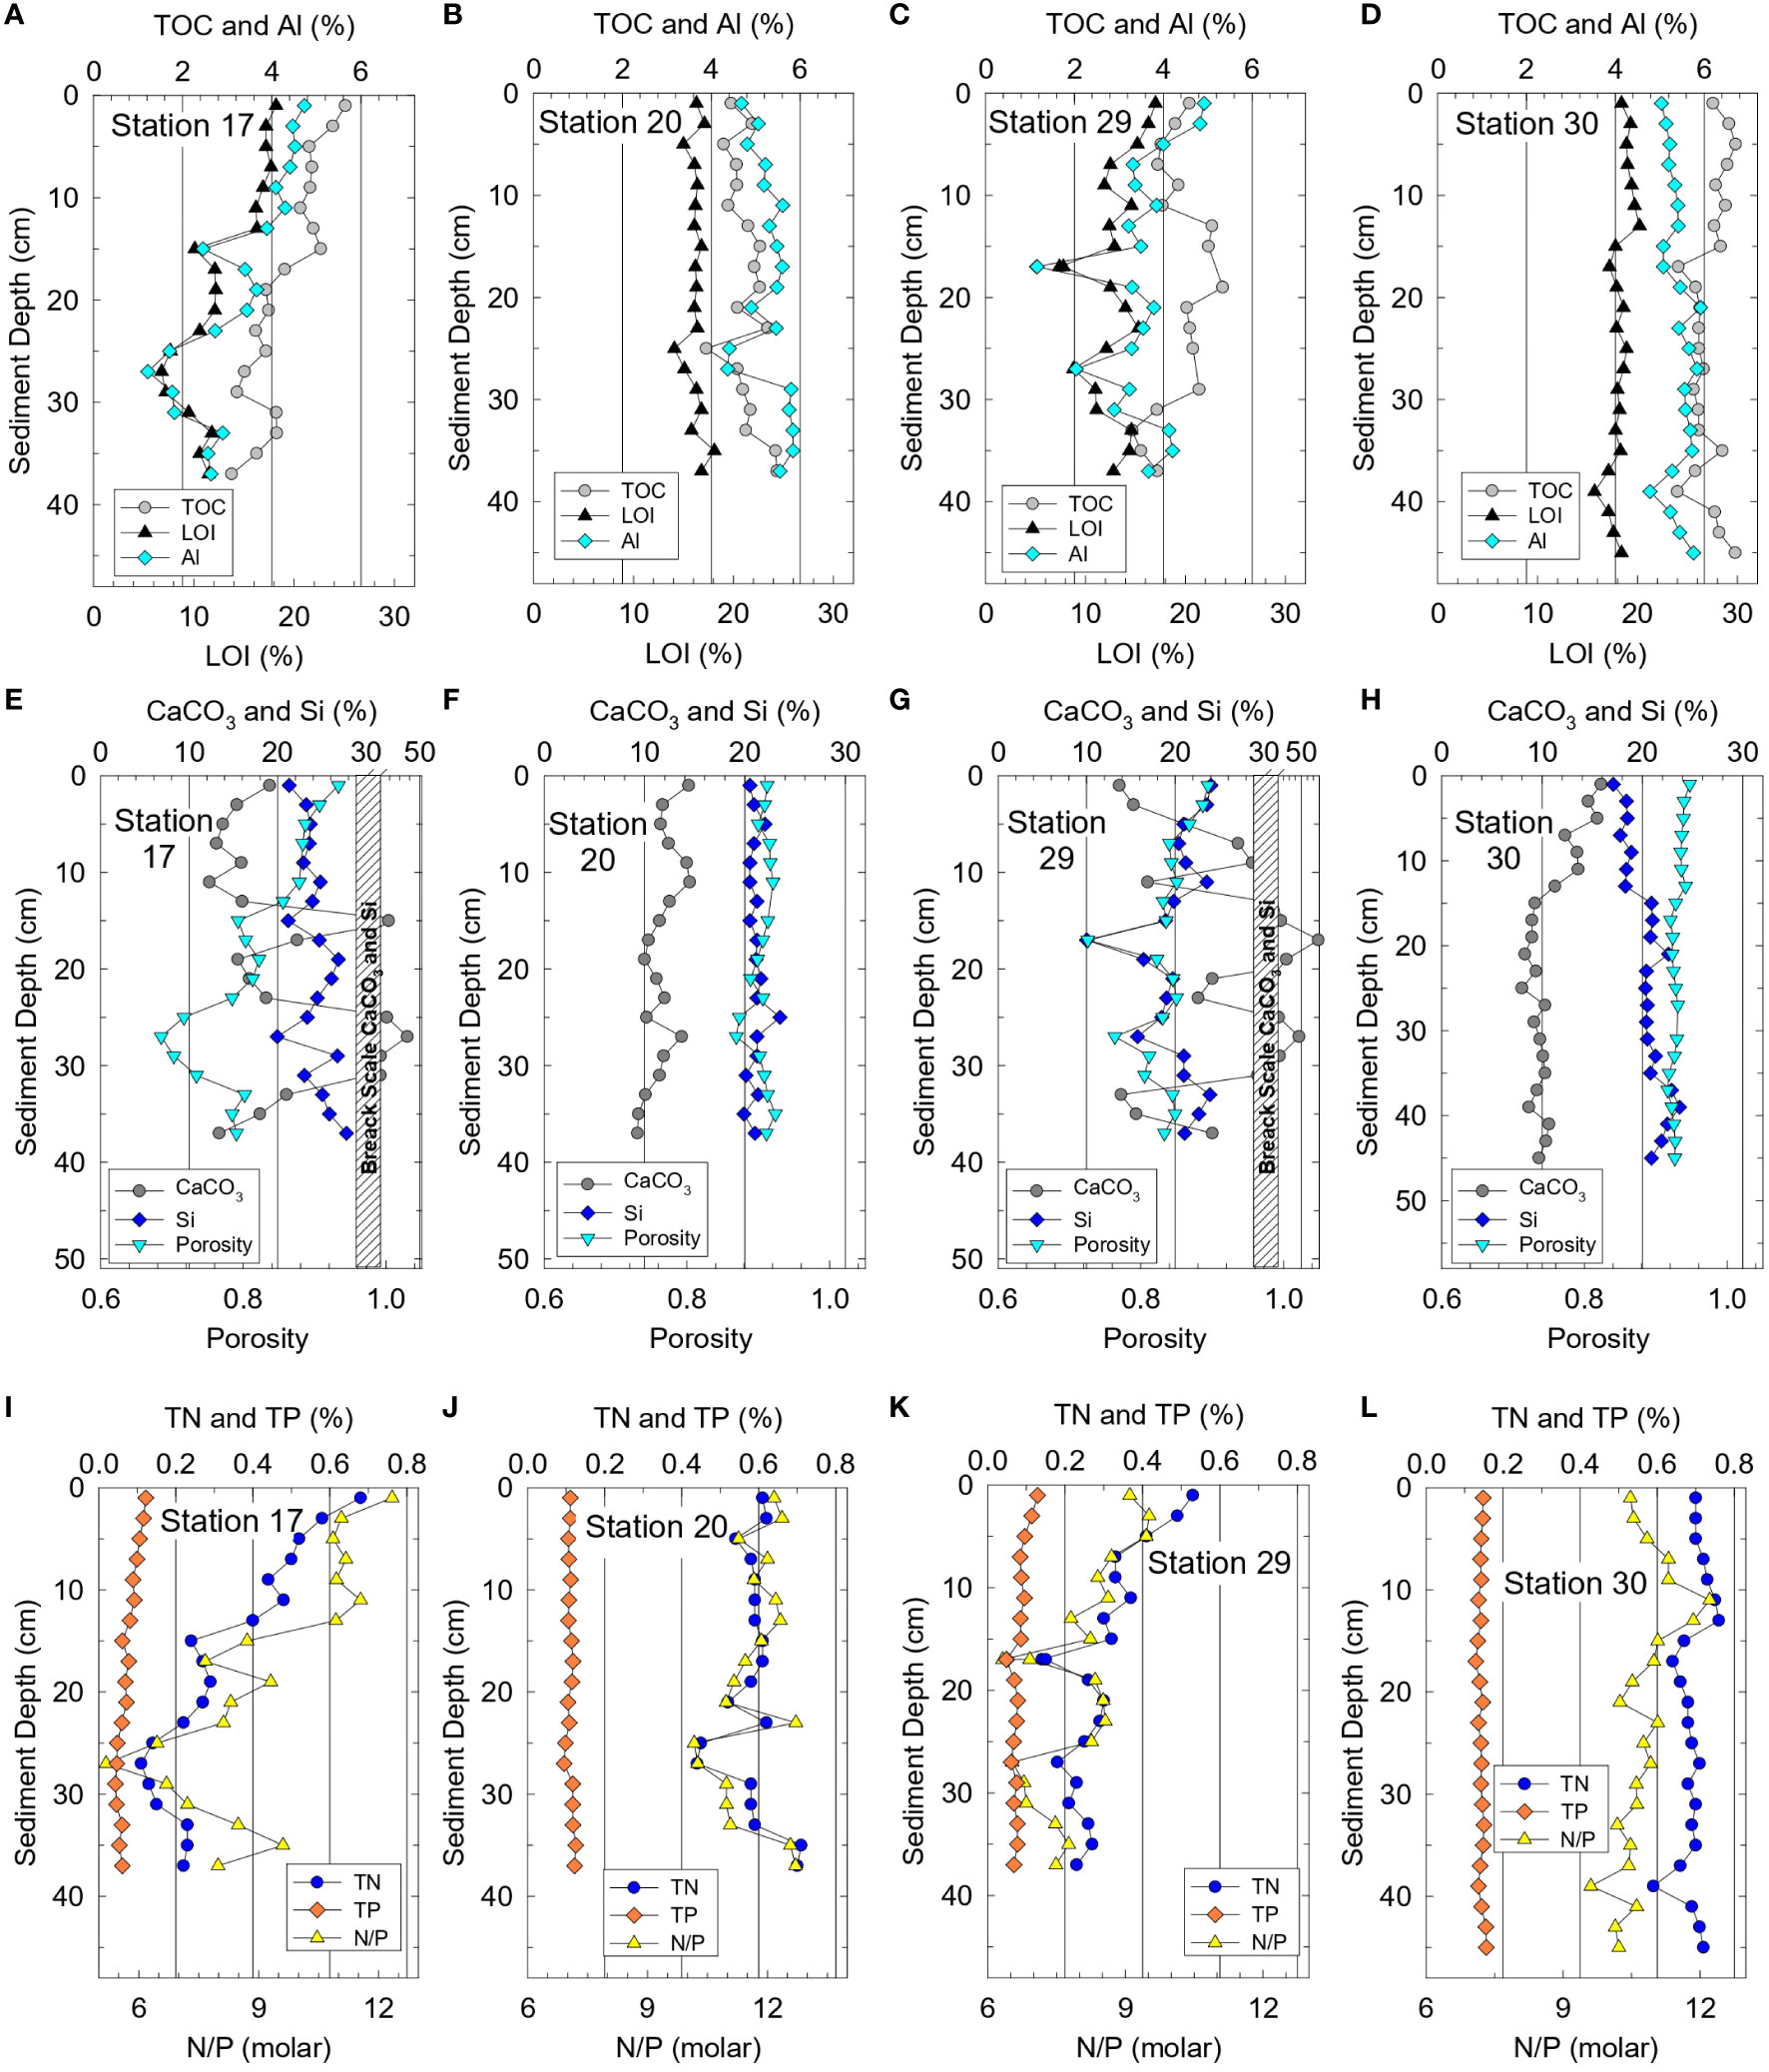
Figure 2 Vertical profiles for sediment at stations 17 and 20 (near Rockledge) plus 29 and 30 (near Eau Gallie, Figure 1) for (A−D) total organic carbon (TOC), loss on ignition (LOI) at 550°C and aluminum (Al), (E−H) calcium carbonate (CaCO3), silicon (Si) and porosity, and (I−L) total nitrogen, (TN), total phosphorus (TP) and TN/TP ratios.
Within the complete Phase 1 data set, quantities of some constituents differed between the northern and southern parts of our study area. For example, sediment TOC and TN for NIRL north of 28° 25´ N were significantly higher by 1.6- to 2.1-fold (p <0.0001) relative to the area south of 28° 25´ N (Table 1; Figure 1). In sharp contrast, concentrations of sediment TP averaged the same in each area and average concentrations of Al varied by only 0.3% Al between the two areas (Table 1).
Phase 2 was designed to obtain a larger data set for benthic fluxes of ammonium and phosphate and thereby improve estimates of internal inputs of N and P to NIRL. Measurements of just LOI and porosity were obtained during Phase 2 to streamline analyses while adequately identifying organic-rich sediments. The average value for LOI in surface sediments from Phase 2 (18.1 ± 4.8%; n = 352) was not significantly different from Phase 1 (18.3 ± 3.5; n = 15; p = 0.87; Table 2). Likewise, the average value for porosity for surface sediments from Phase 2 was not significantly different from Phase 1 (p = 0.63, Table 2). Thus, sediments sampled in Phases 1 and 2 were representative of similar organic-rich deposits.
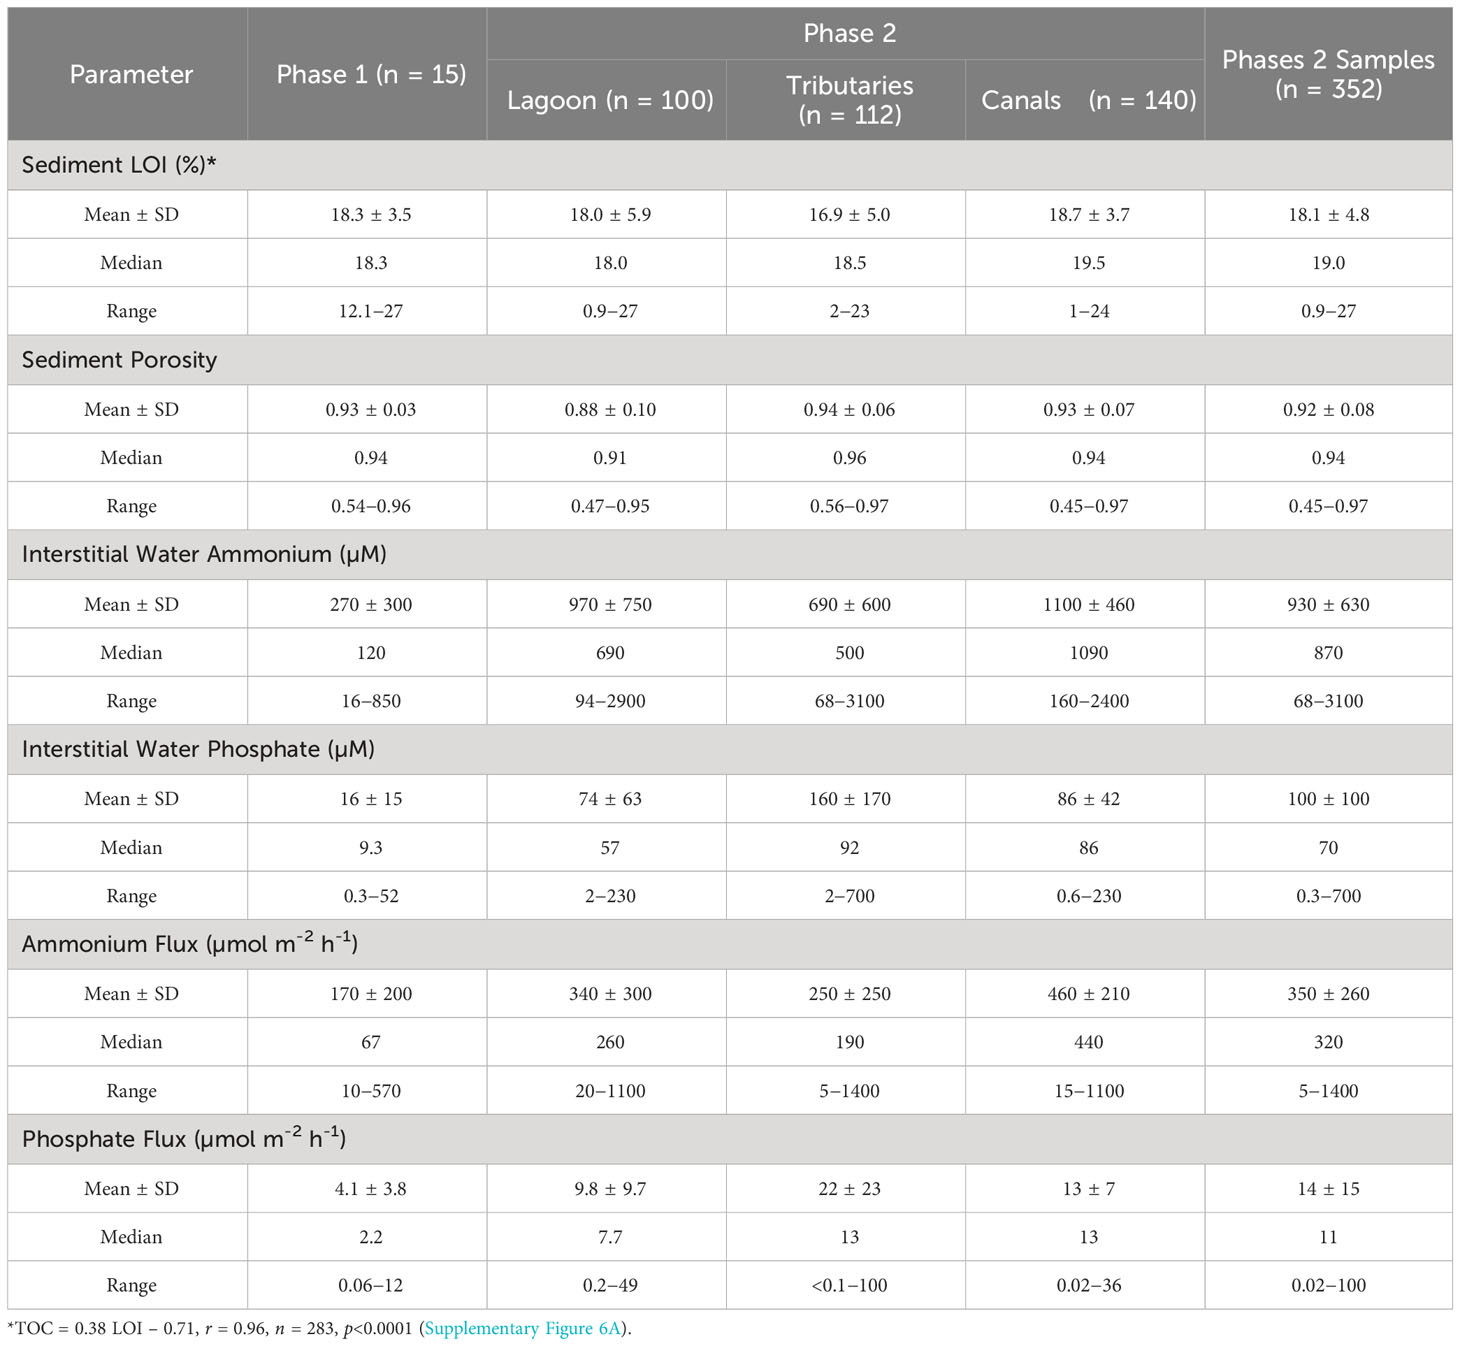
Table 2 Means ± standard deviations (SD), medians and ranges for loss on ignition (LOI) at 550°C, porosity and dissolved organic carbon for surface sediments and concentrations and benthic fluxes of ammonium and phosphate.
Stable isotope ratios varied among stations. Average δ13C values for sediments in Turkey Creek (station 31, -23.6 ± 1.1‰, n = 10) were significantly more negative than values for sediments from the open lagoon (-21.4 ± 0.4‰; n = 40, p <0.0001; Supplementary Table 2 and Supplementary Figure 2). More variability was observed for δ13C in the core from station 31 in Turkey Creek than for stations 17, 20 and 24 in the open NIRL (Supplementary Figure 2). A significant difference also was found for δ15N with Turkey Creek (4.4 ± 0.2‰, n = 10) having lower values than the open lagoon (4.9 ± 0.4‰; n = 40, p <0.0001).
3.2 Interstitial water
Chloride values for bottom water and surface layers of interstitial water during Phase 1 ranged from ~10-20 g kg-1 (Figures 3A, B; Supplementary Figure 3). Vertical profiles of interstitial chloride from the four stations sampled repeatedly showed either no changes or decreasing concentrations with depth (Figures 3A, B). Decreases in chloride concentrations with depth were found for stations in tributaries and on the mainland side of the lagoon (e.g., stations 20 and 30) versus stations farther from the mainland (e.g., stations 17 and 29) on the east side of the lagoon (Figures 3A, B; Supplementary Figure 3).
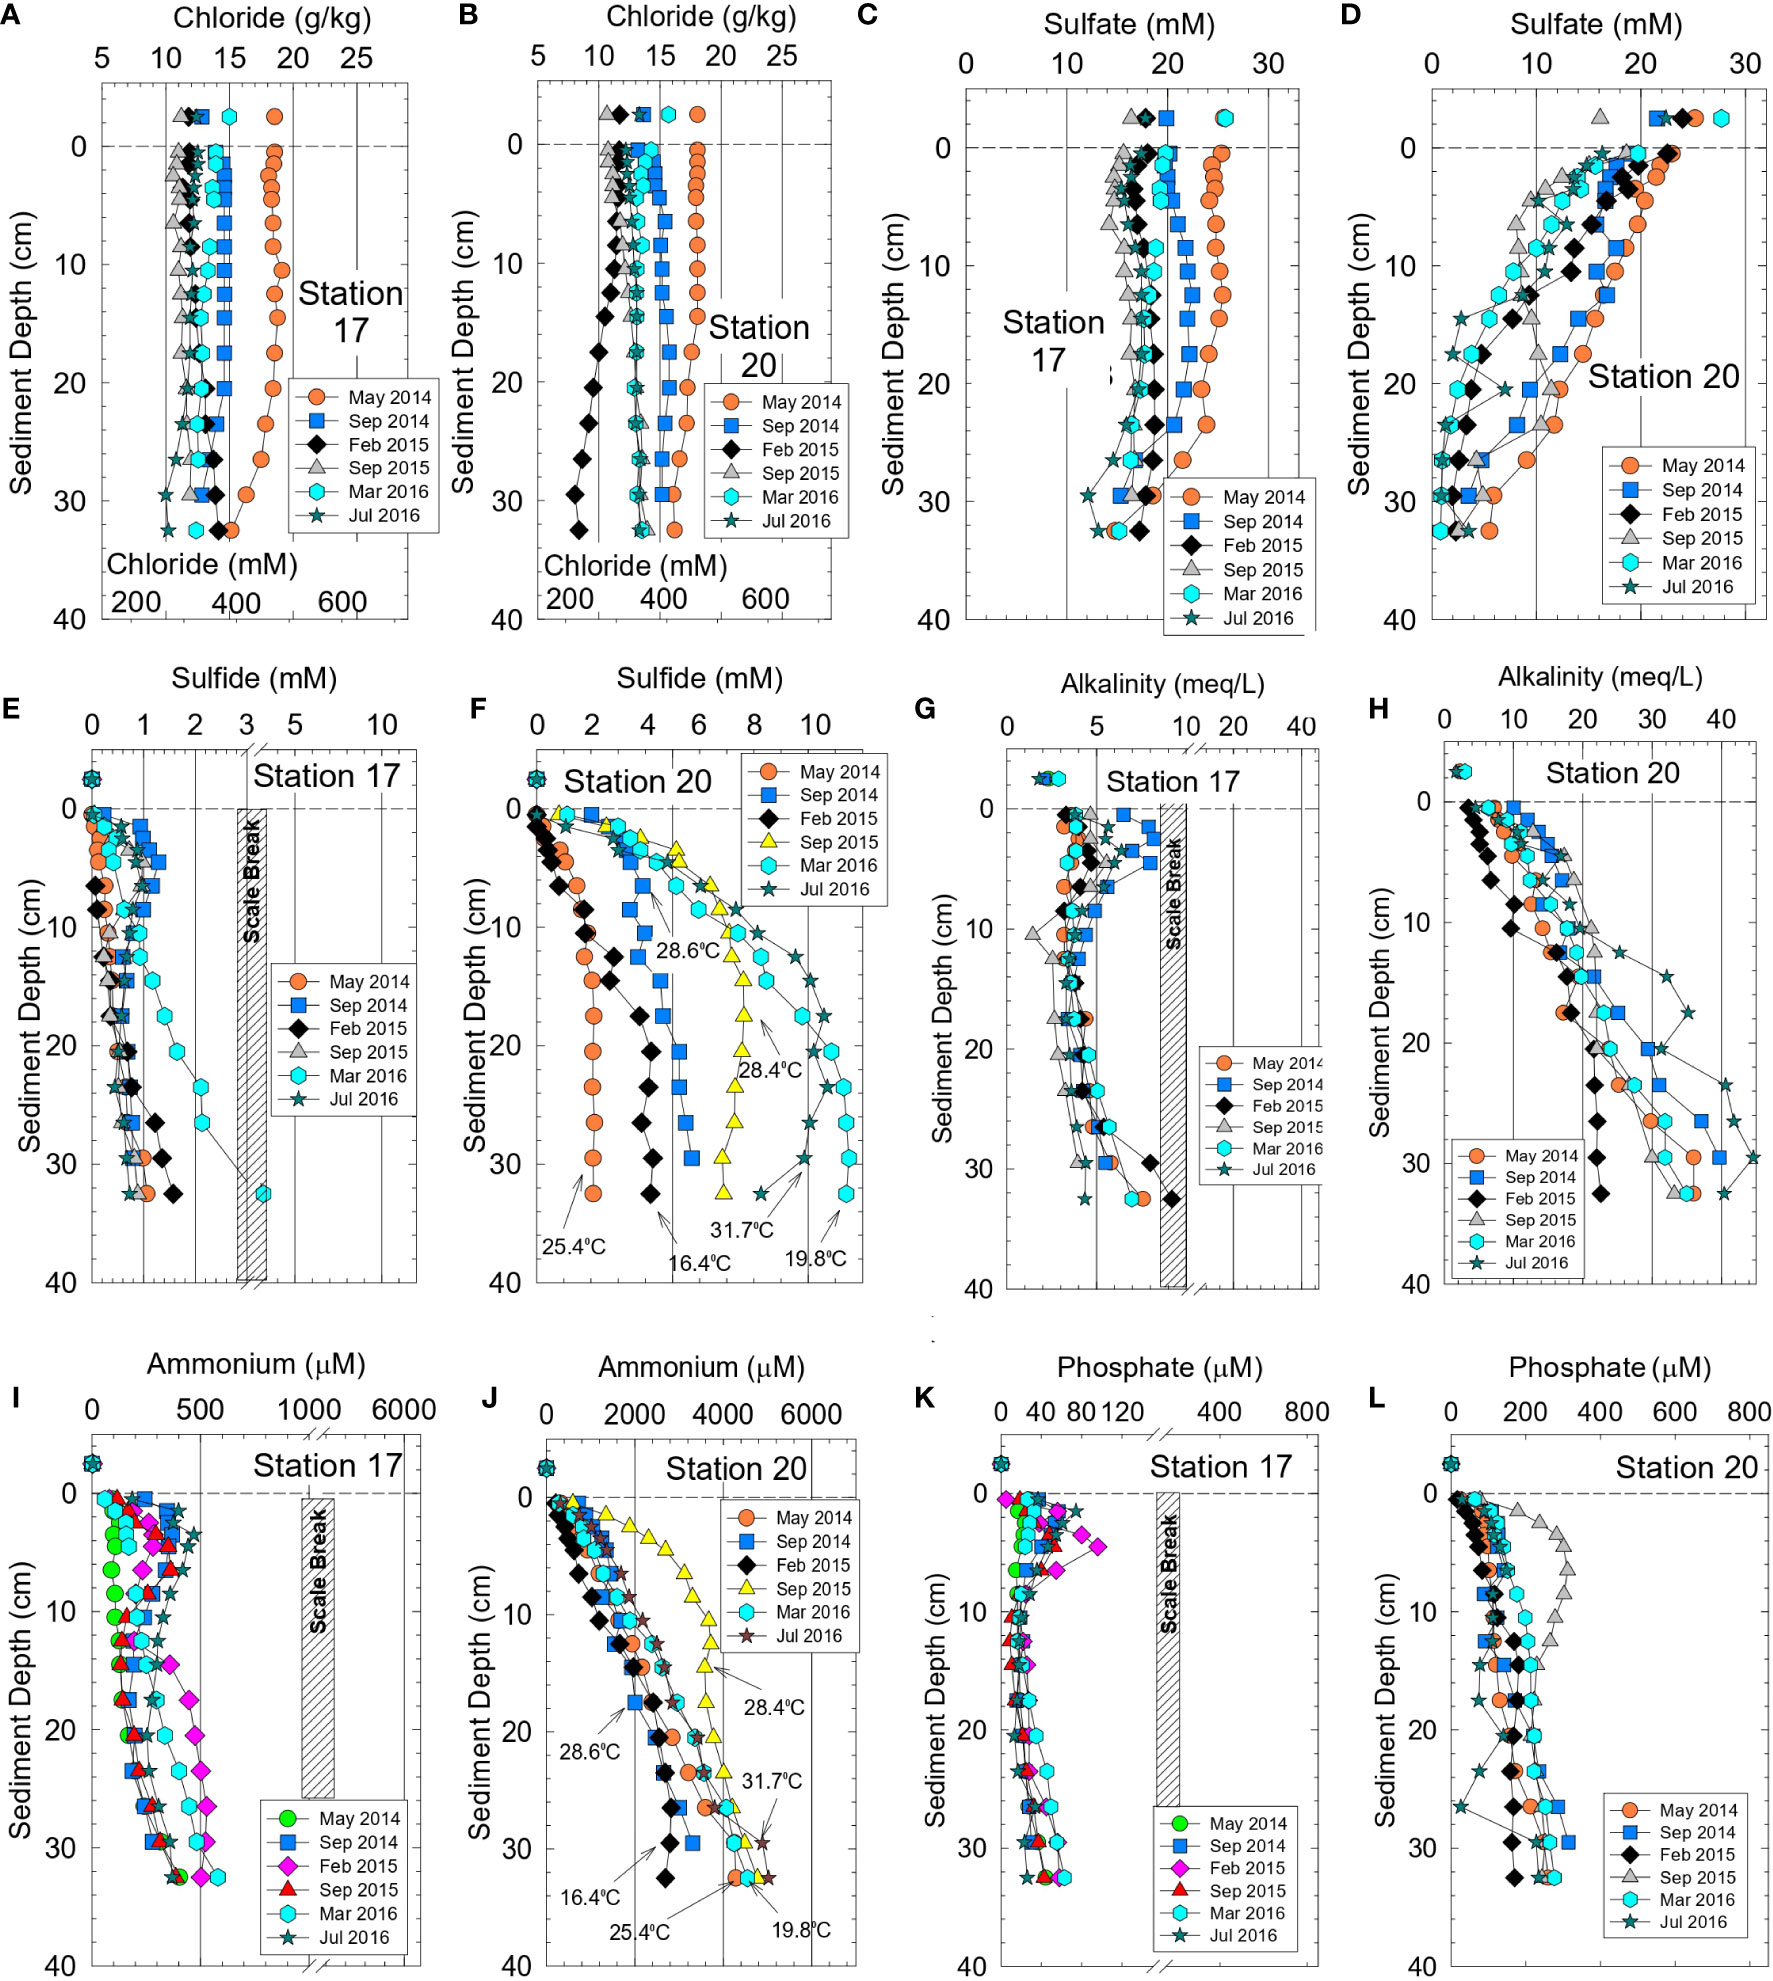
Figure 3 Bottom water values and vertical profiles for sediment interstitial water from stations 17 and 20 (near Rockledge) for (A, B) chloride, (C,D) sulfate, (E, F) sulfide, (G, H) alkalinity, (I, J) ammonium and (K, L) phosphate. Panel (F, J) show surface sediment temperatures. Temperatures for other locations in Supplementary Table 3.
Concentrations of sulfate in interstitial water sampled during Phase 1 ranged from 23 to <0.3 mM (Figures 3C, D). Sulfate concentrations were nearly constant with depth in cores from station 17 and molar ratios for sulfate to chloride of ~0.050 at the surface closely matched the ratio of 0.051 for seawater. At the bottom of the core from station 17, sulfate to chloride ratios only decreased to 0.045 ± 0.003, thereby indicating limited sulfate reduction (Figure 3C). In contrast, sulfate decreased by >80% within the top 10-15 cm at station 20 and sulfate to chloride ratios decreased to <0.006 at depth in the core, the result of greater amounts of TOC and near-complete sulfate reduction (Figure 3D).
Concentrations of interstitial sulfide and alkalinity were highly variable and inversely related to sulfate values. Maximum sulfide values were often >5 mM at station 20 versus 0.5-2 mM at station 17 (Figures 3E, F). Sulfide concentrations generally increased at higher temperature in response to enhanced sulfate reduction and increased bacterial activity (Figure 3F). Interstitial alkalinity at Phase 1 station 20 increased from ~2.4 meq L-1 in bottom water to 22-44 meq L-1 at a depth of 30 cm (Figure 3H). At station 17, alkalinity only increased from 2.6 meq L-1 in bottom water to 5-9 meq L-1 at the base of the core (Figure 3G).
Concentrations of interstitial ammonium, phosphate and DOC during Phase 1 varied by one to more than two orders-of-magnitude as a function of location and month (Table 2). For example, values for ammonium and phosphate were 10- to 20-fold higher for interstitial water from stations 20 and 30 than for stations 17 and 29 during Phase 1 (Figures 3I–L; Supplementary Figure 3) which is the same trend observed for alkalinity and sulfide. Higher concentrations of sediment TN and TP, as previously mentioned, were found in higher porosity, more-organic rich sediments from stations 20 and 30. Downcore concentrations of DOC mirrored alkalinity with much smaller increases in concentration at increased depth for stations 17 and 29 relative to 20 and 30 (Supplementary Figure 4).
During Phase 2, ammonium concentrations and δ15N values for ammonium in interstitial water were determined. Concentrations of ammonium (n = 352) ranged from 68−3100 µM with a median of 870 µM (Table 2). Highest median and maximum concentrations of ammonium during Phase 2 were found in residential canals and tributaries, respectively (Table 2). Average ammonium concentrations also were significantly higher during Phase 2 than Phase 1 (Table 2; p <0.0001), due to the much smaller dataset and different experimental design for Phase 1. Highest ammonium concentrations during both phases were at temperatures >25°C; however, temperature did not singularly control ammonium concentrations (Figure 3J). The highly reducing sediments in our study typically had <0.2 µM interstitial nitrate + nitrite, thereby making fluxes of these oxidized species of N inconsequential. δ15N values for ammonium in interstitial water collected from the lagoon, tributaries and canals averaged 6.88 ± 1.57‰ and ranged from 5.86 to 10.73‰ (Supplementary Table 3).
Phosphate concentrations for interstitial water during Phase 2 ranged from 0.3-700 µM with a median of 70 µM (Table 2). Analogous to ammonium, highest median and maximum phosphate concentrations were obtained in tributaries and residential canals (Table 2). Vertical profiles for interstitial ammonium, phosphate and other chemicals provided valuable insight to seasonal and spatial changes in the reservoir of pore water species available to supply benthic fluxes (Figure 3).
3.3 Water column parameters
Stratification at water temperatures >28°C, combined with high sediment oxygen demand for organic-rich sediments, sometimes led to decreases in dissolved oxygen saturation from 90 to >100% in surface water to a maximum of 20% and a median of <2% saturation (~5 µM) at the sediment-water interface. Transient hypoxic and anoxic water at the sediment-water interface helped support a more reducing sediment column that enhanced interstitial water concentrations and benthic fluxes of ammonium and phosphate. At a depth of 1 mm in all organic-rich sediments, the median sediment DO was <5 µM (Supplementary Figure 5). Concentrations of ammonium in bottom water typically ranged from ~2-5 µM, creating an interstitial water to bottom water ratio of 50-700 for organic-rich sediments (Figures 3I, J). Bottom water values for phosphate ranged from 0.08-1.6 µM relative to interstitial water values that were 50- to 200-fold higher (Figures 3K, L).
3.4 Benthic fluxes
Ammonium fluxes spanned a wide range of values (Table 2). Fluxes of ammonium calculated from vertical profiles for interstitial water during Phase 1 ranged from 10-570 µmol m-2 h-1 with a median of 67 µmol m-2 h-1 (Table 2). Values >200 µmol m-2 h-1 during Phase 1 were calculated for interstitial water at temperatures of ~28-32°C (Supplementary Table 4). At the four repeatedly sampled stations, ammonium fluxes averaged ~200 µmol m-2 h-1 when sediment temperatures were 28-32°C relative to ~100 µmol m-2 h-1 during months with temperatures of 16-23°C (Supplementary Table 4). Median ammonium flux during Phase 2 was ~4-fold higher than during Phase 1, a function of shifting from stations with varying amounts of OM for a collaborative study during Phase 1 to collecting only organic-rich sediments (>10% OM) during Phase 2 (Table 2). Highest average and median fluxes of ammonium were obtained for residential canals (Table 2). Maximum ammonium flux was 1400 µmol m-2 h-1 for Turkey Creek at ~31°C (Table 2).
Median fluxes for phosphate during Phase 1, like ammonium, were 5-fold lower than during Phase 2 due to different foci for samples (Table 2). Phosphate fluxes during Phase 1 ranged from 0.06-12 µmol m-2 h-1 with a median of 2.2 µmol m-2 h-1 (Table 2). Fluxes at the four repeatedly sampled stations during Phase 1 averaged 12 ± 7 µmol P m-2 h-1 and ranged from 2-30 µmol P m-2 h-1 (Supplementary Table 4). The highest phosphate flux during Phase 2, 100 µmol m-2 h-1, was observed at a temperature of ~29°C.
3.5 Distribution of organic-rich sediments
A map showing the spatial distribution of organic-rich sediments in NIRL and BRL was developed using our data from physical probing at >1000 locations plus applicable NOAA lidar data (Figure 4; National Oceanic and Atmospheric Administration [NOAA], 2022). Previous probing and acoustic surveys (Trefry et al., 1990; Foster et al., 2018) provided a valuable template for the present map (Figure 4). Organic-rich deposits were categorized as follows: (1) discrete deposits with separate, well-defined boundaries identified by physical probing, (2) discrete deposits identified via lidar and (3) continuous deposits with no sharp boundaries identified via lidar or probing.
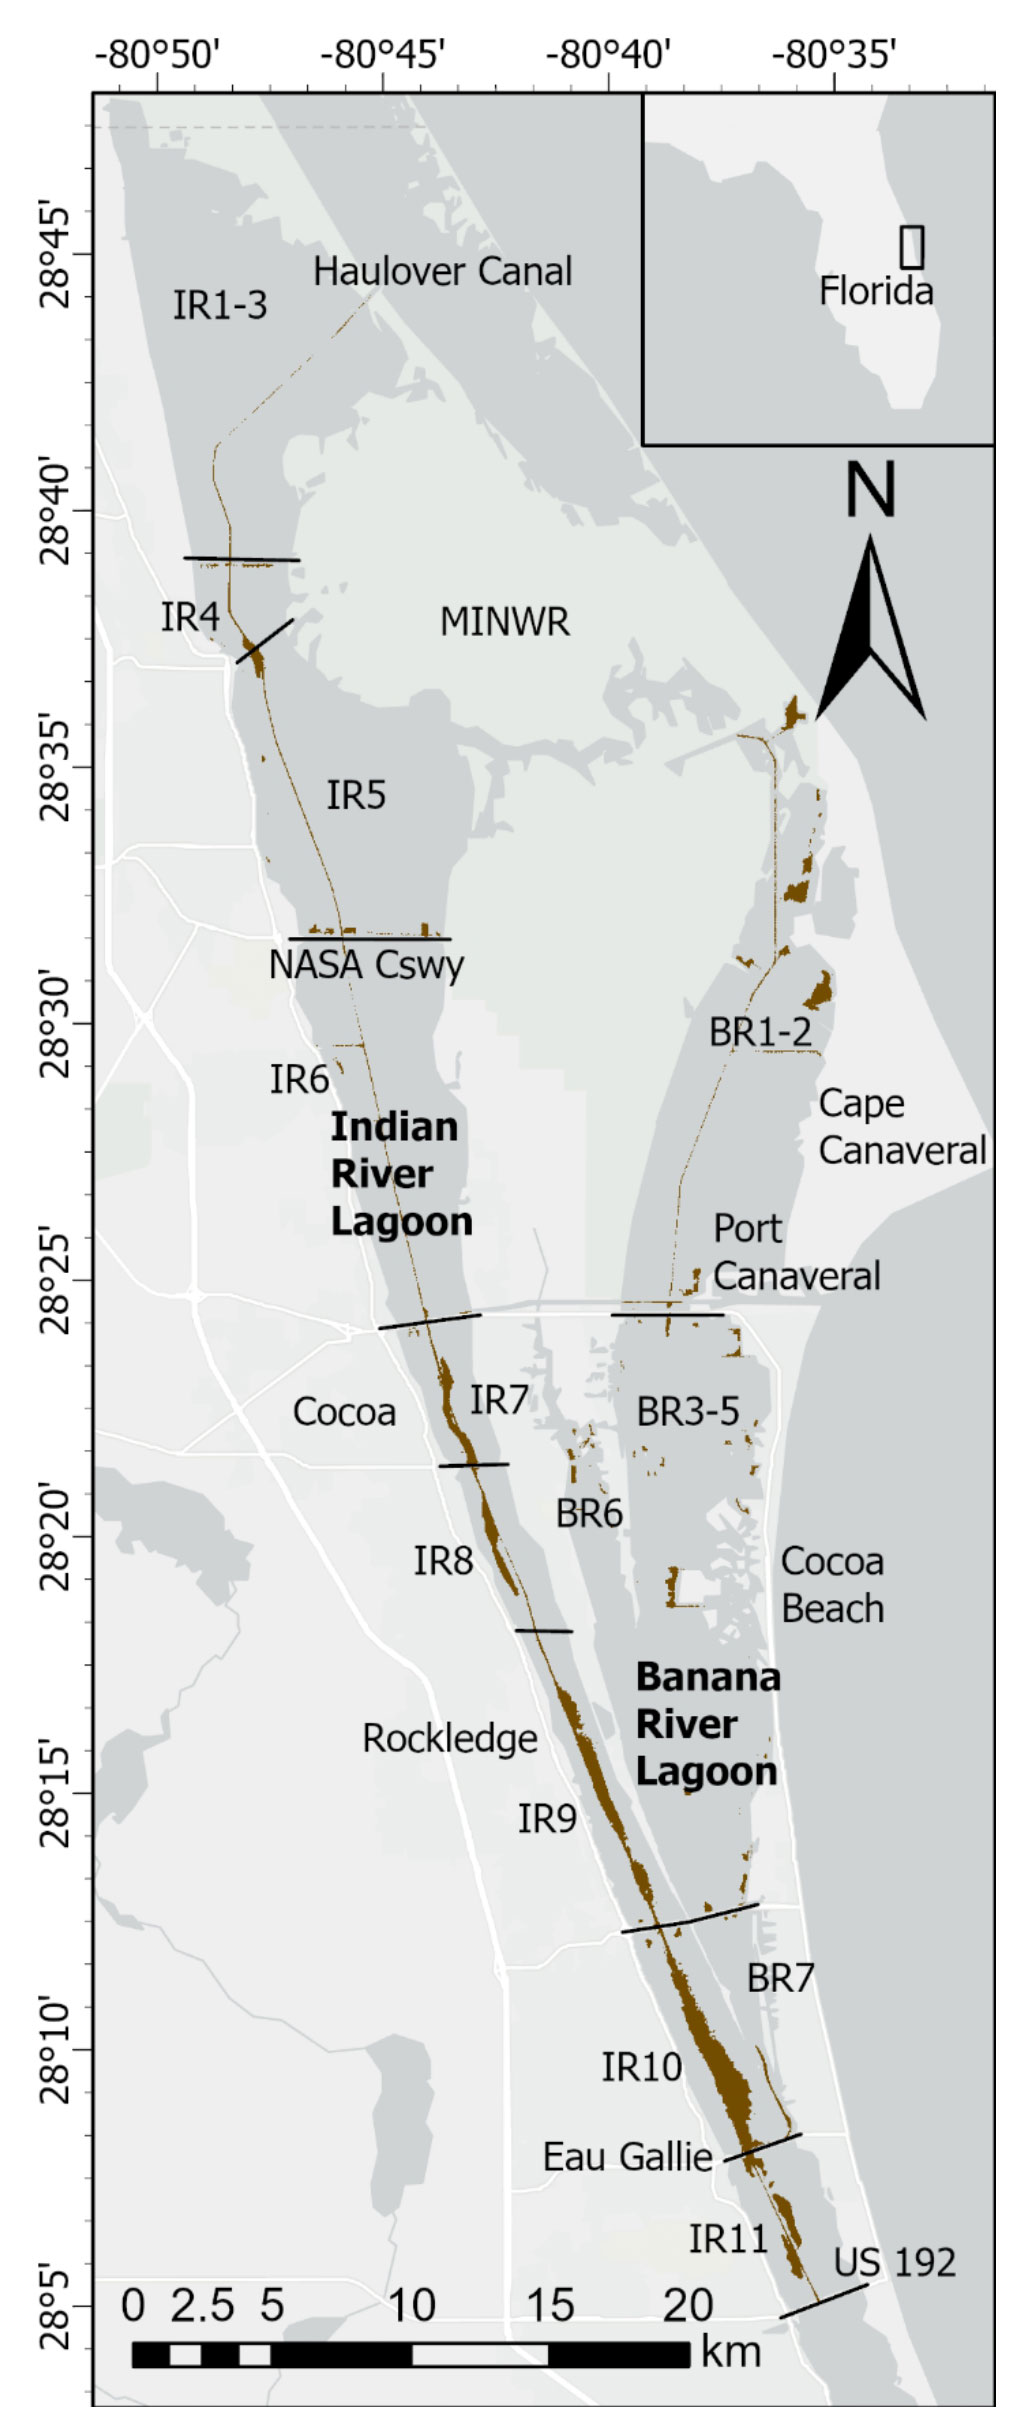
Figure 4 Map with brown shading showing locations of organic-rich (>3% organic carbon) sediments in North Indian River Lagoon (NIRL) and Banana River Lagoon (BRL). NIRL and BRL are divided into 11 and 7 segments, respectively. Some segments have been grouped to match data for external loading of nutrients by Gao (2009). Merritt Island National Wildlife Refuge (MINWR).
Surface areas for selected organic-rich deposits determined by probing were compared with results from geospatial analysis using available lidar data for major deposits in NIRL (Table 3). These major deposits had surface areas that ranged from 0.08−0.60 km2 and totaled ~3 km2 in NIRL and ~1 km2 in BRL (Table 3). Ratios of surface areas from probing to those from lidar ranged from 0.75-1.38 and averaged 1.03 ± 0.18 (Table 3). For example, the surface area of the discrete deposit at station 11 determined by probing was ~16% greater than by lidar; both methods captured the main features of the deposit (Table 3; Figure 5). Similar agreement was obtained for the discrete deposit at station 22 (Figures 5C, D; Table 3).
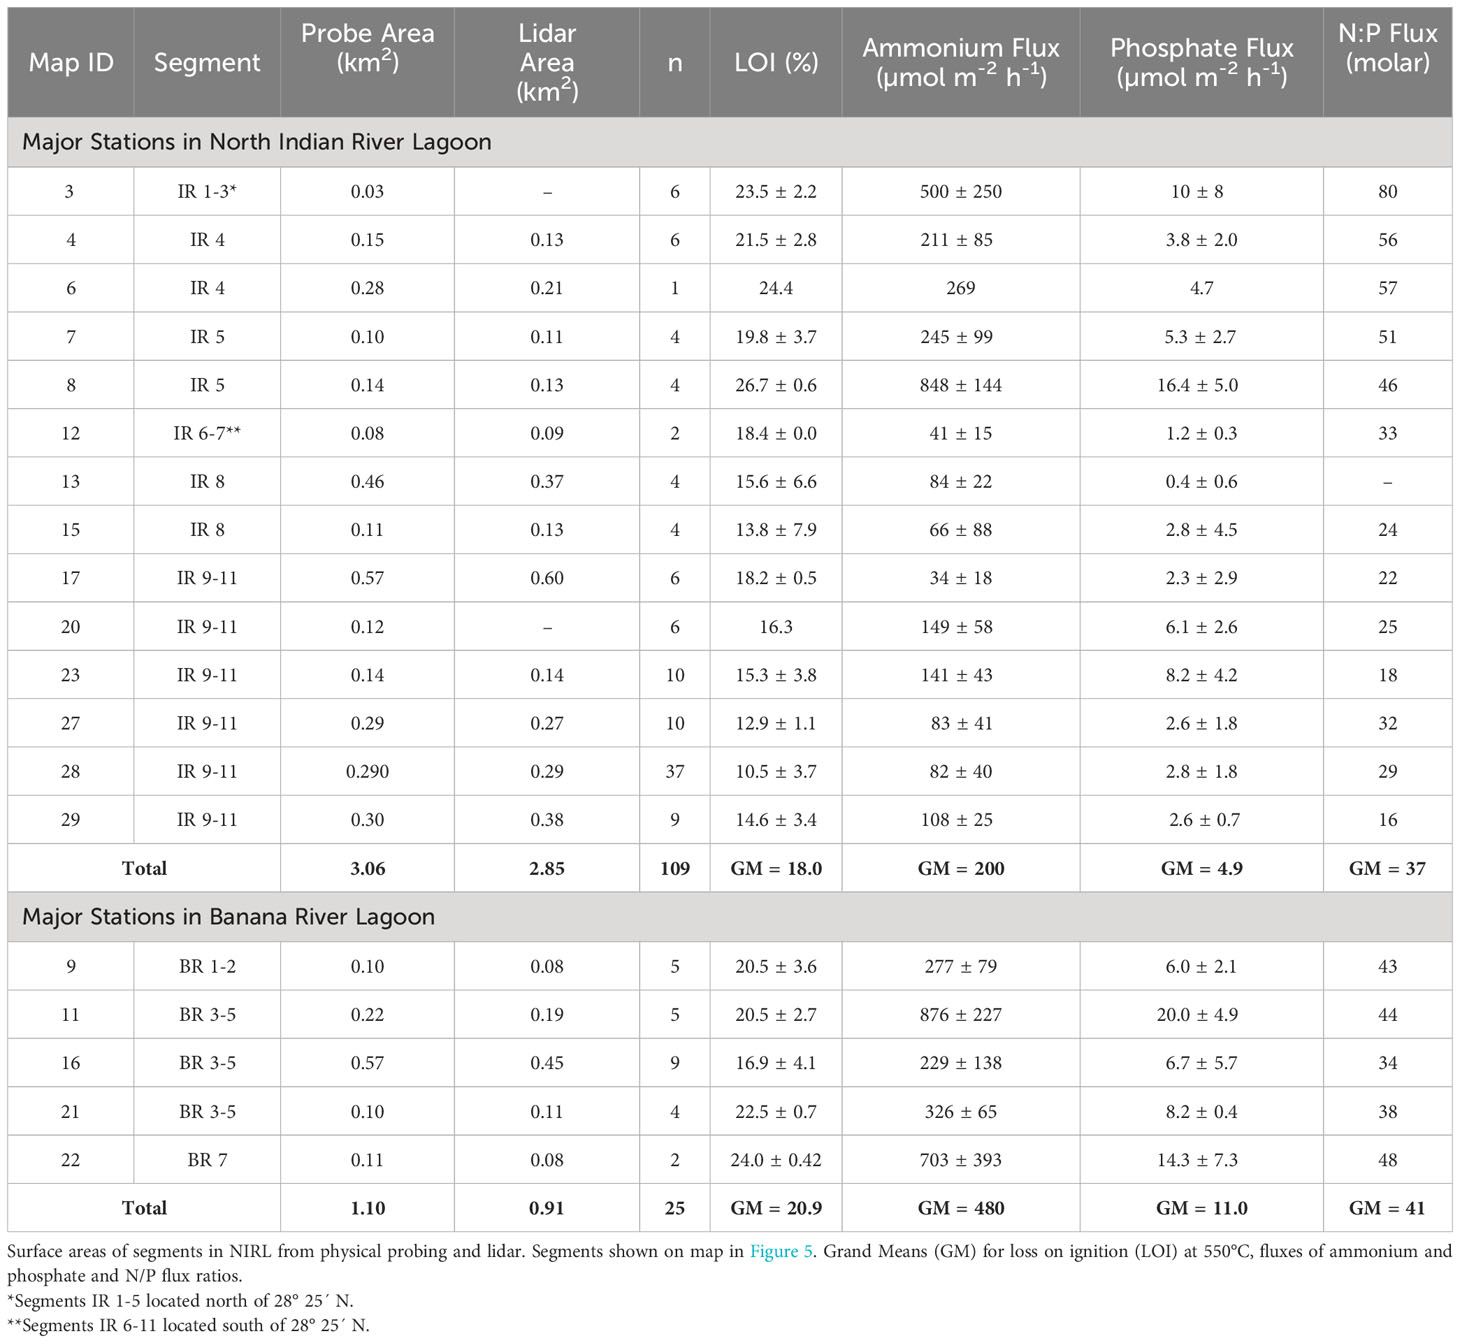
Table 3 Benthic fluxes of ammonium and phosphate normalized to 25°C and N/P flux ratios for major deposits of organic-rich sediments from North Indian River Lagoon (NIRL) and Banana River Lagoon (BRL).
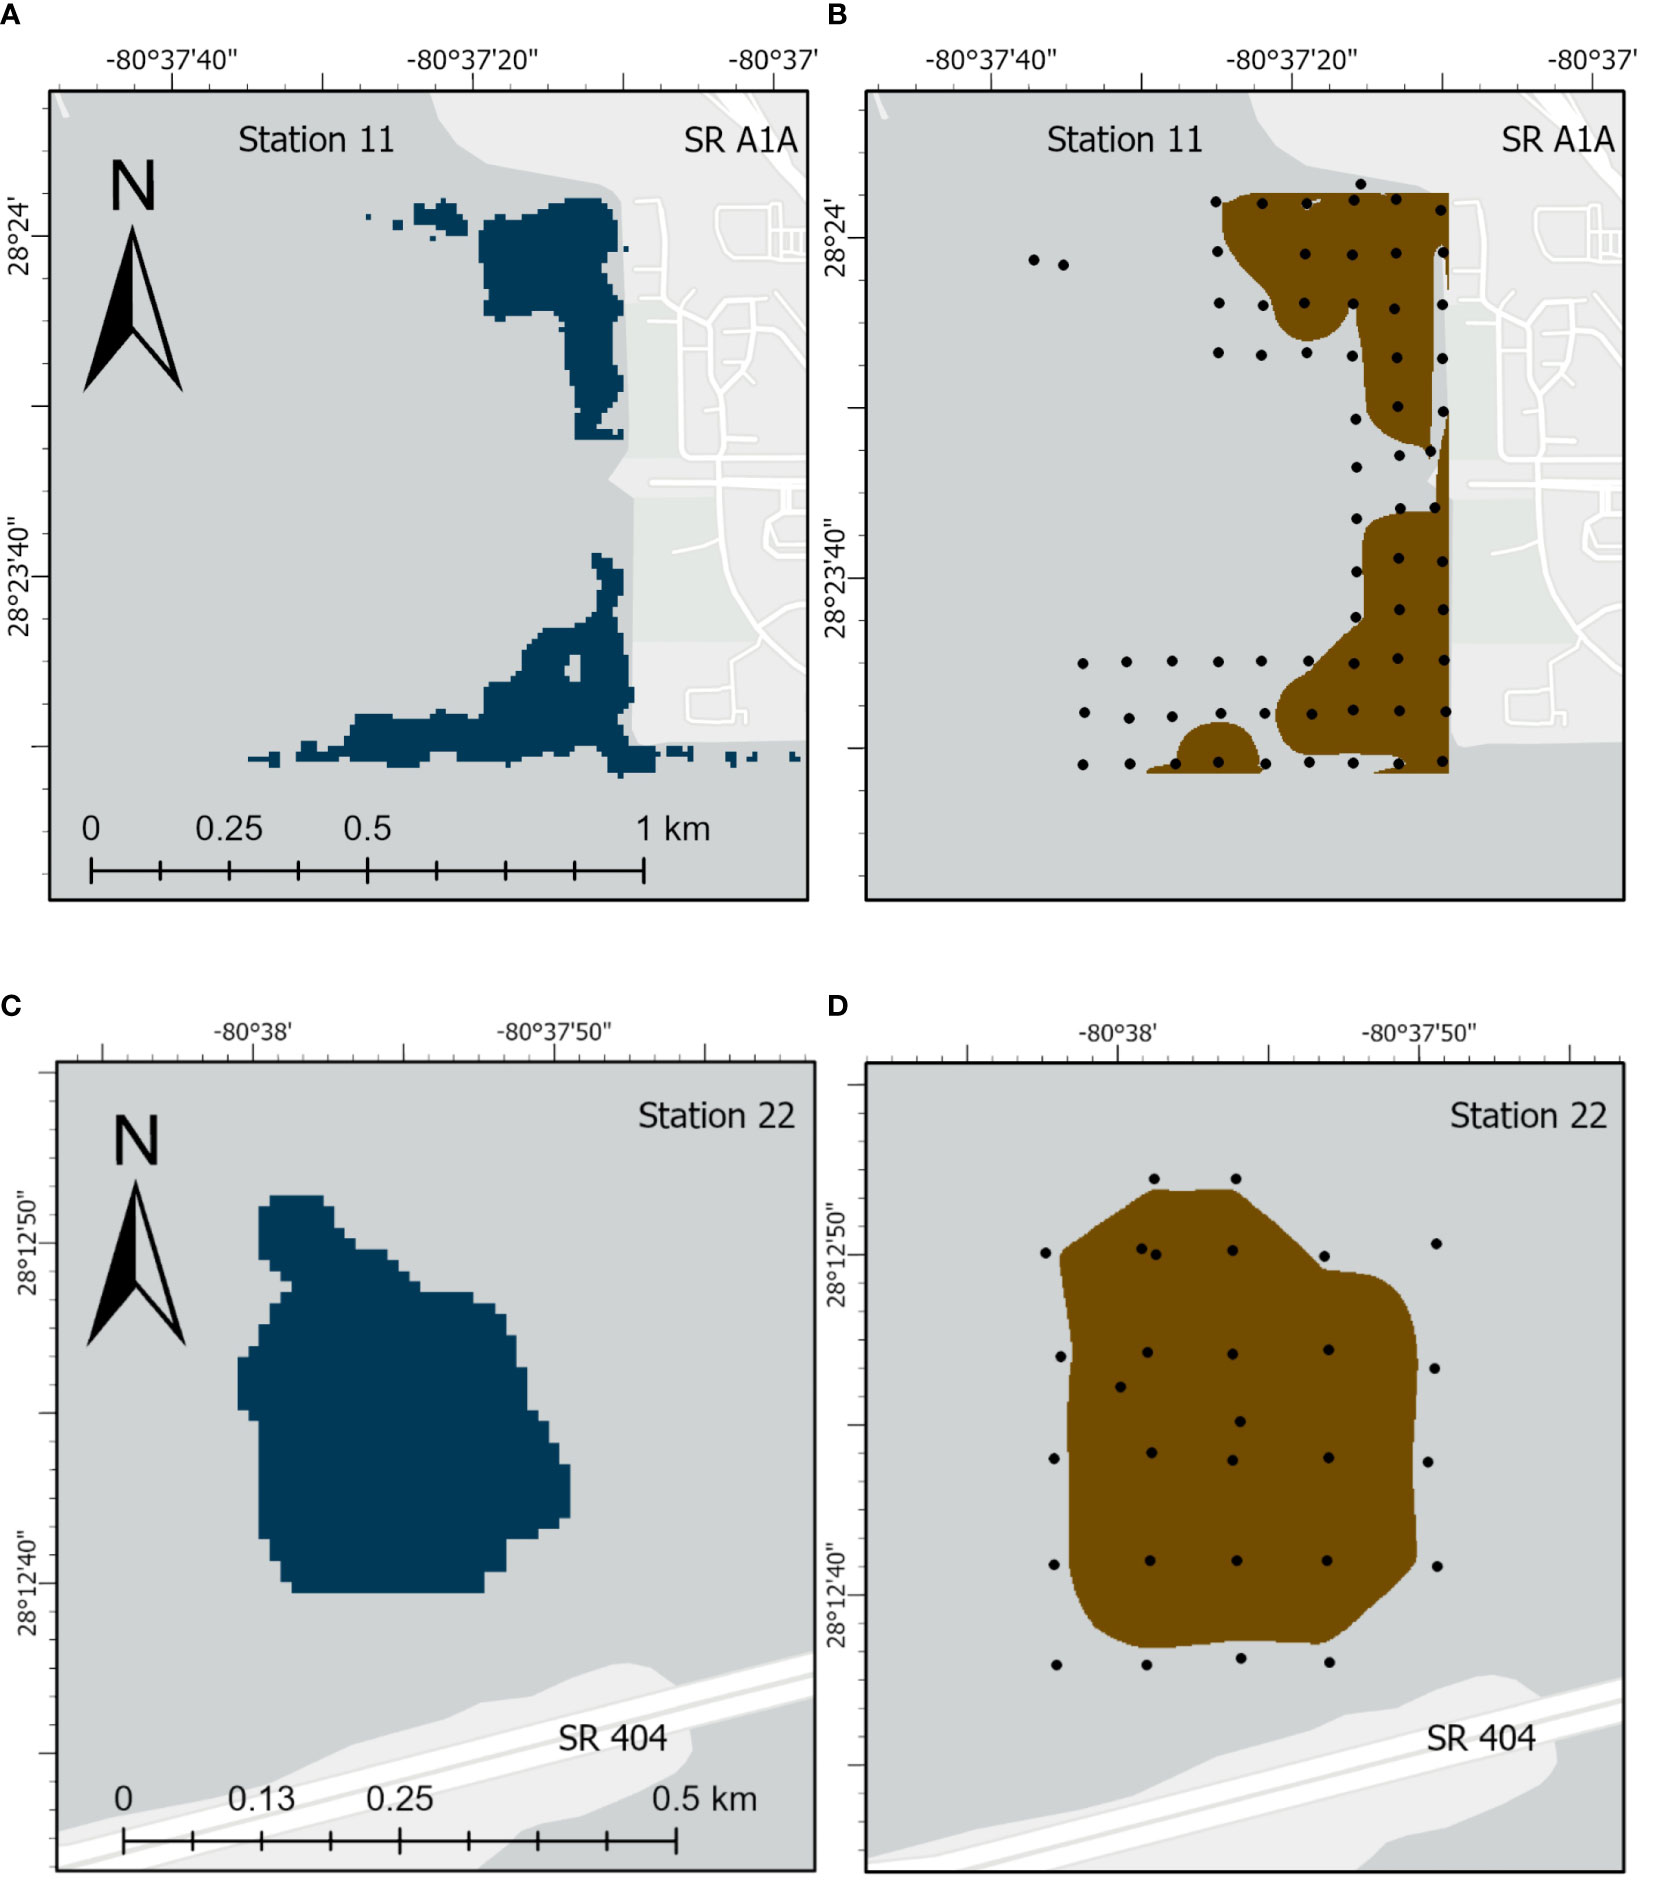
Figure 5 Images for deposits of organic-rich sediments for station 11 from (A) lidar and (B) physical probing and for station 22 from (C) lidar and (D) physical probing. State Road (SR).
Collectively, organic-rich sediments covered 14.5 km2 in NIRL (Table 4) and included the following: 3.1 km2 of large, discrete probed deposits, 2.0 km2 of discrete deposits in the ICW and 9.4 km2 of continuous, organic-rich sediments in deeper dredge pits (>4 m, Supplementary Table 5). The 2.0 km2 area of organic-rich sediment in the ICW was calculated using a value of 50% coverage from Trefry et al. (1990); Trefry and Trocine (2011), and this study.
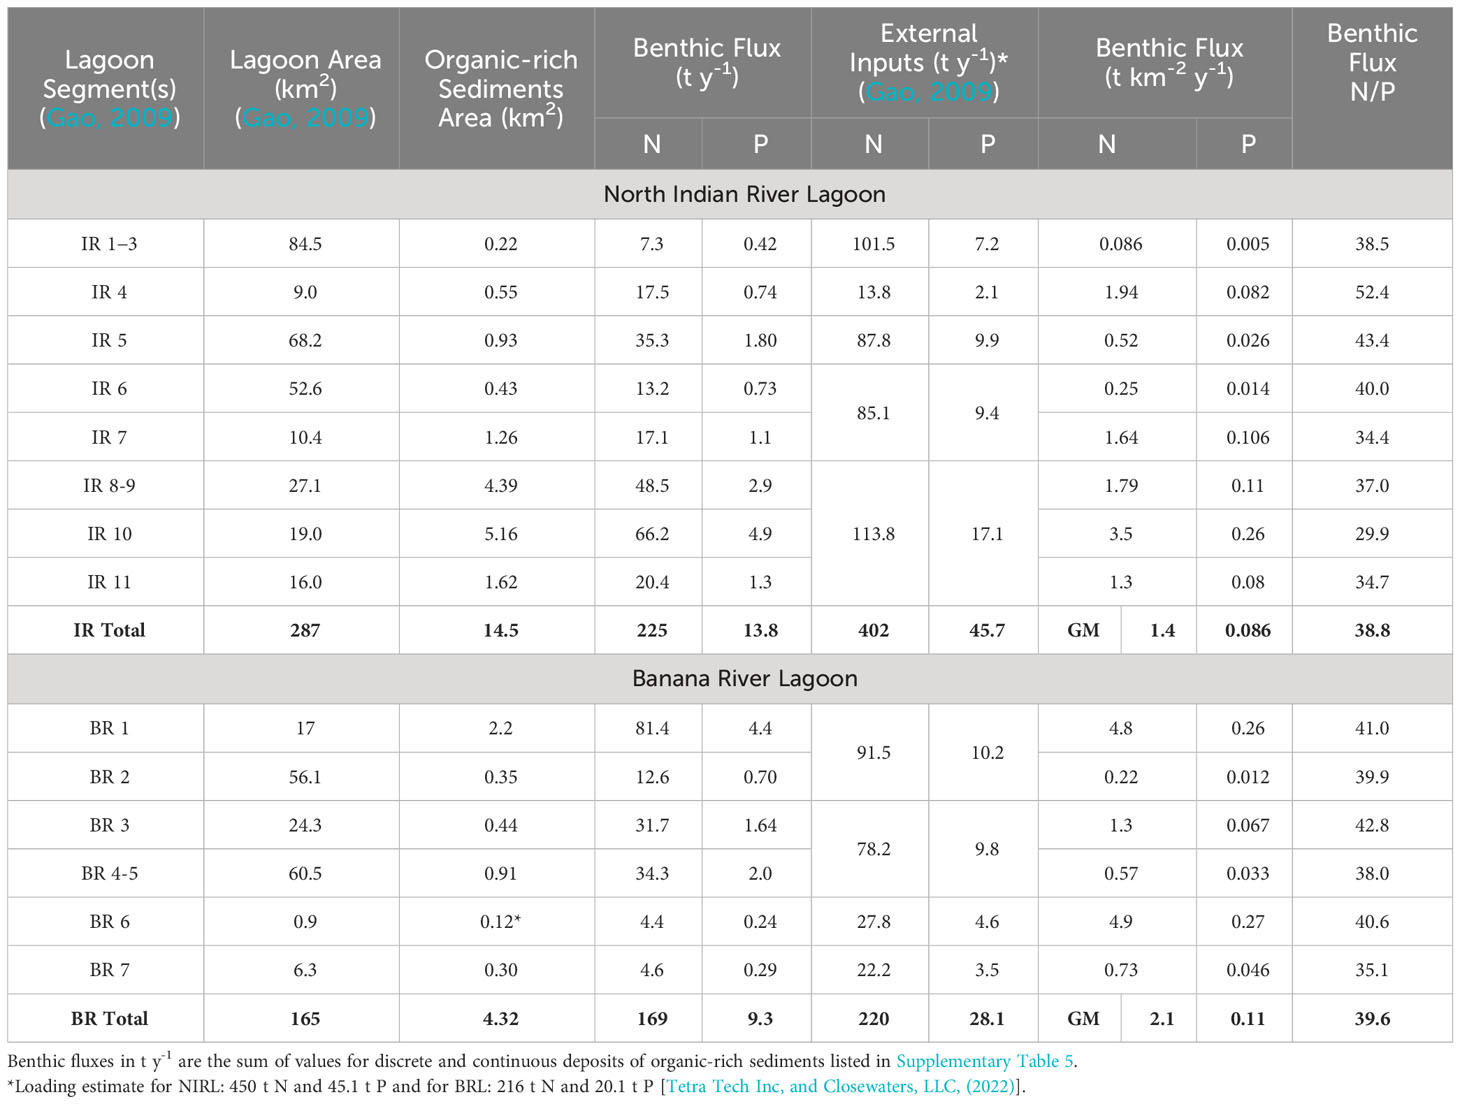
Table 4 Benthic fluxes, external inputs, and nitrogen/phosphorus (N/P) flux ratios for segments of North Indian River Lagoon and Banana River Lagoon.
In BRL, 4.32 km2 of organic-rich sediment (Table 4) were identified as follows: 1.1 km2 of probed discrete deposits, 2.98 km2 of large discrete deposits identified via lidar and 0.24 km2 of continuous deeper (>4 m) deposits (Supplementary Table 5). The largest area (2.98 km2) included 0.61 km2 in channels and 2.37 km2 in dredge pits between Merritt Island National Wildlife Refuge and Cape Canaveral Space Force Station (Figure 4).
Lidar data helped find previously undiscovered bathymetric features that could harbor organic-rich deposits (Figure 4). Deposits found via lidar were at the following locations: (1) portions of the ICW, (2) broad deposits in water deeper than 4 m and typically adjacent to the ICW, (3) large dredge pits mostly in BRL north of Port Canaveral and (4) numerous, smaller dredge pits (Figure 4).
Overall, organic-rich deposits were known to collect predominantly in depressions >2 m deep, including dredged borrow pits and navigational channels (Trefry et al., 1990; Foster et al., 2018). In contrast, deeper areas (>3-4 m) created by active scour in passages through causeways usually did not contain organic-rich sediments. Clearly, water depth, flow and proximity to upstream sources combine to yield complex controls on the distribution of fine-grained, organic-rich sediments in the shallow NIRL.
4 Discussion
4.1 Physicochemical controls on benthic fluxes and flux ratios of ammonium and phosphate
Boynton et al. (2017) summarized the following key controls on the magnitude and composition of benthic nutrient fluxes for 167 estuaries and coastal systems globally: (1) oxygen concentrations in bottom water, (2) sediment temperature, (3) quantity and lability of organic matter and (4) modification of sediment composition by mixing by infauna. The relative importance of these and other variables is, of course, dependent on the system studied. Data for organic-rich, high porosity sediments in sub-tropical systems, such as IRL, help support and expand our understanding of variables controlling fluxes.
Average fluxes of ammonium and phosphate from organic-rich NIRL sediments (Table 2) were ~300% and 30% higher, respectively, than averages of 91 µmol m-2 h-1 and 11 µmol m-2 h-1 in the Boynton et al. (2017) database from chambers/sediment incubation. Such high fluxes in NIRL were consistent with average TOC values >5%. In contrast, sediments in the global database had TOC <3% in 77% of the samples; TOC was rarely >5% (Boynton et al., 2017). Recent results from Chesapeake Bay included sediments with ~18% of the samples containing >4% TOC (Boynton et al., 2023). Larger N and P fluxes for these organic-rich sediments from Chesapeake Bay (450-1550 µmol ammonium m-2 h-1 and 29-150 µmol phosphate m-2 h-1) were on the same order as found for organic-rich sediments in NIRL (Table 2). Undoubtedly, a diverse group of site-specific factors control benthic nutrient fluxes globally.
We used a stepwise regression to identify factors that controlled fluxes of N and P for NIRL and BRL. Fifteen sediment parameters (ambient temperature, porosity, LOI, TOC, CaCO3, TN, TP, Fe, Al, Si, (Fe/Al)molar, (N/P)molar, (C/N)molar, (C/P)molar and interstitial H2S) were used to explain variations in benthic fluxes at our Phase 1 stations (Supplementary Table 6). Concentrations of sulfide in interstitial water (top 3 cm) explained 77% of the total variance for ammonium fluxes among stations (Supplementary Table 6). Sulfide plus ambient temperature explained 93% of the variance in ammonium fluxes. Adding a third factor such as TOC to the regression obviously improved prediction of ammonium fluxes by <5%. A strong correlation between ammonium fluxes and interstitial sulfide during Phase 1 was corroborated by a moderately strong correlation for ammonium fluxes versus interstitial sulfide using the much larger Phase 2 dataset (Figure 6A). These results support agreement between the Phase 1 and 2 data and reinforce the importance of sulfate reduction to ammonium fluxes (Klump and Martens, 1989). Results for phosphate showed that interstitial sulfide, plus sediment Fe/Al ratios and ambient temperature, explained 94% of the variance in the data (Supplementary Table 6). Moderately strong correlations between interstitial sulfide and phosphate flux were found during Phases 1 and 2 (Figure 6B).
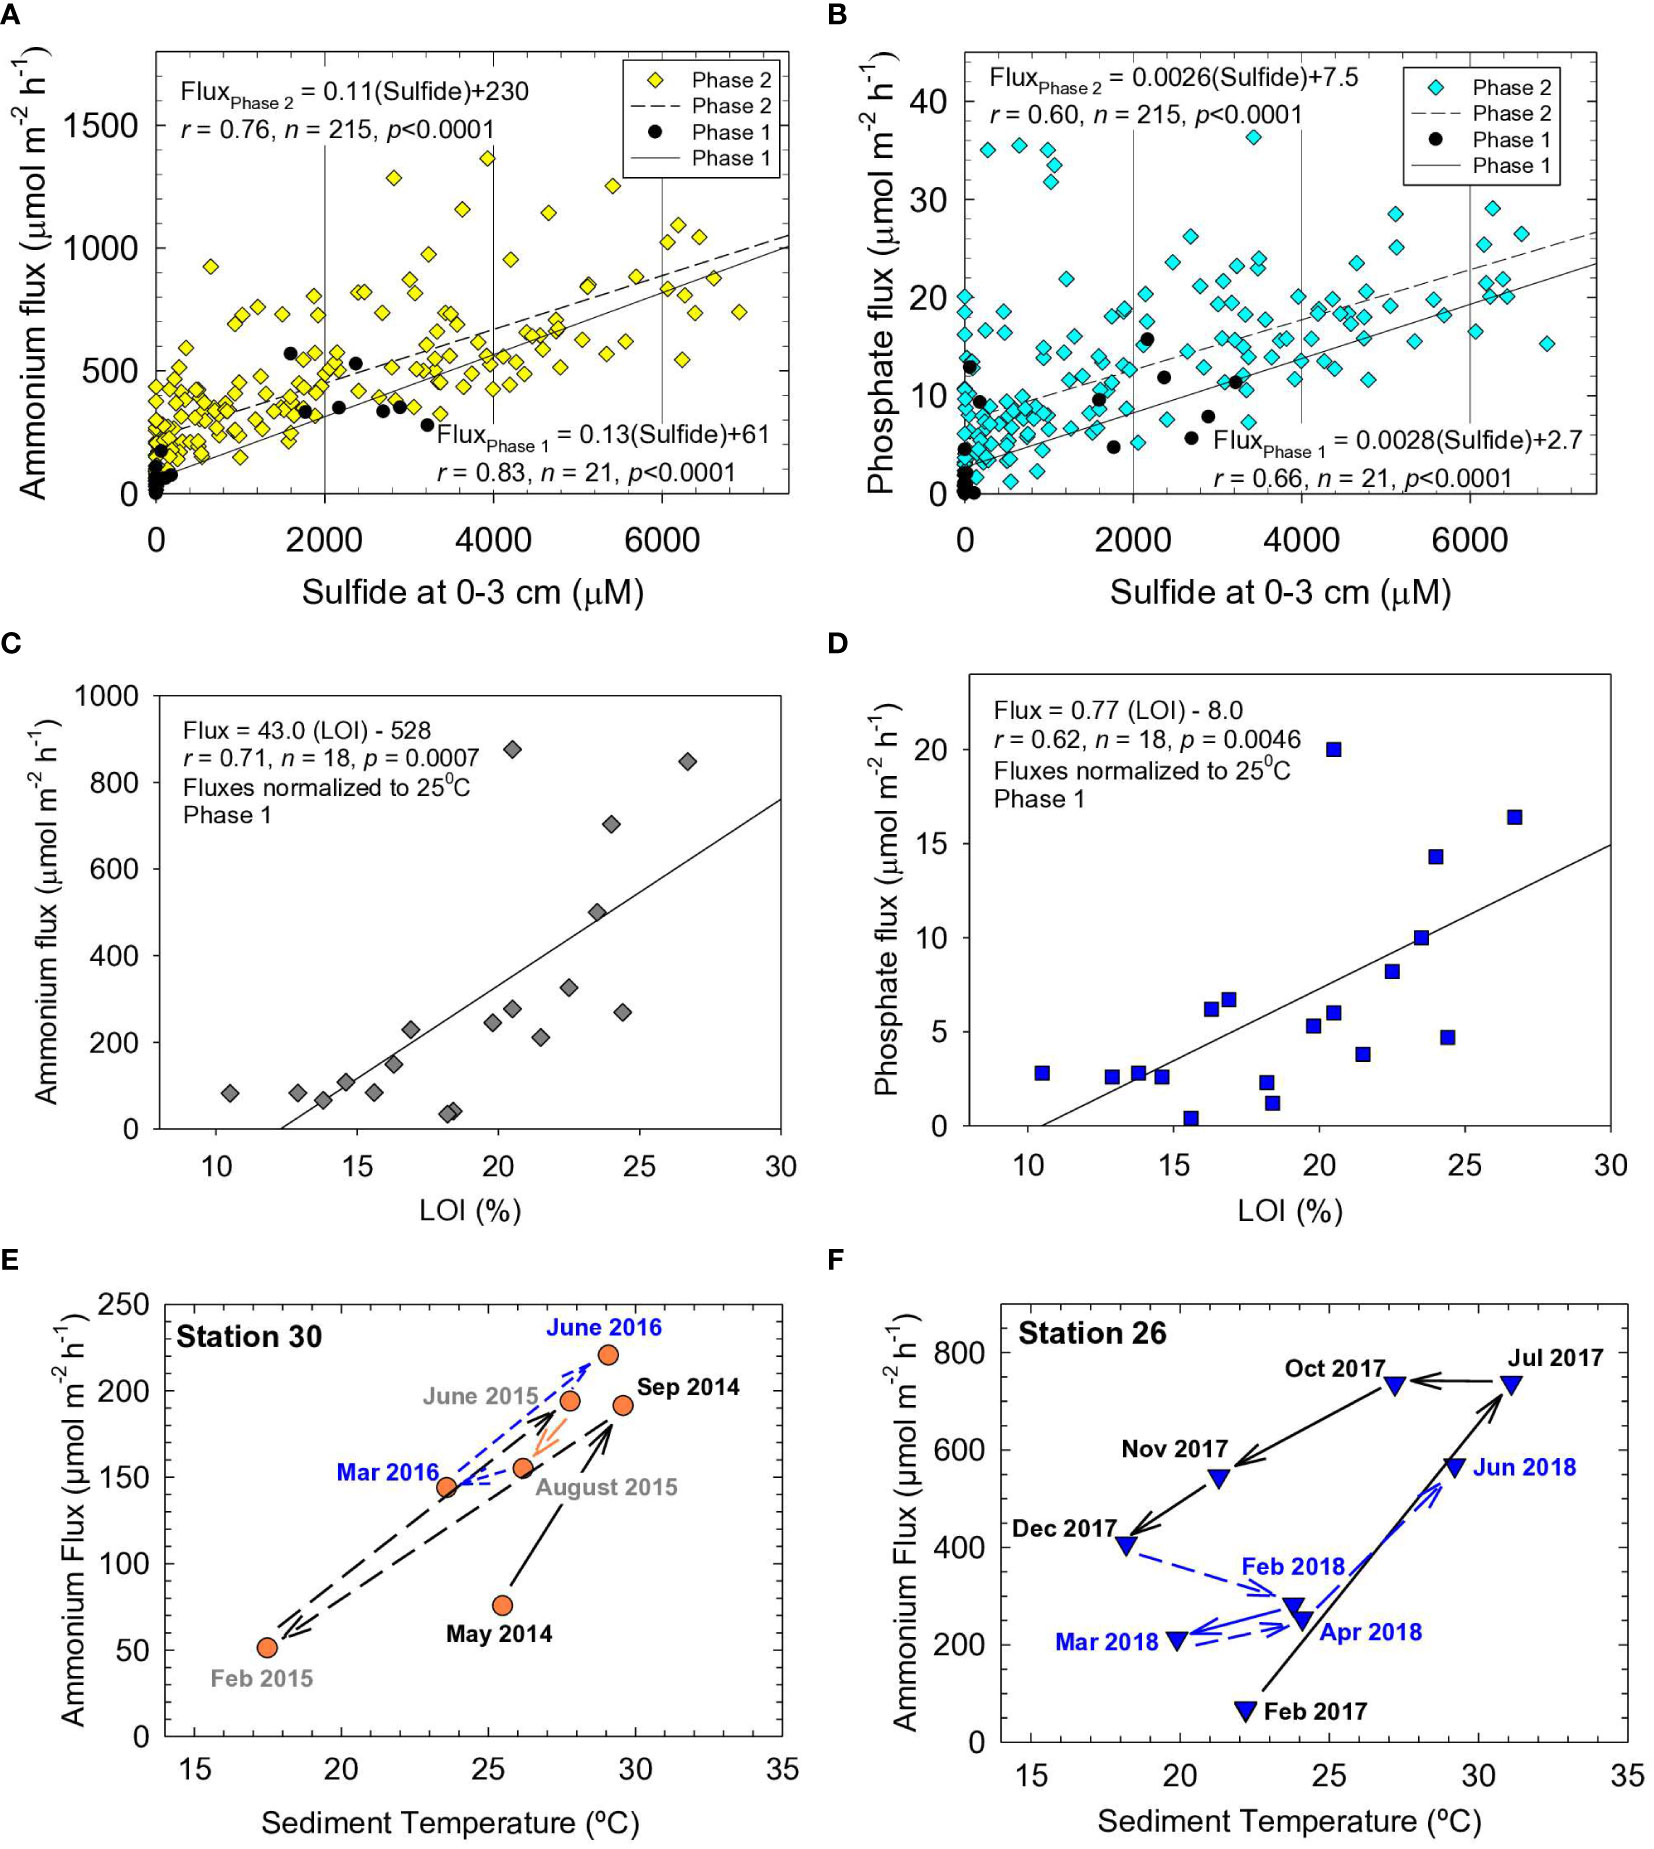
Figure 6 Benthic (A) ammonium flux versus sulfide and (B) phosphate flux versus sulfide at sediment depth of 0-3 cm. Fluxes normalized to 25°C for (C) ammonium and (D) phosphate versus loss on ignition (LOI) at 550°C. Solid lines and equations are from best-fit linear least squares analysis, r is the correlation coefficient, n is the number of data points and p is the probability of obtaining the observed result. Fluxes of ammonium versus temperature for different dates at (E) station 30 in Eau Gallie Harbor and (F) Station 26 in Redwood Canal.
While interstitial sulfide and temperature were important variables explaining fluxes of ammonium and phosphate, TOC, TN and TP in sediment were the fundamental drivers of fluxes. Very strong correlations were observed among these variables that defined organic-rich NIRL sediments, including TN versus TOC and TOC versus LOI (Supplementary Figures 6A, B). Correlations for benthic fluxes of ammonium and phosphate versus ambient temperature were significant, yet weak (p <0.001, r <0.4), because sediments with similar OM concentrations often were sampled at different times of year with varying changes in temperature over the preceding weeks. Overall, the data still underscored the importance of temperature to fluxes. When normalized to an average sediment temperature of 25°C in NIRL (Equation 5), fluxes of ammonium and phosphate correlated moderately strongly with LOI (Figures 6C, D). Therefore, as shown for other estuaries, fluxes of N and P from NIRL sediments were fundamentally controlled by OM; observed variations were in response to changes in temperature and redox conditions (Klump and Martens, 1989; Dollar et al., 1991; Vidal and Morgui, 1995; Boynton et al., 2017; Fox and Trefry, 2018).
Temperature-related shifts in benthic fluxes of N and P often show a time lag (Kemp et al., 2009; Brady et al., 2013). For example, ammonium fluxes can be underestimated during spring and overestimated during fall due to lags in production of ammonium following increased temperatures from spring to summer and decreased temperatures from fall to winter (Brady et al., 2013). We found similar trends for NIRL. Ammonium fluxes at NIRL station 30 (Eau Gallie Harbor) increased by 2- to 3-fold as temperatures increased (May−Sep 2014, Feb−Sep 2015); fluxes then decreased with decreasing temperatures from November to March (Figure 6E). A similar trend was observed for station 26 in a residential canal (Figure 6F) and most other stations. Sometimes fluxes remained high or even increased following decreases in temperature (e.g., Jul−Oct 2017 at station 26), which indicated it took weeks to months for diffusion to deplete the accumulated reservoir of ammonium (Figure 6F). Nevertheless, expected decreases in high fluxes at the end of summer sometimes lagged into November and December (Figures 6E, F).
Molar N/P ratios for estuarine sediments and benthic fluxes help identify limiting nutrients and favored phytoplankton species, thereby guiding management decisions designed to improve sediment and water quality. Ratios for concentrations of TN/TP in estuarine sediments are a product of the composition and lability of incoming terrestrial and marine OM plus subsequent changes during recycling in the water column and decomposition in sediments. Lower TN/TP ratios for sediments have been found under aerobic conditions because excess P was adsorbed by abundant amorphous Fe (Pant and Reddy, 2001). In contrast, higher TN/TP ratios for sediments often have been linked to loss of P by greater desorption and dissolution of P under reducing conditions (Christophoridis and Fytianos, 2006; Hou et al., 2013; Hartzell et al., 2017).
Two significantly different sets of molar TN/TP ratios were found for organic-rich NIRL sediments (Table 1). An average TN/TP ratio of 18.5 ± 7.3 for sediments collected north of 28°25´N (Segments IR 1-6) was ~2-fold greater and significantly different (p <0.0001) than the mean TN/TP ratio of 9.3 ± 2.6 for sediments at stations south of 28°25´N (Segments IR 7-11; Figures 4, 7A). This distinct regional difference in N/P ratio for sediments was also found downcore in both areas of the lagoon (Supplementary Figure 7). Based on reported sedimentation rates >0.7 cm y-1 and limited sediment mixing (Trefry and Trocine, 2011), TN/TP ratios for sediments in each area extended over at least several decades in the sedimentary record.
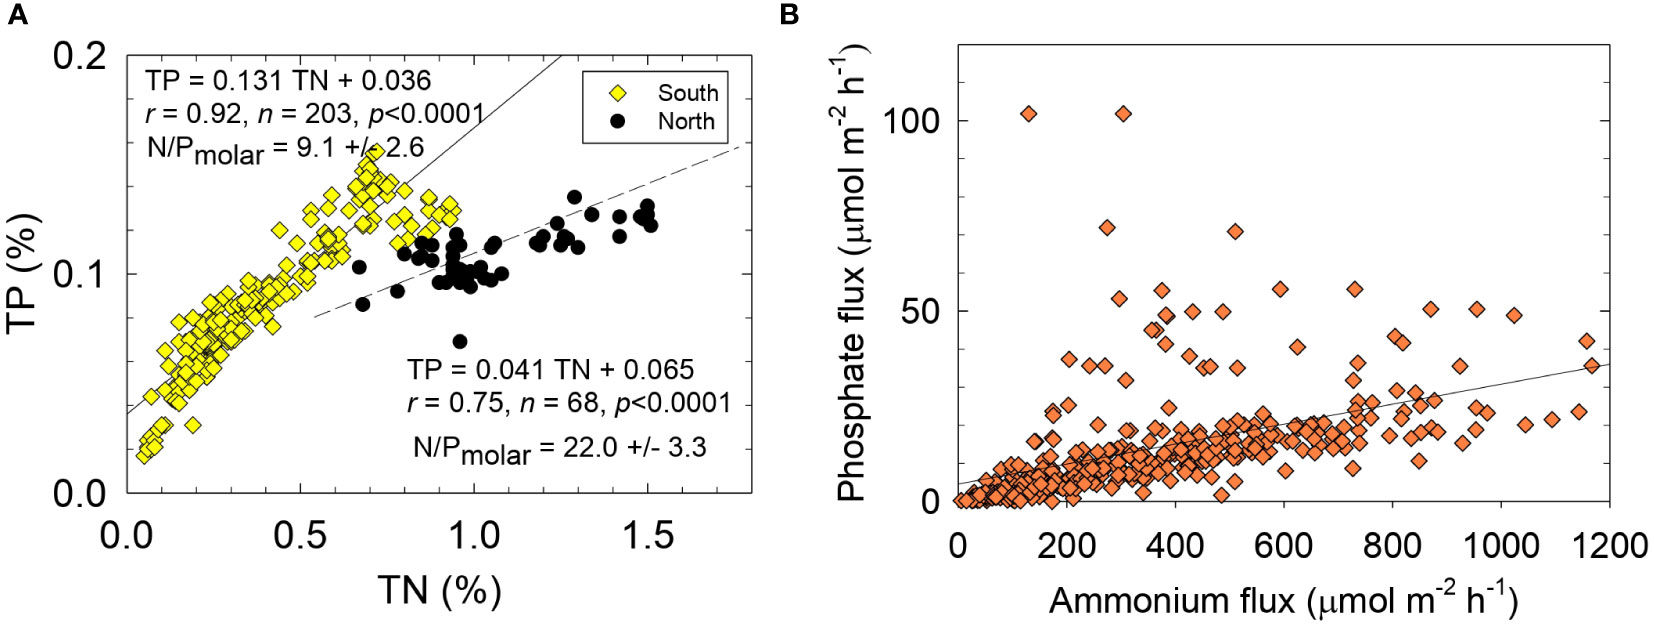
Figure 7 Sediment concentrations for (A) total phosphorus (TP) versus total nitrogen (TN) and (B) benthic fluxes of phosphate versus ammonium. Solid lines and equations are from best-fit linear least squares analysis, r is the correlation coefficient, n is the number of data points and p is the probability of obtaining the observed result.
Higher TN/TP ratios for sediments (lower P content) in the northernmost lagoon were consistent with reported patterns for concentrations of P in the water column and P-limited primary productivity (Sigua et al., 2000; Phlips et al., 2002; Lapointe et al., 2015). For example, Lapointe et al. (2015) reported TDN concentrations of 61-82 µM in NIRL relative to 24-48 µM in Central and South IRL (CIRL and SIRL); average concentrations of TDP in NIRL (1.5 µM) were lower than in SIRL (2.2 µM). Higher concentrations of TDN and lower concentrations of TDP supported TDN/TDP ratios of 49-71 in NIRL relative to 24-28 in CIRL and SIRL (Lapointe et al., 2015). Therefore, higher N/P ratios in sediment and lagoon water in NIRL, as well as likely P-limited productivity, may reflect geographical differences in N/P ratios in upland soils, incoming suspended particles and/or bottom sediments.
Molar N/P ratios for benthic fluxes from organic-rich NIRL sediments averaged 39 ± 5 (Table 4). In contrast, 76% of the studies summarized by Boynton et al. (2017) had a lower than expected N/P flux ratio (<16; Redfield, 1958), likely related to lower OM content and less reducing conditions. Recent data from Chesapeake Bay included more organic-rich sediments but still showed an N/P flux ratio of ~14 (Boynton et al., 2023). During Phase 1, the mean N/P flux ratio for sediments collected north of 28°25´N (segments IR 1-5) was 58 ± 13 relative to 25 ± 6 for sediments south of 28°25´N (segments 6-11), a trend similar to N/P ratios for sediments of 18.5 and 9.7 for north and south of 28°25´N, respectively (Tables 1, 3). Therefore, N/P ratios for sediments and benthic fluxes in NIRL north of 28°25´N were higher than in NIRL south of 28°25´N as well as CIRL and SIRL.
In sharp contrast to organic-rich sediments from the open NIRL, low N/P flux ratios were identified at NIRL stations near large freshwater tributaries or where incoming freshwater was trapped by causeways and large lagoon islands. For example, mid-salinity zones in Eau Gallie Harbor (station 30) and Turkey Creek (station 31, just south of NIRL boundary), had N/P flux ratios of 8 and 12, respectively. The mean N/P flux ratios for stations 15, 17 and 29, trapped by causeways, was 16 ± 3. No major tributaries had a median N/P flux ratio >30 during Phase 1. The preponderance of stations with high N/P flux ratios were in the open lagoon with higher salinity and organic-rich, anoxic sediments.
Iron has been shown to play a key role in both benthic fluxes and burial of P in sediments (Pant and Reddy, 2001; Kraal et al., 2015). As previously mentioned, sediments with amorphous and poorly crystalline forms of Fe, as found in NIRL, tend to adsorb P and release P under aerobic and anaerobic conditions, respectively (Pant and Reddy, 2001). Therefore, highest P fluxes (lower N/P flux ratios) in many estuaries have been observed at higher salinities where reducing conditions enhance dissolution of Fe-bound P, thereby releasing phosphate with subsequent binding of Fe by sulfides (Boynton and Kemp, 1985; Gu et al., 1987; Jordan et al., 2008). Such trends for NIRL were corroborated by very low interstitial Fe concentrations (<2 µM) in the presence of high sulfide values (Gu et al., 1987; Supplementary Figure 7).
Different responses of N and P during hypoxia can lead to stoichiometrically unbalanced and variable ratios of N/P fluxes, thereby creating opportunities for different algal species to thrive. For example, high N/P ratios and abundant reduced N favor planktonic communities with a low requirement for P (Glibert and Burford, 2017). In NIRL, small, fast-growing pico-cyanobacteria and the brown tide species Aureoumbra lagunensis flourish in low-P NIRL water (0.2-0.5 µM) and high TDN/TDP ratios (30-140) (Kang et al., 2015). Therefore, N/P flux ratios throughout the NIRL that were well above the Redfield ratio were consistent with TDN/TDP ratios for the water column and sediments in NIRL (Sigua et al., 2000; Kang et al., 2015: Phlips et al., 2021; Figure 7B).
4.2 Importance of benthic fluxes of ammonium and phosphate to the Indian River Lagoon
Benthic fluxes are often a significant source of N and P to shallow coastal estuaries and poorly-flushed barrier island lagoons (Gilmartin and Revelante, 1978; DiDonato et al., 2006; Buzzelli et al., 2013). Quantifying the relative importance of benthic fluxes to total nutrient loading for NIRL and BRL has been challenging due to insufficient data on the spatial distribution of organic-rich sediments and large temporal variations in benthic fluxes (Fox and Trefry, 2018). This extensive dataset for benthic fluxes of readily bioavailable ammonium and phosphate was used to make a first-order assessment of the magnitude of benthic fluxes from organic-rich sediments in NIRL and BRL.
Annual and regional benthic fluxes of ammonium and phosphate from organic-rich sediments in NIRL and BRL were calculated using data normalized to 25°C to help account for temporal differences. Our calculated fluxes of ammonium and phosphate from organic-rich sediments in NIRL (segments IR 1-11) were 225 t N y-1 and 13.8 t P y-1 (Table 4). Annual external inputs of N and P to NIRL (segments IR 1-11) were estimated at 402 t N and 46 t P by Gao (2009). Therefore, our estimated contributions to total loading from benthic fluxes were ~36% for N and ~23% for P. These results agree well with values of 33% for N and 23% for P using data from Tetra Tech Inc and Closewaters LLC (2022, Table 4 footnote). Fluxes for NIRL included the following: (1) 57.3 t N y-1 and 3.2 t P y-1 from 3.1 km2 of known organic-rich sediment at 15 major deposits calculated using data from each site, (2) 70.0 t N y-1 and 4.0 t P y-1 from 2.0 km2 of smaller, discrete deposits and (3) 94.2 t N y-1 and 6.6 t P y-1 in NIRL from 9.4 km2 of continuous (less well defined) deposits identified using a combination of probing and lidar data (Supplementary Table 5).
Annual fluxes of ammonium and phosphate from organic-rich sediments in BRL totaled 169 t of N and 9.3 t of P (Table 4). Annual external inputs to segments IR 1-7 in BRL were estimated at 220 t N and 28 t P (Gao, 2009). Therefore, the percentage of total external + internal inputs to BRL from benthic fluxes was ~43% for N and ~25% for P. These results agree relatively well with values of 34% for N and 32% for P using data from Tetra Tech Inc and Closewaters LLC (2022), Table 4 footnote). Benthic fluxes for BRL comprised the following: (1) 86.7 t N y-1 and 4.5 t P y-1 from 1.1 km2 of probed deposits, (2) 151 t N y-1 and 6.0 t P y-1 from 3.0 km2 of discrete dredge pits mostly north of SR 405 (NASA Causeway) and (3) 2.4 t N y-1 and 0.2 t P y-1 from 0.24 km2 of continuous deposits throughout BRL (Supplementary Table 5).
Our data suggest that benthic fluxes from organic-rich sediments collectively supply ~40% and ~24% of the total external + internal inputs of N and P, respectively, to NIRL and BRL. Discrete deposits had higher fluxes of N and P than continuous deposits and accounted for 35% (NIRL) and 94% (BRL) of mapped organic-rich deposits (Supplementary Table 5). The regional impact of benthic fluxes in NIRL was strongly skewed to segments IR 8-11 where 60% of the benthic N and P fluxes came from 22% of the total area of NIRL (Table 4). In contrast, ~3% of total benthic fluxes of N and P to NIRL came from segments IR 1-3; these segments contained 29% of the total area of NIRL, but only 1.5% of all known organic-rich sediment in NIRL (Table 4). In BRL, the regional impact was skewed to segment 1 at the north end of BRL, where 36% and 47% of the benthic N and P fluxes came from 10% of the total area of BRL (Table 4). Overall, concentrated areas of high flux in IRL and BRL, including deposits of organic-rich sediments within IR 8-11 and BR 1 overlapped areas known to be hotspots for algal blooms (Kamerosky et al., 2023). These large areas of fine-grained, organic-rich sediments could serve as refuges for algae during periods of limited external inputs (Dollar et al., 1991; Mortazavi et al., 2000).
In previous studies, benthic fluxes have been shown to support sizeable fractions of primary productivity. For example, Cowan et al. (1996) reported that benthic fluxes can supply as much as 90% of the N and 80% of the P required by phytoplankton in Mobile Bay, Alabama. Boynton et al. (2017) found that in shallow estuaries (<5m) fluxes accounted for 12-87% of the total respiration (water column + sediments) and supplied significant fractions of the N and P required by phytoplankton. In IRL, Phlips et al. (2002) reported an average positive doubling time for algae of 0.32 ± 0.12 dbl d-1. Using these values and algal biomass at 1 µg C mL-1 in NIRL (1 m2 with an average depth of 1.7 m = 1,700 L containing 1,700 µg C m-2 equal to 142 mmol C m-2, 21.4 mmol N m-2, 1.3 mmol P m-2 [Redfield ratio]), the nutrient requirement is ~248 µmol N m-2 h and ~15.5 µmol P m-2 h. These values increase during blooms; however, benthic fluxes from organic-rich NIRL sediments at median values (320 µmol m-2 h-1 and 11 µmol m-2 h-1) could supply >100% of the nitrogen and ~70% of the P required by algae in the immediate overlying water. These data and calculations corroborate the overlap between deposits of fine-grained organic-rich sediments and hotspots for algal blooms.
Ratios of stable isotopes of carbon (13C/12C) and nitrogen (15N/14N) have been used to identify and trace sources and transport pathways for organic matter in the environment (Cloern et al., 2002; Onodera et al., 2015). For example, N isotopes in benthic macroalgae have been used to infer that failing septic systems and sewage spills are an important external source of N to the IRL (Lapointe et al., 2015; Barile, 2018). Other external sources of N to the IRL include fertilizer, reclaimed water, rainwater and upland vegetation. As we have shown, benthic fluxes of N from NIRL and BRL are a significant internal source of N to the lagoon; N from benthic fluxes is essentially all present as ammonium.
Organic matter in sediments from the lagoon, tributaries and residential canals had δ15N that ranged from 3.79 to 6.21‰ with an average of 4.89 ± 0.44‰ (n = 50) (Supplementary Table 2). The average δ15N value for interstitial ammonium formed in these in organic-rich lagoon sediments was 6.88 ± 1.57‰ (Supplementary Table 3). δ15N values were +1‰ to +3‰ greater for interstitial ammonium N relative to organic N values of the source estuarine and marine sediments. These results match observed trends for coastal and marine sediments (Borowski and Paull, 2000; Prokopenko et al., 2006). The observed increase is due to fractionation during decomposition of an isotopically heavier fraction of sediment OM to form ammonium (Prokopenko et al., 2006). NIRL sediments had δ13C values that ranged from -19.5 to -26.5‰; most were at -20.5 to -22.5‰ (Supplementary Figure 2).
Interstitial ammonium from the IRL had δ15N values that coincide with those for sewage (Supplementary Figure 2). However, NIRL sediments had δ13C values that were consistent with a mix of terrestrial and marine OM and not in the range of values typically found for sewage (Supplementary Figure 2). This observation complicates assessments of the relative importance of wastewater to δ15N values in benthic algae (Lapointe et al., 2015; Barile, 2018) because interstitial ammonium carries essentially the same isotope signature as benthic macroalgae and sewage (Supplementary Figure 2). Variability in stable isotope ratios for C and/or N in a source chemical (e.g., ammonium) or composite material (e.g., sewage), as well as a plant or animal that may take up a certain chemical, can confound use of an isotope pair and require a complementary tool, such as a molecular biomarker to confirm sources and pathways (Cloern et al., 2002).
5 Synthesis and perspectives
Our investigations showed that benthic fluxes of N and P from organic-rich NIRL and BRL sediments (>10% OM) correlated significantly with concentrations of interstitial sulfide and sediment temperature. Nevertheless, fluxes were fundamentally controlled by sediment concentrations of TOC, TN and TP. We estimated that organic-rich sediments covered <10% of NIRL and BRL; however, these recent anthropogenic deposits (past 50 y) contributed 30-40% of the total external + internal inputs of N and P to our study area. Regional impacts of benthic fluxes in NIRL were skewed to segments IR 8-11 where >60% of the flux came from just 22% of the total area of NIRL (Table 4; Figure 4). In BRL, fluxes were skewed to segment BR 1 where >36% of flux came from just 10% of the total area of BRL that contained >50% of the organic-rich sediments. Areas of high fluxes overlapped hotspots for algal blooms and could serve as refuges for algae during periods of limited external inputs (Dollar et al., 1991; Mortazavi et al., 2000; Kamerosky et al., 2023).
Since 2010, a two-fold increase in the standing stock of total dissolved P has been observed in IRL in the absence of significant or abrupt changes in external loading (Phlips et al., 2021). Such shifts for IRL were consistent with losses of submerged aquatic vegetation, altered internal cycling, increased phytoplankton biomass, most notably following a 2011 mass mortality event (Phlips et al., 2014; Phlips et al., 2021; Hall et al., 2022; Morris et al., 2022). Since then, algal blooms have been more frequent, but less predictable relative to external loading reflecting the increased importance of internal nutrient loading towards controlling algal blooms.
In studies since 2011, low oxygen, sulfide-rich environments with high benthic nutrient fluxes in NIRL and BRL cultivated significantly fewer infauna and much lower biodiversity than directly adjacent sediments with less OM (Fuller et al., 2021; Mallick et al., 2023). Also, fewer ammonium oxidizing bacteria were found in organic-rich versus sandy sediments throughout IRL (Bradshaw et al., 2020). Loss of biodiversity and decreased bio-irrigation contribute to increasingly anaerobic and sulfidic sediments via changes in bacterial community structure and inhibition of nitrification (Hendricksen and Kemp, 1988). Increases in the surface area of organic-rich and reducing sediments can advance the migration of sulfidic sediment, thereby deteriorating ecosystem functions and impairing the recovery or recolonization of seagrasses, infauna and nitrifying bacteria (Eldridge et al., 2004). Such shifts and self-reinforcing feedback loops can decrease how efficiently N and P are removed from estuaries. As the eutrophic state progresses, sediments can become a larger source and smaller sink for nutrients (Boynton et al., 2017). Increases in the surface area of reducing sedimentary environments also can explain the decreased capacity of sediments to sequester P, thereby increasing P concentrations in the water column (Pant and Reddy, 2001; Phlips et al., 2021). All the above processes support a series of positive feedback loops that help sustain eutrophication by enhancing benthic fluxes of N and P.
Globally, benthic nutrient fluxes play a variable role in nutrient cycling and photosynthetic activity (Nixon, 1981; DiDonato et al., 2006; Boynton et al., 2017). If eutrophication continues, algal blooms will become an increasingly important source of sediment OM and benthic nutrient fluxes (Lemley et al., 2021). Sediments have been found to support a larger fraction of the total primary productivity as the eutrophic state progresses (DiDonato et al., 2006; Kemp et al., 2009); this transition has been observed in other estuaries (e.g., Kemp et al., 2009). Altered sediment biogeochemistry can result in more efficient recycling and less uptake and removal of nutrients by sediments. A solid understanding of these concepts strengthens future mitigation and management efforts.
If eutrophication in the IRL is to be diminished, external and internal sources of nutrients need to be reduced and the availability of nutrients presently in the system needs to be decreased (Chislock et al., 2013; Schindler et al., 2016). The global challenge to reduce eutrophication is daunting. Controlling external sources of nutrients has been a mainstay for mitigation of estuarine eutrophication for many years (Kemp et al., 2009; Trefry and Fox, 2021). Point sources, such as wastewater treatment plants, are usually a starting point for reducing external nutrient sources (Diaz et al., 2008). Fertilizer runoff, leaking septage, runoff of nutrients from reclaimed water and agricultural and residential lands make up a more complicated second step in the mitigation process. A variety of options to manage fertilizer include reducing the amount applied, using slow-release fertilizers, no fertilization within a fixed distance from a waterway and use of native plants that require less fertilizer (e.g., Tetra Tech Inc and Closewaters LLC, 2022). Solutions to leaking septage include upgrading failed and aging septic systems, connecting them to a central sewer system, upgrading old pipes in municipal wastewater systems and constructing overflows with ≥2-day capacity (e.g., Tetra Tech Inc and Closewaters LLC, 2022). Furthermore, N and P concentrations in reclaimed water can be decreased with more advanced treatment options. Stormwater management is a critical component of controlling broad-scale non-point external inputs from agricultural, urban and residential land. Successfully approaches include land-use planning, and engineering solutions (National Research Council, 2009).
Internal sources of nutrients can make up a highly variable fraction of total nutrient inputs as a function of drainage basin hydrology, human development and seasonal weather patterns (Boynton et al., 2008). Restoration that addresses geochemical processes includes removal of highly organic sediments and creating or restoring repositories to collect new material and reduce migration of organic rich sediments to broader areas. Capping fine-grained sediments can prevent resuspension, and mitigate fluxes by creating an oxic surface layer that promotes coupled nitrification-denitrification plus sorption of phosphorus and through consolidation of sediments. Although aeration was unable to improve sediment conditions in highly organic sediments from BRL, it may be a viable option to preserve areas near the tipping point (e.g., Harris et al., 2015; Ma et al., 2023). We should continue to investigate methods to promote coupled nitrification-denitrification and sequestration of P. For example, some benthic habitats can be modified to promote bioirrigation and thereby restore ecosystem services, including nutrient removal (e.g. Kemp et al., 2009). Recent data suggests that restoration of infauna communities capable of surviving in the current conditions could decrease sediment sulfide concentrations through increased bioirrigation, potentially aiding in the recovery of other foundational species (e.g., Eldridge et al., 2004; Bonaglia et al., 2019).
More recently, there is growing evidence that despite efforts to decrease external loading, internal nutrient loading can sustain algal blooms and an expanded approach to restoration has become necessary. Recent data and studies support use of ecosystem-based approaches that decrease external and internal loading of nutrients to promote sustainable biogeochemical processes. Approaches that address geochemical processes may include aeration, alterations to hydrology (increased circulation), removal of impaired sediments (dredging) and targeted habitat and shoreline restoration. These approaches have experienced varying degrees of success in the IRL system and globally (e.g., Harris et al., 2015; Fox and Trefry, 2018; Ma et al., 2023).
Data availability statement
The raw data supporting the conclusions of this article will be made available by the authors, without undue reservation.
Author contributions
AF: Conceptualization, Data curation, Funding acquisition, Methodology, Resources, Writing – original draft, Writing – review & editing. JT: Conceptualization, Funding acquisition, Investigation, Methodology, Project administration, Resources, Writing – review & editing.
Funding
The author(s) declare financial support was received for the research, authorship, and/or publication of this article. Funding for this project was provided by the following: (1) Florida Legislature as part of the Florida Department of Environmental Protection Grant Agreement No. NS005-Brevard County Muck Dredging, (2) St; Johns River Water Management District Contract No. 27815, (3) Indian River Lagoon Council Contract No. IRL2017-06, Indian River Lagoon National Estuary Program and (4) Florida Legislature as part of the Florida Department of Education Grant Project No. 857-93160-1Q001 Restore Lagoon Inflow Research.
Acknowledgments
We thank John Windsor of Florida of Technology (FIT) for his outstanding performance in the challenging role of Project Manager and for valuable scientific discussion and constructive criticism. Virginia Barker, Matt Culver, Mike McGarry and Walker Dawson from the Brevard County Natural Resources Management Department were invaluable contributors for planning and background information; we also are most thankful for their keen interest and participation in this project. We thank Chuck Jacoby of SJRWMD for invaluable help with the cycles or algae blooms and for updates on water diversion and other projects in the lagoon and Rex Ellis and Lauren Hall for valuable scientific discussion. We greatly appreciated support and timely conversations with Duane De Freese, IRL Council and IRL National Estuary Program. We thank Joel Steward of Dredging and Marine Consultants, LLC, who graciously shared his wealth of knowledge on IRL. Collaboration with Jonathan Martin and Andrea Pain (University of Florida) and Ashok Pandit (FIT) during Phase 1 greatly enriched our efforts to better understand physicochemical controls on benthic fluxes. We thank Stacey Fox, Bob Trocine, Jessica Voelker and Kate (Beckett) Fuller of FIT for outstanding support in the field and laboratory. We appreciate the support and encouragement of Frank Kinney and Rob Salonen of FIT and Thad Altman (Florida Legislature), who played important roles in guiding these projects to fruition.
Conflict of interest
The authors declare that the research was conducted in the absence of any commercial or financial relationships that could be construed as a potential conflict of interest.
Publisher’s note
All claims expressed in this article are solely those of the authors and do not necessarily represent those of their affiliated organizations, or those of the publisher, the editors and the reviewers. Any product that may be evaluated in this article, or claim that may be made by its manufacturer, is not guaranteed or endorsed by the publisher.
Supplementary material
The Supplementary Material for this article can be found online at: https://www.frontiersin.org/articles/10.3389/fmars.2023.1305990/full#supplementary-material
References
Bailey E. M. (2005). Measurements of nutrient and oxygen fluxes in estuarine and coastal marine sediments: Literature review and data report (Solomons, MD: University of Maryland Center for Environmental Science, Chesapeake Biological Laboratory [UMCES]).
Barile P. J. (2018). Widespread sewage pollution of the Indian River Lagoon system, Florida (USA) resolved by spatial analyses of macroalgal biogeochemistry. Mar. pollut. Bull. 128, 557–574. doi: 10.1016/j.marpolbul.2018.01.046
Bender M., Martin W., Hess J., Sayles F., Ball L., Lambert C. (1987). A whole-core squeezer for interfacial pore-water sampling. Limnol. Oceanogr. 32, 1214–1225. doi: 10.4319/lo.1987.32.6.1214
Berner R. A. (1974). “Kinetic models for the early diagenesis of nitrogen, sulfur and phosphorus in anoxic marine sediments,” in The Sea, vol. 5 . Ed. Goldberg E. D. (New York: John Wiley & Sons), 427–450.
Bonaglia S., Marzocchi U., Ekeroth N., Bruchert V., Blomqvist S., Hall P. O. J. (2019). Sulfide oxidation in deep Baltic Sea sediments upon oxygenation and colonization by macrofauna. Mar. Biol. 166, 149. doi: 10.1007/s00227-019-3597-y
Borowski W. S., Paull C. K. (2000). “Stable nitrogen isotopes of ammonium in interstitial waters from ODP Site 164-997,” in Proceedings of the Ocean Drilling Program, Scientific Results, vol. 164 . Eds. Paull C. K., Matsumoto R., Wallace P. J., Dillon W. P. (College Station, TX: Ocean Drilling Program), 1–2. doi: 10.2973/odp.proc.sr.164.213.2000
Boudreau B. P., Scott M. R. (1978). A model for the diffusion controlled growth of deep sea manganese nodules. Am. J. Sci. 278, 903–929. doi: 10.2475/ajs.278.7.903
Boynton W., Bailey E. (2008). Sediment oxygen and nutrient exchange measurements from Chesapeake Bay, tributary rivers and Maryland coastal bays: development of a comprehensive database and analysis of factors controlling patterns and magnitude of sediment– water exchanges (Solomons, MD: University of Maryland Center for Environmental Science) 31:301–333.
Boynton W. R., Ceballos M. A. C., Bailey E. M., Hodgkins C. L. S., Humphrey J. L., Testa J. M. (2017). Oxygen and nutrient exchanges at the sediment-water interface: a Global synthesis and critique of estuarine and coastal data. Estuar. Coasts. 41:301–333. doi: 10.1007/s12237-017-0274-5
Boynton W. R., Ceballos M. A. C., Hodgkins C. L. S., Liang D., Testa. J. M. (2023). Large−scale spatial and temporal patterns and importance of sediment–water oxygen and nutrient fluxes in the Chesapeake Bay region. Estuar. Coasts 46, 356–375. doi: 10.1007/s12237-022-01127-0
Boynton W. R., Hagy J. D., Cornwell J. C., Kemp W. M., Greene S. M., Owens M. S., et al. (2008). Nutrient budgets and management actions in the Patuxent River Estuary, Maryland. Estuar. Coasts. doi: 10.1007/s12237-008-9052-9
Boynton W. R., Kemp W. M. (1985). Nutrient regeneration and oxygen consumption by sediments along an estuarine salinity gradient. Mar. Ecol. Prog. Ser. 23, 43–55. doi: 10.3354/meps023045
Bradshaw D. J. II, Dickens N. J., Trefry J. H., McCarthy P. J. (2020). Defining the sediment prokaryotic communities of the Indian River Lagoon, FL, USA, an Estuary of National Significance. PloS One 15 (10), e0236305. doi: 10.1371/journal.pone.0236305
Brady D. C., Testa J. M., Di Toro D. M., Boynton W. R., Kemp W. M. (2013). Sediment flux modeling: calibration and application for coastal systems. Estuar. Coast. Shelf Sci. 117, 107–124. doi: 10.1016/j.ecss.2012.11.003
Brock J. C., Purkis S. J. (2009). The emerging role of lidar remote sensing in coastal research and resource management. J. Coast. Res. 25, 1–5. doi: 10.2112/SI53-001.1
Burdidge D. J. (2012). “Estuarine and coastal sediments − coupled biogeochemical cycling,” in Treatise on Estuarine and Coastal Science, vol. 5 . Eds. Laane R., Middelburg J. J. (Cambridge, MA: Academic Press), 279–308.
Burkholder J. M., Tomasko D. A., Touchette B. W. (2007). Seagrasses and Eutrophication. J. Exper. Mar. Biol. Ecol. 350, 46–72. doi: 10.1016/j.jembe.2007.06.024
Buzzelli C., Chen Z., Coley T., Doering P., Samimy R., Schlezinger D., et al. (2013). Dry season sediment-water exchanges of nutrients and oxygen in two Florida estuaries: patterns, comparisons, and internal loading. Florida Sci. 76, 54–79.
Charbonnier C., Anschutz P., Tamborski J., van Beek P. (2023). Benthic fluxes and mineralization processes at the scale of a coastal lagoon; permeable versus fine-grained sediment contribution. Mar. Chem. 254, 104274. doi: 10.1016/j.marchem.2023.104274
Chislock M. F., Doster E., Zitomer R. A., Wilson R. A. (2013). Causes, consequences, and controls in aquatic ecosystems. Nat. Educ. Knowledge 4, 10.
Christophoridis C., Fytianos K. (2006). Conditions affecting the release of phosphorus from surface lake sediments. J. Environ. Qual. 35, 1181–92. doi: 10.2134/jeq2005.0213
Cloern J. E., Canuel E. A., Harris D. (2002). Stable carbon and nitrogen isotope composition of aquatic and terrestrial plants of the San Francisco Bay estuarine system. Limnol. Oceanogr. 47, 713–729. doi: 10.4319/lo.2002.47.3.0713
Cowan J. L. W., Boynton W. R. (1996). Sediment-water oxygen and nutrient exchanges along the longitudinal axis of Chesapeake Bay: seasonal patterns, controlling factors and ecological significance. Estuaries 19, 562–580. doi: 10.2307/1352518
Cowan J. L. W., Pennock J. R., Boynton W. R. (1996). Seasonal and interannual patterns of sediment-water nutrient and oxygen fluxes in Mobile Bay, Alabama (USA): Regulating factors and ecological significance. Mar. Ecol. Prog. Ser. 141, 229–245. doi: 10.3354/meps141229
Decleyre H., Heylen K., Van Colen C., Willems A. (2015). Dissimilatory nitrogen reduction in intertidal sediments of a temperate estuary: small scale heterogeneity and novel nitrate-to-ammonium reducers. Front. Microbiol. 6:1124. doi: 10.3389/fmicb.2015.01124
Diaz R. J., Trefry J. H. (2006). Comparison of sediment profile imaging data with profiles of oxygen and Eh from sediment cores. J. Mar. Sys. 62, 164172. doi: 10.1016/j.marsys.2006.01.009
Diaz R. J., Rhoads D. C., Blake J. A. (2008). Long-term trends of benthic habitats related to reduction in wastewater discharge to Boston Harbor. Estuar. Coasts 31), 1184–1197. doi: 10.1007/s12237-008-9094-z
DiDonato G. T., Lores E. M., Murrell M. C., Smith L. M., Caffrey J. M. (2006). Benthic nutrient flux in a small estuary in northwestern Florida (USA). Gulf Carib. Res. 18, 15–26. doi: 10.18785/gcr.1801.02
Dollar S. J., Smith S. V., Vink S. M., Obrebski S., Hollibaugh J. T. (1991). Annual cycle of benthic nutrient fluxes in Tomales Bay, California, and contribution of the benthos to total ecosystem metabolism. Mar. Ecol. Prog. Ser. 79, 115–125. doi: 10.3354/meps079115
Dunic J. C., Brown C. J., Connolly R. M., Turschwell M. P., Côté I. M. (2021). Long-term declines and recovery of meadow area across the world’s seagrass bioregions. Glob. Change. Biol. 27, 4096–4109. doi: 10.1111/gcb.15684
Eldridge P. M., Kaldy J. E., Burdm A. B. (2004). Stress response model for the tropical seagrass Thalassia testudinum: The interaction of light, temperature, sedimentation and geochemistry. Estuaries 27, 923–937. doi: 10.1007/BF02803419
Engle V. P., Kurtz J. C., Smith L. M., Chancey C., Bourgeois P. (2007). A classification of U.S. estuaries based on physical and hydrologic attributes. Environ. Monit. Assess. 129, 397–412. doi: 10.1007/s10661-006-9372-9
Ferguson A., Eyre B., Gay J. (2004). Nutrient cycling in the sub-tropical Brunswick estuary, Australia. Estuaries 27, 1–17. doi: 10.1007/BF02803556
Fisher T. R., Carlson P. R., Barber R. T. (1982). Sediment nutrient regeneration in three North Carolina estuaries. Estuar. Coast. Shelf Sci. 14, 101–116. doi: 10.1016/S0302-3524(82)80069-8
Flint W. R. (1985). Long-term estuarine variability and associated biological response. Estuaries 8, 158–169. doi: 10.2307/1351865
Foster G., Riegl B. M., Foster K. A., Morris L. J. (2018). Acoustic detection and mapping of muck deposits in the Indian River Lagoon, Florida. J. Coast. Res. 34, 856–863. doi: 10.2112/jcoastres-D-16-00156.1
Fox A. L., Trefry J. H. (2018). Environmental dredging to remove fine-grained, organic-rich sediments and reduce inputs of nitrogen and phosphorus to a subtropical estuary. Mar. Tech. Soc J. 52, 42–57. doi: 10.4031/mtsj.52.4.3
Fuller K. M., Fox A. L., Jacoby C. A., Trefry J. H. (2021). Biological abundance and diversity in organic-rich sediments from a Florida barrier island lagoon. Front. Mar. Sci 8. doi: 10.3389/fmars.2021.768083
Gao X. (2009). TMDL Report Nutrient and Dissolved Oxygen TMDLs for the Indian River Lagoon and Banana River Lagoon (Tallahassee, FL: Florida Department of Environmental Protection).
Gilmartin M., Revelante N. (1978). The phytoplankton characteristics of barrier lagoons of the Gulf of California. Estuar. Coast. Mar. Sci. 7, 29–47. doi: 10.1016/0302-3524(78)90055-5
Glibert P. M., Burford M. A. (2017). Globally changing nutrient loads and harmful algal blooms: Recent advances, new paradigms, and continuing challenges. Oceanography 30, 5869. doi: 10.5670/oceanog.2017.110
Gu D., Iricanin N., Trefry J. H. (1987). The geochemistry of interstitial water for a sediment core from the Indian River Lagoon. Florida Sci. 50, 99–110.
Hall L. M., Morris L. J., Chamberlain R. H., Hanisak M. D., Virnstein R. W., Paperno. R., et al. (2022). Spatiotemporal patterns in the biomass of drift macroalgae in the Indian River Lagoon, Florida, United States. Front. Mar. Sci. 9. doi: 10.3389/fmars.2022.767440
Harris L. A., Hodgkins C. L. S., Day M. C., Austin D., Testa J. M., Boynton W., et al. (2015). Optimizing recovery of eutrophic estuaries: Impact of destratification and re-aeration on nutrient and dissolved oxygen dynamics. Ecol. Eng. 75, 470–483. doi: 10.1016/j.ecoleng.2014.028
Hartzell J. L., Jordan T. E., Cornwell J. C. (2017). Phosphorus sequestration in sediments along the salinity gradients of Chesapeake Bay subestuaries. Estuar. Coasts 40, 1607–1625. doi: 10.1007/s12237-017-0233-2
Heiri O., Lotter A. F., Lemcke G. (2001). Loss on ignition as a method for estimating organic and carbonate content in sediments: reproducibility and comparability of results. J. Paleolimnol. 25, 101–110. doi: 10.1023/A:1008119611481
Heisler J., Glibert P., Burkholder J., Anderson D., Cochlan W., Dennison W., et al. (2008). Eutrophication and harmful algal blooms: A scientific consensus. Harmful Algae 8, 3–13. doi: 10.1016/j.hal.2008.08.006
Henricksen K., Kemp W. (1988). Nitrification in estuaries and coastal marine sediments. Eds. Blackburn T. H., J. Sorenen J. (New York: John Wiley and Sons Ltd), 207–249.
Hou D., He J., Lu C., Sun Y., Zhang F., Otgonbayar K. (2013). Effects of environmental factors on nutrients release at sediment-water interface and assessment of trophic status for a typical shallow lake, Northwest China. Sci. World J. 2013, 716342. doi: 10.1155/2013/716342
Indian River Lagoon National Estuary Program [IRLNEP] (2007). Indian River Lagoon: An Introduction to a National Treasure (Palatka, FL, USA: St. Johns River Water Management District).
Jahnke R. A. (1988). A simple, reliable, and inexpensive pore-water sampler. Limnol. Oceanogr. 33, 483–487. doi: 10.4319/lo.1988.33.3.0483
Jordan T. E., Cornwell J. C., Boynton W. R., Anderson J. T. (2008). Changes in phosphorus biogeochemistry along an estuarine salinity gradient: The iron conveyer belt. Limnol. Oceanogr. 53, 172–184. doi: 10.4319/lo.2008.53.1.0172
Kamerosky A., Listopad C., Barker V. (2023). Remote sensing of harmful algal blooms in the Indian River Lagoon and connected waterways in Brevard County. Florida Sci. 86, 386–399.
Kang Y., Koch F., Gobler C. J. (2015). The interactive roles of nutrient loading and zooplankton grazing in facilitating the expansion of harmful algal blooms caused by the pelagophyte, Aureoumbra lagunensis, to the Indian River Lagoon, FL, USA. Harmful Algae 49, 162–173. doi: 10.1016/j.hal.2015.09.005
Kemp W. M., Testa J. M., Conley D. J., Gilbert D., Hagy J. D. (2009). Temporal responses of coastal hypoxia to nutrient loading and physical controls. Biogeosci. 6, 2985–3008. doi: 10.5194/bg-6-2985-2009
Klump J. V., Martens C. S. (1989). The seasonality of nutrient regeneration in an organic-rich coastal sediment: Kinetic modeling of changing pore-water nutrient and sulfate distributions. Limnol. Oceanogr. 34, 559–577. doi: 10.4319/lo.1989.34.3.0559
Kraal P., Burton E. D., Rose L., Kocar B. D., Lockhart R. S., Grice K., et al. (2015). Sedimentary iron–phosphorus cycling under contrasting redox conditions in a eutrophic estuary. Chem. Geol. 392, 19–31. doi: 10.1016/j.chemgeo.2014.11.006
Kristensen E., Delefosse M., Quintana C. O., Flindt M. R., Valdemarsen T. (2014). Influence of benthic macrofauna community shifts on ecosystem functioning in shallow estuaries. Front. Mar. Sci. 1. doi: 10.3389/fmars.2014.00041
Landsberg J. H., Tabuchi M., Rotstein D. S., Subramaniam K., Rodrigues T. C. S., Waltzek T. B., et al. (2022). Novel lethal clostridial infection in Florida manatees (Trichechus manatus latirostris): Cause of the 2013 unusual mortality event in the Indian River Lagoon. Front. Mar. Sci. 9. doi: 10.3389/fmars.2022.841857
Lapointe B. E., Herren L. W., Brewton R. A., Alderman P. K. (2020). Nutrient over-enrichment and light limitation in seagrass communities in the Indian River Lagoon, an urbanized subtropical estuary. Sci. Tot. Environ. 699, 134068. doi: 10.1016/j.sci.totenv.2019.134068
Lapointe B. E., Herren L. W., Derbortoli D. D., Vogel M. A. (2015). Evidence of sewage-driven eutrophication and harmful algal blooms in Florida’s Indian River Lagoon. Harmful Algae 43, 82−102. doi: 10.1016/j.hal.2015.01.004
Lemley D. A., Adams J. B., Largier J. L. (2021). Harmful algal blooms as a sink for inorganic nutrients in a eutrophic estuary. Mar. Ecol. Prog. Ser. 663, 63–76. doi: 10.3354/meps13655
Levoy F., Anthony E. J., Dronkers J., Monfort O., Montreuil A.-L. (2019). Short-term to decadal-scale sand flat morphodynamics and sediment balance of a Megatidal Bay: Insight from multiple LiDAR datasets. J. Coast. Res. 88, 61–76. doi: 10.2112/SI88-006.1
Li H., Gregory S. (1974). Diffusion of ions in sea water and deep-sea sediments. Geochim. Cosmochm. Acta 88, 703–714. doi: 10.1016/0016-7037(74)90145-8
Livingston R. J. (2000). Eutrophication Processes in Coastal Systems: Origin and Succession of Plankton Blooms and Effects on Secondary Production in Gulf Coast Estuaries, CRC Marine Science Book 22 (Boca Raton: CRC Press).
Lopez C. B., Tilney C. L., Muhlbach E., Bouchard J. N., Villac M. C., Henschen K. L., et al. (2021). High-resolution spatiotemporal dynamics of harmful algae in the Indian River Lagoon (Florida): A case study of Aureoumbra lagunensis, Pyrodinium bahamense, and Pseudo-nitzschia. Front. Mar. Sci. 8. doi: 10.3389/fmars.2021.769877
Ma X., Fox A., Fox S., Johnson K. B. (2023). Phytoplankton and benthic infauna responses to aeration, an experimental ecological remediation, in a polluted subtropical estuary with organic-rich sediments. PloS One 18 (1), e0280880. doi: 10.1371/journal.pone.0280880
Mallick N., Johnson K. B., Jacoby C. A. (2023). The effect of environmental dredging of muck on an assemblage of benthic amphipods. J. Mar. Sci. Eng. 11, 444. doi: 10.3390/jmse11020444
Morris L. J., Hall L. M., Jacoby C. A., Chamberlain R. H., Hanisak D. M., Miller J. D., et al. (2022). Seagrass in a changing estuary, the Indian River Lagoon, Florida, United States. Front. Mar. Sci. 8. doi: 10.3389/fmars.2021.789818
Mortazavi B., Iverson R. L., Huang W., Lewis F. G., Caffrey J. M. (2000). Nitrogen budget of Apalachicola Bay, a bar-built estuary in the northeastern Gulf of Mexico. Mar. Ecol. Prog. Ser. 195, 1–14. doi: 10.3354/meps195001
National Oceanic and Atmospheric Administration [NOAA]. (2022). Central Florida 1/3 arc-second NAVD 88 Coastal Digital Elevation Model. Available at: https://data.noaa.gov/metaview/page?xml=NOAA/NESDIS/NGDC/MGG/DEM/iso/xml/5167.xml&view=getDataView&header=none.
National Research Council (2009). Urban Stormwater Management in the UNITED STATES (Washington, DC: The National Academies Press). doi: 10.17226/12465
Nixon S. W. (1981). “Remineralization and nutrient cycling in coastal marine ecosystems,” in Estuaries and Nutrients, 1st ed. Eds. Neilson B. J., Cronin L. E. (Clifton: Humana Press), 111–138.
Onodera T., Kanaya G., Syutsubo K., Miyaoka Y., Hatamoto M., Yamaguchi T. (2015). Spatial changes in carbon and nitrogen stable isotope ratios of sludge and associated organisms in a biological sewage treatment system. Water Res. 68, 387–393. doi: 10.1016/j.watres.2014.10.020
Pain A. J., Martin J. B., Young C. R. (2021). Biogeochemical and hydrological drivers of heterogeneous nutrient exports from subterranean estuaries. Front. Mar. Sci. 8. doi: 10.3389/fmars.2021.699916
Pant H. K., Reddy K. R. (2001). Phosphorus sorption characteristics of estuarine sediments under different redox conditions. J. Environ. Qual. 30, 1475–1480. doi: 10.2134/jeq2001.3041474x
Paulson A. J., Wagner R. J., Sanzolone R. F., Cox S. E. (2006). Concentrations of elements in sediments and selective fractions of sediments, and in natural waters in contact with sediments from Lake Roosevelt (Washington: U.S. Geological Survey).
Phlips E. J., Badylak S., Grosskopf T. (2002). Factors affecting the abundance of phytoplankton in a restricted sub-tropical lagoon, the Indian River Lagoon, Florida, USA. Estuar. Coast. Shelf Sci. 55, 385–402. doi: 10.1006/ecss.2001.0912
Phlips E. J., Badylak S., Nelson N. G., Hall L. M., Jacoby C. A., Lasi M. A., et al. (2021). Cyclical patterns and a regime shift in the character of phytoplankton blooms in a restricted sub-tropical lagoon, Indian River Lagoon, Florida, United States. Front. Mar. Sci. 8. doi: 10.3389/fmars.2021.730934
Phlips E. J., Badylak S., Lasi M. A., Chamberlain R., Green W. C., Hall L. M., et al. (2014). From red to green and brown tides: Bloom dynamics in a restricted subtropical lagoon under shifting climatic conditions. Estuaries and Coasts 38(3). doi: 10.1007/s12237-014-9874-6
Phlips E. J., Badylak S., Nelson N. G., Havens K. E. (2020). Hurricanes, El Niño and harmful algal blooms in sub-tropical Florida estuaries: Direct and indirect impacts. Sci. Rep. 10, 1910. doi: 10.1038/s41598-020-058771-4
Presley B. J., Trefry J. H. (1980). “Sediment-water interactions and the geochemistry of interstitial water,” in Chemistry and Biogeochemistry of Estuaries. Eds. Olausson E., Cato I. (New York: John Wiley & Sons), 187–232.
Proisy C., Gratiot N., Anthony E. J., Gardel A., Fromard F. (2009). Mud bank colonization by opportunistic mangroves: A case study from French Guiana using lidar data. Cont. Shelf Res. 29, 632–641. doi: 10.1016/j.csr.2008.09.017
Prokopenko M. G., Hammond D. E., Berelson W. M., Bernhard. J. M., Scott. L., Douglas R. (2006). Nitrogen cycling in the sediments of Santa Barbara basin and Eastern Subtropical North Pacific: Nitrogen isotopes, diagenesis and possible chemosymbiosis between two lithotrophs (Thioploca and Anammox)—” riding on a glider”. Earth Plan. Sci. Lett. 242, 86–204. doi: 10.1016/j.epsl.2005.11.044
Redfield A. C. (1958). The biological control of chemical factors in the environment. Am. Sci. 46 (230A), 205–221.
Rodil I. F., Lucena-Moya P., Tamelander T., Norkko J., Norkko A. (2020). Seasonal variability in benthic-pelagic coupling: quantifying organic matter inputs to the seafloor and benthic macrofauna using a multi-marker approach. Front. Mar. Sci. 7. doi: 10.3389/fmars.2020.00404
Rosario-Llantin J., Zarillo G. A. (2021). Flushing rates and hydrodynamic characteristics of Mosquito Lagoon (Florida, USA). Environ. Sci. pollut. R. 28, 30019–30034. doi: 10.1007/s11356-021-12367-1
Schindler D. W., Carpenter S. R., Chapra S. C., Hecky R. E., Orihel D. M. (2016). Reducing phosphorus to curb lake eutrophication is a success. Environ. Sci. Technol. 50, 8923–8929. doi: 10.1021/acs.est.6b02204
Schultz G., Ruppel C. (2002). Constraints on hydraulic parameters and implications for groundwater flux across the upland-estuary interface. J. Hydrol 260, 255–269. doi: 10.1016/S0022-1694(01)00616-3
Seitzinger S. P. (1991). The effect of pH on the release of phosphorus from Potomac estuary sediments: Implications for blue-green algal blooms. Estuar. Coast. Shelf Sci. 33, 409–418. doi: 10.1016/0272-7714(91)90065-J
Sigua G. C., Steward J. S., Tweedale W. A. (2000). Water-quality monitoring and biological integrity assessment in the Indian River Lagoon, Florida: status, trends, and loadings, (1988–1994). Environ. Manage 25, 199209. doi: 10.1007/s002679910016
Smith N. P. (1993). Tidal and nontidal flushing of Florida’s Indian River Lagoon. Estuaries 16, 739–746. doi: 10.2307/1352432
Smith N. P. (2007). Inter-annual variability in net outflow from Indian River Lagoon. Florida Sci. 70, 332–343.
Tetra Tech, Inc. and Closewaters, LLC (2022). Save our Indian River Lagoon Project Plan Update 2021 (Melbourne, FL: Brevard County Natural Resources Management).
Trefry J. H., Fox A. L. (2021). Extreme runoff of chemical species of nitrogen and phosphorus threatens a Florida barrier island lagoon. Front. Mar. Sci. 8. doi: 10.3389/fmars.2021.752945
Trefry J. H., Johnson K. B., Fox A. L., Ma X. (2019). Optimizing selection of sites for environmental dredging in the Indian River Lagoon System (Melbourne, FL: Brevard County Natural Resources Management).
Trefry J. H., Metz S., Trocine R. P., Iricanin N., Burnside D., Chen N., et al. (1990). Design and operation of a muck sediment survey. Special Report SJ90-SP3 (Palatka, FL: Saint Johns River Water Management District).
Trefry J. H., Trocine R. P. (2011). Metals in sediments and clams from the Indian River Lagoon, Florida: 2006-7 versus 1992. Florida Sci. 74, 43–62.
Twilley R. R., Cowan J., Miller-Way T., Montagna P. A., Mortazavi B. (1999). “Benthic nutrient fluxes in selected estuaries in the Gulf of Mexico,” in Biogeochemistry of Gulf of Mexico Estuaries. Eds. Bianchi T. S., Pennock J. R., Twilley R. R. (Hoboken, NJ: John Wiley & Sons), 163–209.
Vidal M., Morgui J.-A. (1995). Short-term pore water ammonium variability coupled to benthic boundary layer dynamics in Alfacs Bay, Spain (Ebro Delta, NW Mediterranean). Mar. Ecol. Prog. Ser. 118, 229–236. doi: 10.3354/meps118229
Wang P., Zhang X., Yin H., Jeppesen H., Liu Z. (2022). Editorial: The effects of benthic-pelagic coupling on shallow lake ecosystems: Implications for lake management. Front. Environ. Sci. 10. doi: 10.3389/fens,2022.1084861
Waycott M., Duarte C. M., Carruthers T. J. B., Orth R. J., Dennison W. C., Olyarnik S., et al. (2009). Accelerating loss of seagrasses across the globe threatens coastal ecosystems. P. Natl. Acad. Sci. U.S.A. 106, 12377–12381. doi: 10.1073/pnas.0905620106
Keywords: Indian River Lagoon, nitrogen, phosphorus, eutrophication, benthic-pelagic coupling, lidar
Citation: Fox AL and Trefry JH (2023) Nutrient fluxes from recent deposits of fine-grained, organic-rich sediments in a Florida estuary. Front. Mar. Sci. 10:1305990. doi: 10.3389/fmars.2023.1305990
Received: 02 October 2023; Accepted: 24 November 2023;
Published: 20 December 2023.
Edited by:
Duane E. De Freese, Independent Researcher, United StatesReviewed by:
Edward Sherwood, Tampa Bay Estuary Program, United StatesDavid Tomasko, Sarasota Bay Estuary Program, United States
Copyright © 2023 Fox and Trefry. This is an open-access article distributed under the terms of the Creative Commons Attribution License (CC BY). The use, distribution or reproduction in other forums is permitted, provided the original author(s) and the copyright owner(s) are credited and that the original publication in this journal is cited, in accordance with accepted academic practice. No use, distribution or reproduction is permitted which does not comply with these terms.
*Correspondence: Austin L. Fox, YWZveEBmaXQuZWR1