 Amanda M. Belanger
 Bryanna A. H. Sherbo
 James D. Roth
 Cortney A. Watt
- 1Department of Biological Sciences, University of Manitoba, Winnipeg, MB, Canada
- 2Fisheries and Oceans Canada, Arctic and Aquatic Research Division, Winnipeg, MB, Canada
Limiting disturbance in critical habitats is an important part of ensuring the well-being and sustainability of populations at risk, such as Cumberland Sound beluga whales (Delphinapterus leucas). Using non-disruptive Very High Resolution (VHR) satellite imagery, an emerging tool in cetacean monitoring, we aimed to estimate summer abundance and identify critical habitat for Cumberland Sound beluga whales. Specifically we looked in fiords that comprise their summer distribution, such as Clearwater Fiord where there is a large estuary, an important habitat to many beluga populations. Satellite images of the area were collected in 2020 and 2021, at 30 cm resolution, and in 2022 at 50 cm resolution. We evaluated beluga whale distribution using Kernel density, and identified critical habitats as areas consistently part of the beluga whale core distribution across years. Clearwater Fiord abundance estimates were corrected for whales that were too deep to be identified in the images. The estimates were significantly lower in 2021 (197 whales, 95%CI: 180-216) and 2022 (194 whales, 95%CI: 172-218) compared to 2020 (393 whales, 95%CI: 366-422). Other fiords were only imaged in 2021 and 2022, resulting in average corrected abundance estimates for all fiords of 462 (95% CI: 425-502) and 252 (95%CI: 226-280) beluga whales, respectively. Downsampling of 30 cm images to 50 cm resulted in up to 45% fewer whales detected. The only critical habitat identified within the summer distribution was in Clearwater Fiord, in or near the estuary freshwater plume and in a bay to the west of the plume. The identified critical habitats should be areas of consideration in the continued discussion on the protection and sustainability of the Cumberland Sound beluga whale population.
1 Introduction
Identifying critical habitat is an important step in protecting key areas and ensuring the well-being of a species (Hoyt, 2011). Protection of critical habitat is particularly important for species and populations at risk, such as several populations of Arctic cetaceans. Hoyt (2011) defines critical habitat for cetaceans as an area regularly used by the species of interest that is essential to their continued survival and well-being. Critical areas can be identified through the frequent display of particular behaviors such as foraging or the presence of important resources like prey (e.g. Panigada et al., 2017; McGuire et al., 2020). Critical habitats can also be identified as high-use areas and have been defined using satellite tag movements (Baird et al., 2012) or areas of high concentrations of the target species (Awbery et al., 2022).
Estuaries, water bodies where the riverine fresh water and ocean salt water meet, specifically those that create a large visible plume, have been identified as critical or important habitat for several beluga whale (Delphinapterus leucas) populations (e.g., Moore et al., 2000; Smith et al., 2017; Whalen et al., 2020). Many of these Arctic estuaries are warmer than the surrounding ocean water, which may provide thermoregulation and skin sloughing benefits to whales (St. Aubin et al., 1990; Pitman et al., 2020; Whalen et al., 2020). Beluga whales are believed to use large estuaries as calving or nursing grounds and for skin proliferation (St. Aubin et al., 1990) and have site fidelity for these summering areas (COSEWIC, 2020). Smith et al. (2017) hypothesized that beluga whales may remain closest to where fresh and salt water mix to regulate skin proliferation, by controlling exposure to each water type. Beluga distribution may vary annually on a smaller scale around the mouth of the river that feeds the estuary, based on factors such as flowrate (Smith et al., 2017).
Cumberland Sound beluga whales are one such population that seasonally returns to an estuary. From July through September, these whales congregate in fiords at the far end of Cumberland Sound and regularly return to Clearwater Fiord and its estuary (Figure 1) (Richard and Orr, 1986; Kilabuk, 1998; Richard and Stewart, 2008; Richard, 2013; Watt et al., 2021a). Millut bay, which forms the estuary, has been identified as an important part of the beluga whale’s summering ground, based on acoustic monitoring (Booy et al., 2021). Cumberland Sound beluga whales are one of the smallest beluga populations in the world, having been heavily commercially hunted in the past, and continued hunting of this endangered population is likely unsustainable (COSEWIC, 2020; Watt et al., 2021a; Watt et al., 2021b). The latest aerial survey in 2017 resulted in a population estimate of 1381 (95%CI: 1270-1502) whales (Watt et al., 2021a) and an adjusted population estimate using environmental covariates of 1245 (95%CI: 564−2715) whales for 2018 (Biddlecombe and Watt, 2022). This population is currently listed by the Committee on the Status of Endangered Wildlife in Canada as Endangered and under the Species at Risk Act as Threatened (COSEWIC, 2021; Species at Risk Act, 2023). Continued monitoring of the abundance and distribution of this endangered population are essential for management decisions (COSEWIC, 2020; COSEWIC, 2021; Watt et al., 2021a).
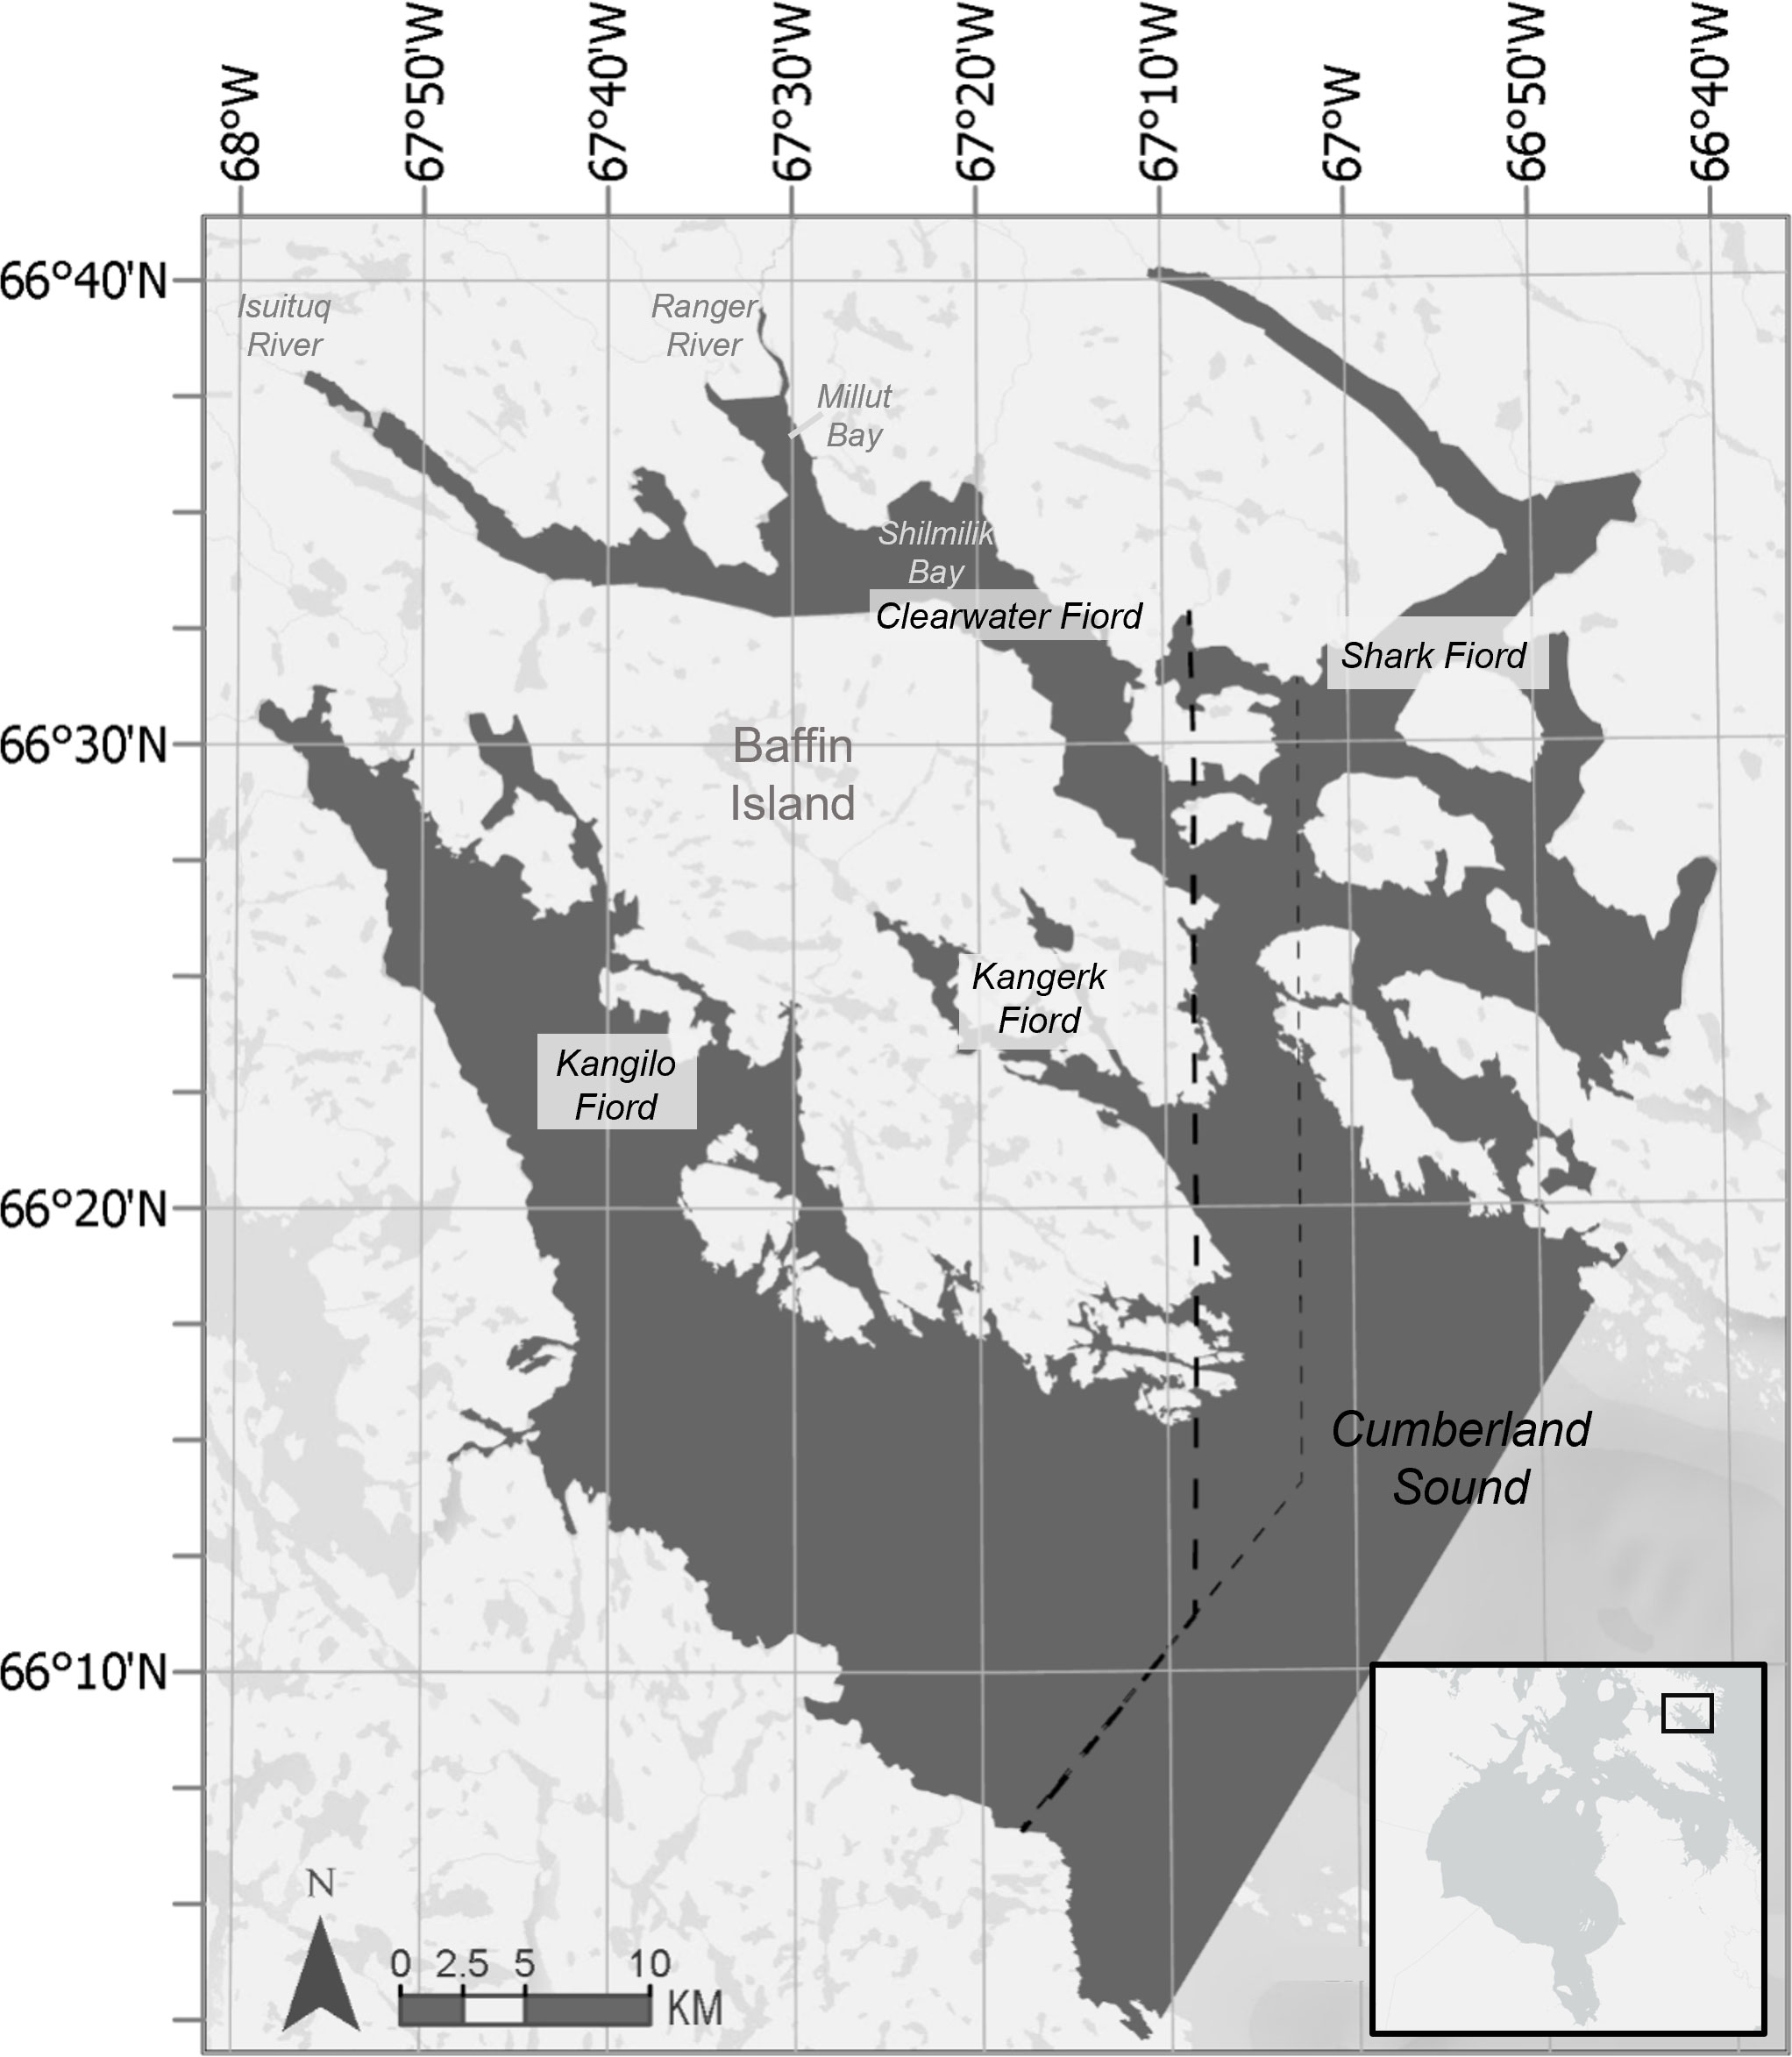
Figure 1 Map of northern Cumberland Sound, Baffin Island, Nunavut. Four fiords, Kangilo, Kangerk, Shark, and Clearwater, are indicated. Rivers and bays are labeled in grey. The dark grey shaded area depicts the maximum extent of the satellite images captured in 2022, with 1281 km2 of water covered. The thick dashed line depicts the border of the area used in abundance estimates based on the extent of September 7, 2021 images. The thin dashed line is the image extent for September 4, 2021.
An emerging tool in marine mammal research and monitoring that is particularly beneficial in remote locations, such as the Arctic, is Very High Resolution (VHR) satellite imagery (Höschle et al., 2021). Unlike many other survey methods, satellites guarantee a non-invasive and non-disruptive method of surveying whales that does not alter their behavior (Charry et al., 2021; Hammond et al., 2021). A very large area can be captured in one satellite image, which mitigates over or undercounting whales as a result of their fine-scale movements. While groups of whales can still be missed if coverage with the satellite is insufficient, this method does alleviate missing whales that may otherwise be hidden by coastlines and islands, which can occur in aerial surveys (Richard, 2013). The use of satellite imagery to monitor cetaceans is increasing and is most often used for large whale species such as humpbacks, blue whales, fin whales, and right whales (Cubaynes et al., 2019; Hodul et al., 2023). However, VHR satellites such as Worldview-2 and -3, which provide images at 50 cm, 40 cm, and 30 cm resolution (a measure of pixel size), have been identified as a feasible method to study medium-sized cetaceans like beluga whales (Charry et al., 2021; Fretwell et al., 2023; Watt et al., 2023). Although satellite imagery has been used to estimate beluga whale abundance (Watt et al., 2023), to our knowledge, it has yet to be used to evaluate cetacean distribution or identify critical habitat.
The objectives of this study were to evaluate summer abundance and distribution of Cumberland Sound beluga whales and identify critical habitat in Clearwater, Kangilo, Kangerk, and Shark Fiords (Figure 1) using satellite imagery collected in 2020, 2021, and 2022. Our study is the first examination of the fine-scale distribution of these beluga whales within the northern fiords of Cumberland Sound. In this study, we considered critical habitat as areas that are consistently part of the core distribution for beluga whales each summer. We expected that the estuary within Clearwater Fiord would be identified as critical habitat, but explored whether other areas and smaller estuaries may offer critical habitat as well. As a result of the short temporal span of our study (three years) and the large confidence intervals of abundance estimates (Watt et al., 2021a), we did not expect to detect significant changes in abundance over time.
2 Methods
2.1 Satellite images & whale detection
Satellite images of northern Cumberland Sound (N 66°25, W 67°20), specifically Clearwater, Kangilo, Kangerk, and Shark Fiords (Figure 1), were collected on September 4 and 7, 2021, and August 17, 2022 covering a maximum extent of 3124 km2 (1281 km2 of water). Additional images of Clearwater Fiord were collected August 21 and 30, 2020. The 2020 and 2021 images were taken with Maxar’s WorldView-3 satellite at 30 cm resolution and the 2022 images were from a WorldView-2 satellite at 50 cm resolution. Collection time was within a few weeks each summer and varied based on tasking availability of the satellite company and cloud cover of the area. All images used were cloud free, except August 21, 2020 which had some scattered clouds. Whale detections were possible through the clouds. Pan-sharpening was not conducted, as not all dates had a matching multi-spectral image.
For each date, multiple images were taken in strips by the satellite within 30 seconds to cover the whole area. The 2021 images were covered in three strips approximately 60 km by 16 km. The 2022 image was covered by two 75 km by 40 km strips. Overlap in images was systematically removed to avoid duplication in counts For each date, we selected either the right or left side consistently across all strips. The version (all left or all right) selected was the one with the most overall whales detected. The single band panchromatic satellite images were read in ArcMap (Version 10.8.1) at 1:800 or 1:1000, using a 250 m by 250 m grid for a systematic search. During image analysis, readers could zoom in or out to look at features and contextual cues. Objects of interest were marked using a two-level confidence system of possible whale (50-80% confident) and confident whale (>80% confident). Identifications of whales as confident instead of possible observations were made based on known formations, shapes, and group patterns observed in highly confident whale identifications. For example, two whales will often swim next to each other forming a “v” shape or in pod formations (Figure 2). A confident classification over a possible classification was more likely if other confidently identified beluga whales were present nearby, as they are a contextual cue. Once an image was read by the primary reader, the second reader would examine the marked points indicating agreement or disagreement. Points of disagreement were then discussed by the readers until a consensus was reached on whether the point of interest should be considered a confident whale or not. Locations of confidently identified whales are displayed in supplementary figures. Seals are also observable in satellite imagery, and harp seals (Pagophilus groenlandicus) in particular are found throughout Kangilo Fiord in large aggregations (personal observation), which could be misidentified as beluga whales. However, seals were distinguished from beluga whales by their smaller size and aggregations of seals were excluded. Narwhal (Monodon monoceros) may be occasional transients in the greater Cumberland Sound but are not a significant presence in the area (Dietz et al., 2008; Westdal et al., 2010).
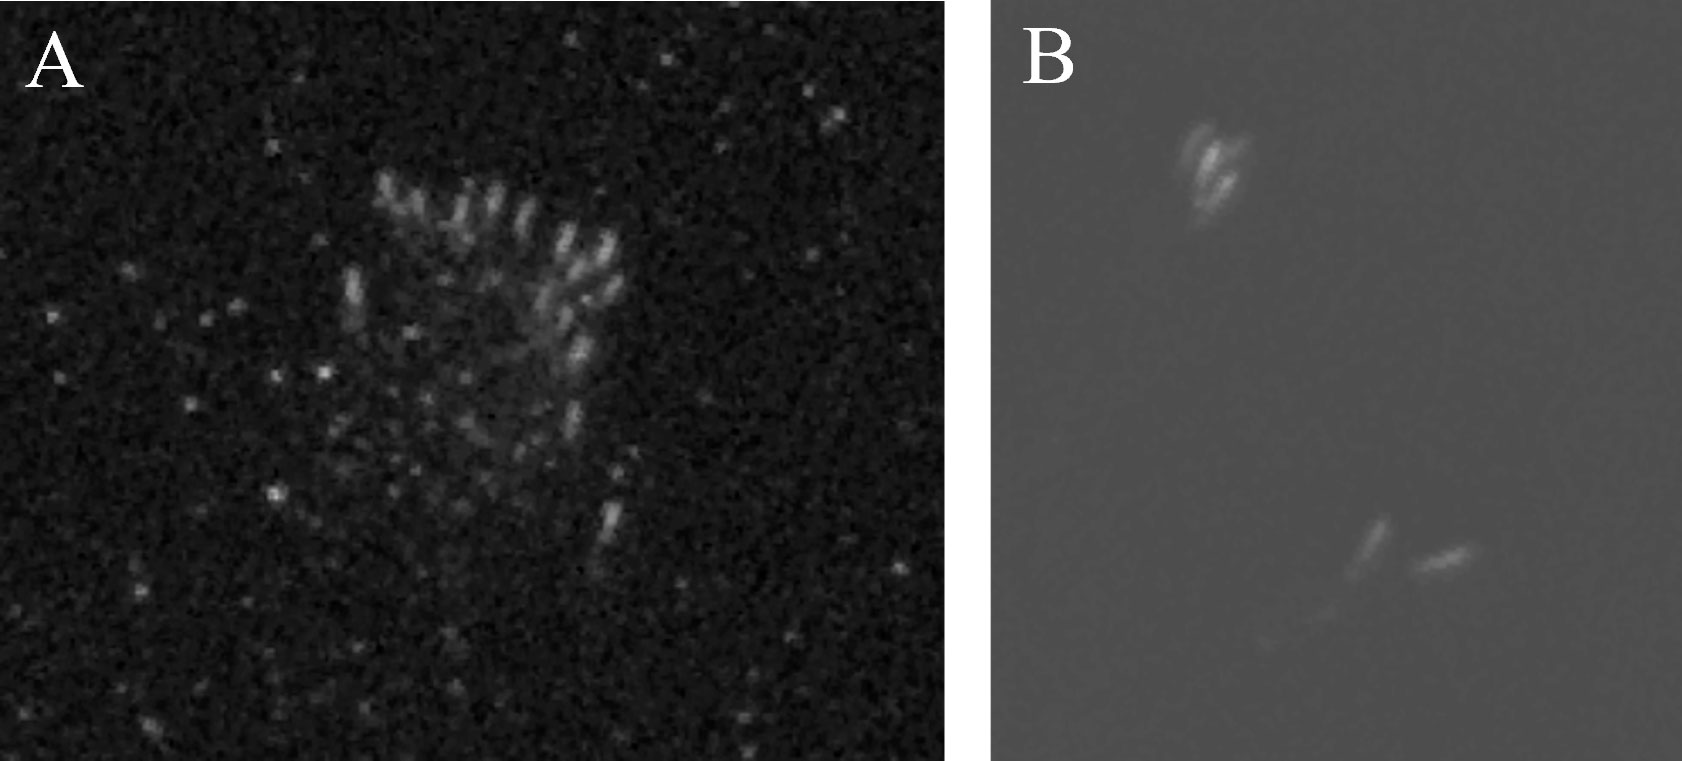
Figure 2 Examples of pod formations in panchromatic 30 cm WorldView-3 satellite images of beluga whales taken on Sept 7, 2021 in Kangilo Fiord, Nunavut (A) and Aug 30, 2020 in Clearwater Fiord, Nunavut (B) (republished under an end user license agreement with Maxar Technologies, original copyright 2021 and 2020, respectively).
The ability to detect whales in an image depends on water clarity, sea state, presence of surrounding sea ice, cloud cover, and light. Low light can reduce the amount of detail captured by the camera and excess light can cause reflection off the water’s surface. To help eliminate false identifications, additional resources such as Google Maps and images from other days were sometimes used. For instance, if an object of interest was suspected of being a rock, additional images could be viewed to determine whether that object was present in the same location on another day.
2.2 Distribution
Utilization distribution maps for the beluga whales on each date are presented as 50% utilization distribution to represent the core area and 95% utilization distribution representing the overall distribution of the confidently identified beluga whales (MacLeod, 2013). Utilization distributions represent an animals distribution and the probability of use throughout an area calculated using Kernel density estimates (KDE) (Whorton, 1989; Keating and Cherry, 2009). In this case we are presenting a population’s distribution based on the locations of observed individuals. KDEs are a proportional sum of kernel functions centered over each data point (Keating and Cherry, 2009). We calculated KDEs, with barriers, in ArcGIS Pro (Version 2.8.8). The barrier shape files include land, islands, and large rocks. ArcGIS uses an algorithm following Silverman’s rule of thumb (Silverman, 1986) to calculate the fixed bandwidth. A cell size of 15, and a geodesic method was used for all KDEs. KDEs were calculated for the entire surveyed area of northern Cumberland Sound in 2021 and 2022. KDEs were also separately calculated for all dates in Clearwater Fiord only. As Clearwater Fiord is a smaller area, the scale of the KDE changes. This KDE provides a finer resolution of beluga whale distribution within the fiord, which allows identification of specific high-density areas. Finally, to examine how the lower resolution (50 cm) image in 2022 may impact whale detectability, the 2020 images were down-sampled from 30 cm to 50 cm resolution and re-read by the same observer months later to compare the number of confidently identified whales.
2.3 Abundance estimates
Abundance estimates using confidently identified whales were calculated for Clearwater Fiord in all years. Abundance estimates (NC) were calculated for all fiords (Kangerk, Kangilo, and Clearwater) in 2021 and 2022. Due to the difference in area across dates, only whales found in the area extent of the smallest image (September 7) were included in abundance estimates (Figure 1). Shark Fiord is outside this image extent. To produce an abundance estimate, we needed to correct surface counts from the satellite imagery for whales that were too deep to be seen (referred to as availability bias). Based on Stewart et al. (unpublished data), beluga whales are visible in satellite imagery up to 2 m deep in clear water, and only at the surface in turbid water. Each near-surface estimate () was corrected for the instantaneous availability bias (Ca) calculated by Watt et al. (2021a) using average weighted time spent above a certain depth, obtained from 2006 satellite tag dive data in Clearwater Fiord (Orr et al., 2001; Richard and Stewart, 2008; Watt et al., 2021a). An availability bias correction factor of 2.06 (CV = 0.056), representing time above 2 m of depth, was applied to beluga counts outside the estuarine plume. Due to the opaqueness of the Millut Bay estuary plume (Figure 3), we assumed whales in this area were only seen at the surface in the satellite imagery. Therefore, an availability bias correction factor of 4.46 (CV= 0.117), representing time above 1 m of depth, was used to correct beluga counts within the plume. The corrected estimates (NC) were calculated using:
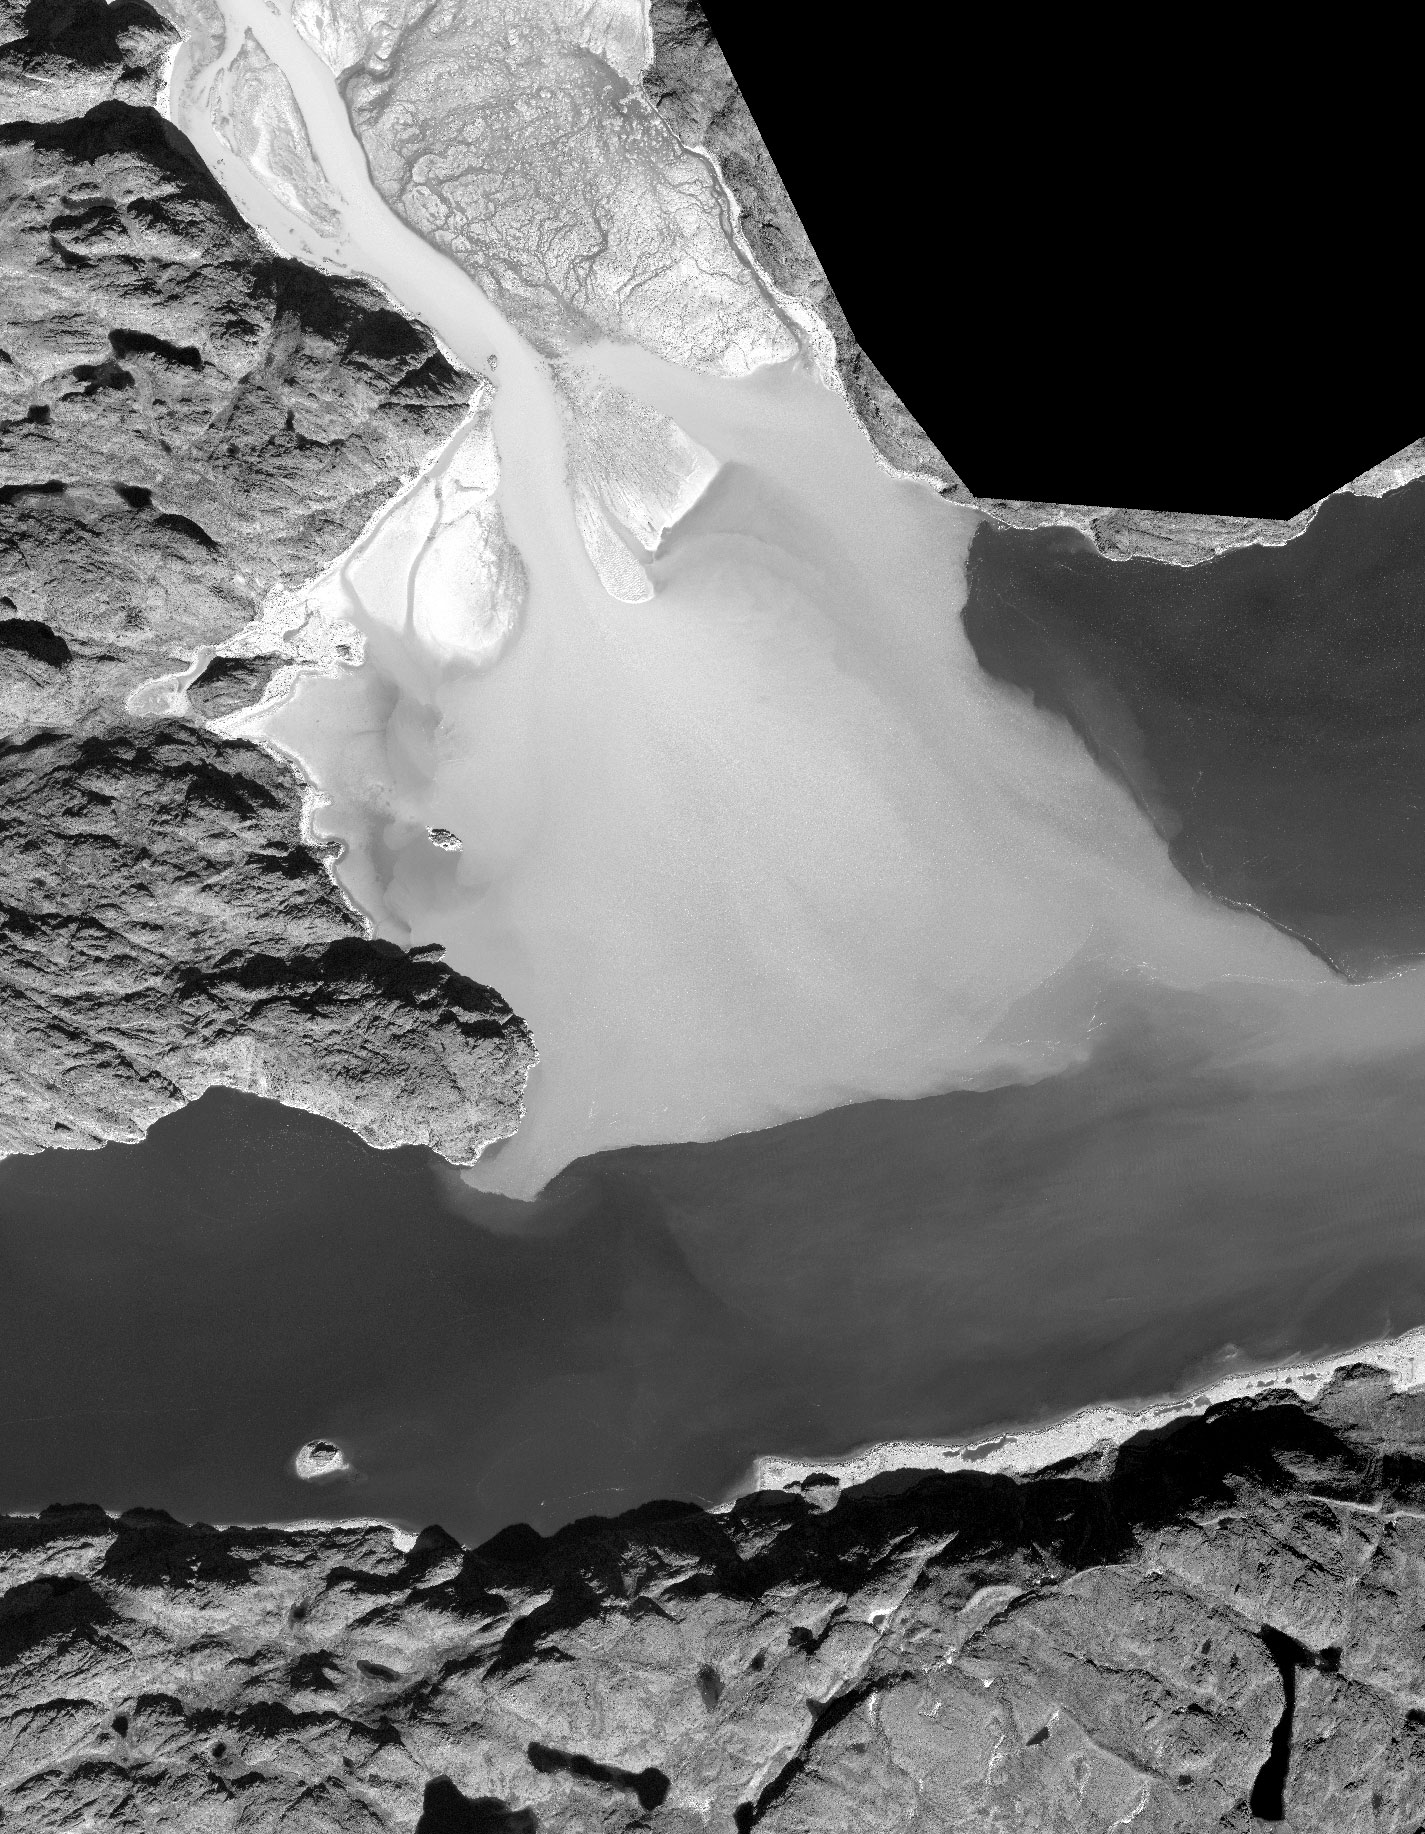
Figure 3 Clearwater Fiord estuary plume (light grey), Sept 7, 2021 (republished under an end user license agreement with Maxar Technologies, original copyright 2021).
Annual average estimates were calculated using a weighted average based on variance:
Confidence intervals (CI) for average estimates () were calculated following Buckland et al. (2001):
Where
Since the satellite images provide full-coverage of the region of analysis, and readers came to consensus on all detections, the coefficient of variation of the availability bias correction factor is the only variance in the abundance estimate.
3 Results
3.1 Distribution
Beluga whales were observed in Clearwater and Kangilo Fiords in all images that covered those respective areas. The distribution of beluga whales was most consistent within Clearwater Fiord, where whales were always identified within the estuary, in or near the freshwater plume. The freshwater plume shape and size differed from day to day, ranging from approximately 4 to 22 km2 (Table 1; Figure 4). The core area of the beluga distribution within Clearwater Fiord overlapped with the estuary plume on all dates except August 30, 2020 (Figure 4). On both 2020 dates, part of the core distribution was east of the estuary, in Shilmilik Bay (Figure 4). The whales were more tightly aggregated on August 30 compared to August 21, 2020 (Table 1). On some days, belugas were present toward the entrance of the fiord, but this area was never within the 50% utilization area. September 4, 2021 had the smallest 95% utilization distribution in Clearwater Fiord (1.67 km2; Table 1). Three days later on September 7, the belugas were more spread out throughout the estuary, with a 95% utilization distribution of 14 km2 (Table 1).
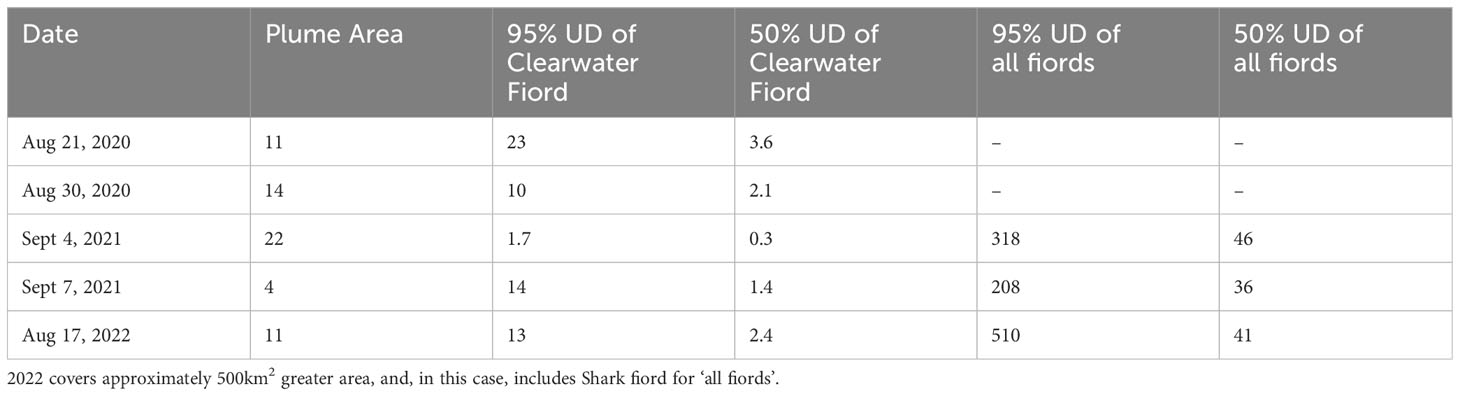
Table 1 Approximate extent (km2) of the estuary plumes and Kernel density estimate utilization distributions (UD) for each date imaged.
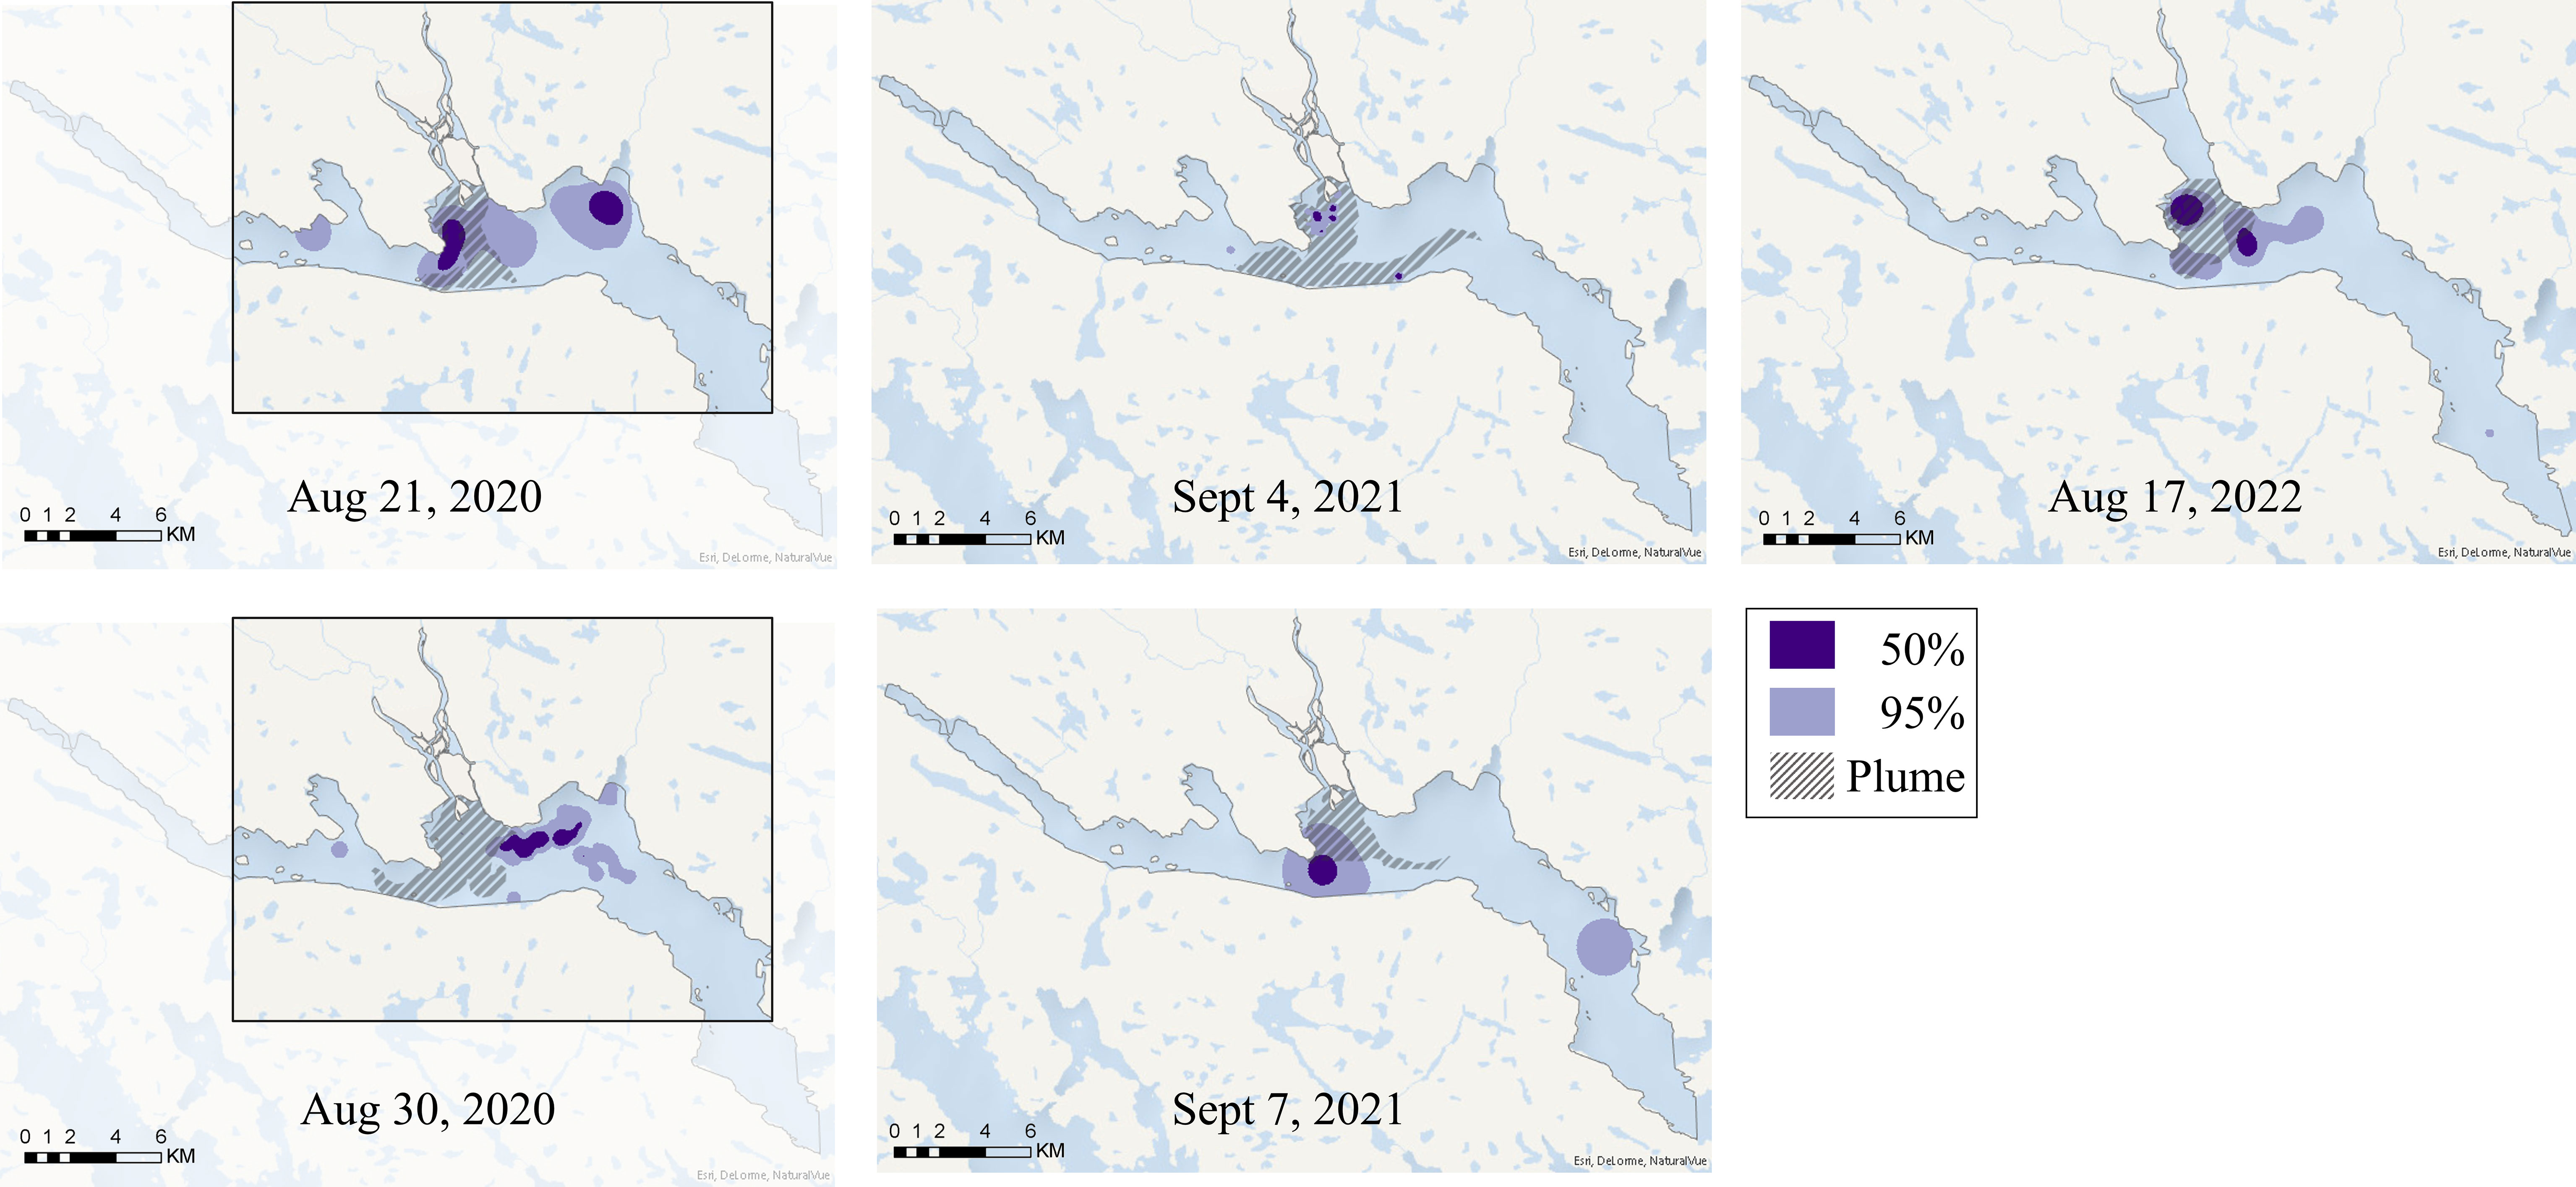
Figure 4 Kernel density estimates, based on satellite images, showing the 50% (dark purple) and 95% (light purple) utilization distribution of beluga whales in Clearwater Fiord. The extent of the 2020 images are bordered. The 2022 image was captured at high tide where the small islands at the mouth of Ranger River are covered by water.
Only one beluga was identified within Shark Fiord in 2022 (Supplementary Figure 7) and this area was not part of the 95% utilization distribution. While whales were present in Kangilo Fiord in all images collected, the distribution changed greatly from day to day and across years, with no consistent core areas (Figure 5). The majority of the whales observed within Kangilo Fiord were in small groups and widely dispersed. Kangerk Fiord, found near the entrance to Clearwater Fiord, was part of the 50% utilization distribution of whales on September 4, 2021 but not on September 7, 2021 (Figure 5).
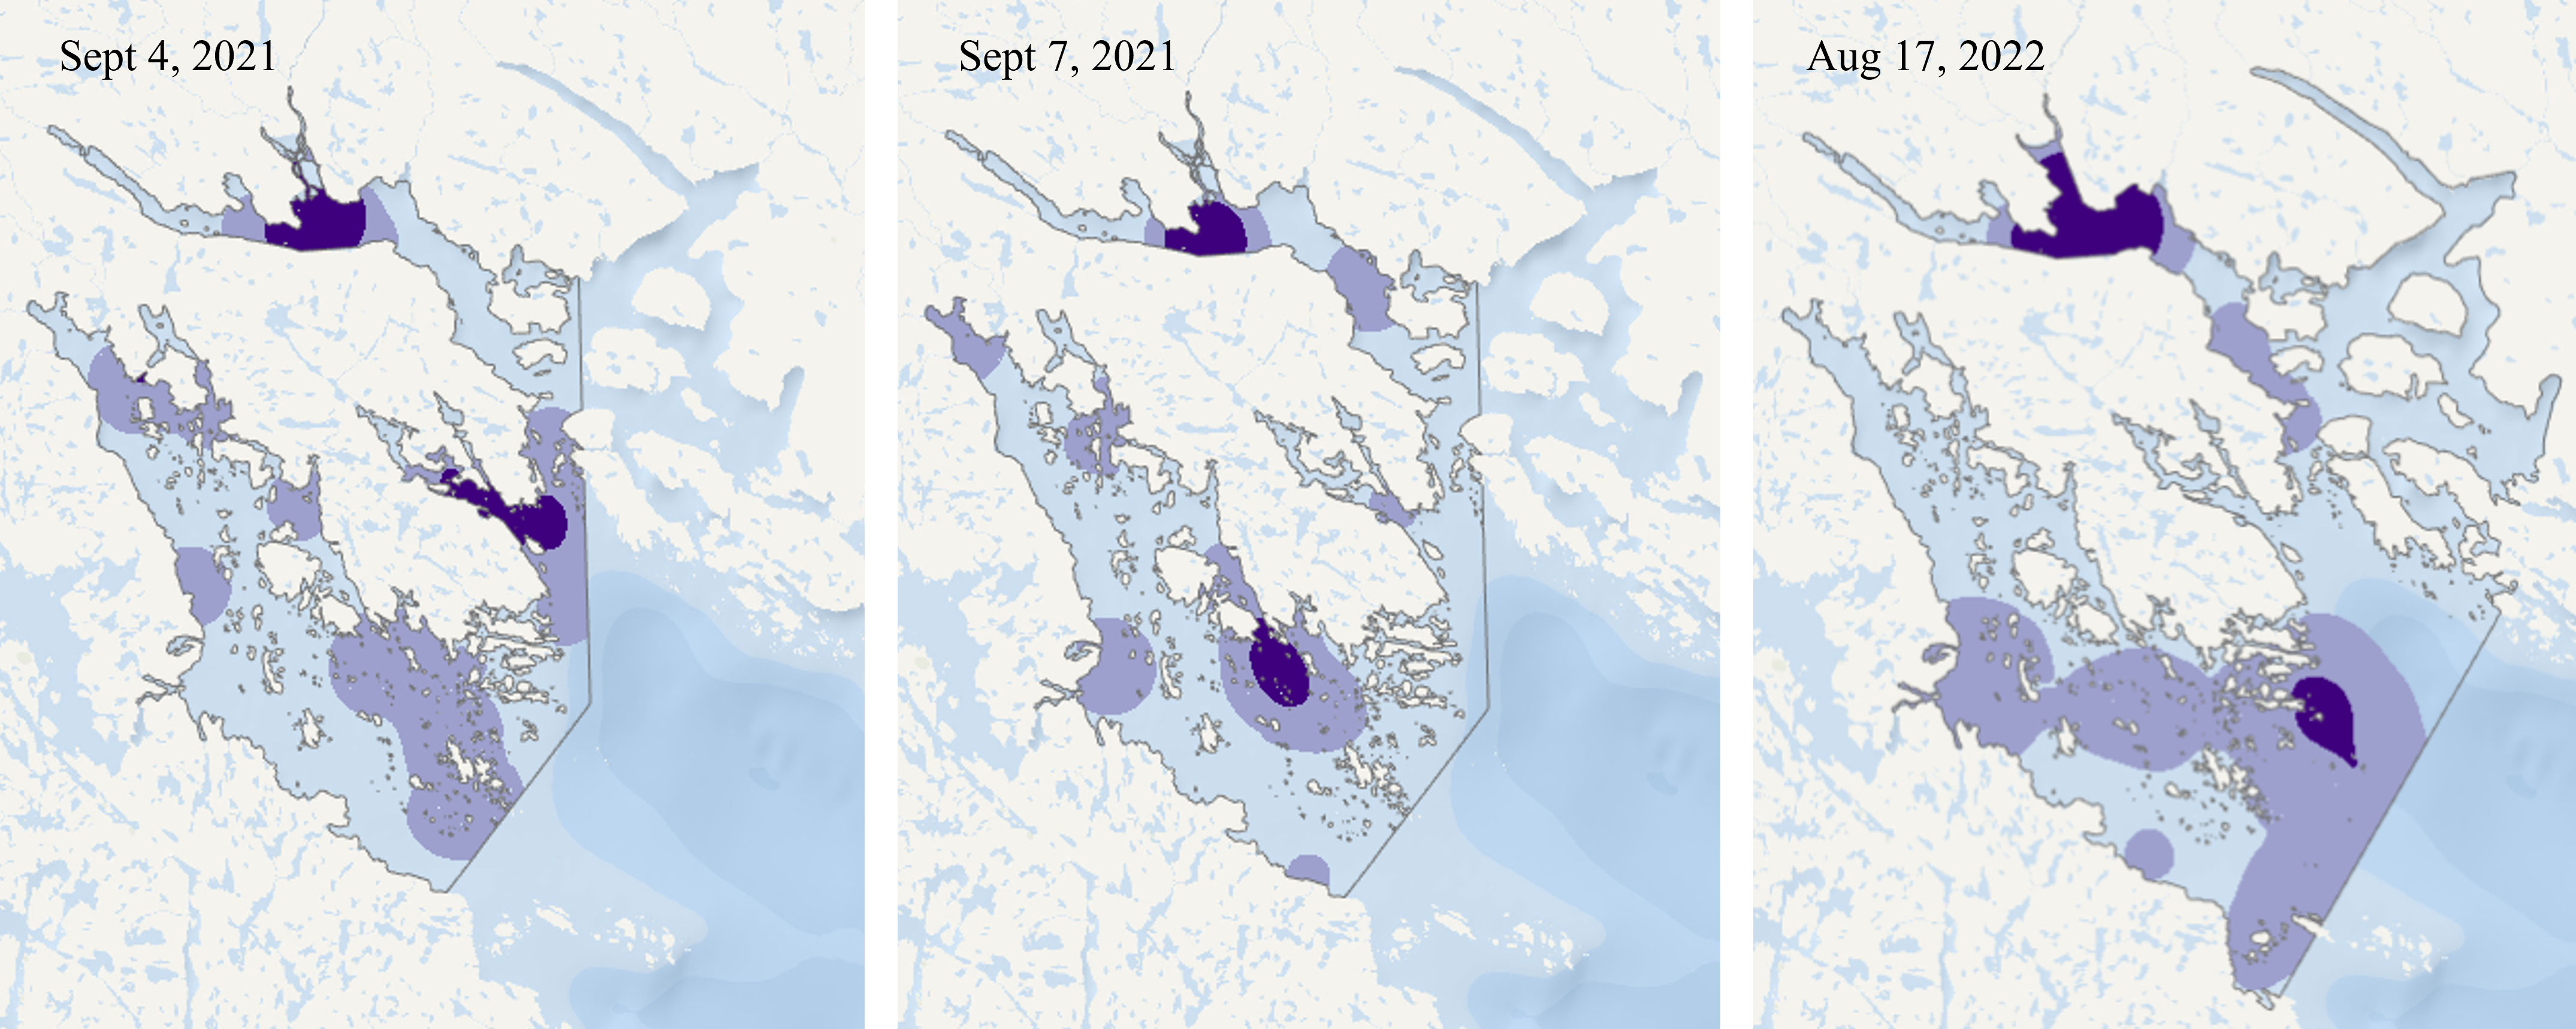
Figure 5 Kernel density estimates of beluga whales, based on satellite images, showing the 50% (dark purple) and 95% (light purple) utilization distribution throughout the northern fiords of Cumberland Sound (Clearwater, Kangilo, Kangerk, and Shark Fiords). Note that 2022 has ~500 km2 larger extent, as shown by the outline.
The two 2020 images down-sampled to a 50 cm resolution had 15% and 45% fewer belugas confidently observed than in the original 30 cm image. However, utilization distributions remained relatively similar, only with smaller core areas in the down-samples images. In the down sampled images, the August 21 50% utilization distribution was 3.4 km2 compared to the original 3.6 km2 and August 30 was 1.8 km2 compared to the 2.1 km2 in the 30 cm resolution.
3.2 Abundance estimates
The highest number of beluga whales observed near-surface in Clearwater Fiord was 202 (unadjusted count) on August 30, 2020 (Table 2). The average corrected abundance estimate for Clearwater Fiord was 393 (CV = 0.036; 95%CI: 366-422) beluga whales in 2020, 197 (CV = 0.047; 95%CI: 180-216) in 2021, and 194 (CV = 0.06; 95%CI: 172-218) in 2022. For all fiords combined, the average corrected estimate was 462 (CV = 0.042; 95%CI: 425-502) beluga whales in 2021 and 252 (CV = 0.054; 95%CI: 226-280; Table 2) beluga whales in 2022 (Table 2).
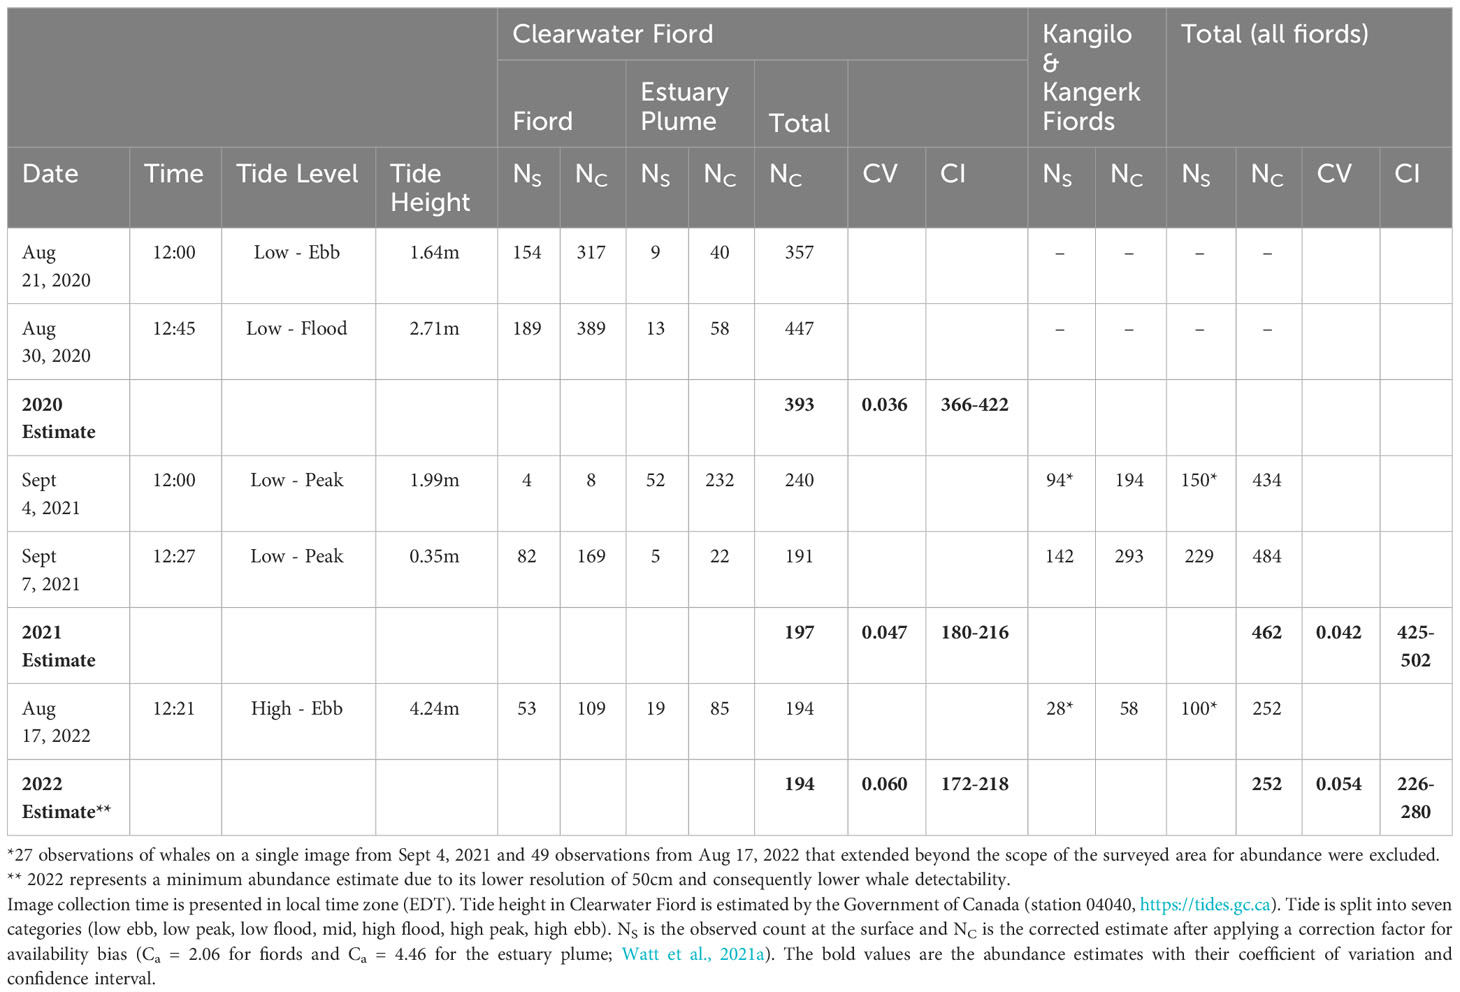
Table 2 Estimates of beluga whale abundance in Clearwater Fiord, and a ‘total’ estimate when combined with Kangilo and Kangerk Fiords.
4 Discussion
Beluga whales have been present in Clearwater Fiord and Kangilo Fiord for decades and continue to return during summer (Kilabuk, 1998; Watt et al., 2021a). While there is the recurring presence of whales within Kangilo and Kangerk Fiords, it does not appear to be centralized in a specific location. On the other hand, beluga whales are present in the central part of Clearwater Fiord on all surveyed dates and we identify this area as critical habitat. Within our study, whales were mainly observed in and around the Millut Bay estuary plume, with the core distribution extending into Shilmilik Bay in 2020. Beluga whales were not identified in Ranger River, which appeared quite shallow in the satellite images.
4.1 Clearwater Fiord
The preference for the two bays in Clearwater Fiord has been previously observed. Hydrophones in Shilmilik Bay recorded five times more calls than the entrance of the fiord, and Millut Bay had 19 times more calls (Booy et al., 2021). The 2014 and 2017 aerial surveys also found beluga whales primarily spread out across Shilmilik Bay and the estuary (Marcoux et al., 2016; Watt et al., 2021a). The August 2017 aerial surveys show movement to and from each area over eight days (four days of observation; Watt et al., 2021a). A similar pattern can be seen in the August 1999 aerial survey. From August 6 to 8, 1999, beluga whales were observed in highest abundance progressively from Shilmilik Bay to the estuary (Richard and Stewart, 2008). The similarity in distribution of beluga whales across time and survey methods further supports the importance of this area as critical habitat for this population, and also demonstrates that satellite imagery is a comparable tool to identify beluga whale distribution.
Whale distribution between the estuary and Shilmilik Bay can change within days. Average beluga speeds have been measured at 3.7 km/h and 3.98 km/h (Lydersen et al., 2001; Richard et al., 2001). At this speed, belugas can reasonably travel the 4 to 6 km between the two bays in under two hours and may make a return trip within the same day. What motivates these changes in distribution across the bays is currently unknown. The transition to Shilmilik Bay does not appear to be directly influenced by the size and shape of the estuary plume (Figure 4). However, it is possible that underwater currents from the river influx, not visible at the surface, flow into the downstream Shilmilik Bay, which may influence beluga whale distribution, if the river plume is important. Tide cycles can influence beluga whale movement, changing salinity and access to shallower areas (Ezer et al., 2008; Ezer et al., 2013; Smith et al., 2017), which could influence whale movement between the two bays. However, both 2020 and 2021 images, with beluga whales observed primarily in Shilmilik and the estuary, respectively, were collected at low tide (Table 1). The upper portion of Millut Bay is relatively shallow (Richard and Stewart, 2008); however, fine scale bathymetry is not available. Time of day also does not appear to influence beluga distribution within Clearwater Fiord. The 2014 surveys were primarily conducted in the morning and the beluga observations were spread out over the two bays (Marcoux et al., 2016). The 2017 surveys, which had a strong presence of beluga within Shilmilik Bay, were conducted in the afternoon. However, our images were all collected between noon and 1PM EDT and showed concentrated distribution in the estuary on both days in 2021 (Table 1). In addition, Booy et al. (2021) did not find any correlation between peak vocalization patterns and tide or time of day in either bay.
4.2 Estuaries
Estuaries, such as that in Clearwater Fiord, are an important part of summer distribution for many beluga whale populations, including Western Hudson Bay, Cook Inlet, and Eastern Beaufort Sea beluga whales (Goetz et al., 2012; Smith et al., 2017; Whalen et al., 2020). Many estuaries are considered calving grounds. Calves are undetectable at a 30 cm resolution in satellite images, and therefore calf presence throughout the fiords could not be assessed in this study. Calves may be observable in higher resolutions such as 10 or 15 cm, but the technology is not currently commercially available. Brodie (1971) observed young calves in Clearwater Fiord, and Inuit recognize this area as a primary calving ground (Kilabuk, 1998). Warm estuarine waters may help slough skin and aid in calf thermoregulation (St. Aubin et al., 1990; Watts et al., 1991; Pitman et al., 2020; Whalen et al., 2020). However, the Clearwater Fiord estuary is fed by Ranger River, which is said to be much colder than the surrounding salt water (Richard and Stewart, 2008) because the river input is actually glacial water from the Penny Ice Cap. Shilmilik Bay has a small river offshoot from Ranger River, rather than the main input into Millut Bay that creates the large estuary, and therefore may be warmer than the plume and may contribute to beluga movement between the bays.
Despite the apparent cooler waters of Clearwater Fiord compared to other estuaries, Inuit indicate whales enter Clearwater Fiord with a yellow coating, commonly present on beluga in spring (St. Aubin et al., 1990), and use the waters to molt, returning to their white coloration (Kilabuk, 1998). In estuaries in the Eastern Beaufort Sea, belugas preferentially selected areas of rough substrates, which may be beneficial for exfoliation (Whalen et al., 2020). Those beluga whales in the estuary were also found to concentrate in shallow waters, which may be another preferred environmental characteristic potentially beneficial for calving (Fraker et al., 1979; Whalen et al., 2020). Most of Clearwater Fiord is relatively deep, with parts reaching 190 m in depth (Richard and Stewart, 2008); however, more detailed bathymetry mapping is needed to compare with beluga distribution. While warm water is described as preferential for beluga whales, such as in Scharffenberg et al. (2019), these authors were unable to separate the effects of salinity and water temperature on beluga distribution, since freshwater was the warmest. Direct investigation into the temperature differences among fresh, brackish, and salt water across estuaries would provide additional insight into the benefit of warm water. The presence of fresh water influx may be more or equally important for beluga, possibly for skin proliferation. The abundant nutrients provided by freshwater (Lamberti et al., 2010) and increased primary productivity can lead to an abundance of prey (Reichert et al., 2010; Antell and Saupe, 2021), potentially influencing the belugas’ movement between the two bays.
While there are other river inputs throughout the study area, the Millut Bay estuary is the only one with a substantial riverine plume. No beluga whales were observed near Isuituq River, at the western end of Clearwater Fiord, which does not have direct glacial input. No whales were observed within the small estuary at the most northern end of Kangilo Fiord. Only one group and three lone whales were observed on September 7, 2021, in the farthest part of the fiord, near but not in the small estuary (Supplementary Figure 7). This estuary has narrow access with slight rapids, which may contribute to its lack of use by the whales, and the water input is from Kipisa Lake (Tallman and Marcoux, 2021), which also does not have direct glacial water input. Whales were observed in this area during the 2014 and 2017 aerial surveys in groups under 10 individuals (Watt et al., 2021a). While there is repeated presence of belugas in this area, it is not in large numbers nor part of the core areas in our KDE.
4.3 Abundance estimates
Our Clearwater Fiord abundance estimates are lower than previous years of 603 beluga whales in 2014 and 1286 in 2017 (Watt et al., 2021a), and 2021 and 2022 have significantly lower abundance estimates than 2020. Unfortunately, we cannot evaluate whether this higher abundance in Clearwater Fiord in 2020 resulted in a lower abundance in the neighboring fiords as those areas were not imaged. While the abundance estimate for all fiords is much lower in 2022 compared to 2021, 2022 only represents a minimum abundance estimate, since whale detectability in 50 cm resolution images is lower than in 30 cm images. Based on the down-sampled images at 50 cm resolution, the lower counts in 2022 can, in part, be attributed to lower image resolution. The difference in the percentage of missed whales between the two down-sampled images may be due to cloud cover and areas of low light. The down-sampled image with 45% of confidently identified whales missed had dark shadows cast by the thicker clouds, in addition to a thin cloud cover over most of the image, potentially making it more difficult to detect lower resolution beluga whales. Beluga whales are typically under one meter in width, meaning a 50 cm resolution image only has one or two pixels in width per beluga, compared to three or four in a 30 cm image. The reduction in resolution affects the shape of the beluga in the image and can impact a reader’s ability to detect or confirm it as a whale. A 30 cm or higher resolution is preferred for detection and monitoring of beluga whales using satellite imagery.
While our abundance estimates do not include the whole population of Cumberland Sound, as whales can be observed throughout the western strata (the south-west half of Cumberland Sound) in summer (Watt et al., 2021a), they do provide a new estimate for the northern fiords and Clearwater Fiord in particular. Our estimate is likely conservative, as whales in the estuary plume can only be seen at the surface and likely not 1 m deep, and the dive data resolution is insufficient to evaluate time at surface. Continued exploration of the comparison between aerial and satellite surveys is important for establishing accurate abundance estimates. Despite these limitations, the satellite imagery abundance estimates from Clearwater Fiord may suggest a decline in beluga whales since the most recent aerial survey estimates in 2014 and 2017, which estimated 603 and 1286 whales in the fiord respectively (Watt et al., 2021a).
4.4 Conclusion
While Cumberland Sound beluga whales have a continued presence in both Kangilo and Clearwater Fiord, no specific area within Kangilo, Kangerk, or Shark Fiords could be considered critical habitat that is used consistently by the beluga whales. Richard and Stewart (2008) also saw the primary congregation of beluga in Clearwater Fiord. Within Clearwater Fiord, we identified the estuary and its large plume as critical habitat. While beluga whales were not present in Shilmilik Bay across the years of our study, we suggest this bay may act as critical habitat based on the repeated presence of beluga whales within the bay in 2020 and past aerial surveys. The comparison of beluga distribution across time in Shilmilik Bay using previous surveys to illuminate trends shows the importance of long-term studies when researching animals. Long-term data are important for identifying patterns that may not be evident in short temporal spans. Our results also demonstrate that VHR satellite imagery is an effective tool for monitoring beluga whale abundance and distribution. It is clear that Clearwater Fiord bays and its estuary are consistently used by beluga whales across time. However, the specific use of these areas is still unknown. One study has used VHR imagery to infer beluga behavior by evaluating the positioning and orientation of beluga whales (Fretwell et al., 2023). In our study, there was no consistent directionality or positioning of whales, which may suggest that multiple behaviors are occurring in this critical habitat. Further investigation on the drivers of the movement between these two bays could provide insight into estuary and habitat use. Finally, continued minimal boat traffic and noise (Booy et al., 2021) and locally enforced laws that ban hunting in the fiord (Kilabuk, 1998) particularly in these critical habitats, may prove beneficial to the belugas’ wellbeing and survival.
Data availability statement
The datasets presented in this article are not readily available because the satellite images are not available for distribution due to the copyright agreement with Maxar. Beluga locations are provided as figures in the Supplementary Material. These image annotations could also be available in the form of shape files upon request. Requests to access the datasets should be directed to YmVsYW5nMjFAbXl1bWFuaXRvYmEuY2E= or Y29ydG5leS53YXR0QGRmby1tcG8uZ2MuY2E=.
Ethics statement
Ethical approval was not required for the study involving animals in accordance with the local legislation and institutional requirements because there was no handling or interaction with animals during the study, method was 100% non-invasive.
Author contributions
AB: Conceptualization, Formal analysis, Methodology, Writing – original draft, Writing – review & editing, Investigation. BS: Investigation, Project administration, Writing – review & editing. JR: Supervision, Writing – review & editing. CW: Conceptualization, Funding acquisition, Methodology, Project administration, Supervision, Writing – review & editing.
Funding
The author(s) declare financial support was received for the research, authorship, and/or publication of this article. We thank Species at Risk and Crown-Indigenous Relations and Northern Affairs Canada (CIRNAC) for funding which supported this research.
Acknowledgments
Thanks to MDA, Maxar, and John Iacozza and Jordan Stewart for technical support. Also thanks to two reviewers for their comments which improved the final version of this paper.
Conflict of interest
The authors declare that the research was conducted in the absence of any commercial or financial relationships that could be construed as a potential conflict of interest.
Publisher’s note
All claims expressed in this article are solely those of the authors and do not necessarily represent those of their affiliated organizations, or those of the publisher, the editors and the reviewers. Any product that may be evaluated in this article, or claim that may be made by its manufacturer, is not guaranteed or endorsed by the publisher.
Supplementary material
The Supplementary Material for this article can be found online at: https://www.frontiersin.org/articles/10.3389/fmars.2023.1305536/full#supplementary-material
References
Antell G. T., Saupe E. E. (2021). Bottom-up controls , ecological revolutions and diversification in the oceans through time. Curr. Biol. 31, R1237–R1251. doi: 10.1016/j.cub.2021.08.069
Awbery T., Akkaya A., Lyne P., Rudd L., Hoogenstrijd G., Nedelcu M., et al. (2022). Spatial distribution and encounter rates of delphinids and deep diving cetaceans in the eastern mediterranean sea of Turkey and the extent of overlap with areas of dense marine traffic. Front. Mar. Sci. 9. doi: 10.3389/fmars.2022.860242
Baird R., Hanson M., Schorr G., Webster D., McSweeney D., Gorgone A., et al. (2012). Range and primary habitats of Hawaiian insular false killer whales: informing determination of critical habitat. Endanger. Species Res. 18, 47–61. doi: 10.3354/esr00435
Biddlecombe B. A., Watt C. A. (2022). Incorporating environmental covariates into a Bayesian stock production model for the endangered Cumberland Sound beluga population. Endanger. Species Res. 48, 51–65. doi: 10.3354/esr01186
Booy K. V., Mouy X., Ferguson S. H., Marcoux M. (2021). Spatio-temporal summer distribution of Cumberland Sound beluga whales (Delphinapterus leucas) in Clearwater Fiord, Nunavut, Canada. Arct. Sci. 7, 394–412. doi: 10.1139/as-2019-0031
Brodie P. F. (1971). A reconsideration of aspects of growth, reproduction, and behavior of the white whale (Delphinapterus leucas), with reference to the cumberland sound, baffin island, population. J. Fish. Res. Board Canada 28 (9), 1309–1318. doi: 10.1139/f71-198
Buckland S. T., Anderson D. R., Burnham K. P., Laake J. L., Borchers D. L., Thomas L. (2001). Introduction to distance sampling: estimating abundance of biological populations (New York, N.Y. USA: Oxford University Press).
Charry B., Tissier E., Iacozza J., Marcoux M., Watt C. A. (2021). Mapping Arctic cetaceans from space: a case study for beluga and narwhal. PloS One 16, 1–14. doi: 10.1371/journal.pone.0254380
COSEWIC. (2020). COSEWIC assessment and status report on the Beluga Whale Delphinapterus leucas, Eastern High Arctic - Baffin Bay population, Cumberland Sound population, Ungava Bay population, Western Hudson Bay population, Eastern Hudson Bay population and James Bay population in Canada (Ottawa: Committee on the Status of Endangered Wildlife in Canada) xxxv + 84 pp. Available at: https://www.Canada.ca/en/environment-climate-change/services/species-risk-public-registry.html.
COSEWIC. (2021). COSEWIC Annual Report (Ottawa: Committee on the Status of Endangered Wildlife in Canada). Available at: https://species-registry.Canada.ca/index-en.html#/species/130-276.
Cubaynes H. C., Fretwell P. T., Bamford C., Gerrish L., Jackson J. A. (2019). Whales from space: Four mysticete species described using new VHR satellite imagery. Mar. Mammal Sci. 35, 466–491. doi: 10.1111/mms.12544
Dietz R., Heide-Jørgensen M. P., Richard P., Orr O., Laidre K., Schmidt H. C. (2008). Movements of narwhals (Monodon monoceros) from Admiralty Inlet monitored by satellite telemetry. Polar Biol. 31, 1295–1306. doi: 10.1007/s00300-008-0466-4
Ezer T., Ashford J. R., Jones C. M., Mahoney B. A., Hobbs R. C. (2013). Physical-biological interactions in a subarctic estuary: How do environmental and physical factors impact the movement and survival of beluga whales in Cook Inlet, Alaska? J. Mar. Syst. 111–112, 120–129. doi: 10.1016/j.jmarsys.2012.10.007
Ezer T., Hobbs R., Oey L. Y. (2008). On the movement of beluga whales in Cook Inlet, Alaska: Simulations of tidal and environmental impacts using a hydrodynamic inundation model. Oceanography 21 (4), 186–195. doi: 10.5670/oceanog.2008.17
Fraker M. A., Gordon C. D., McDonald J. W., Ford J. K. B., Cambers G. (1979). White whale (Delphinapterus leucas) distribution and abundance and the relationship to the physical and chemical characteristics of the Mackenzie Estuary. Can. Fish. Mar. Serv. Tech. Rep. 863, v+56. Available at: https://waves-vagues.dfo-mpo.gc.ca/library-bibliotheque/20122.pdf.
Fretwell P. T., Cubaynes H. C., Shpak O. V. (2023). Satellite image survey of beluga whales in the southern Kara Sea. Mar. Mammal Sci. 39 (4), 1204–1214. doi: 10.1111/mms.13044
Goetz K. T., Montgomery R. A., Ver Hoef J. M., Hobbs R. C., Johnson D. S. (2012). Identifying essential summer habitat of the endangered beluga whale Delphinapterus leucas in Cook Inlet, Alaska. Endanger. Species Res. 16, 135–147. doi: 10.3354/esr00394
Hammond P. S., Francis T. B., Heinemann D., Long K. J., Moore J. E., Punt A. E., et al. (2021). Estimating the abundance of marine mammal populations. Front. Mar. Sci. 8. doi: 10.3389/fmars.2021.735770
Hodul M., Knudby A., Mckenna B., Brown M., James A., Mayo C., et al. (2023). Individual North Atlantic right whales identified from space. Mar. Mammal Sci. 39, 220–231. doi: 10.1111/mms.12971
Höschle C., Cubaynes H. C., Clarke P. J., Humphries G., Borowicz A. (2021). The potential of satellite imagery for surveying whales. Sensors 21 (3), 963. doi: 10.3390/s21030963
Hoyt E. (2011). Marine Protected Areas for Whales, Dolphins and Porpoises: A World Handbook for Cetacean Habitat Conservation, and Planning. 2nd ed (Abingdon, UK: Earthscan).
Keating K. A., Cherry S. (2009). Modeling utilization distributions in space and time. Ecology. 90 (7), 1971–1198. doi: 10.1890/08-1131.1
Kilabuk P. (1998). A study of inuit knowledge of the southeast baffin beluga (Iqaluit, NU: Nunavut Wildlife Management Board), 74.
Lamberti G. A., Chaloner D. T., Hershey A. E. (2010). Linkages among aquatic ecosystems. J. North Am. Benthol. Soc 29, 245–263. doi: 10.1899/08-166.1
Lydersen C., Martin A. R., Kovacs K. M., Gjert I. (2001). Summer and Autumn movements of white whales Delphinapterus leucas in Svalbard, Norway. Mar. Ecol. Prog. Ser. 219, 265–274. doi: 10.3354/meps219265
Marcoux M., Young B. G., Asselin N. C., Watt C. A., Dunn J. B., Ferguson S. H. (2016). Estimate of Cumberland Sound beluga (Delphinapterus leucas) population size from the 2014 visual and photographic aerial survey. DFO Can. Sci. Advis. Sec. Res. Doc. 037. iv + 19 p. Available at: https://publications.gc.ca/collections/collection_2016/mpo-dfo/Fs70-5-2016-037-eng.pdf.
McGuire T. L., Himes Boor G. K., McClung J. R., Stephens A. D., Garner C., Shelden K. E. W., et al. (2020). Distribution and habitat use by endangered Cook Inlet beluga whales: Patterns observed during a photo-identification study 2005–2017. Aquat. Conserv. Mar. Freshw. Ecosyst. 30, 2402–2427. doi: 10.1002/aqc.3378
MacLeod C. D. (2013). An introduction to collecting and analysing cetacean survey data. Course Manual (Gardenstown Scotland: Cetacean Reasearch and Rescure Unit). Available at: www.GISinEcology.com.
Moore S. E., Shelden K. E. W., Litzky L. K., Mahoney B. A., Rugh D. J. (2000). Beluga, delphinapterus leucas, habitat associations in cook inlet, alaska. Mar. Fish. Rev. 62, 60–80. Available at: https://spo.nmfs.noaa.gov/sites/default/files/pdf-content/MFR/mfr623/mfr6237.pdf.
Orr J. R., Joe R., Evic D. (2001). Capturing and handling of white whales (Delphinapterus leucas) in the Canadian arctic for instrumentation and release. Arctic 54, 299–304. doi: 10.14430/arctic789
Panigada S., Donovan G. P., Druon J., Lauriano G., Pierantonio N., Pirotta E., et al. (2017). Satellite tagging of Mediterranean fin whales: working towards the identification of critical habitats and the focussing of mitigation measures. Sci. Rep. 7, 1–12. doi: 10.1038/s41598-017-03560-9
Pitman R. L., Durban J. W., Joyce T., Fearnbach H., Panigada S., Lauriano G. (2020). Skin in the game: Epidermal molt as a driver of long-distance migration in whales. Mar. Mammal Sci. 36, 565–594. doi: 10.1111/MMS.12661
Reichert J. M., Fryer B. J., Pangle K. L., Johnson T. B., Tyson J. T., Drelich A. B., et al. (2010). River-plume use during the pelagic larval stage benefits recruitment of a lentic fish. Can. J. Fish. Aquat. Sci. 67, 987–1004. doi: 10.1139/F10-036
Richard P. R. (2013). Size and trend of the Cumberland Sound beluga whale population 1990 to 2009. DFO Can. Sci. Advis. Sec. Res. Doc. 159. iii + 28 p. Available at: https://waves-vagues.dfo-mpo.gc.ca/library-bibliotheque/347932.pdf.
Richard P. R., Heide-Jørgensen M. P., Orr J. R., Dietz R., Smith T. G. (2001). Summer and autumn movements and habitat use by belugas in the canadian high arctic and adjacent areas. Arctic 54 (3), 207–355. doi: 10.14430/arctic782
Richard P. R., Orr J. R. (1986). A review of the status and harvest of white whales (Delphinapterus leucas) in the cumberland sound area, baffin island. Can. Tech. Rep. Aquat. Sci. 1447. iv + 25 p. Available at: https://publications.gc.ca/collections/collection_2013/mpo-dfo/Fs97-6-1447-eng.pdf.
Richard P. R., Stewart D. B. (2008). Information relevant to the identification of critical habitat for cumberland sound belugas (Delphinapterus leucas). DFO Can. Sci. Advis. Sec. Res. Doc. 085. iv + 24 p. Available at: https://waves-vagues.dfo-mpo.gc.ca/library-bibliotheque/336597.pdf.
Scharffenberg K., Whalen D., Marcoux M., Iacozza J., Davoren G., Loseto L. (2019). Environmental drivers of beluga whale Delphinapterus leucas habitat use in the Mackenzie Estuary, Northwest Territories, Canada. Mar. Ecol. Prog. Ser. 626, 209–226. doi: 10.3354/meps13011
Silverman B. W. (1986). Density estimation for statistics and data analysis (New York, New York, USA: Chapman and Hall). doi: 10.1201/9781315140919
Smith A. J., Higdon J. W., Richard P., Orr J., Bernhardt W., Ferguson S. H. (2017). Beluga whale summer habitat associations in the Nelson River estuary, western Hudson Bay, Canada. PloS One 12, e0181045. doi: 10.1371/journal.pone.0181045
Species at Risk Act (2023) Species at Risk Act / Loi sur les espèces en péril. Available at: https://laws-lois.justice.gc.ca/eng/acts/S-15.3/.
St. Aubin D. J., Smith T. G., Geraci J. R. (1990). Seasonal epidermal molt in beluga whales, Delphinapterus leucas. Can. J. Zool. 68, 359–367. doi: 10.1139/z90-051
Tallman R. F., Marcoux M. (2021). Review of the ecosystem approach in Cumberland Sound, Nunavut, Canada. Arct. Sci. 7, 376–393. doi: 10.1139/as-2019-0035
Watt C. A., Carlyle C. G., Hornby C. A., Sherbo B. A. H. (2023). Eastern High Arctic – Baffin Bay beluga whale (Delphinapterus leucas) estuary abundance and use from space. Front. Mammal Sci. 2. doi: 10.3389/fmamm.2023.1208276
Watt C. A., Marcoux M., Ferguson S. H., Hammill M. O., Matthews C. J. D. (2021a). Population dynamics of the threatened Cumberland Sound beluga (Delphinapterus leucas) population. Arct. Sci. 7, 545–566. doi: 10.1139/as-2019-0030
Watt C. A., Marcoux M., Hammill M. O., Montsion L., Hornby C., Charry B., et al. (2021b). Abundance and total allowable landed catch estimates from the 2017 aerial survey of the Cumberland Sound beluga (Delphinapterus leucas) population. DFO Can. Sci. Advis. Sec. Res. Doc. 050. iv + 33 p. Available at: https://publications.gc.ca/collections/collection_2021/mpo-dfo/fs70-5/Fs70-5-2021-050-eng.pdf.
Watts P. D., Draper B. A., Henrico J. (1991). Preferential use of warm water habitat by adult beluga whales. J. Therm. Biol. 16, 57–60. doi: 10.1016/0306-4565(91)90053-5
Westdal K. H., Richard P. R., Orr J. R. (2010). “Migration Route and Seasonal Home Range of the Northern Hudson Bay Narwhal (Monodon monoceros),” in A Little Less Arctic. Eds. Ferguson S. H., Loseto L. L., Mallory M. L. (Dordrecht: Springer). doi: 10.1007/978-90-481-9121-5_4
Whalen D., Loseto L. L., Hornby C. A., Harwood L., Hansen-Craik K. (2020). Mapping and understanding the role of seabed morphology in relation to beluga whale (Delphinapterus leucas) hotspots and habitat use in the mackenzie estuary, NT. Estuaries Coasts 43, 161–173. doi: 10.1007/s12237-019-00653-8
Keywords: estuary, Kernel density estimate (KDE), critical habitat, white whale, Clearwater Fiord, Delphinapterus leucas, WorldView-3, cetacean
Citation: Belanger AM, Sherbo BAH, Roth JD and Watt CA (2024) Use of satellite imagery to estimate distribution and abundance of Cumberland Sound beluga whales reveals frequent use of a glacial river estuary. Front. Mar. Sci. 10:1305536. doi: 10.3389/fmars.2023.1305536
Received: 02 October 2023; Accepted: 12 December 2023;
Published: 08 January 2024.
Edited by:
Lars Bejder, University of Hawaii at Manoa, United StatesReviewed by:
Amelia Meier, University of Hawaii at Manoa, United StatesKelly Macleod, Joint Nature Conservation Committee, United Kingdom
Copyright © 2024 Belanger, Sherbo, Roth and Watt. This is an open-access article distributed under the terms of the Creative Commons Attribution License (CC BY). The use, distribution or reproduction in other forums is permitted, provided the original author(s) and the copyright owner(s) are credited and that the original publication in this journal is cited, in accordance with accepted academic practice. No use, distribution or reproduction is permitted which does not comply with these terms.
*Correspondence: Amanda M. Belanger, YmVsYW5nMjFAbXl1bWFuaXRvYmEuY2E=