- Environmental Laboratory, U.S. Army Engineer Research and Development Center, Vicksburg, MS, United States
Coastal wetlands provide a variety of ecological functions that sustain biodiverse habitats, serve as barriers to storm surge, regulate biogeochemical cycles, and yield ecosystem goods and services that benefit society. The magnitude of wetland functional delivery varies with geomorphology and landscape position, hydropattern and hydrodynamics, vegetation structure and composition, soil properties, and microbial community assemblages and activities. Here we describe soil physicochemical and microbial diversity along a vegetation and salinity gradient in the Mobile Bay estuary, AL, USA and discuss how these factors feedback on ecosystem characteristics and the delivery of ecological functions. We incorporated microbial biomass, diversity, and community composition into patterns of dominant vegetation cover type and soil properties. Stepwise model selection using permutation tests indicated that vegetation type >> soil horizon > and salinity strongly influenced microbe-soil relationships. The dominant variables governing microbial content were total sulfur concentration in surface soils and nitrate and nitrite (NOx) for subsurface soils. All biotic and abiotic variables indicated that seasonally inundated forested wetlands represented a distinct microbial biome within the Mobile Bay estuary compared to more frequently flooded and increasingly salt-tolerant Typha, tidal shrub, and Juncus wetland types. Compared with the other wetland types examined for this study, forested wetlands contained ~80% less organic carbon content, ~75% less nitrogen, ~33% less phosphorus, and ~95% less sulfur. Our results show the benefit of incorporating microbial trait data, including metataxonomics, enzymatics, and biomass, with other ecosystem properties such as vegetation and soil characterization data.
1 Introduction
Wetlands display unique characteristics due to their geomorphic position at the interface of terrestrial and aquatic ecosystems, representing one of the planet’s most productive and dynamic landforms (Mitsch and Gosselink, 2015). Wetlands provide a diverse array of societally beneficial ecosystem functions, including natural infrastructure that dissipates wave energy, reduces storm surge, and provides storage for floodwaters; a biogeochemically reactive “core” that cycles nutrients, sequesters carbon, and retains and transforms elements and compounds; and habitat functions that support a wide array of fish and wildlife species (Smith et al., 1995). However, the degree to which wetlands deliver these valuable ecosystem functions varies widely based on intersections of the substrate supporting the wetland, water quality and hydropattern, and the biota utilizing the system. For example, wave attenuation mechanisms differ between dense stands of herbaceous vegetation, i.e., healthy salt marsh, and a more sparsely vegetated forested wetland characterized by large trees (Feagin et al., 2011). As a result, wetland classification schemes evolved to characterize these systems using readily observable differences in substrates, water sources and hydrodynamics, and vegetation community composition (Cowardin, 1979). For several decades, wetland classification approaches have linked wetland hydrogeomorphology with ecological functional capacity, providing opportunities to evaluate the current condition of wetlands and estimate the implications of natural or anthropogenic perturbations to wetland performance (Brinson et al., 1995).
Coastal zone impacts from both natural and anthropogenic disturbances influence the functional capacity of wetlands (Hauser et al., 2015). As the anticipated changes in coastal ecosystem forcings (e.g., intensifying storms) continue to accelerate, linking potential shifts in wetland habitat type to underlying functional outcomes becomes increasingly important (Day et al., 2008). Predicting shifts in coastal ecosystem habitats and wetland functions is of interest to various stakeholders, including agricultural and aquacultural producers, conservation groups, homeowners, businesses, and other entities (Jurjonas and Seekamp, 2018). Additionally, the United States Department of Defense maintains over 1200 military installations in the United States, disproportionately located in coastal zones (valued at up to 100 billion USD), and vulnerable to modest increases in coastal inundations (~1 m, Union of Concerned Scientists, 2016). Current efforts are underway to improve the resiliency of military infrastructure under future climate scenarios (Bassetti et al., 2022). However, a paucity of information exists regarding the underlying mechanisms associated with shifts in wetland types and functions. The research described here focused on determining the relationships among ecological components (i.e., soil characteristics, vegetation community composition, and microbial traits) that combine to deliver wetland functions.
Most critical ecosystem functions provided by wetlands are directly related to soil microorganism dynamics, including carbon mineralization, nutrient cycling, and primary production, with recent attention focused on including microbial data in ecosystem modeling (Louis et al., 2016; Blankinship et al., 2018; Sulman et al., 2018). Historically, considerations of microbial traits included a combination of laboratory and field-derived parameters such as growth rate, biomass, maintenance and growth, respiration, and soil enzyme activity (Wallenstein and Hall, 2012). More recently, high throughput sequencing approaches combined with bioinformatic analysis and computational modeling have been used to extract discreet functional traits from in situ soil microbial communities to elucidate the specific genera and associated biochemical pathways involved in carbon mineralization and nutrient cycling (Malik et al., 2020 and references therein). Integrating microbial trait data with more traditional wetland classification methods, leveraging historic hydrogeomorphology with more recent bioinformatics, presents new opportunities for estimating wetland spatial and functional changes.
Our study site, located at Mobile Bay, Alabama, USA, represents both the second-largest estuary and the primary depositional basin for the sixth-largest river system in the United States. Mobile Bay is a managed, working estuary where maintenance dredging of the rivers and harbor and other activities occur to support navigation for commercial and economic development (Berkowitz et al., 2019). In addition, the area provides a convenient example of a dynamic yet vulnerable ecosystem that receives significant freshwater and associated sediment inputs in the upper portion of the Bay yet is subjected to periodic saltwater pulses and coastal inundation from storms in the Gulf of Mexico in its lower and mid-bay. As a result, the ecosystem trajectory of Mobile Bay is in constant flux between processes that either nourish or degrade the estuary, resulting in a diverse number (>40) of distinct wetland habitat types (Berkowitz at el., 2019).
To better understand wetland functional processes operating within Mobile Bay and the potential for shifts in wetland form and function as the result of climate instability or other perturbations, soil core samples were collected throughout along a salinity gradient to evaluate relationships between vegetation community composition, soil geochemical characteristics, and microbial trait data that inform our understanding of ecological function. We hypothesized that soil geochemistry and microbial community composition, diversity, and activity reflected patterns in vegetation coverage that may be altered under future climate scenarios. To test this hypothesis, we characterized the soil and microbial community characteristics of freshwater forested wetlands and three increasingly salt-tolerant wetland types.
2 Materials and methods
2.1 Sample location and collection
All soil samples were collected from the Mobile Bay estuary April 20-21, 2021. Low tide was ~0700 and high tide was ~1800. Each collection day ran ~1000-1400 to align with lowest possible water levels (<30 cm) and to keep daily tidal inundation between sites as consistent as possible. Sample locations were identified using wetland plant community maps described in Berkowitz et al. (2020), targeting the commonly encountered wetland types in the Bay while representing the wide gradient of vegetation salinity tolerances observed in the region (tolerance values derived from USDA, 2000). The elevation distribution of wetland plant communities was determined based on digital elevation mapping (Berkowitz et al., 2020). Samples were all collected within <50 km proximity of each other (Figure 1). Soil cores were collected at (i) triplicate freshwater hardwood forest wetlands (total of n=17 soil cores; salinity tolerance range for optimal growth = 0.0-1.3 ppt), (ii) triplicate Typha domingensis dominated emergent wetlands (n=18; 1.31-2.59 ppt), (iii) four replicate tidal shrub wetlands characterized by a mixture of herbaceous species interspersed with small pockets of sparse woody plants (n=24; 2.6-6.4 ppt), and (iv) triplicate Juncus roemerianus marshes (n=17; >6.4 ppt). Clear 60 cm long, 10 cm diameter core tubes were inserted into the soil, excavated, and sealed at both ends with rubber caps. Surface and subsurface horizons were identified based on the location of the organo-mineral interface. Cores were stored at 4°C prior to processing. The cores were processed as follows: The exterior tubing of each core was rinsed with 70% EtOH and cores were separated along the longitudinal axis allowing access to both surface and subsurface horizons. All soil cores were first subsampled for DNA analysis. The remaining soil material from each replicated sample location was separated by horizon, transferred to sterile bags, and manually mixed for physicochemical analysis.
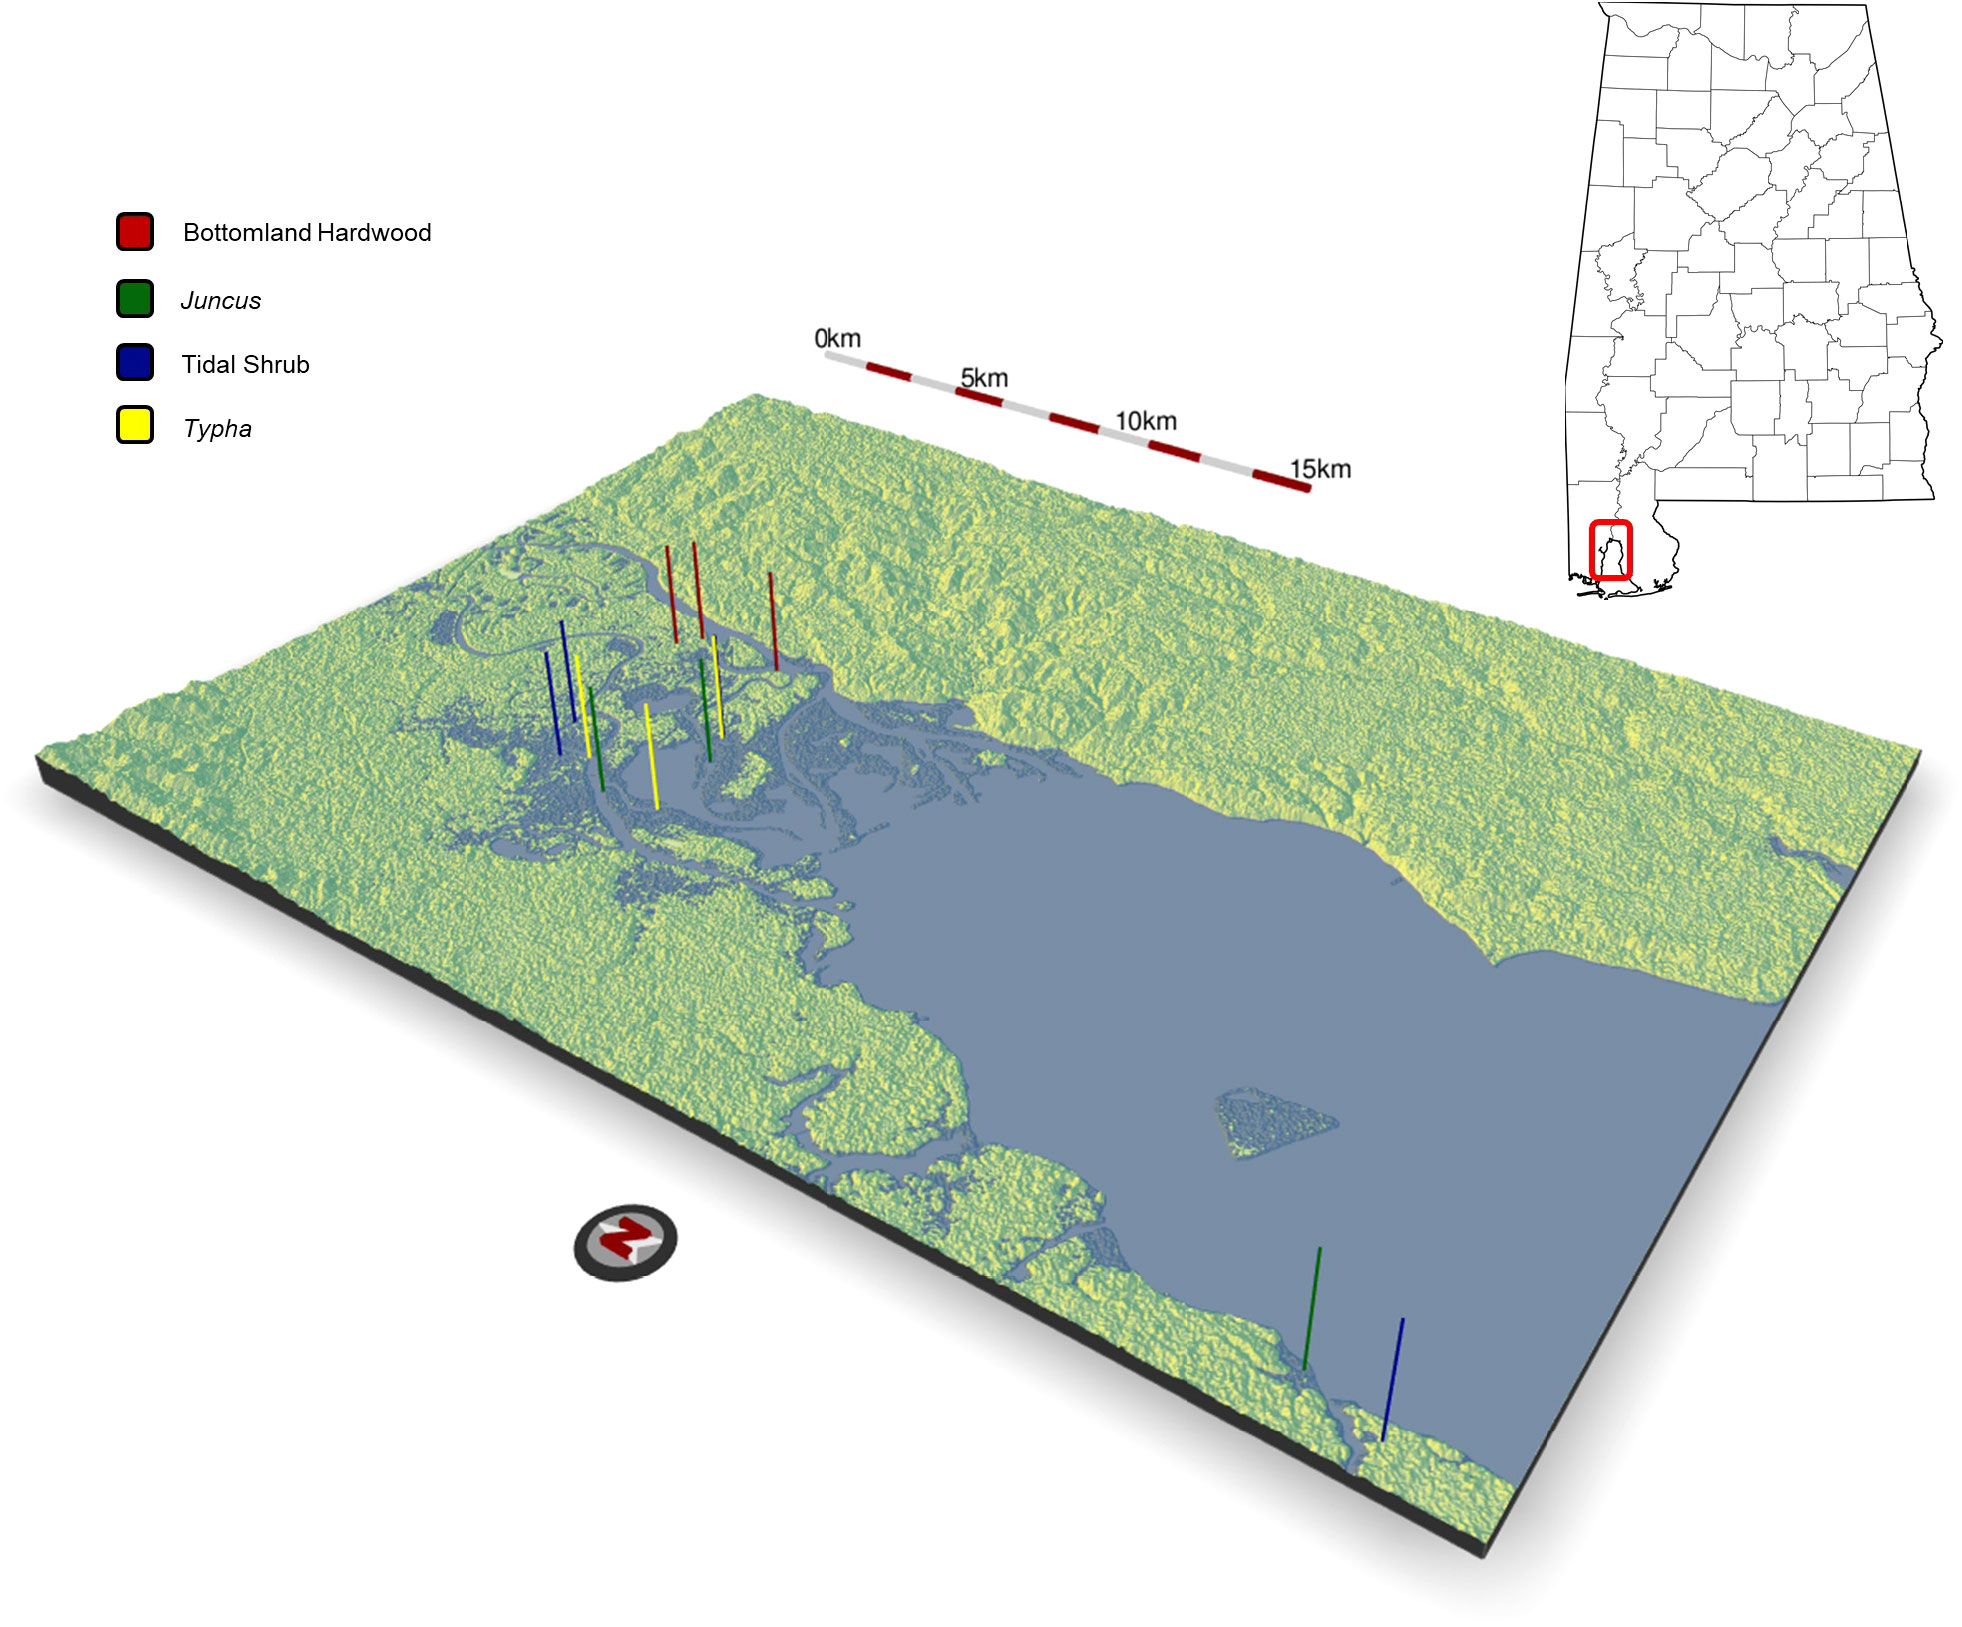
Figure 1 Topographic relief map of the upper Mobile Bay estuary where sediment samples were collected in April, 2021 from n=3 hardwood forest sites, n=3 Juncus sp. sites, n=4 tidal shrub sites, and n=3 Typha sp. sites. All sites were located within a distance <50 km. Map generated using the rayshader package in R.
2.2 Physicochemical analysis
Phospholipid fatty acid analysis (PLFA) was performed by Microbial Insights (Knoxville, TN) on 26 composited samples representing each marsh vegetation type. Viable microbial biomass was inferred from total PLFA biomarker abundance. Eukaryote abundance was inferred from polyenoic PLFA abundance. Metal reducer abundance was inferred from branched monomeric PLFA abundance. Modifications of monoenoic PLFAs which are abundant in Proteobacteria were used to infer growth rate and membrane permeability. Microbial biomass, reported as a cell count, was used to estimate microbiological abundance and activity in the sediment. Eukaryote abundance was used to estimate which wetland environment contained the most fungi relative to bacteria and archaea. Metal reducer abundance was used to infer iron and sulfur cycling as key processes in wetlands. Proteobacterial membrane proteins were used as an inference of total community stress status.
Fifty grams of wet soil from each sampling location were weighed and dried at 70°C until a constant weight was reached. Moisture content was calculated as the percentage of mass lost between wet and dry measurements. Dry bulk density was calculated as the total weight of the soil, corrected for moisture content and the volume of the soil core.
Soil extractable nutrients include nitrate and nitrite (NOx), ammonium (NH4+), and orthophosphate in the soil porewater or ionically complexed with soil particles. Orthophosphate is hereafter referred to as soluble reactive phosphorus (SRP) for the inorganic form of phosphorus directly taken up by plant cells. Nutrients were released from the soil complexes with the addition of KCl salts and measured via colorimetric methods. Analysis was performed via EPA Methods 353.2 Rev. 2.0, 350.1 Rev. 2.0, and 365.1 Rev. 2.0, respectively, for NOx, NH4+, and SRP (O’Dell, 1993) using a SEAL AQ2 Automated Discrete Analyzer (SEAL Analytical, Mequon, WI). Soil organic matter (SOM) content was determined via loss-on-ignition (LOI) at 550°C for 4 h. Soil porewater salinity was measured with a YSI probe from a centrifuged 1:5 slurry of field moist soil and ultrapure water (Steinmuller et al., 2020). Solid-phase organic (TOC) and inorganic (TIC) carbon were determined via a dynamic temperature ramping method with combustion temperatures of 400°C and 900°C, respectively. Analysis was performed via International Organization for Standardization, 2016 using an Elementar Soli TOC Cube (Elementar Americas, Inc., Mt Laurel, NJ). Soil carbon, nitrogen, and sulfur were determined by high-temperature combustion. Analysis was performed via International Organization for Standardization, 1996, AOAC 2012, and International Organization for Standardization, 2000 using an Elementar vario MAX cube (Elementar Americas, Inc., Mt Laurel, NJ).
Extracellular enzyme activity assays were performed using fluorescent 4-methylumbelliferone (MUF) for standardization and fluorescently labeled MUF substrates specific to each of the extracellular enzymes: β-1-4-glucosidase (β-glucosidase); β-N-acetylglucosaminidase (NAGase), and alkaline phosphatase as indicators of C, N, and P cycling, respectively. A 1:78 slurry of soil to Milli-Q water was made and shaken continuously at 25°C in the dark for 1 h to release the enzymes into solution (Kang et al., 2013). An aliquot of the soil slurry was mixed with fluorescently labeled MUF substrate. Excitation/emission wavelengths 360/460 were read on a BioTek Synergy HTX (BioTek Instruments, Inc., Winooski, VT, USA) immediately after mixing the slurry with substrate and after 24 h. Enzyme activities were calculated as converted fluorescence units to moles per gram of dry soil per hour.
2.3 DNA extraction, 16S rRNA gene amplification, and sequencing
In the lab, subsections of each sediment core were taken from the surface and the subsurface horizons using sterile utensils. DNA was extracted from each subsection using a Qiagen DNeasy PowerSoil Kit (Qiagen, Germantown, MD) following the standard protocol with the addition of a 10-minute, 70°C heating step prior to bead beating. PCR amplification of the V4 region of the 16S rRNA gene used the primers (515F/806R) and procedures recommended by the Earth Microbiome Project (Gilbert et al., 2014, https://earthmicrobiome.org/protocols-and-standards/16s/). Amplicons were cleaned using a Wizard SV Gel and PCR cleanup kit (Promega, Madison, WI) and quantified and qualified with NanoDrop. The amplicon library was normalized and prepared for sequencing following the protocol in Caporaso et al. (2011). Sequencing was performed on the Illumina MiSeq platform using a 300-cycle V2 Reagent Kit.
2.4 Sequence data processing
Illumina sequencing data was processed using DADA2 (Callahan et al., 2016). Read lengths were not truncated to ensure forward and reverse reads could be merged (sequencing used a 300-cycle kit, allowing <50 bp of overlap for ~254 bp V4 16S gene). However, a minimum length filter of 120 bp was set. Reads were pseudo-pooled to preserve resolution of rare taxa. Chimeras as well as merged sequences longer than 256 bp or shorter than 250 bp were removed. Amplicon sequence variants (ASVs) were classified against training set 18 of the Ribosomal Database Project (RDP) database (Maidak et al., 2000). Metagenomic predictions were performed using PICRUSt2 and the PICRUSt2_pipeline.py script (Douglas et al., 2020). Gene families (EC numbers) and KEGG orthologs corresponding to respiration and degradation activity were exported from the output table for analysis. Respiration pathways detected among the KEGG orthologs included aerobic respiration, nitrate reduction, sulfate reduction, methanogenesis, and fermentation. Degradation pathways detected included the breakdown of glucose, xylose, sucrose, and starch. Enzymes responsible for degradation found among the EC gene families included alpha- and beta-galactosidase, alpha- and beta-glucosidase, alpha-N-acetylglucosiminidase, acid and alkaline phosphatase, cellulase, chitinase, xylanase, and urease.
2.5 Statistical analysis
The effect of sediment horizon and vegetation cover on each measured physicochemical parameter, enzyme assay, and PLFA analysis was first assessed with a MANOVA. As these factors were significant (p<0.001) for all variables, individual ANOVAs were performed for each, followed by a Tukey posthoc test to determine pairwise differences. Correlations between the physicochemical conditions were tested using the cor.mtest function in the corrplot package. P-values were adjusted for multiple comparisons using the Benjamini, Hochberg, and Yekutieli method to control for the false discovery rate. Correlations between taxonomic abundance, inferred functional groups, and physicochemistry were determined using the same significance methods.
A phylogenetic tree of the 5,000 most abundant ASVs was created using the neighbor-joining method with the NJ and optim.pml functions in the phangorn package. A GTR substitution model was selected by comparing AIC scores returned by the modelTest function. Bray-Curtis, Jaccard, and weighted UniFrac distance matrices were generated using the distance function in the phyloseq package. Separate PERMANOVAs were performed with the adonis2 function in vegan for each distance matrix, with overlying vegetation, sediment horizon (surface v. subsurface), and porewater salinity as the independent variables. Pairwise PERMANOVAs were performed as a post-hoc test to determine the pairwise differences between plant species using both the pairwise.adonis function in the pairwiseAdonis package and the pairwise.perm.manova function in the RVAideMemoire package, with the model producing the higher adjusted p-values being selected. NMDS was performed using the metaMDS function in vegan (k=2, try=50, trymax=500) with returned 2D stress scores of 0.077-0.157.
To test the relative importance of the observed physicochemical parameters on the microbial community, the variance inflation factor (VIF) was used to reduce the effects of multicollinearity. The correlations of porewater salinity, moisture content, depth of the surface soil horizon, bulk density, soluble reactive phosphorus (SRP), nitrate + nitrite (NOx), ammonium (NH4+), total inorganic carbon (TIC), total organic carbon (TOC), percent N, and percent S were initially tested for the surface and subsurface soil horizons separately. Factors were removed stepwise by highest VIF with correlations re-tested until none had VIF >10. The final surface and subsurface soil models were scaled with a zero-center (mean = 0, SD = 1). Distance-based redundancy analysis (dbRDA) was performed using the dbrda function (vegan) against the retained factor models and with the Bray-Curtis distance matrix as the dependent variable. Final stepwise, bi-directional model selection was done with the ordistep function and a permutation test using the anova.cca function (vegan). Variables were ranked in importance by the AIC scores returned by ordistep and p-values for each factor were recorded from the permutational ANOVA. All analyses were performed in R Studio with R version 4.2.2.
3 Results
3.1 Soil physicochemistry
Porewater salinity in both the surface and subsurface horizons was higher in herbaceous-dominated wetland soils (Typha, tidal shrub, Juncus) compared to forested wetland soils, with the difference being more pronounced in the subsurface (α=0.05, Table 1; Figure 2). Forested wetlands possessed the lowest soil moisture content and highest bulk density of the wetland communities. Herbaceous wetland soil contained significantly higher TIC, TOC, and TC concentrations relative to forested wetland soil. Like C, total N and S percentages were highest in herbaceous wetland soils. Soluble Reactive Phosphorus (SRP) was highest in tidal shrub and Juncus sediment. Nitrate and nitrite (NOx) were the only nutrients observed at a significantly higher concentration in forested wetland soil than in herbaceous soil.
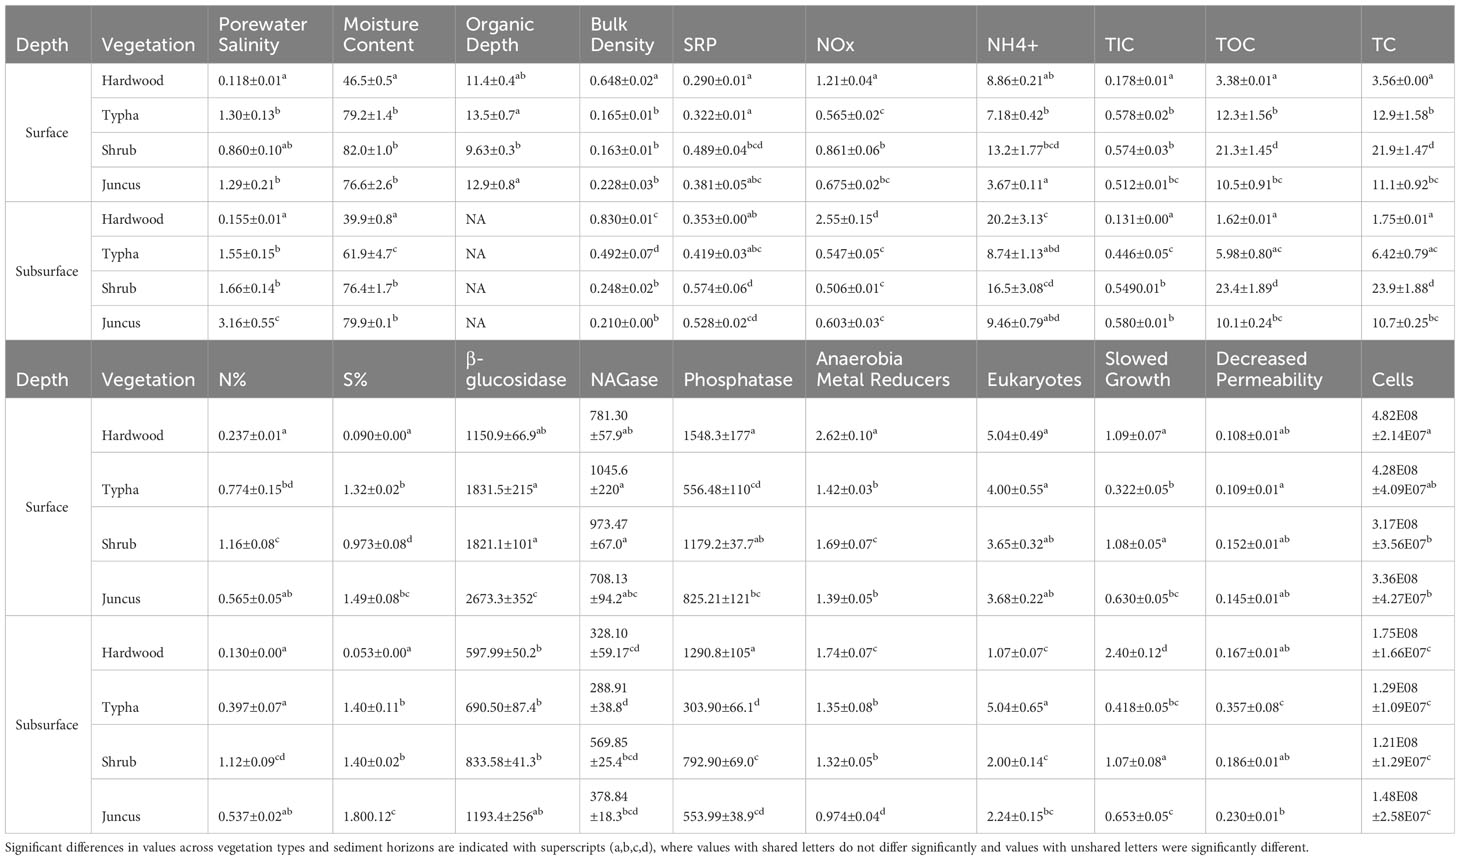
Table 1 Physicochemical parameters of wetland sediment samples collected from beneath hardwood (n=34), Typha sp. (n=36), tidal shrub (n=47), and Juncus sp. (n=34).
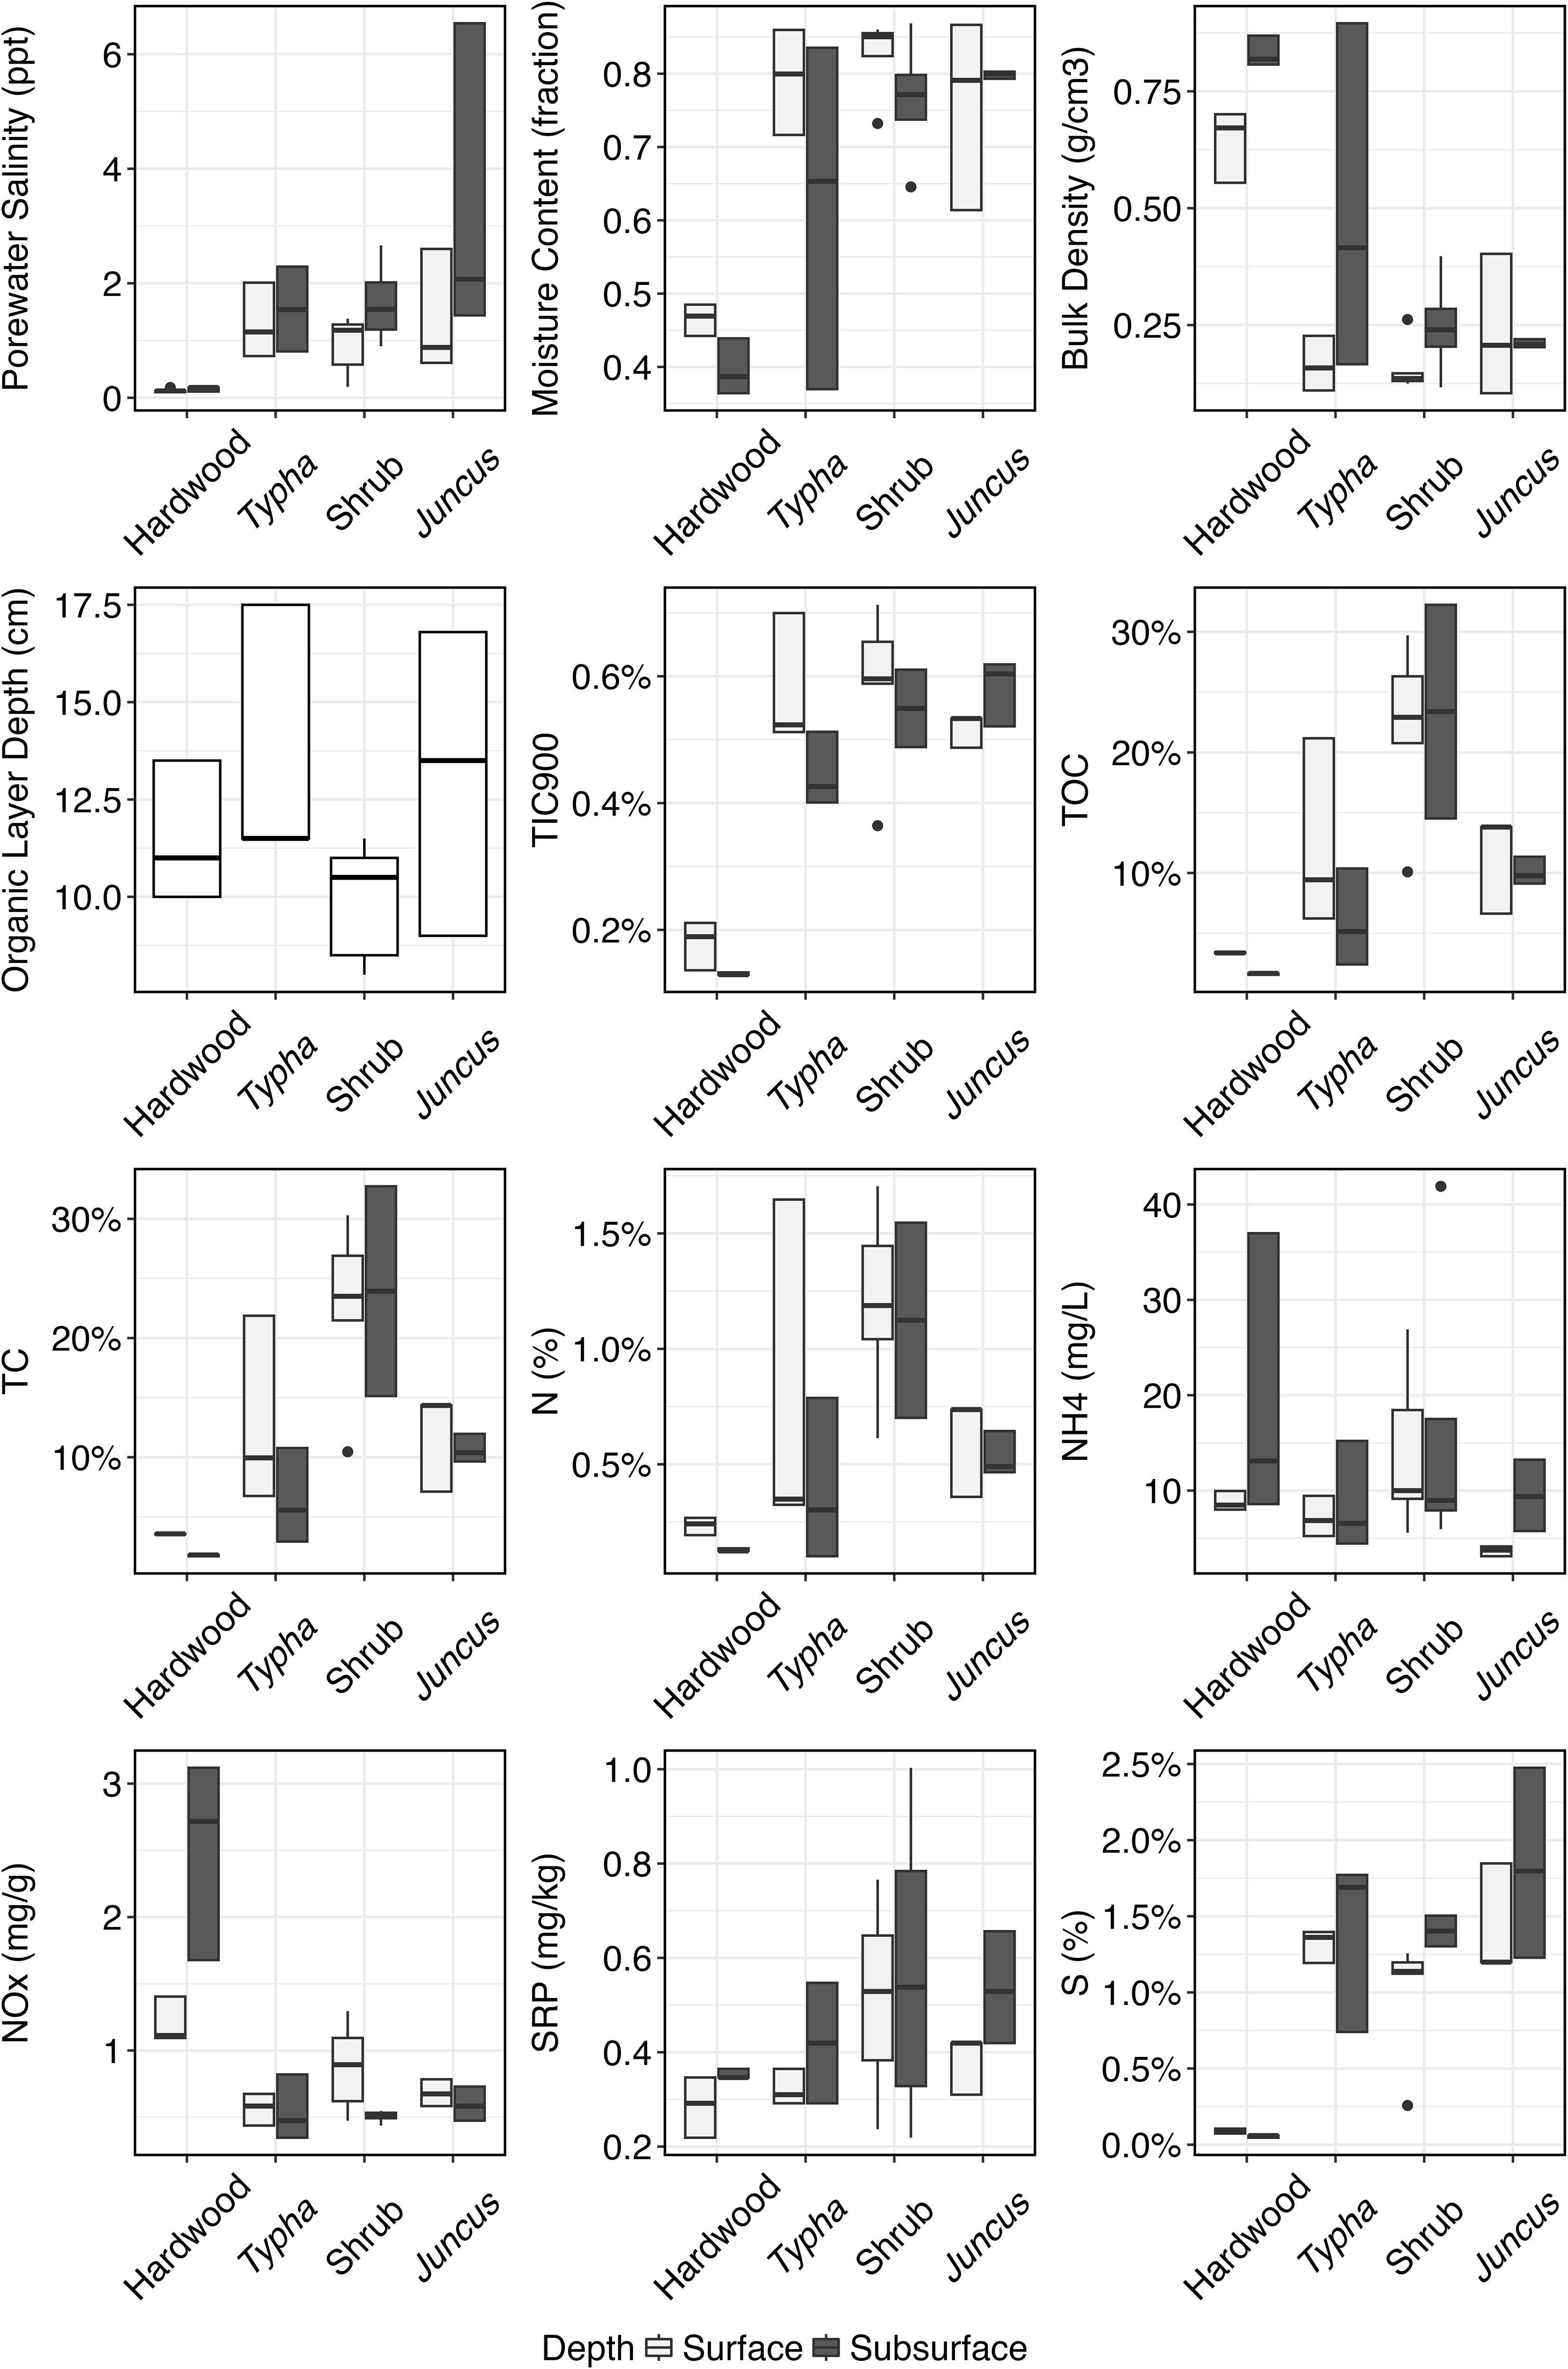
Figure 2 Range, lower quartile, median, and upper quartile of the measured physicochemical parameters in hardwood (n=34), Typha sp. (n=36), tidal shrub (n=47), and Juncus sp.-dominated (n=34) sediment samples. Parameters are plotted separately for the surface, organic soil horizon and the subsurface, mineralized soil horizon.
Porewater salinity was positively correlated with moisture content, surface horizon depth, TIC, SRP, S percent (p<0.001), TOC, TC (p=0.001), and N percent (p=0.015, Figure 3) and negatively correlated only with bulk density and NOx (p<0.001). C, N, P, and S nutrient concentrations were higher in the wetter, less dense sediment found in the herbaceous wetlands as compared with forested.
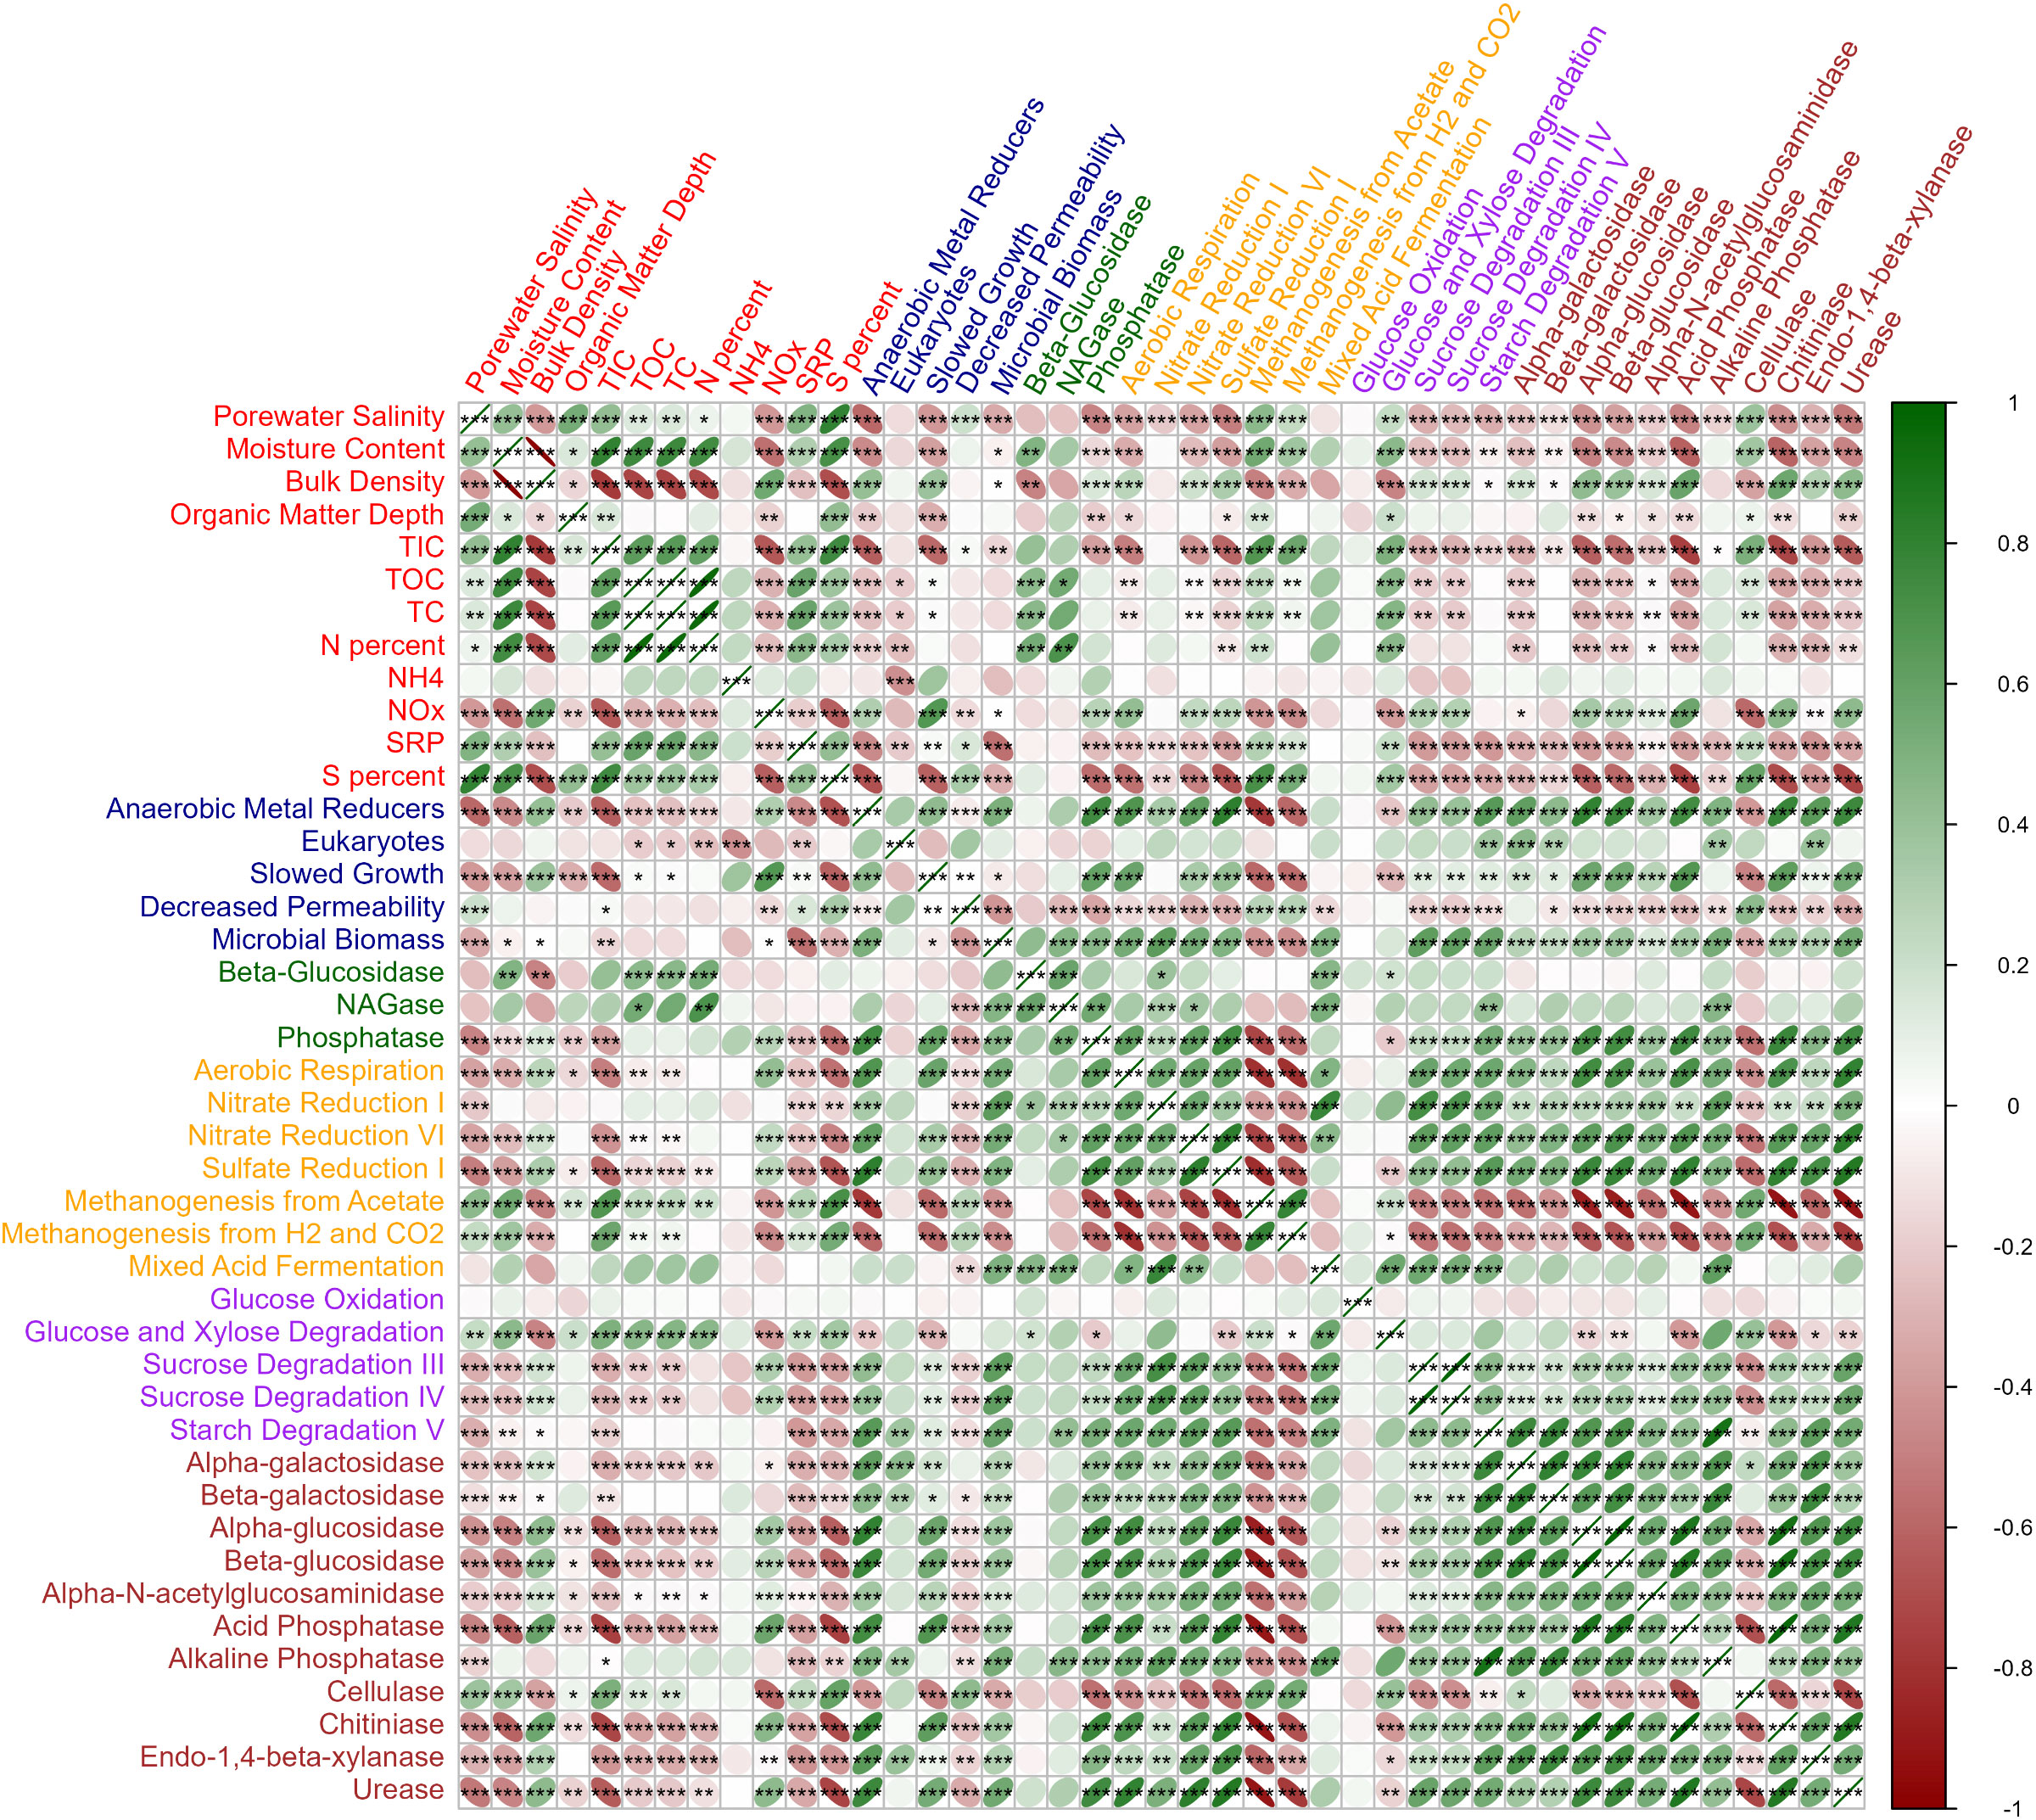
Figure 3 Correlation matrix between the measured physicochemical (red labels), PLFA (blue labels), extracellular enzyme activity (green labels), PICRUSt respiration pathways (yellow labels), PICRUSt degradation pathways (purple labels), and PICRUSt degradation enzymes (brown labels) data layers. Negative correlations are shown red and positive correlations shown green. Significance of correlations is denoted *p<0.05, **p<0.01, ***p<0.001. Figure generated with corrplot R package.
3.2 Microbial richness and diversity
A total of 12,916,148 high-quality sequences were recovered from n=151 soil samples, with sequence counts rarefied to 15,425 per sample. Mean and median coverage were 93.9% and 94.0%, respectively. Species richness, measured by ASVs observed, was significantly higher in surface soil (p<0.001), as well as higher in Typha and tidal shrub wetlands than in the forested wetland or Juncus soils (p<0.03, Figure 4). Community diversity, measured by the Simpson metric, was similarly higher in the surface soil horizons than the subsurface (p=0.001) and higher in Typha and tidal shrub than in forested wetland soils (p<0.03). However, there was no statistically significant correlation between porewater salinity and microbial richness (p=0.065) or between porewater salinity and diversity (p=0.280).
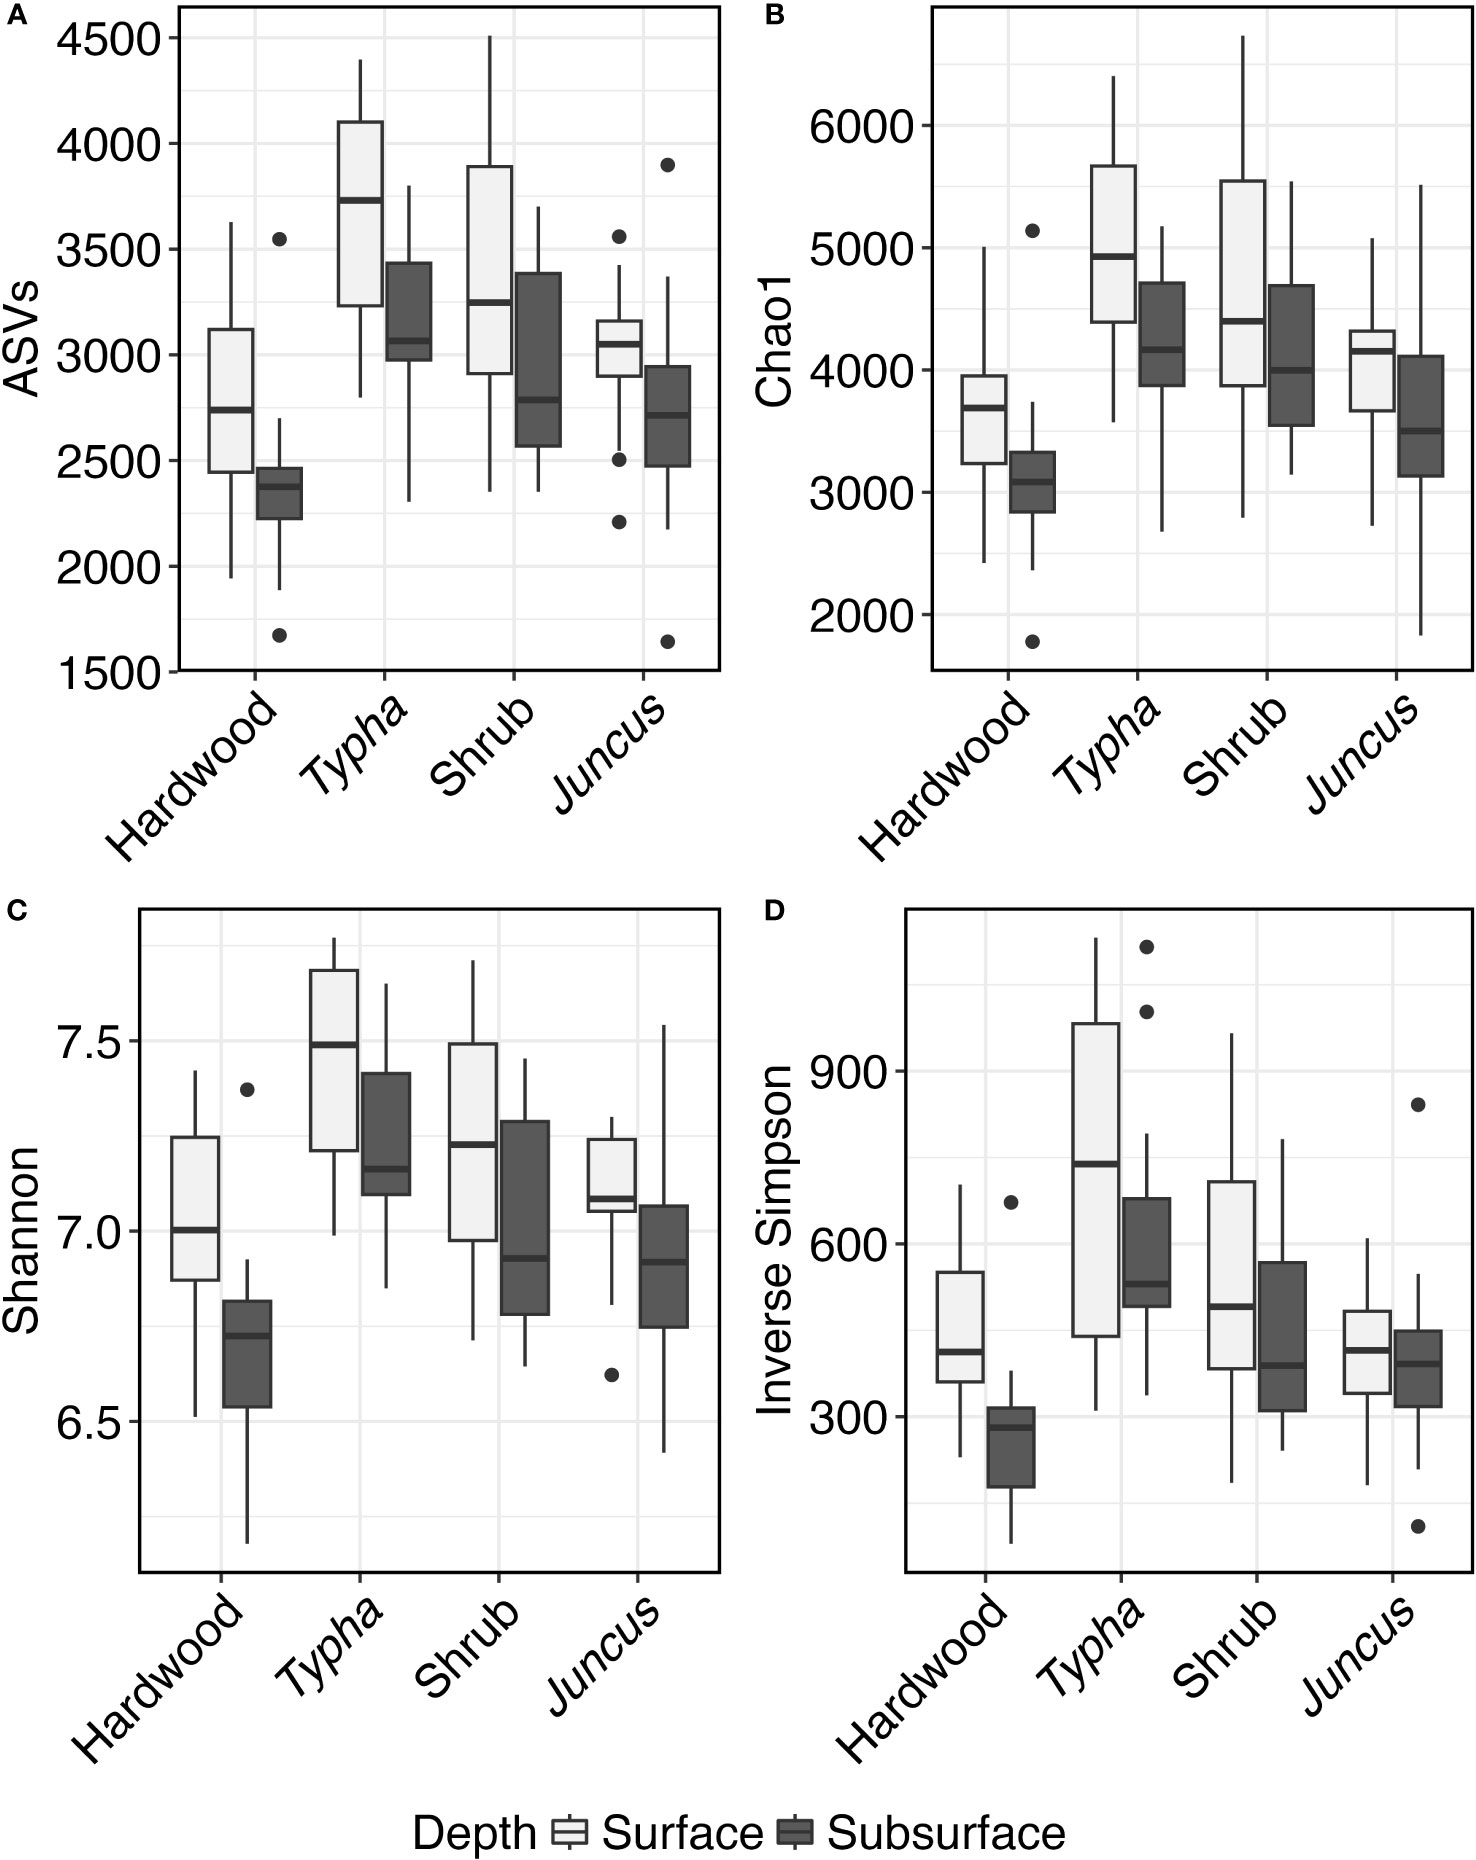
Figure 4 Box and whisker plot of Alpha Diversity. Range, lower quartile, median, and upper quartile of the (A) number of ASVs, (B) Chao1 metric, (C) Shannon metric, and (D) Inverse Simpson metric of high-quality V4 16S sequences collected from hardwood (n=34), Typha sp. (n=36), tidal shrub (n=47), and Juncus sp.-dominated (n=34) sediment samples. Alpha diversity scores are plotted separately for the surface, organic soil horizon and the subsurface, mineralized soil horizon.
3.3 Microbiome composition patterns
Microbial community composition differed significantly between overlying vegetation types (p<0.001), surface and subsurface soil horizon (p<0.001), and porewater salinity (p<0.001) for each beta-diversity metric. Bray-Curtis, Jaccard, and weighted UniFrac distances each showed that the categorical vegetation and horizon factors explained more variation than porewater salinity, but the interaction effects for each combination of these factors was significant as well (p ≤ 0.004, Table 2). All pairwise comparisons between microbiota of the vegetation types also differed significantly (p adjusted ≤ 0.042, all comparisons, all diversity metrics). More variation was explained for comparisons between forested wetlands and all other wetland types (R2 ≥ 0.148, Bray-Curtis) than between Typha, tidal shrub, and Juncus wetland types (R2 ≤ 0.093, Bray-Curtis). The strong differentiation of the forested wetland microbiome was readily observable using NMDS ordination of all metrics (Figure 5). There was also a visible separation of wetland habitat types by porewater salinity, particularly in the Bray-Curtis and Jaccard distance matrices.
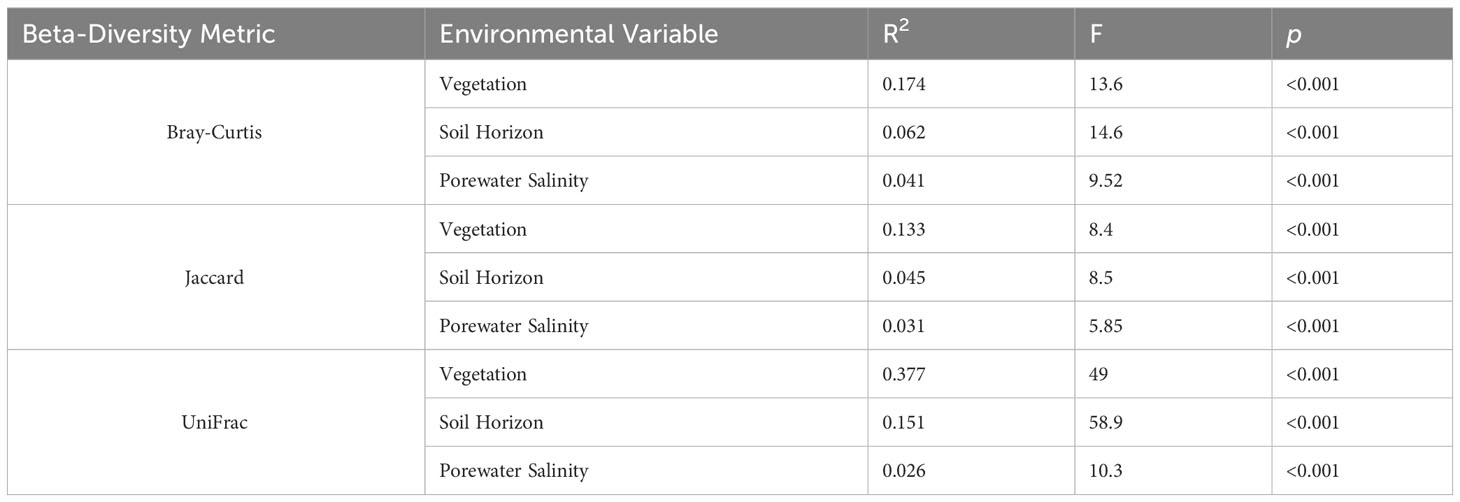
Table 2 Statistical results of PERMANOVA comparing microbial community composition between vegetation types (hardwood, Typha, tidal shrub, and Juncus), soil horizons (surface and subsurface), and porewater salinities across Bray-Curtis, Jaccard, and weighted UniFrac beta-diversity measurements.
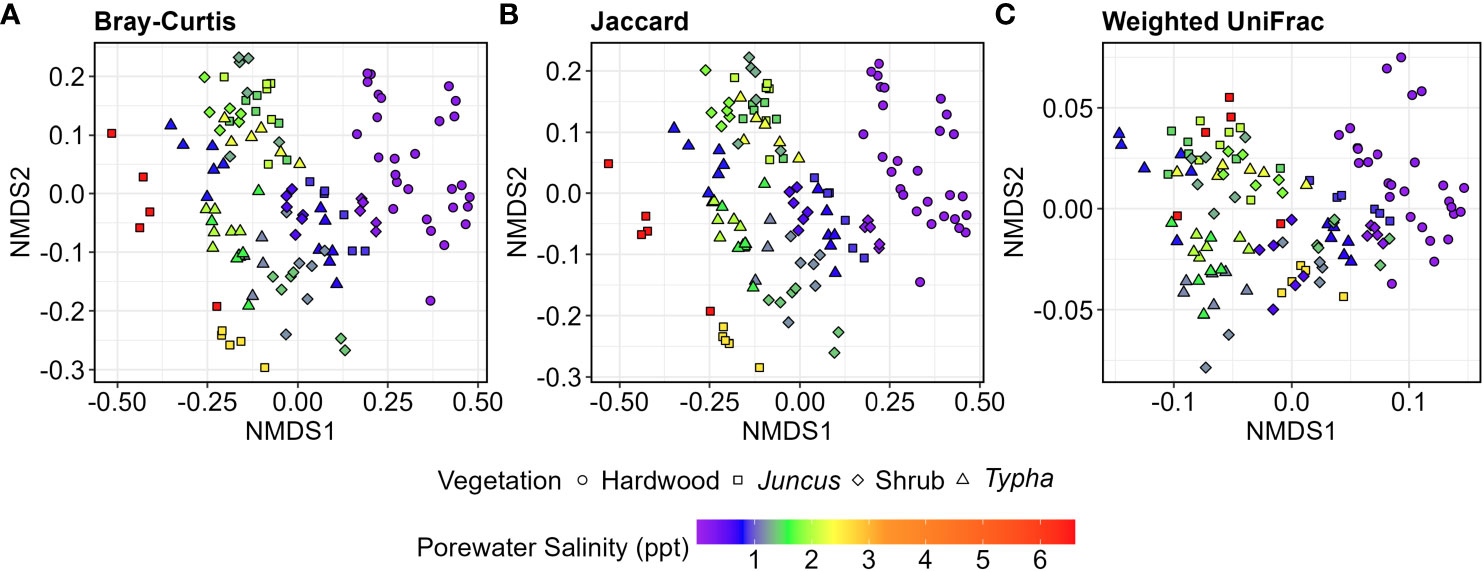
Figure 5 NMDS ordinations of V4 16S sequences collected from hardwood (n=34), Juncus sp. (n=34), tidal shrub (n=47), and Typha sp.-dominated (n=36) sediment samples. (A) Bray-Curtis distance, (B) Jaccard distance, (C) Weighted UniFrac distance of a phylogenetic tree of the 5,000 most abundant ASVs. Porewater salinity ranged 0.0-6.0 ppt and is indicated by color gradient. 2D stress ranged 0.077-0.157.
Lacking a priori hypotheses for the influence of sediment physicochemistry on microbial community structure, model selection via VIF, dbRDA, and automated stepwise model building began by including all of the measured parameters. Samples were processed separately by whether they came from the surface or subsurface horizon. Ranked by AIC scores, S content, TOC, porewater salinity, NH4+, surface horizon depth, and NOx were the most influential factors explaining the community composition of the surface horizon (Table 3). In the subsurface horizon, NOx, bulk density, porewater salinity, SRP, and NH4+ were the most explanatory environmental variables. Constrained ordination, like NMDS, showed separation of forested wetland soils from the other three wetland types in the first two dimensions (Figure 6). NOx content was the only factor positively associated with forested wetland microbiota in the surface horizon. At the same time, NOx, bulk density, and NH4+ were positively correlated with forested wetland microbiota in the subsurface horizon. Porewater salinity was strongly correlated with the Typha, tidal shrub, and Juncus wetland soils in both horizons. There was no visual separation by association with wetland vegetation in dbRDA dimensions 3 and 4; instead, there was a strong separation of individual sites, assumed to be based on local physicochemistry.
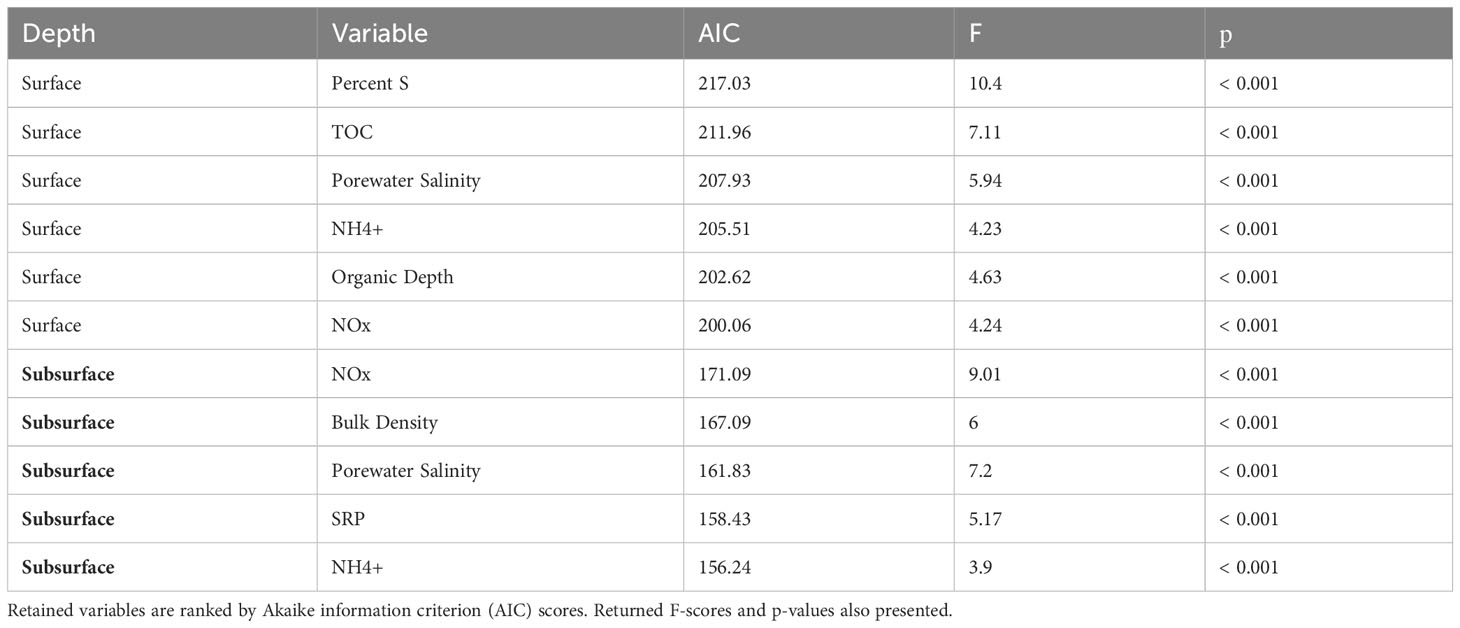
Table 3 Results of automated stepwise model building, retaining those physicochemical factors which best predicted microbial composition of the organic and mineralized soil horizons, separately.
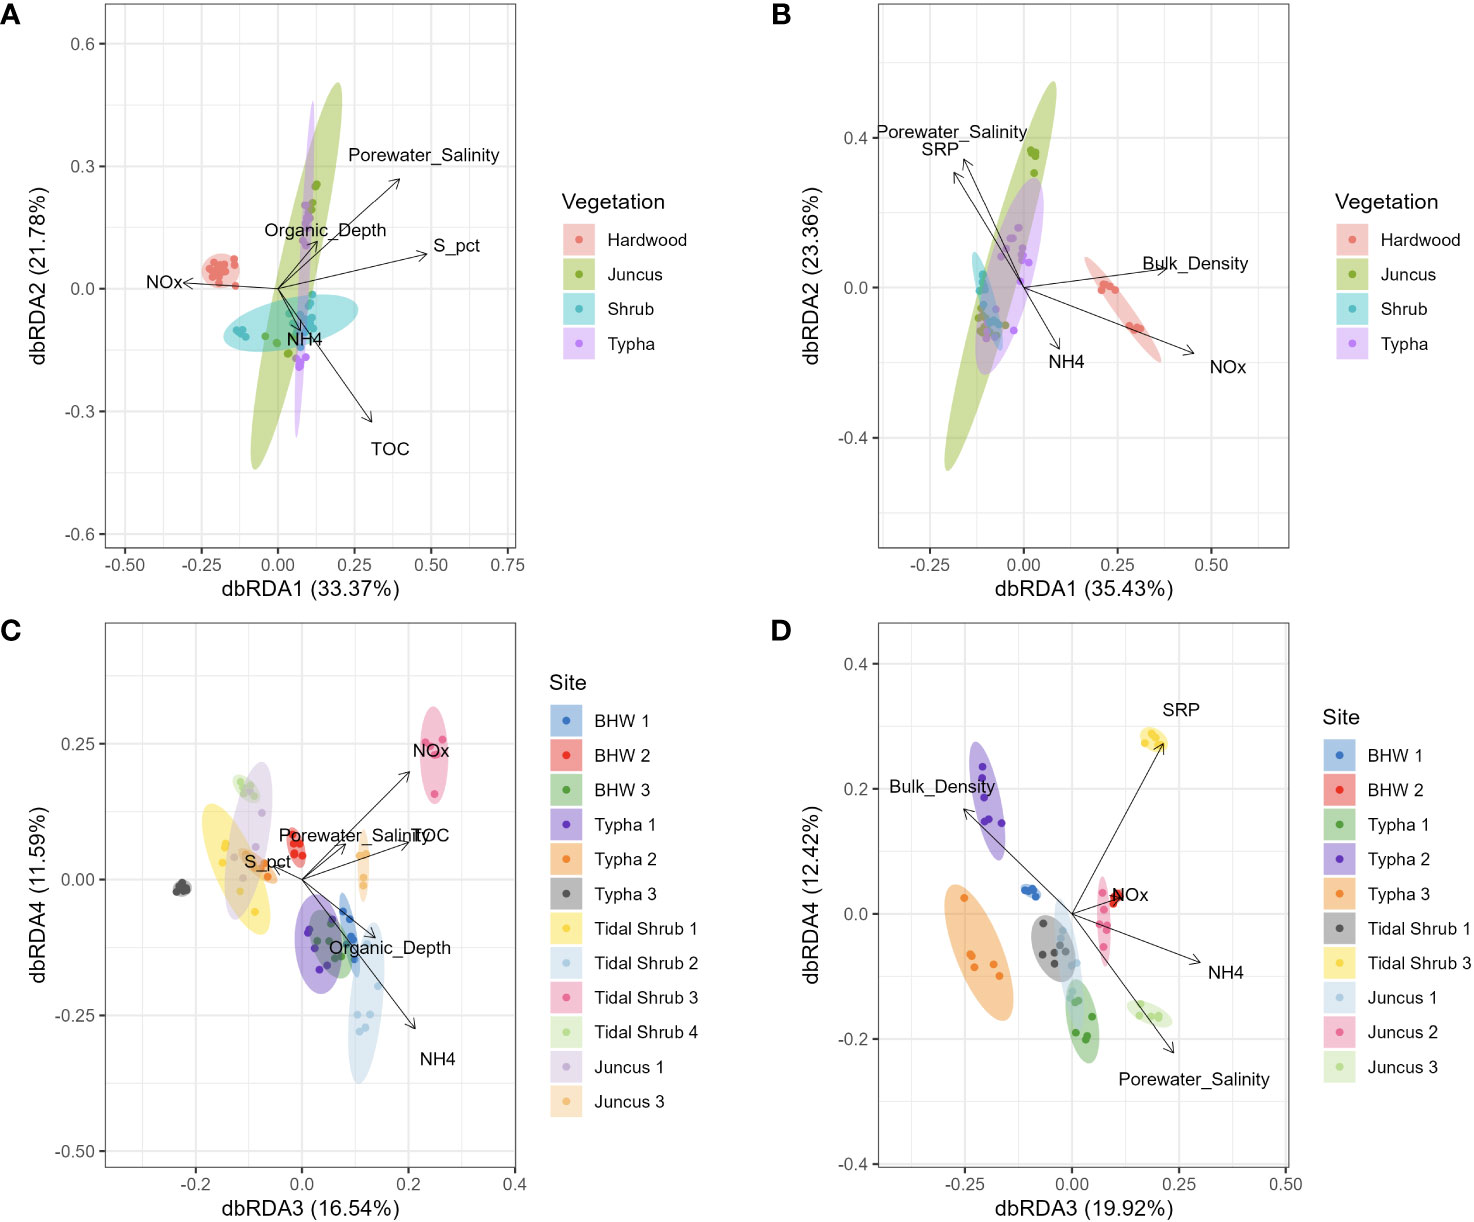
Figure 6 Distance-based redundancy analysis (dbRDA, Bray-Curtis distance) constrained ordination of V4 16S sequences collected from hardwood (n=34), Juncus sp. (n=34), tidal shrub (n=47), and Typha sp.-dominated (n=36) sediment samples. Samples are colored by overlying vegetation for axes 1 and 2 (A, B) and by sampling location in axes 3 and 4 (C, D). Ordinations were performed separately for the organic soil horizon (A, C) and the mineralized soil horizon (B, D). Arrows indicate microbiome compositional correlation with those physicochemical parameters which best explained composition as returned by the automated model selection.
3.4 Microbial taxonomy and inferred activity
Of the 39.6% of sequences classified to the family level (~5,114,000), 24 families accounted for >30% of the total dataset (Figure 7). Families which varied in abundance by salinity also showed a strong correlation with bulk density and S content, wherein greater sequence abundance at high salinity also correlated with greater sequence abundance at high S content and low bulk density. This community pattern recapitulates the linkages between high salinity, high S content, and low bulk density, which dominate in the frequent tidal inundation of the mid-bay, where more herbaceous vegetation is found (Figure 8). Families which were at significantly greater abundance in more saline porewater included: Anaerolineaceae, Desulfobacteraceae, Methanomassillicoccaceae, Anaerohalosphaeraceae, Spirochaetaceae, Aggregatilineaceae, Calditrichaceae, and Prolixibacteraceae. Families which were more abundant in low salinity porewater were: Gallionellaceae, Bradyrhizobiaceae, Geobacteraceae, Nitrososphaera, Ktedonobacteraceae, and Methylococcaceae.
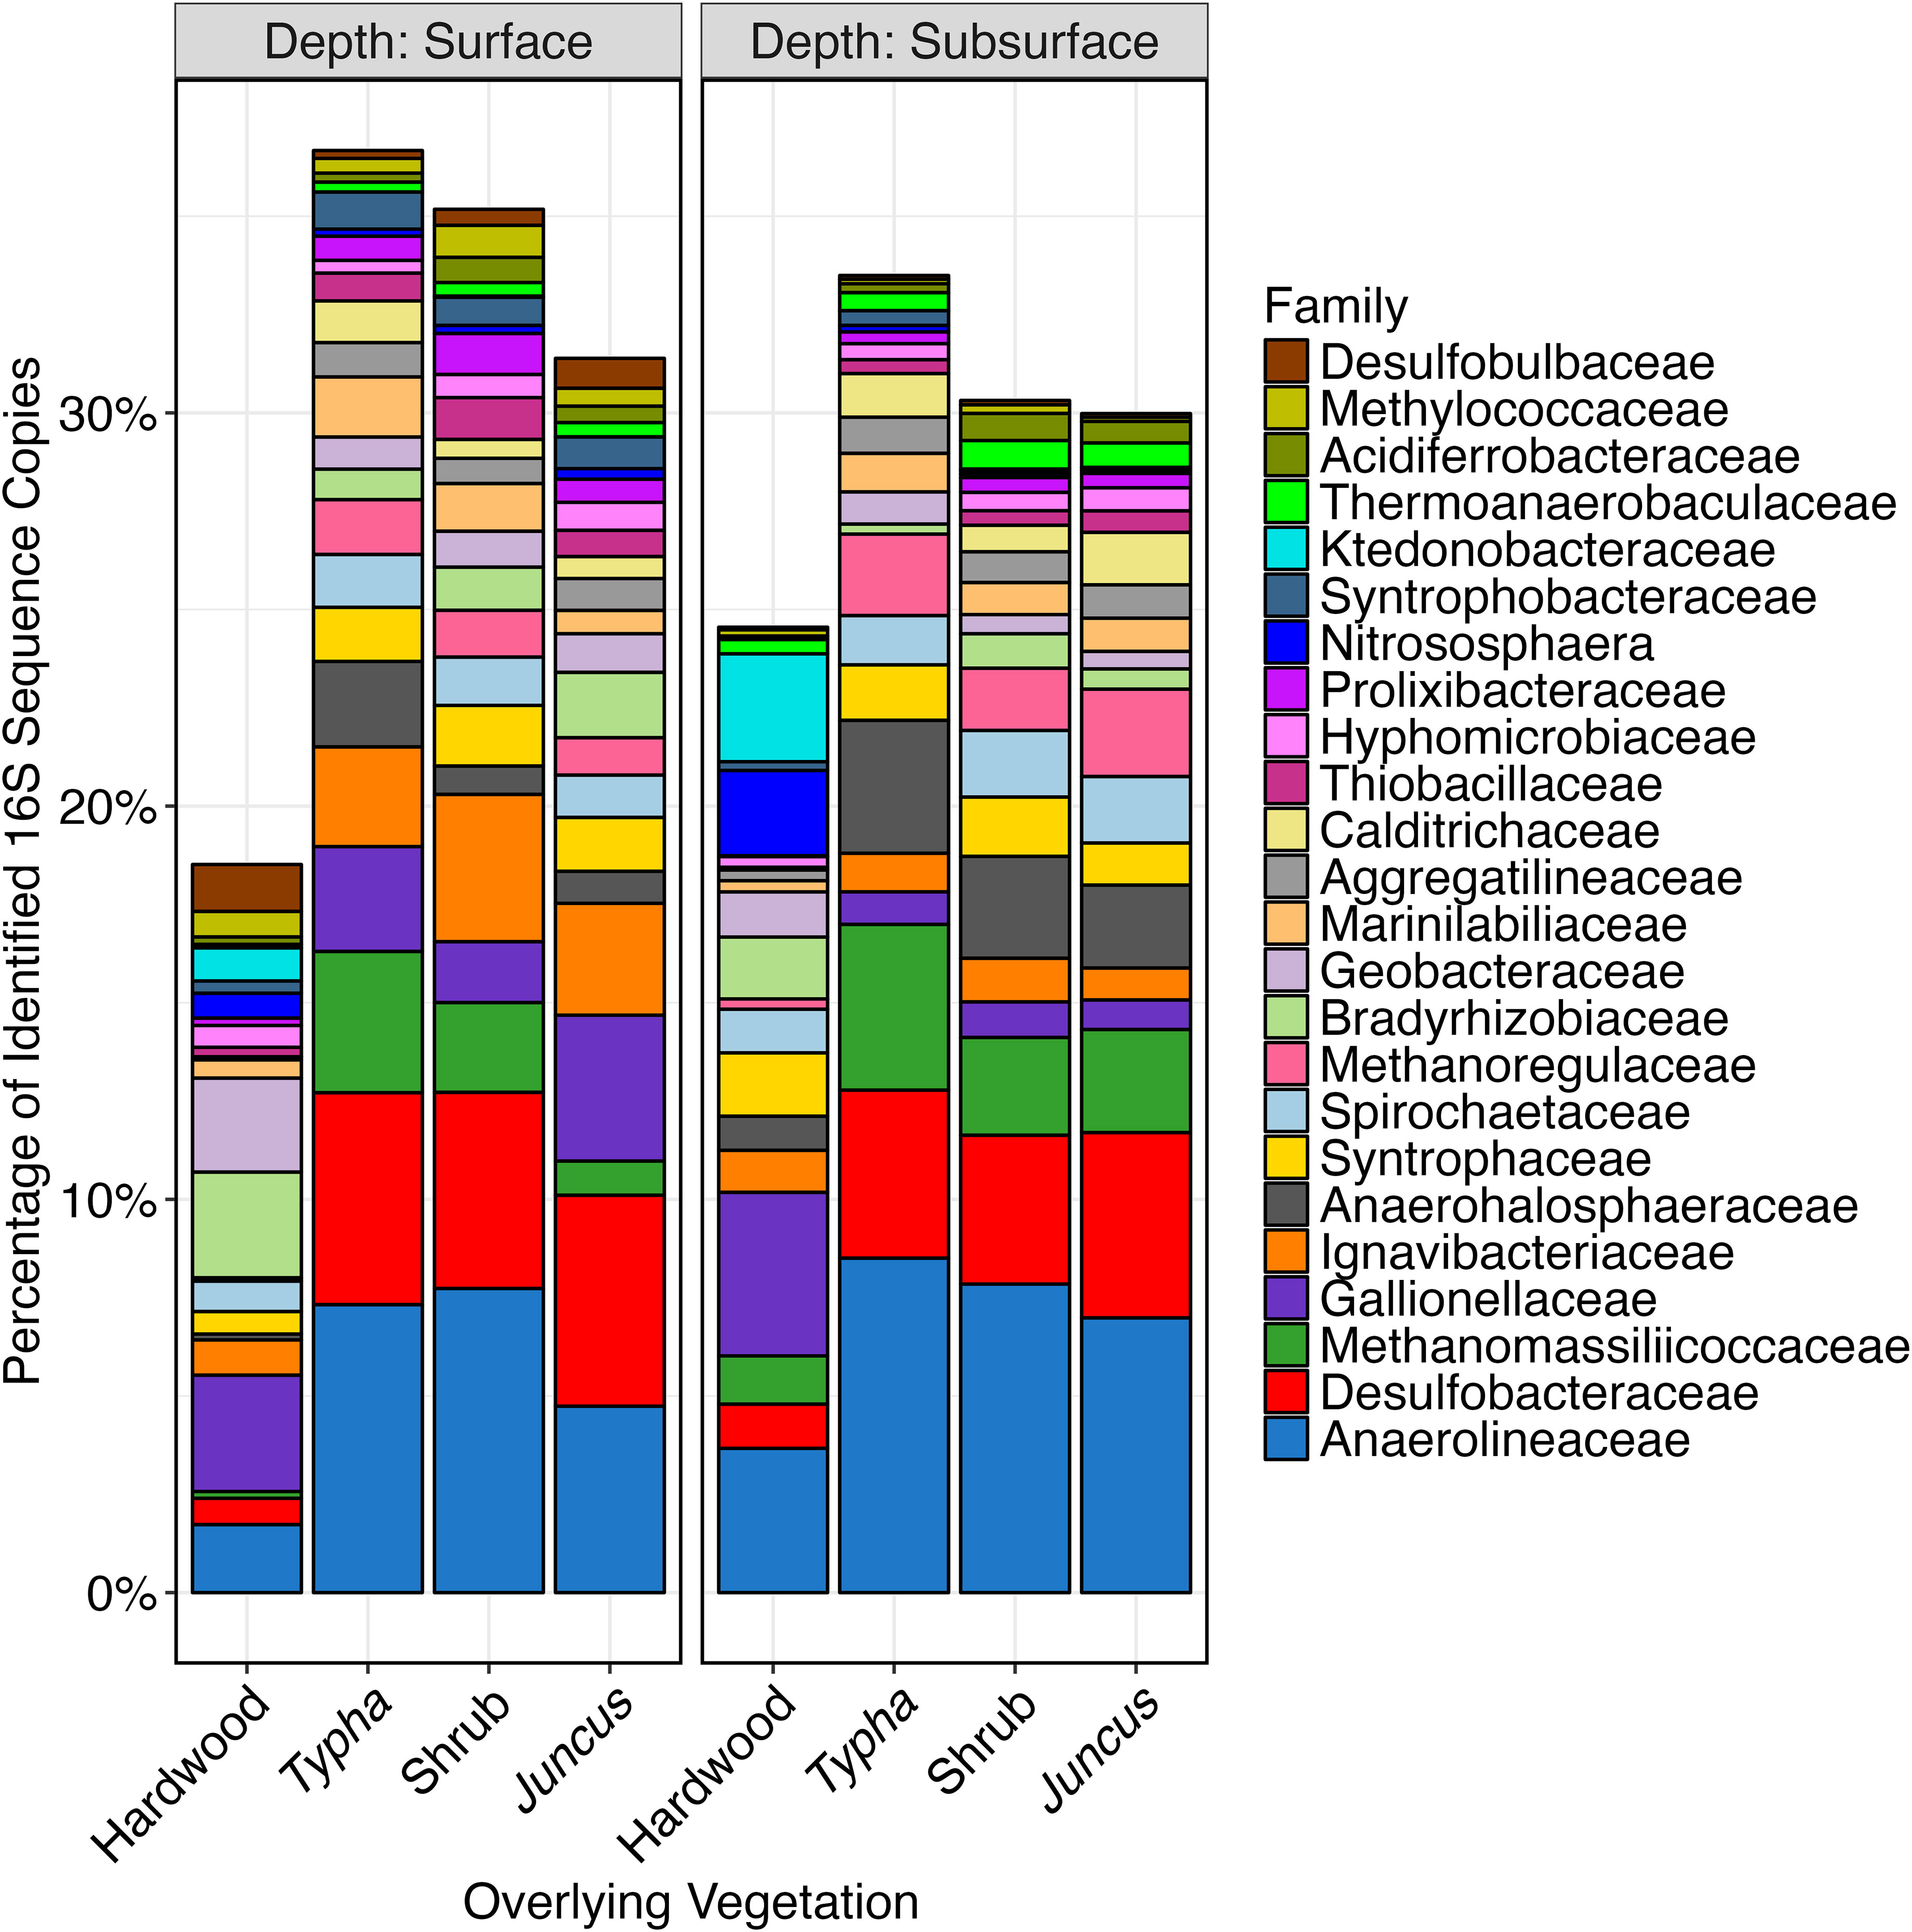
Figure 7 Stacked bar plot of V4 16S sequences which were identified to the family taxonomic level and which collectively comprised >30% of the total sequences generated. Samples are ordered by association with hardwood (n=34), Typha sp. (n=36), tidal shrub (n=47), and Juncus sp. (n=34) and by whether they were collected from the organic soil horizon (n=75) or the mineralized horizon (n=76).
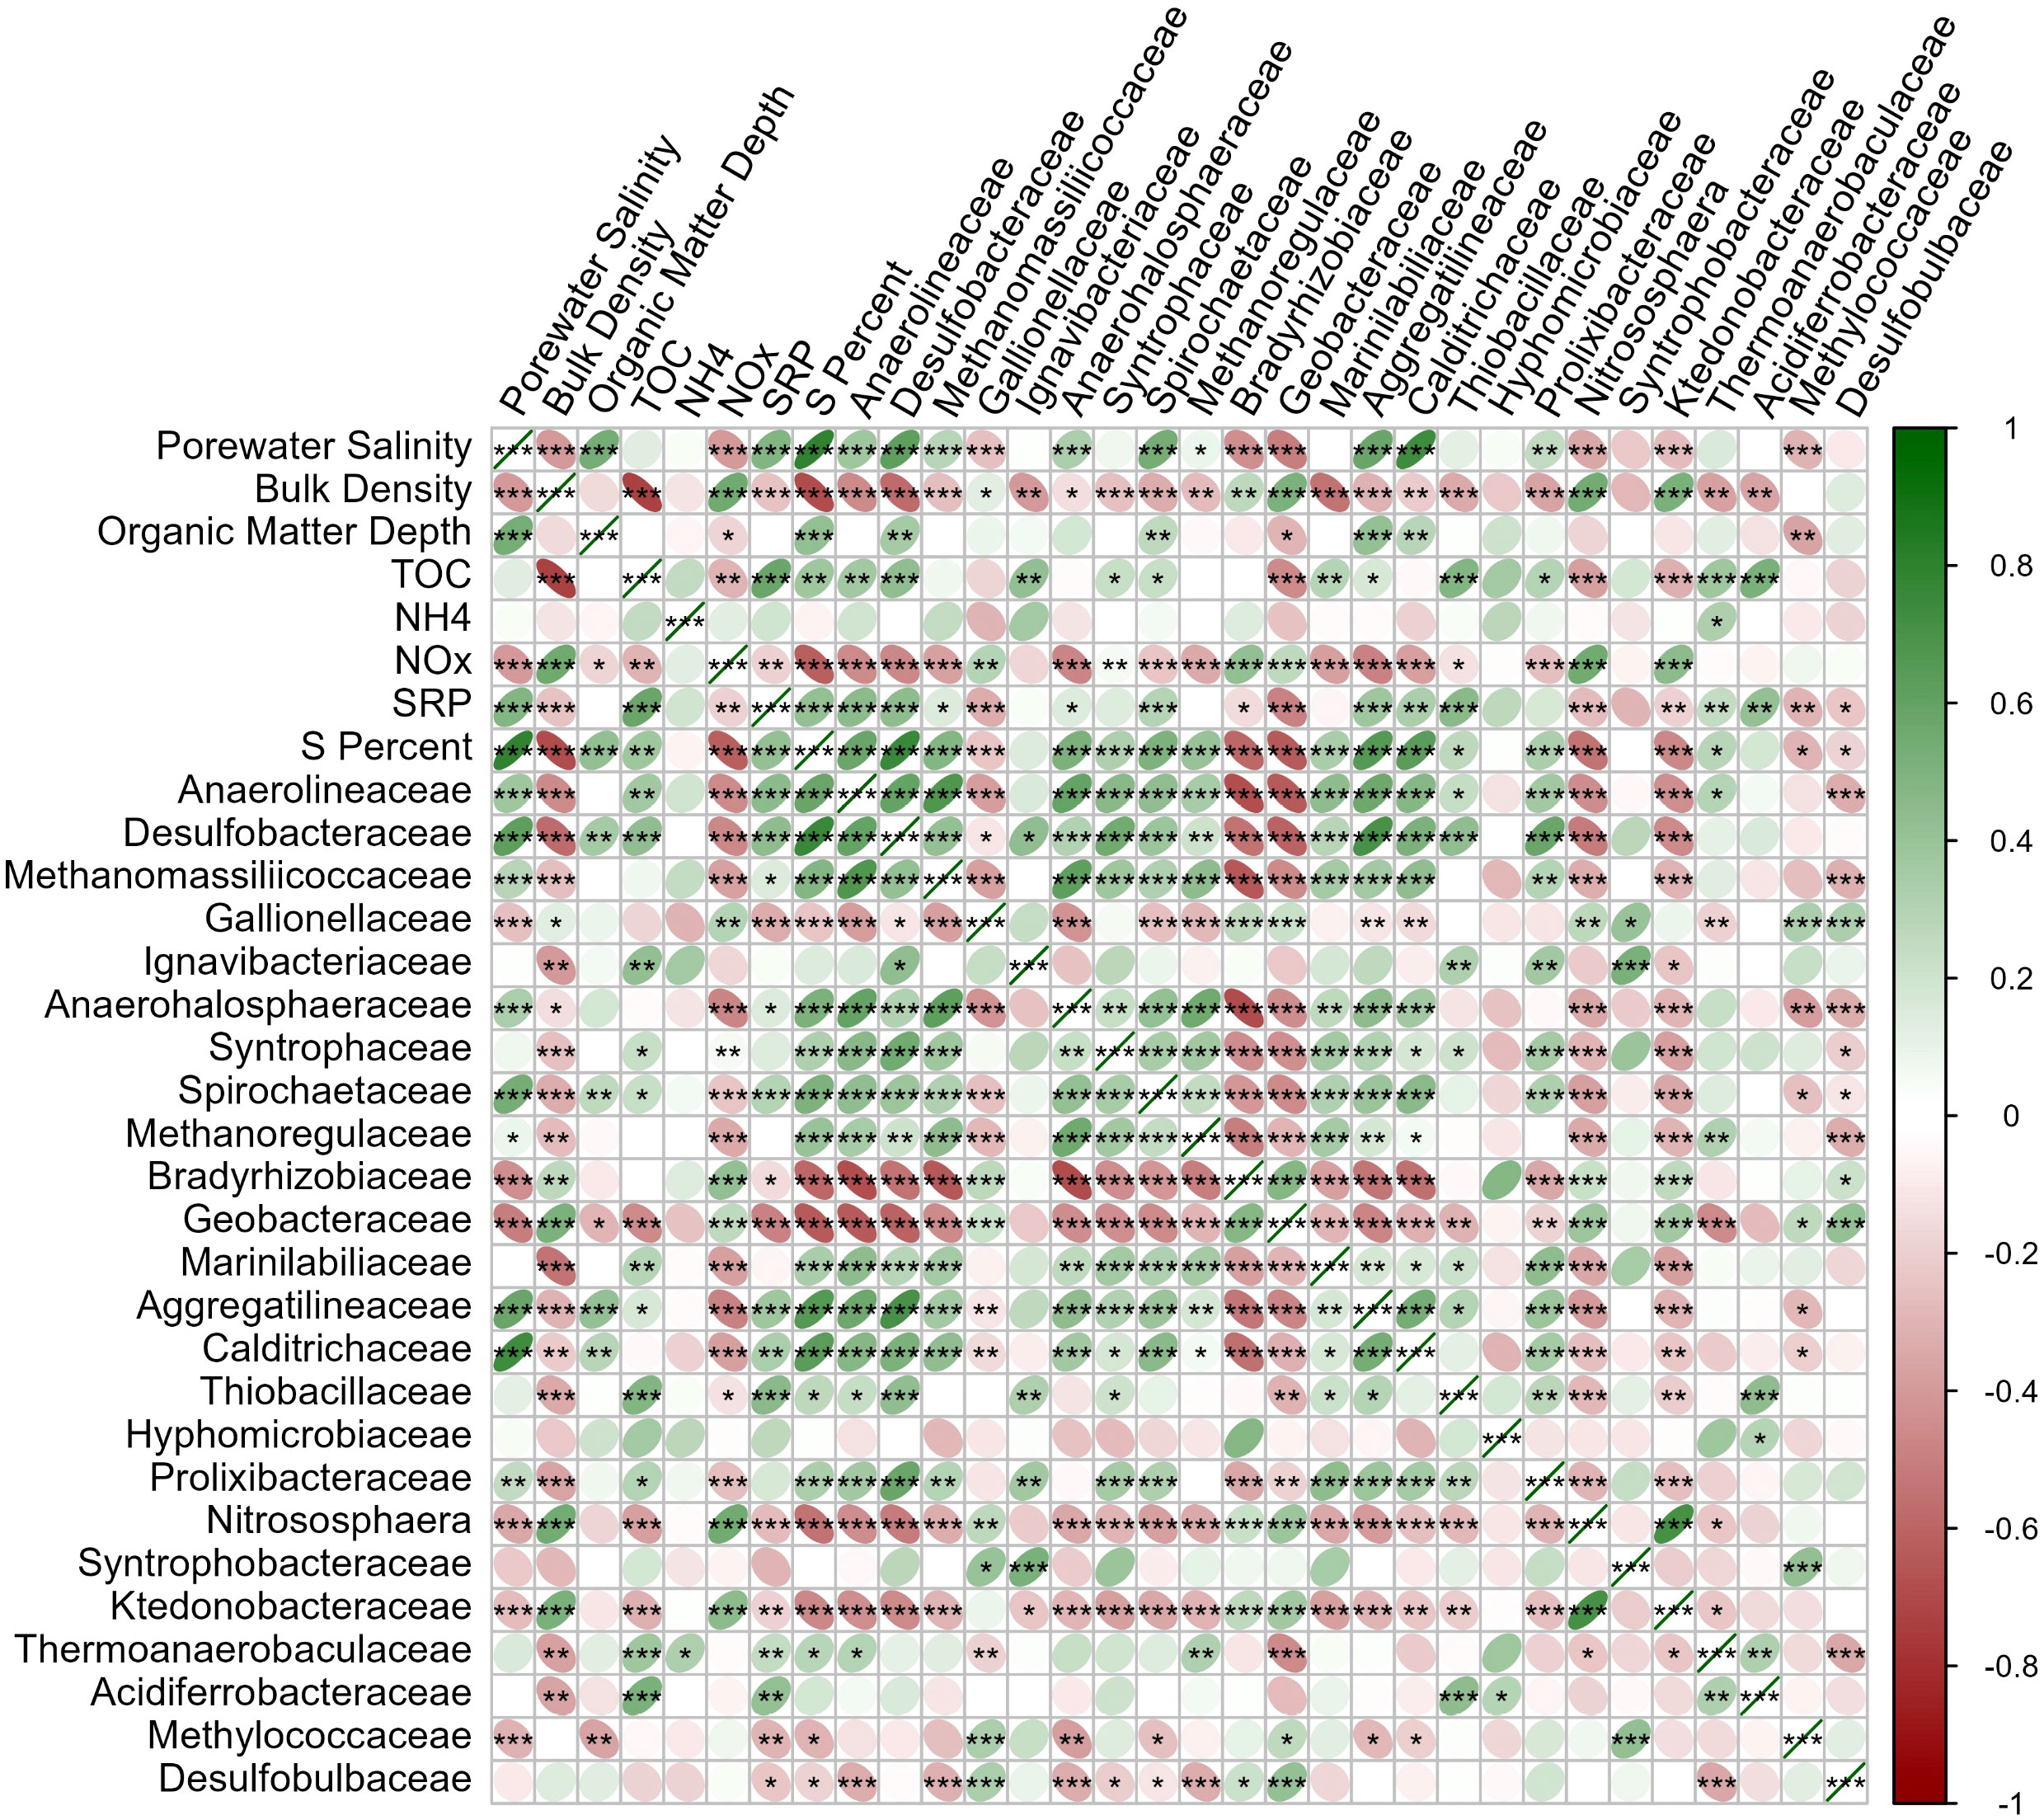
Figure 8 Correlation matrix of physicochemistry and those sequences identified to the family taxonomic level which collectively comprised >30% of the total sequences generated. Negative correlations are shown red and positive correlations shown green. Significance of correlations is denoted *p<0.05, **p<0.01, ***p<0.001. Figure generated with corrplot R package.
Decomposition attributable to microbial activity was inferred through direct, fluorometric enzyme assays and PICRUSt functional prediction. Among the measured enzymes, β-glucosidase and phosphatase (p<0.001) differed between wetland types, unlike NAGase (p=0.108). β-Glucosidase activity was highest in the three herbaceous wetland soil types, while phosphatase activity was highest in the forested wetland soils (Figure 9). All of the degradation genes inferred from the 16S marker gene dataset differed significantly in abundance between vegetation types (p<0.042). Derived pathways and genes regulating soil enzymes, such as starch degradation, galactosidase, glucosidase, NAGase, phosphatase, chitinase, xylanase, and urease were all more abundant in hardwood forest soil. Inferred genes controlling metabolism, including aerobic respiration, assimilatory nitrate reduction, and sulfate reduction pathways were all highest in forested wetland soils (p<0.001). Denitrification pathway abundance was highest in herbaceous surface sediment (p=0.047), and methanogenesis pathway abundance was significantly higher in herbaceous subsurface sediment (p<0.001).
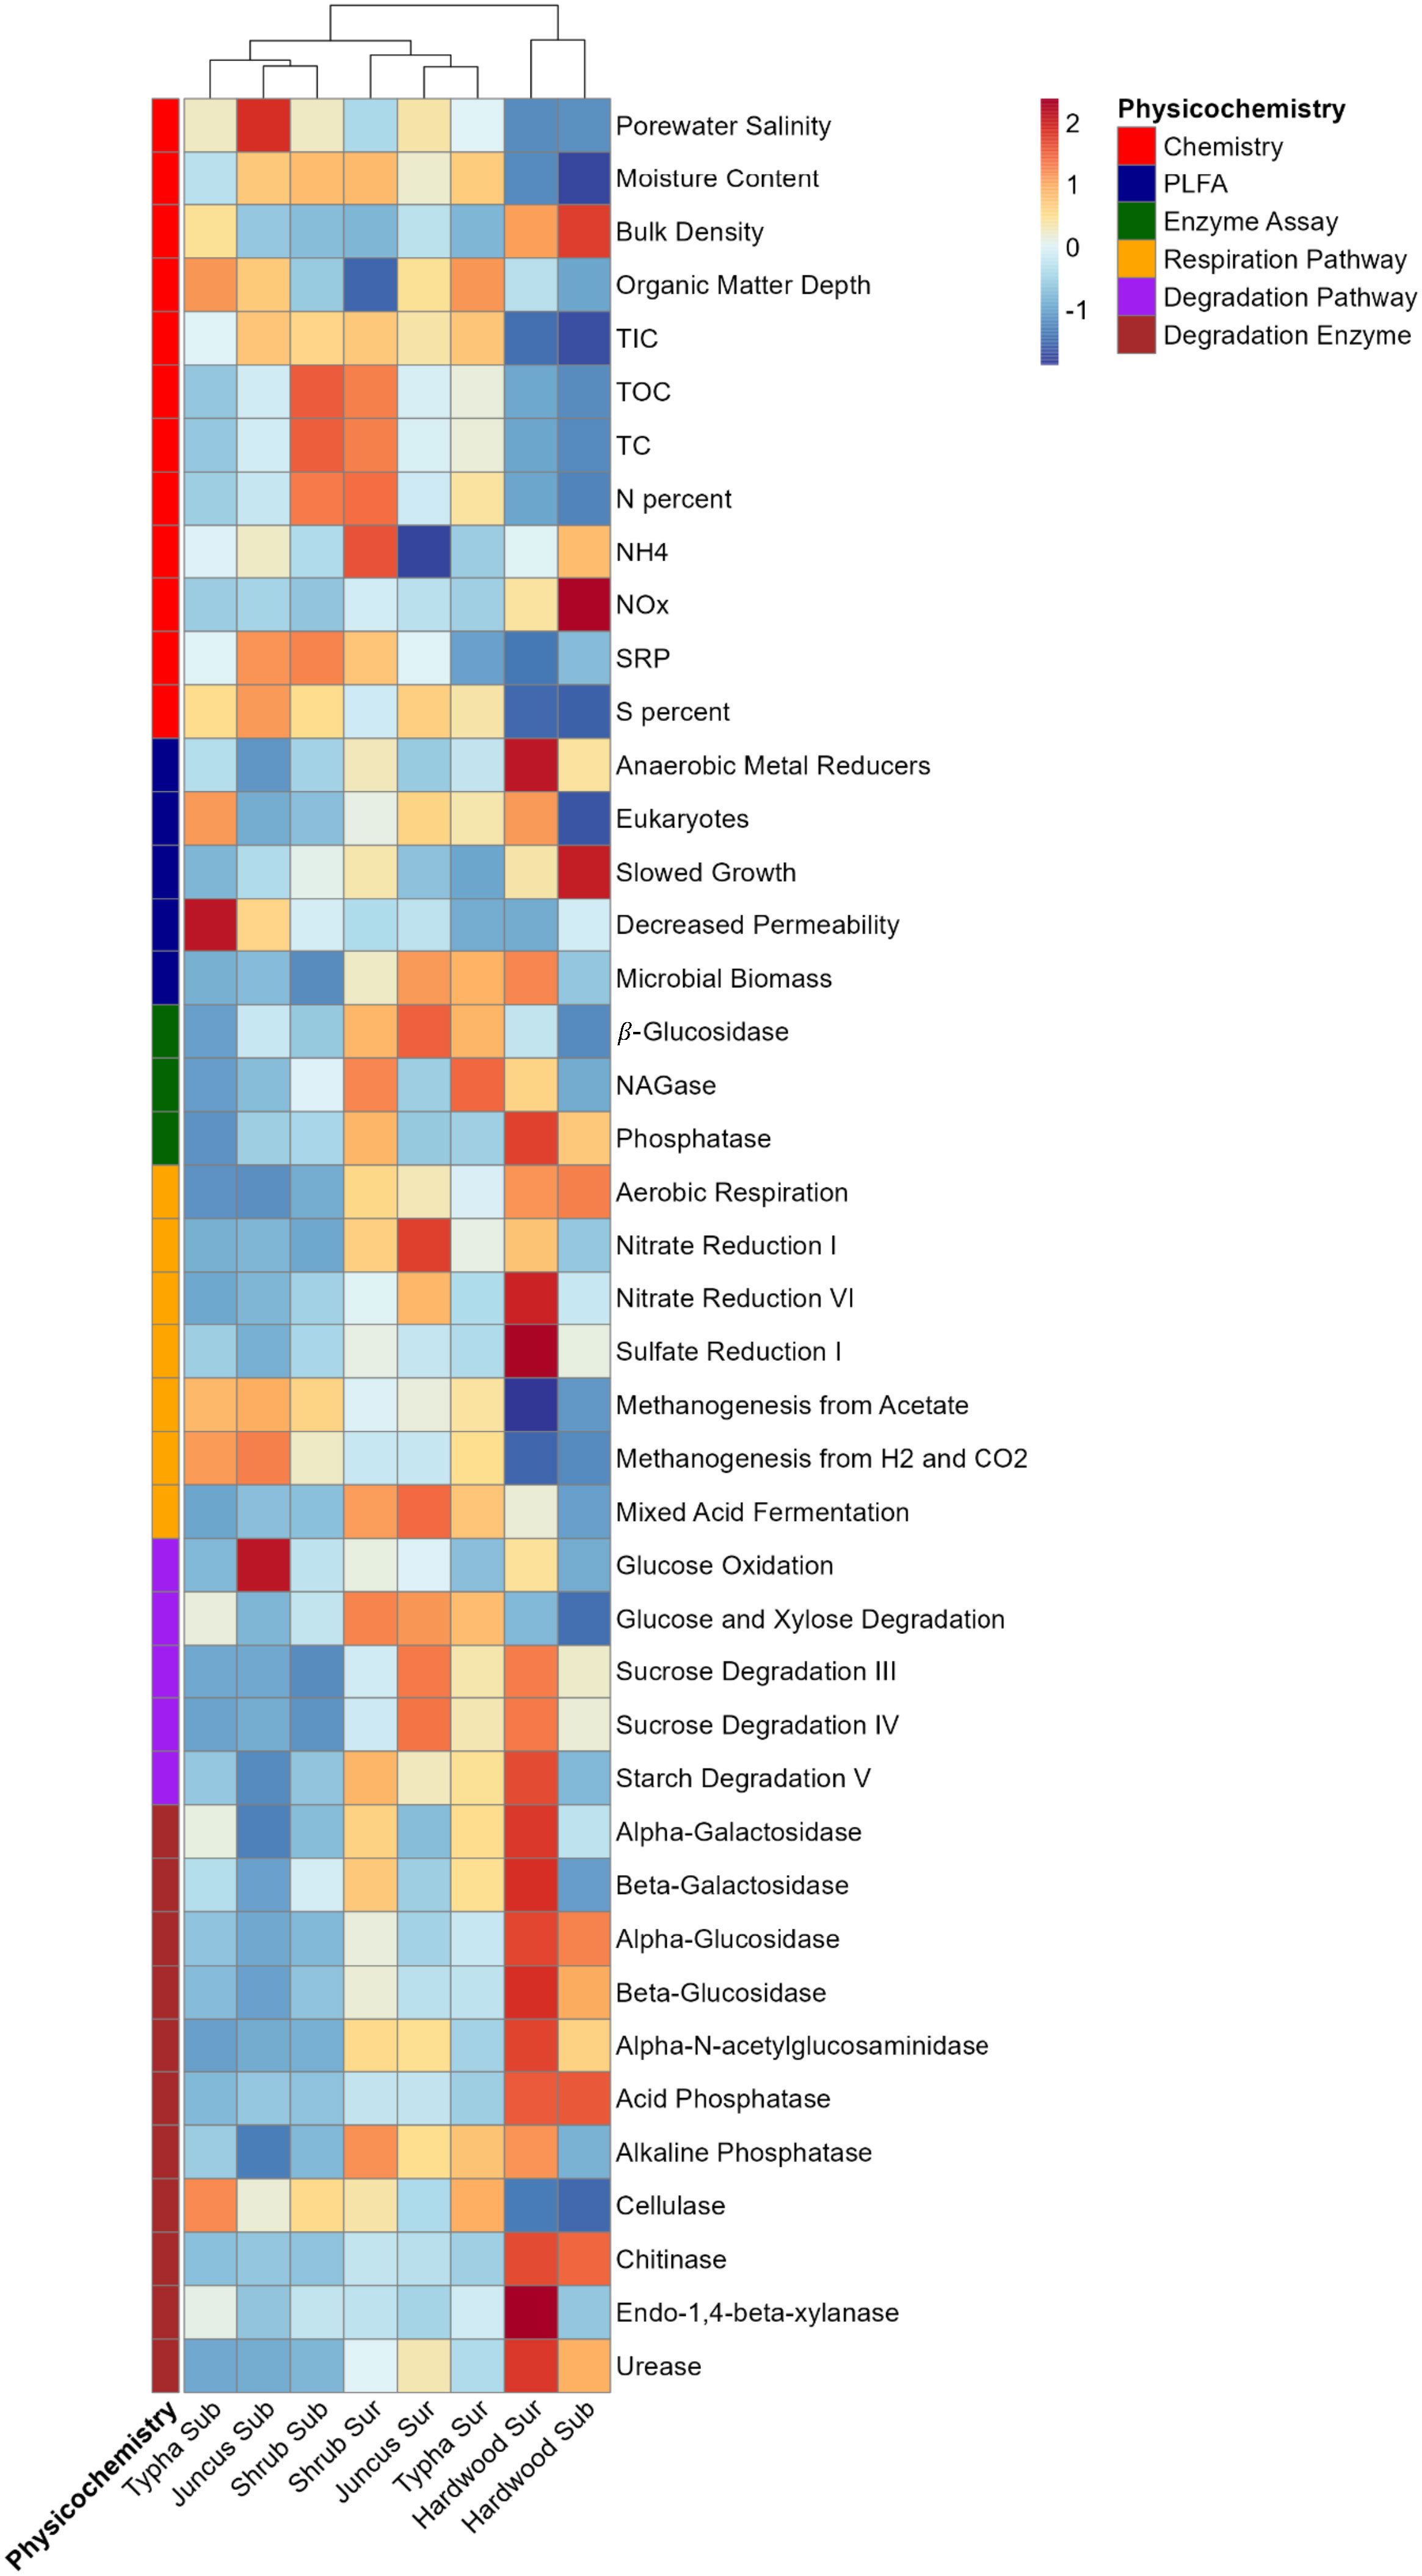
Figure 9 Heatmap of physicochemical (red labels), PLFA (blue labels), extracellular enzyme activity (green labels), PICRUSt respiration pathways (yellow labels), PICRUSt degradation pathways (purple labels), and PICRUSt degradation enzymes (brown labels) data layers. Scale is 0-centered and each 1-fold change represents 1 standard deviation from the mean. Columns denote vegetation-association and soil horizon (surface/organic and subsurface/mineralized). Columns are clustered by Euclidean distance. Figure generated with pheatmap R package.
3.5 Connecting microbial activity, porewater salinity, and physicochemistry
Fluorometric phosphatase activity decreased significantly with increased porewater salinity, while β-glucosidase and NAGase showed no relationship (Figure 3). β-glucosidase activity increased significantly with TOC, NAGase activity increased with N percent, but phosphatase activity decreased with SRP. Both aerobic and anaerobic respiration pathways were depressed by salinity, while predicted methanogenesis gene abundance increased with porewater salinity. All degradation pathways were lower in sequence count at high salinity except for cellulose, glucose, and xylose degradation. Similarly, cellulose, glucose, and xylose were the only degradation pathways that positively correlated with TIC, TOC, TC, and surface sediment horizon depth, with all other pathways having much lower abundances in high organic matter conditions. Microbial biomass (as measured by PLFA) decreased with higher salinity and was weakly negatively correlated with C content. All measures of metabolism increased significantly with high biomass, except for methanogenesis and cellulase pathway abundance. All degradation pathway abundances were positively correlated with each other, except for cellulase. Decomposition inferred from predicted gene abundance positively correlated with actual phosphatase activity but did not strongly correlate with either β-glucosidase or NAGase activity.
4 Discussion
4.1 Soil physicochemistry and microbial composition linkages
Freshwater forested wetland soils exhibited notable differences from the other wetland types examined across nearly all measured physicochemical parameters, microbial diversity characteristics, and measures of microbial activity. Porewater salinity remained near zero across all forested wetland soils, which rarely (if ever) experienced short pulses of brackish water during storm events where seawater from the Gulf of Mexico breached Mobile Bay during periods of low riverine water inputs. Conversely, the herbaceous wetland types displayed porewater salinities ranging from ~0.5 ppt to >6 ppt, where a subset of the plant communities can survive much higher salinities (up to 35 ppt in the case of the Juncus-dominated marshes). The difference in salinities, and associated soil physicochemical and microbial characteristics, was not unexpected, as forested wetlands occur at higher elevations and receive less tidal and more riverine influence than the other three marsh types. Forested areas are situated at the northern end of Mobile Bay, receiving much higher mineral sediment influxes, as reflected by the much higher bulk densities and lower relative soil organic matter contents (Krauss et al., 2018). All sites co-occurred in the mid-to-upper portions of the Mobile Bay estuary along a salinity gradient with average elevations of forested wetlands (2.42 m), mixed tidal shrub (0.42 m), Typha (0.30 m), and Juncus (0.17 m). Total C, N, P, and S were each lowest in forested wetland soils where more available nutrients were likely stored in aboveground biomass (Craft, 2012; Noe et al., 2016). Porewater NH4+, and particularly NOx, were the only nutrients measured at higher concentrations in forested soil, likely due to greater exposure to riverine agricultural and cattle sources of N. Higher salinity concentrations can inhibit denitrification rates (~70% decrease by increasing salinity from 1.7 ppt to 3.8 ppt, Neubauer et al., 2019) where nitrate addition dramatically stimulates decomposition (Bulseco et al., 2019), also potentially explaining the high nitrate, low OM dynamics observed in the forested wetland soils, relative to the other wetland types.
Both constrained and unconstrained ordinations of the microbial communities of the four wetland habitats consistently showed the differentiation of forested wetlands from all other wetland types as the primary factor driving dissimilarity. Dominant vegetation types showed a greater influence on microbial composition than either horizon depth or salinity, and pairwise comparisons between forested wetlands and all other wetland types were more dissimilar than comparisons between any other environmental factor. Previous studies have similarly identified vegetation-driven zonation of the wetland microbiome (Rietl et al., 2016), but salinity usually represents the dominant effect in structuring community composition (Ceccon et al., 2019; Liu et al., 2023). In our case, we propose that the salinity gradient in Mobile Bay drives vegetation zonation, representing the primary factor in partitioning microbial content.
Our data suggest that the presence of freshwater forest vegetation, seasonal hydrologic regimes, and high soil mineral content exhibited a deterministic influence on below-ground microbiota. Liu et al. (2020); Liu et al. (2023) investigated similar vegetation-salinity-microbe interactions, and reported a positive correlation between vegetation species diversity and microbial richness along with negative relationships between microbial diversity and higher salinities. Others have reported similar results. For example, Barreto et al. (2018) investigated a wetland plant-microbial community shift that displayed similar microbiome differentiation as the result of woody mangrove species encroachment into adjacent emergent salt marshes, which introduced sources of woody organic matter, root exudates, and increased oxygen delivery to the soils. This mangrove-driven aeration of the rhizosphere and subsequent increase in activity may represent a corollary for the seasonal hydrology of the forested wetland, where seasonal drying allows increased oxygenation. One contrast here was that richness and diversity did not scale well with salinity, again underscoring the primary influence of vegetation in our study.
4.2 Comparison of surface and subsurface soil horizons
After vegetation cover, residence in either the surface or subsurface soil horizon was the second most influential factor in microbial composition. The depth of the organic layer at the marsh surface, averaging between approx. 10 and 14 cm, was deeper and contained more organic matter in Juncus and Typha soils than in tidal shrub or forested wetlands. This observation was consistent with previous descriptions of frequently inundated herbaceous wetland soil horizons (Seybold et al., 2002), suggesting a possible connection between organic horizon depth, microbial activity, and vegetation cover. Higher microbial biomass and inferred activity in the forested wetland may limit the accumulation of organic matter, especially considering that the less flooded, higher-elevation forested wetlands typically receive more allochthonous, nutrient-rich sediment deposition than the lower-elevation marshes (Hupp et al., 2019), but was observed to contain much less organic carbon. Microbial biomass was significantly higher in the surface horizon than in the subsurface layer across all vegetation types, positively correlating with PICRUSt-inferred enzyme activities and direct measurement of the constitutive β-glucosidase and NAGase enzyme activities (Moorhead et al., 2013). There was little difference in the inorganic and organic carbon ratios between the sediment horizons, in agreement with previous studies of coastal wetland soils (Unger et al., 2016).
Sampling wetland soils at arbitrary depth intervals complicates the succeeding microbiology assessment between surface and subsurface horizons. Therefore, selecting sample depth intervals based on pedogenically derived, morphologically distinct layers is often preferable (Premrov et al., 2017). Significant oxygen penetration, which leaves distinct pedomorphological markers, is limited to the top few millimeters in many tidal wetlands (Brodersen et al., 2019), while the forested wetlands experience seasonal periods of aerobic conditions during which rates of organic matter decomposition increase (limiting soil carbon accumulation) (Miao et al., 2017). Thus, differences in microbial composition and activity are likely a function of redox potential and associated organic matter decomposition dynamics, not soil horizon depth. For example, inferred aerobic respiration, nitrate reduction, and sulfate reduction KEGG pathways were more abundant at the soil surface than anaerobic metal reducer abundance (determined by PLFA). This diversity of metabolic pathways captured in the surface layer likely shows that samples collected from the surface soil layer spanned nearly the full extent of the sediment redox potential, which is reasonable within a depth of a few centimeters (Mobilian and Craft, 2021). Methanogenic pathways were confined mainly to the subsurface horizons, where typically saturated, lower oxidation-reduction conditions prevailed (Megonigal et al., 1993). The forested wetlands represented the grand exception to this pattern, given that aerobic respiration pathways remained abundant in the subsurface and inferred methanogenesis, nitrate, and sulfate reduction pathways were minimal, likely due to the seasonal hydroperiod, and the introduction of oxygen along decomposed root channels and between mineral ped faces (Lahiri and Davidson, 2020). Large pockets of dissolved carbon and nutrients, corresponding to elevated enzyme activity and CO2-production, were previously observed in wetland subsurface soils, highlighting their capacity for biogeochemical functions such as nutrient cycling and climate regulation (Steinmuller et al., 2019).
4.3 Estimation of salinity and its effect in comparison with vegetation
The four vegetation types were selected to assess plant-microbe abundance patterns, across a gradient of brackish to freshwater porewater salinities. The expected salinity gradient in Mobile Bay based on reported vegetation salinity tolerances was forested wetland < Typha < tidal shrub < Juncus (USDA (U.S. Department of Agriculture), 2000). As expected, salinity in the subsurface was highest in Juncus, followed by shrub and Typha, and significantly less in forested wetlands. Salinity was similar in the surface layer across all wetland types, except for Typha wetlands which exhibited a higher salinity than the tidal shrub. The salinity difference was sufficient to differentiate the wetland types into three salinity classes, with the forested wetlands exhibiting pure fresh conditions (<0.5 ppt) compared with the herbaceous tidal shrub, Typha, and Juncus wetlands spanning intermediate to brackish salinity (0.5-6.0 ppt, Howes et al., 2010; Poffenbarger et al., 2011). Fine-scale differentiation of microbial community structure across domains has been observed along wetland salinity gradients previously (Franklin et al., 2017; Zhang et al., 2021). We observed a similarly significant salinity effect in addition to the stronger vegetation cover and sediment horizon effects described above.
Anaerolineaceae was the most frequently observed bacterial family in our study and occurred more frequently at higher salinity. This taxon has been noted as a significant community member under similar salinity and vegetation conditions (Weingarten and Jackson, 2022) and has also been seen to be enriched when wetland salinity is elevated (Wang et al., 2019). Notably, that study also found that the sulfate-reducing order Desulfobacterales formed a close association with Anaerolinaceae in intertidal wetland sediment to promote decomposition under anaerobic and saline conditions. This relationship could be decoupled with the removal of overlying vegetation and it is potentially significant that we observe a similar dynamic along a salinity-vegetation gradient. We observed the family Desulfobacteraceae, a member of the Desulfobacterales, as the second-most-prevalent family in wetland sediment, and like Anaerolineaceae, was more abundant at higher salinity. Syntrophy between these taxa and methanogens promoted anoxic decomposition in Wang et al., and we also observed the methanogenic Methanomassillicoccaceae as the third most abundant family, again being enriched by salinity. We were surprised to observe greater predicted gene abundance for methanogenesis at higher porewater salinities and in association with more salt-tolerant vegetation, but a close relationship with Anaerolineaceae and Desulfobacteraceae abundance may explain this finding.
Microbial biomass was significantly and negatively correlated with porewater salinity. Contrary to prior research showing that microbial biomass is highest in brackish wetlands (Luo et al., 2019), we observed consistently greater microbial biomass in the forested wetland soils. Microbial biomass and C abundance in brackish marsh are potentially connected to a larger pool of plant exudates (Armstrong et al., 2000; Luo et al., 2019), making it possible that the abundance of woody plant material in the forested sites fueled the higher microbial cell abundances. Unlike mangroves, where bacterial alpha diversity is often higher than in proximate freshwater marshes (Zhang et al., 2019), forested wetlands showed lower richness and diversity than the tidal shrub or Typha sites. Notably, alpha-diversity metrics were similarly low in Juncus sp. vegetated sites, representing low diversity at the two extremes of the observed salinity gradient. This parabolic trajectory of alpha-diversity to salinity has been observed previously (Zhang et al., 2021), but it is notable that in that study, brackish marsh, occupied here by Juncus sp., showed the highest diversity. In Zhang et al., the highest observed diversity occurs at ~6,000 µS/cm (3.2 ppt), near the mean salinity of the gradient in that study. We did not attempt to capture the full extent of salinity in Mobile Bay, instead focusing on fresher communities that are more likely to be impacted by saltwater intrusion than those already adapted to higher salinity.
Each of the extracellular enzyme activities and most of the PICRUSt degradation pathways declined with increasing porewater salinity. The same was true for most PICRUSt-inferred metabolic pathways, implying that elevated salinity may have suppressed microbial activity which could explain the higher C content in the herbaceous sites relative to the lower salinity forested sites. A similar relationship was reported from a 28-day salt addition to wetland soil (Qu et al., 2019), with greenhouse gas production and decomposition of OM being lowest in high-salinity treatments. Cellulase was the lone enzyme (PICRUSt-inferred) enriched at higher salinity, as shown previously in response to inundation with saline water (Li et al., 2022). Methanogen abundance and associated methane production are generally negatively correlated with salinity (Sutton-Grier et al., 2011; He et al., 2022), but inferred methanogenesis was the lone metabolic pathway positively correlated with porewater salinity here. This observation was likely due to the much higher moisture content in the herbaceous sediment compared to seasonally flooded freshwater forested wetlands, with methane production strongly favored under strongly reducing conditions (Neubauer et al., 2013), in addition to potential inter-taxa cooperation described above.
4.4 Connecting microbial composition and function with physicochemistry in tidal wetlands
Several interactions observed between wetland vegetation cover, soil physicochemistry, and microbial composition and function violated broad assumptions repeatably observed in coastal wetland systems. The relationship between microbial biomass and soil C differed from a trend that favors high biomass with larger soil C content (Bastida et al., 2021). Not only was microbial biomass highest in forested wetland soil, which was the most C-limited, but the ratio of bacterial richness to biomass was also atypical, with low species richness and diversity in forested soils (high biomass) relative to the other wetland types (low biomass). Temperate and tropical forest biomes often exhibit similar very high bacterial and fungal biomass, with low diversity. In terrestrial settings, the effect has been attributed to competitive exclusion, with intense competition reducing alpha diversity when microbial biomass is high (Delgado-Baquerizo and Eldridge, 2019). The caveat is that while microbial biomass was high and diversity low in the forested wetland soils, soil organic matter and total C were relatively low compared to the other wetland types, representing the inverse of the reported carbon-microbial community dynamics reported in terrestrial forests. High microbial biomass and activity have been linked to larger biomass plant species (Kim et al., 2022), as we saw here, but with corresponding higher prokaryotic diversity, unlike our finding. The relationship between carbon, microbial biomass, and diversity also differed from previous comparisons between mangrove wetlands and tidal marshes, where soil organic matter was positively correlated with diversity, which was higher in the mangroves relative to emergent herbaceous wetlands (Zhang et al., 2019). This difference suggests that the C – microbial biomass – prokaryotic richness/diversity dynamic in freshwater forested wetlands may be incomparable to either terrestrial forests or mangrove ecosystems.
Using automatic stepwise model building, we found percent S as the dominant factor driving microbial dissimilarity in the surface sediment layer, with disproportionate abundances of the sulfate reducer Desulfobacteraceae (Murphy et al., 2020). Interestingly, Desulfobulbaceae, a sulfate reducer commonly found in sulfate-rich wetlands (Long et al., 2021), was disproportionately abundant in the freshwater forested wetland soils, but was correlated with neither S content or salinity. Nitrate and nitrite were the strongest factors influencing the composition of the subsurface soil layer, expectedly concentrated in the NOx-rich forested wetland soils, where the nitrate-reducer Gallionellaceae (Huang Y.M. et al., 2021) and the ammonium-oxidizer Nitrososphaera (Tourna et al., 2011) were found in greater abundance.
Further connecting physicochemistry and microbial composition to microbial metabolism using amplicon-based genomic inference tools like PICRUSt, Piphillin, or Tax4Fun is complicated by inferior representation of environmental microbiota relative to human-associated taxa in microbial databases such as SILVA and RDP. As a result, these inference tools underperform on environmental datasets (Wemheuer et al., 2020). In the results of this study, inferred sulfate-reduction genes were enriched in forested wetland soils despite higher salinity, S%, and abundance of Desulfobacteraceae in the other marsh types. Interestingly, actual measurements of β-glucosidase and NAGase did not correlate with their PICRUSt-inferred equivalents (although actual vs. inferred phosphatase did positively correlate). It is also possible that our genome-inferences are incomplete, given that we only sequenced the archaeal/bacterial 16S gene, given that much of the degradation that occurs in wetlands, particularly of lignin-rich woody material, is driven by fungal metabolism (Ma et al., 2020; Zhan et al., 2021). However, given the strong and consistent correlation between inferred respiration, degradation pathways, and salinity, total microbial activity was likely the greatest in the forested wetland soils.
Of particular interest in future studies will be how short-term changes in coastal wetland habitats, i.e., daily tidal cycles, disturbances from drought and floods, or seasonal differences intersect with long-term changes from saltwater intrusion and the expected shifts in vegetative zonation. We found, principally, that higher elevation, microtidal forested habitat was compositionally and functionally different from lower elevation, more inundated marsh habitat, but it is unknown from our study how temporally dynamic the difference may be. Wetland microbiota may be enriched with marine taxa during high tide and sediment-bound taxa during low tide (Becker et al., 2020), and it may be necessary to separate resident from transient species in estimating microbiological ecosystem function (Weingarten and Jackson, 2022). Distinct compositional patterns in wetlands have been observed with monthly tidal cycles (neap-spring, Zhao et al., 2023) and between seasons (He et al, 2020), including changes in degradation activity (Zhang et al., 2020), warranting further investigation into whether the patterns observed in Mobile Bay persist throughout the year. Extreme storm disturbance may disrupt community composition, activity, and resulting carbon cycling (Yan et al., 2020; Huang S. et al., 2021), and with more frequent disturbances expected to coincide with saltwater intrusion, Mobile Bay is an intriguing study system for investigating the strength and persistence of the plant-microbe-soil relationships we have shown.
In summary, while some of the microbial trait interactions were unexpected compared with other terrestrial and estuarine ecosystems, these results highlight the dependence of soil biogeochemical pathways on inputs from overlying vegetation, hydropatterns, and salinity, improving our understanding of the complex plant-microbe-soil feedbacks occurring in spatially- and temporally-dynamic coastal ecosystems. Results of this study can be used to inform future modeling efforts with a specific focus on linking differences in microbial community composition and activity with anticipated shifts in salinity regimes, vegetation types, and associated delivery of wetland ecosystem functions, goods, and services.
5 Conclusions
In this case study of the Mobile Bay estuary, diverse vegetation reflected the gradient of freshwater to oligohaline salinities examined as seen in other microtidal hydrologic regimes typical of the northern Gulf of Mexico and elsewhere (Coogan and Dzwonkowski, 2018; Berkowitz et al., 2020). Physicochemical and microbial community and functional parameters demonstrated that wetland vegetation type played the strongest role in differentiating soil characteristics across the freshwater forested, Typha, tidal shrub, and Juncus wetlands. Vegetation superseded the still-significant effects of soil horizon and porewater salinity. Results indicate that forested wetlands displayed several distinctive characteristics relative to the other wetlands examined, including low soil organic matter contents; low microbial diversity; low β-glucosidase activity, low methanogenesis; high microbial biomass; high phosphatase activity; high respiration, nitrate, and sulfate reduction; and more abundant PICRUSt-inferred decomposition pathways. Several of the relationships examined are atypical for either terrestrial or estuarine biogeochemistry. In particular, forested wetland soils exhibited low carbon and nutrient content and relatively low bacterial diversity, yet hosted disproportionately high microbial biomass and high metabolic and decomposition activity, (as determined by PLFA, amplicon-seq, and PICRUSt). Some of the deviations from terrestrial or estuarine biogeochemistry may speak to the high connectivity throughout this estuary as a result of the many dynamic processes that shape this region ranging from significant riverine freshwater and sediment inputs influencing the forested wetlands to recent hurricanes and storms introducing saline waters into the herbaceous portions of the Bay. Future studies incorporating additional sampling of this region during periods of drought, riverine and coastal (i.e., storm) flooding, and following management activities that alter salinity and hydrodynamics (e.g., dredging navigation channels) may reveal clearer relationships between site geochemistry and microbial traits under a variety of scenarios. The lack of finding clear homology between these processes along the freshwater forest to oligohaline marsh wetland transition also highlights technical and computational opportunities to connect molecular microbiology and soil physicochemical properties with ecosystem functions in dynamic coastal ecosystems on the front lines of climate variability (Arneth et al., 2010; Bridgham et al., 2013).
Data availability statement
Original datasets are available in a publicly accessible repository. Sequencing data hasbeen archived in NCBI Sequence Read Archive under Accession PRJNA1051103.
Author contributions
EW: Data curation, Formal analysis, Investigation, Methodology, Visualization, Writing – original draft, Writing – review & editing. CJ: Conceptualization, Investigation, Methodology, Writing – review & editing. FC: Conceptualization, Investigation, Methodology, Writing – review & editing. MK: Data curation, Investigation, Methodology, Writing – review & editing. NH: Data curation, Investigation, Methodology, Writing – review & editing. MC: Conceptualization, Data curation, Funding acquisition, Methodology, Project administration, Resources, Supervision, Writing – review & editing. JB: Conceptualization, Data curation, Funding acquisition, Investigation, Methodology, Project administration, Resources, Supervision, Writing – review & editing. KI: Conceptualization, Data curation, Funding acquisition, Investigation, Methodology, Project administration, Resources, Supervision, Writing – review & editing.
Funding
The author(s) declare financial support was received for the research, authorship, and/or publication of this article. Project funding was provided by the Technical Director for Military Environmental Engineering and Sciences, US Army Engineer Research and Development Center.
Acknowledgments
Matthew R. Carr, Lyndsay A. Carrigee, Kayla N. Clark, Brianna M. Fernando, Cynthia L. Price, Yadav Sapkota, and Maggie A. Waites assisted with initial sample collection and processing. Banjamin D. Kocar was responsible for project administration.
Conflict of interest
The authors declare that the research was conducted in the absence of any commercial or financial relationships that could be construed as a potential conflict of interest.
Publisher’s note
All claims expressed in this article are solely those of the authors and do not necessarily represent those of their affiliated organizations, or those of the publisher, the editors and the reviewers. Any product that may be evaluated in this article, or claim that may be made by its manufacturer, is not guaranteed or endorsed by the publisher.
References
AOAC (2012). Total nitrogen, combustion. Official Methods of Analysis of AOAC INTERNATIONAL. 19th Ed (Gaithersburg, MD, USA: AOAC INTERNATIONAL).
Armstrong W., Cousins D., Armstrong J., Turner D., Beckett P. (2000). Oxygen distribution in wetland plant roots and permeability barriers to gas-exchange with the rhizosphere: a microelectrode and modelling study with Phragmites australis. Ann. Bot. 86, 687–703. doi: 10.1006/anbo.2000.1236
Arneth A., Harrison S. P., Zaehle S., Tsigaridis K., Menon S., Bartlein P., et al. (2010). Terrestrial biogeochemical feedbacks in the climate system. Nat. Geosci. 3, 525–532. doi: 10.1038/ngeo905
Barreto C. R., Morrissey E., Wykoff D., Chapman S. (2018). Co-occurring mangroves and salt marshes differ in microbial community composition. Wetlands 38, 497–508. doi: 10.1007/s13157-018-0994-9
Bassetti L., Pontee N., Bird J. (2022). An Innovative Case Study on Coastal Resilience: Tyndall Air Force Base (TAFB), Panama City, Florida Vol. 2022 (Ports), 23–31.
Bastida F., Eldridge D. J., García C., Kenny Png G., Bardgett R. D., Delgado-Baquerizo M. (2021). Soil microbial diversity–biomass relationships are driven by soil carbon content across global biomes. ISME J. 15, 2081–2091. doi: 10.1038/s41396-021-00906-0
Becker C. C., Weber L., Suca J. J., Llopiz J. K., Mooney T. A., Apprill A. (2020). Microbial and nutrient dynamics in mangrove, reef, and seagrass waters over tidal and diurnal time scales. Aquat. Microbial Ecol. 85, 101–119. doi: 10.3354/ame01944
Berkowitz J. F., Altman S., Reine K. J., Wilbur D., Kjelland M. E., Gerald T. K., et al. (2020). Evaluation of the potential impacts of the proposed Mobile Harbor navigation channel expansion on the aquatic resources of Mobile Bay, Alabama.
Berkowitz J., Piercy C., Welp T., VanZomeren C. (2019). Thin layer placement : technical definition for U.S. army corps of engineers applications (Engineer Research and Development Center (U.S). doi: 10.21079/11681/32283
Blankinship J. C., Berhe A. A., Crow S. E., Druhan J. L., Heckman K. A., Keiluweit M., et al. (2018). Improving understanding of soil organic matter dynamics by triangulating theories, measurements, and models. Biogeochemistry 140 (1), 1–13. doi: 10.1007/s10533-018-0478-2
Bridgham S. D., Cadillo-Quiroz H., Keller J. K., Zhuang Q. (2013). Methane emissions from wetlands: biogeochemical, microbial, and modeling perspectives from local to global scales. Global Change Biol. 19, 1325–1346. doi: 10.1111/gcb.12131
Brinson M. M., Christian R. R., Blum L. K. (1995). Multiple states in the sea-level induced transition from terrestrial forest to estuary. Estuaries 18, 648–659. doi: 10.2307/1352383
Brodersen K. E., Trevathan-Tackett S. M., Nielsen D. A., Connolly R. M., Lovelock C. E., Atwood T. B., et al. (2019). Oxygen consumption and sulfate reduction in vegetated coastal habitats: effects of physical disturbance. Front. Mar. Sci. 6, 14. doi: 10.3389/fmars.2019.00014
Bulseco A. N., Giblin A. E., Tucker J., Murphy A. E., Sanderman J., Hiller-Bittrolff K., et al. (2019). Nitrate addition stimulates microbial decomposition of organic matter in salt marsh sediments. Global Change Biol. 25, 3224–3241. doi: 10.1111/gcb.14726
Callahan B. J., McMurdie P. J., Rosen M. J., Han A. W., Johnson A. J. A., Holmes S. P. (2016). DADA2: High-resolution sample inference from Illumina amplicon data. Nat. Methods 13, 581–583. doi: 10.1038/nmeth.3869
Caporaso J. G., Lauber C. L., Walters W. A., Berg-Lyons D., Lozupone C. A., Turnbaugh P. J., et al. (2011). Global patterns of 16S rRNA diversity at a depth of millions of sequences per sample. Proc. Natl. Acad. Sci. 108, 4516–4522. doi: 10.1073/pnas.1000080107
Ceccon D. M., Faoro H., da Cunha Lana P., de Souza E. M., de Oliveira Pedrosa F. (2019). Metataxonomic and metagenomic analysis of mangrove microbiomes reveals community patterns driven by salinity and pH gradients in Paranaguá Bay, Brazil. Sci. Total Environ. 694, 133609. doi: 10.1016/j.scitotenv.2019.133609
Coogan J., Dzwonkowski B. (2018). Observations of wind forcing effects on estuary length and salinity flux in a river-dominated, microtidal estuary, Mobile Bay, Alabama. J. Phys. Oceanography 48, 1787–1802. doi: 10.1175/JPO-D-17-0249.1
Cowardin L. M. (1979). Classification of wetlands and deepwater habitats of the United States (Fish and Wildlife Service, US Department of the Interior).
Craft C. B. (2012). Tidal freshwater forest accretion does not keep pace with sea level rise. Global Change Biol. 18, 3615–3623. doi: 10.1111/gcb.12009
Day J. W., Christian R. R., Boesch D. M., Yáñez-Arancibia A., Morris J., Twilley R. R., et al. (2008). Consequences of climate change on the ecogeomorphology of coastal wetlands. Estuaries coasts 31, 477–491. doi: 10.1007/s12237-008-9047-6
Delgado-Baquerizo M., Eldridge D. J. (2019). Cross-biome drivers of soil bacterial alpha diversity on a worldwide scale. Ecosystems 22, 1220–1231. doi: 10.1007/s10021-018-0333-2
Douglas G. M., Maffei V. J., Zaneveld J. R., Yurgel S. N., Brown J. R., Taylor C. M., et al. (2020). PICRUSt2 for prediction of metagenome functions. Nat. Biotechnol. 38, 685–688. doi: 10.1038/s41587-020-0548-6
Feagin R., Irish J., Möller I., Williams A., Colón-Rivera R., Mousavi M. (2011). Engineering properties of wetland plants with application to wave attenuation. Coast. Eng. 58, 251–255. doi: 10.1016/j.coastaleng.2010.10.003
Franklin R. B., Morrissey E. M., Morina J. C. (2017). Changes in abundance and community structure of nitrate-reducing bacteria along a salinity gradient in tidal wetlands. Pedobiologia 60, 21–26. doi: 10.1016/j.pedobi.2016.12.002
Gilbert J. A., Jansson J. K., Knight R. (2014). The Earth Microbiome project: successes and aspirations. BMC Biol. 12, 1–4. doi: 10.1186/s12915-014-0069-1
Hauser S., Meixler M. S., Laba M. (2015). Quantification of impacts and ecosystem services loss in New Jersey coastal wetlands due to Hurricane Sandy storm surge. Wetlands 35, 1137–1148. doi: 10.7282/T3GF0WFH
He L., She C., Huang J., Yang P., Yu H., Tong C. (2022). Effects of constant and fluctuating saltwater addition on CH4 fluxes and methanogens of a tidal freshwater wetland: A mesocosm study. Estuarine Coast. Shelf Sci. 277, 108076. doi: 10.1016/j.ecss.2022.108076
He R., Zeng J., Zhao D., Huang R., Yu Z., Wu Q. L. (2020). Contrasting patterns in diversity and community assembly of phragmites australis root-associated bacterial communities from different seasons. Appl. Environ. Microbiol. 86, e00379–e00320. doi: 10.1128/AEM.00379-20
Howes N. C., FitzGerald D. M., Hughes Z. J., Georgiou I. Y., Kulp M. A., Miner M. D., et al. (2010). Hurricane-induced failure of low salinity wetlands. Proc. Natl. Acad. Sci. 107, 14014–14019. doi: 10.1073/pnas.0914582107
Huang S., Sherman A., Chen C., Jaffé P. R. (2021). Tropical cyclone effects on water and sediment chemistry and the microbial community in estuarine ecosystems. Environ. Pollut. 286, 117228. doi: 10.1016/j.envpol.2021.117228
Huang Y.-M., Straub D., Blackwell N., Kappler A., Kleindienst S. (2021). Meta-omics reveal Gallionellaceae and Rhodanobacter species as interdependent key players for Fe (II) oxidation and nitrate reduction in the autotrophic enrichment culture KS. Appl. Environ. Microbiol. 87, e00496-21. doi: 10.1128/AEM.00496-21
Hupp C. R., Kroes D. E., Noe G. B., Schenk E. R., Day R. H. (2019). Sediment trapping and carbon sequestration in floodplains of the lower Atchafalaya Basin, LA: Allochthonous versus autochthonous carbon sources. J. Geophysical Research: Biogeosciences 124, 663–677. doi: 10.1029/2018JG004533
International Organization for Standardization (1996). Soil quality - Determination of organic and total carbon after dry combustion.
International Organization for Standardization (2000). Soil quality -Determination of total sulfur by dry combustion.
International Organization for Standardization (2016). December 2016 - Investigation of solids temperature dependent differentiation of total carbon (TOC400, ROC, TIC900).
Jurjonas M., Seekamp E. (2018). Rural coastal community resilience: Assessing a framework in eastern North Carolina. Ocean Coast. Manage. 162, 137–150. doi: 10.1016/j.ocecoaman.2017.10.010
Kang H., Kim S., Freeman C. (2013). Enzyme activities. Methods biogeochemistry wetlands 10, 373–384. doi: 10.2136/sssabookser10
Kim S., Kang H., Megonigal J. P., McCormick M. (2022). Microbial activity and diversity vary with plant diversity and biomass in wetland ecosystems. Estuaries Coasts 45, 1434–1444. doi: 10.1007/s12237-021-01015-z
Krauss K. W., Noe G. B., Duberstein J. A., Conner W. H., Stagg C. L., Cormier N., et al. (2018). The role of the upper tidal estuary in wetland blue carbon storage and flux. Global Biogeochemical Cycles 32, 817–839. doi: 10.1029/2018GB005897
Lahiri C., Davidson G. R. (2020). Heterogeneous oxygenation of wetland soils with increasing inundation: Redox potential, water depth, and preferential flow paths. Hydrological Processes 34, 1350–1358. doi: 10.1002/hyp.13654
Li Y. L., Ge Z. M., Xie L. N., Li S. H., Tan L. S. (2022). Effects of waterlogging and salinity increase on CO2 efflux in soil from coastal marshes. Appl. Soil Ecol. 170, 104268. doi: 10.1016/j.apsoil.2021.104268
Liu L., Wu Y., Yin M., Ma X., Yu X., Guo X., et al. (2023). Soil salinity, not plant genotype or geographical distance, shapes soil microbial community of a reed wetland at a fine scale in the Yellow River Delta. Sci. Total Environ. 856, 159136. doi: 10.1016/j.scitotenv.2022.159136
Liu L., Zhu K., Wurzburger N., Zhang J. (2020). Relationships between plant diversity and soil microbial diversity vary across taxonomic groups and spatial scales. Ecosphere 11, e02999. doi: 10.1002/ecs2.2999
Long Y., Jiang J., Hu X., Hu J., Ren C., Zhou S. (2021). The response of microbial community structure and sediment properties to anthropogenic activities in Caohai wetland sediments. Ecotoxicology Environ. Saf. 211, 111936. doi: 10.1016/j.ecoenv.2021.111936
Louis B. P., Maron P.-A., Viaud V., Leterme P., Menasseri-Aubry S. (2016). Soil C and N models that integrate microbial diversity. Environ Chem Lett 14, 331–344. doi: 10.1007/s10311-016-0571-5
Luo M., Huang J. F., Zhu W. F., Tong C. (2019). Impacts of increasing salinity and inundation on rates and pathways of organic carbon mineralization in tidal wetlands: a review. Hydrobiologia 827, 31–49. doi: 10.1007/s10750-017-3416-8
Ma Y., Huang S., Gan Z., Xiong Y., Cai R., Liu Y., et al. (2020). The succession of bacterial and fungal communities during decomposition of two hygrophytes in a freshwater lake wetland. Ecosphere 11, e03242. doi: 10.1002/ecs2.3242
Maidak B. L., Cole J. R., Lilburn T. G., Parker C. T. Jr., Saxman P. R., Stredwick J. M., et al. (2000). The RDP (ribosomal database project) continues. Nucleic Acids Res. 28, 173–174. doi: 10.1093/nar/28.1.173
Malik A. A., Martiny J. B. H., Brodie E. L., Martiny A. C., Treseder K. K., Allison S. D. (2020). Defining trait-based microbial strategies with consequences for soil carbon cycling under climate change. ISME J. 14 (1), 1–9. doi: 10.1038/s41396-019-0510-0
Megonigal J. P., Patrick W. Jr., Faulkner S. (1993). Wetland identification in seasonally flooded forest soils: soil morphology and redox dynamics. Soil Sci. Soc. America J. 57, 140–149. doi: 10.2136/sssaj1993.03615995005700010027x
Miao G., Noormets A., Domec J.-C., Fuentes M., Trettin C. C., Sun G., et al. (2017). Hydrology and microtopography control carbon dynamics in wetlands: Implications in partitioning ecosystem respiration in a coastal plain forested wetland. Agric. For. Meteorology 247, 343–355. doi: 10.1016/j.agrformet.2017.08.022
Mobilian C., Craft C. B. (2021). “Wetland soils: physical and chemical properties and biogeochemical processes,” in Encyclopedia of Inland Waters (Second Edition), eds. Mehner T., Tockner K. (Oxford: Elsevier), 157–168. doi: 10.1016/B978-0-12-819166-8.00049-9
Moorhead D. L., Rinkes Z. L., Sinsabaugh R. L., Weintraub M. N. (2013). Dynamic relationships between microbial biomass, respiration, inorganic nutrients and enzyme activities: informing enzyme-based decomposition models. Front. Microbiol. 4, 223. doi: 10.3389/fmicb.2013.00223
Murphy A. E., Bulseco A. N., Ackerman R., Vineis J. H., Bowen J. L. (2020). Sulphide addition favours respiratory ammonification (DNRA) over complete denitrification and alters the active microbial community in salt marsh sediments. Environ. Microbiol. 22, 2124–2139. doi: 10.1111/1462-2920.14969
Neubauer S., Franklin R., Berrier D. (2013). Saltwater intrusion into tidal freshwater marshes alters the biogeochemical processing of organic carbon. Biogeosciences 10, 8171–8183. doi: 10.5194/bg-10-8171-2013
Neubauer S. C., Piehler M. F., Smyth A. R., Franklin R. B. (2019). Saltwater intrusion modifies microbial community structure and decreases denitrification in tidal freshwater marshes. Ecosystems 22, 912–928. doi: 10.1007/s10021-018-0312-7
Noe G. B., Hupp C. R., Bernhardt C. E., Krauss K. W. (2016). Contemporary deposition and long-term accumulation of sediment and nutrients by tidal freshwater forested wetlands impacted by sea level rise. Estuaries Coasts 39, 1006–1019. doi: 10.1007/s12237-016-0066-4
O’Dell J. W. (1993). “DETERMINATION OF NITRATE-NITRITE NITROGEN BY AUTOMATED COLORIMETRY,” in Methods for the determination of metals in environmental samples (Elsevier), 464–478. doi: 10.1016/B978-0-8155-1398-8.50026-4
Poffenbarger H. J., Needelman B. A., Megonigal J. P. (2011). Salinity influence on methane emissions from tidal marshes. Wetlands 31, 831–842. doi: 10.1007/s13157-011-0197-0
Premrov A., Cummins T., Byrne K. A. (2017). Assessing fixed depth carbon stocks in soils with varying horizon depths and thicknesses, sampled by horizon. Catena 150, 291–301. doi: 10.1016/j.catena.2016.11.030
Qu W., Li J., Han G., Wu H., Song W., Zhang X. (2019). Effect of salinity on the decomposition of soil organic carbon in a tidal wetland. J. Soils Sediments 19, 609–617. doi: 10.1007/s11368-018-2096-y
Rietl A. J., Overlander M. E., Nyman A. J., Jackson C. R. (2016). Microbial community composition and extracellular enzyme activities associated with Juncus roemerianus and Spartina alterniflora vegetated sediments in Louisiana saltmarshes. Microbial Ecol. 71, 290–303. doi: 10.1007/s00248-015-0651-2
Seybold C. A., Mersie W., Huang J., McNamee C. (2002). Soil redox, pH, temperature, and water-table patterns of a freshwater tidal wetland. Wetlands 22, 149–158. doi: 10.1672/0277-5212(2002)022[0149:SRPTAW]2.0.CO;2
Smith R. D., Ammann A. P., Bartoldus C. C., Brinson M. M. (1995). An approach for assessing wetland functions using hydrogeomorphic classification, reference wetlands, and functional indices.
Steinmuller H. E., Dittmer K. M., White J. R., Chambers L. G. (2019). Understanding the fate of soil organic matter in submerging coastal wetland soils: A microcosm approach. Geoderma 337, 1267–1277. doi: 10.1016/j.geoderma.2018.08.020
Steinmuller H. E., Hayes M. P., Hurst N. R., Sapkota Y., Cook R. L., White J. R., et al. (2020). Does edge erosion alter coastal wetland soil properties? A multi-method biogeochemical study. Catena 187, 104373. doi: 10.1016/j.catena.2019.104373
Sulman B. N., Moore J. A. M., Abramoff R., Averill C., Kivlin S., Georgiou K., et al. (2018). Multiple models and experiments underscore large uncertainty in soil carbon dynamics. Biogeochemistry 141 (2), 109–123. doi: 10.1007/s10533-018-0509-z
Sutton-Grier A. E., Keller J. K., Koch R., Gilmour C., Megonigal J. P. (2011). Electron donors and acceptors influence anaerobic soil organic matter mineralization in tidal marshes. Soil Biol. Biochem. 43, 1576–1583. doi: 10.1016/j.soilbio.2011.04.008
Union of Concerned Scientists, (2016). The US Military on the Front Lines of Rising Seas, Union of Concerned Scientists (2016). Available at: https://www.ucsusa.org/resources/us-military-front-lines-rising-seas (Accessed December 13, 2023).
Tourna M., Stieglmeier M., Spang A., Könneke M., Schintlmeister A., Urich T., et al. (2011). Nitrososphaera viennensis, an ammonia oxidizing archaeon from soil. Proc. Natl. Acad. Sci. 108, 8420–8425. doi: 10.1073/pnas.1013488108
Unger V., Elsey-Quirk T., Sommerfield C., Velinsky D. (2016). Stability of organic carbon accumulating in Spartina alterniflora-dominated salt marshes of the Mid-Atlantic US. Estuarine Coast. Shelf Sci. 182, 179–189. doi: 10.1016/j.ecss.2016.10.001
USDA (U.S. Department of Agriculture) (2000). The PLANTS database (Baton Rouge, LA: National Plant Data Center). Available at: http://plants.usda.gov.
Wallenstein M. D., Hall E. K. (2012). A trait-based framework for predicting when and where microbial adaptation to climate change will affect ecosystem functioning. Biogeochemistry 109 (1), 35–47. doi: 10.1007/s10533-011-9641-8
Wang Q., Cao Z., Liu Q., Zhang J., Hu Y., Zhang J., et al. (2019). Enhancement of COD removal in constructed wetlands treating saline wastewater: Intertidal wetland sediment as a novel inoculation. J. Environ. Manage. 249, 109398. doi: 10.1016/j.jenvman.2019.109398
Weingarten E. A., Jackson C. R. (2022). Microbial composition of freshwater marsh sediment responds more strongly to microcosm seawater addition than simulated nitrate or phosphate eutrophication. Microb. Ecol. 86, 1060–1070. doi: 10.1007/s00248-022-02111-8
Wemheuer F., Taylor J. A., Daniel R., Johnston E., Meinicke P., Thomas T., et al. (2020). Tax4Fun2: prediction of habitat-specific functional profiles and functional redundancy based on 16S rRNA gene sequences. Environ. Microbiome 15, 1–12. doi: 10.1186/s40793-020-00358-7
Yan G., Labonté J. M., Quigg A., Kaiser K. (2020). Hurricanes accelerate dissolved organic carbon cycling in coastal ecosystems. Front. Mar. Sci. 7. doi: 10.3389/fmars.2020.00248
Zhan P., Liu Y., Wang H., Wang C., Xia M., Wang N., et al. (2021). Plant litter decomposition in wetlands is closely associated with phyllospheric fungi as revealed by microbial community dynamics and co-occurrence network. Sci. Total Environ. 753, 142194. doi: 10.1016/j.scitotenv.2020.142194
Zhang C. J., Pan J., Duan C. H., Wang Y. M., Liu Y., Sun J., et al. (2019). Prokaryotic diversity in mangrove sediments across southeastern China fundamentally differs from that in other biomes. Msystems 4, e00442–e00419. doi: 10.1128/mSystems.00442-19
Zhang G., Bai J., Tebbe C. C., Zhao Q., Jia J., Wang W., et al. (2021). Salinity controls soil microbial community structure and function in coastal estuarine wetlands. Environ. Microbiol. 23, 1020–1037. doi: 10.1111/1462-2920.15281
Zhang X., Ji Z., Shao Y., Guo C., Zhou H., Liu L., et al. (2020). Seasonal variations of soil bacterial communities in Suaeda wetland of Shuangtaizi River estuary, Northeast China. J. Environ. Sci. 97, 45–53. doi: 10.1016/j.jes.2020.04.012
Keywords: wetlands, sea level rise, sediment microbiome, physicochemistry, estuary, plant-microbe, plant-microbe-soil
Citation: Weingarten EA, Jung CM, Crocker FH, Kneer ML, Hurst NR, Chappell MA, Berkowitz JF and Indest KJ (2023) Connecting coastal wetland microbial community characteristics with soil physicochemical properties across an estuarine salinity and vegetation gradient in Mobile Bay, AL, USA. Front. Mar. Sci. 10:1304624. doi: 10.3389/fmars.2023.1304624
Received: 29 September 2023; Accepted: 06 December 2023;
Published: 22 December 2023.
Edited by:
Li Jianlon, Shandong University, ChinaReviewed by:
Patrick Biber, University of Southern Mississippi, United StatesPing Gao, Ministry of Natural Resources, China
Copyright © 2023 Weingarten, Jung, Crocker, Kneer, Hurst, Chappell, Berkowitz and Indest. This is an open-access article distributed under the terms of the Creative Commons Attribution License (CC BY). The use, distribution or reproduction in other forums is permitted, provided the original author(s) and the copyright owner(s) are credited and that the original publication in this journal is cited, in accordance with accepted academic practice. No use, distribution or reproduction is permitted which does not comply with these terms.
*Correspondence: Karl J. Indest, a2FybC5qLmluZGVzdEB1c2FjZS5hcm15Lm1pbA==
 Eric A. Weingarten
 Carina M. Jung
 Fiona H. Crocker
 Karl J. Indest