
95% of researchers rate our articles as excellent or good
Learn more about the work of our research integrity team to safeguard the quality of each article we publish.
Find out more
ORIGINAL RESEARCH article
Front. Mar. Sci. , 22 December 2023
Sec. Marine Biology
Volume 10 - 2023 | https://doi.org/10.3389/fmars.2023.1304493
This article is part of the Research Topic Ecology of Marine Zooplankton and Micronekton in Polar and Sub-Polar Areas View all 12 articles
 Marco Barra1
 Letterio Guglielmo2
 Angelo Bonanno3*
 Olga Mangoni4
 Paola Rivaro5
 Paola Rumolo1
 Pierpaolo Falco6
 Gualtiero Basilone3Ignazio Fontana3
 Rosalia Ferreri3
 Giovanni Giacalone3
 Salvatore Aronica3Roberta Minutoli7
 Francesco Memmola6
 Antonia Granata7†Simona Genovese3†
Acoustic data were collected by means of Simrad EK60 scientific echosounder on board the research vessel “Italica” in the Ross Sea during the 2016/2017 austral summer as part of the P-Rose and CELEBeR projects, within the framework of the Italian National Research Program in Antarctica (PNRA). Sampling activities also involved the collection of vertical hydrological profiles using the SBE 9/11plus oceanographic probe. Acoustic data were processed to extract three specific scattering structures linked to Euphausia superba, Euphausia crystallorophias and the so called Sound-Scattering Layers (SSLs; continuous and low-density acoustic structures constituted by different taxa). Four different sectors of the study area were considered: two southern coastal sectors (between the Drygalski Ice Tongue and Coulman Island), a northern sector (~30 nmi East of Cape Hallett) and an offshore one spanning about 2 degrees of latitude from Coulman Island south to the Drygalski Ice Tongue. The vertical structure of each group in each area was then analyzed in relation to the observed environmental conditions. Obtained results highlighted the presence of different vertical structures (both environmental and acoustic) among areas, except for the two southern coastal sectors that were found similar. GAM modelling permitted to evidence specific relationships between the environmental factors and the vertical distribution of the considered acoustic groups, letting to hypothesize the presence of trophic relationships and differences in SSL species composition among areas. The advantages of acoustic techniques to implement opportunistic monitoring strategies in endangered ecosystems are also discussed.
The use of active acoustic techniques to study life in the ocean began about a century ago (Kimura, 1929; Sund, 1935). From the earliest applications, the importance of such techniques and the impact they would have on our ability to study marine species in the water column became clear (Benoit-Bird and Lawson, 2016). Over the years, there has been considerable progress in both the development of increasingly reliable electroacoustic instrumentation and the development of faster and more sophisticated data analysis algorithms. Furthermore, for several years now, acoustic instruments specifically designed to study marine organisms in the water column have played a very important role in the assessment of commercial fish stocks and their management (Fernandes et al., 2002; Muradian et al., 2017; Bonanno et al., 2021; Leonori et al., 2021). The availability of acoustic data, acquired for the assessment of commercially exploited species, often with time series spanning decades, has made it possible to carry out multiple studies on the habitat suitability, spatial distribution and fluctuations in abundance of these species in relation to indices of natural climate variability in various regions (Lluchbelda et al., 1992; Gutierrez et al., 2007; Barange et al., 2009; Barra et al., 2015; Bonanno et al., 2015; Schismenou et al., 2017; Ben Abdallah et al., 2018; Bonanno et al., 2018; Zgozi et al., 2018; De Felice et al., 2021). In addition, acoustic techniques allow the acquisition of scattering volume profiles of the water column with high vertical resolution over large spatial scales in a quasi-synoptic way. Taking advantage of such features, an important area of marine ecology, focusing on spatial distribution of organisms in the water column in relation to environmental forcings, has strongly developed over the years. In this context, since many organisms aggregate in areas with particular environmental characteristics, acoustic observations, together with hydrographic and current measurements (often estimated from satellite data or through ocean circulation models) are used to understand the interaction of biological and physical processes underlying animal aggregations (Murase et al., 2009; Davis et al., 2017; Leonori et al., 2017).
Acoustics have also become an important part of plankton research (Greenlaw and Johnson, 1982) allowing scientists to monitor zooplankton movements in the water column in response to physical and chemical characteristics of the ocean. Just to give some examples, Cheriton et al. (2007) studied zooplankton aggregations occupying vertical scales of the order of 1 m and horizontal scales of kilometers. The authors showed how such layers are associated with the pycnocline in calm conditions while being strongly modified by wind and the movement of water masses with different characteristics from those in which these layers were formed. Ianson et al. (2011), analyzing acoustic data from multifrequency scientific echosounders, highlighted the influence of turbulent flow in the aggregation of Euphausia pacifica. The acquisition of acoustic data using an autonomous underwater vehicle made it possible to sample previously inaccessible areas under the ice in Antarctica, revealing the importance of the ice edge for krill (Brierley et al., 2002). Acoustics also allowed researchers to examine an important strategy used by copepods to hide from predators: overwintering at depth (Bagoien et al., 2001).
The ability of acoustics to examine multiple types of organisms at once has played an important role in identifying how the avoidance and foraging strategies of predators change depending on the time of day. For example, in the waters of Oahu (Hawaii), zooplankton, fish and dolphins all concentrate on one depth and are very active at dusk, but each group uses very different tactics during the rest of the night (Benoit-Bird & McManus, 2014).
The present study reports some of the results of an oceanographic survey, carried out in the austral summer of 2016/2017 in the waters of the Ross Sea as part of the P-ROSE project (“Plankton biodiversity and functioning of the Ross Sea ecosystems in a changing Southern Ocean” - PNRA16 00239), within the framework of the Italian National Research Program in Antarctica (PNRA). Part of the data analyzed were also collected during the activities of the CELEBeR project (“CDW Effects on glacial melting and on Bulk of Fe in the Western Ross sea” - PNRA16 00207).
The Ross Sea is a highly productive ecosystem whose food web is very complex and characterized by multiple trophic pathways (Hopkins, 1987; Smith et al., 2007; Pinkerton and Bradford-Grieve, 2014; Smith et al., 2014). Regarding the application of acoustic techniques for the study of marine organisms in this specific area of Antarctica, over the past decades, most efforts focused on studying the spatial distribution of a few key species such as Euphausia superba, Euphausia crystallorophias and Pleuragramma antarctica, using both net sampling and acoustic techniques (Guglielmo et al., 1997; Azzali and Kalinowski, 2000; Granata et al., 2002; Sala et al., 2002; Azzali et al., 2006; Granata et al., 2009; Guglielmo et al., 2009; La Mesa et al., 2010; Naganobu et al., 2010; Davis et al., 2017; Leonori et al., 2017). In contrast, only little information is available on the characteristics and extent of sound-scattering layers that are ubiquitous acoustic structures commonly found in all oceans and representing a large percentage of the pelagic biomass (Blanluet et al., 2019; Geoffroy et al., 2019).
In the present study, according to well-known procedures available in literature (Fontana et al., 2022 and references therein), three distinct acoustic groups were identified (E. crystallorophias, E. superba and Sound-Scattering Layers) aiming at characterizing their vertical structure in relation to the environmental conditions (as inferred by CTD data) in four different sectors of the Ross Sea during the 2016/2017 summer.
In the framework of the Italian National Research Program in Antarctica (PNRA), a multidisciplinary oceanographic survey is routinely carried out in the Ross Sea during the austral summer, partitioning the available vessel time among different research projects. During the 2016/2017 Austral summer, the P-ROSE project focused on the plankton biodiversity and functioning in some sectors of the Ross Sea. The planned sampling activities considered the collection of acoustic data and zooplankton samples along specific transects. Additional acoustic data were opportunistically collected in the sectors pertaining the CELEBeR project study area. Due to bad weather conditions, that led to a reduction in the time available for zooplankton and micronekton samplings, few (and unrepresentative) samples were collected in the area pertaining the P-ROSE project, while the zooplankton sampling was not foreseen in the other sectors considered in this study (CELEBeR project study area). Thus, for the purposes of this work, biological samples were not considered.
Acoustic data were collected from 08 January to 04 February 2017, on the board research vessel “Italica”, in four sectors of the Ross Sea: area A1 located in the coastal waters between the Drygalski tongue and Cape Washington; area A2 located in coastal waters between Cape Washington and Coulman island; area A3 corresponding to the off-shore sector between Coulman island and the Drygalski tongue; area A4 is the one in front of Cape Hallett (Figure 1). Acoustic data were collected with a Simrad EK60 scientific echo-sounder working at three different frequencies (38 kHz, 120 kHz and 200 kHz) and calibrated following standard techniques (Foote et al., 1987).
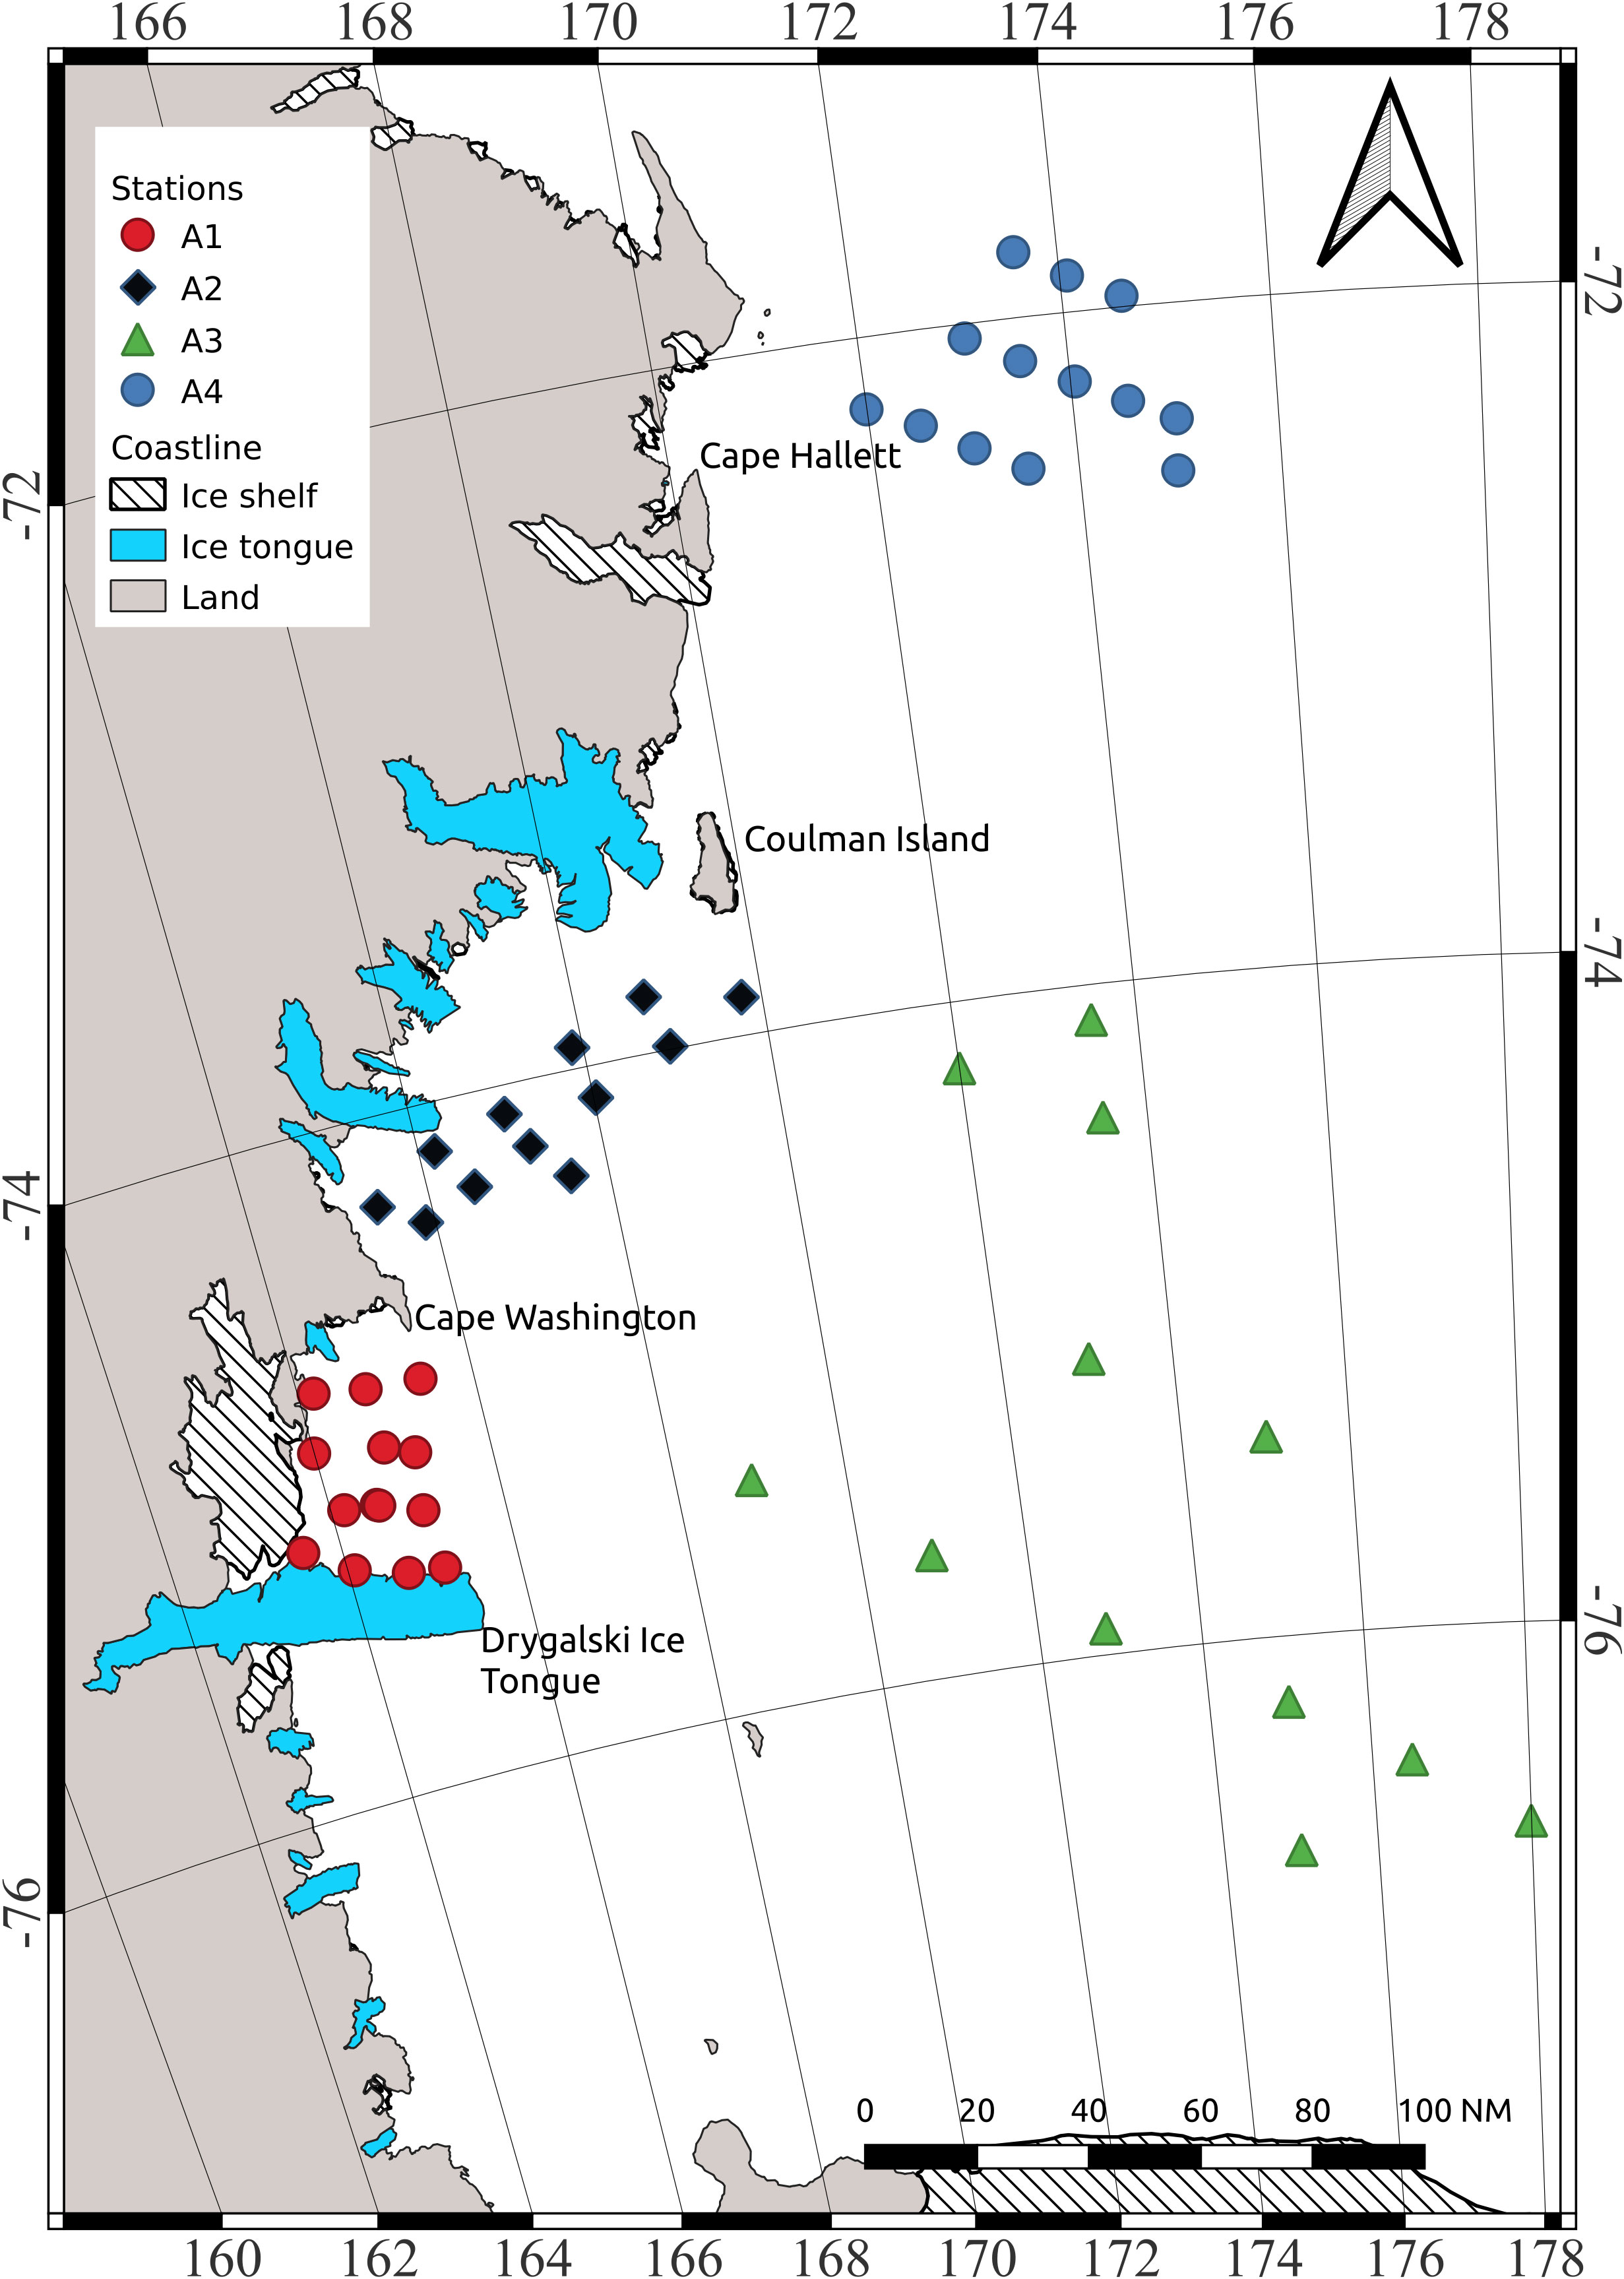
Figure 1 Study area and sampling stations.
The echo-sounder was configured to ping simultaneously at each frequency with a pulse duration of 1024 ms. Raw data were processed using the Echoview@ software package (Higginbottom et al., 2000) in order to extract all echoes related to the three considered groups, namely Euphausia superba (S), Euphausia crystallorophias (C) and Sound-Scattering Layers (SSL).
In each echogram, the analysis area was defined between 15 m and 200 m. The upper threshold (15 m) was chosen to avoid the effects of air bubbles due to bad weather conditions. The lower threshold (200 m) was chosen considering that most mesozooplankton occurs in the upper 200 m layer (Kasyan, 2023) and that the acoustic signal acquired by the transducer at 200 kHz was strongly attenuated. In order to remove background noise from the echograms collected at 38, 120 and 200 kHz, the method proposed by De Robertis & Higginbottom (2007) was adopted. In terms of krill species identification, E. superba and E. crystallorophias could be identified based on the equation proposed by Brierley et al. (1998) and La et al. (2015), respectively. Fontana et al. (2022), who worked on energetic and geometric parameters extracted from each aggregation and tested different clustering methods, highlighted that k-means performed better than other clustering methods, allowing the consistent classification of the two krill species. Consequently, acoustic data associated with the krill species were identified using the k-means method according to Fontana et al. (2022). All aggregations not linked to E. superba and E. crystallorophias were classified as “unknown” and removed from the analysis. SSLs were thus obtained by removing the identified krill aggregations (as well as background noise) from the acoustic data and ensuring the absence of other aggregations (“unknown” based on k-means approach; Fontana et al., 2022). NASC (Nautical Area Scattering Coefficient; MacLennan et al., 2002) values for the three above mentioned groups were extracted according to a grid characterized by a vertical resolution of 10 m and an elementary distance sampling unit (EDSU) of 0.5 nmi. The threshold level for the acoustic data analysis was set at -90 dB for the three frequencies. In relation to the aim of this study, density values (i.e. NASC) here analyzed were based on acoustic data acquired at 120 kHz, the most suitable frequency for detecting zooplankton aggregations (see Supplementary Figures S1–S4).
Temperature (°C), salinity (PSU), fluorescence (mg/m3), depth (m) and oxygen (mg/l) data were acquired along the water column by means of the SBE 9/11plus multiparametric probe at the maximum frequency (24 Hz) with a descent speed of 1 m/s. 13 CTD stations were acquired in the A1 area, 12 in the A2 area, 12 in the A3 area and 13 in the A4 area (Figure 1). The data were processed and quality checked according to international procedures (SCOR Working Group, 1988), by using the CTD Sea Bird Electronics data processing software. Finally, the profiles were vertically averaged over 1-m-depth bins. The fluorescence sensor was calibrated (Chl-a = 1.5764 * Fluorescence + 0.2533; R2 = 0.8514) with chlorophyll-a samples collected in situ and analyzed following Holm-Hansen et al. (1965), using a spectrofluorometer (Shimadzu, Mod. RF - 6000; Shimadzu Corporation-Japan) checked daily with a Chl-a standard solution (Sigma-Aldrich).
For each CTD station position, mean vertical NASC profiles at 120 kHz for the three considered groups (E. crystallorophias, E. superba and SSL) were obtained by averaging the NASC profiles of the EDSUs falling within 5 nmi from the CTD station. Furthermore, CTD related environmental parameters were vertically averaged each 10 m depth in order to obtain the same vertical resolution of acoustic data. The obtained dataset was thus fully balanced as for each station almost the same number of observations was available, allowing for consistent comparisons among sub-areas.
In a first step, an exploratory data analysis on the environmental dataset was carried out. Boxplots and Kruskal-Wallis ANOVA (followed by Dunn’s post-hoc test) were used to graphically evidence and evaluate the presence of significant differences in temperature, salinity, chlorophyll-a, and oxygen values among the four areas. The possible presence of structural patterns among environmental variables was also assessed by means of Principal Component Analysis (PCA). In particular, PCA was carried out on log-transformed values as, working on raw values, the distribution of PCA scores was highly skewed. E. crystallorophias, E. superba and SSL NASC values were considered in the PCA as quantitative supplementary variables to evaluate possible relationships between NASC values and Principal Components (PCs). In a similar way, the area factor was included in the PCA as a qualitative supplementary variable thus allowing to evaluate possible significant effects in terms of area. In this context, the supplementary variables (qualitative and quantitative) do not influence the PCA that is thus based on environmental dataset only.
For each station, the average S, C and SSL NASC values were computed along with the vertical mass center (i.e. the NASC-weighted average depth, highlighting the depth where most of the biomass was concentrated) for the three groups. Similarly to what was done on the environmental dataset, boxplot and Kruskal-Wallis ANOVA followed by Dunn’s post-hoc test were used to visualize and to test the differences in terms of NASC and mass center among areas for the three groups (SSL, C and S). The analysis of the relationship between environmental variables and C, S and SSL was carried out by means of Generalized Additive Models (GAM). The variables selection was carried out according to Wood’s guidelines (Wood, 2001) and evaluating at each step the presence of deviation from the main assumptions (influential points, residuals distribution and multicollinearity). In particular, SSL NASC values, due to the highly right-skewed distribution, were modeled using Gamma error distribution with a log-link function. In the case of C and S, due to the large proportion of zero values and to the highly skewed strictly positive values, a presence/absence approach was used; NASC values for such groups were coded as binary variables and a binomial error family with logit-link function was used for modelling. To test the possible relationship between the vertical distribution of krill species (i.e. C and S) and SSL, the effect of C and S NASC was tested in the SSL model and the effect of SSL NASC was evaluated in the C and S models. All statistical analyses were carried out by means of R statistical software (R Core Team, 2023) by using “FactoMineR” (Le et al., 2008) and “mgcv” (Wood, 2011) packages.
In a first step, CTD vertical profiles were inspected and averaged to highlight differences between areas in terms of temperature, salinity, Chl-a and oxygen (Supplementary Figure S5). Considering the average profiles by area, the A1 and A2 areas showed very similar shapes in terms of temperature (Figure 2), characterized by an almost linear decreasing trend from surface to 50 m depth, followed by a smooth decrease in temperature up to 100 m depth where temperature values almost stabilize. In such areas, and particularly in the A2 area, a small inversion was observed at the surface in terms of trends (i.e. the temperature increases with depth in the first part of the vertical profile and then starts to decrease). In addition, the two areas showed different temperature values at surface (~0.75°C in A1 and ~0°C in A2). The A3 area showed almost the same temperature profile of A1 and A2 areas, but here a step was observed around 30 m depth and temperature values were more variable below 100 m depth. Finally, in the A4 area the average temperature profile was quite different from the other ones with temperature almost stable from the surface till 40 m, while increasing from 50 m depth up to about 160 m depth where it stabilizes. In terms of salinity, average vertical profiles showed pairwise similarity, with A1 and A2 areas which showed an increasing trend from the surface up to 100 m depth followed by almost stable salinity values, while A3 and A4 areas were characterized by a very low variability from the surface up to 50 m depth followed by an increasing trend up to 200 m depth. Concerning the average Chl-a profiles, in the A1, A2 and A3 areas a clear maximum was observed at different depths and with different values depending on the area (Figure 2). On the contrary, in the A4 area, Chl-a values increased along the first few meters and then remained almost constant up to 50 m depth, where they started to decrease. Oxygen values showed an almost sigmoidal shape in all areas, but with a different degree of variation depending on the area.
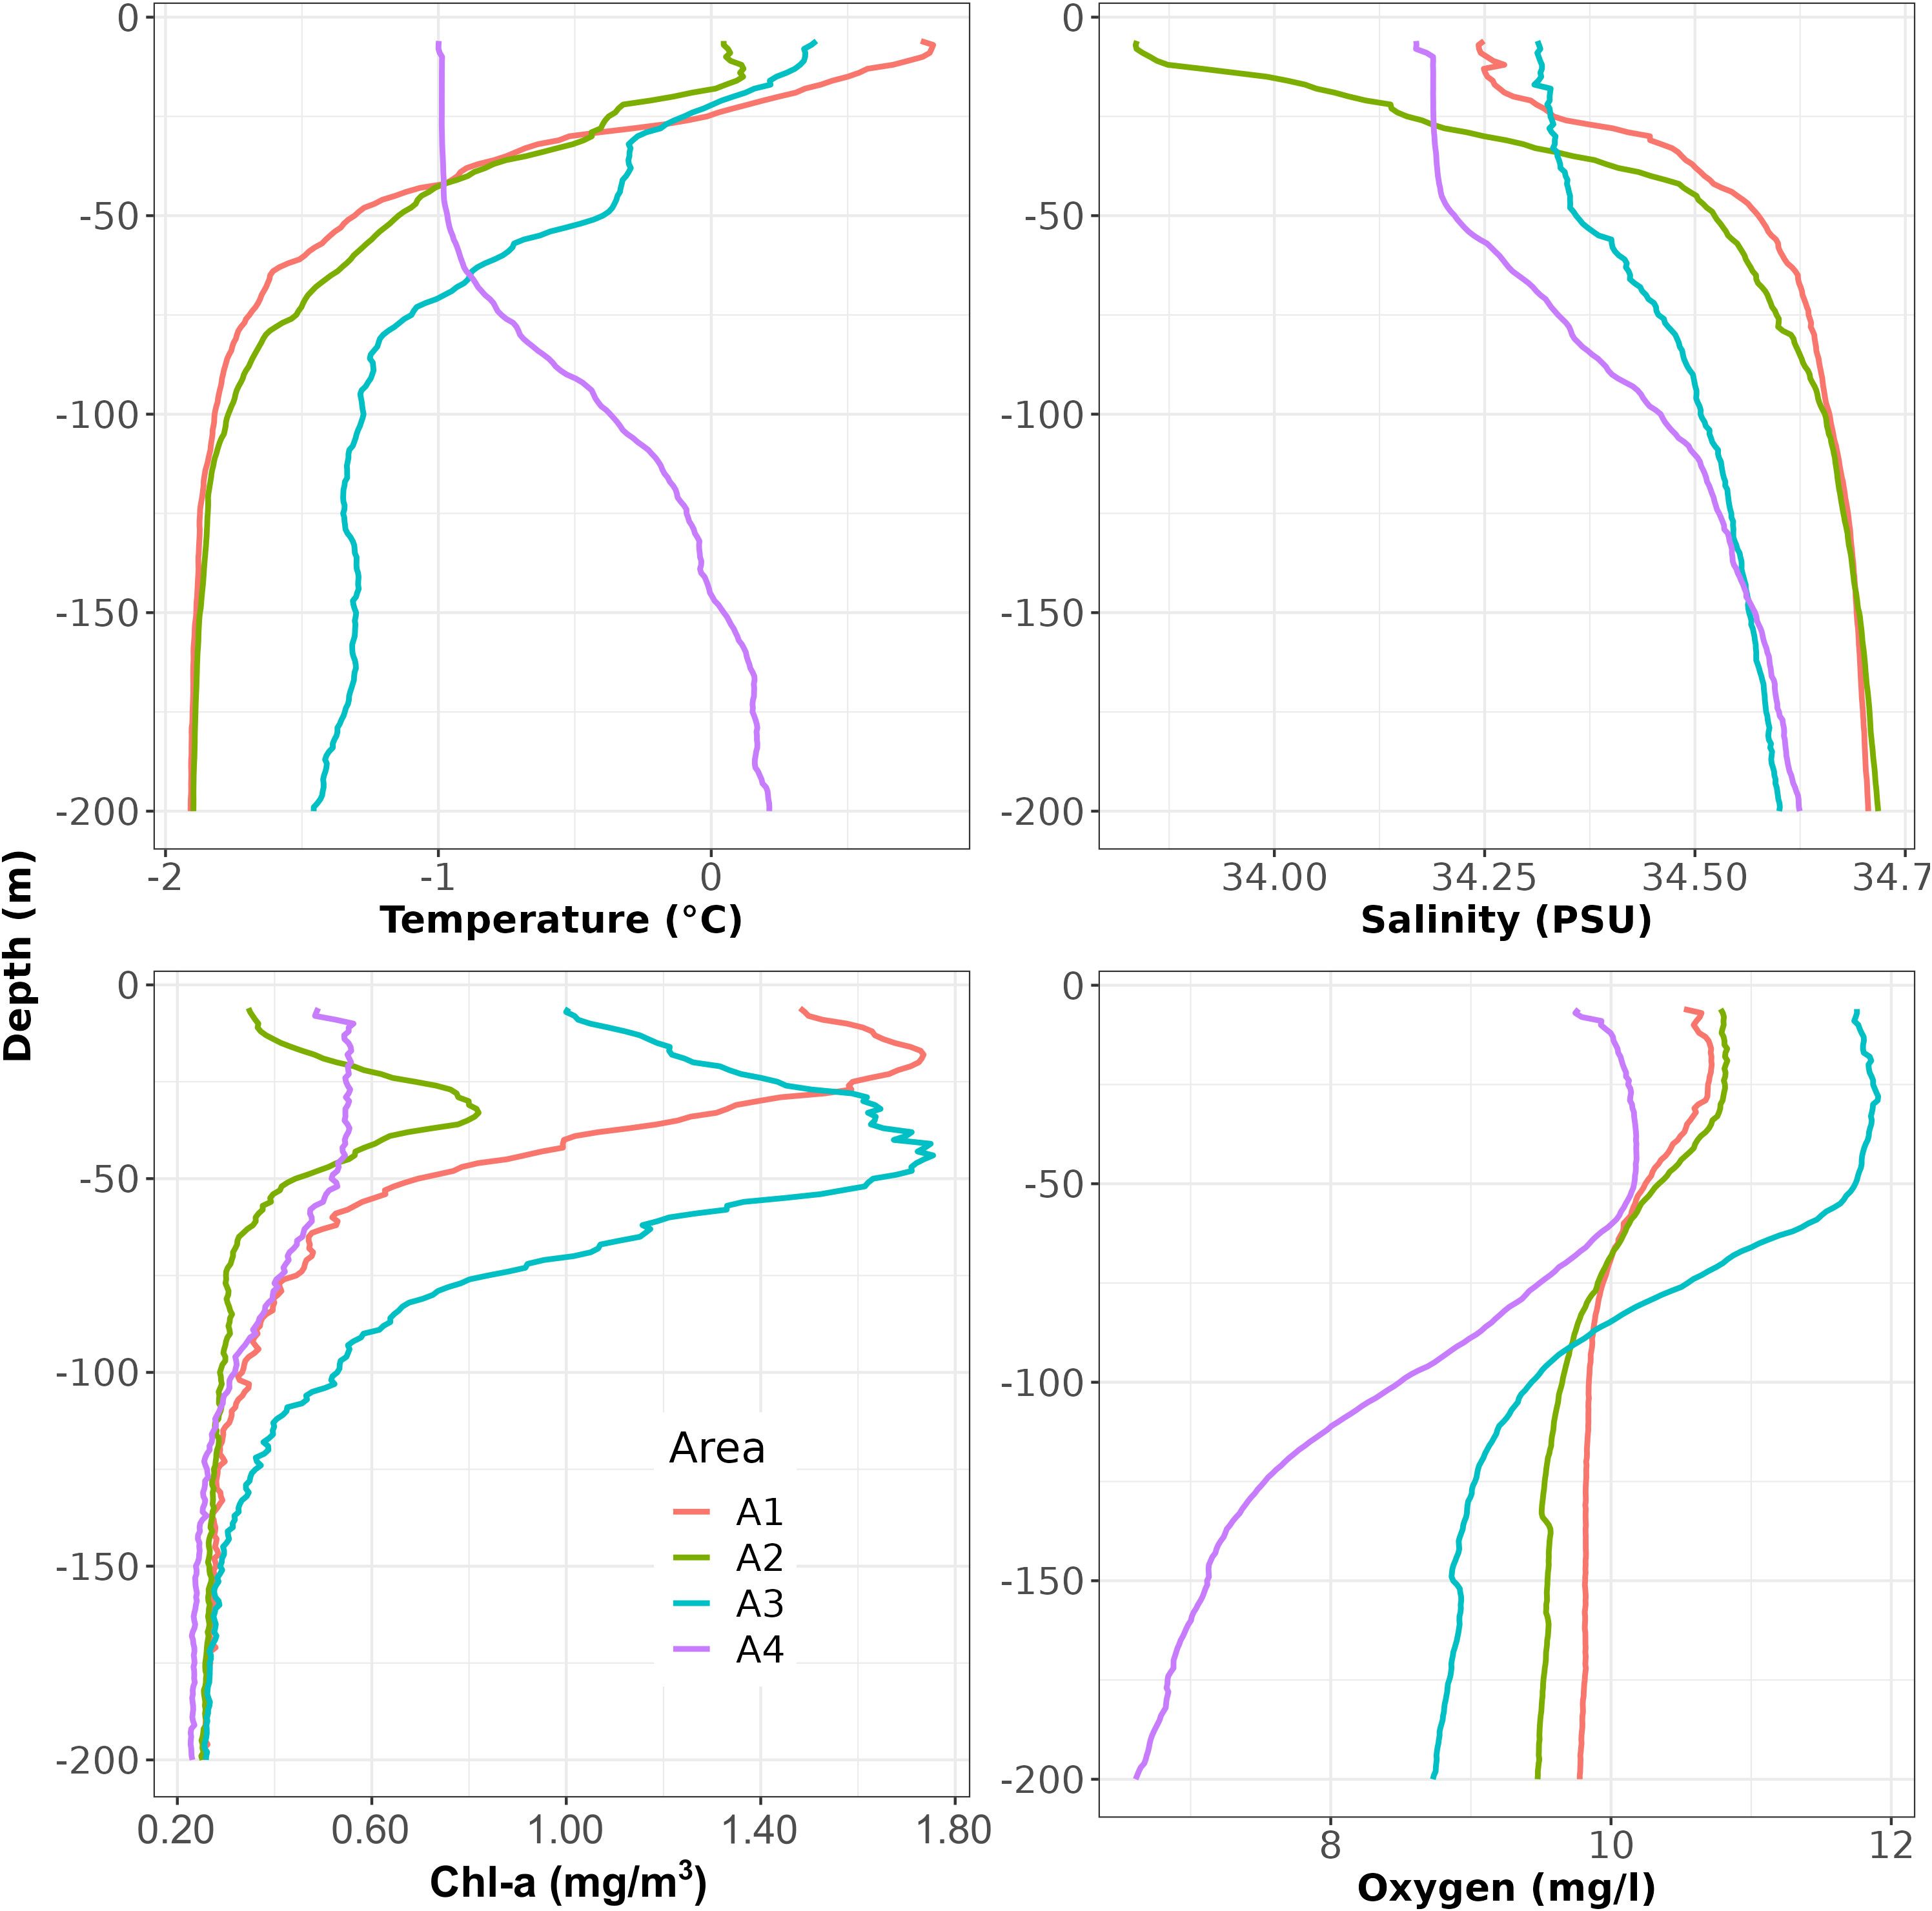
Figure 2 Depth-averaged vertical profiles by area of temperature, salinity, Chl-a and oxygen.
Non-parametric ANOVA (Kruskal-Wallis rank sum test) showed significant differences between areas (H(3) = 36.902, p-value = 4.8×10-08 for temperature; H(3) = 38.484, p-value = 2.2×10-08 for salinity; H(3) = 29.913, p-value = 1.4×10-06 for Chl-a; H(3) = 24.99, p-value = 1.6×10-05 for oxygen). Post-hoc tests showed: A1 and A2 to be similar in terms of temperature; pairwise similar in salinity (A1 - A2 and A3 - A4); pairwise similar in Chl-a (A1 - A3 and A2 - A4); A1, A2 and A3 similar for oxygen but all different from the A4 area (Figure 3).
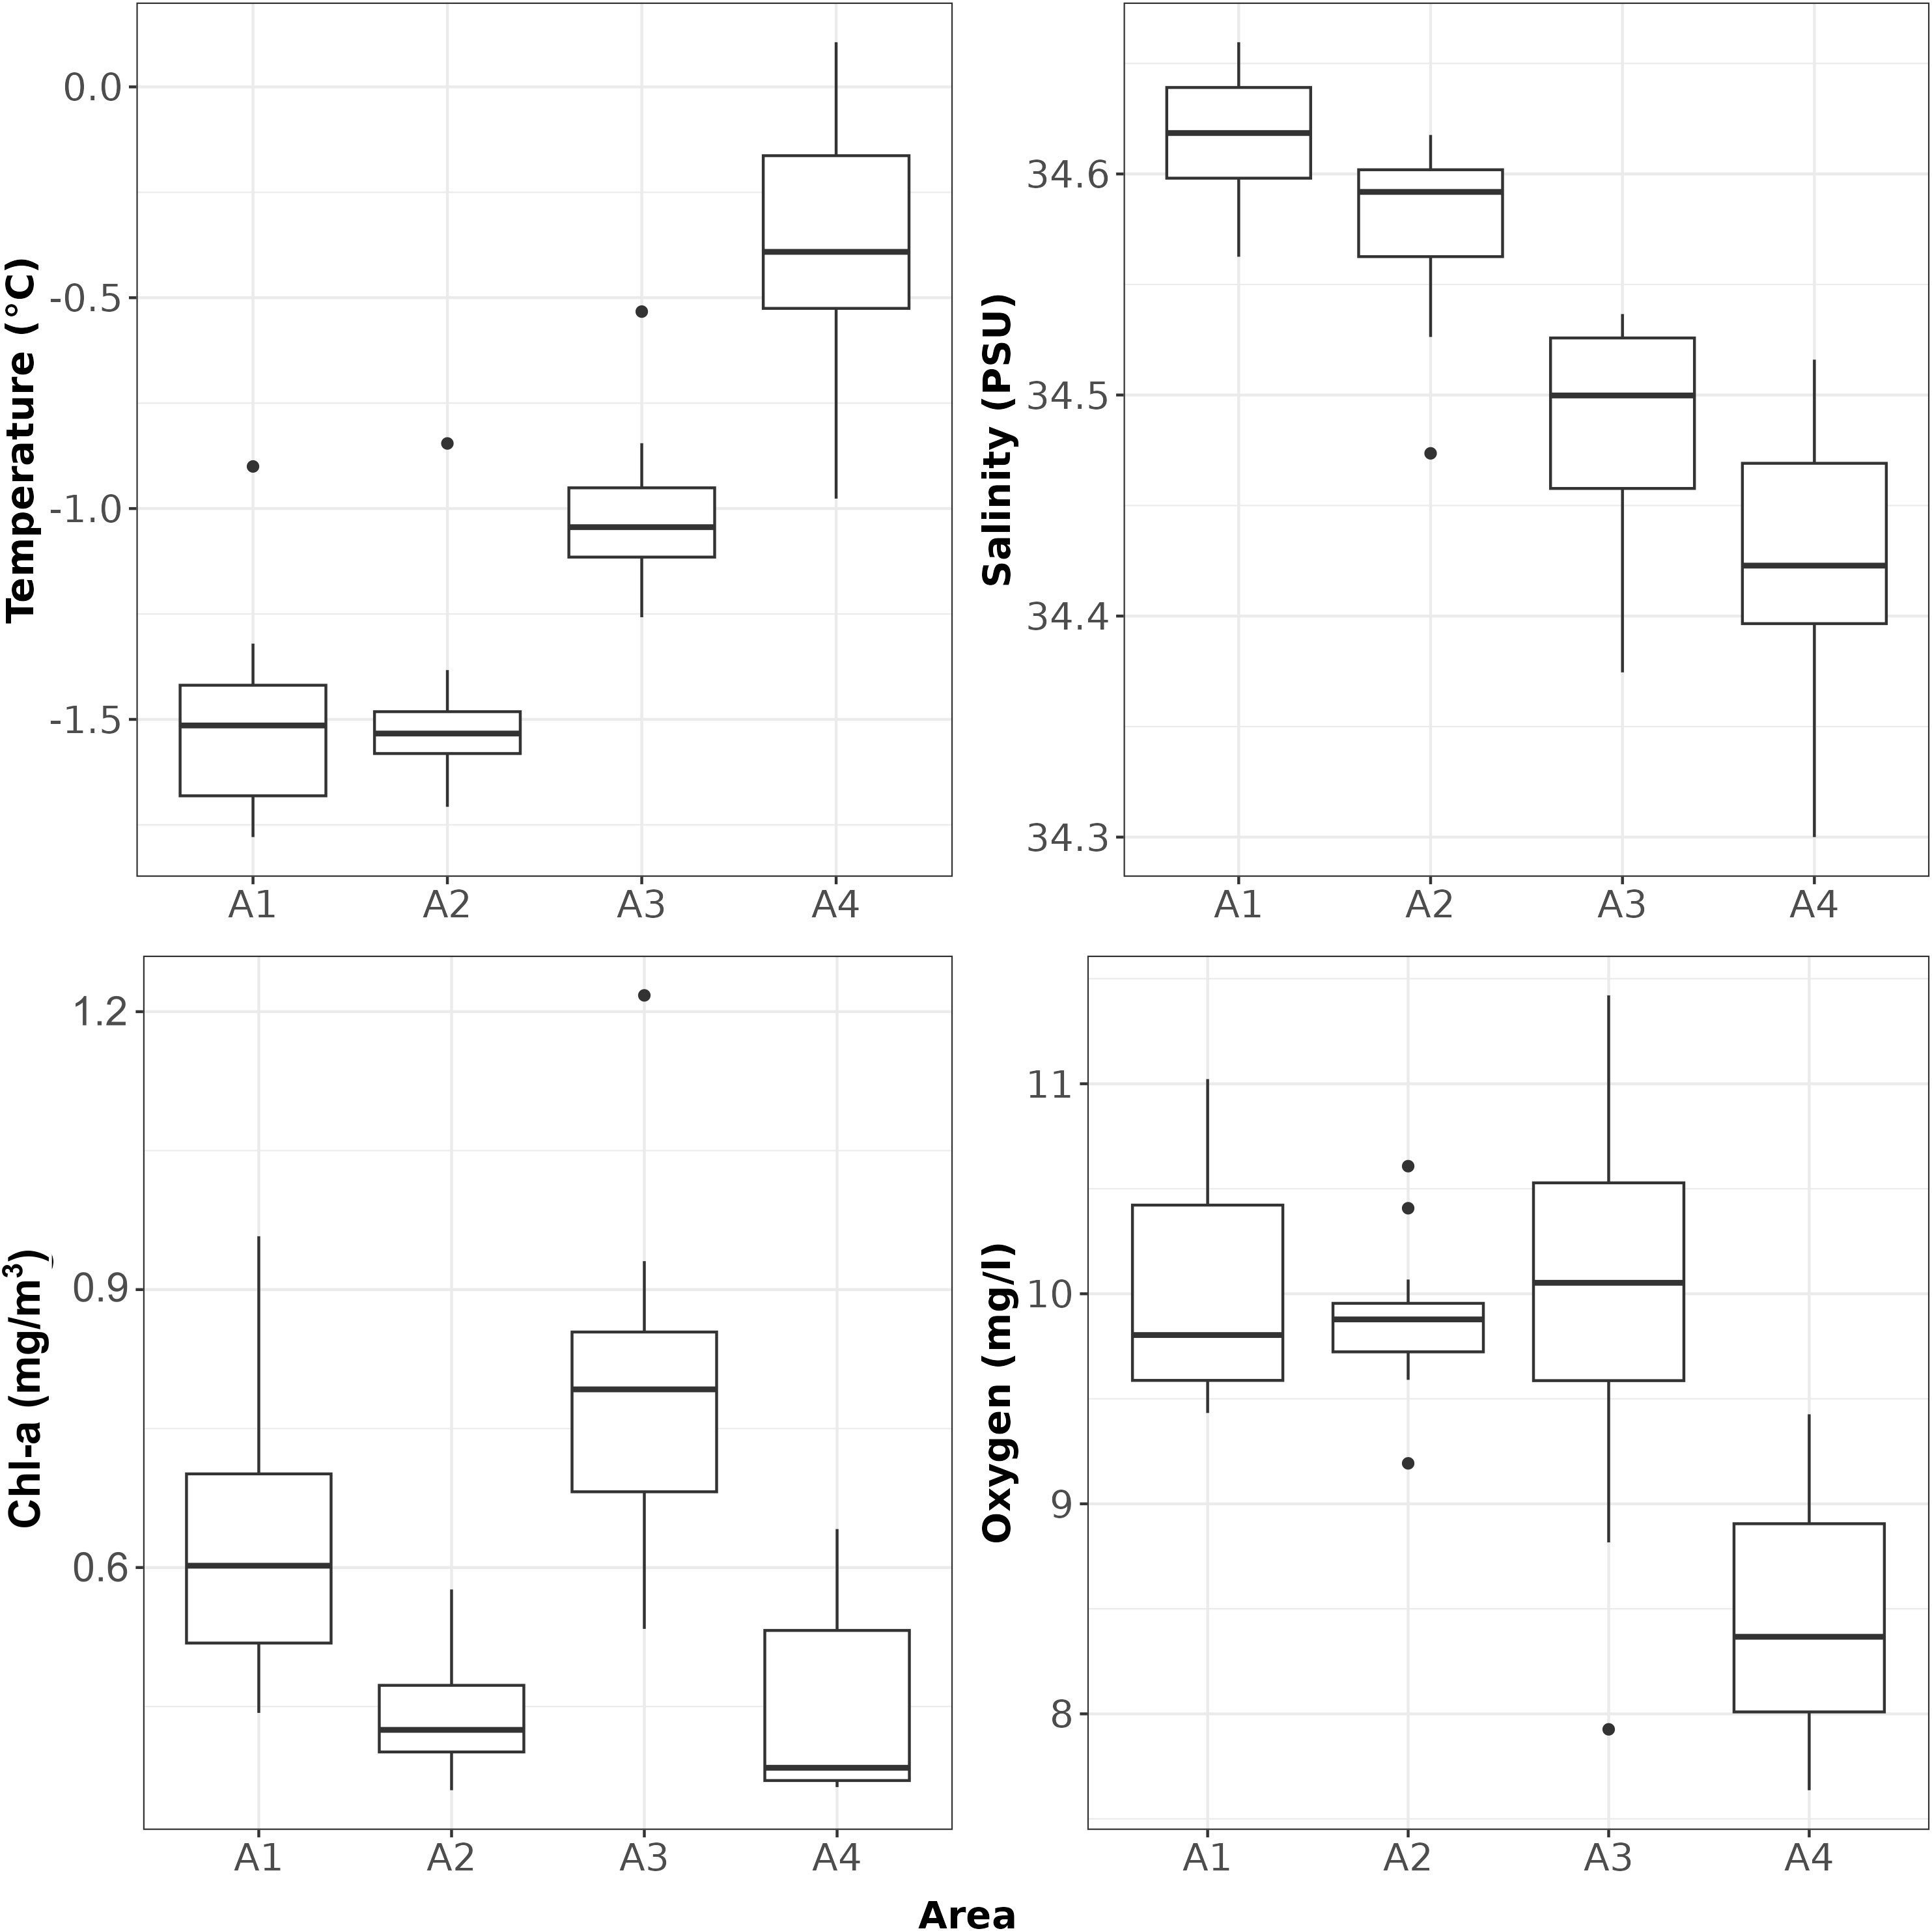
Figure 3 Boxplot of CTD derived temperature, salinity, Chl-a and oxygen.
Principal component analysis was also carried out to highlight structural patterns among variables, species density (i.e. species NASC included in the analysis as quantitative supplementary variables) and identified areas (included in the analysis as a qualitative supplementary variable). Results from the PCA showed that the first and second PCA axes explained a large amount of variance (~82%), highlighting the presence of strong variables patterns (Figure 4A). In particular, obtained results (Figure 4A) evidenced a strong association on the first axis of depth, salinity and Chl-a (correlation values -0.88, 0.86 and 0.81, respectively) and relatively lower correlations with oxygen, temperature and SSL NASC (0.6, 0.57 and 0.51, respectively). On the second axis, the only significantly associated variables were temperature and oxygen (0.76 and -0.73 respectively) that were inversely related each other (Figure 4A). The area factor resulted also significantly associated to both the 1th and 2nd axes (Figure 4B), thus confirming the similarities between A1 and A2 areas that were in turn quite different from A3 and A4 areas.
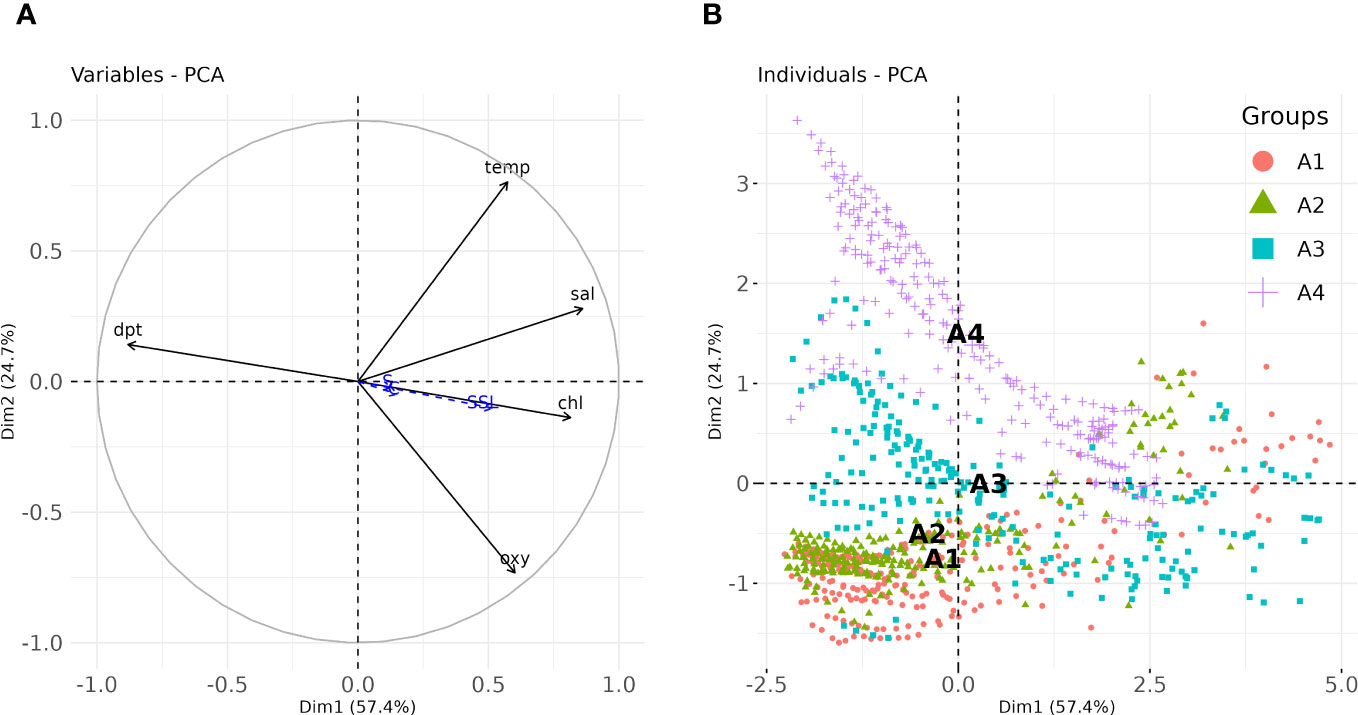
Figure 4 (A) Factor-Variables correlation plot and (B) Scatterplot of observations in the PC space. Area labels in panel (B) represent the centroid of each group. temp, Temperature (°C); sal, salinity (PSU); chl, Chl-a (mg/m3); dpt, depth (m); oxy, oxygen (mg/l).
Some echograms of the three acoustically-detected zooplankton groups at different frequencies in the four considered areas are shown in Supplementary Figures S1–S4.
For each CTD station, the presence of the three groups was assessed, evaluating also the co-occurrence of C and S (Figure 5). The group showing the lower presence among stations was S (with only 18 positive stations), followed by C (with 42 positive stations), while SSL was ubiquitous. C and S were found co-occurring in 11 stations (Figure 5, bottom-right panel).
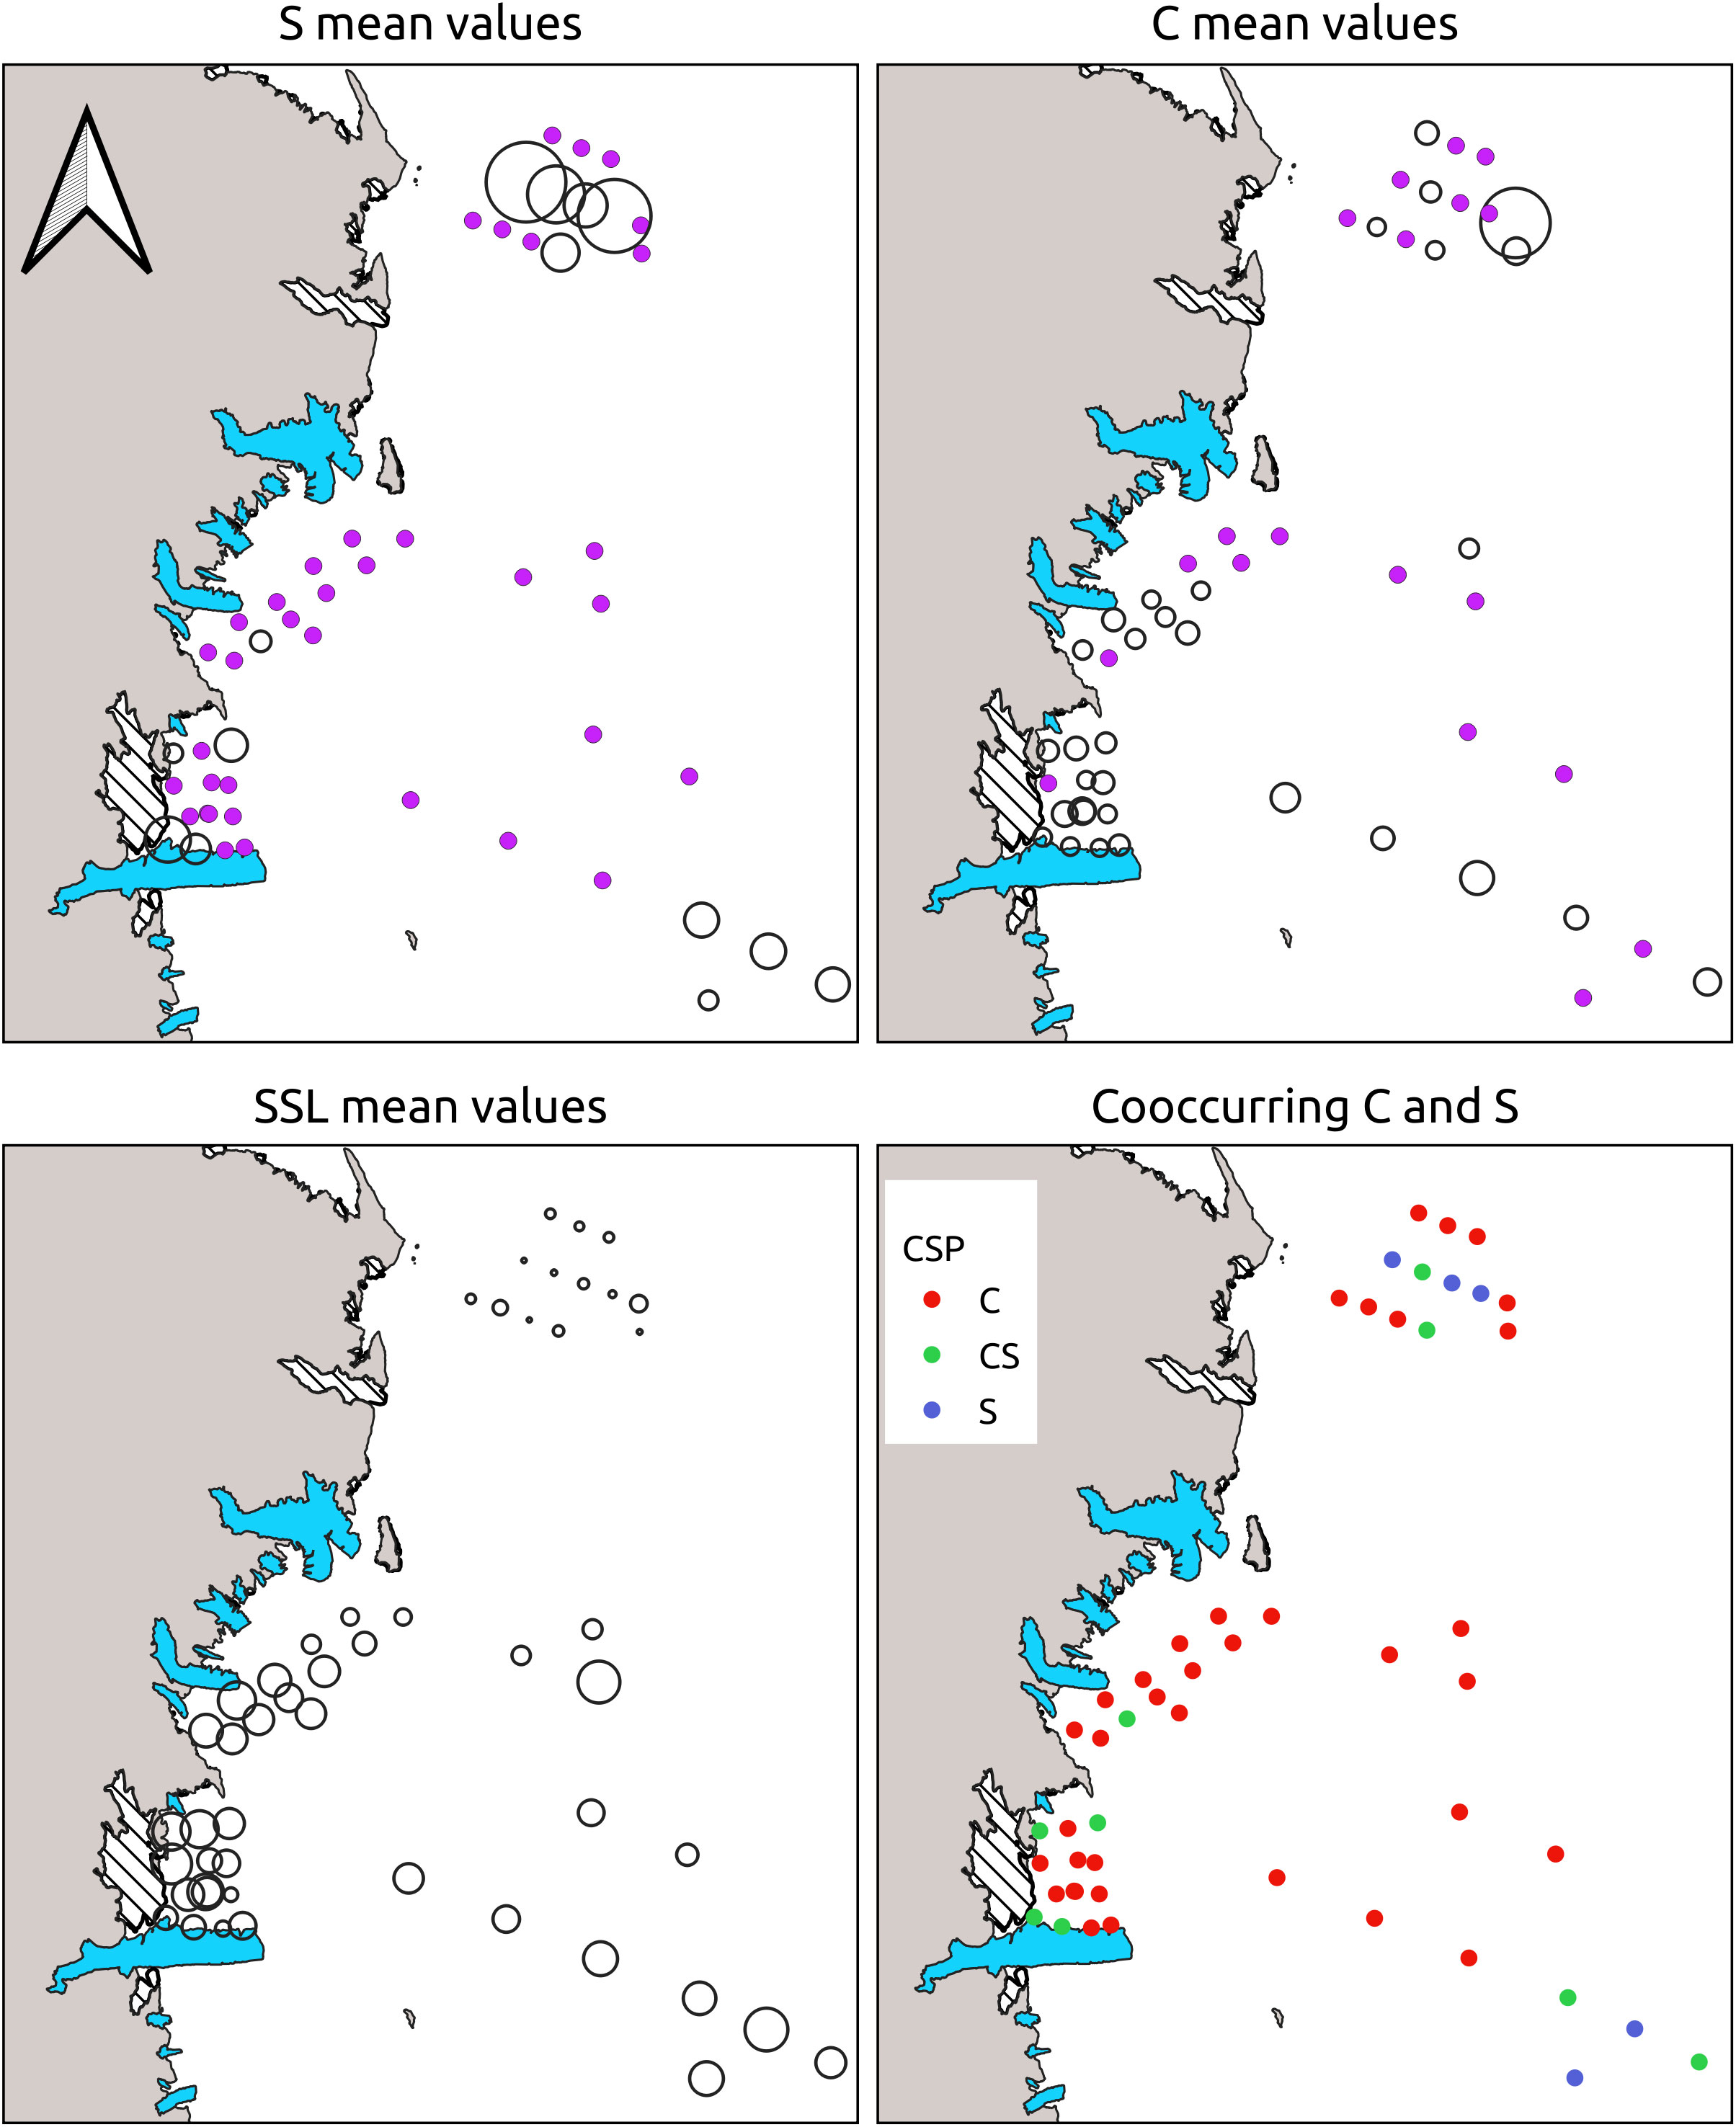
Figure 5 Proportional representation of station-averaged C, S and SSL NASC values. Points in purple represent group absence. The bottom right panel represent the station positive for S (blue points), for C (red points) or for both (green points - CS).
No significant difference was found among the four considered areas in terms of average NASC values for C and S, while significant differences (H(3) = 27.644, p-value < 0.05) were evidenced for SSL (Figure 6). In particular, according to the post-hoc test results, SSL NASC values were similar among the A1, A2 and A3 areas which resulted significantly different from the A4 one.
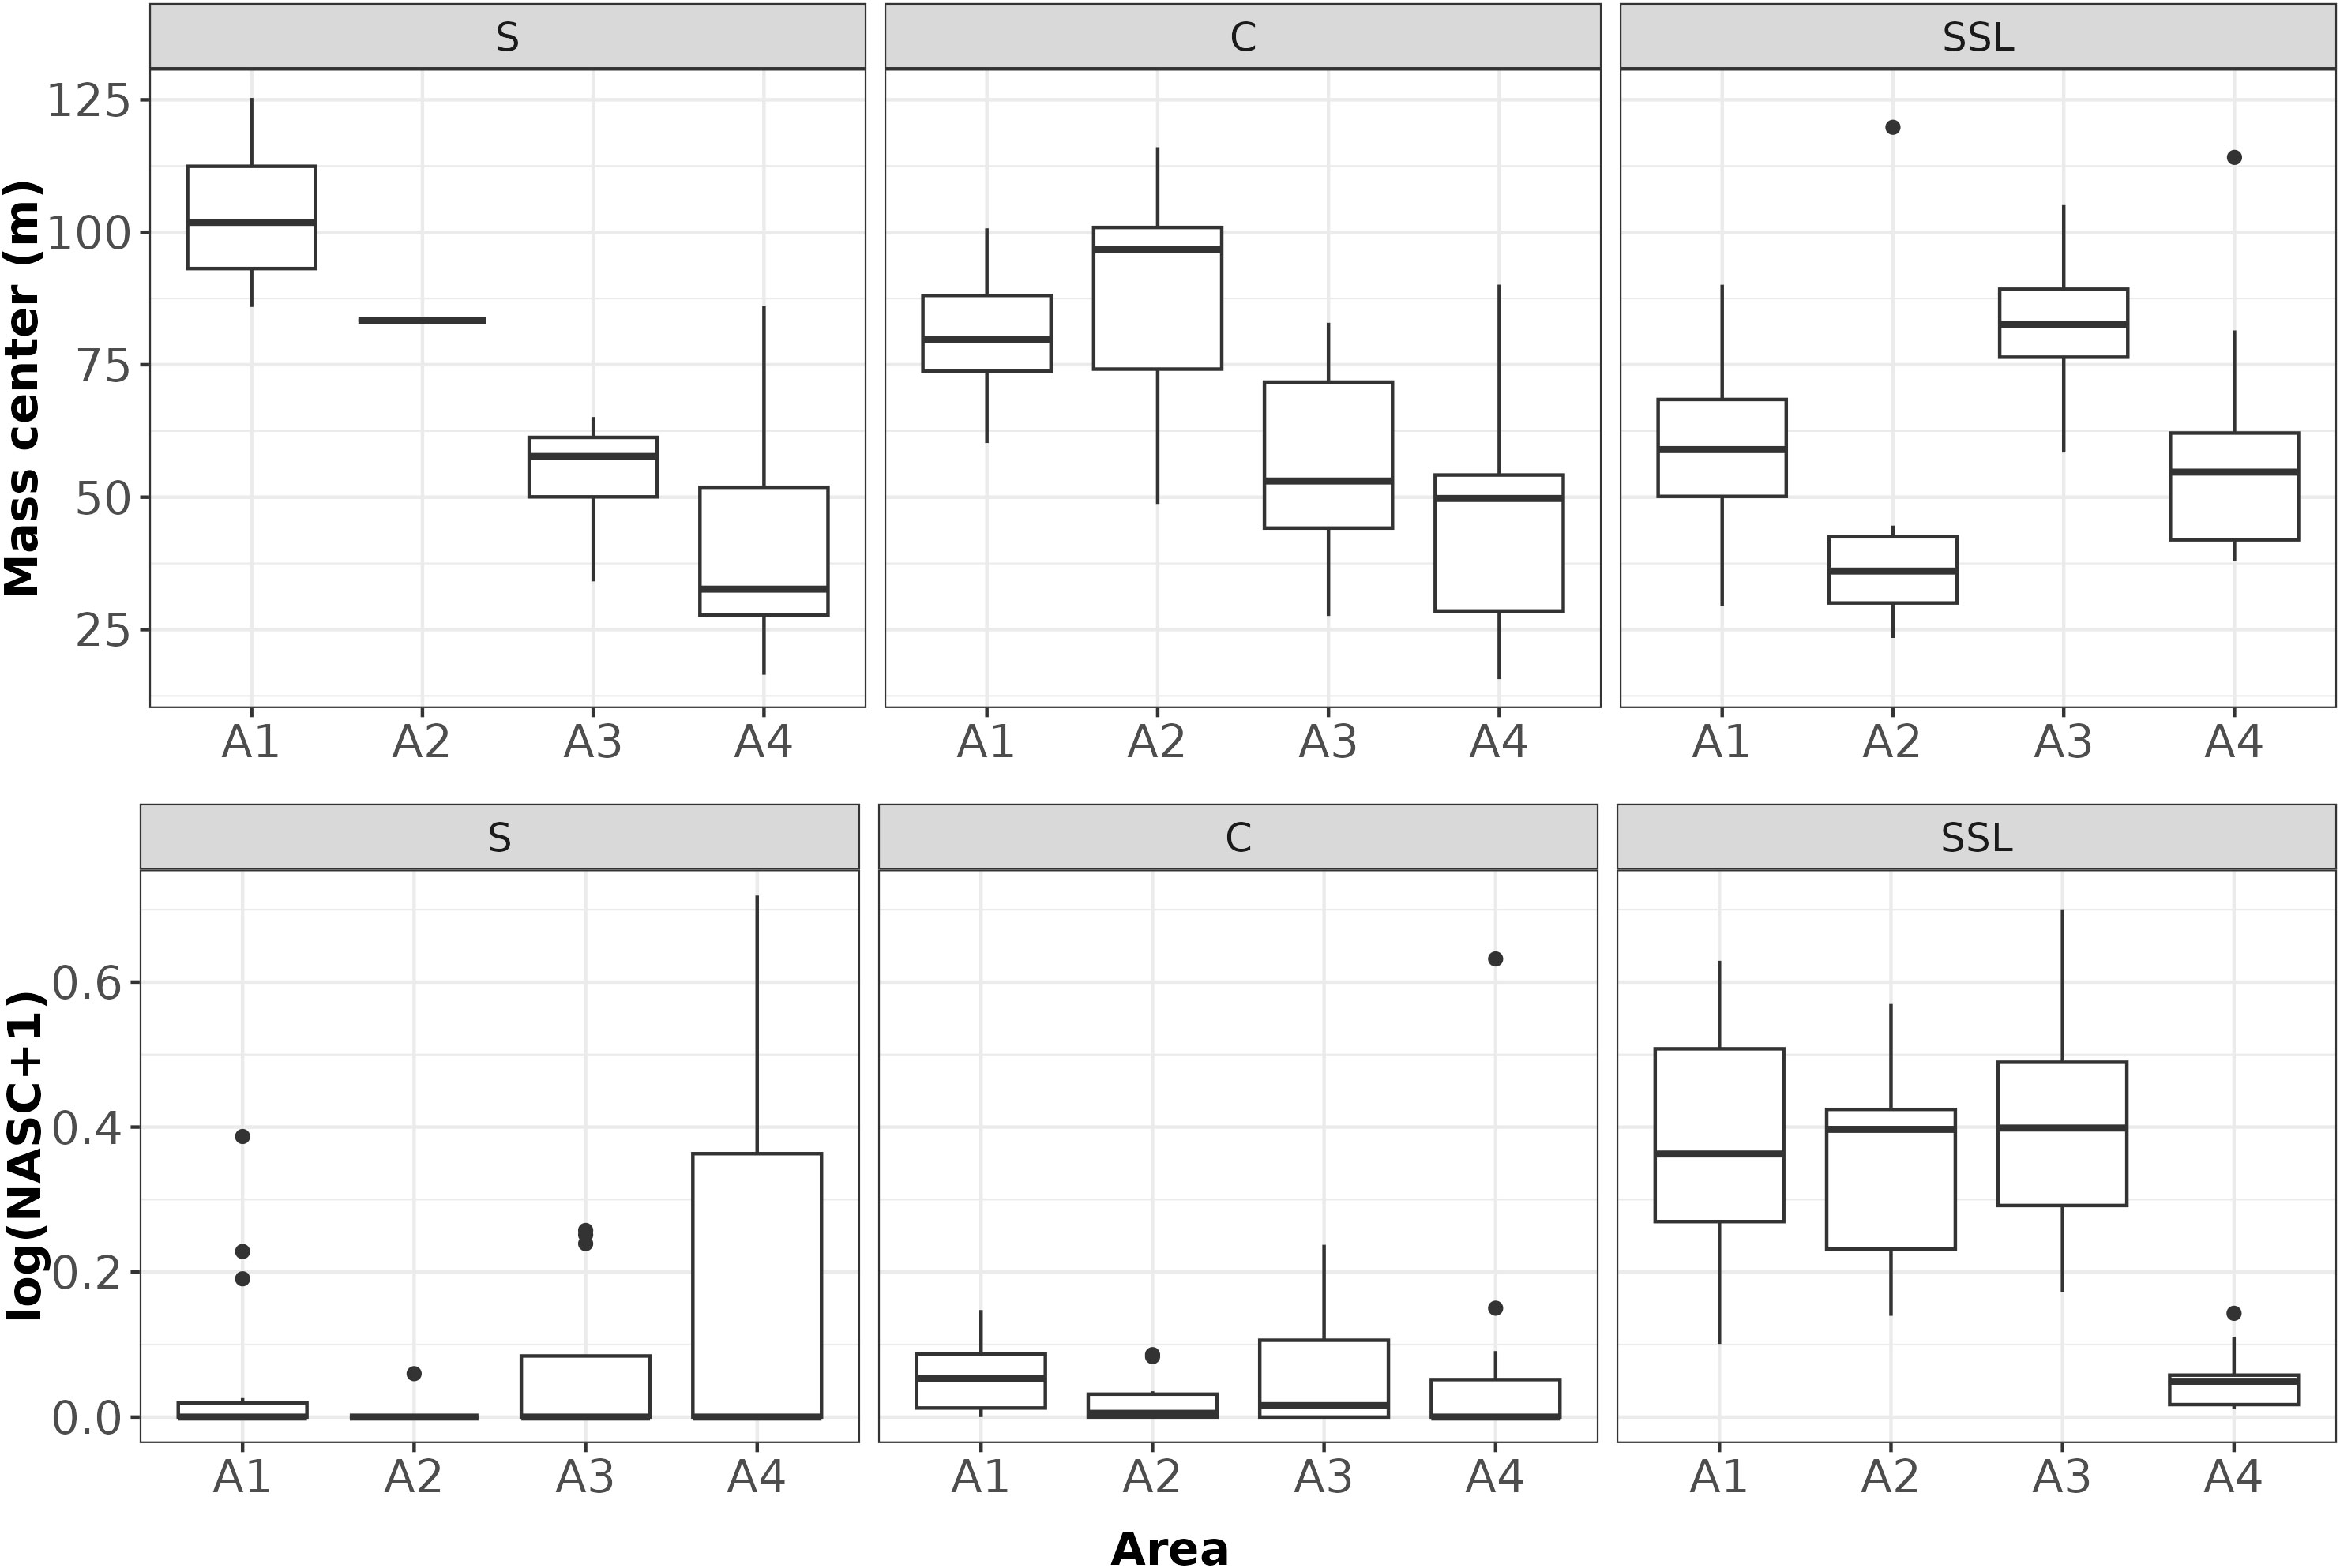
Figure 6 Boxplot of NASC and Mass center by acoustic groups (S: Euphausia superba; C: Euphausia crystallorophias; SSL: Sound Scattering Layers) and areas. Note that in the statistical test, the case “S” in the A2 area was not considered as only one positive station was present.
For each station, the vertical mass center (GC) of the three groups showed significant differences for S (H(3) = 7.4967, df = 2, p-value < 0.05) with deeper GC in the A1 than in A3 and A4 areas (the A2 area was excluded for this species as only one positive station was present).
In the C case, significant differences (H(3) = 11.819, df = 3, p-value <0.05) were found with a pairwise similarity between A1-A2 and A3-A4 areas (Figure 6). Finally, SSL GCs were also found significantly different among all areas (H(3) = 21.406, df = 3, p-value < 0.05), except for the comparison A1-A4.
The vertical distribution of SSL was found to be significantly related to the area factor, to the logarithm of C NASC, to the interaction between area factor and depth as well as to the interaction among area, Chl-a and temperature (Table 1). The obtained model explained about 63% of the total deviance (Table 1) and evidenced a different effect of depth among the considered areas (Figure 7). In A1 area, SSL NASC values decreased with depth from the surface till 50 m where they started to increase again up to ~110 m; below such depth, SSL NASC decreased again till 200 m. In A2 area, the SSL NASC values rapidly decreased to 0 from the surface till about 70 m, to increase again from about 120 m up to 200 m. In A3 area, the depth effect was bell shaped and centered around 100 m while in A4 area the depth effect monotonically decreased from the surface up to 75 m. In addition, for all areas SSL NASC almost linearly increased according to the (shifted) logarithm of C NASC values (Figure 7). Finally, the temperature - Chl-a interaction showed different behavior according to the area factor. In A1 and A2 areas, higher SSL NASC were linked mainly to higher temperature even if slightly lower values were estimated for lower Chl-a values. In A3 and A4 areas, the relationship among temperature, Chl-a and SSL NASC values was much more complex, evidencing different effects in relation to specific combination of Chl-a and temperature values (e.g. in A3 area higher SSL values were found related to higher Chl-a but the effect direction and magnitude was modulated by temperature values).

Table 1 SSL (Sound Scattering Layer) NASC model summary.
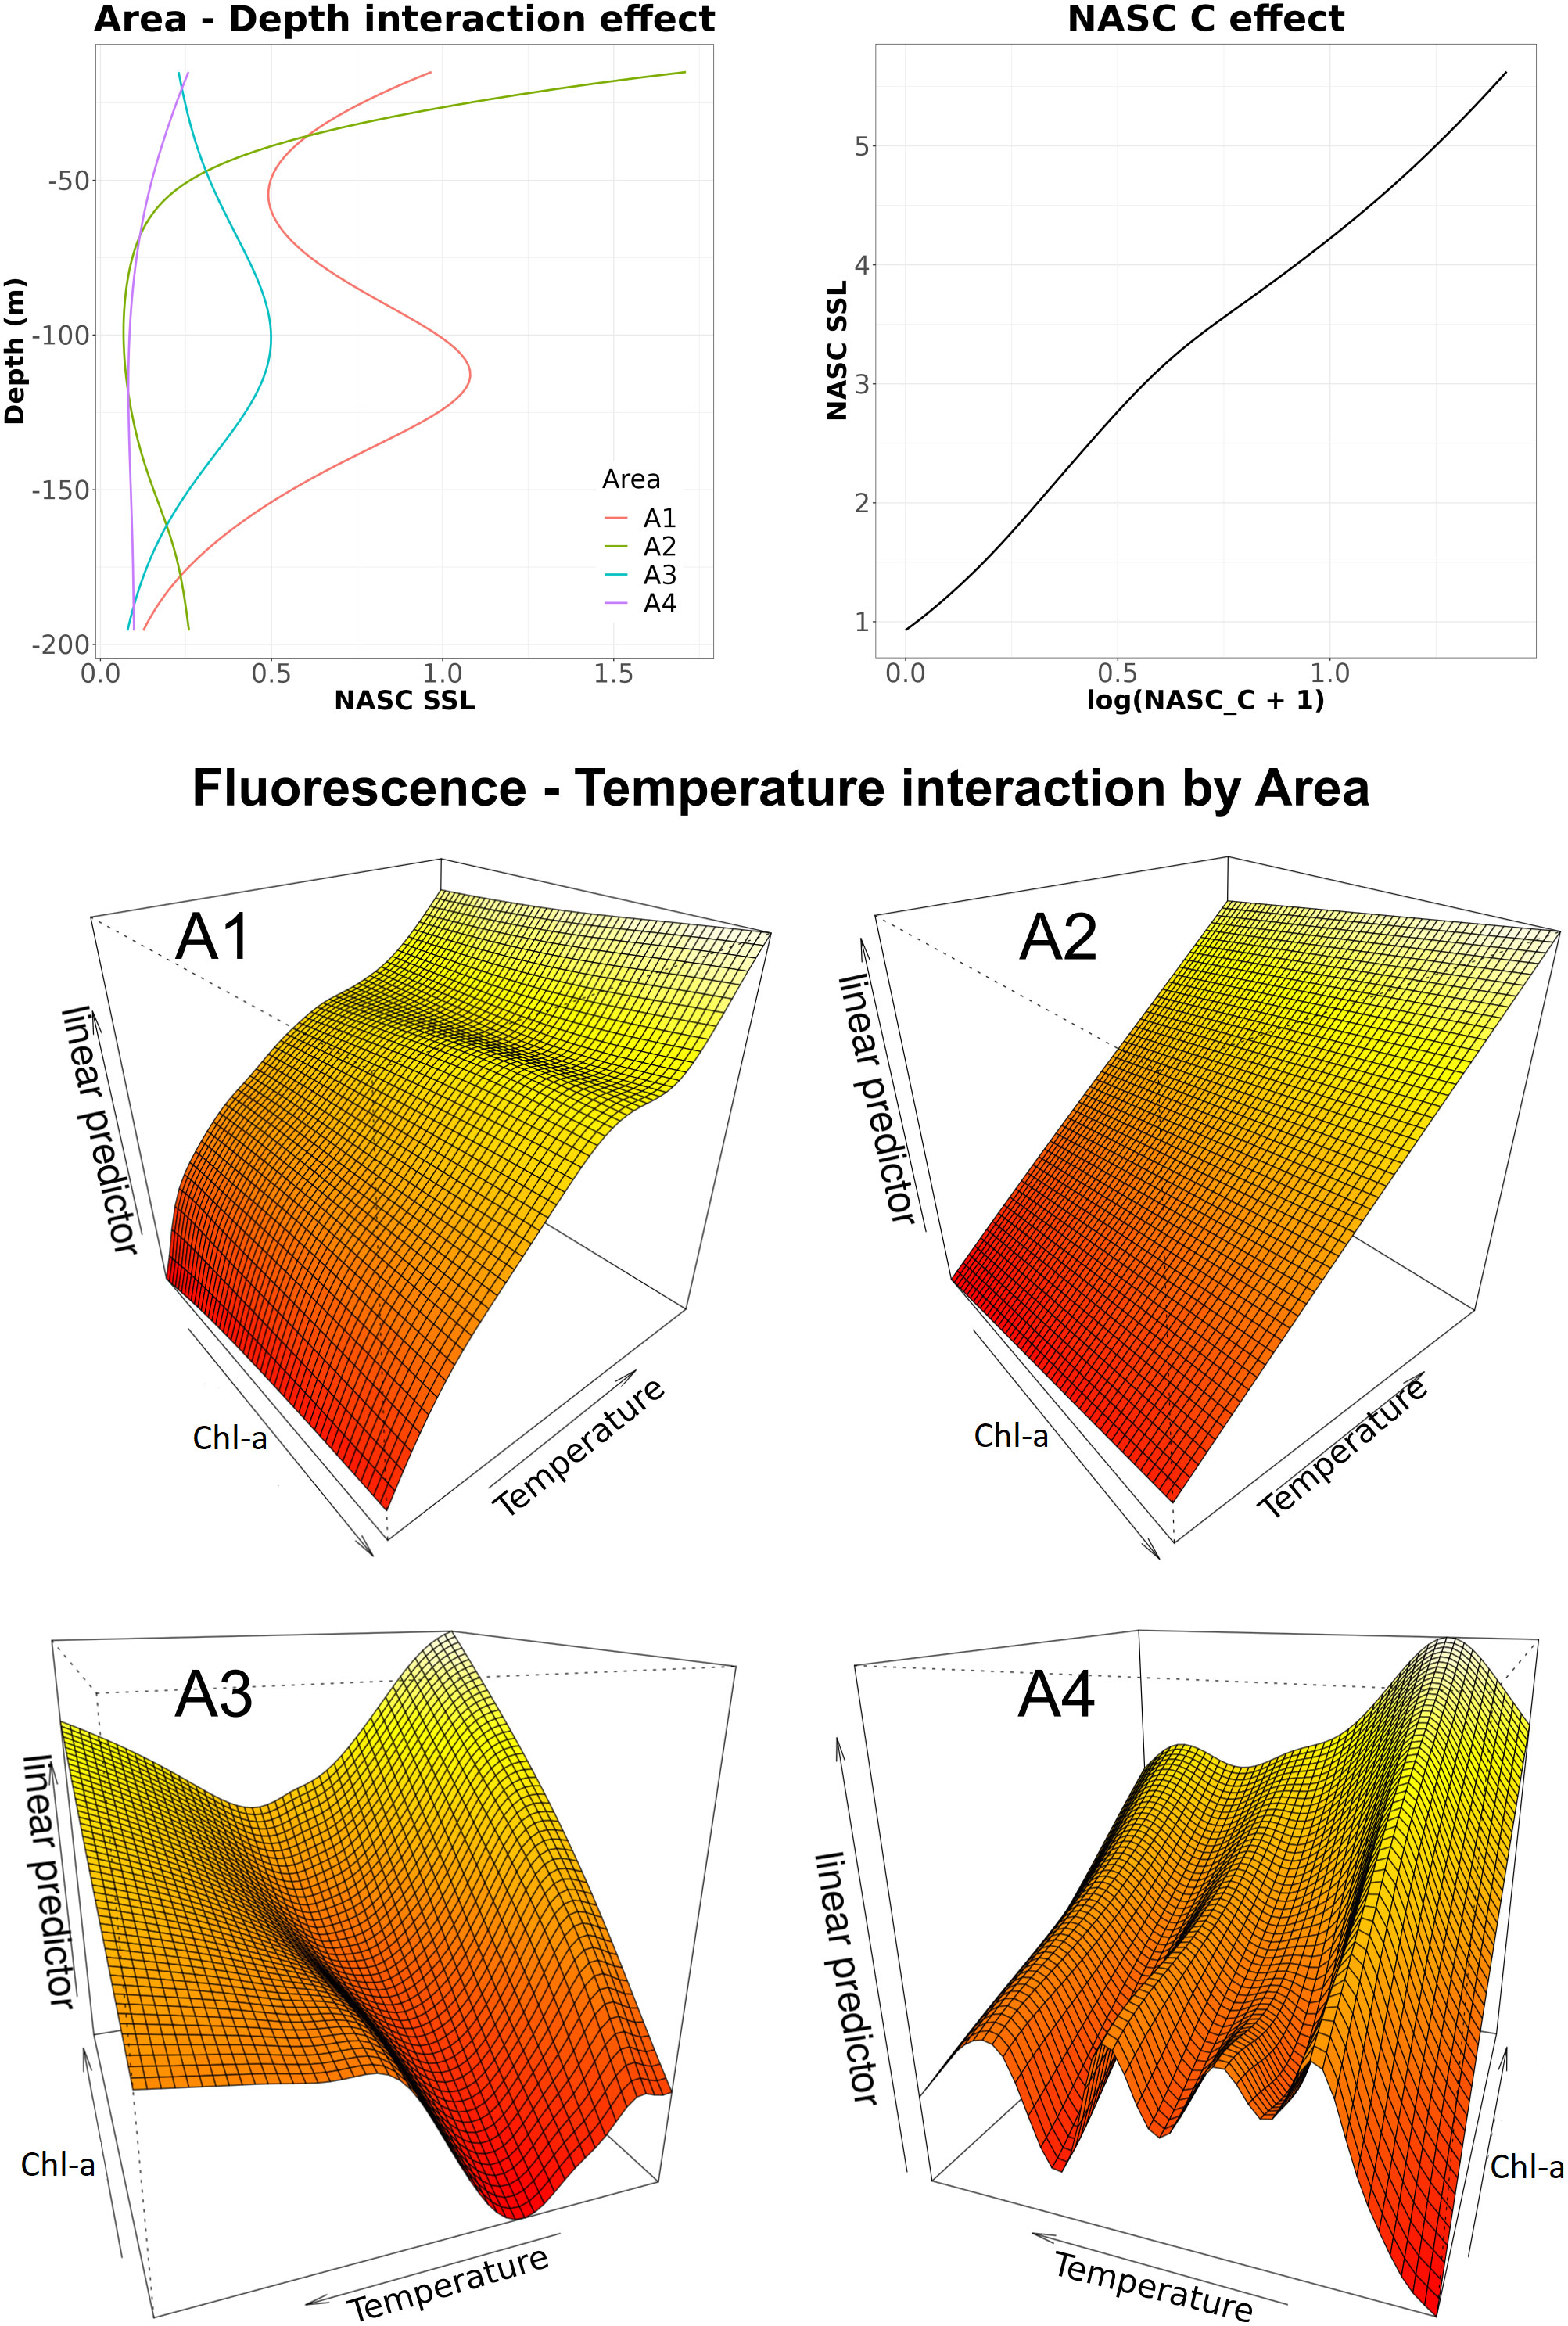
Figure 7 Effects of the significant terms in the SSL (Sound Scattering Layer) NASC model. The interaction between Chl-a and temperature as well as depth were evaluated by area factor.
In the case of C NASC, the binomial GAM approach explained about 50% of the total deviance and showed that the probability of C presence was significantly related to the area-depth interaction, the oxygen-salinity interaction and the SSL NASC (Table 2). In terms of depth, in A1 and A3 areas the effect was almost bell-shaped but with peaks occurring at different depths (Figure 8). In A2 and A4 areas the depth effect was characterized by a more complex shape with 2 peaks occurring at different depth. Furthermore, for all areas considered, the C probability of presence was positively influenced by the square root of SSL NASC. Specifically, the C probability of presence increased from 0 to 0.5 when transformed SSL NASC values were between 0 and 0.8, decreased from 0.5 to 0.2 for transformed SSL NASC values between 1 and 1.8, and increased again to 0.8 for transformed SSL NASC values greater than 1.8. Finally, the interaction between oxygen and salinity led to an increase in C probability of presence for higher salinity and increasing oxygen from low to mid-low values, followed by a decrease for oxygen values from mid-low to medium levels. Then, for medium to high oxygen levels, the C probability of presence showed an increase with increasing oxygen for high salinity values.

Table 2 Model summary for the probability of presence of C.
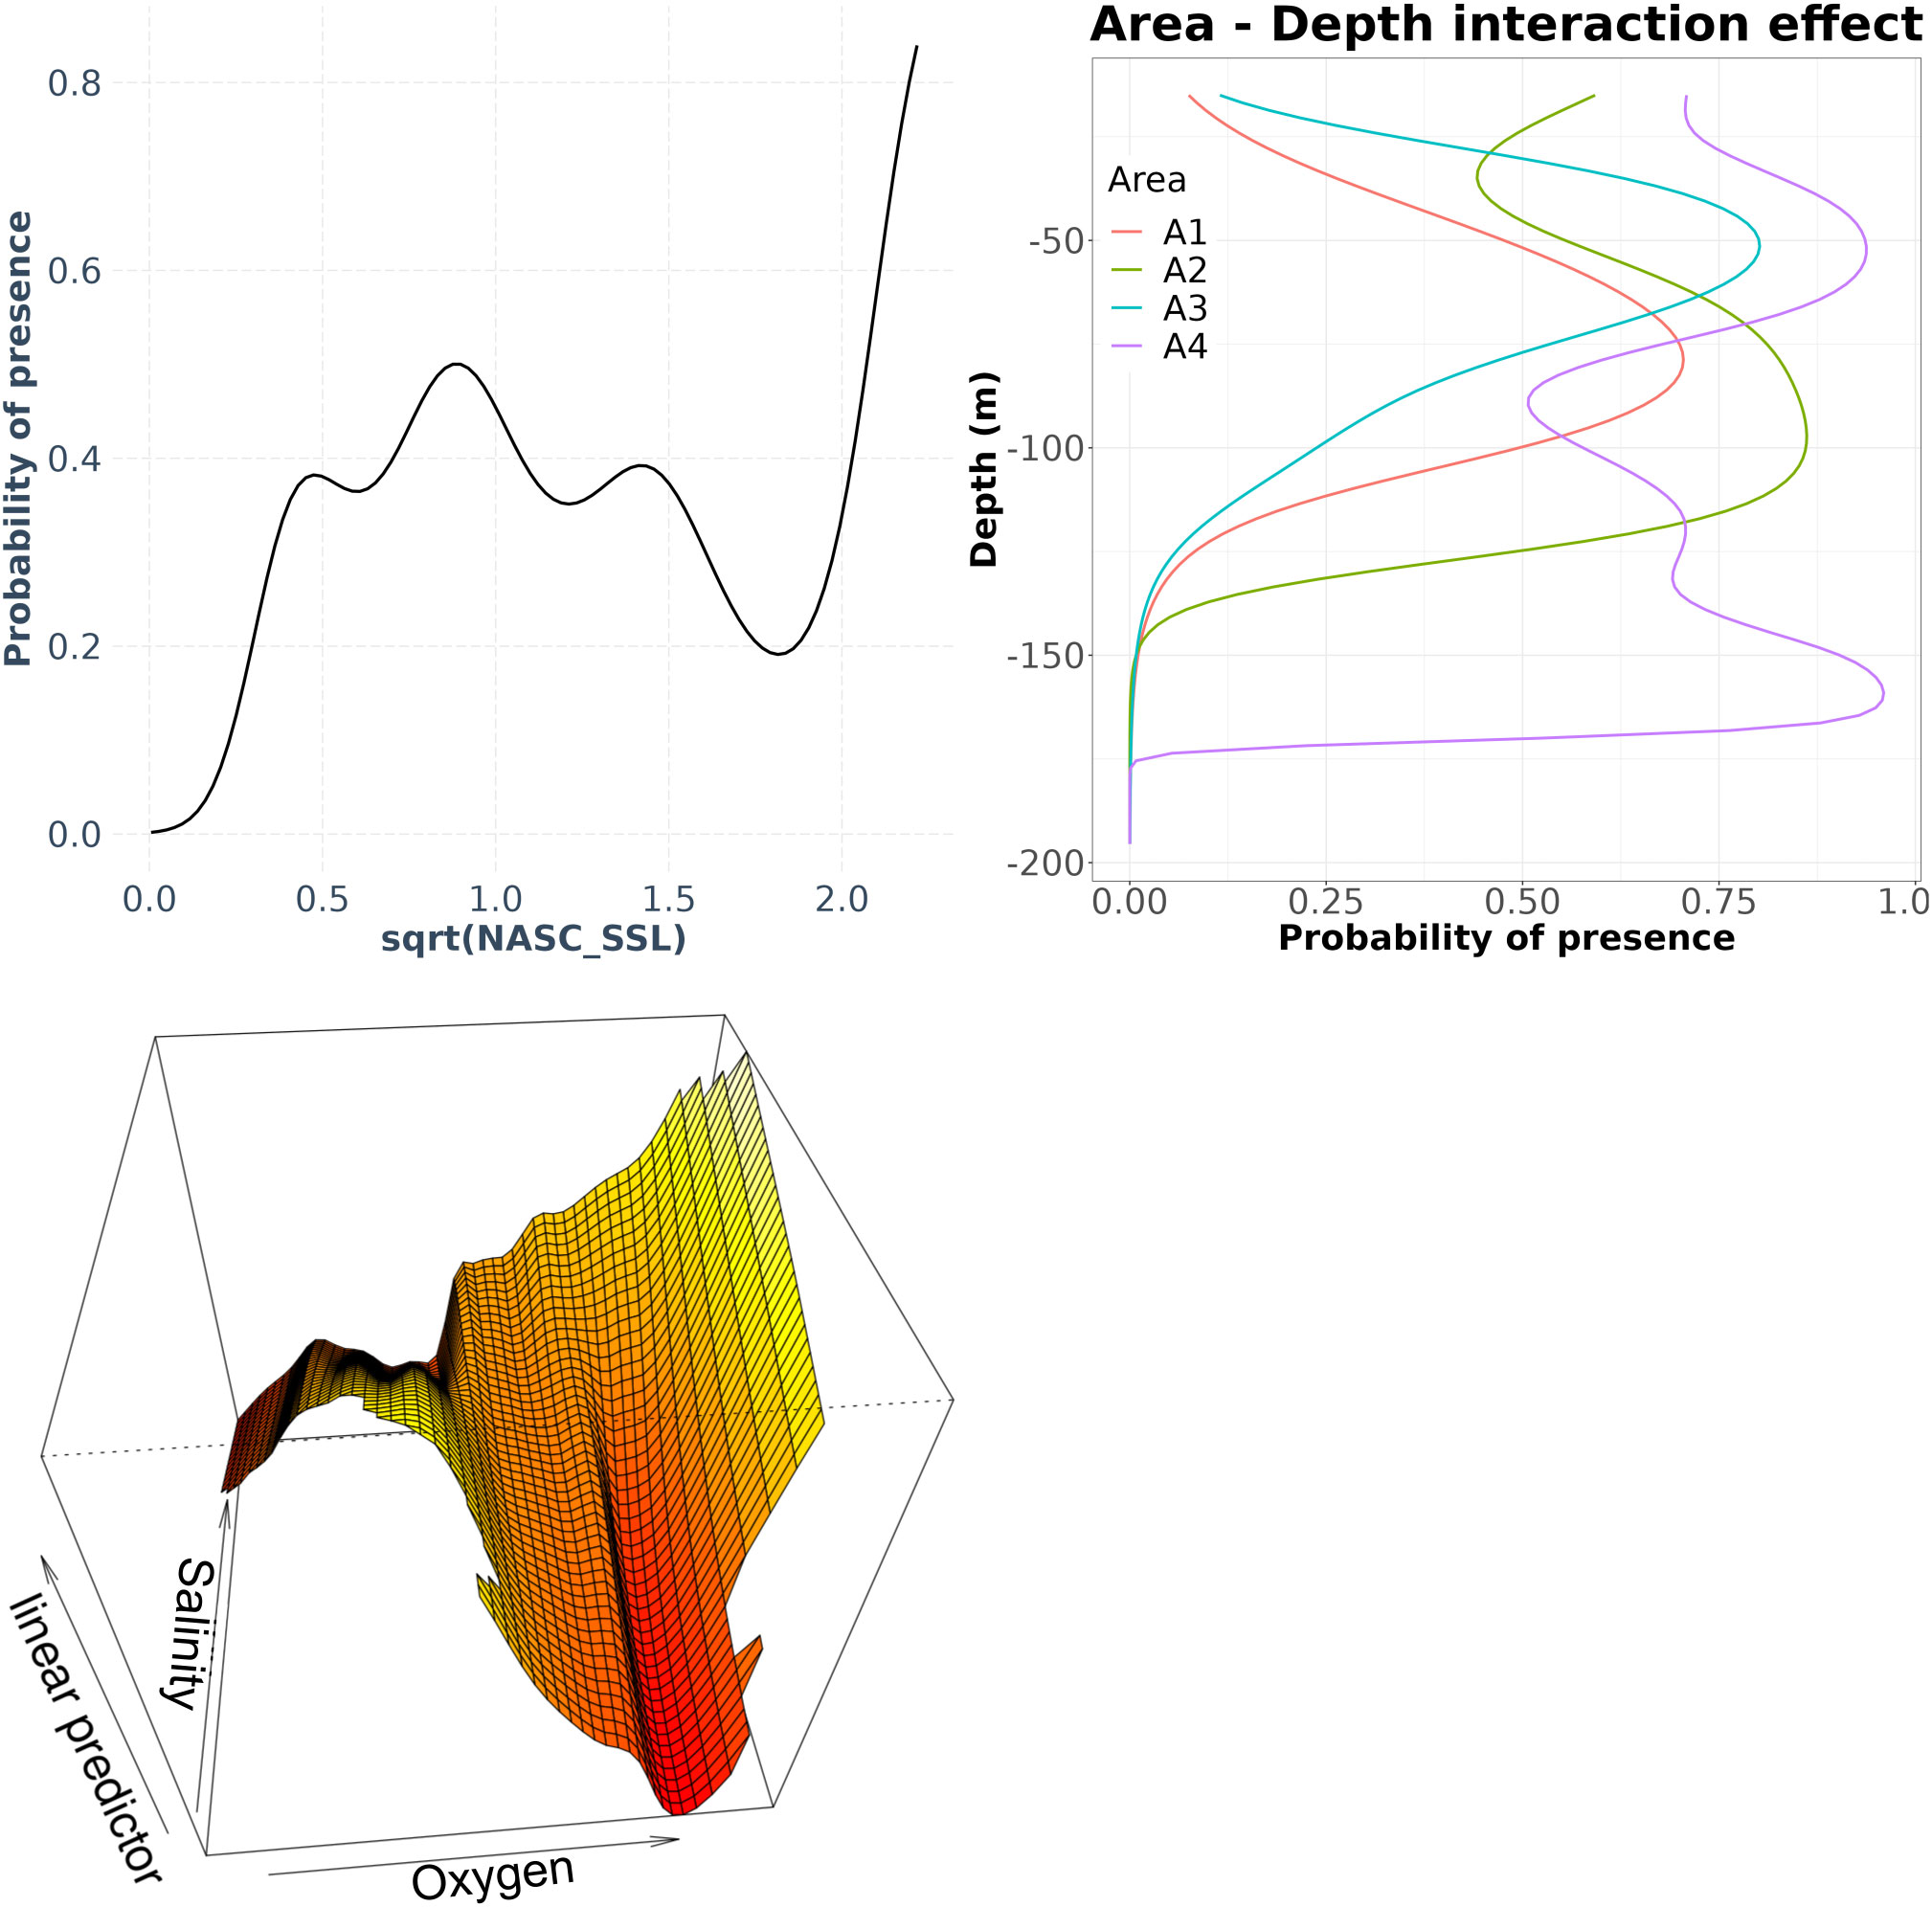
Figure 8 Effects of the significant terms in the Euphausia crystallorophias (C) presence/absence model. The depth was also evaluated by area factor.
The GAM model for S presence/absence explained ~44% of the total deviance, highlighting again different depth patterns in relation to the area factor (Table 3). In A3 and A4 areas, the probability of S presence decreased almost similarly from the surface to 200 m, with a change in slope at 120 m and a different behavior between the two areas at the surface. On the contrary, the depth effect in A1 area was bell-shaped, with the peak occurring at around 100 m depth (Figure 9). The interaction between Chl-a and oxygen was quite complex, showing a low probability of presence at low oxygen and Chl-a levels and the highest probability at higher Chl-a and lower oxygen levels.
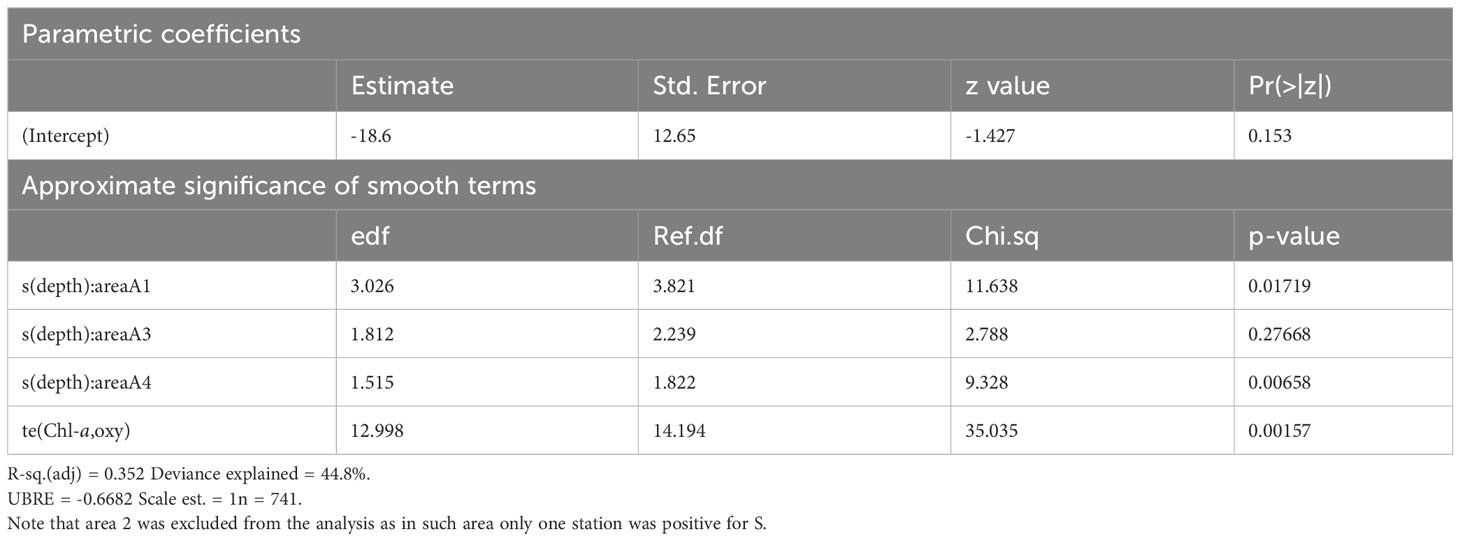
Table 3 Model summary for the probability of presence of S.
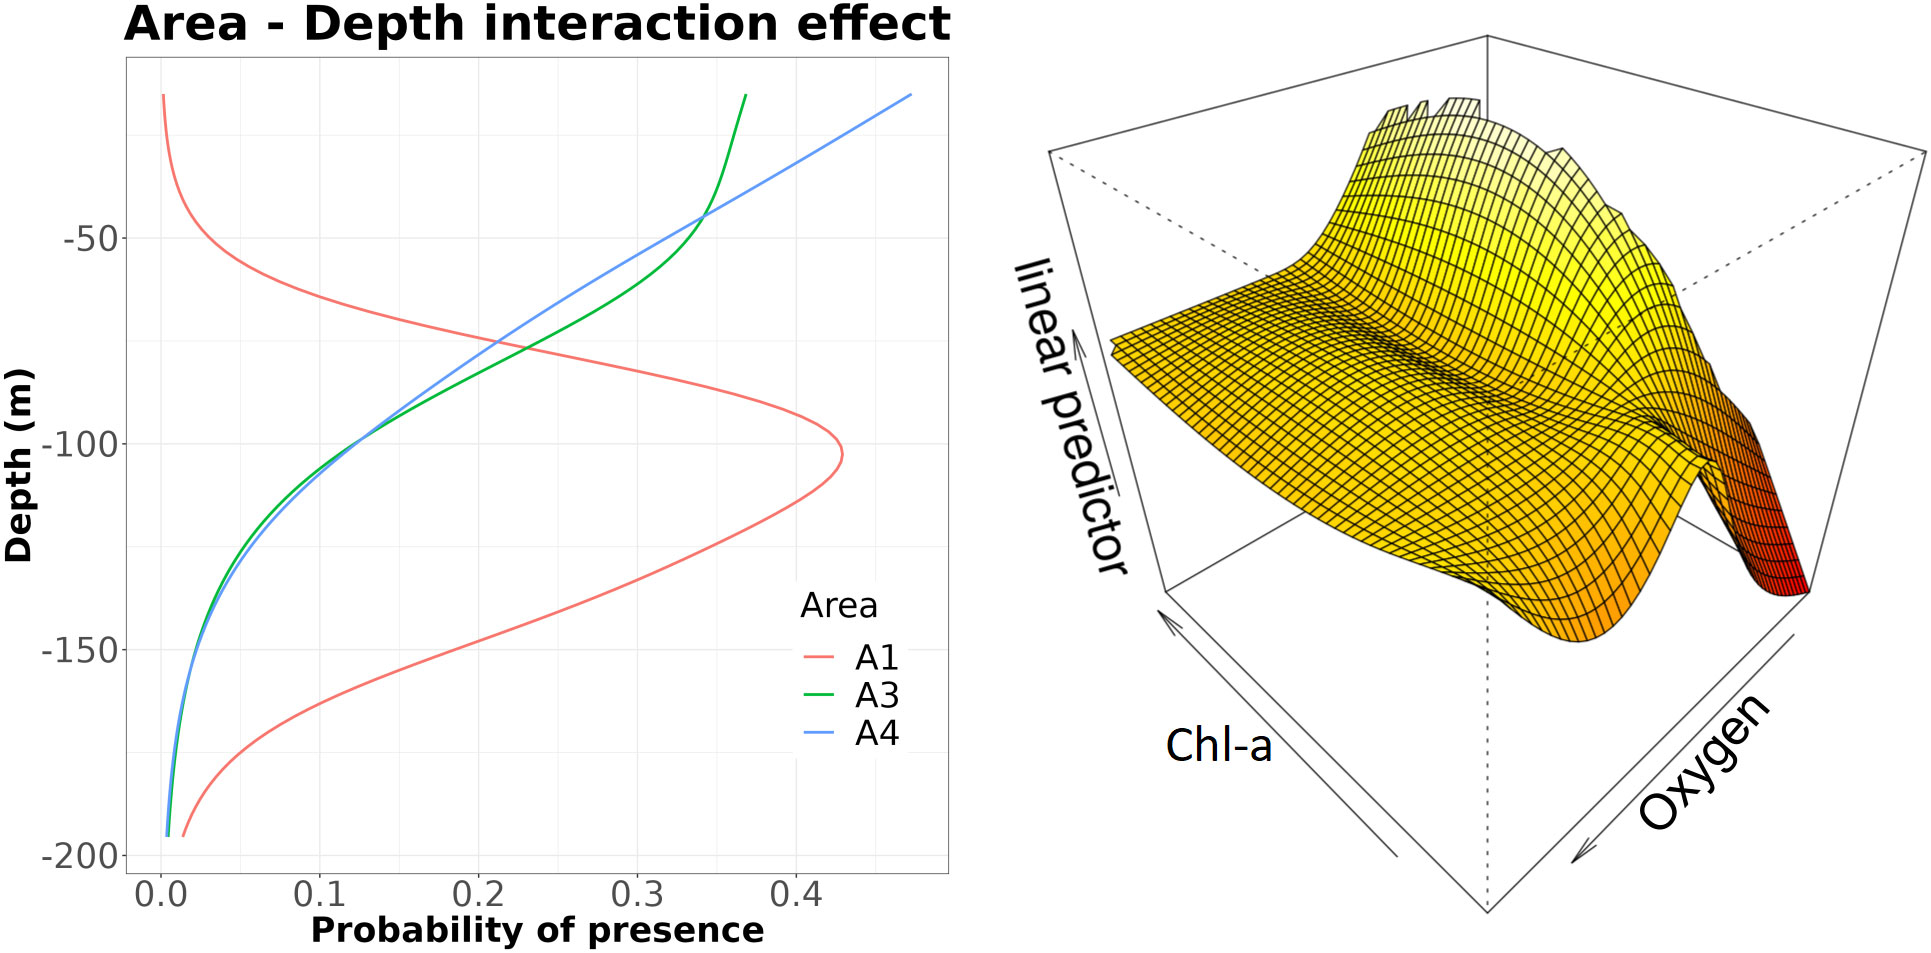
Figure 9 Effects of the significant terms in the Euphausia Superba (S) presence/absence model. Note that, as in A2 area only one station was positive for S, such area was excluded from the analysis.
In the present study, active acoustic techniques were used to characterize the vertical structure of E. crystallorophias, E. superba and SSL in four different areas of the Ross Sea. SSLs were found mostly ubiquitous while E. crystallorophias and E. superba showed a patchy distribution with the latter patchier than the former. Some differences and similarities among areas were also observed in terms of both environmental parameters and vertical distributions of the three acoustic groups. The A1 and A2 areas showed high degree of similarity for temperature, salinity and oxygen but not for Chl-a (Figure 2). For the two areas, the average vertical profiles of the three acoustic groups were also found similar (Supplementary Figures S6, S7), even if S was found in only one station in area A2, thus making it difficult a direct comparison for this species. The A3 and A4 areas were found different from each other and from the A1 and A2 areas both in terms of hydrological vertical profiles and acoustic vertical profiles of S, C and SSL (Supplementary Figures S6, S7). Such results, likely due to difference among areas in terms of phytoplankton and zooplankton communities, confirm the complexity of the marine ecosystem structure in the Ross Sea (Faranda et al., 2000). The western Ross Sea is known to represent a mosaic of functionally different marine subsystems, characterized by different levels of primary production (Saggiomo et al., 2002; Ducklow et al., 2006; Arrigo et al., 2008; Mangoni et al., 2018), with the most productive area to the west of the 175th meridian. Furthermore, the west coast of the Ross Sea is characterized by two blooms based on different spatial and temporal scales (Di Tullio and Smith, 1996; Arrigo et al., 1999; Innamorati et al., 2000; Smith and Asper, 2001; Arrigo et al., 2008). In this area, the phytoplankton community shows a well-defined biogeographic distribution (Nuccio et al., 2000; Saggiomo et al., 2000) with blooms of haptophytes (Phaeocystis antarctica) dominating the larger Ross Sea polynya during spring and early summer, and diatoms (most frequently Fragirariopsis curta, F. cylindricus, Nitzschia and Chaetoceros spp.) in the open waters and the marginal ice zones of the western Ross Sea during summer (Di Tullio and Smith, 1996; Arrigo et al., 1999; Sweeney et al., 2000; Mangoni et al., 2004; Sedwick et al., 2011; Smith et al., 2014; Misic et al., 2017). Less rich zones are mainly dominated by dinoflagellates and other flagellates (Smith et al., 2014; Mangoni et al., 2017; Phan-Tan et al., 2018). Bolinesi et al. (2020), working on data collected in the same expedition of the P-Rose Project (austral summer 2016/2017), reported higher phytoplankton biomass values (in terms of chlorophyll-a concentrations) in Terra Nova Bay (Area A1), compared to the values in A2 area. Moreover, in the south-central Ross Sea (Area A3) the phytoplankton community exhibited high variability both in terms of biomass and structure, associated to a latitudinal effect. The A4 area sub-system was different from the other areas showing a completely different arrangement of chemicals and biological variables (Bolinesi et al., 2020).
Zooplankton is the most important factor in regulating food web dynamics and ecological interactions in the Ross Sea (Hopkins, 1987; Saino and Guglielmo, 2000; Ainley et al., 2010; Ainley et al., 2015; Minutoli et al., 2017; Smith et al., 2017; Kiko et al., 2020) with gelatinous zooplankton, comprising jellyfish, ctenophores and chordate tunicates (Pagès, 1997), showing a ubiquitous behavior (Richardson et al., 2009; Schaub et al., 2018; Verhaegen et al., 2021). Nonetheless, zooplankton abundance varies greatly over the continental shelf and its assemblages, beyond copepods, are mainly composed by fish larvae, euphausiids, hyperiid and gammarid amphipods, pteropods, chaetognaths, and ostracods (Guglielmo et al., 1990; Guglielmo et al., 1992; Hecq et al., 1992; Hunt et al., 2008; Stevens et al., 2015; Smith et al., 2017; Granata et al., 2022; Kim et al., 2022). In the coastal area (corresponding to A1 and A2 areas) copepods are the dominant group (Carli et al., 1990; Zunini Sertorio et al., 1990; Carli et al., 1992; Hecq et al., 1992; Zunini Sertorio et al., 1992; Carli et al., 2000; Zunini Sertorio et al., 2000; Pane et al., 2004; Guglielmo et al., 2015; Smith et al., 2017; Bonello et al., 2020; Grillo et al., 2022; Kim et al., 2022), representing in austral summer more than 70% of the total community, while the remaining species are pelagic amphipods (Minutoli et al., 2023), Limacina helicina antarctica (Accornero et al., 2003; Manno et al., 2010), postlarval and juvenile stages of Pleuragramma antarcticum (Guglielmo et al., 1997; Granata et al., 2000; Granata et al., 2002; Granata et al., 2009), and calyptopis and furcilia stages of Euphausia crystallorophias (Guglielmo et al., 2009).
In the offshore waters between 170° and 175°E (corresponding to A3 area) and in the southern part of Terra Nova Bay, juvenile Pleuragramma antarcticum show higher abundance with respect to postlarvae (Guglielmo et al., 1998; Granata et al., 2000; Granata et al., 2002; Granata et al., 2009) which showed higher abundances in Terra Nova Bay (Area A1).
In the norther part of the Ross Sea (area A4 in this study), high abundance of copepods was found during the 1989-90 summer season, particularly in the upper 100 m with dominant species represented by adults of Calanoides acutus, Calanus propinquus, Metridia gerlachei and Rhincalanus nasutus (Zunini Sertorio et al., 2000). On the contrary, L. helicina antarctica and P. antarcticum larvae showed relatively low abundance (Kim et al., 2022), compared to coastal areas such as Terra Nova Bay (Area A1).
In all considered areas, SSLs showed similar average NASC values except in A4 area characterized by lower values (Figure 6). SSLs are commonly observed in all oceans, spanning different spatial and temporal scales likely due to the species composition that, although almost unknown, appears mainly composed of mesozooplankton, macrozooplankton, micronekton organisms, fish larvae and juveniles (Blanluet et al., 2019; Geoffroy et al., 2019). SSL backscatter values also show temporal and spatial variation as well as seasonal changes in species composition. For instance, in the Barents Sea, Geoffroy et al. (2019) observed a latitudinal decrease (south to north) in SSL Sv (Volume backscattering strength) that was consistent with previous studies (Siegelman-Charbit and Planque, 2016; Knutsen et al., 2017). However, the latitudinal trend found by the authors evidenced changes with seasons (being present in January but not in August), thus highlighting a complex interaction between spatial and temporal variations. Also in our case, while the southern areas were characterized by similar SSL NASC values, the northern one showed lower NASC values, letting us to hypothesize that SSL latitudinal gradients also exists in the Ross Sea. Despite the similar densities among A1, A2 and A3 areas, the vertical SSL structure showed different relationships with environmental conditions. In A1 and A2 areas, the vertical profiles of SSL were quite similar, but in A1 area a small increase in SSL NASC was observed between 75 and 100 m depth. The modelling approach highlighted the importance of depth in both areas as well as the influence of the interaction between temperature and Chl-a (Figure 7). As far as this latter aspect is concerned, most of the SSL NASC variation is linked to increasing temperature and modulated by Chl-a. Indeed, in A1 and A2 areas, even if the vertical SSL NASC profiles followed a decreasing trend in the upper layer, in A1 area SSL NASC values below 50 m depth were higher than in the A2 area (Figure 2), likely associated to higher Chl-a below such depth in A1 area. In A3 and A4 areas, the shape of interaction between Chl-a and temperature was much more complex, highlighting a different response of SSL assemblages to vertical environmental gradients and letting us to hypothesize a different species composition in SSL.
The presence/absence average vertical profiles for C (Supplementary Figure S7) also highlighted some similarities between the A1 and A2 areas, showing deeper maxima than in the A3 and A4 areas. In this case, the binomial GAM approach highlighted the importance of the interaction between salinity and oxygen as well as the effect of SSL NASC, included in the model as predictor (Figure 9). Overall, higher probability of presence of C was found for higher oxygen values but modulated by salinity. Such complex interaction, likely reflects the different oxygen and salinity levels found in the four areas. In addition, higher SSL NASC values were associated to higher probability of presence of C, likely indicating a trophic relationship between the two acoustic groups. In this context, gut content analyses of E. crystallorophias revealed phytoplankton, protozoans and metazoans as food items (Kattnerll and Hagen, 1998), even if more investigations indicate that such species may switch from algae to other food sources (Pakhomov et al., 1998; Ko et al., 2016). In addition, fatty acid and stable isotopic analyses suggested that E. crystallorophias apparently occupies a trophic niche different from E. superba (Ko et al., 2016; Yang et al., 2016; De Felice et al., 2022). This wide diversification in food sources could support the hypothesized trophic link between SSL and the presence of E. crystallorophias.
In the case of S, the modelling approach highlighted the importance of depth (similarly to SSL and C) and the effect of the interaction between Chl-a and oxygen; the latter evidencing highest probability of presence for relatively lower oxygen and higher Chl-a values. Also in this case the complex shape of the oxygen-Chl-a interaction surface likely reflects trophic effects as well as the different oxygen-Chl-a combination in the different areas. Euphausia superba is a key species in the Southern Ocean that serves as a link between primary production and higher trophic levels. Here, E. superba is essentially herbivorous, with a great contribution of nanoplankton (2–20 μm) particles in its diet, especially during the austral spring and autumn when phytoplankton blooms occur (Mangoni et al., 2019; Saggiomo et al., 2021). Differently from the E. crystallorophias, the lack of significant relationship between E. superba and SSL could be justified by the prevalence of phytoplankton in E. superba diet.
Despite the unavailability of biological samples, it is important to highlight the monitoring-related perspective of the methodology. Acoustic methods are relatively non-invasive and allow to cover large sectors in a quasi-synoptic way without impacting other survey-related activities (except for the needs to sample specific acoustic structure identified on ecograms along the route). Such methods permit to optimize biological sampling by sampling only specific acoustic targets (such features is particularly important for endangered species or ecosystems). In this context, the wide-band technology in conjunction with a multifrequency approach and pattern recognition algorithms (e.g. Aronica et al., 2019; Fontana et al., 2022; Giacalone et al., 2022) could also improve the reliability of acoustic estimates and reduce the sampling effort. Finally, from an operational point of view only 3 or 4 researchers/technicians are necessary to continuously acquire acoustic dataset during the survey, thus permitting the development of “opportunistic” monitoring programs with highly positive benefit–cost ratio. Considering the importance of mid-trophic levels organisms from the ecological point of view, as well as that the Southern Ocean plays an important role in carbon sequestration (DeVries, 2014) through still poorly understood mechanisms involving mid-tropic levels organisms (Tournier et al., 2021), it is important to increase the monitoring effort on yearly basis during multidisciplinary surveys, thus developing a time series of detailed information about the vertical structure and the daily vertical migration of the zooplankton community.
The raw data supporting the conclusions of this article will be made available by the authors, without undue reservation.
MB: Conceptualization, Data curation, Formal analysis, Investigation, Methodology, Software, Supervision, Writing – original draft, Writing – review & editing. LG: Conceptualization, Methodology, Supervision, Writing – original draft, Writing – review & editing. AB: Conceptualization, Data curation, Investigation, Supervision, Writing – original draft, Writing – review & editing. OM: Conceptualization, Data curation, Methodology, Supervision, Validation, Writing – original draft. PRi: Conceptualization, Data curation, Investigation, Methodology, Supervision, Writing – original draft. PRu: Conceptualization, Methodology, Supervision, Writing – original draft, Writing – review & editing. PF: Data curation, Investigation, Supervision, Writing – original draft, Writing – review & editing. GB: Conceptualization, Data curation, Methodology, Writing – original draft. IF: Data curation, Investigation, Methodology, Writing – original draft, Writing – review & editing. RF: Data curation, Methodology, Supervision, Writing – original draft, Writing – review & editing. GG: Conceptualization, Data curation, Methodology, Software, Writing – original draft. SA: Conceptualization, Data curation, Investigation, Software, Writing – original draft. RM: Conceptualization, Data curation, Methodology, Writing – original draft. FM: Data curation, Investigation, Writing – original draft. AG: Conceptualization, Data curation, Investigation, Methodology, Supervision, Writing – original draft, Writing – review & editing. SG: Conceptualization, Data curation, Methodology, Software, Supervision, Writing – original draft, Writing – review & editing.
The author(s) declare financial support was received for the research, authorship, and/or publication of this article. This study was funded by the Italian National Program for Antarctic Research, in the framework of the Projects P-ROSE (PNRA16_00239) and CELEBeR (PNRA16_00207).
The authors express their gratitude to Italian Antarctic National Program (PNRA) and the scientific personnel and crew of the research vessel Italica for logistical support.
The authors declare that the research was conducted in the absence of any commercial or financial relationships that could be construed as a potential conflict of interest.
The author(s) declared that they were an editorial board member of Frontiers, at the time of submission. This had no impact on the peer review process and the final decision.
All claims expressed in this article are solely those of the authors and do not necessarily represent those of their affiliated organizations, or those of the publisher, the editors and the reviewers. Any product that may be evaluated in this article, or claim that may be made by its manufacturer, is not guaranteed or endorsed by the publisher.
The Supplementary Material for this article can be found online at: https://www.frontiersin.org/articles/10.3389/fmars.2023.1304493/full#supplementary-material
Supplementary Figure 1 | Example of echograms acquired at 38 kHz (upper panel) and at 120 kHz (lower panel) in the A1 area.
Supplementary Figure 2 | Example of echograms acquired at 38 kHz (upper panel) and at 120 kHz (lower panel) in the A2 area.
Supplementary Figure 3 | Example of echograms acquired at 38 kHz (upper panel) and at 120 kHz (lower panel) in the A3 area.
Supplementary Figure 4 | Example of echograms acquired at 38 kHz (upper panel) and at 120 kHz (lower panel) in the A4 area.
Supplementary Figure 5 | Average vertical profiles by area and depth (thick red lines) and vertical profiles by station and area (thin lines) of temperature (°C), salinity (PSU), chlorophyll-a (mg/m3) and oxygen (mg/m3).
Supplementary Figure 6 | Comparison between the vertical profiles of temperature (°C), salinity (PSU), chlorophyll-a (mg/m3) and oxygen (mg/m3) and NASC C, S and SSL ones. All variables were scaled in order to allow a clear representation on a common x scale.
Supplementary Figure 7 | Model-predicted vs. observed average SSL NASC profiles and probability of presence of C and S by area. Note that in the case of S, area A2 was excluded from the analysis as only one station was found positive for such group.
Accornero A., Manno C., Esposito F., Gambi M. C. (2003). The vertical flux of particulate matter in the polynya of Terra Nova Bay: Part II. Biological components. Antarct. Sci. 15, 175–188. doi: 10.1017/S0954102003001214
Ainley D. G., Ballard G., Blight L. K., Ackley S., Emslie S. T., Lescroel A., et al. (2010). Impacts of cetaceans on the structure of Southern Ocean food webs. Mar. Mamm. Sci. 26 (2), 482–489. doi: 10.1111/j.1748-7692.2009.00337.x
Ainley D. G., Ballard G., Jones R. M., Jongsomjit D., Pierce S. D., Smith W. O. Jr, et al. (2015). Trophic cascades in the western Ross Sea, Antarctica: revisited. Mar. Ecol. -Prog. Ser. 534, 1–16. doi: 10.3354/meps11394
Aronica S., Fontana I., Giacalone G., Lo Bosco G., Rizzo R., Mazzola S., et al. (2019). Identifying small pelagic Mediterranean fish schools from acoustic and environmental data using optimized artificial neural networks. Ecol. Inform. 50, 149–161. doi: 10.1016/j.ecoinf.2018.12.007
Arrigo K. L., Robinson D. H., Worthen D. L., Dunbar R. B., Di Tullio G. R., VanWoert M., et al. (1999). Phytoplankton community structure and the drawdown of nutrients and CO2 in the southern ocean. Science 283 (5400), 365–367. doi: 10.1126/science.283.5400.365
Arrigo K. R., Van Dijken G. L., Bushinsky S. (2008). Primary production in the southern ocean 1997-2006. J. Geophys. Res. 113, C08004. doi: 10.1029/2007JC004551
Azzali M., Kalinowski J. (2000). “Spatial and temporal distribution of krill Euphausia superba biomass in the Ross Sea, (1989-1990 and 1994),” in Ross Sea ecology. Eds. Faranda F. M., Guglielmo L., Ianora A. (Berlin, Heidelberg: Springer-Verlag), 433–455. doi: 10.1007/978-3-642-59607-0_31
Azzali M., Leonori I., De Felice A., Russo A. (2006). Spatial-temporal relationships between two euphausiid species in the Ross Sea. Chem. Ecol. 22, S219–S233. doi: 10.1080/02757540600670836
Bagoien E., Kaartvedt S., Aksnes D. L., Eiane K. (2001). Vertical distribution and mortality of overwintering Calanus. Limnol. Oceanogr. 46, 1494–1510. doi: 10.4319/lo.2001.46.6.1494
Barange M., Coetzee J., Takasuka A., Hill K., Gutierrez M., Oozeki Y., et al. (2009). Habitat expansion and contraction in anchovy and sardine populations. Prog. Oceanogr. 83 (1-4), 251–260. doi: 10.1016/j.pocean.2009.07.027
Barra M., Petitgas P., Bonanno A., Somarakis S., Woillez M., Machias A., et al. (2015). Interannual changes in biomass affect the spatial aggregations of anchovy and sardine as evidenced by geostatistical and spatial indicators. PloS One 10 (8), e0135808. doi: 10.1371/journal.pone.0135808
Ben Abdallah L., Barra M., Gaamour A., Khemiri S., Genovese S., Mifsud R., et al. (2018). Small pelagic fish assemblages in relation to environmental regimes in the Central Mediterranean. Hydrobiologia 821, 113–134. doi: 10.1007/s10750-018-3540-0
Benoit-Bird K. J., Lawson G. L. (2016). Ecological insights from pelagic habitats acquired using active acoustic techniques. Annu. Rev. Mar. Sci. 8, 463–490. doi: 10.1146/annurev-marine-122414-034001
Benoit-Bird K. J., McManus M. A. (2014). A critical time window for organismal interactions in a pelagic ecosystem. PloS One 9, e97763. doi: 10.1371/journal.pone.0097763
Blanluet A., Doray M., Berger L., Romagnan J. B., Le Bouffant N., Lehuta S., et al. (2019). Characterization of sound scattering layers in the Bay of Biscay using broadband acoustics, nets and video. PloS One 14 (10), e0223618. doi: 10.1371/journal.pone.0223618
Bolinesi F., Saggiomo M., Ardini F., Castagno P., Cordone A., Fusco G., et al. (2020). Spatial-related community structure and dynamics in phytoplankton of the Ross Sea, Antarctica. Front. Mar. Sci. 7. doi: 10.3389/fmars.2020.574963
Bonanno A., Barra M., De Felice A., Giannoulaki M., Iglesias M., Leonori I., et al. (2021). Acoustic correction factor estimate for compensating vertical diel migration of small pelagics. Mediterr. Mar. Sci. 22 (4), 784–799. doi: 10.12681/mms.25120
Bonanno A., Barra M., Mifsud R., Basilone G., Genovese S., Di Bitetto M., et al. (2018). Space utilization by key species of the pelagic fish community in an upwelling ecosystem of the Mediterranean Sea. Hydrobiologia 821, 173–190. doi: 10.1007/s10750-017-3350-9
Bonanno A., Zgozi S., Basilone G., Hamza M., Barra M., Genovese S., et al. (2015). Acoustically detected pelagic fish community in relation to environmental conditions observed in the Central Mediterranean Sea: a comparison of Libyan and Sicilian-Maltese coastal areas. Hydrobiologia 755, 209–224. doi: 10.1007/s10750-015-2234-0
Bonello G., Grillo M., Cecchetto M., Giallain M., Granata A., Guglielmo L., et al. (2020). Distributional records of ross sea (Antarctica) planktic copepoda from bibliographic data and samples curated at the Italian national antarctic museum (MNA): checklist of species collected in the ross sea sector from 1987 to 1995. ZooKeys 969, 1–22. doi: 10.3897/zookeys.969.52334
Brierley A. S., Fernandes P. G., Brandon M. A., Armstrong F., Millard N. W., McPhail S. D., et al. (2002). Antarctic krill under sea ice: elevated abundance in a narrow band just south of ice edge. Science 295 (5561), 1890–1892. doi: 10.1126/science.1068574
Brierley A. S., Ward P., Watkins J. L., Goss C. (1998). Acoustic discrimination of Southern Ocean zooplankton. Deep-Sea Res. Part II: Topical Studies in Oceanography 45 (7), 1155–1173. doi: 10.1016/S0967-0645(98)00025-3
Carli A., Feletti M., Mariottini G. L., Pane L. (1992). Contribution to the study of Copepods collected during the Italian oceanographic campaign in Antarctica 1989-90. Nat. Sc. Com. Ant. Ocean. Camp., 1987–1988.
Carli A., Mariottini G. L., Pane L. (1990). Contribution to the study of Copepods collected in Terra Nova Bay (Ross Sea). Nat. Sc. Com. Ant. Ocean. Camp., 1987–1988.
Carli A., Pane L., Stocchino C. (2000). “Planktonic Copepods in Terra Nova Bay (Ross Sea): Distribution and relationship with environmental factors,” in Ross Sea Ecology Italian Antarctic expeditions, (1987-1995). Eds. Faranda F. M., Guglielmo L., Ianora A. (Berlin: Springer), 309–321.
Cheriton O. M., McManus M. M., Holliday D. V., Greenlaw C. F., Donaghay P. L., Cowles T. J. (2007). Effects of mesoscale physical processes on thin zooplankton layers at four sites along the west coast of the U.S. Estuaries Coasts: J. ERF 30, 575–590. doi: 10.1007/BF02841955
Davis L. B., Hofmann E. E., Klinck J. M., Pinones A., Dinniman M. S. (2017). Distributions of krill and Antarctic silverfish and correlations with environmental variables in the western Ross Sea, Antarctica. Mar. Ecol. -Prog. Ser. 584, 45–65. doi: 10.3354/meps12347
De Felice A., Biagiotti I., Canduci G., Costantini I., Malavolti S., Giuliani G., et al. (2022). Is it the same every summer for the euphausiids of the ross sea? Diversity-Basel 14, 433. doi: 10.3390/d14060433
De Felice A., Iglesias M., Saraux C., Bonanno A., Tičina V., Leonori I., et al. (2021). Environmental drivers influencing the abundance of round sardinella (Sardinella aurita) and European sprat (Sprattus sprattus) in different areas of the Mediterranean Sea. Mediterr. Mar. Sci. 22(4), 812–826. doi: 10.12681/mms.25933
De Robertis A., Higginbottom I. (2007). A post-processing technique to estimate the signal-to-noise ratio and remove echosounder background noise. ICES J. Mar. Sci. 64, 1282–1291. doi: 10.1093/icesjms/fsm112
DeVries T. (2014). The oceanic anthropogenic CO2 sink: storage, air-sea fluxes, and transports over the industrial era. Glob. Biogeochem. Cycle 28 (7), 631–647. doi: 10.1002/2013GB004739
Di Tullio G. R., Smith W. O. Jr (1996). Spatial patterns in phytoplankton biomass and pigment distributions in the Ross Sea. J. Geophys. Res. 101, 18467–18477. doi: 10.1029/96JC00034
Ducklow H. W., Fraser W., Karl D. M., Quetin L. B., Ross R. M., Smith R. C., et al. (2006). Water-column processes in the West Antarctic Peninsula and the Ross Sea: Interannual variations and foodweb structure. Deep-Sea Res. Part II-Top. Stud. Oceanogr. 53, 834–852. doi: 10.1016/j.dsr2.2006.02.009
Faranda F. M., Guglielmo L., Ianora A. (2000). “The italian oceanographic cruises in the ross sea, (1987-95): Strategy, general considerations and description of the sampling sites,” in Ross Sea Ecology Italian antarctic expeditions, (1987-1995). Eds. Faranda F. M., Guglielmo L., Ianora A. (Berlin: Springer), 1–13.
Fernandes P. G., Gerlotto F., Holliday D. V., Nakken O., Simmonds E. J. (2002). Acoustic applications in fisheries science: the ICES contribution. ICES Mar. Sci. Symp. 215, 483–492. doi: 10.17895/ices.pub.8889
Fontana I., Barra M., Bonanno A., Giacalone G., Rizzo R., Mangoni O., et al. (2022). Automatic classification of acoustically detected krill aggregations: a case study from Southern Ocean. Environ. Modell. Software 151, 105357. doi: 10.1016/j.envsoft.2022.105357
Foote K. G., Knudsen H. P., Vestnes G., MacLennan D. N., Simmonds E. J. (1987). Calibration of acoustic instruments for fish density estimation: a practical guide. ICES Cooperative Res. Rep. 144, 82. doi: 10.1121/1.396131
Geoffroy M., Daase M., Cusa M., Darnis G., Graeve M., Santana Hernández N., et al. (2019). Mesopelagic sound scattering layers of the High Arctic: Seasonal variations in biomass, species assemblage, and trophic relationships. Front. Mar. Sci. 6. doi: 10.3389/fmars.2019.00364
Giacalone G., Barra M., Bonanno A., Basilone G., Fontana I., Calabrò M., et al. (2022). A pattern recognition approach to identify biological clusters acquired by acoustic multi-beam in Kongsfjorden. Environ. Modell. Software 152, 105401. doi: 10.1016/j.envsoft.2022.105401
Granata A., Cubeta A., Guglielmo L., Sidoti O., Greco S., Vacchi M., et al. (2002). Ichthyoplankton abundance and distribution in the Ross Sea during 1987–1996. Polar Biol. 25, 187–202. doi: 10.1007/s00300-001-0326-y
Granata A., Guglielmo L., Greco S., Vacchi M., Sidoti O., Zagami G., et al. (2000). “Spatial distribution and feeding habits of larval and juvenile Pleuragramma antarcticum in the Western Ross Sea (Antarctica),” in Ross Sea ecology. Eds. Faranda F., Guglielmo L., Ianora A. (Berlin Heidelberg New York: Springer), 369–393.
Granata A., Weldrick C. K., Bergamasco A., Saggiomo M., Grillo M., Bergamasco A., et al. (2022). Diversity in zooplankton and sympagic biota during a period of rapid sea ice change in Terra Nova Bay, Ross Sea, Antarctica. Diversity-Basel 14 (6), 425. doi: 10.3390/d14060425
Granata A., Zagami G., Vacchi M., Guglielmo L. (2009). Summer and spring trophic niche of larval and juvenile Pleuragramma antarcticum in the Western Ross Sea, Antarctica. Polar Biol. 32, 369–382. doi: 10.1007/s00300-008-0551-8
Greenlaw C. F., Johnson R. K. (1982). Physical and acoustical properties of zooplankton. J. Acoust. Soc Am. 72, 1706–1710. doi: 10.1121/1.388663
Grillo M., Huettmann F., Guglielmo L., Schiaparelli S. (2022). Three-dimensional quantification of copepods predictive distributions in the Ross Sea: first data based on a machine learning model approach and open access (FAIR) data. Diversity-Basel 14, 355. doi: 10.3390/d14050355
Guglielmo L., Arena G., Brugnano C., Guglielmo R., Granata A., Minutoli R., et al. (2015). MicroNESS: an innovative opening–closing multinet for under pack-ice zooplankton sampling. Polar Biol. 38 (12), 2035–2046. doi: 10.1007/s00300-015-1763-3
Guglielmo L., Costanzo G., Manganaro A., Zagami G. (1990). Spatial and vertical distribution of zooplanktonic communities in Terra Nova Bay (Ross Sea). Nat. Sc. Com. Ant. Ocean. Camp 1987-88, Data Rep I, 257–398.
Guglielmo L., Costanzo G., Zagami G., Manganaro A., Arena G.(1992).Zooplankton ecology in the southern ocean. Nat. Sc. Com. Ant. Ocean. Camp 1989-90, Data Report Part II, 301–468.
Guglielmo L., Donato P., Zagami G., Granata A. (2009). Spatiotemporal distribution and abundance of Euphausia crystallorophias in Terra Nova Bay (Ross Sea, Antarctica) during austral summer. Polar Biol. 32, 347–367. doi: 10.1007/s00300-008-0546-5
Guglielmo L., Granata A., Greco S. (1997). Distribution and abundance of postlarval and juvenile Pleuragramma antarcticum (Pisces, Nototheniidae) off Terra Nova Bay (Ross Sea, Antarctica). Polar Biol. 19, 37–51. doi: 10.1007/s003000050214
Gutierrez M., Swartzman G., Bertrand A., Bertrand S. (2007). Anchovy (Engraulis ringens) and sardine (Sardinops sagax) spatial dynamics and aggregation patterns in the Humboldt Current ecosystem, Peru, from 1983-2003. Fish Oceanogr. 16, 155–168. doi: 10.1111/j.1365-2419.2006.00422.x
Hecq J. H., Magazzù G., Goffart A., Catalano G., Vanucci S., Guglielmo L. (1992). “Distribution of Planktonic Components related to structure of water masses in the Ross Sea during the Vth Italiantartide Expedition,” in Atti 9° Congresso A.I.O.L. S. Margherita Ligure, , 20-23 November 1990. 665–678.
Higginbottom I. R., Pauly T. J., Heatley D. C. (2000). “Virtual echograms for visualization and post-processing of multiple-frequency echosounder data,” in Proceedings of the Fifth European Conference on Underwater Acoustics, ECUA 2000, Lyon, France, P. Chevret and M.E. Zakharia.
Hopkins T. L. (1987). Midwater food web in McMurdo Sound, Ross Sea, Antarctica. Marine Biology. 96, 93–106.
Holm-Hansen O., Lorenzen C. J., Holmes R. W., Strickland J. D. H. (1965). Fluorometric determination of chlorophyll. ICES J. Mar. Sci. 30 (1), 3–15. doi: 10.1093/icesjms/30.1.3
Hunt B. P. V., Pakhomov E. A., Hosie G. W., Siegel V., Ward P., Bernard K. (2008). Pteropods in southern ocean ecosystems. Prog. Oceanogr. 78, 193–221. doi: 10.1016/j.pocean.2008.06.001
Ianson D., Allen S. E., Mackas D. L., Trevorrow M. V., Benfield M. C. (2011). Response of Euphausia pacifica to small-scale shear in turbulent flow over a sill in a fjord. J. Plankton Res. 33, 1679–1695. doi: 10.1093/plankt/fbr074
Innamorati M., Mori G., Massi L., Lazzara L., Nuccio C. (2000). “Phytoplankton biomass related to environmental factors in the Ross Sea,” in Ross Sea Ecology Italian antarctic expeditions, (1987–1995). Eds. Faranda F. M., Guglielmo L., Ianora A. (Berlin: Springer), 259–273.
Kasyan V. V. (2023). Recent changes in composition and distribution patterns of summer mesozooplankton off the western Antarctic Peninsula. Water 15 (10), 1948. doi: 10.3390/w15101948
Kattnerll G., Hagen W. (1998). Lipid metabolism of the Antarctic euphausiid Euphausia crystallorophias and its ecological implications. Mar. Ecol. -Prog. Ser. 170, 203–213. doi: 10.3354/meps170203
Kiko R., Bianchi D., Grenz C., Hauss H., Iversen M., Kuma S., et al. (2020). Editorial: zooplankton and nekton: gatekeepers of the biological pump. Front. Mar. Sci. 7. doi: 10.3389/fmars.2020.00545
Kim S. H., Kim B. K., Lee B., Son W., Jo N., Lee J., et al. (2022). Distribution of the mesozooplankton community in the Western Ross Sea region marine protected area during late summer bloom. Front. Mar. Sci. 9. doi: 10.3389/fmars.2022.860025
Kimura K. (1929). On the detection of fish groups by an acoustic method. J. Imp. Fish. Inst. Tokyo 24, 451–458.
Knutsen T., Wiebe P. H., Gjøsæter H., Ingvaldsen R. B., Lien G. (2017). High latitude epipelagic and mesopelagic scattering layers - a reference for future Arctic ecosystem change. Front. Mar. Sci. 4. doi: 10.3389/fmars.2017.00334
Ko A.-R., Yang E. J., Kim M.-S., Ju S.-J. (2016). Trophodynamics of euphausiids in the Amundsen Sea during the austral summer by fatty acid and stable isotopic signatures. Deep-Sea Res. Part II-Top. Stud. Oceanogr. 123, 78–85. doi: 10.1016/j.dsr2.2015.04.023
La H. S., Lee H., Fielding S., Kang D., Ha H. K., Atkinson A., et al. (2015). High density of ice krill (Euphausia crystallorophias) in the Amundsen sea coastal polynya, Antarctica. Deep-Sea Res. Part I: Oceanographic Res. Papers 95, 75–84. doi: 10.1016/j.dsr.2014.09.002
La Mesa M., Catalano B., Russo A., Greco S., Vacchi M., Azzali M. (2010). Influence of environmental conditions of spatial distribution and abundance of early life stages of Antarctic silverfish, Pleuragramma antarcticum (Nototheniidae), in the Ross Sea. Antarct. Sci. 22, 243–254. doi: 10.1017/S0954102009990721
Le S., Josse J., Husson F. (2008). FactoMineR: an R package for multivariate analysis. J. Stat. Software 25 (1), 1–18. doi: 10.18637/jss.v025.i01
Leonori I., De Felice A., Canduci G., Costantini I., Biagiotti I., Giuliani G., et al. (2017). Krill distribution in relation to environmental parameters in mesoscale structures in the Ross Sea. J. Mar. Syst. 166, 159–171. doi: 10.1016/j.jmarsys.2016.11.003
Leonori I., Tičina V., Giannoulaki M., Hattab T., Iglesias M., Bonanno A., et al. (2021). History of hydroacoustic surveys of small pelagic fish species in the European Mediterranean Sea. Mediterr. Mar. Sci. 22 (4), 751–768. doi: 10.12681/mms.26001
Lluch-belda D., Schwartzlose R. A., Serra R., Parrish R., Kawasaki T., Hedgecock D., et al. (1992). Sardine and anchovy regime fluctuations of abundance in four regions of the world oceans: a workshop report. Fish Oceanogr. 114, 339–347. doi: 10.1111/j.1365-2419.1992.tb00006.x
MacLennan D., Fernandes P., Dalen J. (2002). A consistent approach to definitions and symbols in fisheries acoustics. ICES J. Mar. Sci. 59, 365–369. doi: 10.1006/jmsc.2001.1158
Mangoni O., Modigh M., Conversano F., Carrada G. C., Saggiomo V. (2004). Effects of summer ice coverage on phytoplankton assemblages in the Ross Sea, Antarctica. Deep-Sea Res. Part I-Oceanogr. Res. Pap. 51, 1601–1617. doi: 10.1016/j.dsr.2004.07.006
Mangoni O., Saggiomo M., Bolinesi F., Castellano M., Povero P., Saggiomo V., et al. (2019). Phaeocystis Antarctica unusual summer bloom in stratified Antarctic coastal waters (Terra Nova Bay, Ross Sea). Mar. Environ. Res. 151, 104733. doi: 10.1016/j.marenvres.2019.05.012
Mangoni O., Saggiomo V., Bolinesi F., Escalera L., Saggiomo M. (2018). A review of past and present summer primary production processes in the Ross Sea in relation to changing ecosystems. Ecol. Quest. 29, 75–85. doi: 10.12775/EQ.2018.024
Mangoni O., Saggiomo V., Bolinesi F., Margiotta F., Budillon G., Cotroneo Y., et al. (2017). Phytoplankton blooms during austral summer in the Ross Sea, Antarctica: Driving factors and trophic implications. PloS One 12 (4), e0176033. doi: 10.1371/journal.pone.0176033
Manno C., Tirelli V., Accornero A., Fonda Umani S. (2010). Importance of the contribution of Limacina helicina faecal pellets to the carbon pump in Terra Nova Bay (Antarctica). J. Plankton Res. 32 (2), 145–152. doi: 10.1093/plankt/fbp108
Minutoli R., Bergamasco A., Guglielmo L., Swadling K. M., Bergamasco A., Veneziano F., et al. (2023). Species diversity and spatial distribution of pelagic amphipods in Terra Nova Bay (Ross Sea, Southern Ocean). Polar Biol. 46, 821–835. doi: 10.1007/s00300-023-03166-0
Minutoli R., Brugnano C., Granata A., Zagami G., Guglielmo L. (2017). Zooplankton electron transport system activity and biomass in the western Ross Sea (Antarctica) during austral summer 2014. Polar Biol. 40, 1197–1209. doi: 10.1007/s00300-016-2043-6
Misic C., Covazzi Harriague A., Mangoni O., Cotroneo Y., Aulicino G., Castagno P. (2017). Different responses of the trophic features of particulate organic matter to summer constraints in the Ross Sea. J. Mar. Syst. 166, 132–143. doi: 10.1016/j.jmarsys.2016.06.012
Muradian M. L., Branch T. A., Moffitt S. D., Hulson P. J. F. (2017). Bayesian stock assessment of Pacific herring in Prince William sound Alaska. PloS One 12 (2), e0172153. doi: 10.1371/journal.pone.0172153
Murase H., Nagashima H., Yonezaki S., Matsukura R., Kitakado T. (2009). Application of a generalized additive model (GAM) to reveal relationships between environmental factors and distributions of pelagic fish and krill: a case study in Sendai Bay, Japan. ICES J. Mar. Sci. 66, 1417–1424. doi: 10.1093/icesjms/fsp105
Naganobu M., Murase H., Nishiwaki S., Yasuma H., Matsukura R., Takao Y., et al. (2010). Structure of the marine ecosystem of the Ross Sea, Antarctica-overview and synthesis of the results of a Japanese multidisciplinary study by Kaiyo-Maru and JARPA. Bull. Jpn. Soc Fish. Oceanogr. 74, 1–12.
Nuccio C., Innamorati M., Lazzara L., Mori G., Massi L. (2000). “Spatial and temporal distribution of phytoplankton assemblage in the Ross Sea,” in Ross Sea Ecology Italian antarctic expeditions, (1987–1995). Eds. Faranda F. M., Guglielmo L., Ianora A. (Berlin: Springer), 231–246.
Pagès F. (1997). The gelatinous zooplankton in the pelagic system of the Southern Ocean: a review. Annales l'Institute Oceanographique 73, 139−158.
Pakhomov E. A., Perissinotto R., Froneman P. W. (1998). Abundance and trophodynamics of Euphausia crystallorophias in the shelf region of the Lazarev Sea during austral spring and summer. J. Mar. Syst. 17, 313–324. doi: 10.1016/S0924-7963(98)00046-3
Pane L., Feletti M., Francomacaro B., Mariottini G. L. (2004). Summer coastal zooplankton biomass and copepod community structure near the Italian Terra Nova base (Terra Nova Bay, Ross Sea, Antarctica). J. Plankton Res. 26, 1479–1488. doi: 10.1093/plankt/fbh135
Phan-Tan L., Nguyen-Ngoc L., Smith W. O., Doan-Nhu H. (2018). A new dinoflagellate species, Protoperidinium smithii H. Doan-Nhu, L. Phan-Tan et L. Nguyen-Ngoc sp. nov., and an emended description of Protoperidinium defectum (Balech 1965) Balech 1974 from the Ross Sea, Antarctica. Polar Biol. 41, 983–992. doi: 10.1007/s00300-018-2262-0
Pinkerton M. H., Bradford-Grieve J. M. (2014). Characterizing foodweb structure to identify potential ecosystem effects of fishing in the Ross Sea, Antarctica. ICES J. Mar. Sci. 71, 1542–1553. doi: 10.1093/icesjms/fst230
R Core Team. (2023). R: A Language and Environment for Statistical Computing_ (Vienna, Austria: R Foundation for Statistical Computing). Available at: https://www.R-project.org/.
Richardson A., Bakun A., Hays G., Gibbons M. (2009). The jellyfish joyride: causes, consequences and management responses to a more gelatinous future. Trends Ecol. Evol. 24, 312−322. doi: 10.1016/j.tree.2009.01.010
Saggiomo M., Escalera L., Bolinesi F., Rivaro P., Saggiomo V., Mangoni O. (2021). Diatom diversity during two austral summers in the Ross Sea (Antarctica). Mar. Micropaleontol. 165, 101993. doi: 10.1016/j.marmicro.2021.101993
Saggiomo V., Carrada G. C., Mangoni O., Marino D., Ribera d’Alcalà M. (2000). “Physiological and ecological aspects of primary production in the Ross Sea,” in Ross Sea Ecology - Italian Antarctic Expeditions, (1987–1995). Eds. Faranda F. M., Guglielmo L., Ianora A. (Berlin: Springer-Verlag), 247–258.
Saggiomo V., Catalano G., Mangoni O., Budillon G., Carrada G. C. (2002). Primary production processes in ice-free waters of the Ross Sea (Antarctica) during the austral summer 1996. Deep-Sea Res. Part II-Top. Stud. Oceanogr. 49, 1787–1801. doi: 10.1016/S0967-0645(02)00012-7
Saino N., Guglielmo L. (2000). “ROSSMIZE expedition: distribution and biomass of birds and mammals in the western ross sea,” in Ross Sea Ecology Italian Antarctic Expeditions, (1987–1995). Eds. Faranda F. M., Guglielmo L., Ianora A. (Berlin: Springer- Verlag), 469–478.
Sala A., Azzali M., Russo A. (2002). Krill of the Ross Sea: distribution, abundance and demography of Euphausia superba and Euphausia crystallorophias during the Italian Antarctic Expedition (January–February 2000). Sci. Mar. 66, 123–133. doi: 10.3989/scimar.2002.66n2123
Schaub J., Hunt B. V., Pakhomov E., Holmes K., Lu Y., Quayle L. (2018). Using unmanned aerial vehicles (UAVs) to measure jellyfish aggregations. Mar. Ecol.-Prog. Ser. 591, 29−36. doi: 10.3354/meps12414
Schismenou E., Tsoukali S., Giannoulaki M., Somarakis S. (2017). Modelling small pelagic fish potential spawning habitats: eggs vs spawners and in situ vs satellite data. Hydrobiologia 788, 17–32. doi: 10.1007/s10750-016-2983-4
SCOR Working Group (1988). The acquisition, calibration and analysis of CTD data. UNESCO Technical Papers in Marine Science. 54. Available at: https://www.jodc.go.jp/info/ioc_doc/UNESCO_tech/096989eb.pdf.
Sedwick P. N., Marsay C. M., Sohst B. M., Aguilar-Islas A. M., Lohan M. C., Long M. C., et al. (2011). Early season depletion of dissolved iron in the Ross Sea polynya: implications for iron dynamics on the Antarctic continental shelf. J. Geophys. Res. 116, C12019. doi: 10.1029/2010JC006553
Siegelman-Charbit L., Planque B. (2016). Abundant mesopelagic fauna at oceanic high latitudes. Mar. Ecol. .-Prog. Ser. 546, 277–282. doi: 10.3354/meps11661
Smith W. O. Jr., Ainley D. G., Arrigo K. R., Dinniman M. S. (2014). The oceanography and ecology of the Ross Sea. Annu. Rev. Mar. Sci. 6, 469–487. doi: 10.1146/annurev-marine-010213-135114
Smith W. O. Jr., Ainley D. G., Cattaneo-Vietti R. (2007). Trophic interactions within the Ross Sea continental shelf ecosystem. Philos. Trans. R. Soc Lond. Ser. B-Biol. Sci. 362, 95–111. doi: 10.1098/rstb.2006.1956
Smith W. O. Jr., Asper V. (2001). The influence of phytoplankton assemblage composition on biogeochemical characteristics and cycles in the southern Ross Sea, Antarctica. Deep Sea Res. Part I-Oceanogr. Res. Pap. 48, 137–161. doi: 10.1016/S0967-0637(00)00045-5
Smith W. O. Jr., Delizo L. M., Herbolsheimer C., Spencer E. (2017). Distribution and abundance of mesozooplankton in the Ross Sea, Antarctica. Polar Biol. 40, 2351–2361. doi: 10.1007/s00300-017-2149-5
Stevens C. J., Pakhamov E. A., Robinson K. V., Hall J. A. (2015). Mesozooplankton biomass, abundance and community composition in the Ross Sea and the Pacific sector of the Southern Ocean. Polar Biol. 38, 275–286. doi: 10.1007/s00300-014-1583-x
Sweeney C., Smith W. O. Jr., Hales B., Bidigare R. R., Carlson C. A., Codispoti L. A., et al. (2000). Nutrient and carbon removal ratios and fluxes in the Ross Sea, Antarctica. Deep-Sea Res. Part II-Top. Stud. Oceanogr. 47, 3395–3421. doi: 10.1016/S0967-0645(00)00073-4
Tournier M., Goulet P., Johnson M., Nerini D., Fonvieille N., Guinet C. (2021). A novel animal-borne miniature echosounder to observe the distribution and migration patterns of intermediate trophic levels in the Southern Ocean. J. Mar. Syst. 223, 103608. doi: 10.1016/j.jmarsys.2021.103608
Verhaegen G., Cimoli E., Lindsay D. (2021). Life beneath the ice: jellyfish and ctenophores from the Ross Sea, Antarctica, with an image-based training set for machine learning. Biodiver. Data J. 9, e69374. doi: 10.3897/BDJ.9.e69374
Wood S. N. (2011). Fast stable restricted maximum likelihood and marginal likelihood estimation of semiparametric generalized linear models. J. R. Stat. Soc Ser. B-Stat. Methodol. 73 (1), 3–36. doi: 10.1111/j.1467-9868.2010.00749.x
Yang G., Li C., Wang Y. (2016). Fatty acid composition of Euphausia superba, Thysanoessa macrura and Euphausia crystallorophias collected from Prydz Bay, Antarctica. J. Ocean Univ. China 15, 297–302. doi: 10.1007/s11802-016-2791-5
Zgozi S., Barra M., Basilone G., Hamza M., Assughayer M., Nfate A., et al. (2018). Habitat suitability modelling for a key small pelagic fish species (Sardinella aurita) in the central Mediterranean sea. Hydrobiologia 821, 83–98. doi: 10.1007/s10750-017-3265-5
Zunini Sertorio T., Licandro P., Ossola C., Artegiani A. (2000). “Copepod communities in the pacific sector of the southern ocean in early summer,” in Ross Sea Ecology (Berlin/Heidelberg, Germany: Springer), 291–307.
Zunini Sertorio T., Licandro P., Ricci F., Giallain M. (1992). Antarctica, N.S.C. for A study on ross sea copepods. Nat. Sc. Com. Ant. Ocean. Camp. 90, 217–246. doi: 10.1007/978-3-642-59607-0_23
Keywords: Euphausia superba, Euphausia crystallorophias, vertical distribution, Ross Sea, sound scattering layers
Citation: Barra M, Guglielmo L, Bonanno A, Mangoni O, Rivaro P, Rumolo P, Falco P, Basilone G, Fontana I, Ferreri R, Giacalone G, Aronica S, Minutoli R, Memmola F, Granata A and Genovese S (2023) Vertical structure characterization of acoustically detected zooplankton aggregation: a case study from the Ross Sea. Front. Mar. Sci. 10:1304493. doi: 10.3389/fmars.2023.1304493
Received: 29 September 2023; Accepted: 08 December 2023;
Published: 22 December 2023.
Edited by:
Satya Panigrahi, Indira Gandhi Centre for Atomic Research (IGCAR), IndiaReviewed by:
Ajit Kumar Mohanty, Indira Gandhi Centre for Atomic Research (IGCAR), IndiaCopyright © 2023 Barra, Guglielmo, Bonanno, Mangoni, Rivaro, Rumolo, Falco, Basilone, Fontana, Ferreri, Giacalone, Aronica, Minutoli, Memmola, Granata and Genovese. This is an open-access article distributed under the terms of the Creative Commons Attribution License (CC BY). The use, distribution or reproduction in other forums is permitted, provided the original author(s) and the copyright owner(s) are credited and that the original publication in this journal is cited, in accordance with accepted academic practice. No use, distribution or reproduction is permitted which does not comply with these terms.
*Correspondence: Angelo Bonanno, YW5nZWxvLmJvbmFubm9AY25yLml0
†These authors have contributed equally to this work
Disclaimer: All claims expressed in this article are solely those of the authors and do not necessarily represent those of their affiliated organizations, or those of the publisher, the editors and the reviewers. Any product that may be evaluated in this article or claim that may be made by its manufacturer is not guaranteed or endorsed by the publisher.
Research integrity at Frontiers
Learn more about the work of our research integrity team to safeguard the quality of each article we publish.