 Xiaolei Liu1
 Gang Dong
94% of researchers rate our articles as excellent or good
Learn more about the work of our research integrity team to safeguard the quality of each article we publish.
Find out more
ORIGINAL RESEARCH article
Front. Mar. Sci. , 05 January 2024
Sec. Marine Pollution
Volume 10 - 2023 | https://doi.org/10.3389/fmars.2023.1303879
As an important component of new western land-sea corridor, the construction of Pinglu Canal will effectively alleviated waiting time and congestion costs and enhance the reliability and resilience of the regional maritime transport network in the post-pandemic era in particular. From the perspective of competition and cooperation game, this paper investigates typical transportation routes from the port of Jakarta in Indonesia to the port of Nanning in China from the key factors of the changes in freight volume and the evolution of profits and subsidies, considering local government subsidies, environmental costs, marine emissions and other critical factors. The results demonstrated that in the centralized strategies adopted by two transport route operators, as the volume of goods transported through Pinglu Canal increased, so the corresponding profits increased. The increase in subsidies also contributed to generating the volume of freight through Pinglu Canal, but the social welfare under the decentralized strategy adopted by both transport route operators was more effective than that of the centralized strategy.
The waiting time of ships and cargoes at container and dry bulk ports has significantly increased during the pandemic period (UNCTD, 2022). To reduce such waiting time and congestion costs and to enhance the reliability and resilience of the regional maritime transport network in the post-pandemic era in particular, Pinglu Canal began at the end of August 2022, connecting Nanning and the Beibu Gulf and the canal will be put into operation in 2028. The total estimated cost is RMB 72.7 billion. The total length is about 140 kilometers, travelling from the Pingtang Estuary in the lower reaches of Nanning through the Shaping River and the tributary watershed of the Qinjiang River and finally to the Qinzhou port area of the Beibu Gulf. According to the standard construction of inland Class-I waterway, it can accommodate the navigation of 5000 tons of inland river ships.
After the opening of Pinglu Canal, the ports of Nanning and the Beibu Gulf will be connected by waterways. Some of the coal transported through the Pearl River Delta port to the Xijiang River shipping line could be transported to the Beibu Gulf. For instance, Indonesia’s coal resources are transported to the port of Nanning in Guangxi province. With the aid of Pinglu Canal, there will be two transport routes to import coal resources. Route 1 will allow transport from the port of Jakarta in Indonesia to the port of the Beibu Gulf in Guangxi province, China, through the South China Sea; this will then continue from the port of the Beibu Gulf to the port of Nanning through Pinglu Canal. If the Pinglu canal is opened, coal resources transported from Indonesia to Nanning Port in Guangxi can be transported by this route. Route 2 is the route for Indonesia to transport resources to the Port of Nanning before the Pinglu Canal was opened, which already existed. Route 2 will allow transport from the port of Jakarta to the port of Nansha in Guangzhou through the South China Sea and then continue to the port of Nanning.
The opening of Pinglu Canal will create water transport channels for trade between China and the Association of Southeast Asian Nations (ASEAN), promote the comprehensive development of economic and trade cooperation between China and ASEAN member states, shorten the transportation distance between the ports of China and ASEAN countries, and save transportation costs and help green development. Our main research focused on how the new transport infrastructure may compete with the existing transport infrastructure and what the advantages of transporting goods from Pinglu Canal would be.
Specifically, we explored the following issues: (1) which strategy does help the two transport infrastructure chains maximize social welfare? (2) What impact of local government subsidies for Pinglu Canal could be on Nanning coal imports and shipper route choices? And (3) should the two chains adopt different decentralized and centralized strategies, considering the impact on marine emissions?
The rest of the paper is organized as follows. Section 2 reviews the literature on port competition and shipping route selections. Section 3 establishes the model. Section 4 takes a case study of Pinglu Canal. Policy implications and conclusions are presented in Section 5 and Section 6.
New canal construction can promote the development of global trade and maritime transport, and corresponding competition and cooperation between ports have been studied by means of game theory models. Song et al. (2016) established a game cost model between shipping companies and ports from the perspective of the transportation chain. Dong et al. (2016) established a two-stage non-cooperative game model and found that the price-matching strategy could cause a tacit collusion between coastal container ports. Sheng et al. (2017) studied the impact of different marine emission regulations on the revenue and environment of shipping companies and ports in the case of competition between shipping companies and ports. Dong et al. (2021) analyzed the impact of cost difference on vertical collusion from the perspective of container transport chain. Zheng and Luo (2021) explored how ports and shipping companies chose competition or cooperation strategies as well as the impact on social welfare. Peng et al. (2023) proposed corresponding high-frequency container port congestion measures by means of vessel movement information. In order to improve port integration, Gao et al. (2023) used game theory to analyze the game relationship between relevant stakeholders, including the government, ports, etc., and proposed a strategy to maximize the gains from multi-party games. Wang et al. (2022) pointed out that the internal integration of Shenzhen port had a great impact on improving the synergistic mechanism in the Guangdong-Hong Kong-Macao Greater Bay Area, so the article established a government-regulated port gaming matrix, which provided a decision-making reference for the sustainable development of Shenzhen port.
Several scholars have also taken social welfare into account. Jiang and Wang (2021) found that when studying competition between air and high-speed rail, the latter changed from fixed rates to variable rates, bringing greater social welfare. To solve the competition problem between China Railway Express node cities, Zhang and Xu (2021) studied the impact of various strategies on platform company profits and social welfare in three cases. In terms of consumer behavior, Wang et al. (2021) proposed that the entry of airlines into the high-speed rail service market reduced the frequency of high-speed rail services and the scale of high-speed rail trains. However, D’Alfonso et al. (2015) claimed that the competition between airline and high-speed railway in passenger transport has affected the environment and social welfare. Yuan and Wang (2022) examined the issue of port competition and cooperation with service differences and found that port cooperation can increase port throughput while improving social welfare, but it can harm the profitability of both ports.
To avoid the disadvantages caused by excessive competition, government departments subsidize transport in some policies. In the context of such subsidies, scholars have studied the relationship between subsidies and competition. Hu et al. (2022) considered a two-tier model of regional freight networks connected by roads and waterways. Most studies on subsidies focus on the impact of government subsidy policies from the perspective of reducing marine emissions. Yin et al. (2020) found that disorderly subsidies by local governments for CR Express led to malicious competition among node cities and hindered the development of CR Express. Taking CR Express in Chongqing and Chengdu as an example, Ma et al. (2021) studied the competition between railway transportation services in the duopoly market.
The choice of shipping routes with the change in sailing distance is also a hot topic for scholars. Lasserre (2014) analyzed articles on the economic feasibility of the Arctic route from 1991 to 2013 and proposed his model after comparing and analyzing previous research. Melia et al. (2016) studied how the reduction in Arctic sea ice could increase shipping opportunities in Arctic transit; their study suggested that shipping routes to the Arctic could double by the middle of the 21st century. Wang et al. (2017) used GIS tools and a complex network analysis to study the advantages of Arctic route. Dai et al. (2021) observed that the Arctic route would have a significant impact on the traditional Central European route. Hsu and Hsieh (2007) built the bi-objective model to determine the optimal liner route, ship size and navigation frequency of container transportation companies to minimize transportation and inventory costs. Agarwal and Ergun (2008) studied the route selection optimization problem of liner shipping, considering factors such as the ship type and cargo type in their mixed integer programming model. Considering the marine emission reduction targets in shipping industry, Moradi et al. (2022) presented a path optimization method on reinforcement learning using an artificial neural network. To optimize the ship path selection of the iron and steel plants along the Yangtze River, Li et al. (2019) established an integer planning model by considering the multi-layer shipping network of the Yangtze River route and the demand of the iron and steel plants.
Moreover, with the construction of a new canal, the geographical location of the port, the port’s own infrastructure, the port’s shipping services, market demand and other factors affect changes in port throughput (Talley, 2014; Jeevan et al., 2015; Jiang et al., 2019). By comparing the changes in port imports before (2000-2015) and after (2016-2017), Medina et al. (2020) concluded that Panama Canal expansion increased the import volume of large US port containers. In particular, Zeng et al. (2018) developed a modified gravity model with entropy maximization to predict the changes in transshipment traffic under the potential new channel of Carat Canal.
However, Zeng et al. (2018) has not dealt with profits and subsidies as well as marine emission and strategy selection, we are going to analyze the Pinglu case from the perspectives of the changes in freight volume and the evolution of profits and subsidies, considering local government subsidies, environmental costs, marine emissions and other critical factors such as competitive or cooperative strategies, to highlight research gap between existing papers and our paper.
(1) We considered two transport chains of the Indonesia-Nanning route to examine the subsidy mechanism between Pinglu Canal and Xijiang River.
(2) The Belt and Road Initiative provided a subsidy policy for transportation. Therefore, under the government’s subsidy strategy for Pinglu Canal, we examined the opening effects of subsidy on the social welfare and profit of two transport routes. We also provided development suggestions for the local government and for the management of the two transport chains.
(3) The greenhouse gas emissions from ships account for a relatively large proportion of the total greenhouse gas emissions in the EU transportation sector. In this paper, the factors of current marine emissions on different routes were considered in the model.
To effectively alleviate waiting times and congestion costs, and to enhance the reliability and resilience of regional maritime transport networks in the post-pandemic era in particular, we have simplified the transportation route of China’s coal resources imported from Indonesia. Each transportation route is divided into two sections, one is the resource from Indonesia to China’s transit port, and the other is the route from the transit port to Nanning port. A simplified transport route model is shown in Figure 1.
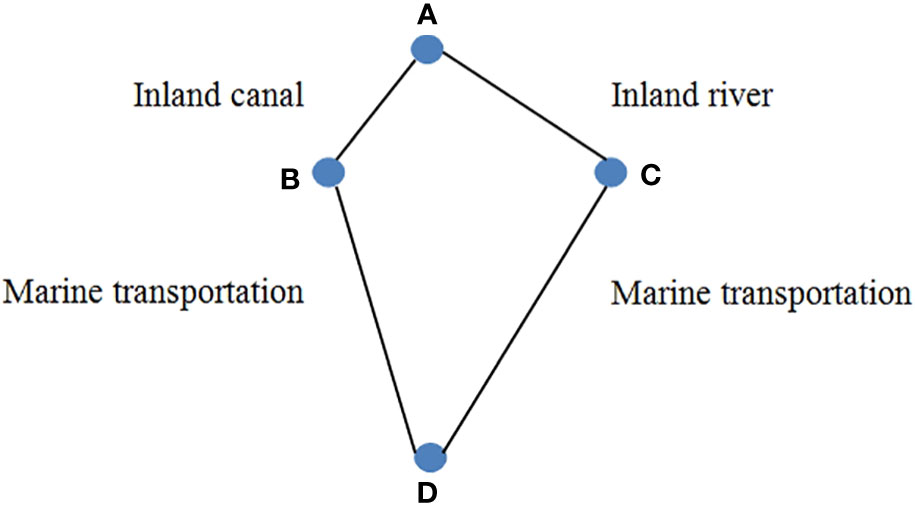
Figure 1 Transport route diagram.
As shown in Figure 1, there are two transport chains; that is, transport chain 1 (A–B–D) and transport chain 2 (A–C–D). A–B and A–C represent inland river transport sections, which are the sections from Chinese domestic transit port to Nanning Port. B–D and C–D represent marine transport sections, which are the sections between Jakarta Port and Chinese domestic transit ports. For the convenience of research, we assume that there are only two transportation routes from Jakarta port to Nanning port. When the shipper delivers the goods to the carrier, the carrier faces the choice of route 1 or route 2. The shipper’s goal is to transport goods economically, the carrier’s goal is to maximize benefits, and the government’s goal is to maximize social welfare. The notation is listed in Table 1.
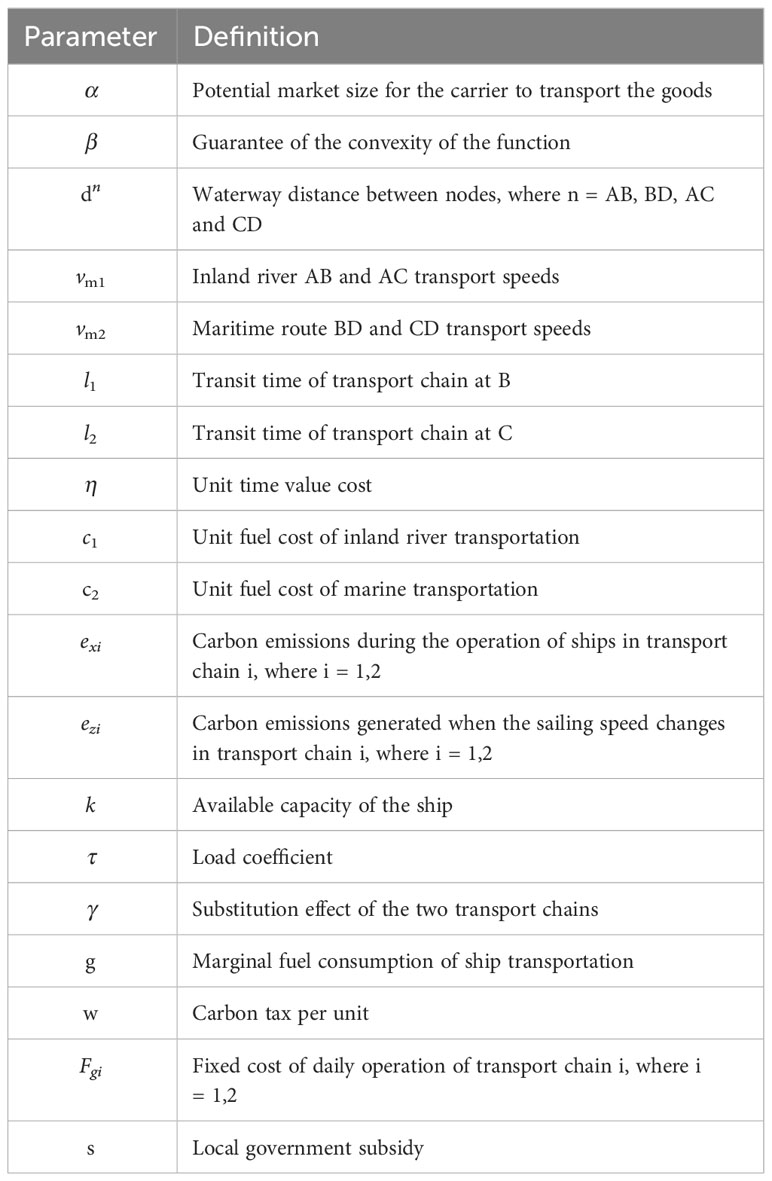
Table 1 Parameter and variable definition.
Following Singh and Vives (1984) and D’Alfonso et al. (2016), a shipper’s utility is a quadratic function of traffic volume. To facilitate the explanation, we use subscript 1 to represent transport chain 1; the transport route is A–B–D; subscript 2 represents transport chain 2 and the transport route is A–C–D. Thus, the utility for AD is given by as Equation 1,
The ratio of the distance to the corresponding speed is the navigation time. There is a transit port in the simplified transportation route model, and the transit time is also required in the port. Therefore the total time includes the transport time and the transit time of the transfer port as follows Equation 2:
The shipper’s generalized transportation cost can be rewritten as:
where p is the transport price. The freight demands on the two transport chains affect each other. In this paper, we used the linear inverse demand function as follows:
Combining Equations 3, 4, the transport price of the two chains is obtained as Equation 5.
Then, we obtain the price of each transport as follows as Equations 6, 7:
Fuel oil is the main power material for ships, according to Gong and Li (2022). The fuel cost is related to factors such as the transportation distance and unit fuel price. The specific expression is as follows Equations 8, 9:
Ship transportation produces a certain amount of marine emissions because of the environmental cost per unit of transportation, which was calculated as follows Equations 10, 11:
The marine emissions of transport chain 1 and transport chain 2 are as follows Equations 12, 13:
To encourage a greater number of ships to pass through Pinglu Canal, the local government could subsidize the route accordingly. As transport chain 1 is representative of a newly engineered route, we posited that the local government would subsidize it to a certain extent; the subsidy amount is s.
The profit functions of transport chain 1 and transport chain 2 are as follows Equations 14, 15:
We take the following consumer surplus and social welfare functions of Pinglu Canal as Equations 16, 17:
Following Dong and Huang (2022), the first transport chain and the second transport chain maximize profits through their respective transport volumes as Equations 18, 19.
Considering , we set and to solve the equilibrium volume.
The equilibrium volume of transport chain 1 (A–B–D), the corresponding freight rate and the profit of transport chain 1 are as follows Equations 20–22:
Similarly, the equilibrium volume of transport chain 2 (A–C–D), the freight and the profit of the corresponding transport chain 2 are as follows Equations 23–25:
Proposition 1. With an increase in government subsidies for transport chain 1, a greater number of shippers will choose route 1 as the transportation route. At the same time, the volume of transport chain 2 will be reduced.
We then hypothesized that the government determines the subsidy policy to maximize social welfare according to the amount of each transport chain as follows Equation 26:
According to the backward induction method, the final profit and social welfare of each transportation chain could then be solved.
The first transport chain and the second transport chain jointly maximize profits by adopting centralized strategy as Equations 27, 28.
where .
By taking and , we obtained the following condition Equations 29, 30:
The relationship between transport volume and subsidies was satisfied as follows Equation 31:
Proposition 2. When the two transport chains adopt a centralized strategy, the increase in government subsidies for the transport chain through transport chain 1 will increase the total traffic volume.
Similarly, the optimal subsidy policy of the government can be obtained when the two adopt a centralized strategy as Equation 32.
According to the backward induction method, the final profit and social welfare of each transportation chain can also be solved.
To further analyze the challenges and opportunities of the opening of Pinglu Canal on regional maritime transport in the post-epidemic era, we adopt real data of two transport chains of coal and products from Indonesia to Nanning Port. The waterway distance from the port of Nanning to the port of the Beibu Gulf is about 140 km, the potential benefit of α shipper per unit of goods was set to 1640 (RMB/t) and the average time value of goods per day was assumed to be 15 (RMB/day/t). Moreover, the marine emissions per cargo ton during the ship’s driving process was calculated by the marine emission calculation tool EcoTransIT (www.ecotransit.org). The tool determines emissions based on a bottom-up approach based on the energy consumed and the fuel used. The values of the parameters are summarized in Table 2.
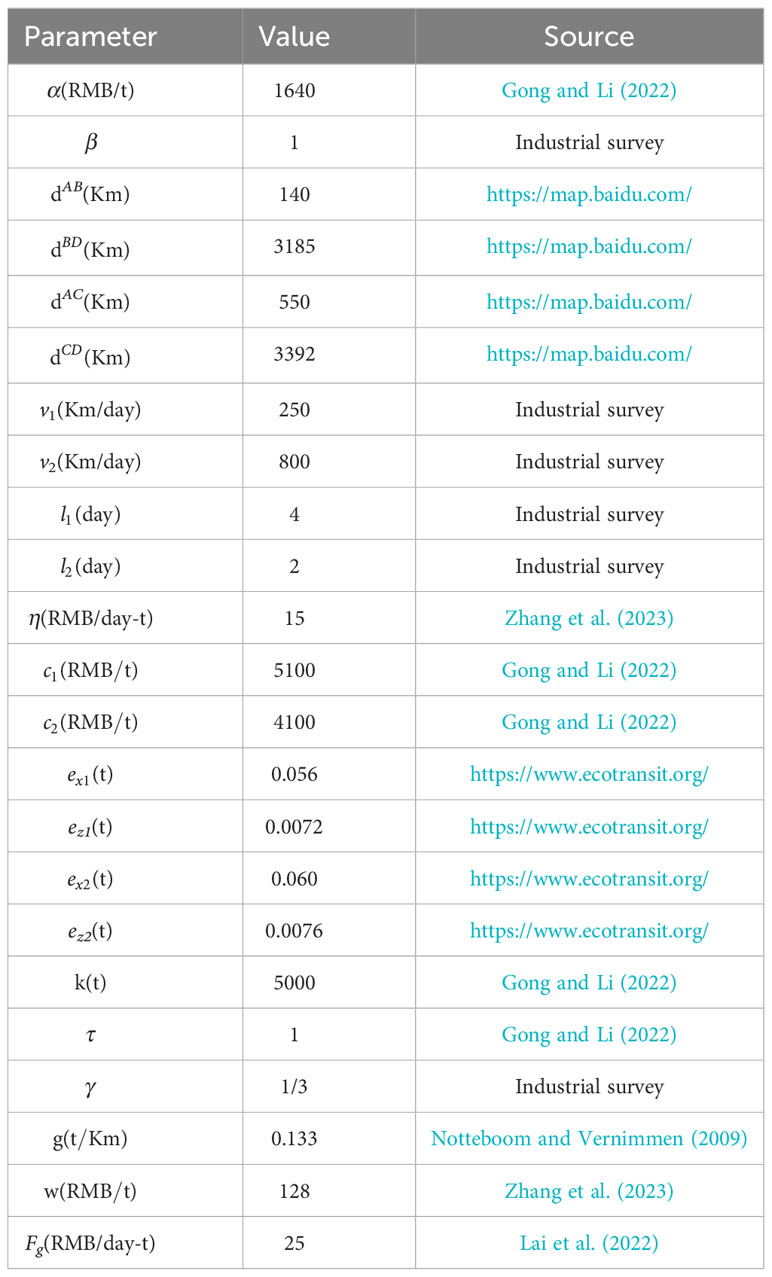
Table 2 Parameter values and sources.
To intuitively illustrate the results, we substitute numerical values into the models of centralization and decentralization, then use the superscript * to denote the equilibrium solution in the decentralized strategy and the superscript ^* to represent the equilibrium solution in the centralized strategy. The data in Table 2 are brought into the expression of the equilibrium solution of competition and cooperation in Section 3. Using Matlab2019b software, the numerical results of freight volume, profit and carbon dioxide emissions of transport chain 1 and transport chain 2 under different strategies can be obtained.
The results are presented in Table 3.
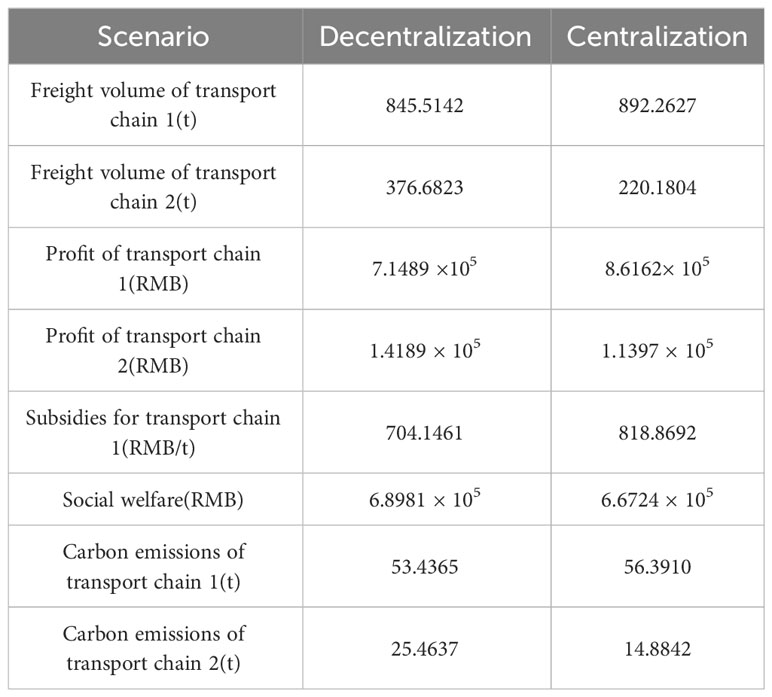
Table 3 Analysis results under different strategies.
As shown in Table 3, when the two transport chains adopt a decentralized strategy, the subsidy of transport chain 1 is smaller than that of the centralized strategy, and the traffic volume of transport chain 1 is also smaller than that of the centralized strategy.
Proposition 3. For transport chain 1, the profit obtained by considering its traffic volume and subsidies will adopt a centralized strategy. That is, .
When the two transport chains adopt a decentralized strategy, the government’s subsidy for transport chain 1 is smaller than the subsidy during centralized, but social welfare is dominant when adopting a decentralized strategy. Proposition 4 was then obtained.
Proposition 4. When the two transport chains adopt a decentralized strategy, the local government has fewer subsidies for the transport chain and the social welfare of the decentralized strategy is greater than that of the centralization, i.e., .
We considered the marine emissions under different strategy choices, the total emission relationship between the two transport chains under decentralization and centralization is . When the centralized strategy is adopted, the environmental pollution is small and the marine emissions are small. The marine emissions of transport chain 1 are higher than those of transport chain 2.
The important implications of policy from the model are as follows:
(1) Centralized strategy not only can help these two typical transportation routes to maximize their profits, but also promote more coal resources to be transported to Nanning Port by Pinglu Canal.
(2) Local government subsidies will affect the operation of the two typical transportation routes. In the strategy of centralization, it may be that the local government is in order to enhance the decentralized advantage of the newly opened transport routes, so the local government provides higher subsidies for transport route through Pinglu Canal.
(3) The social welfare of the two typical transportation routes in decentralization is higher than that in centralization. Since the amount of subsidies provided by the local government in the strategy of centralization is higher than that in decentralization, excessive subsidies will reduce social welfare. Therefore, the local government should pay attention to the subsidy intensity when subsidizing the transportation routes through Pinglu Canal.
(4) From the marine emissions of transport routes, the lowest marine emissions under centralization. In the case of decentralization, the total amount of transport between the two transport chains is larger than that in the case of centralization, and the marine emission is also greater than that in the case of centralization.
This paper analyzed and compared two typical transportation routes under the case of Pinglu from the port of Jakarta in Indonesia to the port of Nanning in China, taking into account the local government subsidies, environmental costs, marine emissions and other critical factors. The profits, marine emissions and social welfare of the two transport chains were also analyzed. The results showed that in the strategy of centralization between the two transport chains, the volume of goods transported through Pinglu Canal will increase, thereby increasing the corresponding profits.
To conduct a further comprehensive analysis the opening effects of Pinglu Canal, it would be meaningful to explore the different transport modes and marine emission regulations in subsequent studies.
The original contributions presented in the study are included in the article/supplementary material. Further inquiries can be directed to the corresponding author.
XL: Writing – review & editing. YL: Writing – original draft. SW: Writing – original draft. GD: Writing – review & editing.
The author(s) declare financial support was received for the research, authorship, and/or publication of this article. This work was supported by Humanities and Social Sciences Fund of Ministry of Education of China [grant number 22YJA630013].
The authors declare that the research was conducted in the absence of any commercial or financial relationships that could be construed as a potential conflict of interest.
All claims expressed in this article are solely those of the authors and do not necessarily represent those of their affiliated organizations, or those of the publisher, the editors and the reviewers. Any product that may be evaluated in this article, or claim that may be made by its manufacturer, is not guaranteed or endorsed by the publisher.
Agarwal R., Ergun Ö. (2008). Ship scheduling and network design for cargo routing in liner shipping. Transportation Sci. 42 (2), 175–196. doi: 10.1287/trsc.1070.0205
Dai L., Jing D., Hu H., Wang Z. J. (2021). An environmental and techno-economic analysis of transporting LNG via Arctic route. Transportation Res. Part A: Policy Pract. 146, 56–71. doi: 10.1016/j.tra.2021.02.005
D’Alfonso T., Jiang C., Bracaglia V. (2015). Would competition between air transport and high-speed rail benefit environment and social welfare? Transportation Res. Part B: Methodological 74, 118–137. doi: 10.1016/j.trb.2015.01.007
D’Alfonso T., Jiang C., Bracaglia V. (2016). Air transport and high-speed rail competition: environmental implications and mitigation strategies. Transportation Res. Part A: Policy Pract. 92, 261–276. doi: 10.1016/j.tra.2016.06.009
Dong G., Huang R. (2022). Inter-port price competition in a multi-port gateway region. Res. Transportation Economics 94, 101178. doi: 10.1016/j.retrec.2022.101178
Dong G., Huang R., Ng P. (2016). Tacit collusion between two terminals of a port. Transportation Res. Part E: Logistics Transportation Rev. 93, 199–211. doi: 10.1016/j.tre.2016.06.001
Dong G., Li J., Lee P. T. W. (2021). Vertical collusion in the shipping container transport chain over the deregulation tariff of port authority. Appl. Economics 54 (20), 2275–2287. doi: 10.1080/00036846.2021.1987379
Gao W. C., Guo W. Y., Zhou S., Wu S. H., Yang Z. Z. (2023). The evolution of the relationship among stakeholders in port integration: Evidence from tripartite evolutionary game analysis. Ocean Coast. Manage. 240, 106628. doi: 10.1016/j.ocecoaman.2023.106628
Gong X., Li Z. C. (2022). Determination of subsidy and emission control coverage under competition and cooperation of China-Europe Railway Express and liner shipping. Transport Policy 125, 323–335. doi: 10.1016/j.tranpol.2022.06.011
Hsu C. I., Hsieh Y. P. (2007). Routing, ship size, and sailing frequency decision-making for a maritime hub-and-spoke container network. Math. Comput. Model. 45 (7-8), 899–916. doi: 10.1016/j.mcm.2006.08.012
Hu Q., Gu W., Wang S. (2022). Optimal subsidy scheme design for promoting intermodal freight transport. Transportation Res. Part E: Logistics Transportation Rev. 157, 102561. doi: 10.1016/j.tre.2021.102561
Jeevan J., Ghaderi H., Bandara Y. M., Saharuddin A. H., Othman M. R. (2015). The implications of the growth of port throughput on the port capacity: The case of Malaysian major container seaports. Int. J. e-Navigation Maritime Economy 3, 84–98. doi: 10.1016/j.enavi.2015.12.008
Jiang C., Wang C. (2021). High-speed rail pricing: implications for social welfare. Transportation Res. Part E: Logistics Transportation Rev. 155, 1366–5545. doi: 10.1016/j.tre.2021.102484
Jiang L., Wang J., Jiang H., Feng X. J. (2019). Prediction model of port throughput based on game theory and multimedia Bayesian regression. Multimedia Tools Appl. 78, 4397–4416. doi: 10.1007/s11042-018-5766-2
Lai X., Wu L., Wang K., Wang F. (2022). Robust ship fleet deployment with shipping revenue management. Transportation Res. Part B: Methodological 161, 169–196. doi: 10.1016/j.trb.2022.05.005
Lasserre F. (2014). Case studies of shipping along Arctic routes. Analysis and profitability perspectives for the container sector. Transportation Res. Part A: Policy Pract. 66, 144–161. doi: 10.1016/j.tra.2014.05.005
Li F., Wang S., Weng J. X. (2019). Ship routing and scheduling problem for steel plants cluster alongside the Yangtze River. Transportation Res. Part E: Logistics Transportation Rev. 122, 198–210. doi: 10.1016/j.tre.2018.12.001
Ma Y., Johnson D., Wang J. Y. T., Shi X. (2021). Competition for rail transport services in duopoly market: case study of China railway (CR) express in chengdu and chongqing. Res. Transportation Business Manage. 38, 100529. doi: 10.1016/j.rtbm.2020.100529
Medina J., Kim J. H., Lee E. S. (2020). A preliminary analysis of US import volumes and regional effects associated with the Panama Canal expansion. Res. Transportation Economics 84, 100969. doi: 10.1016/j.retrec.2020.100969
Melia N., Haines K., Hawkins E. (2016). Sea ice decline and 21st century trans-Arctic shipping routes. Geophysical Res. Lett. 43 (18), 9720–9728. doi: 10.1002/2016GL069315
Moradi M. H., Brutsche M., Wenig M., Wagner U., Koch T. (2022). Marine route optimization using reinforcement learning approach to reduce fuel consumption and consequently minimize CO2 emissions. Ocean opening 259, 111882. doi: 10.1016/j.oceaneng.2022.111882
Notteboom T. E., Vernimmen B. (2009). The effect of high fuel costs on liner service configuration in container shipping. J. Transport Geogr. 17 (5), 325–337. doi: 10.1016/j.jtrangeo.2008.05.003
Peng W., Bai X., Yang D., Yuen K. F., Wu J. (2023). A deep learning approach for port congestion estimation and prediction. Maritime Policy Manage. 50 (7), 835–860. doi: 10.1080/03088839.2022.2057608
Sheng D., Li Z. C., Fu X. W., David G. (2017). Modeling the effects of unilateral and uniform emission regulations under shipping company and port competition. Transportation Res. Part E: Logistics Transportation Rev. 101, 99–114. doi: 10.1016/j.tre.2017.03.004
Singh N., Vives X. (1984). Price and quantity competition in a differentiated duopoly. RAND J. Economics 15 (4), 546–554. doi: 10.2307/2555525
Song D. P., Lyons A., Li D., Sharifi H. (2016). Modeling port competition from a transport chain perspective. Transportation Res. Part E: Logistics Transportation Rev. 87, 75–96. doi: 10.1016/j.tre.2016.01.001
Talley W. K. (2014). Maritime transport chains: carrier, port and shipper choice effects. International. J. Production Economics 151, 174–179. doi: 10.1016/j.ijpe.2013.10.009
UNCTD (2022). Review of maritime transport (Switzerland: United Nations: New York, NY, USA; Geneva: United Nations Conference on Trade and Development).
Wang C., Jiang C., Zhang A. (2021). Effects of airline entry on high-speed rail. Transportation Res. Part B: Methodological 154, 242–265. doi: 10.1016/j.trb.2021.10.004
Wang X. F., Liang S., Liao Z. J. (2022). Integration, game, and sustainable development of shenzhen port based on governmental regulations. J. Math. 2022, 2583027. doi: 10.1155/2022/2583027
Wang N., Yan B., Wu D., Wu N. (2017). Spatial-temporal pattern of China-Europe shipping routes under the background of Arctic navigation. Economic Geogr. 37 (12), 9–16.
Yin C., Lu Y., Xu X., Tao. X. (2020). Railway freight subsidy mechanism based on multimodal transportation. Transportation Lett. 13 (10), 716–727. doi: 10.1080/19427867.2020.1791507
Yuan K. B., Wang X. F. (2022). Port competition and cooperation under emission and privatization. Transportation Res. Rec. 2677 (5), 1046–1061. doi: 10.1177/03611981221138783
Zeng Q., Wang G. W. Y., Qu C., Li X. K. (2018). Impact of the Carat Canal on the evolution of hub ports under China’s Belt and Road initiative. Transportation Res. Part E: Logistics Transportation Rev. 117, 96–107. doi: 10.1016/j.tre.2017.05.009
Zhang M., Xu M. (2021). Co-opetition relationship analysis of China railway express considering government subsidy strategy. J. Transportation Syst. opening Inf. Technol. 21 (2), 16–29.
Zhang Y., Zhang A., Wang K., Zheng S. Y., Yang H. J., Hong J. J. (2023). Impact of CR Express and intermodal freight transport competition on China-Europe Route: Emission and welfare implications. Transportation Res. Part A: Policy Pract. 171, 103642. doi: 10.1016/j.tra.2023.103642
Keywords: Pinglu Canal, marine emissions, game theory, strategy optimization, social welfare, environmental cost
Citation: Liu X, Liu Y, Wang S and Dong G (2024) New canal construction and marine emissions strategy: a case of Pinglu. Front. Mar. Sci. 10:1303879. doi: 10.3389/fmars.2023.1303879
Received: 28 September 2023; Accepted: 12 December 2023;
Published: 05 January 2024.
Edited by:
Erik Ytreberg, Chalmers University of Technology, SwedenReviewed by:
Qingji Zhou, Tianjin University, ChinaCopyright © 2024 Liu, Liu, Wang and Dong. This is an open-access article distributed under the terms of the Creative Commons Attribution License (CC BY). The use, distribution or reproduction in other forums is permitted, provided the original author(s) and the copyright owner(s) are credited and that the original publication in this journal is cited, in accordance with accepted academic practice. No use, distribution or reproduction is permitted which does not comply with these terms.
*Correspondence: Gang Dong, Z2FuZ2RvbmdAc2htdHUuZWR1LmNu
Disclaimer: All claims expressed in this article are solely those of the authors and do not necessarily represent those of their affiliated organizations, or those of the publisher, the editors and the reviewers. Any product that may be evaluated in this article or claim that may be made by its manufacturer is not guaranteed or endorsed by the publisher.
Research integrity at Frontiers
Learn more about the work of our research integrity team to safeguard the quality of each article we publish.