 Yilun Tian1
 Juncheng Zuo2
 Yeqiang Shu3
 Qiang Wang3*Yi Xie3
 Qiyan Ji1Xing Liu4Zhizu Wang4
 You Wu1Yuting Zhang1
- 1College of Marine Science and Technology, Zhejiang Ocean University, Zhoushan, China
- 2College of Marine Sciences, Shanghai Ocean University, Shanghai, China
- 3State Key Laboratory of Tropical Oceanography, South China Sea Institute of Oceanology, Chinese Academy of Sciences, Guangzhou, China
- 4Research Center for Monitoring and Environmental Sciences, Taihu Basin & East China Sea Ecological Environment Supervision and Administration Authority, Ministry of Ecology and Environment, Shanghai, China
The characteristics and mechanism of the southern South China Sea (SCS) Western Boundary Current (WBC) summer-winter transition have been investigated. The transition typically starts in early October and lasts for about two weeks. Above the thermoclines (~100 m), the transition is simultaneous with depth, while below the thermoclines the transition in deeper layer significant lags that in the shallow layers. The geostrophic balance dominates the transition of WBC. Above the thermocline, the transition is determined by the barotropic pressure gradient component. Below the thermocline, the transition is determined by the competition between the barotropic and baroclinic pressures components. When the southern SCS WBC transition above the thermocline starts, the barotropic and baroclinic pressures components offset each other below the thermocline, resulting in the lag of the geostrophic balance. With the depth increases, more time is needed for the barotropic pressures component to enhance enough to dominate a geostrophic balance, which induces the transition lag with depth. Changes in the barotropic pressure gradient component are mainly due to the variations in SCS basin scale wind stress curl, while changes in the baroclinic pressure gradient component below the thermocline are associated with the warming of the deeper water column caused by the downwelling near the continental slope and the disappearing of upwelling off Vietnam.
1 Introduction
The South China Sea (SCS) is a semi-enclosed marginal sea located in Southeast Asia with a northeast-southwest orientation. It connects to neighboring seas through several straits, including the Luzon Strait, the Karimata Strait, the Taiwan Strait, and the Mindoro Strait (Wyrtki, 1961). The upper-layer circulation within the SCS is primarily influenced by the monsoon and the exchange of water between the SCS and its neighboring seas (Qu, 2000; Jilan, 2004). During summer, the SCS circulation exhibits a cyclonic pattern in the north and an anticyclonic pattern in the south. In contrast, a basin-scale cyclonic circulation appears in winter (Shaw and Chao, 1994; Liu et al., 2001; Wang et al., 2003; Gan et al., 2016). In addition, the monsoon plays a significant role in enhancing the West Boundary Current (WBC) along the continental slope at the western boundary of the SCS basin (Qu et al., 2005; Wang et al., 2013; Chen and Xue, 2014). The SCS WBC is a critical component of the SCS circulation system, influencing the vertical water column structure and heat flux in the SCS. Consequently, the processes and physical mechanisms governing its changes have garnered substantial attention (Cai et al., 2003; Liu et al., 2008; Hu et al., 2011; Wang et al., 2019).
The WBC exhibits variations on multiple time scales and displays a distinctive seasonal reversibility pattern (Dale, 1956; Wyrtki, 1961; Fang et al., 2012). Seasonal variations in the SCS WBC primarily result from the combined influences of wind stress and intensified Luzon Strait Transport (LST) (Hu et al., 2000; Xue et al., 2004; Gan et al., 2006). During the summer season, driven by the synergistic effects of the southwest monsoon and the beta effect, the WBC experiences a northward flow, giving rise to a summer eastward jet (SEJ) along the Vietnamese coastline (Chu et al., 1999; Cai et al., 2005; Ngo and Hsin, 2021). Consequently, a dipole structure forms, effectively impeding further northward WBC progression (Wang et al., 2006b; Liu et al., 2008). Conversely, during the winter season, the SEJ and its associated dipole structure dissipate due to the influence of the northeast monsoon, leading to intensified transport through the LST (Chern et al., 2010; Qiu et al., 2019). The WBC subsequently alters its course, flowing southward along the Vietnamese coastline. Part of this flow enters the southern SCS, forming a cyclonic circulation, while the remaining portion moves toward the continental shelf of the Sunda Islands (Cai et al., 2002; Zheng et al., 2006; Gan et al., 2016).
The WBC also exhibits interannual-scale variability due to combined influences on the heat flux and surface circulation in the SCS (Fang et al., 2006; Chang et al., 2008; Shu et al., 2016; Xiao et al., 2022). In the southern SCS, El Niño events and local wind stress curl jointly regulate the interannual variability of the WBC (Chao et al., 1996; Wang et al., 2006a; Zu et al., 2019). During El Niño events, the WBC experiences significant weakening, as observed during the robust El Niño event in 2015/2016, coinciding with the historical weakest state of the SCS WBC (Zhao and Zhu, 2016; Da et al., 2019). The SEJ indirectly impacts the WBC (Xie et al., 2003; Li et al., 2014). The negative wind stress curl, governed by the Sverdrup equilibrium, controls SEJ transport, leading to interannual synchronized variations in the SEJ and the southern SCS WBC (Chen and Wang, 2014; Sun and Lan, 2021). Previous studies have indicated a positive correlation between changes in LST and the interannual variability of the northern SCS WBC. The SCS WBC strengthens as LST gradually intensifies and vice versa (Zu et al., 2019; Wang et al., 2023). The inverse correlation between the SEJ and the northern WBC on interannual scales underscores the critical contribution of LST, and quantitative vorticity estimates suggest that LST is as influential as the monsoon (Zu et al., 2020).
Previous studies have primarily examined the characteristics of the WBC in different seasons. Xie et al. (2022) analyzed the dynamics and physical mechanisms of the winter-summer transition of the SCS WBC using the momentum equation. However, the transition from summer to winter remains poorly understood, necessitating further investigations. This study addresses this knowledge gap by analyzing the spatial and temporal variations, depth structure, and physical mechanisms of the southern SCS WBC to advance our understanding. This research contributes to a better comprehension of energy and heat fluxes within SCS waters (Qu et al., 2004; Chen et al., 2014; Shu et al., 2018; Wang et al., 2021; Luo et al., 2022; Liu et al., 2023) and supports improved marine resource management and ecosystem preservation (Ning et al., 2004; Hein et al., 2013; Lu et al., 2018; Ding et al., 2022).
Noteworthy variations revealed by HYCOM data within the Southern WBC (Figure 1) during the transition from summer to winter will be investigated in this study to understand the dynamic processes and physical mechanisms of the Southern WBC. Section 2 introduces the data and experimental methods used, Section 3 presents the transition phenomena and results of the momentum equation analysis, while Section 4 offers a discussion and Section5 gives a conclusion regarding the transition.
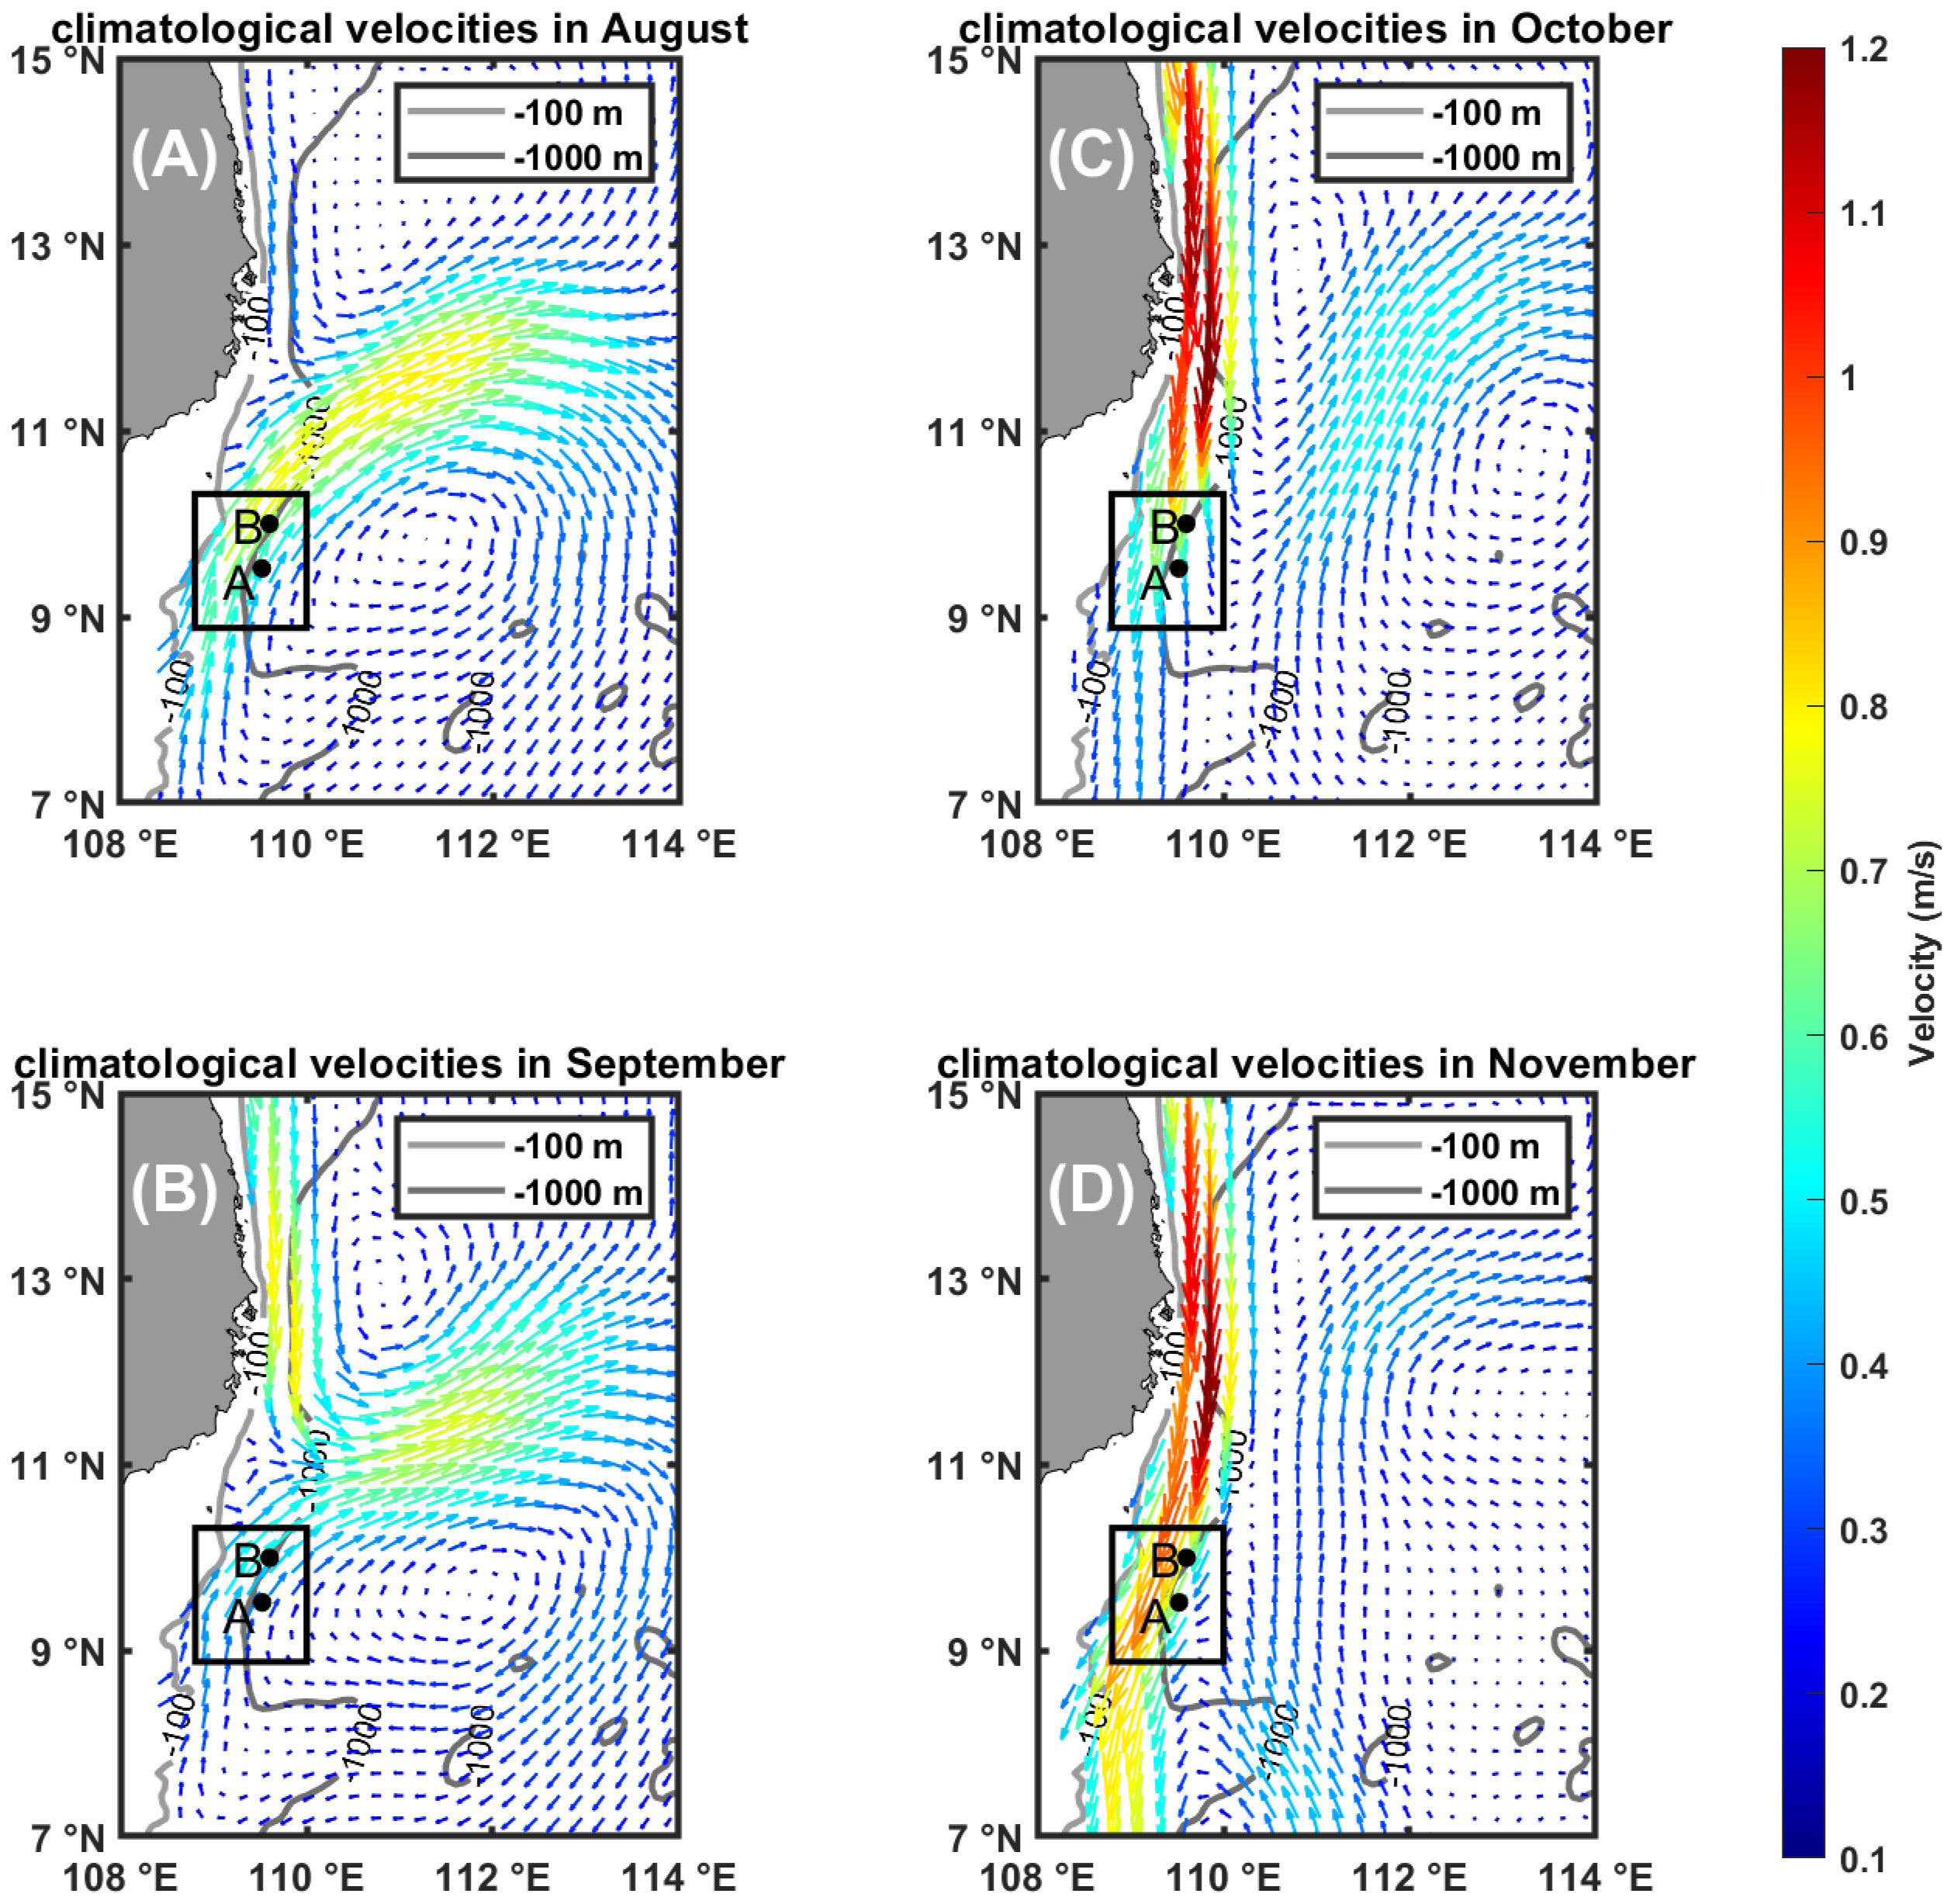
Figure 1 Flow field averaged between 0 and 100 m in August (A), September (B), October (C), and November (D) from HYCOM data. The color of arrows represents the velocities of currents, and the solid lines represent the 100 m and 1000 m isobaths, respectively. The black box in the figure shows the typical area of the southern WBC, and the black dots represent the two typical sites A and B in the area.
2 Data and method
2.1 Data
The Hybrid Coordinate Ocean Model [HYCOM; Cummings and Smedstad (2013)] analysis product is used for investigating the southern SCS WBC transition from summer to winter. HYCOM possess a horizontal grid spacing of 1/12° x 1/12° and 30 vertical layers. For the purposes of this study, the period spanning from 1993 to 2016 has been selected due to data availability and relevance.
Sea surface height (SSH) and associated geostrophic current with spatial resolution of 0.25° × 0.25° from 1993 to 2016 from Archiving, Validation and Interpretation of Satellite Oceanographic Data (Ducet et al., 2000) are used in the study.
The area where the winter and summer flow axes overlap for the southern WBC region was selected in this study (Figure 1), and chose two representative stations close to the flow axis at depths deeper than 300 m were chosen. For Station A and Station B, B fits better than A, while the deviation is slightly larger for Station A. For all stations the velocities of HYCOM performs smaller than that of AVISO in November. To explain the reasons of the different transition in the depth, the ocean has been divided into two layers: above the thermoclines (0-100 m) and below the thermoclines (100-300 m).
The surface meridional velocities of currents were compared with the AVISO data and HYCOM data which taking the 0-100 m vertical averaged (Figures 2A-C). The above summer-winter southern SCS WBC transition process has also been present by both of the HYCOM and AVISO meridional velocity series at the selected WBC stations. The close proximity of AVISO and HYCOM velocities from the Box verifies the availability of the HYCOM data and the fact that the transformation process in the 0-100 m layer is almost identical to that in the surface layer. Previous studies have also shown that HYCOM’s data in the SCS is reliable (Gordon et al., 2012; Xie et al., 2022; Zhu et al., 2022).
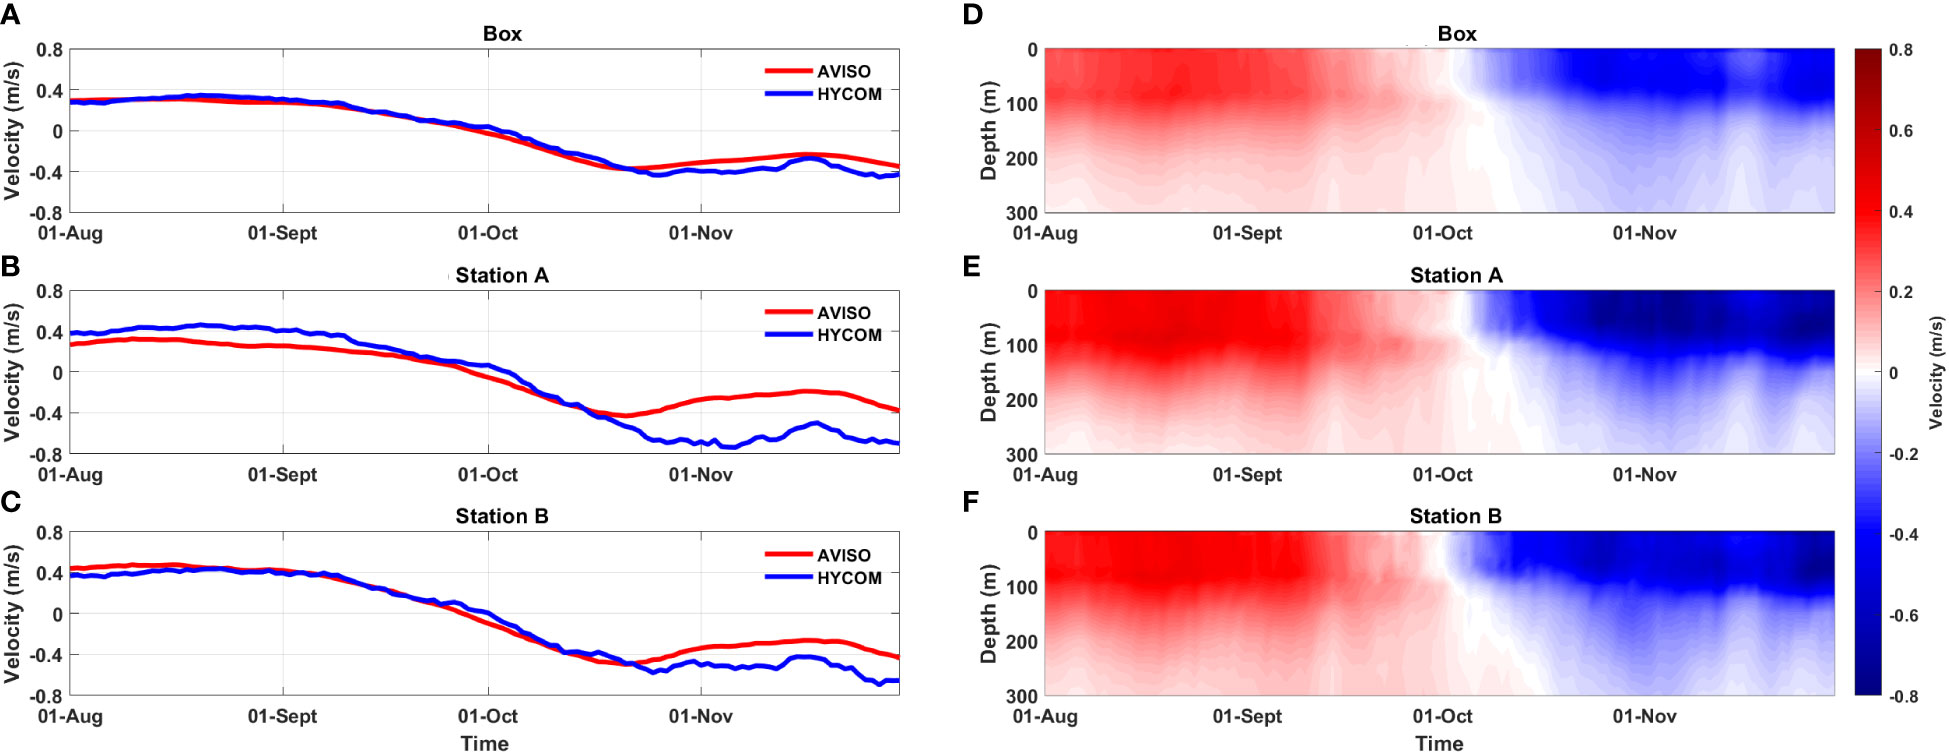
Figure 2 Left panel: the comparison of meridional flow velocities of AVISO and HYCOM 0-100 m vertical averaged for the Box (A), Station A (B) and Station B (C) in the southern WBC of SCS, AVISO in red and HYCOM in blue. Right panel: is the radial flow velocity profiles of HYCOM 0-300 m for the Box (D), Station A (E) and Station B (F).
The 10-meter wind field from the European Centre for Medium-Range Weather Forecasts Reanalysis Interim [ERA-5; Hersbach et al. (2020)] reanalysis products from 1993 to 2016 with spatial resolution of 0.25° × 0.25° is used in the study.
2.2 Methods
To investigate the mechanism of the WBC transition from the summer to winter, momentum balance diagnosis has been utilized(Qiu, 2000; Wang et al., 2010; Liu et al., 2014; Xie et al., 2022):
Term 1) on the left side of equation is the acceleration, and the right-side terms are labeled as 2) advection, 3) Coriolis Force, 4) pressure gradient, 5) horizontal and 6) vertical diffusion, sequentially. The diffusion terms are ignored in the following analysis owing to the lack of diffusion coefficient from HYCOM and its relatively small contribution on the quasi-geostrophic scale (Gan and Qu, 2008).
Further, the pressure gradient can be interpreted in another way (Wang et al., 2015):
Term 1) is the pressure gradient, 2) is the barotropic pressure gradient, and 3) is the baroclinic pressure gradient. Where g is the acceleration of gravity, ρ0 is the mean sea water density (1025kg m-3), η is SSH. Since atmospheric pressure has a tiny effect on the total pressure gradient, it is assumed to remain constant.
The formula (3) for wind stress and formula (4) for wind stress curl used in the paper are as follows (Bakun and Nelson, 1991; Enriquez and Friehe, 1995):
Where τ is the wind stress vector, ρa=1.23kg·m–3 is the mean air density, Cd=1.2x10⁻³ is the dimensionless drag coefficient, |V| is the wind speed and V is the wind vector, respectively.
3 Results
3.1 Summer-winter transition of western boundary current
During August to November, the summer-winter southern SCS WBC transition occurs (Figure 1). In August, a strong SEJ still dominates the southern SCS, while its northern side has been replaced by southward WBC gradually (Figure 1A). In September, the SEJ weakened as the northeast monsoon emerged, leading to the rapid development of the northern WBC (Figure 1B). By October, the SEJ fractured at its root, while the WBC extended to the south of Vietnam (Figure 1C). In November, the WBC extended to cover the entire SCS basin, coinciding with the complete disappearance of the SEJ (Figure 1D). Unlike the gradual transition of the spring WBC (Xie et al., 2022), the transition from summer to winter developed remarkably rapid.
Its transition starts in early October. During its transition, the start time is significantly different above and below the thermocline (Figures 2D-F). Above the thermocline, the transition behaves consistently in depth. Below the thermocline, the transition in the deeper layer significantly lags that in the shallower layer.
3.2 Momentum balance
Momentum equation terms at station B have been shown in Figure 3, which behaves similar to other regions (i.e., station A and the box). To more effectively depict the seasonal transition process of the southern SCS WBC, the zonal-meridional coordinates were transformed into principal axis coordinates (Xm direction and Ym direction) for the mean velocity variance.
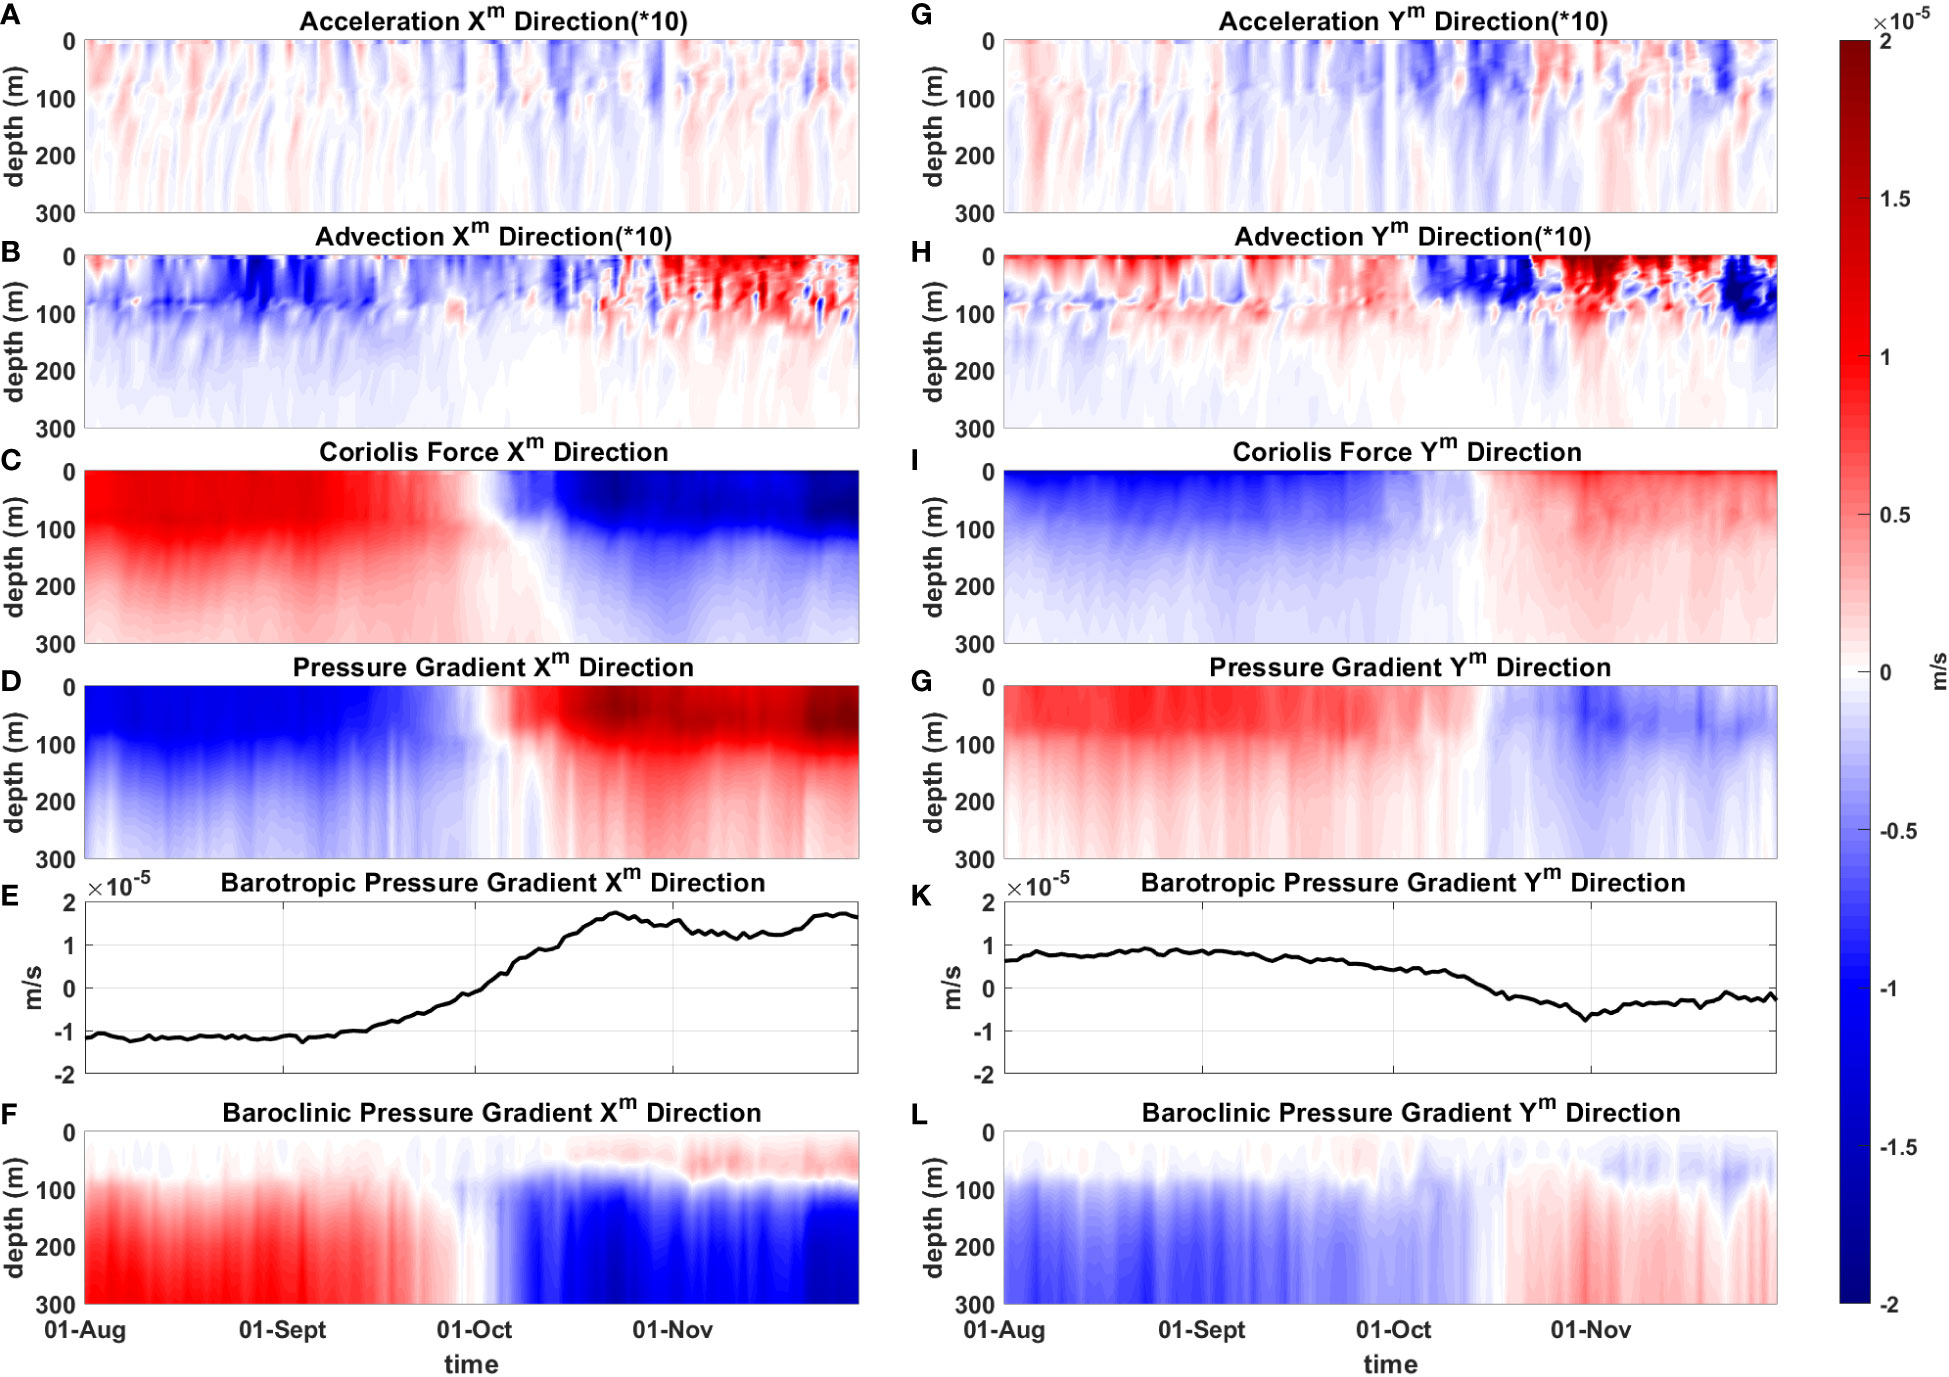
Figure 3 Momentum analysis results for Station B. The left panel is in the Xm direction and the right panel is in the Ym direction. From top to bottom are acceleration term (A), (G), advection term (B), (H), Coriolis force term (C), (I), pressure gradient term (D), (J), barotropic pressure gradient term (E), (K), and baroclinic pressure gradient term (F), (L), with acceleration and advection multiplied by 10.
The results confirm that the geostrophic equilibrium dominates the summer-winter WBC transition. At the beginning of October, the acceleration is negative in Xm direction, which provides a good condition for the transition of WBC (Figure 3A), while the acceleration in the Ym direction is also negative, illustrating that the WBC is diminishing and finally flowing southward (Figure 3G).
From the changes in the Coriolis force and pressure gradient, it is evident that the transition above the thermocline occurs at the same time, and the transition below the thermocline lags behind that above the thermocline, showing that the time of the shallow-to-deep transition is constantly moving backward (Figures 3C, D).
The barotropic pressure gradient dominates the transition above the thermocline, which triggers the consistent transition in depth (Figures 3D, E, J, K). Below the thermocline, the contribution of baroclinic component to the pressure gradient increase with depth (Figures 3D, F, J, L). At the beginning of the barotropic pressure gradient transition, its amplitude is equivalent to the baroclinic component. Therefore, time is needed for the barotropic component to grow large enough to overcome the baroclinic component and dominate the geostrophic equilibrium balance below the thermocline, which induces different transition in the depth.
To further investigate the distinct transitions above and below the thermocline, we have plotted the time series of the vertical integration of the Coriolis force, pressure gradient, and wind stress acting above the thermocline for both water layers (Figure 4). The Coriolis force and pressure gradient exhibit an inverse relationship in maintaining equilibrium, albeit with more pronounced fluctuations in the pressure gradient. The point of intersection between these two terms indicates the timing of the transition in the respective layer. Notably, in both the Xm and Ym directions, the transition below the thermocline occurs later than that above the thermocline, confirming a delay of approximately two weeks in the below-the-thermocline transition. Furthermore, the influence of local wind stress lags behind the transition above the thermocline, suggesting that local wind stress does not play a dominant role in the WBC transition (Figures 4A, C).
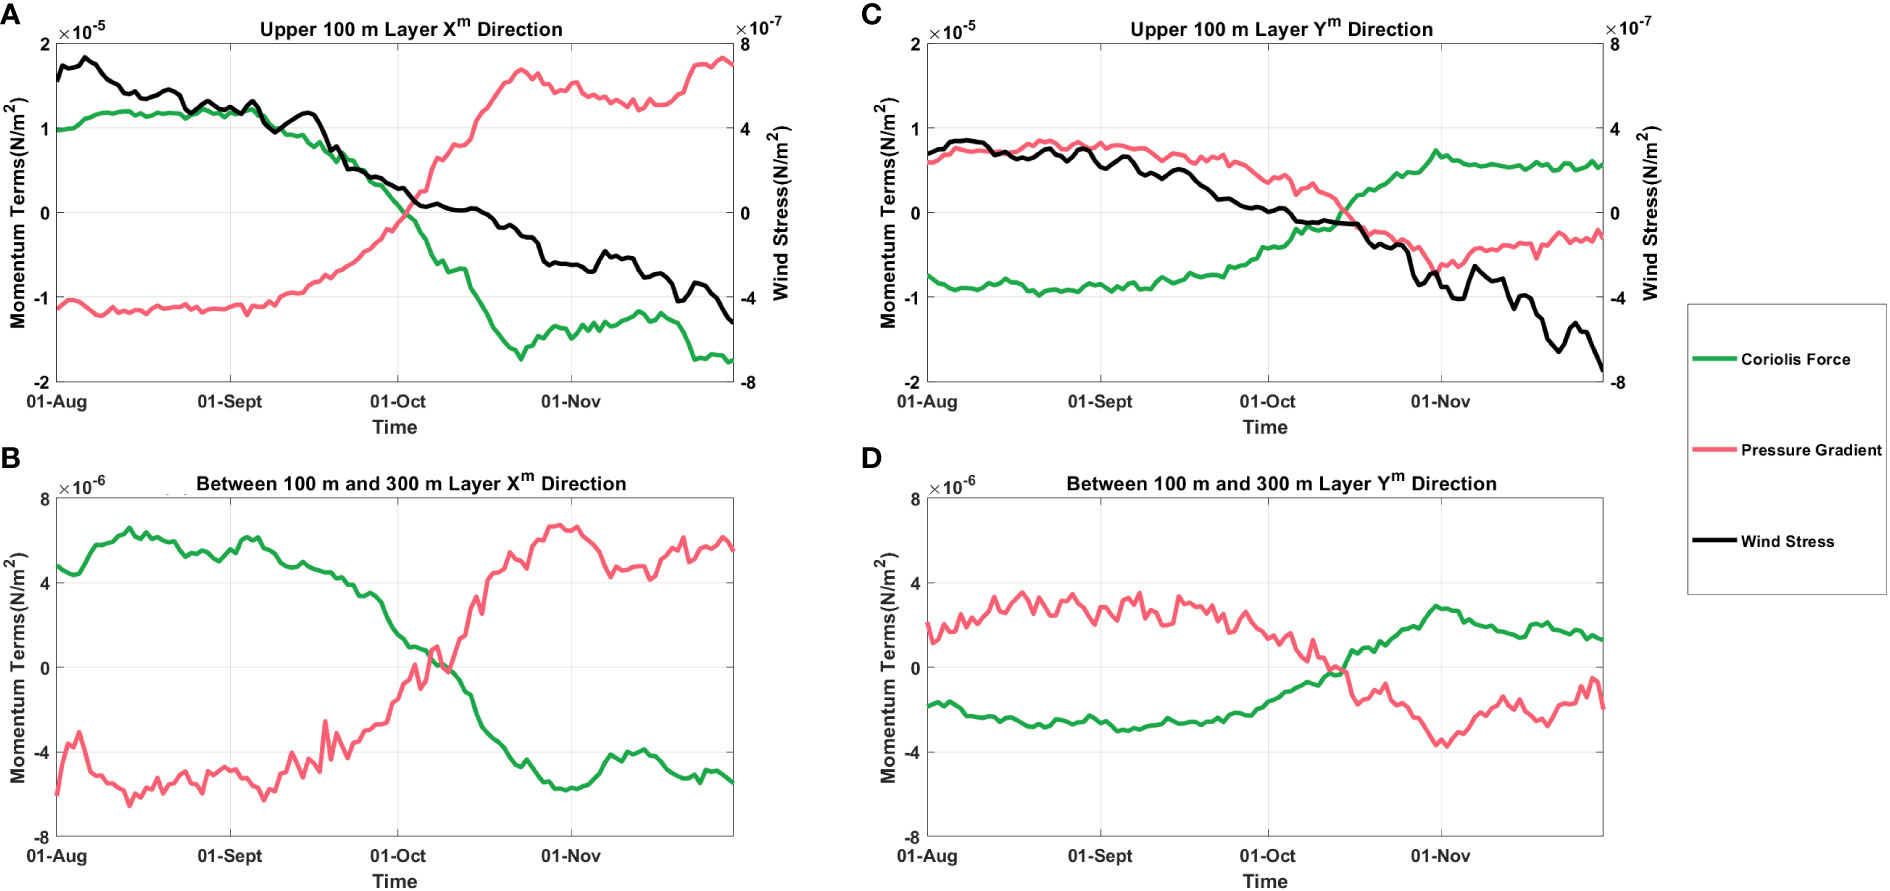
Figure 4 Time series of momentum analysis for Station B. (A) above the thermocline in Xm direction (B) below the thermocline in Xm direction (C) above the thermocline in Ym direction (D) below the thermocline in Ym direction. The green solid line in the figure represents the Coriolis force, the red solid line represents the pressure gradient, and the black solid line is the wind stress.
To solid our understanding of pressure gradient variations above and below the thermocline, we have plotted time series data for each component of the pressure gradients in the Xm and Ym directions at Station B (Figure 5). Above the thermocline, where the baroclinic pressure gradient has not yet gained sufficient strength, the barotropic pressure gradient predominantly influences the overall pressure gradient trend (Figures 5A, C), resulting in nearly identical profiles. Consequently, the Coriolis force and the pressure gradient above the thermocline both deviate simultaneously when the barotropic pressure gradient crosses the zero point. This signifies that the diversion of the WBC above the thermocline is primarily driven by the barotropic pressure gradient (Figures 3C, D, I, J). In contrast, below the thermocline, the baroclinic pressure gradient significantly intensifies, leading to a competition between the baroclinic and barotropic pressure gradients in steering the flow (Figures 5B, D, 3F, L). Below the thermocline, the barotropic pressure transitions from negative to positive before the pressure gradient. This occurs because the baroclinic pressure gradient and the barotropic pressure gradient reach an impasse until the barotropic pressure gradient surpasses the baroclinic pressure gradient in strength, gaining the upper hand in the competition, and subsequently, the pressure gradient undergoes diversion. Notably, both the pressure gradient and the barotropic pressure gradient cross the zero point above the thermocline almost simultaneously.
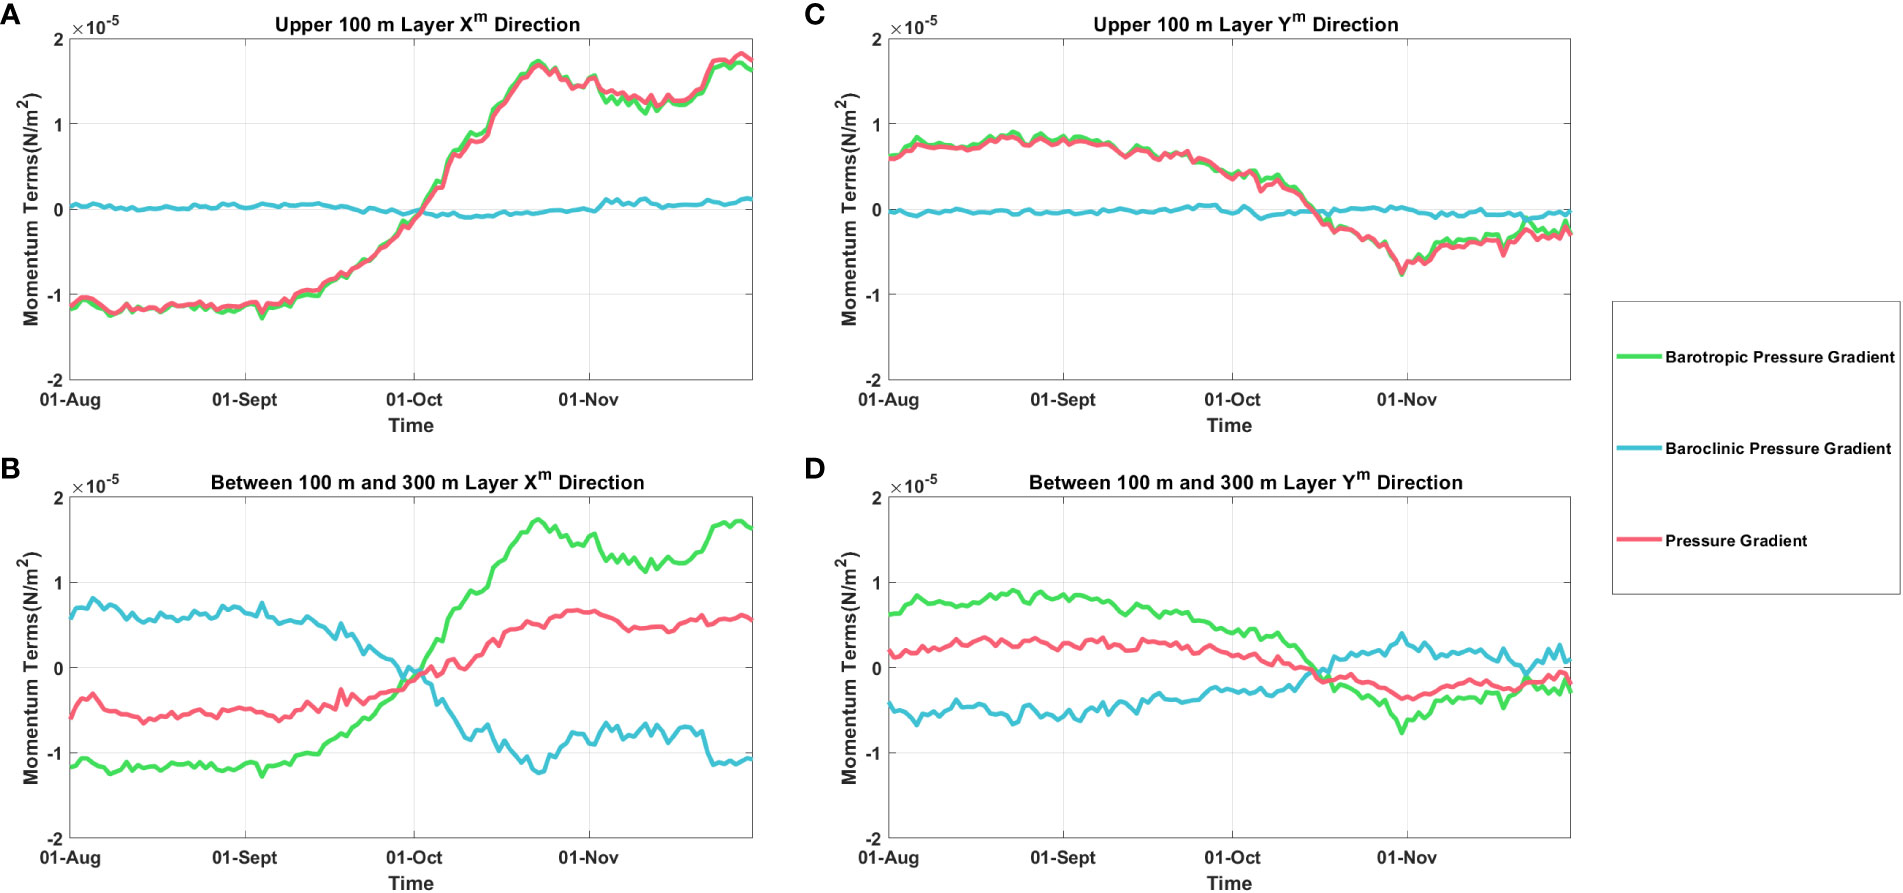
Figure 5 Time series of every components of the pressure gradient at Station B. (A) above the thermocline in Xm direction (B) below the thermocline in Xm direction (C) above the thermocline in Ym direction (D) below the thermocline in Ym direction. The green line represents the barotropic pressure gradient, the blue line represents the baroclinic pressure gradient, and the red line represents the pressure gradient.
4 Discussion
4.1 Dynamic factors above the thermocline
The large scale circulation of SCS is primarily governed by Sverdrup equilibrium, which is driven by wind stress curl (Sun and Lan, 2021). This relationship is clearly demonstrated in Figure 6, where a strong correlation exists between the barotropic pressure gradient of the southern WBC and the wind stress curl in the southern basin of the SCS (Figure 6A). During August, when the wind stress curl is predominantly negative, the barotropic pressure gradient also exhibits a negative trend (Figure 6B). Conversely, in November, when the wind stress curl becomes predominantly positive, the barotropic pressure gradient follows (Figure 6C). The change in wind stress curl from negative to positive is subsequently mirrored by a shift in the southern WBC. Notably, the transition in wind stress curl occurring before October precedes the southern WBC transition, providing evidence of a positive correlation between wind stress curl and the steering of the southern WBC above the thermocline in the southern SCS basin.
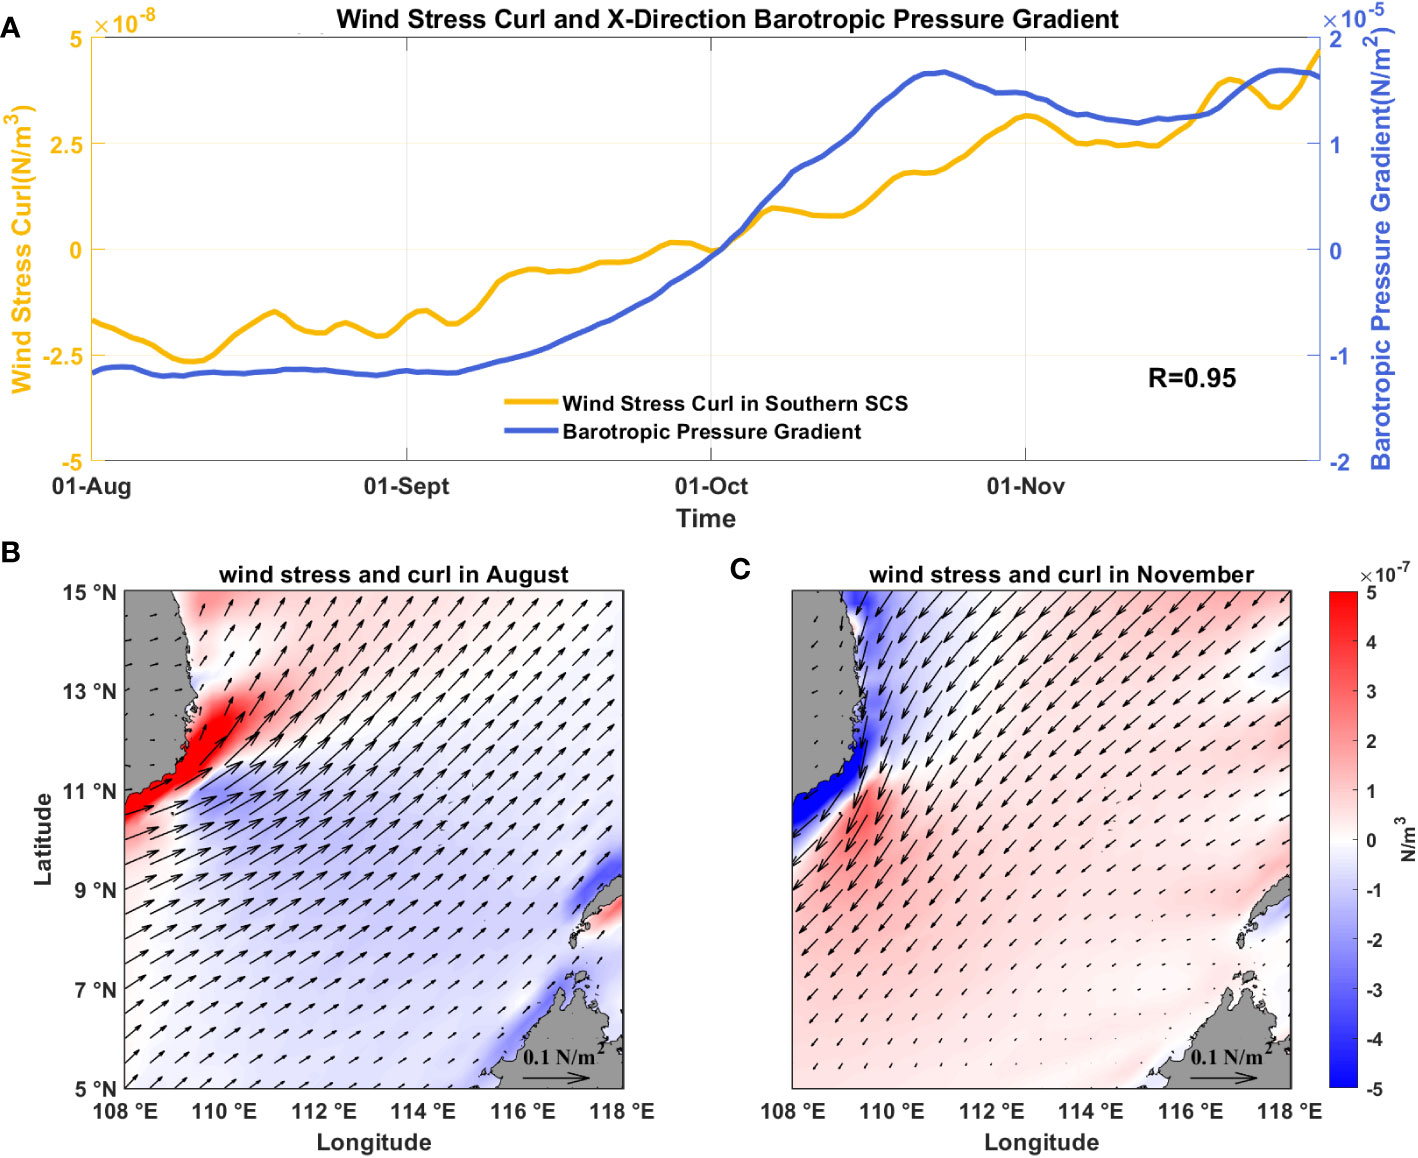
Figure 6 (A) The time series of the mean wind stress curl averaged within the black box marked in Figure 1 and X-direction barotropic pressure gradient of Station B. (B, C) are the climatological wind stress and curl in August and November, respectively. Vectors represent wind stress and colors represent its curl.
4.2 Dynamic factors below the thermocline
The baroclinic pressure gradient exhibited a strong positive correlation with the temperature gradient but a negative correlation with the salinity gradient (Figure 7A). This suggests that variations in the baroclinic pressure gradient are primarily driven by temperature changes, while salinity has a small impact. Subsequently, we calculated the baroclinic pressure gradient with temperature and salinity set as constants—temperature at 35°C and salinity at 32 psu (Figure 7B). Our analysis found that both sets of experimental results closely matched the actual baroclinic pressure gradient trends. Notably, keeping temperature constant had little effect on the gradient, while maintaining constant salinity resulted in significant gradient variations. This observation highlights that temperature fluctuations play a significant role in driving changes in the baroclinic pressure gradient.
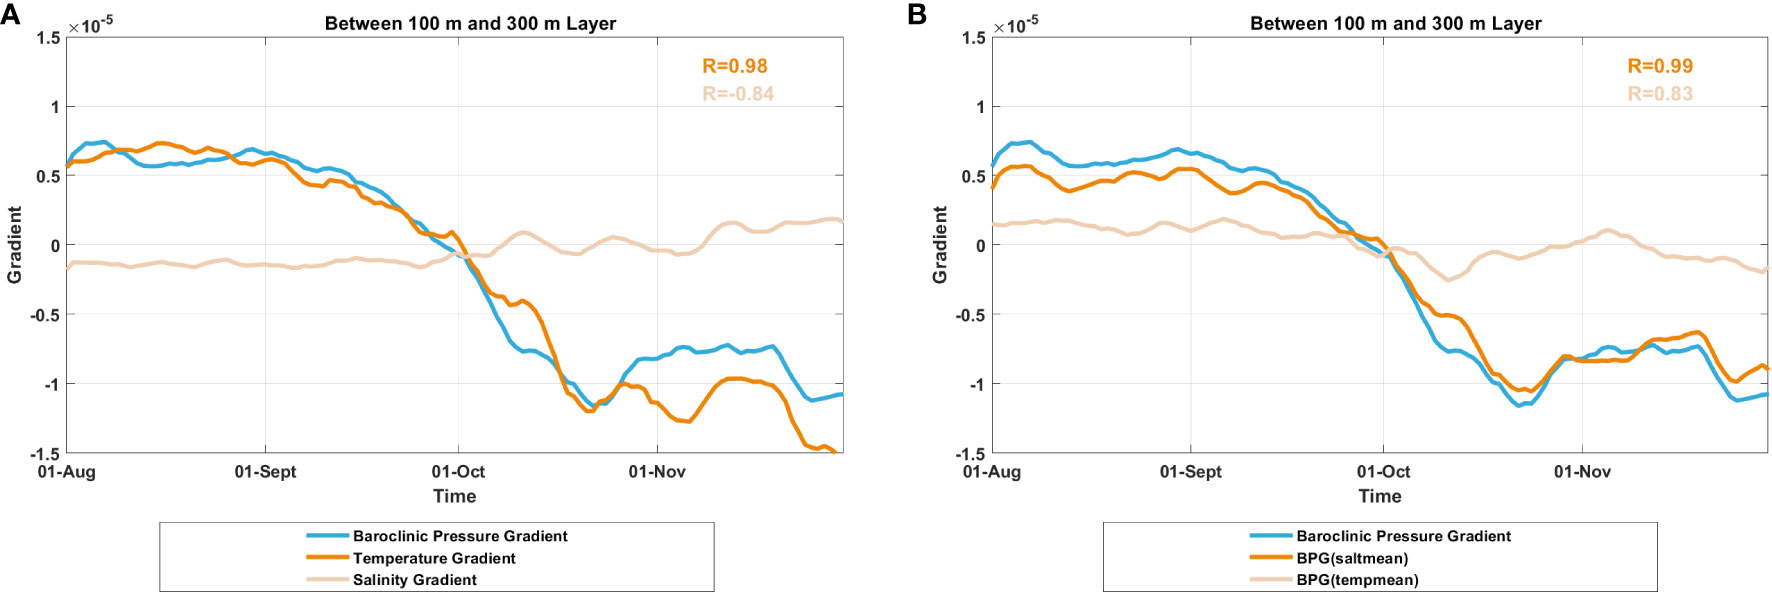
Figure 7 (A) Time series of temperature gradient, salinity gradient, and baroclinic pressure gradient. The dark (light) yellow R represents the correlation coefficient between the baroclinic pressure gradient and the salinity gradient (temperature gradient). (B) Time series of the Baroclinic Pressure Gradient (BPG) and the BPG when salinity (temperature) are constants. R in dark (light) yellow represents the correlation coefficient between the BPG and the BPG when salinity (temperature) is constant.
Prior to the transition, the temperature within the southern WBC exhibited a consistent pattern characterized by higher temperatures to the south and lower temperatures to the north. This distribution was accompanied by upwelling along the coastal slope near the Vietnamese offshore region. The dense isothermal line corresponded to the location of the SEJ (Figures 8A, B). Following the transition, the concentration of isotherms dissipated, and a cold band extended along 110°E, spanning the western edge of the SCS. This shift indicated that the WBC had completed its turn around southeast Vietnam and was now heading directly southward to 6°N (Figures 8C, D). Accompanying the SCS WBC transition, the water along (outside) the slope warms up (cools down) due to downwelling (upwelling) (Figures 8E, F).
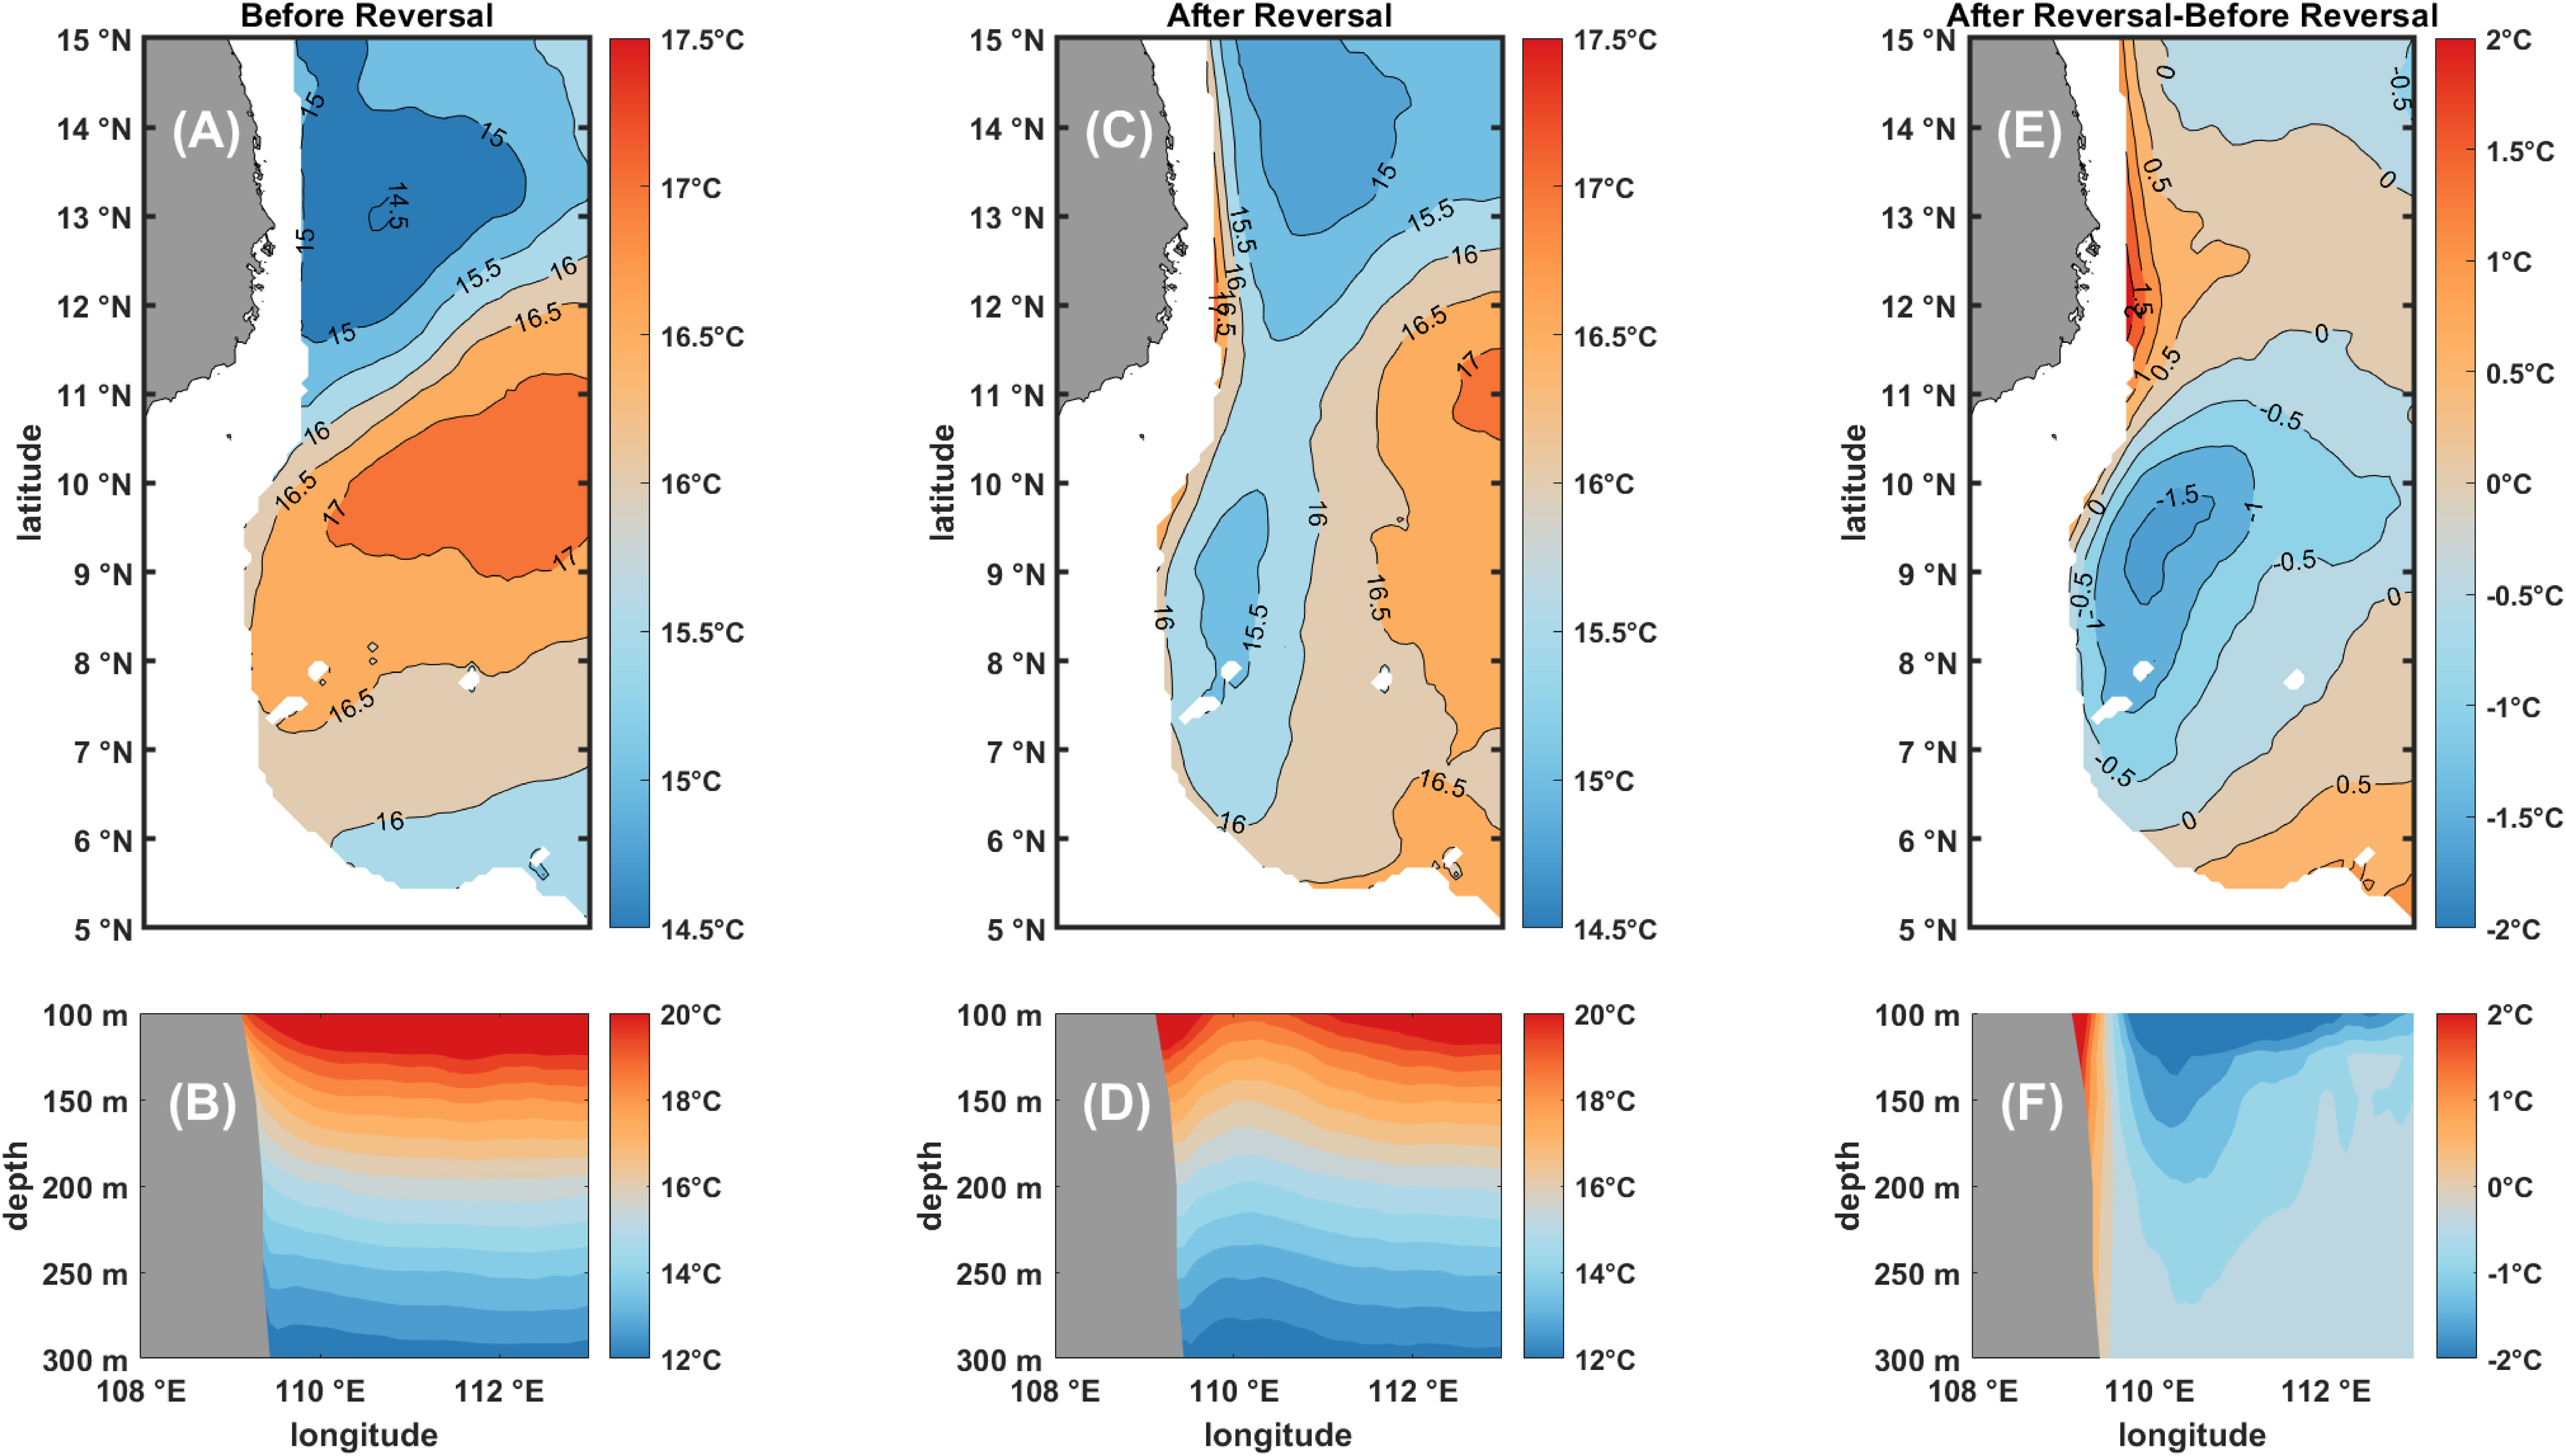
Figure 8 Comparison of vertically averaged (100-300 m) temperatures before and after transition of the southern WBC. The left panel is before the transition, the center panel is after the transition, and the right panel is the temperature difference before and after the transition. (B, D, F) Temperature profiles along the 10°N latitude in the (A, C, E), respectively.
5 Conclusion
Based on HYCOM and AVISO data, the characteristics and physical mechanisms of the southern SCS WBC summer-winter transition are analyzed. The transition begins in early October, and lasts for about two weeks. The transition of the WBC in fall is dominated by the balance between the Coriolis force and the pressure gradient, and the transition process above the thermocline (0-100 m) is rapid, whereas the transition time below the thermocline (100-300 m) lags behind with the increase of the depth.
Above the thermocline, the dominant factor influencing the transition is the barotropic pressure. At the basin scale in the southern SCS, the wind stress curl exhibits an increasing and reversing pattern, and its changes correlate positively with the barotropic pressure gradient. This correlation drives the transition of the WBC from a summer state to a winter state under geostrophic equilibrium.
Below the thermocline, as the depth increases, the baroclinic pressure begins to gradually enhanced, which is equivalent to the barotropic pressure gradient component deepening. The greater the depth, the longer the barotropic needs to be stronger than the baroclinic, which results in a delay in the transition of the WBC below the thermocline compared to above the thermocline. This lag time increases with greater depth. The change of the baroclinic pressure below the thermocline is mainly due to the downwelling along the continental slope east to the Vietnam.
Data availability statement
Publicly available datasets were analyzed in this study. This data can be found here: https://www.hycom.org/; https://www.ecmwf.int/en/forecasts/dataset/ecmwf-reanalysis-v5; https://www.aviso.altimetry.fr/en/home.html.
Author contributions
YT: Writing – original draft. JZ: Formal analysis, Funding acquisition, Writing – review & editing. YS: Methodology, Supervision, Writing – original draft. QW: Methodology, Supervision, Writing – original draft. YX: Data curation, Methodology, Writing – original draft. QJ: Validation, Writing – review & editing. XL: Writing – review & editing. ZW: Writing – review & editing. YW: Writing – review & editing. YZ: Writing – review & editing.
Funding
The author(s) declare financial support was received for the research, authorship, and/or publication of this article. National Natural Science Foundation of China (42176012), " The influence of various El Niño types on interannual sea-level variation in the South China Sea ". National Natural Science Foundation of China (42130402), " Research on the mechanisms and simulation of sea-land resources flow by using big data ". National Natural Science Foundation of China (42006022). National Natural Science Foundation of China (42176027). The Science and Technology Program of Guangzhou (202102020841).
Acknowledgments
All data used in this study are free and publicly available from HYCOM (https://www.hycom.org/), ECWMF (https://www.ecmwf.int/en/forecasts/dataset/ecmwf-reanalysis-v5), and AVISO (https://www.aviso.altimetry.fr/en/home.html). This work was supported by the National Natural Science Foundation of China (42176012, 42130402, 42006022 and 42176027) and the Science and Technology Program of Guangzhou (202102020841).The data analysis was supported by the High-Performance Computing Division of the South China Sea Institute of Oceanology.
Conflict of interest
The authors declare that the research was conducted in the absence of any commercial or financial relationships that could be construed as a potential conflict of interest.
Publisher’s note
All claims expressed in this article are solely those of the authors and do not necessarily represent those of their affiliated organizations, or those of the publisher, the editors and the reviewers. Any product that may be evaluated in this article, or claim that may be made by its manufacturer, is not guaranteed or endorsed by the publisher.
References
Bakun A., Nelson C. S. (1991). The seasonal cycle of wind-stress curl in subtropical eastern boundary current regions. J. J. Phys. Oceanogr. 21, 1815–1834. doi: 10.1175/1520-0485(1991)021<1815:TSCOWS>2.0.CO;2
Cai S., Huang Q., Long X. (2003). Three-dimensional numerical model study of the residual current in the South China Sea. Oceanol. Acta 26, 597–607. doi: 10.1016/S0399-1784(03)00053-7
Cai S., Liu H., Li W. (2002). Water transport exchange between the South China Sea and its adjacent seas. Adv. Mar. Sci. 20, 29–34. doi: 10.3969/j.issn.1671-6647.2002.03.005
Cai S. Q., Su J. L., Long X. M., Wang S. G., Huang Q. Z. (2005). Numerical study on the summer circulation of the upper South China Sea and its establishment. Acta Oceanol. Sin. 24, 31–38.
Chang C.-W. J., Hsu H.-H., Wu C.-R., Sheu W.-J. (2008). Interannual mode of sea level in the South China Sea and the roles of El Niño and El Niño Modoki. Geophys. Res. Lett. 35, L03601. doi: 10.1029/2007GL032562
Chao S.-Y., Shaw P.-T., Wu S. Y. (1996). El Niño modulation of the South China Sea circulation. Prog. Oceanogr. 38, 51–93. doi: 10.1016/S0079-6611(96)00010-9
Chen S., Li W., Lu Y., Wen Z. (2014). Variations of latent heat flux during tropical cyclones over the South China Sea. Meteorologic. Applic. 21, 717–723. doi: 10.1002/met.1398
Chen C., Wang G. (2014). Interannual variability of the eastward current in the western South China Sea associated with the summer Asian monsoon. J. Geophysic. Res. Oceans 119, 5745–5754. doi: 10.1002/2014JC010309
Chen G., Xue H. (2014). Westward intensification in marginal seas. Ocean Dyn. 64, 337–345. doi: 10.1007/s10236-014-0691-z
Chern C.-S., Jan S., Wang J. (2010). Numerical study of mean flow patterns in the South China Sea and the Luzon Strait. Ocean Dyn. 60, 1047–1059. doi: 10.1007/s10236-010-0305-3
Chu P. C., Edmons N. L., Fan C. (1999). Dynamical mechanisms for the South China Sea seasonal circulation and thermohaline variabilities. J. J. Phys. Oceanogr. 29, 2971–2989. doi: 10.1175/1520-0485(1999)029<2971:DMFTSC>2.0.CO;2
Cummings J. A., Smedstad O. M. (2013). “Variational data assimilation for the global ocean,” in Data Assimilation for Atmospheric, Oceanic and Hydrologic Applications (Vol. II). Eds. Park S. K., Xu L. (Berlin, Heidelberg: Springer Berlin Heidelberg).
Da N. D., Herrmann M., Morrow R., Niño F., Huan N. M., Trinh N. Q. (2019). Contributions of wind, ocean intrinsic variability, and ENSO to the interannual variability of the South Vietnam upwelling: A modeling study. J. Geophysic. Res. Oceans 124, 6545–6574. doi: 10.1029/2018JC014647
Ding X., Liu J., Zhang H., Ke Z., Li J., Liu W., et al. (2022). Phytoplankton community patterns in the Northeastern South China Sea: implications of intensified Kuroshio intrusion during the 2015/16 El Niño. J. Geophysic. Res. Oceans 127, e2021JC017998. doi: 10.1029/2021JC017998
Ducet N., Le Traon P. Y., Reverdin G. (2000). Global high-resolution mapping of ocean circulation from TOPEX/Poseidon and ERS-1 and -2. J. Geophys. Res.: Oceans 105, 19477–19498. doi: 10.1029/2000JC900063
Enriquez A. G., Friehe C. A. (1995). Effects of wind stress and wind stress curl variability on coastal upwelling. J. J. Phys. Oceanogr. 25, 1651–1671. doi: 10.1175/1520-0485(1995)025<1651:EOWSAW>2.0.CO;2
Fang G., Chen H., Wei Z., Wang Y., Wang X., Li C. (2006). Trends and interannual variability of the South China Sea surface winds, surface height, and surface temperature in the recent decade. J. Geophys. Res. 111, C11S16. doi: 10.1029/2005JC003276
Fang G., Wang G., Fang Y., Fang W. (2012). A review on the South China Sea western boundary current. Acta Oceanol. Sin. 31, 1–10. doi: 10.1007/s13131-012-0231-y
Gan J., Li H., Curchitser E. N., Haidvogel D. B. (2006). Modeling South China Sea circulation: Response to seasonal forcing regimes. J. Geophys. Res. 111, C06034. doi: 10.1029/2005JC003298
Gan J., Liu Z., Liang L. (2016). Numerical modeling of intrinsically and extrinsically forced seasonal circulation in the China Seas: A kinematic study. J. Geophysic. Res. Oceans 121, 4697–4715. doi: 10.1002/2016JC011800
Gan J., Qu T. (2008). Coastal jet separation and associated flow variability in the southwest South China Sea. Deep Sea Res. Part I: Oceanogr. Res. Papers 55, 1–19. doi: 10.1016/j.dsr.2007.09.008
Gordon A. L., Huber B. A., Metzger E. J., Susanto R. D., Hurlburt H. E., Adi T. R. (2012). South China Sea throughflow impact on the Indonesian throughflow. Geophys. Res. Lett. 39, L11602. doi: 10.1029/2012GL052021
Hein H., Hein B., Pohlmann T., Long B. H. (2013). Inter-annual variability of upwelling off the South-Vietnamese coast and its relation to nutrient dynamics. Global Planet. Change 110, 170–182. doi: 10.1016/j.gloplacha.2013.09.009
Hersbach H., Bell B., Berrisford P., Hirahara S., Horányi A., Muñoz-Sabater J., et al. (2020). The ERA5 global reanalysis. ERA5 Global Reanalys 146, 1999–2049. doi: 10.1002/qj.3803
Hu J., Gan J., Sun Z., Zhu J., Dai M. (2011). Observed three-dimensional structure of a cold eddy in the southwestern South China Sea. J. Geophys. Res. 116, C05016. doi: 10.1029/2010JC006810
Hu J., Kawamura H., Hong H., Qi Y. (2000). A review on the currents in the South China Sea: seasonal circulation, South China Sea warm current and Kuroshio intrusion. J. Oceanogr. 56, 607–624. doi: 10.1023/A:1011117531252
Jilan S. (2004). Overview of the South China Sea circulation and its influence on the coastal physical oceanography outside the Pearl River Estuary. Continent. Shelf Res. 24, 1745–1760. doi: 10.1016/j.csr.2004.06.005
Li Y., Han W., Wilkin J. L., Zhang W. G., Arango H., Zavala-Garay J., et al. (2014). Interannual variability of the surface summertime eastward jet in the South China Sea. J. Geophysic. Res. Oceans 119, 7205–7228. doi: 10.1002/2014JC010206
Liu Q., Kaneko A., Jilan S. (2008). Recent progress in studies of the South China Sea circulation. J. Oceanogr. 64, 753–762. doi: 10.1007/s10872-008-0063-8
Liu Q.-Y., Wang D., Wang X., Shu Y., Xie Q., Chen J. (2014). Thermal variations in the South China Sea associated with the eastern and central Pacific El Niño events and their mechanisms. J. Geophys. Res.: Oceans 119, 8955–8972. doi: 10.1002/2014JC010429
Liu Z., Yang H., Liu Q. (2001). Regional dynamics of seasonal variability in the South China Sea. J. J. Phys. Oceanogr. 31, 272–284. doi: 10.1175/1520-0485(2001)031<0272:RDOSVI>2.0.CO;2
Liu S., Zuo J. C., Shu Y. Q., Ji Q. Y., Cai Y. X., Yao J. L. (2023). The intensified trend of coastal upwelling in the South China Sea during 1982-2020. Front. Mar. Sci. 10, 11. doi: 10.3389/fmars.2023.1084189
Lu W., Oey L. Y., Liao E., Zhuang W., Yan X. H., Jiang Y. (2018). Physical modulation to the biological productivity in the summer Vietnam upwelling system. Ocean Sci. 14, 1303–1320. doi: 10.5194/os-14-1303-2018
Luo X., Yang L., Chen S., Liang D., Chan J. C. L., Wang D. (2022). The decadal variation of eastward-moving tropical cyclones in the South China Sea during 1980–2020. Geophysic. Res. Lett. 49, e2021GL096640. doi: 10.1029/2021GL096640
Ngo M. H., Hsin Y. C. (2021). Impacts of wind and current on the interannual variation of the summertime upwelling off Southern Vietnam in the South China Sea. J. Geophys. Res.: Oceans 126, e2020JC016892. doi: 10.1029/2020jc016892
Ning X., Chai F., Xue H., Cai Y., Liu C., Shi J. (2004). Physical-biological oceanographic coupling influencing phytoplankton and primary production in the South China Sea. J. Geophys. Res. 109, C10005. doi: 10.1029/2004JC002365
Qiu B. (2000). Interannual variability of the Kuroshio extension system and its impact on the wintertime SST field. J. J. Phys. Oceanogr. 30, 1486–1502. doi: 10.1175/1520-0485(2000)030<1486:IVOTKE>2.0.CO;2
Qiu C., Huo D., Liu C., Cui Y., Su D., Wu J., et al. (2019). Upper vertical structures and mixed layer depth in the shelf of the northern South China Sea. Continent. Shelf Res. 174, 26–34. doi: 10.1016/j.csr.2019.01.004
Qu T. (2000). Upper-layer circulation in the South China Sea. J. J. Phys. Oceanogr. 30, 1450–1460. doi: 10.1175/1520-0485(2000)030<1450:ULCITS>2.0.CO;2
Qu T., Du Y., Meyers G., Ishida A., Wang D. (2005). Connecting the tropical Pacific with Indian Ocean through South China Sea. Geophys. Res. Lett. 32, L24609. doi: 10.1029/2005GL024698
Qu T., Kim Y. Y., Yaremchuk M., Tozuka T., Ishida A., Yamagata T. (2004). Can Luzon strait transport play a role in conveying the impact of ENSO to the South China Sea? J J. Climate 17, 3644–3657. doi: 10.1175/1520-0442(2004)017<3644:CLSTPA>2.0.CO;2
Shaw P.-T., Chao S.-Y. (1994). Surface circulation in the South China Sea. Deep Sea Res. Part I: Oceanogr. Res. Papers 41, 1663–1683. doi: 10.1016/0967-0637(94)90067-1
Shu Y., Wang D., Feng M., Geng B., Chen J., Yao J., et al. (2018). The contribution of local wind and ocean circulation to the interannual variability in coastal upwelling intensity in the northern South China Sea. J. Geophysic. Res. Oceans 123, 6766–6778. doi: 10.1029/2018JC014223
Shu Y., Xue H., Wang D., Xie Q., Chen J., Li J., et al. (2016). Observed evidence of the anomalous South China Sea western boundary current during the summers of 2010 and 2011. J. Geophysic. Res. Oceans 121, 1145–1159. doi: 10.1002/2015JC011434
Sun Y., Lan J. (2021). Summertime eastward jet and its relationship with western boundary current in the South China Sea on the interannual scale. Climate Dyn. 56, 935–947. doi: 10.1007/s00382-020-05511-z
Wang G., Chen D., Su J. (2006b). Generation and life cycle of the dipole in the South China Sea summer circulation. J. Geophys. Res. 111, C06002. doi: 10.1029/2005JC003314
Wang D., Hong B., Gan J., Xu H. (2010). Numerical investigation on propulsion of the counter-wind current in the northern South China Sea in winter. Deep Sea Res. Part I: Oceanogr. Res. Papers 57, 1206–1221. doi: 10.1016/j.dsr.2010.06.007
Wang G., Li R., Yan C. (2003). Advances in studying oceanic circulation from hydrographic data with applications in the South China Sea. Adv. Atmos. Sci. 20, 914–920. doi: 10.1007/BF02915514
Wang D., Liu Q., Xie Q., He Z., Zhuang W., Shu Y., et al. (2013). Progress of regional oceanography study associated with western boundary current in the South China Sea. Chin. Sci. Bull. 58, 1205–1215. doi: 10.1007/s11434-012-5663-4
Wang D., Wang Q., Cai S., Shang X., Peng S., Shu Y., et al. (2019). Advances in research of the mid-deep South China Sea circulation. Sci. China Earth Sci. 62, 1992–2004. doi: 10.1007/s11430-019-9546-3
Wang Q., Wang Y., Sui J., Zhou W., Li D. (2021). Effects of weak and strong winter currents on the thermal state of the South China Sea. J. J. Climate 34, 313–325. doi: 10.1175/JCLI-D-19-0790.1
Wang C., Wang W., Wang D., Wang Q. (2006a). Interannual variability of the South China Sea associated with El Niño. J. Geophys. Res. 111, C03023. doi: 10.1029/2005JC003333
Wang Q., Wang Y., Zhou W., Wang D., Sui D., Chen J. (2015). Dynamic of the upper cross-isobath’s flow on the northern South China Sea in summer. Aquat. Ecosyst. Health Manage. 18, 357–366. doi: 10.1080/14634988.2015.1112124
Wang Q., Zeng L., Chen J., He Y., Liu Q., Sui D., et al. (2023). Phase shift of the winter South China Sea western boundary current over the past two decades and its drivers. Geophysic. Res. Lett. 50, e2023GL103145. doi: 10.1029/2023GL103145
Wyrtki (1961). Naga report: scientific results of marine investigations of the South China Sea and the Gulf of Thailand 1959-1961 (La Jolla: University of California, Scripps Institution of Oceanography).
Xiao F., Wang D., Wu Q., Song W., Zeng L., Xie Q., et al. (2022). Discrepant effects of oceanic advection in the evolution of SST anomalies in the South China Sea during El Niño of different intensities. Front. Mar. Sci. 9. doi: 10.3389/fmars.2022.871458
Xie Y., Wang Q., Zeng L., Chen J., He Y. (2022). Winter–summer transition in the southern South China Sea western boundary current. J. Phys. Oceanogr. 52, 2669–2686. doi: 10.1175/JPO-D-21-0282.1
Xie S.-P., Xie Q., Wang D., Liu W. T. (2003). Summer upwelling in the South China Sea and its role in regional climate variations. J. Geophys. Res. 108, 3261. doi: 10.1029/2003JC001867
Xue H., Chai F., Pettigrew N., Xu D., Shi M., Xu J. (2004). Kuroshio intrusion and the circulation in the South China Sea. J. Geophys. Res. 109, C02017. doi: 10.1029/2002JC001724
Zhao R., Zhu X.-H. (2016). Weakest winter South China Sea western boundary current caused by the 2015–2016 El Niño event. J. Geophysic. Res. Oceans 121, 7673–7682. doi: 10.1002/2016JC012252
Zheng Q., Fang G., Song Y. T. (2006). Introduction to special section: Dynamics and Circulation of the Yellow, East, and South China Seas. J. Geophys. Res. 111, C11S01. doi: 10.1029/2005JC003261
Zhu Y., Cao G., Wang Y., Li S., Xu T., Wang D., et al. (2022). Variability of the deep South China Sea circulation derived from HYCOM reanalysis data. Acta Oceanol. Sin. 41, 54–64. doi: 10.1007/s13131-021-1952-6
Zu T., Wang D., Wang Q., Li M., Wei J., Geng B., et al. (2020). A revisit of the interannual variation of the South China Sea upper layer circulation in summer: correlation between the eastward jet and northward branch. Climate Dyn. 54, 457–471. doi: 10.1007/s00382-019-05007-5
Keywords: Western boundary current, autumn transition, barotropic pressure, baroclinic pressure, South China Sea
Citation: Tian Y, Zuo J, Shu Y, Wang Q, Xie Y, Ji Q, Liu X, Wang Z, Wu Y and Zhang Y (2023) Southern South China Sea boundary current transition from summer to winter. Front. Mar. Sci. 10:1297418. doi: 10.3389/fmars.2023.1297418
Received: 20 September 2023; Accepted: 20 November 2023;
Published: 08 December 2023.
Edited by:
Andrea Cucco, National Research Council (CNR), ItalyCopyright © 2023 Tian, Zuo, Shu, Wang, Xie, Ji, Liu, Wang, Wu and Zhang. This is an open-access article distributed under the terms of the Creative Commons Attribution License (CC BY). The use, distribution or reproduction in other forums is permitted, provided the original author(s) and the copyright owner(s) are credited and that the original publication in this journal is cited, in accordance with accepted academic practice. No use, distribution or reproduction is permitted which does not comply with these terms.
*Correspondence: Qiang Wang, d3FpYW5nQHNjc2lvLmFjLmNu