
94% of researchers rate our articles as excellent or good
Learn more about the work of our research integrity team to safeguard the quality of each article we publish.
Find out more
ORIGINAL RESEARCH article
Front. Mar. Sci., 11 January 2024
Sec. Marine Biology
Volume 10 - 2023 | https://doi.org/10.3389/fmars.2023.1294509
 Adan Fernando Mar-Silva1†
 Píndaro Díaz-Jaimes1†
 Maried Ochoa-Zavala2
 Sofia Ortega-Garcia3*
 Giovanna Sotil4Ana Alegre5Teddy Escarabay6Esteban Elias7Jose Miguel Carvajal-Rodríguez8
In the Tropical Eastern Pacific dolphinfish (TEP) Corypahena hippurus is part of commercial, recreational, and artisanal fisheries and is also caught incidentally by the tuna purse-seine and longline fisheries. Defining the existence of differenced populations in exploited species for being considered independent management units is crucial for conservation plans. However, there is a great uncertainty about the species population genetic structure across the TEP. To investigate it and to identify possible management units for conservation purposes this study was carried out, based on two SNPs datasets of 3867 and 3220 SNPs for young of the year (YOY) and adult individuals, respectively, obtained through NGS protocols. Sampling covered the species’ range distribution in the Tropical Eastern Pacific and was structured into YOY and adult individuals in order to discard the effects of migrating individuals into sampled locations. Our results revealed slight but significant differences among locations occupying the latitudinal limits of the species distribution at transitional areas between tropical and subtropical waters. These areas are characterized by strong seasonal variations in sea surface temperature and limit the prevalence of populations in these extremes. Genetic differences also seem to be related to spatial separation of locations as the northernmost (Los Cabos) and southernmost (Peru) locations including a set of oceanic samples, showed the highest levels of genetic differentiation. Whereas were detected barriers to gene flow among spatially separated locations for YOY individuals probably related to site fidelity, clear limitations to gene flow between Mexico and Central America locations were observed probably related to oceanic circulation in the area. Design management strategies in countries where the dolphinfish is explored is of primary interest to preserve genetic resources. It is necessary to define the existence of genetic differences of populations for species that are highly dependent on environmental factors limiting its distributional range as is the case of the dolphinfish.
The dolphinfish (Coryphaena hippurus, Linnaeus, 1758) is a highly migratory epipelagic predator, distributed worldwide in tropical and subtropical waters, in temperatures above 19°C (Palko et al., 1982; Farrell et al., 2014). It is known as dorado in most Latin American countries, but it is also commonly called mahi mahi, perico, doradilla, lampuga, and palometa (Aires-da-Silva et al., 2014). The dolphinfish has a high growth rate during the first year of life, and maximum longevity has been estimated at 4 years; in addition, the species has an early maturity (50% maturity at 0.5–1 years of age), multiple spawning along the year, and high fecundity (Beardsley, 1967; Oxenford and Hunte, 1983; Uchiyama et al., 1986; Alejo-Plata et al., 2011).
In the Tropical Eastern Pacific (TEP), dolphinfish is part of commercial, recreational, and artisanal fisheries and is also caught incidentally (as bycatch) by tuna purse-seine and longline fisheries. The Food and Agriculture Organization of the United Nations (FAO) reported that during the period 2010–2019, the average annual catch of dorado worldwide was 105,754 t. During this period, Peru remained in first place for landings of this species and, together with Ecuador, contributed to more than 56% of total catches (FAO, 2020). In these countries, most of the dolphinfish landings come from artisanal longline fisheries. As a consequence, two exploratory stock assessments, potential reference points, and harvest control rules for dolphinfish in the southern Pacific Ocean have been carried out (Aires-da-Silva et al., 2016; Valero et al., 2019; Roa-Ureta et al., 2021). Moreover, in the 101st Inter-American Tropical Tuna Commission (IATTC) meeting, a resolution to conduct a stock assessment in 2026 has been adopted (IATTC, 2022). Although several countries in the Eastern Pacific, from Mexico to Chile, have access to this resource, there is a lack of an integrated regional management plan for the dolphinfish due to the great uncertainty about the status of its populations. Scientific knowledge about the number of management stocks or fishing units (subpopulations) is of vital importance for the countries involved to establish a sustainable management strategy to ensure resource viability.
Fishery management strategies determine the identification of “fish units” to guarantee the sustainable use of a stock, making it possible to obtain abundance projections closely related to the real situation of the resource. These units are usually determined based on morphology, catch data, and prospective studies in spawning areas including genetic studies. Most pelagic species, including dolphinfish, are thought to lack differentiated populations (subpopulations) due to the high capability to disperse from their natal site and because of the lack of physical and/or geographical barriers in the marine realm. Dispersal capability increases possibilities for gene flow, resulting in genetic homogeneity between spatially separated populations. In addition, life history features of dolphinfish, such as fast growth, high fecundity, and short generational times, result in large population sizes that are consistent with the absence of genetic structure (Grant and Bowen, 1998). As a consequence, for pelagic species, the effect of gene drift on populations is counteracted by their large effective population sizes (Ely et al., 2005).
Until now, genetic studies for dolphinfish in the TEP are based on mitochondrial and nuclear DNA microsatellite data and have not been conclusive in defining genetic differentiation but coincide in showing high levels of genetic variation (Díaz-Jaimes et al., 2006; Rocha-Olivares et al., 2006; Tripp-Valdez et al., 2010). However, evidence for differences between populations in the northern and southern boundaries of the species distributional range of the eastern Pacific has been detected based on microsatellite loci (Ochoa-Zavala et al., 2022). Accordingly, tagging studies in the TEP have revealed limited movements of dolphinfish individuals, suggesting the existence of regional differences related to thermal habitat utilization and displacement over time (Perle et al., 2020). Tagged individuals on the west coast of Baja California and the coast of Oaxaca remained within the region where they were tagged. However, latitudinal movements of tagged individuals from Baja California were detected, while tagged individuals off Oaxaca showed longitudinal movements. Dolphinfish is capable of performing latitudinal movements seasonally, although it is limited by physical changes in oceanic conditions (majorly sea surface temperature) (Zúñiga-Flores et al., 2008; Martínez-Rincón et al., 2015; Torrejón-Magallanes et al., 2019). Similarly, abundance peaks occur differentially across the eastern Pacific during the austral and boreal summer months, whereas on the coasts of Mexico, an abundance peak occurs during September–November. In South America waters (off the coasts of Ecuador and Peru), the highest abundance occurs during October–April (Zúñiga-Flores et al., 2008; Martínez-Ortiz et al., 2015). This may cause differentiated reproductive units for populations located in waters of both hemispheres and hence population divergence by considering the limited movements of individuals. In this context, populations inhabiting the extremes of the species range and located in transitional areas may experiment with expansion–contraction cycles due to seasonal changes in oceanographic conditions driving differences among populations, as was confirmed by Ochoa-Zavala et al. (2022). Accordingly, determining the role of the oceanographic dynamics in demographic processes at the species boundaries in promoting differentiated populations may add relevant information for species conservation in these areas.
Next-generation sequencing (NGS) protocols offer the opportunity to obtain thousands of single-nucleotide polymorphisms (SNPs; Crawford and Oleksiak, 2016; Salas et al., 2019). Such markers are particularly useful for population genetic studies in pelagic species characterized by displaying large effective population sizes that require a significant number of loci to assess low levels of population genetic structure, as is usually reported in these species (Ely et al., 2005). The adequacy of using genome-wide SNP markers in C. hippurus was pointed out in a genomic study where more than 3,000 SNPs in populations from the Mediterranean were used (Maroso et al., 2016). The main results revealed differences in the frequency of heterozygous genotypes between females and males and a weak genetic differentiation based on outlier loci between the western Mediterranean and the Atlantic, which could be related to differences in oceanographic conditions between these areas (Maroso et al., 2016; Maggio et al., 2019).
Therefore, studying highly mobile fish species requires sampling designs capable of recovering the genetic signal of individuals in their sites of origin and considering differential dispersal capabilities between sexes (Phillips et al., 2021). Particularly for the dolphinfish, our experience led us to favor a structured sampling based on different age classes (young of the year [YOY] and adults) to determine the existence of patterns of population differences and interpret them properly. Also, the use of more efficient approaches based on the application of NGS allows the massive sequencing of a large number of DNA segments in parallel with a high coverage across the genome as compared with traditional Sanger sequencing approaches (Hemmer-Hansen et al., 2014; Crawford and Oleksiak, 2016). It makes it possible to obtain more reliable results in detecting subtle genetic differences and to test the existence of population differentiation and its relationship with evolutionary and ecological processes. The identification of genetically discrete populations across the species distribution range would add relevant information for delineating regional management plans to achieve sustainable fisheries. Moreover, understanding the influence of environmental factors on delineating genetic patterns would serve to prioritize the conservation of vulnerable or key populations isolated by oceanographic barriers or demographic processes.
A total of 270 individuals of dolphinfish (159 adult and 111 young of the year individuals) were collected from nine localities in the Eastern Pacific (Table 1; Figure 1; Supplementary Table 1). Adult individuals were categorized based on furcal length higher than 70 cm, while YOY individuals ranged from 30 to 69 cm. Samples were obtained from 1) the northernmost locality at the distributional species limits (Cabo San Lucas [CSL] in Mexico), 2) the southern limits of its range (Paita [PAI]) and Pucusana [PUC] in Peru), and 3) the central part of the Tropical Eastern Pacific, where the species is more abundant (Bahía Banderas [BAB] and Puerto Ángel [PAO] in Mexico, Puntarenas [PUN] in Costa Rica, and Santa Rosa [SRO] in Ecuador). We also included Oceanic (OCE) samples, which were used as a reference of spatially separated localities from the usually recorded species distribution in coastal areas from the TEP. Note that for these four areas, only adult and/or YOY individuals were included (Table 1). The muscle tissue from each specimen was preserved in 96% ethanol until DNA extraction. Total genomic DNA was isolated using the phenol–chloroform protocol (Hillis et al., 1996) and rehydrated in 50–100 μL of TE buffer.
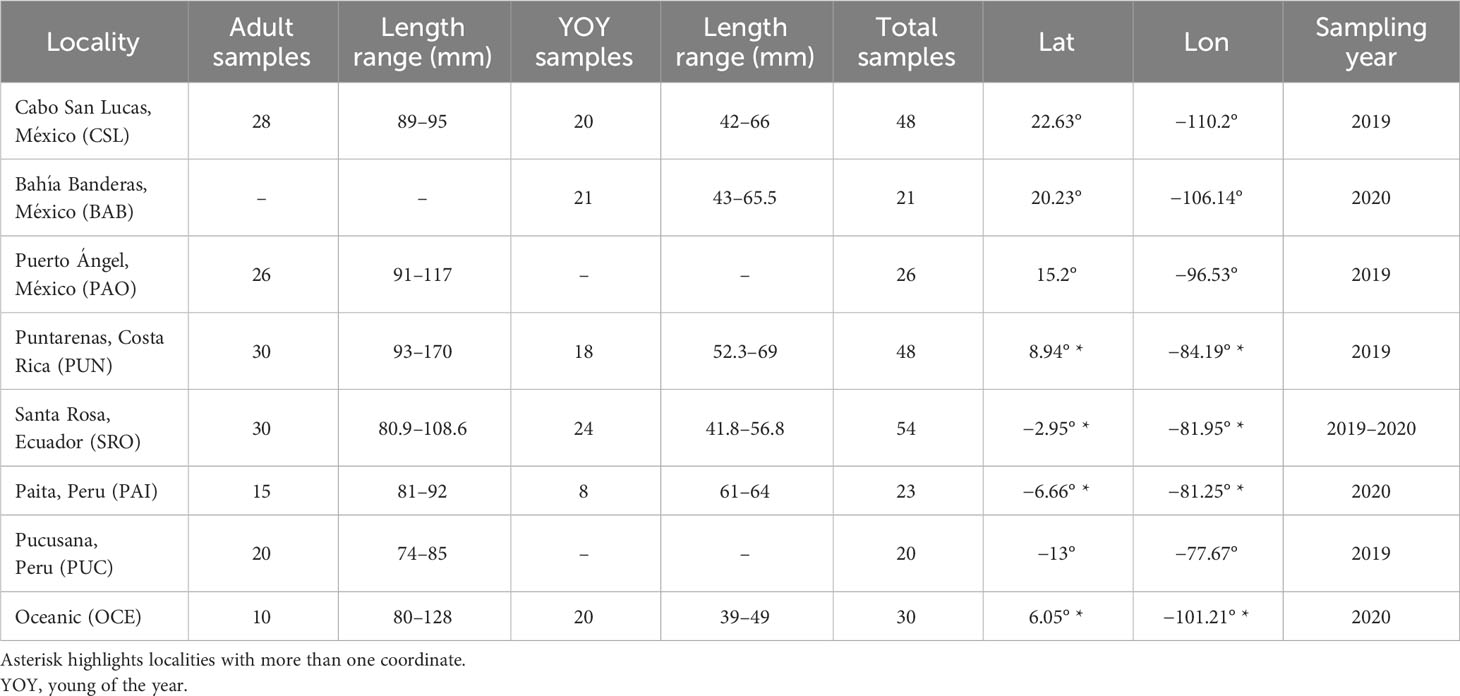
Table 1 Sampling locations for YOY and adult individuals collected in the Tropical Eastern Pacific.
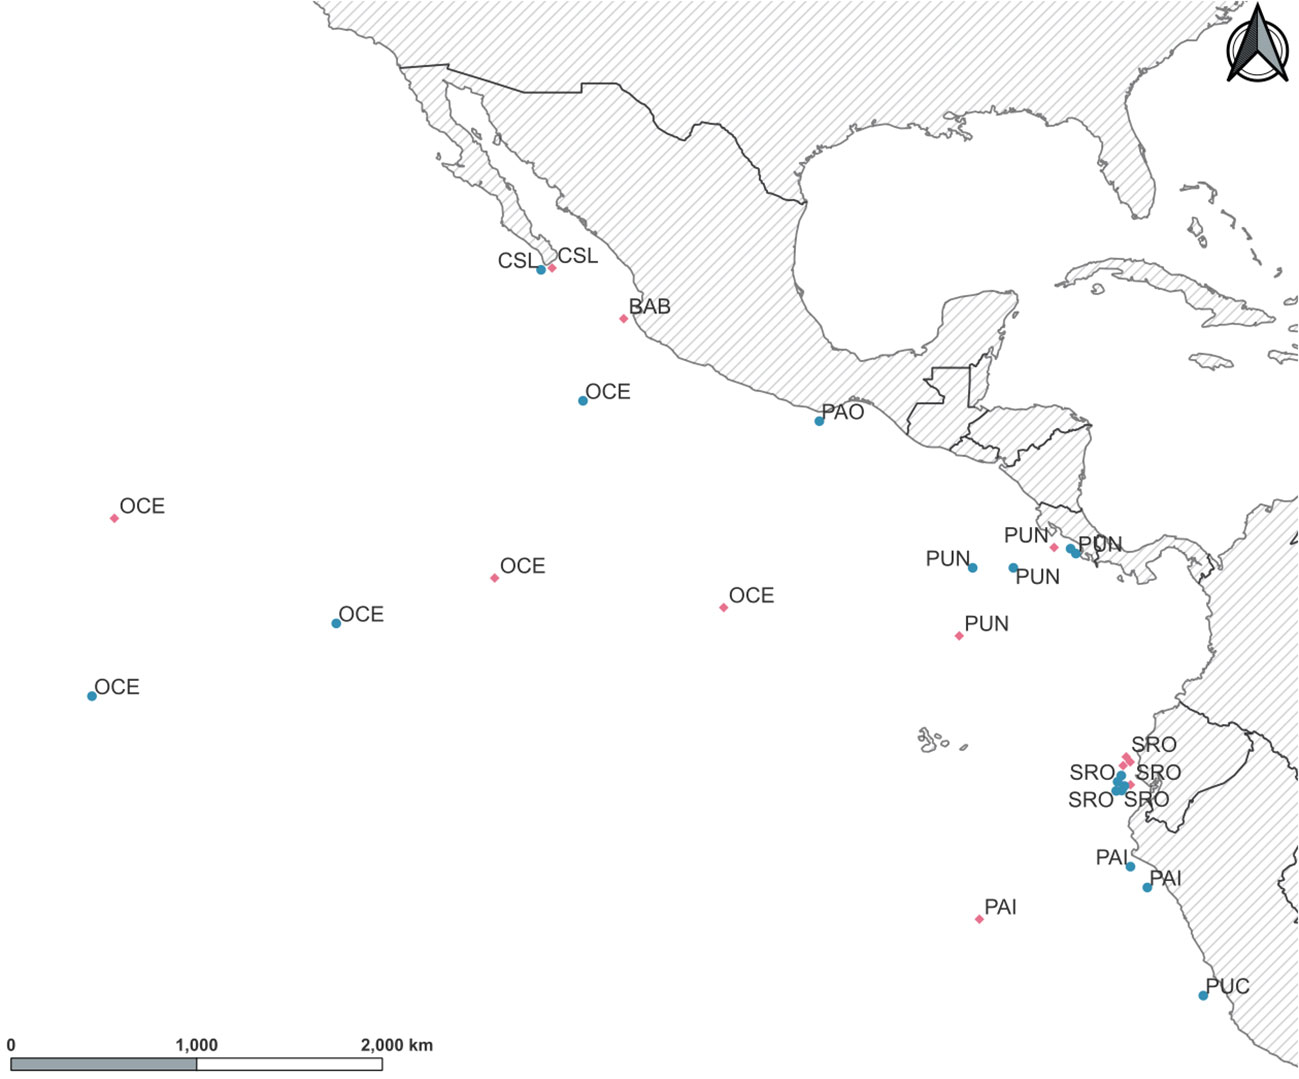
Figure 1 Sampling locations for young of the year (YOY) (pink diamonds) and adult (green circles) individuals of Coryphaena hippurus in the Tropical Eastern Pacific. Localities: Cabo San Lucas (CSL), Bahía Banderas (BAB), Puerto Ángel (PAO), Puntarenas (PUN), Oceanic (OCE), Santa Rosa (SRO), Paita (PAI), and Pucusana (PUC).
Genomic libraries were processed following the 3RAD protocol from Bayona-Vásquez et al. (2019). In short, DNA from 270 samples was normalized to 20 ng/μL and fragmented using enzymes ClaI, BamHI, and MspI (BioLabs® Inc., Boston, MA, USA). Specific adapters for ClaI and BamHI enzymes were ligated to digested products, and the third enzyme (MspI) was used to eliminate adapter dimers and chimeras. Ligated products from each sample were purified using Sera-Mag Speed-Beads (Cytiva, Marlborough, MA, USA) and re-suspended in 20 μL of TE 1× buffer (IDT™, Integrated DNA Technologies, Coralville, IA, USA). In the elaboration of complete full-length libraries, ligated products were amplified with the primers iTru5 and iTru7 (IDT™, Integrated DNA Technologies) using 14 cycles of PCR (Bayona-Vásquez et al., 2019; Glenn et al., 2019). PCR products were purified and pooled in equimolar concentrations, generating three individual pools. Pools were size selected at a range of 500 bp ± 12% in Georgia Genomics Facility, Athens, GA. Selected fragments were amplified through a final PCR with P5 and P7 primers (Glenn et al., 2019), quantified with Qubit, and sequenced in two independent lanes in an Illumina HiSeq 2500 platform at the Oklahoma Medical Research Foundation (Oklahoma City, OK) to obtain high-quality paired-end (2 × 150) data.
The analysis process for data generated by RAD protocols could be divided into three main steps: 1) data cleaning, 2) assembly, and 3) SNP calling. For cleaning data, the paired-end reads were demultiplexed for each individual removing sequences with low quality; internal adapters were checked, and reads were trimmed to 139 bp, using procees_radtags module implemented in Stacks 2.2 (Catchen et al., 2013; Rochette et al., 2019). For assembly, the denovo_map.pl pipeline in stacks 2.2 was used (Rochette et al., 2019), which is recommended when there is no availability of a reference genome. The optimization parameters m (amount of minimum reads to form an allele), M (minimum number of mismatches among alleles to form locus), and n (minimum number of alleles to generate a catalog of locus) were defined following the recommendations of Paris et al. (2017); the details are presented in Supplementary Tables S2 and S3. Finally, the gstacks module was used for SNP calling using the default model (marukilow). Additionally, in the populations module, loci with a minimum allele frequency of 0.01 were retained, with a maximum observed heterozygosity of 0.70, to exclude paralogues and one SNP per locus to avoid linkage disequilibrium. In addition, the minimum percentage of individuals within a site required to define a locus (-r) was 80, and the minimum number of populations required to keep a loci (-p) was 5. The software VCFtools (Danecek et al., 2011) and PLINK v 1.09 (Purcell et al., 2007) were used to filter the SNPs, allowing 10% of missing data (Supplementary Table S4). Additionally, monomorphic and polymorphic sites were obtained using DNASP v.6 (Rozas et al., 2017).
Analyses for genomic data were conducted for the full data set but also for samples separated into YOY and adult individuals. This was to ensure recovery of the genetic signal of individuals in their site of origin by sampling YOY individuals and for comparisons with adult individuals that most probably have moved from their place of origin.
To determine the presence of outlier loci (OLs) in our data, the multivariate (PCAdapt) and Bayesian (BayeScan) approaches were used. The principal component (PC) analysis (PCA) method considers loci under selection with a value of false recovery rate (FDR) equal to 0.01 in PCAdapt v.4.0.2 (Privé et al., 2020). The Bayesian approach in BayeScan v.2.1 (Foll and Gaggiotti, 2008) was used with the default settings, consisting of 20 pilot runs with 5,000 interactions, a burn-in of 50,000 steps, and sampling every 5,000 generations considering a thinning interval of 10. Finally, a data set with outlier loci for both methods was obtained for further analyses. Genetic diversity was assessed in terms of observed (Ho) and expected (Hs) heterozygosity, and allelic richness (Ar) was assessed using the “hierfstat” R package (Goudet and Jombart, 2020).
The number of clusters for genetically related individuals of dolphinfish was determined based on different approaches. First, discriminant analysis of principal components (DAPC) was performed using the “adegenet” package in R (R Core Team, 2022). In this multivariate statistical approach, the data were first transformed using a PCA, and subsequently, clusters were identified using discriminant analysis (DA). Genetic clusters cannot be defined using the K-means algorithm (Supplementary Figure S1) because the find.clusters function does not reliably work when FST is<0.1(Miller et al., 2020). DAPC was implemented using the number of sampling localities as prior (pre-defined), and groups were identified based on the differentiation pattern among localities via discriminant analysis (Jombart and Collins, 2015). After cross-validation, an optimization procedure to identify the number of principal components to be retained through discriminant analysis was performed using 90 and 120 PCs for YOY and adult individuals, respectively.
Second, individual ancestry was estimated from SNP data sets through admixture. This procedure involves the use of maximum likelihood estimates on data from multiple loci to estimate individual ancestry within the population being considered. To determine the most optimal number of populations (K), a cross-validation procedure was undertaken with hypothetical admixture runs from K = 1 to K = 10. Optimal partitioning of the population was achieved at the lowest cross-validation error.
Estimates of FST between pairs of populations were obtained using Arlequin. The significance level for multiple testing was adjusted using the Benjamini and Yekutieli (2001) correction (B-Y), as proposed by Narum (2006), by dividing the critical value of α by the sum of the number of tests according to the following formula:
Finally, different hypotheses of population subdivision were evaluated through an analysis of molecular variance (AMOVA) for each category (YOY and adult individuals) based on 10,000 permutations, allowing 25% of missing data using Arlequin 5.1 (Excoffier and Lischer, 2010). Samples were pooled into groups following the results from the DAPC for both YOY and adult individuals. Adult individuals most probably have left the site where they were born when they were collected, whereas YOY individuals were still found in their natal site (see Results). Alternatively, groups were tested considering the oceanographic regionalization of the Tropical Eastern Pacific as defined by Fiedler and Lavín (2017). Hence, localities were grouped into 1) OCE, 2) Northern and Central Eastern Pacific (CSL+BAB+PAO+PUN), and 3) Southeastern Pacific (SRO+PAI+PUC), the boundaries limiting the Eastern Tropical Pacific beyond the Southern Equatorial Current. These areas differ greatly in major environmental conditions such as temperature and the existence of upwelling areas according to Wilkinson et al. (2009).
The software Estimated Effective Migration Surfaces (EEMS) (Petkova et al., 2016) was used to estimate effective migration rates in a geographical context in terms of genetic dissimilarities produced by an equilibrium between gene flow and genetic drift to detect migrating corridors/potential barriers to gene flow. This method builds a triangular grid representing the habitat and each sample, its migration rate is assigned to a cell, and migration corridors and/or potential barriers to gene flow are identified through Voronoi tessellations (Petkova et al., 2016). A visual representation was obtained in colored plots with the average migration rates obtained through its posterior distribution.
Estimates of effective population size were obtained per location and identified groups using Ne-estimator software (Do et al., 2014) with the linkage disequilibrium method and considering a critical allele frequency value of PCRIT = 0.05. The upper and lower bounds of 95% confidence intervals (CIs) for estimates of Ne, to reduce the bias associated with the estimation of CI when using linkage disequilibrium, were obtained using the jackknife procedure implemented as recommended by Waples and Do (2010).
From the 270 dolphinfish individuals analyzed, 407,728 SNPs were obtained. After data filtering, allowing 10% of missing data, allele frequencies above 99%, and individuals with 40% of missing genotypes and retaining one random SNP per locus as recommended by Pearman et al. (2022), a total of 3,867 and 3,220 SNPs for YOY and adult individuals were retained, respectively (Supplementary Table S4), with an average coverage of loci between 25x and 30x (Supplementary Figure S2). In addition, no monomorphic SNPs were recovered, and different numbers of alleles were observed between YOY and adult individuals, which is usual for aquatic migratory species (Kelson et al., 2020). However, a detailed evaluation of this last result may be necessary, which is out of the scope of the present study. All individuals having SNPs were double-checked for inconsistencies. After filtering missing data were recovered using both methods, 56 OLs for adult individuals and 98 for YOY individuals, none of the OLs were found to be shared between the two age classes (highest values of FST obtained using BayeScan in Supplementary Table S5).
Considering all data sets (270 individuals), gene diversity was similar across locations; the mean observed heterozygosity was 0.114 ranging from 0.109 to 0.124, while the mean expected heterozygosity was 0.125 ranging from 0.122 to 0.130 (Figure 2). Mean allelic richness was also similar with a mean of 1.25 and values ranging from 1.11 to 1.27. Similar estimates of gene diversity were observed when data were analyzed by age classes (data not shown). When using de novo assembly, it is recommended to keep one SNP per locus (which was made in the filter step) in order to diminish possible linked loci. However, to be sure that the data used did not have a bias due to linkage disequilibrium values of the association index (rd) estimated, this index is recommended when using genomic data since this method is not affected by the number of loci (Agapow and Burt, 2001). Values of rd resulted in very low estimations but were statistically significant for both YOY and adult individuals (rd = 0.000709; p = 0.001; and rd = 0.000448; p = 0.01, respectively). When testing for deviations from the Hardy–Weinberg (HW) expectations using the whole data set, significant deviations were observed for 239 and 236 loci for adult and YOY individuals, respectively. It is recommended to remove loci with HW deviations when using parametric approaches such as FST estimates (Pearman et al., 2022). However, estimates of FST and AMOVAs when removing loci with HW deviations remained similar to estimates when using the total set of loci (data not shown).
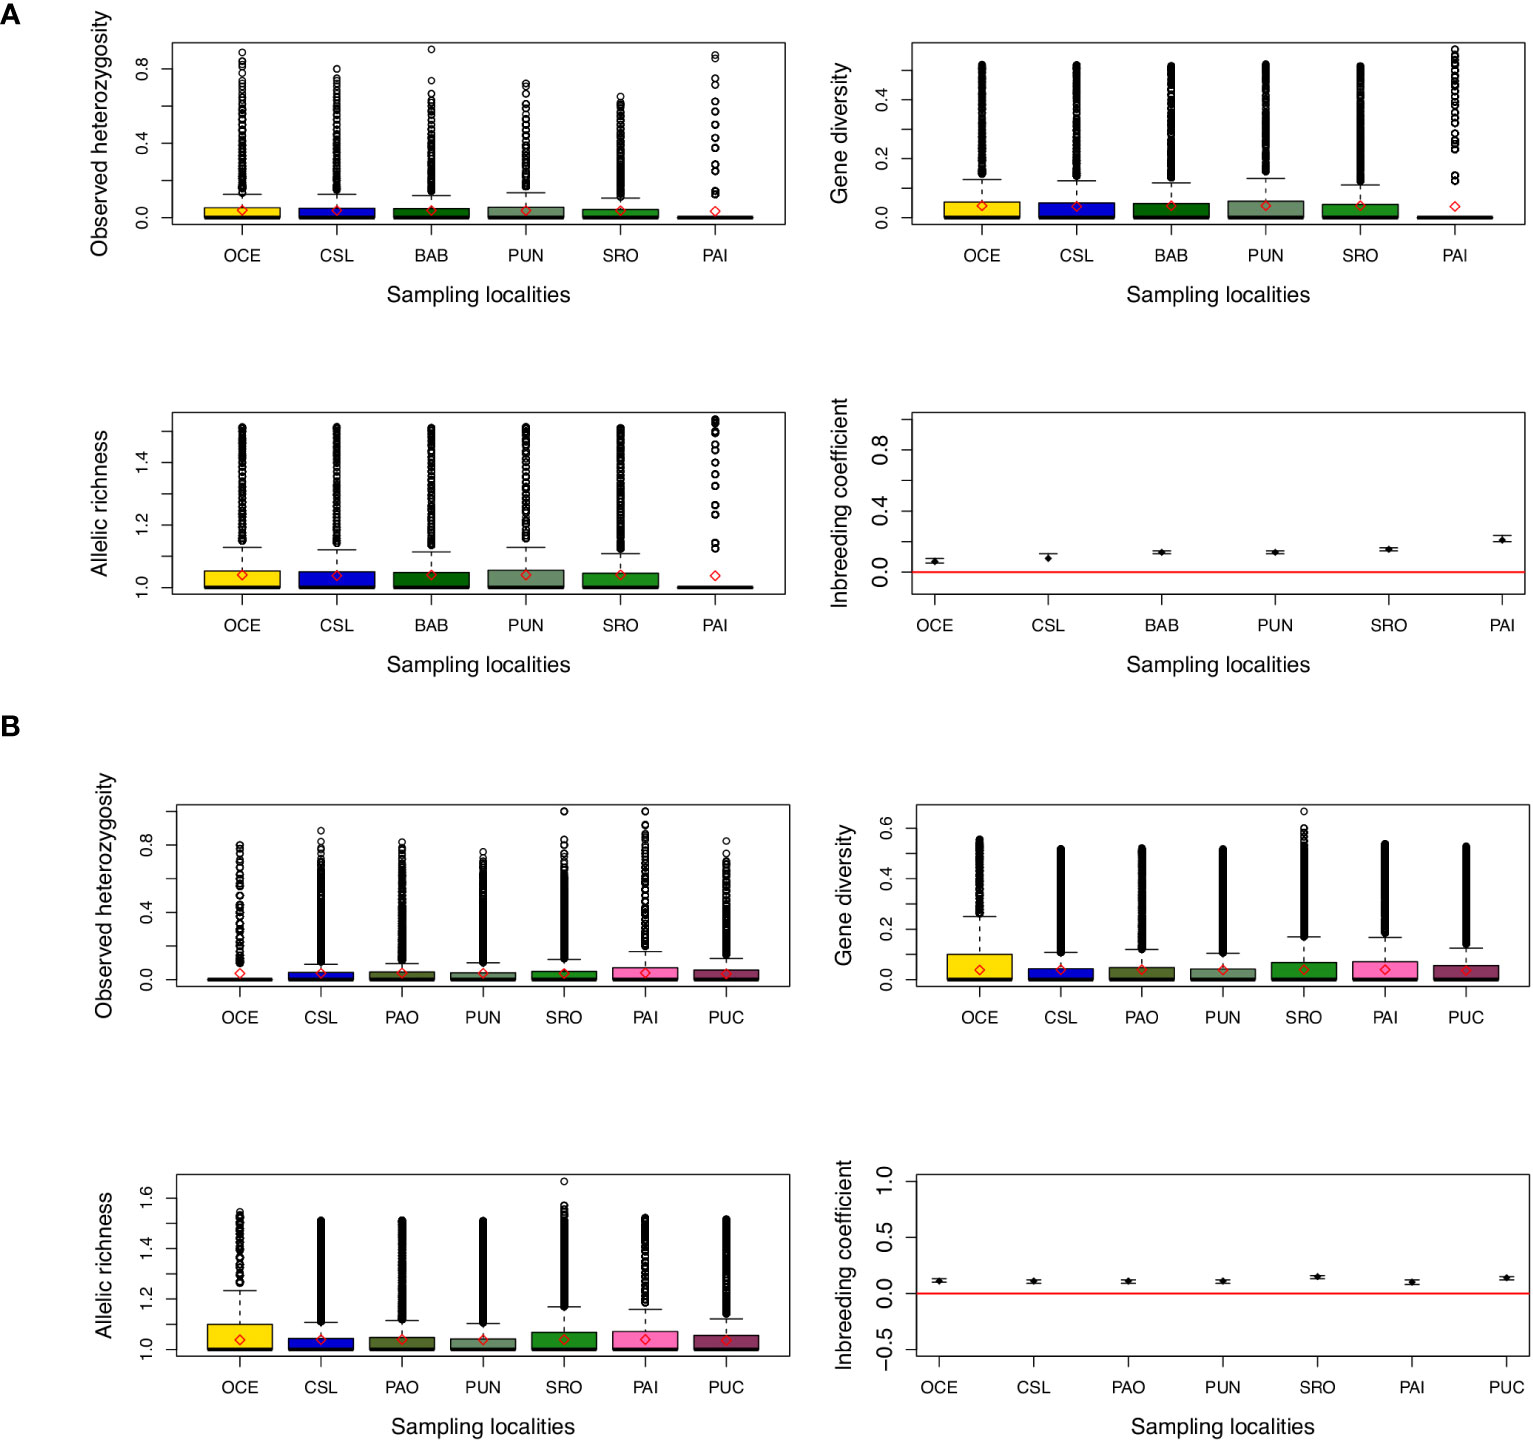
Figure 2 Estimates of genetic diversity and inbreeding coefficient from (A) young of the year (YOY) and (B) adult individuals. Diamonds and points indicate the mean value for each location. For inbreeding coefficient, bars indicate the 95% confidence interval.
The DAPC based on 90 PCs that explained 80% of the variation suggested four groups: 1) Oceanic, 2) Cabo San Lucas, 3) Bahía Banderas + Puntarenas, and 4) Santa Rosa + Paita (Figure 3). The AMOVA, considering the groups defined by the DAPC (Table 2), resulted in low and non-significant differences among groups (FCT = 0.0002; p = 0.409).
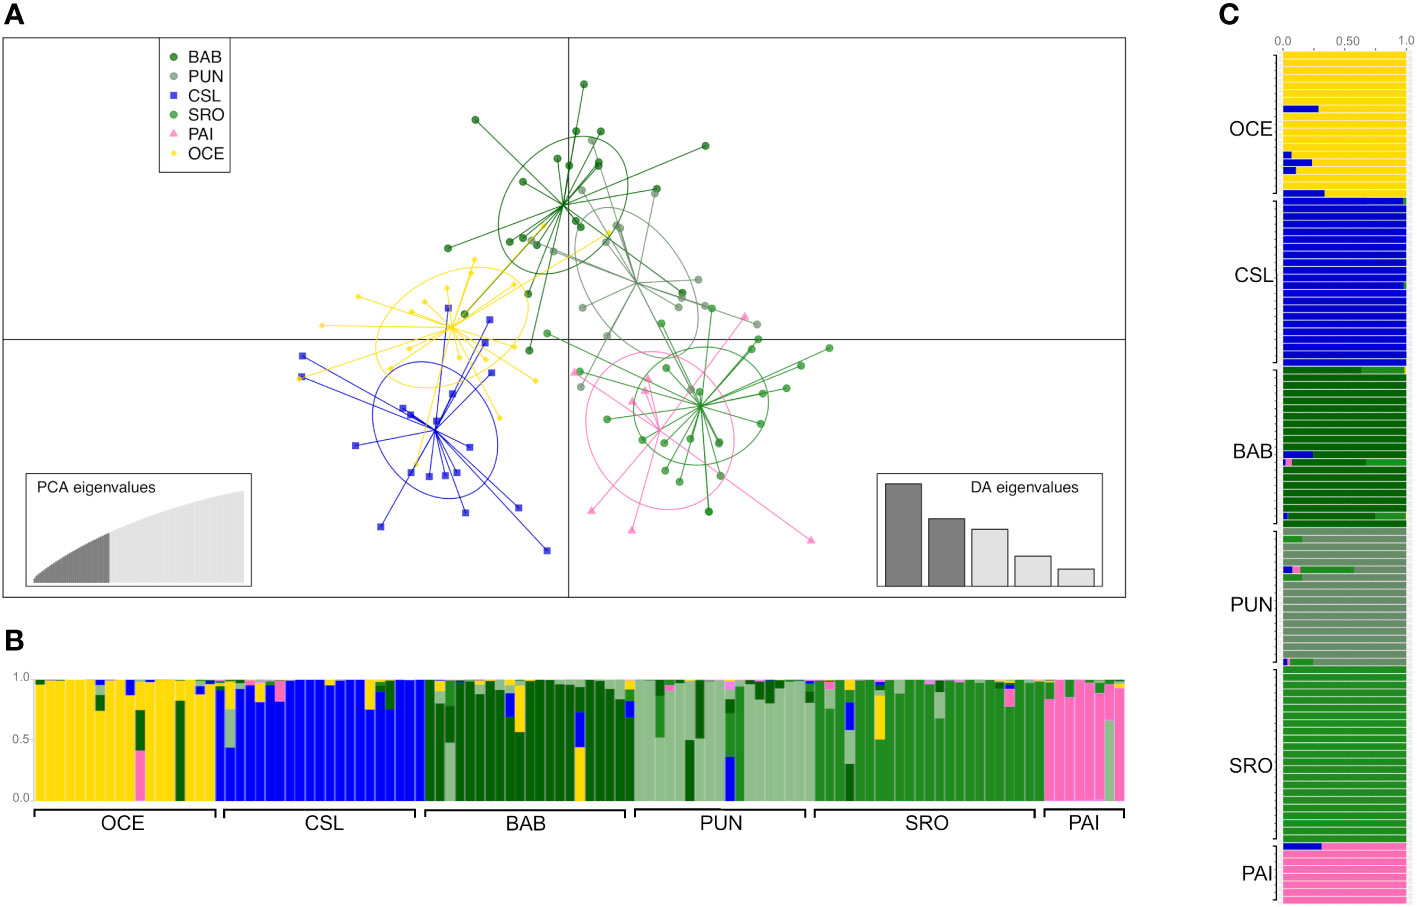
Figure 3 Clustering analysis of young of the year (YOY) individuals. (A) Scatterplot obtained from discriminant analysis of principal components (DAPC) using adegenet. Sample locations are shown as different colors, with dots representing individuals and ellipses representing 90% of variance. (B) DAPC bar plot showing the probabilities of assignment of individuals (along the y-axis) to the different pre-defined locations. (C) Admixture plot showing the ancestry of YOY samples. Individuals are represented by vertical lines partitioned into colored segments proportional to the ancestral components of the individual genome. Scheme colors are the same as in DAPC.
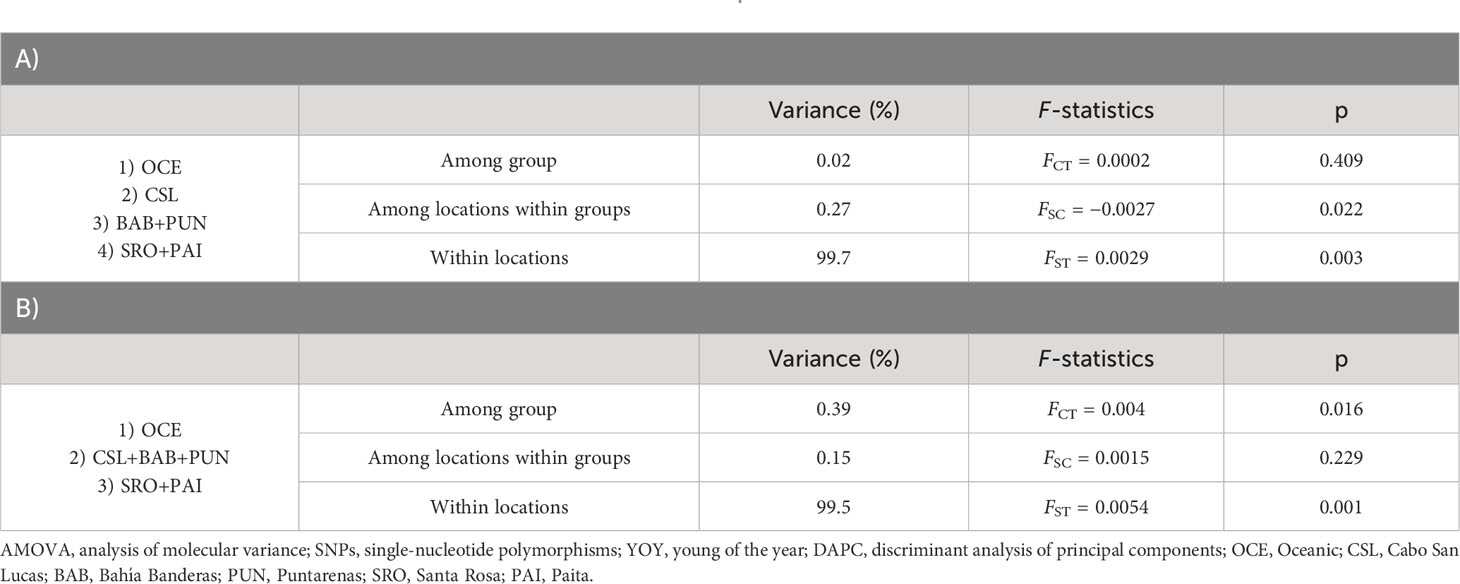
Table 2 Hierarchical AMOVA using 3,867 SNPs for YOY individuals with localities pooled into regions following the results from DAPC (A) and groups based on the oceanographic regions (B) defined by Fiedler and Talley (2006).
Admixture analysis resulted in a K = 6 with a clear separation of the three localities, Oceanic, Cabo San Lucas, and Bahía Banderas; an extent of admixture was observed between Puntarenas and Santa Rosa, while Paita appeared isolated (Figure 3), in consistence with the probabilities of assignment of individuals for each different pre-defined group from the DAPC (Figure 3). The DAPC using outlier loci showed no clear separation or clusters for localities containing YOY individuals (Supplementary Figure S3). This lack of resolution is common in species with extremely low levels of population differentiation or recent population divergence (Lawson et al., 2018). As a result, the AMOVA for outlier loci was omitted.
Estimates of pairwise sample FST between locations showed highly significant differences for comparisons between Oceanic samples vs. Cabo San Lucas (FST = 0.011; p = 0.0001) and vs. Santa Rosa (FST = 0.006; p = 0.019), whereas Cabo San Lucas showed differences vs. Santa Rosa (FST = 0.008; p = 0.0007) and vs. Paita (FST = 0.009; p = 0.009) (Table 3). After correcting for multiple testing, all these comparisons remained significant (p = 0.021). When testing the AMOVA considering the groups based on the oceanographic regions (Table 2), the variance among groups was low but statistically significant (FCT = 0.004; p = 0.016). No significant differences for pairwise FST estimates were recovered at any comparison for outlier loci (Supplementary Table S6A), and no differentiation was recovered with the DAPC (Supplementary Figure S3).
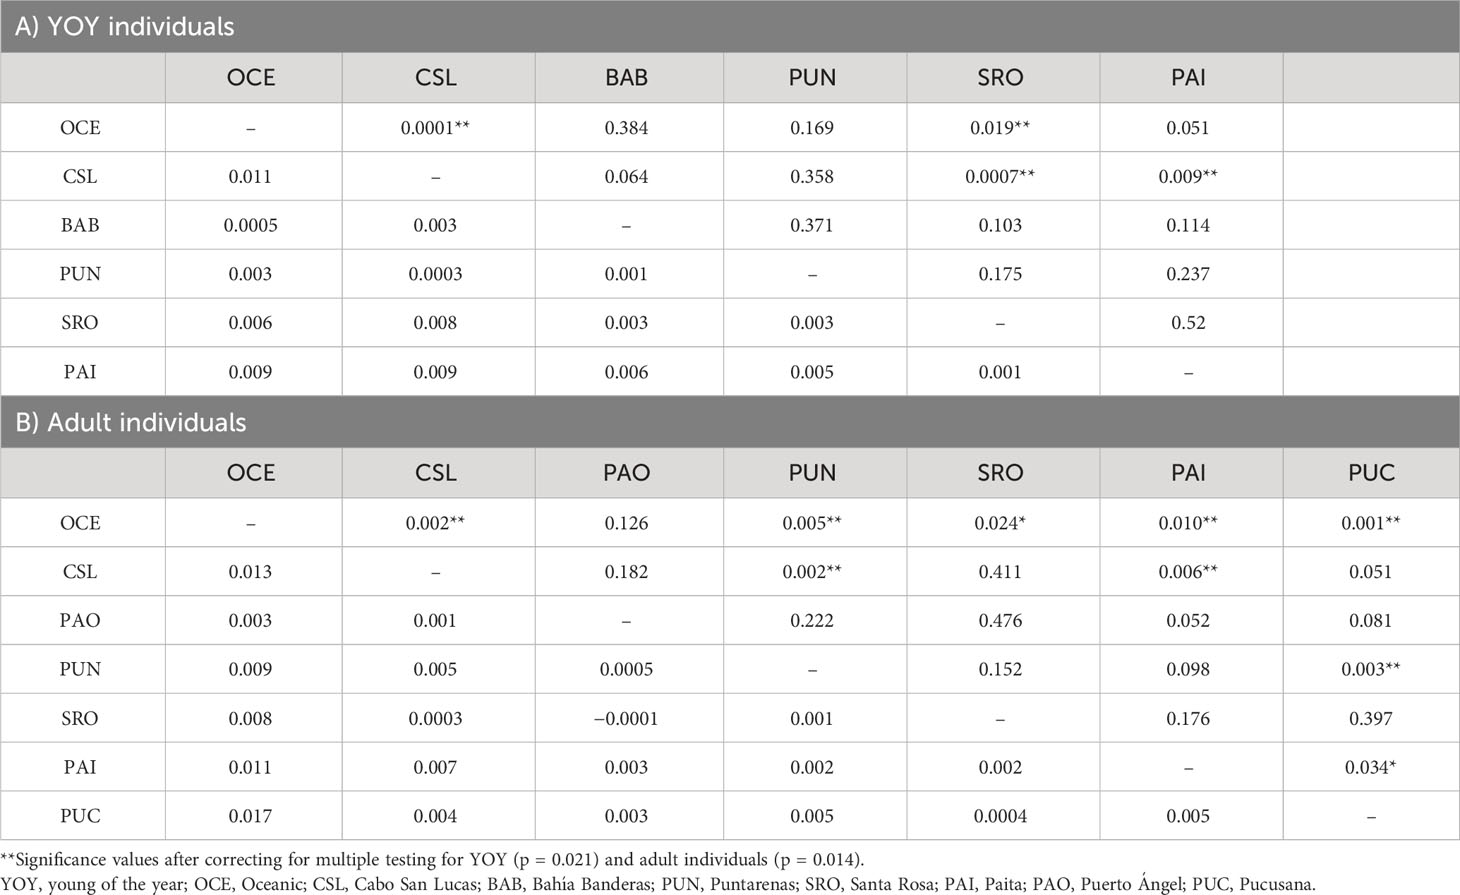
Table 3 Paired FST estimates for localities of dolphinfish in the Tropical Eastern Pacific and Peruvian region (below diagonal) and probabilities of significance (above diagonal) for (A) YOY (3,867) and (B) adult individuals (3,220).
Results from EEMS were consistent in identifying clear barriers to gene flow (Figure 4). The most spatially separated localities (Oceanic, Cabo San Lucas, and Paita) seemed isolated from the rest of the localities supporting the main differences observed for other analyses (AMOVA and DAPC). Cabo San Lucas and the Oceanic samples seemed to be isolated from the rest of the localities. Similarly, Bahía Banderas, a coastal location in Mexico, seemed to have low or no gene flow compared with that from Central America and South America. Peru (Paita) also shared low gene flow with Ecuador (Santa Rosa) and Central America (Puntarenas). This pattern of limited gene flow across the area is probably related to the general oceanography of the eastern Pacific.
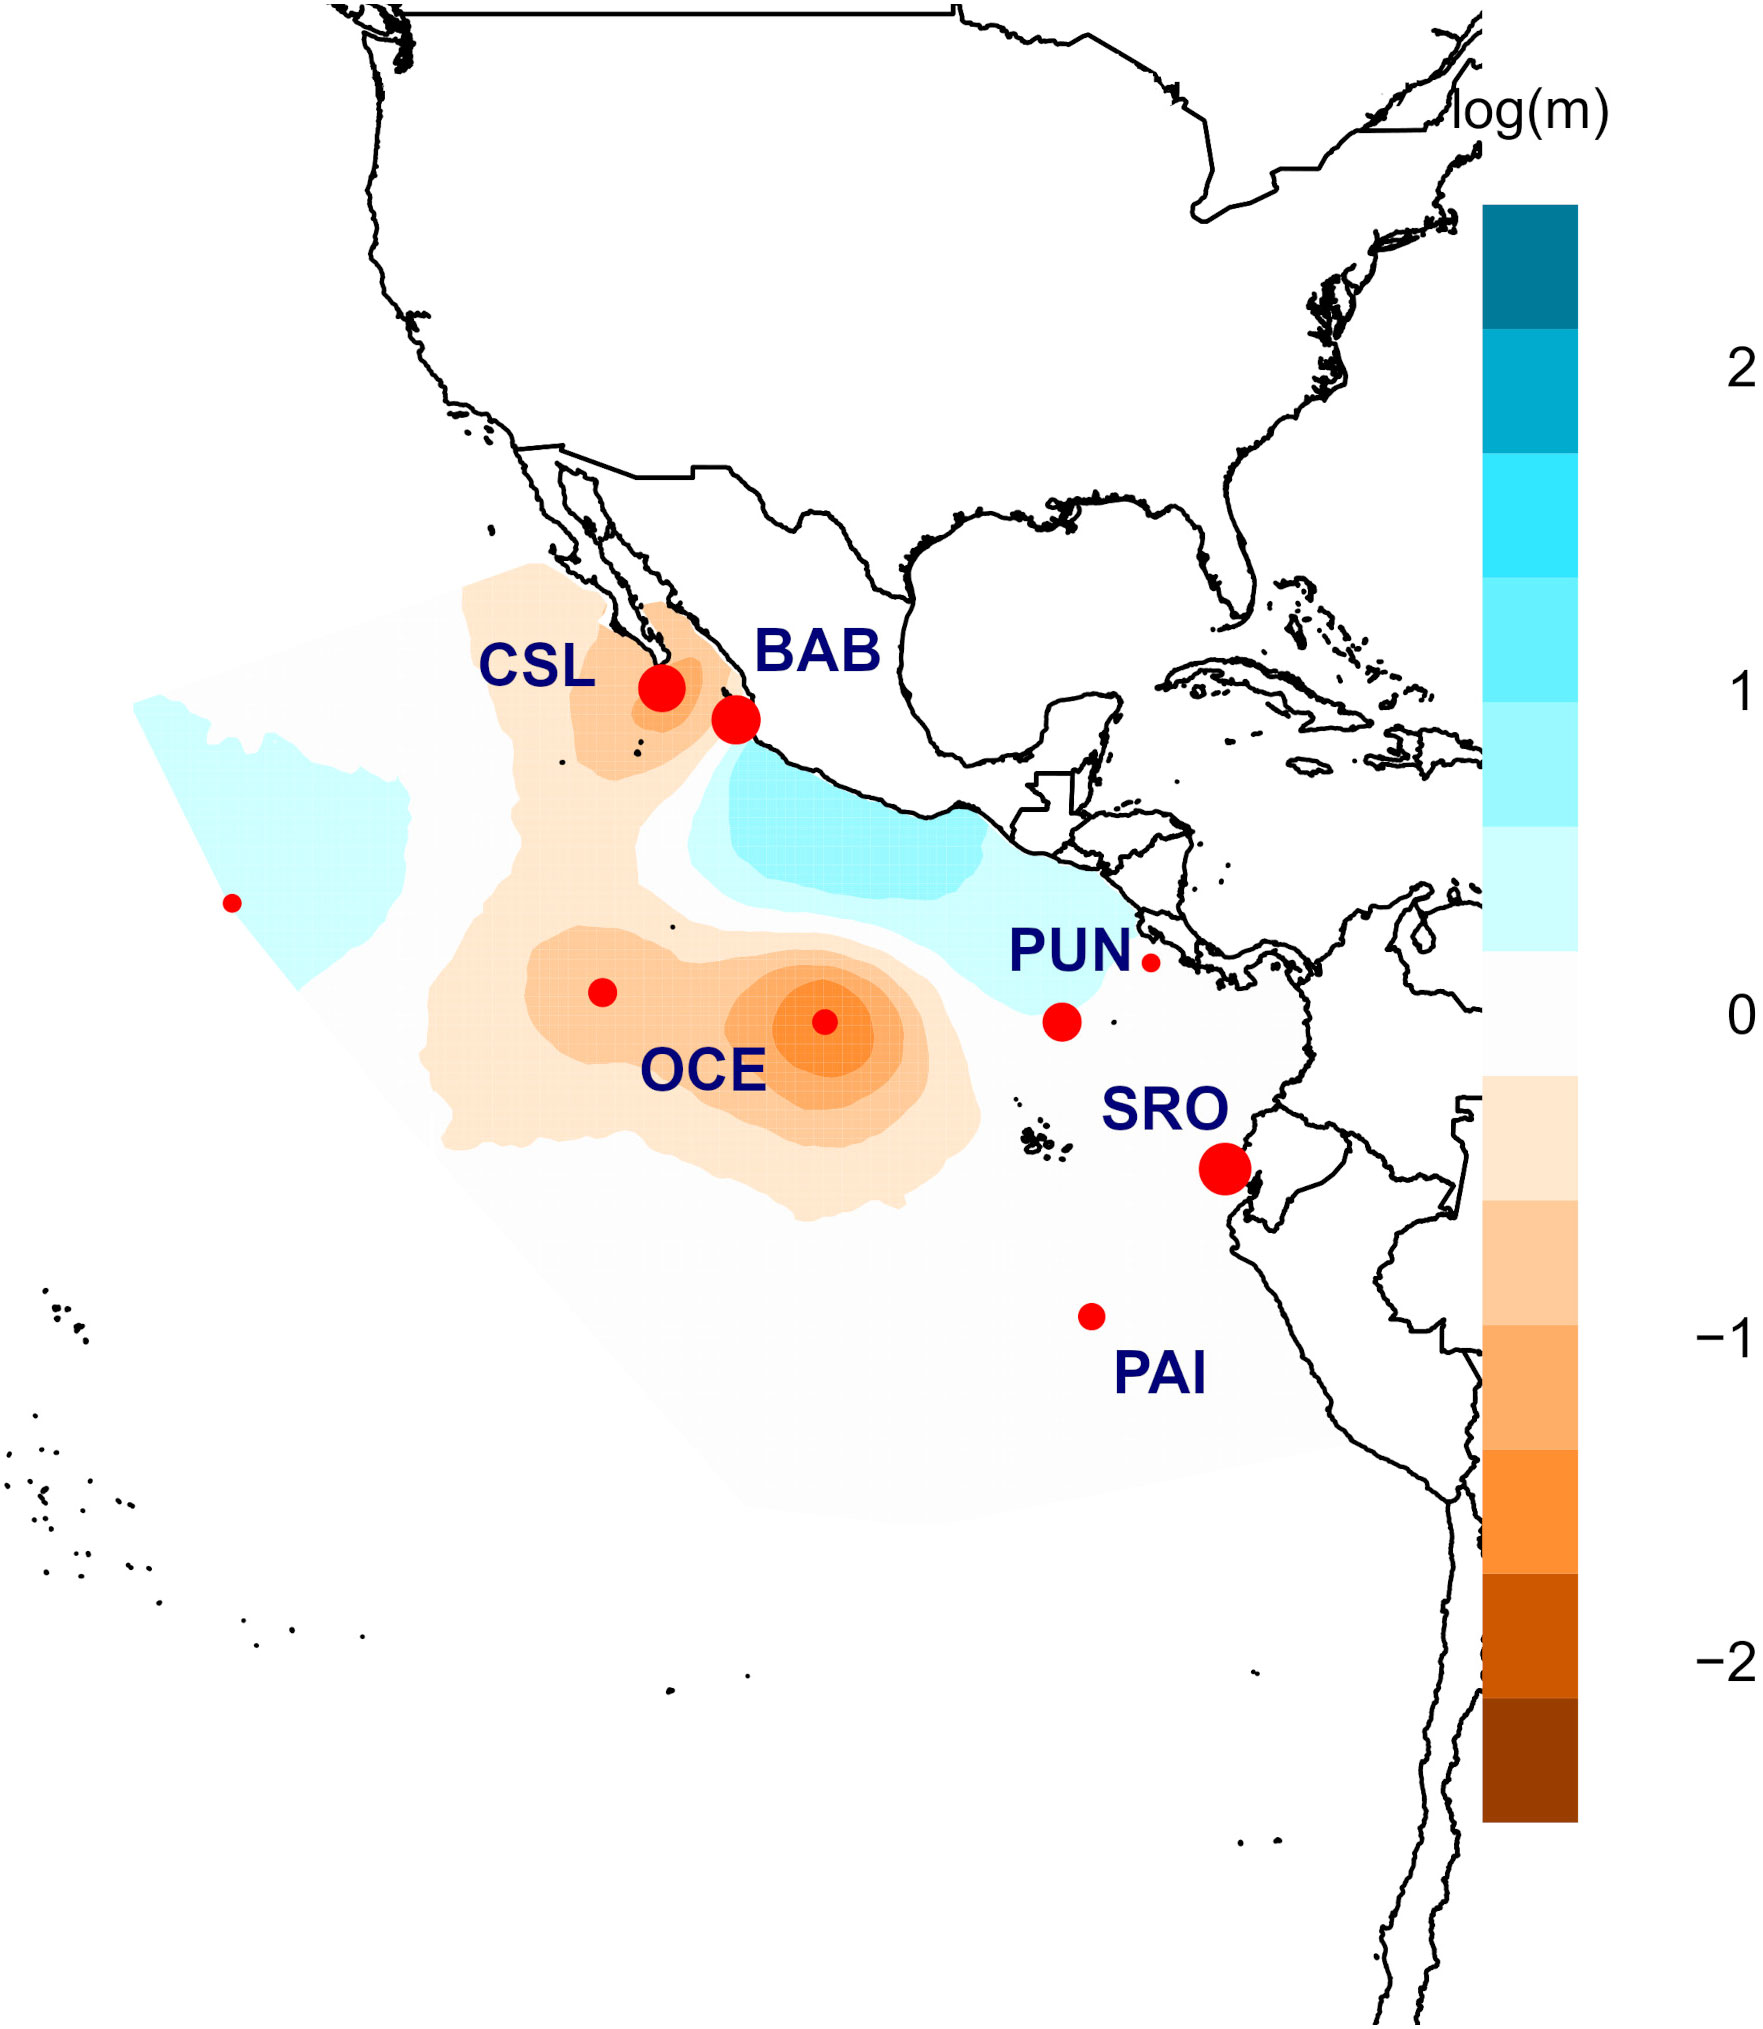
Figure 4 Posterior mean migration rates m (on the log 10 scale) for young of the year (YOY) individuals. Orange colors show potential barriers to gene flow, and blue ones correspond to potential corridors to gene flow.
The DAPC based on 120 PCs explained 80% of the variation for localities from Mexico (Cabo San Lucas and Puerto Ángel), Central America (Puntarenas), South America (Santa Rosa, Pucusana, and Paita), and Oceanic, using the number of sampling locations as before (Figure 5), which resulted in four groups: 1) Oceanic, 2) Cabo San Lucas + Santa Rosa, 3) Puerto Ángel, and 4) Puntarenas + Paita + Pucusana (Figure 5). The AMOVA considering the above groups (Table 4) resulted in low and statistically non-significant variance among groups (FCT = 0.0016; p = 0.157). The DAPC for outlier loci clearly separated Cabo San Lucas + Oceanic samples from Pucusana; these locations are most spatially separated at the north and south limits of the species distribution (Supplementary Figure S4A). The AMOVA using the identified groups from the DAPC for outlier loci was not statistically significant (FCT = 0.021; p = 0.087) (Supplementary Table S7A).
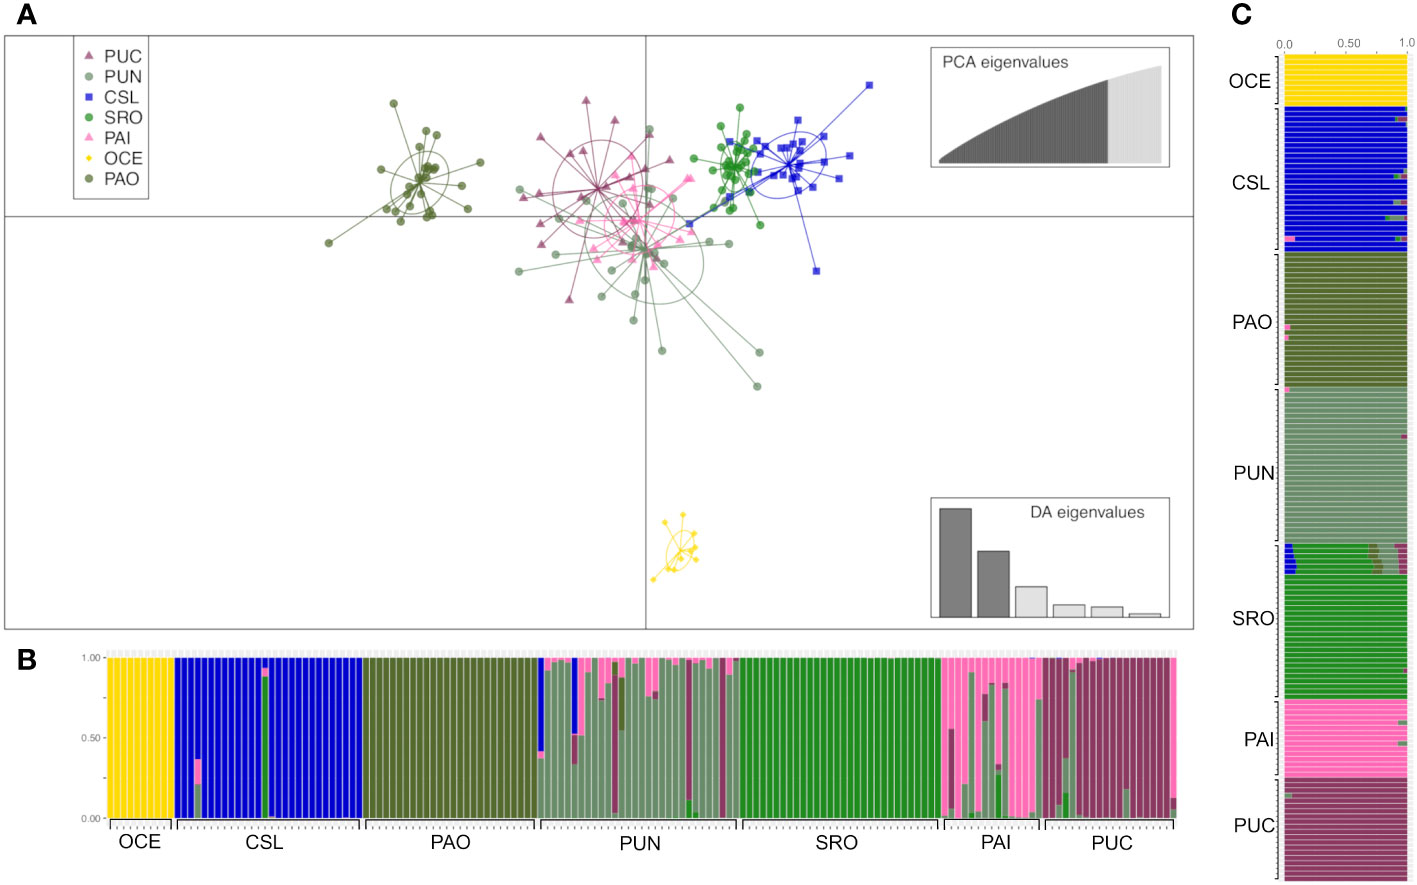
Figure 5 Clustering analysis of adult individuals of Coryphaena hippurus. (A) Scatterplot obtained from discriminant analysis of principal components (DAPC) using adegenet. Sample locations are shown as different colors, with dots representing individuals and ellipses representing 90% of variance. (B) DAPC bar plot showing the probabilities of assignment of each individual (along the y-axis) to the different pre-defined locations. (C) Admixture plot showing the ancestry of juvenile samples. Each individual is represented by a vertical line partitioned into colored segments proportional to the ancestral components of the genome of the individual. Scheme colors are the same as in DAPC.
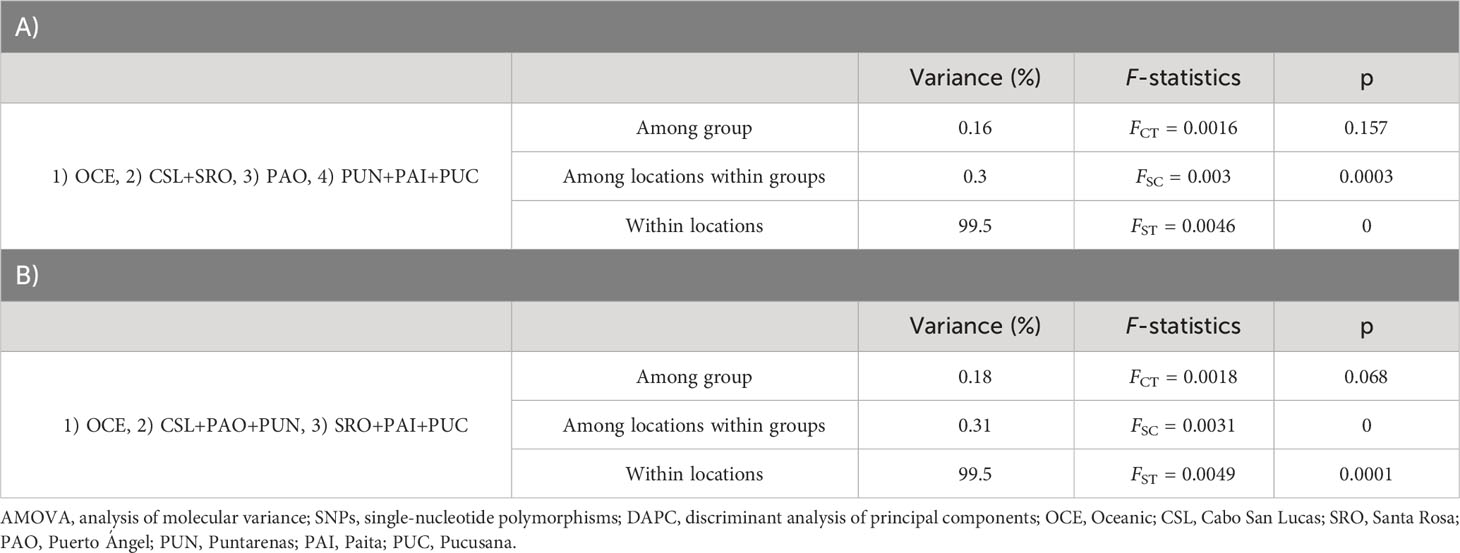
Table 4 Hierarchical AMOVA using 3,220 SNPs for adult individuals with localities pooled into regions following the results from DAPC (A) and groups based on the oceanographic regions (B) defined by Fiedler and Talley (2006).
The analysis of admixture was consistent with a K = 7, with each location being considered a separate cluster (Figure 5). However, the most differentiated locations were those separated by the DAPC (e.g., Oceanic, Puerto Ángel, Cabo San Lucas, and Santa Rosa) (Figure 5). Admixture for outlier loci resulted in a K = 1, and no differentiated clusters were observed (Supplementary Figure S4C).
Significant pairwise-sample FST estimates were obtained for nine out of 21 comparisons following a pattern of differences between the Oceanic area and locations at both extremes (north and south) of the species distribution in the TEP (Table 3). Differences were observed for the Oceanic locality vs. Cabo San Lucas (FST = 0.013; p = 0.002), Puntarenas (FST = 0.009; p = 0.005), Santa Rosa (FST = 0.008; p = 0.024), Paita (FST = 0.011; p = 0.010), and Pucusana (FST = 0.017; p = 0.001). However, Cabo San Lucas presented differences vs. Puntarenas (FST = 0.005; p = 0.002) and Paita (FST = 0.007; p = 0.006). Additionally, Pucusana showed significant differences with Puntarenas (FST = 0.005; p = 0.003) and Paita (FST = 0.005; p = 0.034). After correcting for multiple testing (p = 0.014), only seven comparisons remained significant, but interestingly, the pattern of differences was maintained in the Peruvian localities (Paita and Pucusana). The AMOVA using the groups based on oceanographic regions according to Fiedler and Talley (2006)—Oceanic, Eastern Central Pacific, and Southeastern Pacific (Table 4)—resulted also in low and nearly significant genetic differentiation among groups (FCT = 0.0018; p = 0.068). Pairwise sample estimates of FST for outlier loci resulted in significant differences only for comparisons between Puerto Ángel and Paita, which was no longer significant after correction for multiple testing (Supplementary Table S6B). The AMOVA applied for outlier loci using the groups based on oceanographic regions resulted in non-significant differences (FCT = 0.002; p = 0.403) (Supplementary Table S7B).
The analysis using EEMS identified potential barriers to gene flow for the most spatially separated locations. Oceanic and Paita–Pucusana samples were isolated from the rest of the locations in coincidence with the pattern observed for juveniles (Figure 6). Similarly, low or null gene flow was observed between Central America (Puntarenas), Mexico (Puerto Ángel), and Cabo San Lucas. Contrastingly, migrating corridors were observed between Central America (Puntarenas) and Ecuador (Santa Rosa), but low or no gene flow was observed from these locations compared with those from Mexico and Peru (Figure 6).
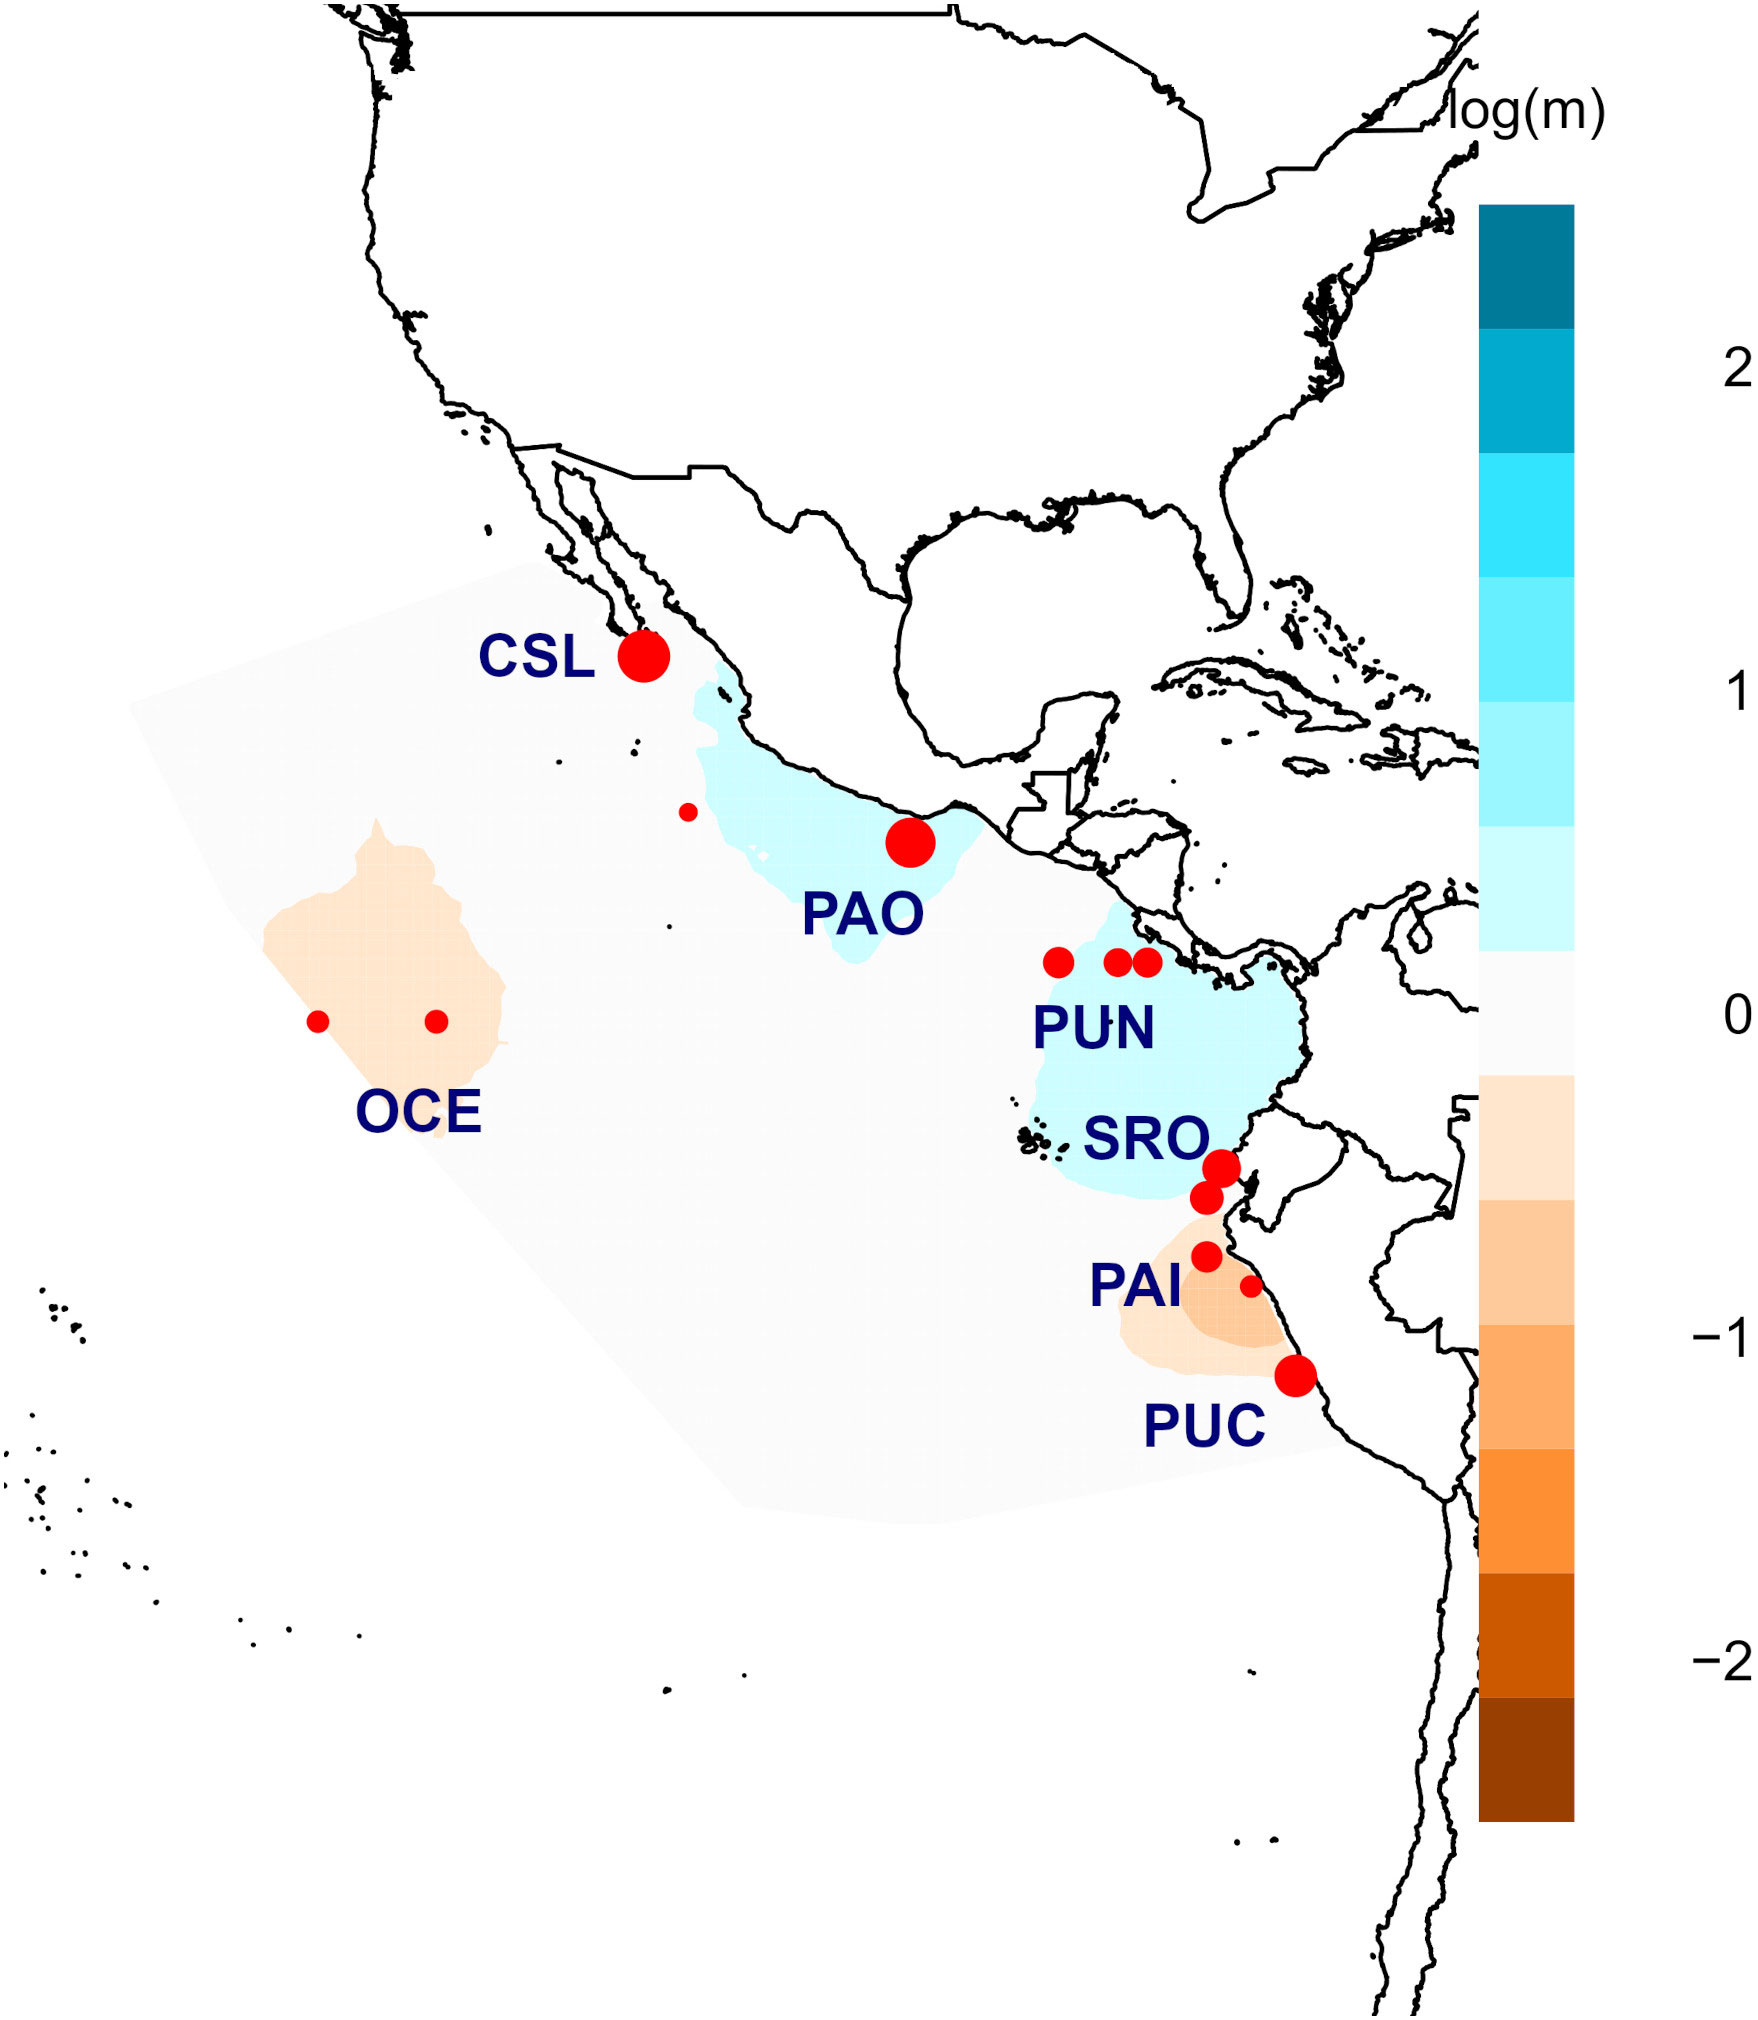
Figure 6 Posterior mean migration rates m (on the log 10 scale) for adult individuals. The orange colors show potential barriers to gene flow, and blue ones correspond to potential corridors to gene flow.
For YOY individuals, Puntarenas (Ne = 246.7) and Bahía Banderas (Ne = 233.9) exhibited the highest Ne values with lower but similar estimates for Cabo San Lucas (Table 5). Locations with low sample sizes resulted in infinite values as in the case of the Oceanic samples (n = 10) for adult individuals and Paita (n = 8) for YOY individuals. Ne estimates for adult individuals (Table 5) resulted in similar values except for Santa Rosa and Puntarenas, which showed the highest estimates (220.4 and 179, respectively), followed by Cabo San Lucas (134.4) and Pucusana (131). Puerto Ángel and Paita had the lowest estimates (99.2 and 68.3, respectively). Therefore, populations close to the equator showed the highest estimates in coincidence of the major abundance of dolphinfish in the TEP.
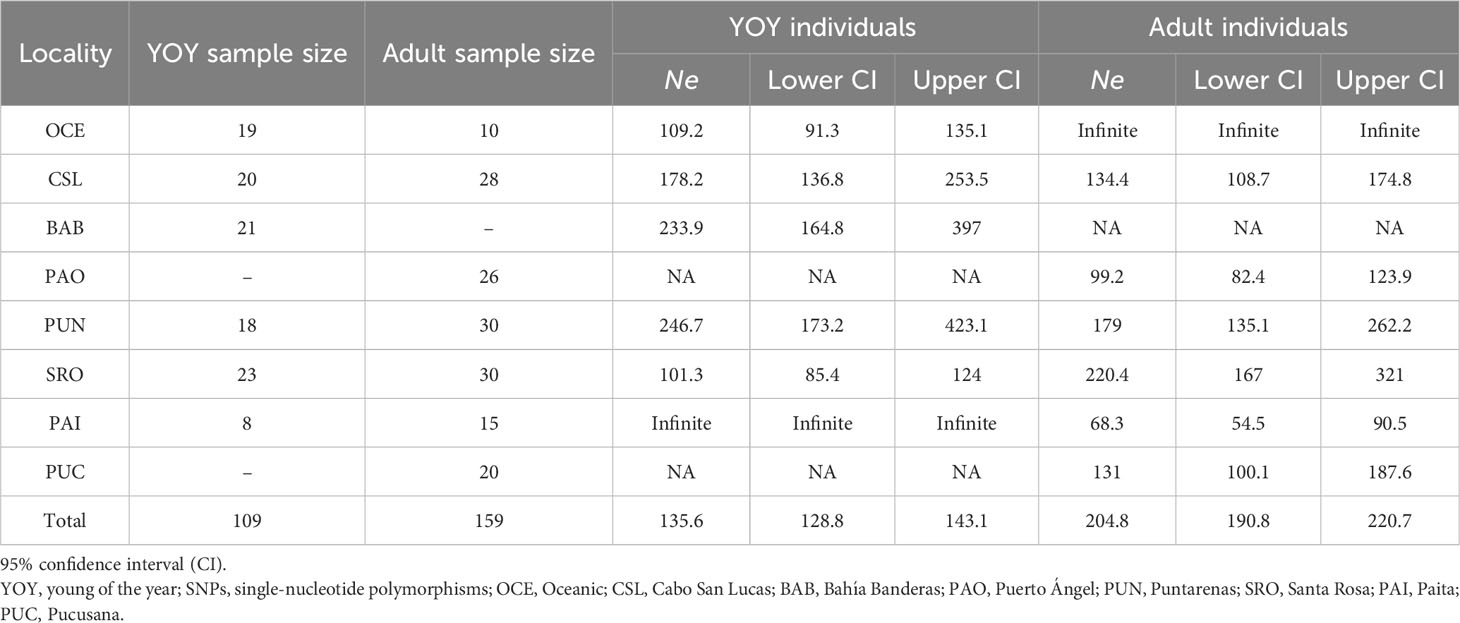
Table 5 Estimates of effective population size (Ne) of dolphinfish Coryphaena hippurus obtained for YOY (3,867 SNPs) and adult individuals (3,220 SNPs) per locality.
Ne values for locations into groups following the oceanographic regions (Table 6) resulted in similar estimates among regions for YOY (range 109.3–148.3) and adult (range 186.6–241.8) individuals. Overall, estimates were lower for YOY individuals (135.6) than for adult individuals (204.8).
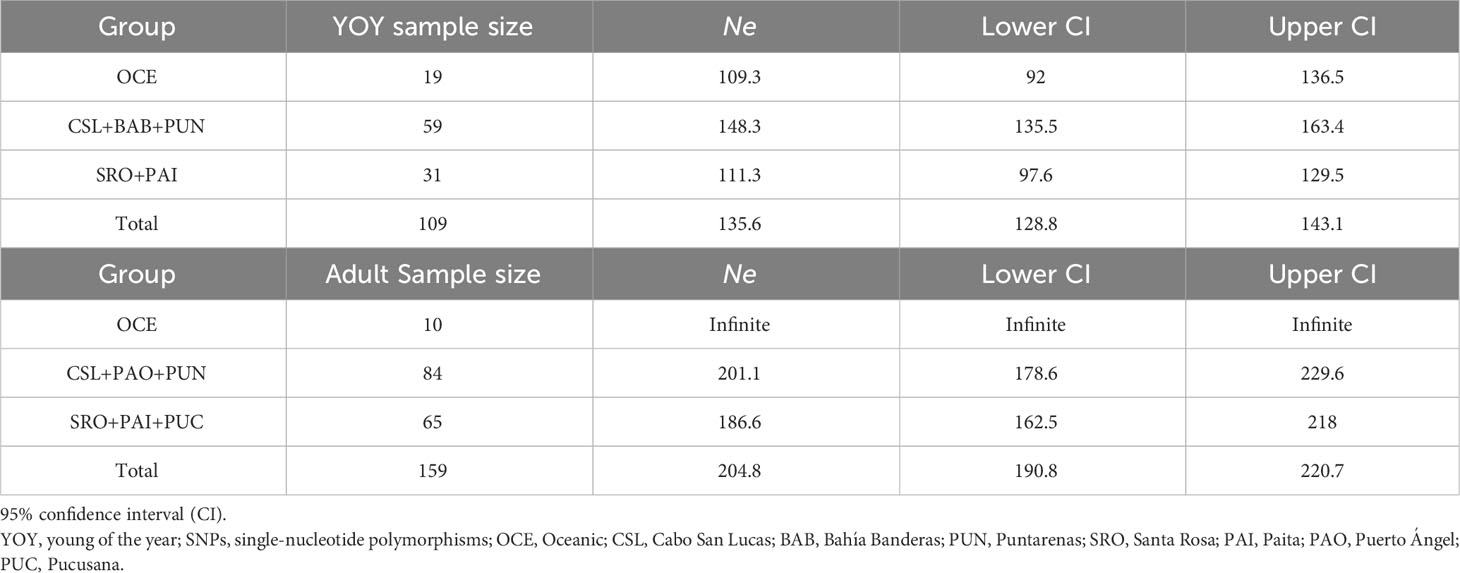
Table 6 Estimates of effective population size (Ne) of dolphinfish Coryphaena hippurus obtained for YOY (3,867 SNPs) and adult individuals (3,220 SNPs) per group following Fiedler and Talley (2006).
Overall results show high levels of connectivity across locations in the study area. However, genetic differences were observed for YOY individuals among sites from the northernmost and southernmost areas seemingly related to the spatial separation of locations. This pattern was confirmed also in adult individuals by the significant differences observed between Cabo San Lucas (Northern) and the two Peruvian localities (Southern). Moreover, the Oceanic location presented differences when compared to the shoreline sample sites in the TEP. Additionally, potential corridors were observed for gene flow in tropical latitudes, where the species has a higher abundance for both YOY and adult individuals, while barriers were detected among the northern and southernmost locations. The genetic pattern detected, in particular for YOY individuals, seems to be related to the oceanographic conditions in the Eastern Pacific, especially for populations with a limited species distributional range. Dolphinfish populations are being impacted by commercial fisheries in the area with no regulations (Ochoa-Zavala et al., 2022), and because of this, our study aimed to contribute information to delineate management units for species conservation. In a recent study, low effective population size and signs of inbreeding were found in populations that are under high fishery pressure (Ochoa-Zavala et al., 2022). However, until today, a clear management plan has not been delineated for this species, and considering at least three genetic clusters (Oceanic, Northern, and Southern) in a vast geographic and complex area constitutes the first step toward the implementation of management and conservation plans (Ochoa-Zavala et al., 2022).
Gene diversity of dolphinfish in the TEP was lower by half when compared to that of dolphinfish populations from the Mediterranean Sea based on 3,324 SNPs revealed by the 2bRAD protocol (Maroso et al., 2016) and notably lower than estimates obtained using microsatellite data (Tripp-Valdez et al., 2010). Estimation of population genetic parameters obtained from RADseq can vary among protocols due to unequal allele sampling during library preparation (Puritz et al., 2014). Also, usually, RADseq protocols underestimate diversity, as compared to microsatellites (Hodel et al., 2017) due to allele dropout, biasing gene diversity estimates downward due to null alleles, and PCR duplicates (Andrews et al., 2016). PCR duplicates represent a primary source of bias affecting allele frequency estimation, increasing homozygosity and hence gene diversity estimates. For most RAD protocols, no effective controls are implemented to reduce the bias on allele frequency estimation. In the present study, we used an improved RADseq (3RAD) protocol, reducing chimeras and allowing the identification of PCR duplicates (Bayona-Vásquez et al., 2019) using specific indexes for primers iTru5-8N when pooling samples. Therefore, reducing the bias resulting from PCR duplicates in allele frequency estimates increased confidence in our estimates of gene diversity. Moderate levels of heterozygosity (0.64–0.80) were estimated using microsatellite data by Ochoa-Zavala et al. (2022) along with low estimates of effective population size for dolphinfish populations in the eastern Pacific. These results were attributed to reductions in gene diversity due to commercial exploitation in this area where no regulations for quotes exist (Alejo-Plata, 2012; Guzman et al., 2015; Ochoa-Zavala et al., 2022). Reductions in gene diversity resulting from commercial exploitation have been reported for the swordfish Xiphias gladius (Yüncü et al., 2021), a cosmopolitan tropical pelagic species with similar distribution to dolphinfish and also a variety of exploited species, modifying genetic patterns usually observed in the marine realm (Allendorf et al., 2008) including a reduction in effective population size for several marine species (Pinsky and Palumbi, 2014). This may call attention to fishery managers, especially for top predator species that have recently been recognized as valuable fish resources (Pecoraro et al., 2020). Moreover, it has been estimated that fish species subjected to intense fishing pressure have less heterozygosity and low allelic richness.
Differences between the most spatially separated populations localized at the extremes of the species distribution including the Oceanic area were observed, as was previously reported for the species in the TEP based on microsatellite data (Ochoa-Zavala et al., 2022), indicating that individuals, although are able to disperse, may have limited movements at relatively small spatial scale. This pattern was recovered through genomic data for YOY individuals, which seemingly contain the genetic signal in their natal site. Those differences were less apparent for adult individuals that most probably have moved out of the site of origin, a result that is consistent with the limited movements among distant populations.
In the Mexican Pacific, tagging studies from Perle et al. (2020) have shown some extent of movements for dolphinfish individuals but mostly in short distances and were concluded to be related to seasonal surface temperature (SST) changes. In the study, where dolphinfish adult individuals were tagged using conventional and electronic tags for two locations on the coasts of Mexico (Pacific coasts of Baja California and Oaxaca), authors reported that the fish remained within the region in which they were tagged except for six individuals (out of 34 recovered) that moved between these areas. In addition, oceanographic conditions in the TEP impose restrictions on movements for pelagic species since they are highly dependent on sea surface temperature, limiting their distributional range.
As an example, in the case of dolphinfish, poleward range expansions in response to the increase of sea surface temperature have been registered during El Niño events in the Northeastern Pacific with the posterior retraction to the original range (Norton, 1999). This has been registered also for several fish and invertebrate species in the TEP in response to global change (Clarke et al., 2020).
Temperature dependence of pelagic species inhabiting tropical areas is of particular interest, as may promote genetic differences at the species distributional boundaries due to the founder effect experimented on in these areas during seasonal expansion cycles. As the sea surface increases during the summer season, populations at the species boundaries expand to suitable habitats, promoting range expansions, whereas in winter, populations shrink as SST decreases, causing expansion–contraction cycles, leaving a genetic fingerprint in these populations. These seasonal expansion–contraction cycles may result in modifications in allele composition (Buckley et al., 2010). The genetic imprint results from the reproduction of expanding individuals in the colonized areas, which consists of a small representation of the whole population’s gene diversity. Poleward range expansions beyond their usual limits reaching southern California waters in the North Pacific US coasts have been registered as a response to climate change during El Niño events (Norton, 1999).
This pattern has been scarcely explored in marine species especially in those with wide distributions due to the difficulties of sampling species at their range boundaries. In the present study, we were able to cover most of the latitudinal species’ range in the TEP and, using adult and YOY individuals and a panel of 3,000–4,000 SNPs, detected differences among the most separated locations in both latitudinal and longitudinal scales. Previous studies using sequences of mtDNA-ND1 gene did not define differences covering a similar spatial scale in the TEP (Díaz-Jaimes et al., 2006). However, using the same dolphinfish samples and microsatellite data, Ochoa-Zavala et al. (2022) were able, for the first time, to detect this pattern of genetic differences in the eastern Pacific that included genetic differences between populations at the extremes of the species’ range that were associated with oceanographic conditions. The genetic pattern reported is very similar to the one found in the present study, especially for YOY individuals, which could be explained by a combination of limited dispersal and variations in oceanographic conditions.
Demographic processes related to climatic conditions have a main role in defining the genetic architecture of populations (García-de León et al., 2018; Zhang et al., 2020; Knutsen et al., 2022). Extinction and recolonization cycles taking place within the limits of environmental tolerance for tropical marine species may modify the allele frequencies, as, at these extreme conditions, only a few individuals contribute to the gene pool after a reproductive event. Spawning at these boundaries has been reported for other pelagic species such as yellowfin tuna (Schaefer et al., 2007), the swordfish (Claramunt et al., 2009; Guzmán-Rivas et al., 2023), including the dolphinfish. In the area of Los Cabos, mature organisms are recorded throughout the year, being more frequent during the summer and autumn months (Zúñiga-Flores et al., 2011). The biggest reproductive activity reported of the dolphinfish in Peru is during the austral summer, although some authors have reported hydrated oocytes in December, February, and March (Solano-Sare et al., 2008; Solano-Sare et al., 2015; Despacho Viceministerial de Pesca y Acuicultura, 2016).
Colonization–expansion cycles bring expanding individuals under the effects of a mutation-drift process, resulting in changes in their allele frequencies faster than in the areas where the species has the major abundances (e.g., stable warm latitudes). Moreover, as this process can be favored during El Niño events, which promote the species range expansion, it probably results in adaptive selection. However, based on paired FST estimates (Supplementary Table S6), we were unable to detect consistent differences for adaptive loci, although we observed a pattern of differences associated with the spatial separation of locations only for adult individuals in the DAPC, consistent with that observed for neutral loci.
The similitude found with this study based on SNPs and that of Ochoa-Zavala et al. (2022) based on microsatellites and the lack of genetic differences for outliers support the effect of a mutation-drift process acting in the differences observed since microsatellites are mostly neutral. These cycles repeat across generations and may leave a genetic fingerprint in populations in areas where there are species boundaries. Differences caused by adaptation to heterogeneous oceanographic features may correspond to a selection-drift model. These differences can be delayed when genetic drift becomes a major factor in eliminating genetic variants because of colonization–expansion cycles; therefore, the time for selection to act in these areas in changing significantly the allele frequencies may be delayed.
Clear patterns of barriers and corridors to gene flow were observed for both YOY and adult individuals. For YOY individuals, the most spatially separated locations (Oceanic, Los Cabos, and Paita) appeared isolated from the rest of the locations, supporting the main differences observed for other analyses (AMOVA and DAPC). The general pattern points toward limited gene flow among the most separated localities determined by low-range movements and/or high residence of individuals revealed by tagging studies in the eastern Pacific combined with the oceanic circulation in the TEP. Whereas limited dispersal, especially in YOY individuals, is relevant for the genetic differences detected among spatially separated localities, barriers to gene flow between Mexico and Central America seem to be related to the oceanographic conditions between both areas.
Although tagging studies in the eastern Pacific have registered movements toward northern areas in the Mexican Pacific, those seem not to be so common (Perle et al., 2020). Similarly, a recent study using stable isotope elements (Briones-Hernández et al., 2023) in the eastern Pacific to infer dispersal of dolphinfish individuals found low dispersal for juveniles and higher dispersal in adult individuals, which is congruent with the genetic signal for YOY individuals observed in this study. Interestingly, the individuals used for this and the present study were the same except for Peru samples, highlighting the consistency of our results and pointing to a limited dispersal for juveniles and higher dispersal in adult individuals.
Similarly, oceanography in the TEP is characterized by the convergence of northern (California) and southern (Humboldt) currents at equatorial latitudes, generating a westward superficial and sub-superficial water flow and turbulence in equatorial waters (Fiedler and Talley, 2006; Kessler, 2006). These conditions may promote isolation of populations to the north and south of this convergence considering that larval drift is a major dispersal mechanism for dolphinfish populations. The barrier between oceanic and coastal samples may be related to the limited ability of adult individuals to perform movements toward oceanic areas and/or the high residence of individuals, in particular females, to remain in coastal areas (Solano-Sare et al., 2008; Solano-Sare et al., 2015).
The Ne estimates for both YOY and adult individuals resulted in lower estimates as compared to the microsatellite study of Ochoa-Zavala et al. (2022) based on microsatellites. However, for adult individuals, estimates of Ne showed similar values as those reported for other circumtropical distributed species, the pelagic Galapagos shark Carcharhinus galapagensis (Ne = 200), based on genomic data (Pazmiño et al., 2019). In contrast, our Ne estimates were slightly lower than those of the pelagic manta ray Mobula alfredi (Ne = 375; Venables et al., 2021) and the gray nurse shark Carcharias taurus (Ne = 400; Reid-Anderson et al., 2019). Even though differences in life history between teleost fish and elasmobranch result in determinants on genetic diversity levels for both groups and hence may not be fully comparable, the Galapagos shark is a pelagic species displaying a similar distribution as the dolphinfish and similar biological features as other widely distributed pelagic sharks. Waples et al. (2013) have demonstrated that larger estimates of Ne are possible in species with long ages of maturity and large generational times as in the case of elasmobranch as compared to dolphinfish.
The census size of dolphinfish populations is larger than estimates of Ne obtained here. An approximation of the census size can be obtained by considering the maximum mean catches of 80,000 metric tons for the Southeastern Pacific (Ecuador and Peru). Also considering a mean size of 100 cm for fish caught in the Pacific waters of Panama (Guzman et al., 2015), we can infer a mean weight of 8 kg per individual according to Alejo-Plata et al. (2011). With these data, we can obtain a rough estimate of the census population size of 10,000,000 individuals for the South Pacific. The Ne/Nc ratio following our estimate is 0.2 × 10⁻⁵, which is consistent with the ratio estimated for marine species (Hare et al., 2011) and a ratio also congruent with species relying on environmental conditions for reproductive success as in the case of most pelagic species. Therefore, levels of gene diversity seem to be consistent with the expectations for healthy populations subjected to an intensive exploitation regime as in the case of dolphinfish in the Southern Pacific.
Management strategies are needed to preserve the viability of populations in areas where the species is highly impacted through fisheries in the Southeastern Pacific, even more when discrete populations have been identified in the northern and southern limits of the species range and migrating corridors have been detected between neighboring populations, maintaining the links between populations and adequate levels of gene diversity.
The original contributions presented in the study are included in the article/Supplementary Material, all supplementary databases have been uploaded to a Zenodo repository: DOI: 10.5281/zenodo.8341927 (https://zenodo.org/records/8341927).
The samples used in this study come from specimens caught in commercial fisheries. The operations and the fish activities are legal and authorized by government instances in each country.
AM-S: Formal analysis, Methodology, Writing – original draft. PD-J: Formal analysis, Methodology, Conceptualization, Supervision, Writing – review & editing. MO-Z: Formal analysis, Methodology, Writing – review & editing. SO-G: Writing – review & editing, Conceptualization, Funding acquisition, Project administration, Supervision. GS: Methodology, Resources, Writing – review & editing. AA: Resources, Writing – review & editing. TE: Writing – review & editing, Funding acquisition. EE: Resources, Writing – review & editing. JC-R: Resources, Writing – review & editing.
The author(s) declare financial support was received for the research, authorship, and/or publication of this article. Walton Family foundation (Grants 2018-524, 00104468) and Project Global Sustainable Supply Chains for Marine Commodities (Grant 5271).
Authors are thankful to Dr. Ulianov Jakes-Cota, the PISCES sports fleet, particularly to Biol. Carlos Narro, PhD. Guillermo Compeán, to M.Sc Gabriel Aldana, and the staff of the Observer Program of the Commission Inter-American Association of Tropical Tuna (Mazatlán headquarters). Samples collection at CSL was supported with the research projects SIP 20200258, SIP20211174. In Costa Rica, authors are thankful to the Exporter Frumar S.A company. especially to Dr. Diana M. Guerra Muñoz, to the Department of Research of the Costa Rican Institute of Fisheries and Aquaculture, to the Sector National Longliner, in particular to Mauricio González Executive Director of this organization, to the M.Sc. Liliana Rendon and Sandra Andraka from EcoPacific. In Ecuador, authors are thankful to the Public Institute for Aquaculture Research and Fisheries of Ecuador, especially to the Director Mgs. Juan Javier Garcia Bodniza, Deputy Director Mgs. María del Pilar Solis Coello Carmen Cabanilla, and Eduardo Macías from the Santa Rosa Cooperative. Peru: David Fiestas of the Cooperative Artisanal Fisheries Jehovah, Jehovah de Reyes de la Islilla, José Puchulan from Institute of the Sea of Peru, and Rosario Escobedo, independent consultant, and Stefany Rojas and Renato Gozzer from Sustainable Fisheries Partnership. Our thanks for all the support provided to the Regional Committee of Producers and Processors of Mahi (COREMAHI). SOG is a fellowship recipient of Comision de Operacion y Fomento de Actividades Academicas (COFAA). This study was supported by the Walton Family Foundation and the Global Sustainable Supply Chains for Marine Commodities (GMC) project. GMC is an interregional initiative implemented by the Ministries and Bureaus of Fisheries and Planning of Costa Rica, Ecuador, Indonesia, and the Philippines, with the technical support of the United Nations Development Programme (UNDP), facilitated by Sustainable Fisheries Partnership (SFP), and supported by the Global Environment Facility (GEF). Laboratory work was supported by the grant 611 from Instituto de Ciencias del Mar y Limnología, UNAM. Finally, we are thankful for the bioinformatic support provided by the Chihuil cluster, from Instituto de Ciencias del Mar y Limnologia, Unidad Mazatlán.
The authors declare that the research was conducted in the absence of any commercial or financial relationships that could be construed as a potential conflict of interest.
All claims expressed in this article are solely those of the authors and do not necessarily represent those of their affiliated organizations, or those of the publisher, the editors and the reviewers. Any product that may be evaluated in this article, or claim that may be made by its manufacturer, is not guaranteed or endorsed by the publisher.
The Supplementary Material for this article can be found online at: https://www.frontiersin.org/articles/10.3389/fmars.2023.1294509/full#supplementary-material
Agapow P. M., Burt A. (2001). Indices of multilocus linkage disequilibrium. Mol. Ecol. Notes 1 (1-2), 101–102. doi: 10.1046/j.1471-8278.2000.00014.x
Aires-da-Silva A., Lennert-Cody C. E., Maunder M. N., Román-Verdesoto M., Minte-Vera C., Vogel N. W., et al. (2014). “Preliminary results from IATTC collaborative research activities on dorado in the eastern Pacific Ocean and future research plan,” in Document SAC-05-11b. Inter-American Tropical Tuna Commission, Scientific Advisory Committee, Fifth Meeting. 1–27. Available at: https://www.iattc.org/getattachment/d0d7d423-f291-4f70-badf-0f5ea5a11a4e/SAC-05-11b_Investigacion-del-dorado.pdf.
Aires-da-Silva A., Valero J. L., Maunder M. N., Minte-Vera C., Lennert-Cody C., Román M. H., et al. (2016). Exploratory stock assessment of dorado (Coryphaena hippurus) in the Southeastern Pacific Ocean. Available at: https://www.iattc.org/Meetings/Meetings2016/SAC-07/PDFs/Docs/_English/SAC-0706a(i)-Dorado-assessment.pdf.
Alejo-Plata M. C. (2012). Biología del dorado Coryphaena hippurus (Linnaeus 1758) y sus implicaciones para la pesquería artesanal del Pacífico sur de México. Thesis. UNAM. Available at: http://132.248.9.195/ptd2013/junio/0695845/Index,html.
Alejo-Plata C., Gómez-Márquez J. L., Salgado-Ugarte I. H. (2011). Edad y crecimiento del dorado Coryphaena hippurus, en el Golfo de Tehuantepec, México. Rev. Biología Marina y Oceanografía. 46, 125–134. doi: 10.4067/S0718-19572011000200003
Allendorf F. W., England P. R., Luikart G., Ritchie P. A., Ryman N. (2008). Genetic effects of harvest on wild animal populations. Trends Ecol. Evol. 23 (6), 327–337. doi: 10.1016/j.tree.2008.02.008
Andrews K. R., Good J. M., Miller M. R., Luikart G., Hohenloe P. A. (2016). Harnessing the power of RADseq for ecological and evolutionary genomics. Nat. Rev. Genet. 17, 81–92. doi: 10.1038/nrg.2015.28
Bayona-Vásquez N. J., Glenn T. C., Kieran T. J., Pierson T. W., Hoffberg S. L., Scott P. A., et al. (2019). Adapterama III: Quadruple-indexed, double/triple-enzyme RADseq libraries (2RAD/3RAD). PeerJ. 7, e7724. doi: 10.7717/peerj.7724
Beardsley G. L. Jr. (1967). Age, growth and reproduction of the dolphinfish, Coryphaena hippurus, in the Straits of Florida. Copeia. 1967, 441–451. doi: 10.2307/1442132
Benjamini Y., Yekutieli D. (2001). The control of the false discovery rate in multiple testing under dependency. Annals of statistics. 1165–1188. doi: 10.1214/aos/1013699998
Briones-Hernández S. A., Galván-Piña V. H., Aguilar-Palomino B., Elorriaga-Verplancken R., Barajas-Calderón A. V., Delgado-Huertas A., et al. (2023). Movements and tropic ecology of dolphinfish (Coryphaena hippurus) in the Mexican Central Pacific inferred from stomach content, bulk, and compound-specific stable isotope analyses. Mar. Biol. 170, 88. doi: 10.1007/s00227-023-04217-0
Buckley J., Bridle J. R., Pomiankowski A. (2010). Novel variation associated with species range expansion. BMC Evol. Biol. 10, 382. doi: 10.1186/1471-2148-10-382
Catchen J., Hohenlohe P. A., Bassham S., Amores A., Cresko W. A. (2013). Stacks: An analysis tool set for population genomics. Mol. Ecol. 22, 3124–3140. doi: 10.1111/mec.12354
Claramunt G., Herrera G., Donoso M., Acuña E. (2009). Spawning period and fecundity of swordfish (Xiphias gladius) caught in the southeastern Pacific. Latin Am. J. Aquat. Res. 37 (1), 29–41. doi: 10.3856/vol37-issue1-fulltext-3
Clarke T. M., Reygondeau G., Wabnitz C., Robertson R., Ixquiac-Cabrera M., López M., et al. (2020). Climate change impacts on living marine resources in the Eastern Tropical Pacific. Diversity Distributions. 00, 1–17. doi: 10.1111/ddi.13181
Crawford D. L., Oleksiak M. F. (2016). Ecological population genomics in the marine environment. Briefings Funct. Genomics 15 (5), 342–351. doi: 10.1093/bfgp/elw008
Danecek P., Auton A., Abecasis G., Albers C. A., Banks E., DePristo M. A., et al. (2011). The variant call format and VCFtools. Bioinformatics. 27 (15), 2156–2158. doi: 10.1093/bioinformatics/btr330
Despacho Viceministerial de Pesca y Acuicultura. (2016). Plan de Acción Nacional para la conservación y manejo del recurso perico en el Perú, PAN Perico - Perú. RESOLUCIÓN VICE-MINISTERIAL N° 81-2016-PRODUCE/DVPA. Lima, Perú.
Díaz-Jaimes P., Uribe-Alcocer M., Ortega-García S., Durand J. D. (2006). Spatial and temporal mitochondrial DNA genetic homogeneity of dolphinfish populations (Coryphaena hippurus) in the eastern central Pacific. Fisheries Res. 80, 333–338. doi: 10.1016/j.fishres.2006.04.015
Do C., Waples R. S., Peel D., Macbeth G. M., Tillett B. J., Ovenden J. R. (2014). NEEstimator v2: re-implementation of software for the estimation of contemporary effective population size (Ne) from genetic data. Mol. Ecol. Res. 14, 209–214. doi: 10.1111/1755-0998.12157
Ely B., Viñas J., Alvarado Bremer J. R., Black D., Lucas L., Covello K., et al. (2005). Consequences of the historical demography on the global population structure of two highly migratory cosmopolitan marine fishes: the yellowfin tuna (Thunnus albacares) and the skipjack tuna (Katsuwonus pelamis). BMC Evolutionary Biol. 5, 1–9. doi: 10.1186/1471-2148-5-19
Excoffier L., Lischer H. E. L. (2010). Arlequin suite ver 3.5: A new series of programs to perform population genetics analyses under Linux and Windows. Mol. Ecol. Resources. 10, 564–567. doi: 10.1111/j.1755-0998.2010.02847.x
FAO (2020)Fishery and Aquaculture statistics. Global commodities production and trade 1976 - 2015 (FishStatJ). In: FAO fisheries and aquaculture department (Rome). Available at: www.fao.org7fishery/statistics/software/fishstatj/en (Accessed on 14 January 2020).
Farrell E. R., Boustany A. M., Halpin G. N., Hammond D. L. (2014). Dolphinfish (Coryphaena hippurus) distribution in relation to biophysical ocean conditions in the northwest Atlantic. Fisheries Res. 151, 177–190. doi: 10.1016/j.fishres.2013.11.014
Fiedler P. C., Lavín M. F. (2017). Oceanographic Conditions of the Eastern Tropical Pacific. In: Glynn P., Manzello D., Enochs I. (eds) Coral Reefs of the Eastern Tropical Pacific. Coral Reefs of the World, vol 8. Springer, Dordrecht. doi: 10.1007/978-94-017-7499-4_3
Fiedler P., Talley L. D. (2006). Hydrography of the eastern tropical Pacific: A review. Prog. Oceanography. 69, 143–180. doi: 10.1016/j.pocean.2006.03.008
Foll M., Gaggiotti O. (2008). A genome-scan method to identify selected loci appropriate for both dominant and codominant markers: a Bayesian perspective. Genetics. 180, 977–993. doi: 10.1534/genetics.108.092221
García-de León F. J., Galván-Tirado C., Sánchez-Velasco L., Silva-Segundo C. A., Hernández-Guzmán R., Barriga-Sosa I. A., et al. (2018). Role of oceanography in shaping the genetic structure in the North Pacific hake Merluccius productus. PLoSONE 13 (3), e0194646. doi: 10.1371/journal.pone.0194646
Glenn T. C., Pierson T. W., Bayona-Vásquez N. J., Kieran T. J., Hoffberg S. L., Thomas Iv J. C., et al. (2019). Adapterama II: universal amplicon sequencing on Illumina platforms (TaggiMatrix). PeerJ. 7, e7786. doi: 10.7717/peerj.7786
Goudet J., Jombart T. (2020). Hierfstat: Estimation and Tests of Hierarchical F-Statistics. R Package Version 0.5-7. Available at: https://CRAN.R-project.org/package=hierfstat.
Grant W. A. S., Bowen B. W. (1998). Shallow population histories in deep evolutionary lineages of marine fishes: insights from sardines and anchovies and lessons for conservation. J. Heredity. 89, 415–426. doi: 10.1093/jhered/89.5.415
Guzman H. M., Díaz-Ferguson E., Vega A. J., Robles Y. A. (2015). Assessment of the dolphinfish Coryphaena hippurus (Perciformes: Coryphaenidae) fishery in Pacific Panama. Rev. Biol. Trop. 63 (3), 705–716. doi: 10.15517/rbt.v63i3.15487
Guzmán-Rivas F., Ortega J., Mora S., Barría P., Riera R., Urzúa Á. (2023). Temporal and inter-individual changes in the integrated biochemical condition of the gonads of female swordfish (Xiphias gladius) from the Southeastern Pacific Ocean. PeerJ. 11, e15524. doi: 10.7717/peerj.15524
Hare M. P., Nunney L., Schwartz M. K., Ruzzante D. E., Burford M., Waples R. S., et al. (2011). Understanding and estimating effective population size for practical application in marine management. Conserv. Biol. 25 (3), 438–449. doi: 10.1111/j.1523-1739.2010.01637.x
Hemmer-Hansen J., Therkildsen N. O., Pujolar J. M. (2014). Population genomics of marine fishes: Next-Generation Prospects and Challenges. Biol. Bull. 227, 117–132. doi: 10.1086/BBLv227n2p117
Hillis D., Moritz C., Mable B. K. (1996). Molecular systematic 2da ed (Sunderland, Massachusetts. USA: Sinauer Associates, Inc. Publishers), 651.
Hodel R. G. J., Chen S., Payton A. C., McDaniel S. F., Soltis P., Soltis D. E. (2017). Adding loci improves phylogeographic resolution in red mangroves despite increased missing data: comparing microsatellites and RAD-Seq and investigating loci filtering. Sci. Rep. 7, 17598. doi: 10.1038/s41598-017-16810-7
IATTC. (2022). “Resolution C-23-09 research for the management of dolphinfish (Dorado),” in 101st Meeeting Victoria, B.C., Canada, 7-11 August 2023. Available at: https://www.iattc.org/GetAttachment/badcdb68-1b6d-43e4-9f32-90253504e968/C-23-09_Dolphinfish-(Dorado).pdf.
Jombart T., Collins C. (2015). “A tutorial for discriminant analysis of principal components (DAPC) using adegenet 2.0. 0,” in London: imperial college london, MRC centre for outbreak analysis and modelling. Available at: https://adegenet.r-forge.r-project.org/files/tutorial-dapc.pdf.
Kelson S. J., Miller M. R., Thompson T. Q., Carlson S. M. (2020). Temporal dynamics of migration-linked genetic variation are driven by streamflows and riverscape permeability. Mol. Ecol. 29, 870–885. doi: 10.1111/mec.15367
Kessler W. S. (2006). The circulation of the eastern tropical Pacific: A review. Prog. Oceanogr. 69, 181–217. doi: 10.1016/j.pocean.2006.03.009
Knutsen H., Catarino D., Rogers L., Sodeland M., Mattingsdal M., Jahnke M., et al. (2022). Combining population genomics with demographic analyses highlights habitat patchiness and larval dispersal as determinants of connectivity in coastal fish species. Mol. Ecology. 31, 2562–2577. doi: 10.1111/mec.16415
Lawson D. J., van Dorp L., Falush D. (2018). A tutorial on how not to over-interpret STRUCTURE and ADMIXTURE bar plots. Nat. Commun. 9, 3258. doi: 10.1038/s41467-018-052577
Linnaeus C.. (1758). Systema Naturae, Ed. X. (Systema naturae per regna tria naturae, secundum classes, ordines, genera, species, cum characteribus, differentiis, synonymis, locis. Tomus I. Editio decima, reformata.) Holmiae. v. 1: i-ii + 1-824 [Nantes and Pisces in Tom. 1, pp. 230–338. doi: 10.5962/bhl.title.35518
Maggio T., Allegra A., Andaloro F., Barreiros J. P., Battaglia P., Butler C. M., et al. (2019). Historical separation and present-day structure of common dolphinfish (Coryphaena hippurus) populations in the Atlantic Ocean and Mediterranean Sea. ICES J. Mar. Sci. 76 (4), 1028–1038. doi: 10.1093/icesjms/fsy174
Maroso F., Franch R., Rovere G. D., Arculeo M., Bargelloni L. (2016). RAD SNP markers as a tool for conservation of dolphinfish Coryphaena hippurus in the Mediterranean Sea: Identification of subtle genetic structure and assessment of populations sex-ratios. Mar. Genomics 28, 57–62. doi: 10.1016/j.margen.2016.07.003
Martínez-Ortiz J., Aires-da-Silva A. M., Lennert-Cody C. E., Maunder M. N. (2015). The Ecuadorian artisanal fishery for large pelagics: species composition and spatio-temporal dynamics. PloS One 10 (8), e0135136. doi: 10.1371/journal.pone.0135136
Martínez-Rincón R. O., Ortega-Garcia S., Vaca-Rodriguez J. G., Griffiths S. P. (2015). Development of habitat prediction models to reduce by-catch of sailfish (Istiophorus platypterus) within the purse-seine fishery in the eastern Pacific Ocean. Mar. Freshw. Res. 66, 644–653. doi: 10.1071/MF14062
Miller A. D., Coleman M. A., Clark J., Cook R., Naga Z., Doblin M. A., et al. (2020). Local thermal adaptation and limited gene flow constrain future climate responses of a marine ecosystem engineer. Evolutionary Applications. 13 (5), 918–934. doi: 10.1111/eva.12909
Narum S. R. (2006). Beyond Bonferroni: less conservative analyses for conservation genetics. Conserv. Genet. 7 (5), 783–787. doi: 10.1007/s10592-005-9056-y
Norton J. G. (1999). Apparent habitat extensions of dolphinfish (Coryphaena hippurus) in response to climate transients in the California Current. Sci. Mar. 63 (3-4), 239–260. doi: 10.3989/scimar.1999.63n3-4261
Ochoa-Zavala M., Diaz-Jaimes P., Ortega-García S., Galván-Magaña F. (2022). Genetic divergence at species boundaries of the dolphinfish (Coryphaena hippurus) in the Tropical Eastern Pacific. PeerJ. 10, e14389. doi: 10.7717/peerj.14389
Oxenford H. A., Hunte W. (1983). Age and growth of dolphin, Coryphaena hippurus, as determined by growth rings in otoliths. Fish. Bull. 84, 906–909.
Palko B. J., Beardsley G. L., Richards W. J. (1982). Synopsis of the biological data on dolphin fishes, Coryphaena hippurus Linnaeus and Coryphaena equiselis Linnaeus. NOAA Tech. Rep. NMFS Circ. 443, 28.
Paris J. R., Stevens J. R., Catchen J. M. (2017). Lost in parameter space: a road map for stacks. Methods Ecol. Evolution. 8 (10), 1360–1373. doi: 10.1111/2041-210X.12775
Pazmiño D. A., van Herderden L., Simpfendorfer, Junge C., Donnellan S. C., Hoyos-Padilla E. M., et al. (2019). Introgressive hybridisation between two widespread sharks in the east Pacific region. Mol. Phylo. Evol. 136, 119–127. doi: 10.1016/j.ympev.2019.04.013
Pearman W. S., Urban L., Alexander A. (2022). Commonly used Hardy-Weinberg equilibrium filtering schemes impact population structure inferences using RADseq data. Mol. Ecol. Res. 22, 2599–2613. doi: 10.1111/1755-0998.13646
Pecoraro C., Babbucci M., Franch R., Rico C., Papetti C., Chassot E., et al. (2020). The population genomics of yellowfin tuna (Thunnus albacares) at global geographic scale challenges current stock delination. Sci. Rep. 8 (1), 1–10. doi: 10.1038/s41598-018-323
Perle C. R., Snyder S., Merten W., Simmons M., Dacey J., Rodriguez-Sanchez R., et al. (2020). Dolphinfish movements in the Eastern Pacific Ocean of Mexico using conventional and electronic tags. Anim. Biotelemetry. 8, 1–15. doi: 10.1186/s40317-020-00217-9
Petkova D., Novembre J., Stephens M. (2016). Visualizing spatial population structure with estimated effective migration surfaces. Nat. Genet. 48, 94–100. doi: 10.1038/ng.3464
Phillips N. M., Devloo-Delva F., McCall C., Daly-Engel T. S. (2021). Reviewing the genetic evidence for sex-biased dispersal in elasmobranchs. Rev. Fish Biol. Fisheries 31, 821–841. doi: 10.1007/s11160-021-09673-9
Pinsky M. L., Palumbi S. R. (2014). Meta-analysis reveals lower genetic diversity in overfished populations. Mol. Ecol. 23 (1), 29–39. doi: 10.1111/mec.12509
Privé F., Luu K., Vilhjálmsson B. J., Blum M. G. B., Rosenberg M. (2020). Performing highly efficient genome scans for local adaptation with R Package pcadapt Version 4. Mol. Biol. Evol. 37, 2153–2154. doi: 10.1093/molbev/msaa053
Purcell S., Neale B., Todd-Brown K., Thomas L., Ferreira M. A., Bender D., et al. (2007). PLINK: a tool set for whole-genome association and population-based linkage analyses. Am. J. Hum. Genet. 81 (3), 559–575. doi: 10.1086/519795
Puritz J. B., Matz M. V., Toonen R. J., Weber J. N., Bolnick D. I., Bird C. E. (2014). Demystifying the RAD fad. Mol. Ecol. 23, 5937–5942. doi: 10.1111/mec.12965
R Core Team. (2022). R: A language and environment for statistical computing (Vienna, Austria: R Foundation for Statistical Computing). Available at: http://www.r-project.org/.
Reid-Anderson S., Bilgmann K., Stow A. (2019). Effective population size of the critically endangered east Australian grey nurse shark Carcharias taurus. Mar. Ecol. Prog. Ser. 610, 137–148. doi: 10.3354/meps12850
Roa-Ureta R. H., Román G., Marín P., Guevara I., Alegre A., Elías E., et al. (2021). “Stock Assessment of the dolphinfish (Coryphaena hippurus)) in the South-East Pacific Ocean,” in Document SAC-13 INF-O. 13th meeting of the Inter-American Tropical Tuna Commission, Scientific Advisory Committee, 16-20 May 2022. Available at: https://www.iattc.org/GetAttachment/6d3cf4f6-d196-4d82-905b-7a957ab9ee7d/SAC-13-INF-O_Stock-assessment-dorado-South-EPO.pdf.
Rocha-Olivares A., Bobadilla-Jiménez M., Ortega-García S., Saavedra-Sotelo N., Sandoval-Castillo J. R. (2006). Mitochondrial variability of dolphinfish Coryphaena hippurus populations in the Pacific Ocean. Cienc. Marinas. 32, 569–578. doi: 10.7773/cm.v32i3.1122
Rochette N. C., Rivera-Colón A. G., Catchen J. M. (2019). Stacks 2: Analytical methods for paired-end sequencing improve RADseq-based population genomics. Mol. Ecol. 28, 4737–4754. doi: 10.1111/mec.15253
Rozas J., Ferrer-Mata A., Sánchez-Del Barrio J. C., Guirao-Rico S., Librado P., Ramos-Onsins S. E., et al. (2017). DnaSP 6: DNA sequence polymorphism analysis of large data sets. Mol. Biol. Evol. 34 (12), 3299–3302. doi: 10.1093/molbev/msx248
Salas E. M., Bernardi G., Berumen M. L., Gaither M. R., Rocha (2019). RADseq analyses reveal concordant Indian Ocean biogeographic and phylogeographic boundaries in the reef fish Dascyllus trimaculatus. R. Soc Open Sci. 6, 172413. doi: 10.1098/rsos.172413
Schaefer K. M., Fuller D. W., Block B. A. (2007). Movements, behavior, and habitat utilization of yellowfin tuna (Thunnus albacares) in the northeastern Pacific Ocean, ascertained through archival tag data. Mar. Biol. 152, 503–525. doi: 10.1007/s00227-007-0689-x
Solano-Sare A., Tresierra-Aguilar A., García V., Goicochea-Vigo C., Blaskovic-Huayta V., Buitron-Diaz B., et al. (2015). Biología y pesquería del perico o dorado Coryphaena hippurus, febrero 2010. Informe interno. Inst. Mar. Perú 42 (1), 35–72. Available at: https://hdl.handle.net/20.500.12958/2949.
Solano-Sare A., Tresierra-Aguilar A., García-Nolasco V., Dioses T., Marin W., Sánchez C., et al. (2008). “Biología y pesquería del perico,” in Informe interno. Inst. Mar. Perú. Available at: https://www.iattc.org/GetAttachment/cf97baf0-38de-4a02-8e4e-7c641c6b527d/DOR-01-PRES_Biologia-y-pesqueria-del-perico-en-el-area-centro-norte-del-Peru.pdf.
Torrejón-Magallanes J., Grados D., Lau-Medrano W. (2019). Spatio-temporal distribution modeling of dolphinfish (Coryphaena hippurus) in the Pacific Ocean off Peru using artisanal longline fishery data. Deep Sea Res. Part II: Topical Stud. Oceanography. 169, 104665.
Tripp-Valdez M. A., García de León F. J., Ortega-García S., Lluch-Cota D., López-Martínez J., Cruz P. (2010). Population genetic structure of dolphinfish (Coryphaena hippurus) in the Gulf of California, using microsatellite loci. Fisheries Res. 105, 172–177. doi: 10.1016/j.fishres.2010.03.023
Uchiyama J. H., Burch R. K., Kraul S. (1986). Growth of dolphins, Coryphaena hippurus and C. equiselis, in Hawaiian water as determined by daily increments on otoliths. Fishery Bulletin. 84, 186–191.
Valero J. L., Aires-da-Silva A., Maunder M. N. (2019). Potential reference points and harvest control rules for dorado (Coryphaena hippurus) in the eastern pacific ocean. Inter-American Trop. Tuna Commssion-Comisión Interamericana del Atún Trop. 51, 1–26.
Venables S. K., Marshall A. D., Armstrong A. J., Tomkins J. L., Kennington J. (2021). Genome-wide SNPs detect no evidence of genetic population structure for reef manta rays (Mobula alfredi) in southern Mozambique. Heredity. 126, 308–319. doi: 10.1038/s41437-020-00373-x
Waples R. S., Do C. (2010). Linkage disequilibrium estimates of contemporary Ne using highly variable genetic markers: a largely untapped resource for applied conservation and evolution. Evol. Appl. 3 (3), 244–262. doi: 10.1111/j.1752-4571.2009.00104.x
Waples R. S., Luikart G., Faulkner J. R., Tallmon D. A. (2013). Simple life-history traits explain key effective population size ratios across diverse taxa. Proc. R. Soc B. 280, 20131339. doi: 10.1098/rspb.2013.1339
Wilkinson T., Wiken E., Bezaury-Creel J., Hourigan T., Agardy T., Hermann H., et al. (2009). Marine ecoregions of North America. Commission for Environmental Cooperation. Montreal, Canada. 200 pp.
Yüncü E., Açan S. C., Onar V., Karakulak F. S., Gökoğlu M., Alıçlı T. Z., et al. (2021). Demography of swordfish (Xiphias gladius Linneus) populations from the coasts of Turkey, based on mitochondrial DNA and microsatellites. J. Fish. Biol. 99, 37–48. doi: 10.1111/JFB.14696
Zhang B. D., Li Y. L., Xue D. X., Liu J. X. (2020). Population genomics reveals shallow genetic structure in a connected and ecologically important fish from the northwestern pacific ocean. Front. Mar. Sci. 7. doi: 10.3389/fmars.2020.00374
Zúñiga-Flores M. S., Ortega-García S., Klett-Traulsen A. (2008). Interannual and seasonal variation of dolphinfish (Coryphaena hippurus) catch rates in the southern Gulf of California, Mexico. Fisheries Res. 94, 13–17. doi: 10.1016/j.fishres.2008.06.003
Keywords: dolphinfish, genomic, population, Eastern Pacific, management units, 3RAD, SNPs
Citation: Mar-Silva AF, Díaz-Jaimes P, Ochoa-Zavala M, Ortega-Garcia S, Sotil G, Alegre A, Escarabay T, Elias E and Carvajal-Rodríguez JM (2024) A genomic approach for the identification of population management units for the dolphinfish (Coryphaena hippurus) in the eastern Pacific. Front. Mar. Sci. 10:1294509. doi: 10.3389/fmars.2023.1294509
Received: 14 September 2023; Accepted: 11 December 2023;
Published: 11 January 2024.
Edited by:
Jitendra Kumar Sundaray, Indian Council of Agricultural Research, IndiaReviewed by:
Priyanka Nandanpawar, Central Institute of Freshwater Aquaculture (ICAR), IndiaCopyright © 2024 Mar-Silva, Díaz-Jaimes, Ochoa-Zavala, Ortega-Garcia, Sotil, Alegre, Escarabay, Elias and Carvajal-Rodríguez. This is an open-access article distributed under the terms of the Creative Commons Attribution License (CC BY). The use, distribution or reproduction in other forums is permitted, provided the original author(s) and the copyright owner(s) are credited and that the original publication in this journal is cited, in accordance with accepted academic practice. No use, distribution or reproduction is permitted which does not comply with these terms.
*Correspondence: Sofia Ortega-Garcia, c29ydGVnYUBpcG4ubXg=
†These authors share first authorship
Disclaimer: All claims expressed in this article are solely those of the authors and do not necessarily represent those of their affiliated organizations, or those of the publisher, the editors and the reviewers. Any product that may be evaluated in this article or claim that may be made by its manufacturer is not guaranteed or endorsed by the publisher.
Research integrity at Frontiers
Learn more about the work of our research integrity team to safeguard the quality of each article we publish.