- 1Division of Physical Sciences and Engineering, King Abdullah University of Science and Technology, Thuwal, Saudi Arabia
- 2Department of Ocean Science and Engineering, Southern University of Science and Technology, Shenzhen, China
A 3D high-resolution general ocean circulation model was implemented and validated to study the characteristics and seasonal variability of the internal tides in the Arabian Sea (AS). Three major source locations of internal tides were identified: Socotra Island, the northeastern shelf area of AS, and the Maldives. Around Socotra Island, internal tides propagate both southward and northward, before quickly dissipating. The internal tides generated in the northeastern AS split into two branches: Branch-I propagates perpendicular to the shelf, whereas Branch-II propagates more southernly. The internal tides originated in the Maldives propagate almost latitudinally both eastwards and westwards. Generally, the internal tides in the AS are more pronounced in January as shown by the forcing function, energy flux, and conversion rate. The hourly average conversion rate for the entire domain, including the AS, the Red Sea, and the Arabian Gulf – was 34.28 GW in January and 20.51 GW in July, suggesting a slightly larger barotropic-to-baroclinic conversion rate in January, probably due to the strong stratification around 100 meters in winter.
1 Introduction
Internal tides are predominantly produced as barotropic tides flow over rugged topographies, such as seamounts, ridges, and trenches, in a stratified ocean, and are generally referred to as baroclinic tides with tidal frequencies (Egbert and Ray, 2003; Laurent et al., 2003; Carter et al., 2008). Compared to surface tides, internal tides are characterized by a larger vertical displacement of isopycnals and smaller horizontal wavelengths (Dushaw et al., 1995; Ray and Mitchum, 1996). The occurrence of internal tides is widespread and they hold significant importance in the global ocean as one of the crucial components of barotropic dissipation (Munk, 1997). They further promote ocean mixing (St. Laurent and Garrett, 2002) and were suggested to be one of the driving forces of the Meridional Overturning Circulation (MOC), a major component of the global climate system (Munk and Wunsch, 1998; McManus et al., 2004). Internal tides also have extraordinary biological significance. For instance, Smith et al. (2004) demonstrated that internal tides could be an important source of externally transported nutrients for tropical reefs. Moreover, the breaking of internal tides generates mixing that contributes to the re-distribution of nutrients and oxygen in the water column, which enhances primary productivity (Sharples et al., 2001; McManus et al., 2004). In addition, internal tides can affect sediment transport and inhibit the deposition of fine-grained sediments onto slopes (Cacchione et al., 2002; Maier et al., 2019).
The Arabian Sea (AS) is located north of the Indian Ocean, extending from 45°E to 75°E, with an average depth of about 3000 m. The AS is connected to the Red Sea (RS) via the strait of Bab-al-Mandeb (BAM) in the west and the Arabian Gulf (AG) in the north via the Strait of Hormuz. During winter, the Northern Hemisphere monsoons are directed away from the Asian continent, which generates northeasterly wind stresses over the AS. In contrast, during summer, the monsoon winds are southwesterly, driving strong seasonal circulations that are clockwise in summer and anticlockwise in winter (Lee et al., 2000; Schott and McCreary, 2001; Beal et al., 2013), and seasonal variability in eddy activity (Zhan et al., 2020). The seasonal variations in water stratification and background circulations in the basin may impact the properties of the internal tides, as suggested by previous studies (Rainville and Pinkel, 2006; Zilberman et al., 2011). This makes the AS basin an ideal location for investigating the seasonality of internal tides.
Until recently, studies on internal tides in the AS remained remarkably limited and mostly based on observations (Murthy et al., 1992; Shenoi et al., 2005). One example of successful internal tide amplitude recordings is from an array of four moorings deployed by the Russian R/V Vityaz in 1967, which recorded the amplitudes of internal tides in the upper 200 m. During the AS Mixed Layer Dynamics Experiment (Woods Hole Oceanographic Institution) in 1994, a mooring deployed at 15°30’N, 61°30’E, captured high internal tide amplitudes up to 25-30 m at a depth of 300 m. Based on in-situ data, Kumar et al. (2010) proposed that temperature fluctuations attributed to internal tides are associated with a thermocline gradient in the northeastern AS. By analyzing Acoustic Doppler current profiler data, Subeesh et al. (2013) revealed the occurrence of intense internal tides on the continental shelf of the eastern AS, indicating that strong seasonal stratification on the shelf drives the generation of large semi-diurnal internal tides during the southwesterly monsoons. Following the deployment of global satellite observational networks, the AS became a hotspot of research on internal tides (Zhao et al., 2016; Zaron, 2019; Ma et al., 2021), but the limited observations in the water column precluded the investigation of the 3D properties of these signals.
To cope with the limited observations, many studies have resorted to numerical simulations of the features of internal tides in many regions of the global ocean. For instance, a general circulation ocean model was used by Chuang and Wang (1981) to investigate the impact of a density front on the generation of internal waves on a continental margin. Khatiwala (2003) showed that the existence of an upper reflective surface greatly decreases the rate of barotropic tidal energy transfer to the internal wave field. High-resolution global ocean models have been used to simulate internal tides, primarily in regions with high tidal energy (Fu et al., 2021; Arbic, 2022). These models efficiently generate internal tides at key locations, allowing the propagation of tidal energy over vast distances (Shriver et al., 2012). However, it’s important to highlight that most global studies of internal tides tend to maintain a broader scope and may not directly address the AS, underscoring the potential advantages of conducting a regional simulation study. Niwa and Hibiya (2004) used the hydrostatic Princeton Ocean Model (POM) (Blumberg and Mellor, 1987) to examine M2 internal tides around the continental shelf edge in the East China Sea and suggested that ∼10% of the M2 barotropic energy is converted into baroclinic tides, whereas ∼50% of the M2 internal tidal energy is dissipated close to the generation sites. Numerical ocean simulations performed by Subeesh et al. (2021) indicated that around 2.4 GW of barotropic tide energy is converted to baroclinic tides off the western coast of India.
Previous studies on internal tides in the AS have mainly focused on specific areas, leaving the overall picture unclear. In particular, Ma et al. (2021) analyzed multiple satellite data to reveal the distribution of M2 internal tides on the surface, providing a general understanding of internal tides in this basin. However, details regarding internal tides in the AS, particularly below the sea surface, get to be thoroughly explored. To address this gap, we developed a high-resolution, three-dimensional ocean general circulation model based on the Massachusetts Institute of Technology general circulation model (MITgcm). After validation, the model simulations were used to investigate the characteristics and seasonality of internal tides in the AS, including their generation, propagation, and basic properties. Three main sources of internal tides were suggested and their properties are revealed based on an energetics analysis.
The remainder of this study is organized as follows. Section 2 describes the model configuration and validation. Section 3 presents the seasonal difference of internal tides in the AS in terms of their generation, propagation, and basic properties. Section 4 outlines the main conclusions of this study and discusses future extensions.
2 Model configuration and validation
2.1 Model setup
Version c67m of MITgcm was implemented for simulating the internal tides in the AS. The model domain covered the area between 0.96° - 30.68°N and 31.92° - 77.96°E, as shown in Figure 1, with a horizontal resolution of 0.04° and 60 uneven vertical layers ranging from 4–70 m in the upper 800 m to 250-350 m near the bottom. The model bathymetry was extracted from the General Bathymetric Chart of the Oceans (Hall, 2006). The horizontal homogeneous initial temperature and salinity data were obtained from the monthly World Ocean Atlas (WOA) dataset at a location of 51.88°E, 12.92°N. Numerous simulation experiments have demonstrated the feasibility of simulating internal tides using a horizontally homogeneous background, as has been used in the idealized simulation, the east China Sea, and the Angolan (Niwa and Hibiya, 2004; Kelly and Nash, 2010; Ponte and Klein, 2015; Zeng et al., 2021). January and July were selected to represent winter and summer, respectively. The model setting differences in these two months are the stratification and boundary tidal forcing input. The corresponding profiles of these variables along with the buoyancy frequency are illustrated in Figure 2. Two prominent features can be discerned from Figure 2C during summer, the stratification is stronger than in winter in the depth shallower than 50 meters, while in the depth over 100 meters, the stratification is stronger in winter. The model time step was set to 30 seconds and the model was integrated for 30 days with hourly output. The model quickly reached a stable state due to the exclusive use of tidal forcing from boundaries. Implicit vertical mixing was incorporated in the model to parameterize mixing processes that were not explicitly resolved. Besides, the third-order upwind-biased advection scheme was used for the transport of temperature and salinity. The non-linear free surface option was set to 4, which represents a full non-linear free surface, and the model was designed to conserve the total volume of fluid in the ocean.
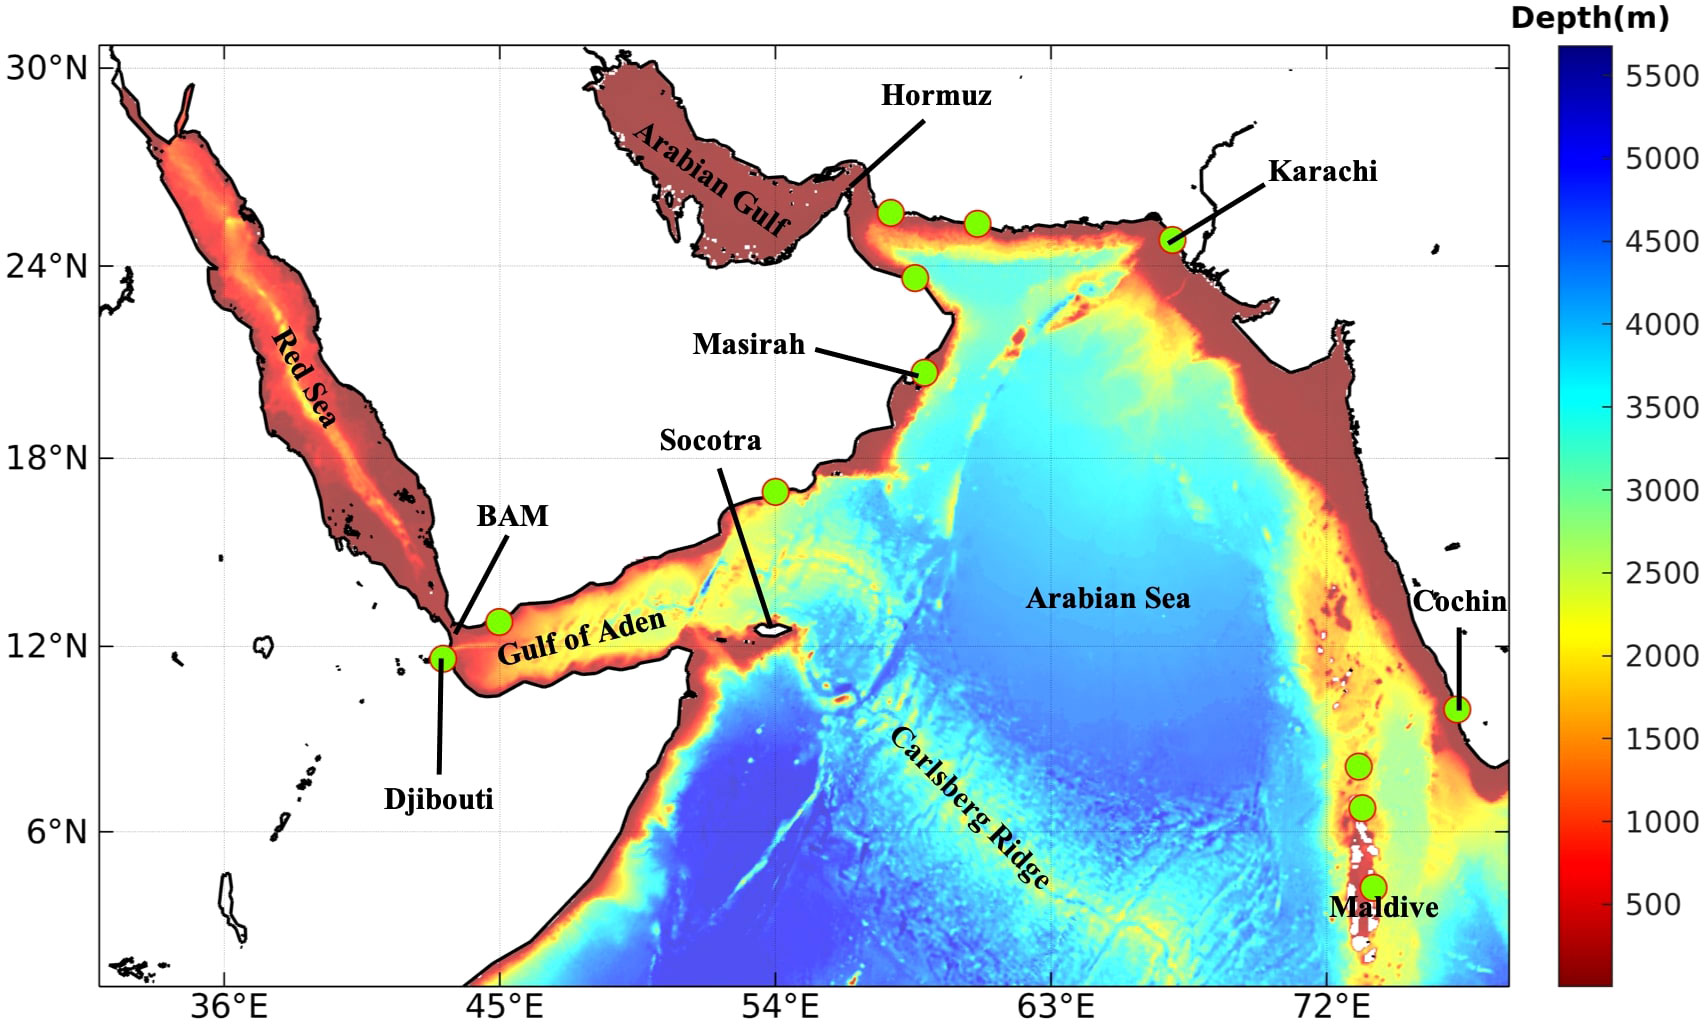
Figure 1 Topography of the AS. The positions of tidal gauges for validation are shown as green dots. The main locations involved in this study are indicated.
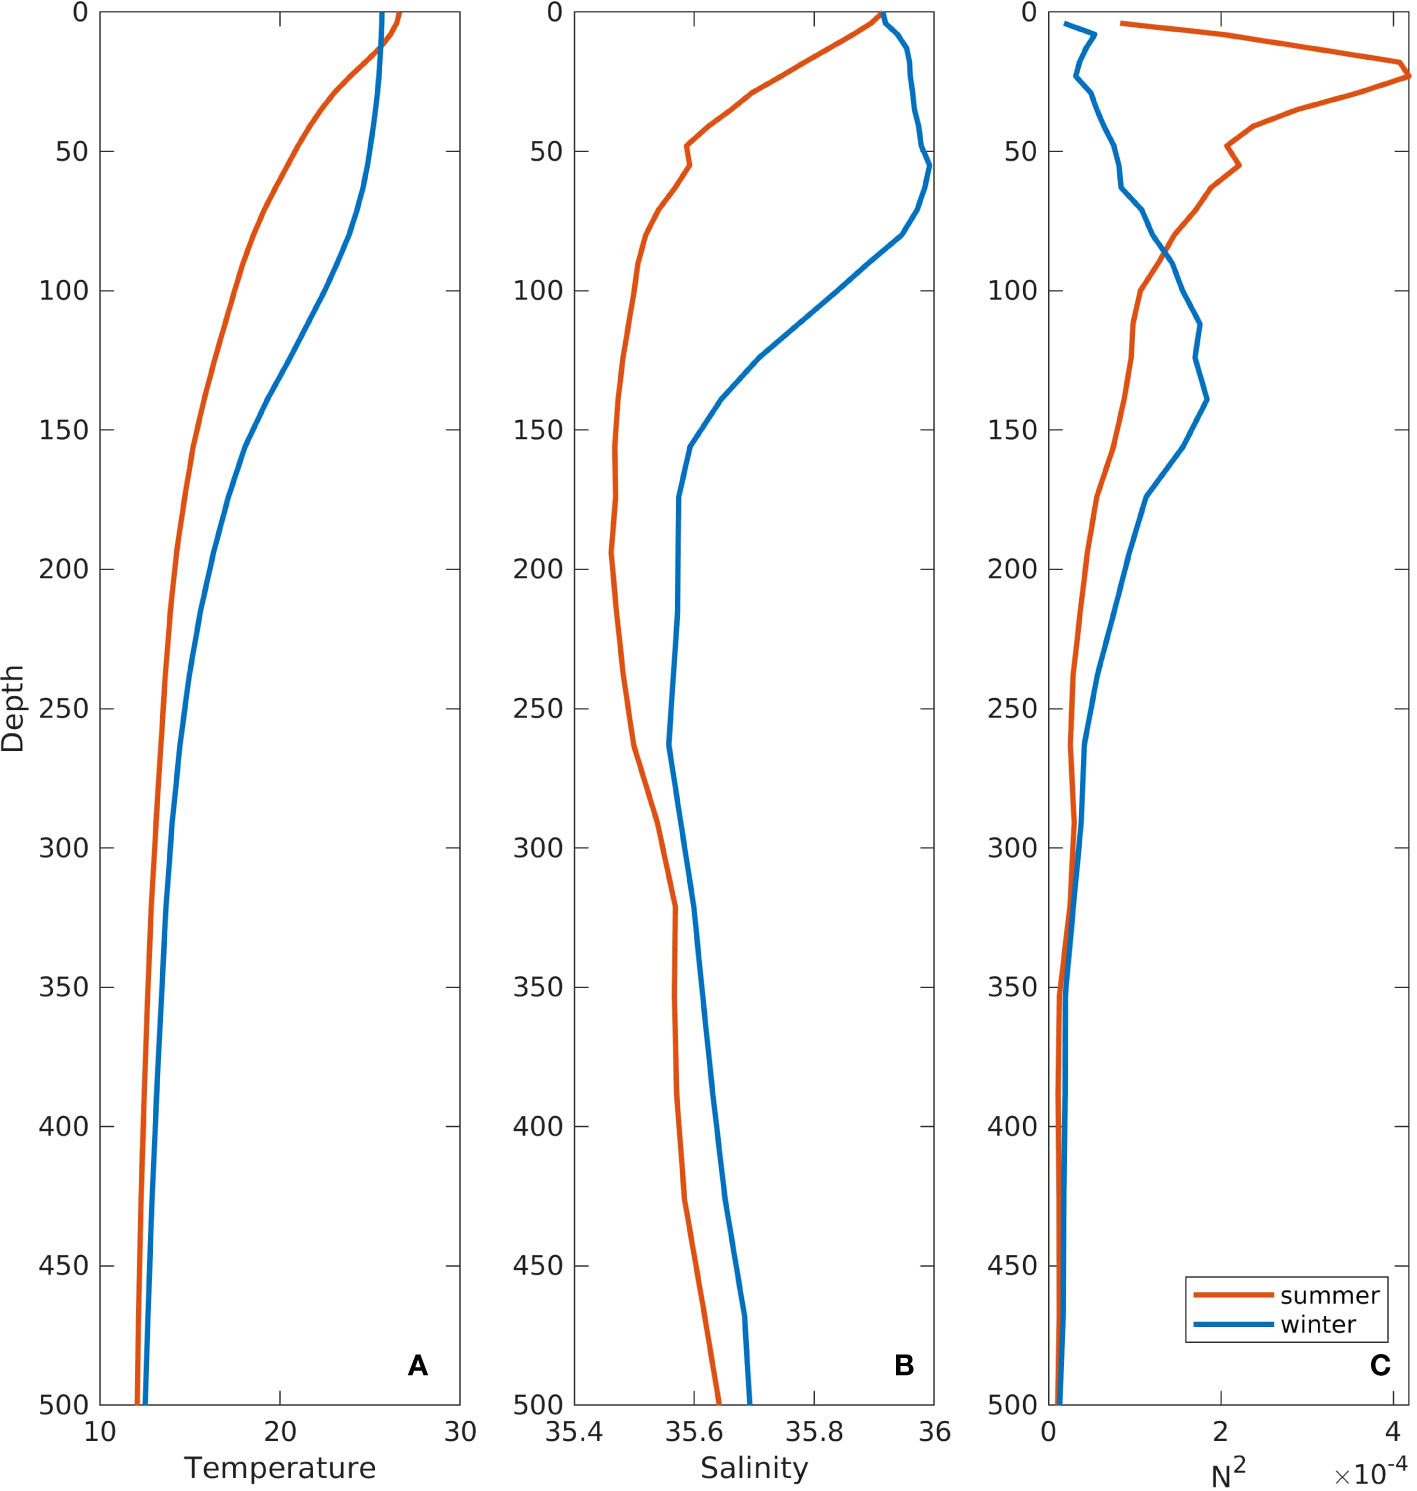
Figure 2 (A) The initial temperature profile of AS-Tide. (B) The initial salinity profile of AS-Tide. (C) The corresponding buoyancy frequency profile. The profiles are shown in red and blue colors for July and January, respectively.
In terms of the boundary conditions, the southern and eastern boundaries are open, with only tidal forcing prescribed by the eight primary tidal components (M2, S2, N2, K2, K1, O1, P1, and Q1), whose amplitudes and phases were obtained from the TOPEX/POSEIDON Indian Ocean tidal model. Moreover, the Relaxation Boundary Condition with Smoothing (RBCS) package available in the MITgcm was applied to remove fake reflection signals from these two open boundaries.
2.2 Model validation
The Arabian Sea Tide (AS-Tide) model outputs were validated by comparing with the widely used OSU Tidal Inversion Software (OTIS) (https://www.tpxo.net/otis) and available in-situ tidal gauges data. The OTIS model calculates global and regional barotropic tidal parameters and was developed by Egbert and Erofeeva (2002). We used the M2 tidal component to compare differences in the harmonic analysis of surface elevation between AS-Tide and OTIS. First, we ran a single-layer model to confirm the ability of our model to reproduce the barotropic signals, as shown in Figure 3D. The model was run for one month and the final 25 days were dedicated to conducting harmonic analysis. Comparing with Figure 3B, which shows the co-tidal charts of the M2 tidal component determined from OTIS, one can see that the positions of the amphidromic points and the distribution of amplitudes are consistent, suggesting that the model well reproduce barotropic tidal signals. After this validation exercise, stratification was added based on the single-layer AS-Tide model to simulate the baroclinic signals as shown in Figure 3A. The distributions of amplitudes and phases between the model simulation and OTIS suggested good consistency in the open Indian Ocean. The irregular lines evident in Figure 3A result from the existence of internal tides. This phenomenon primarily occurs because the M2 barotropic and baroclinic tides share identical frequencies, rendering them indistinguishable using harmonic analysis. Figure 3C shows the difference in amplitude between the AS-Tide and OTIS, the regions with dark red and dark blue colors exhibit large differences between barotropic tides and baroclinic tides. The differences between OTIS and AS-Tide are primarily confined to the marginal seas and coastal areas. For example, the amplitudes in the southern RS are larger as per AS-Tide, and the phase distribution shows more intricate than that of the open ocean. This could be attributed to the low resolutions in the BAM Strait, which would not allow for proper propagation of the tide signal through the strait (Guo et al., 2018).
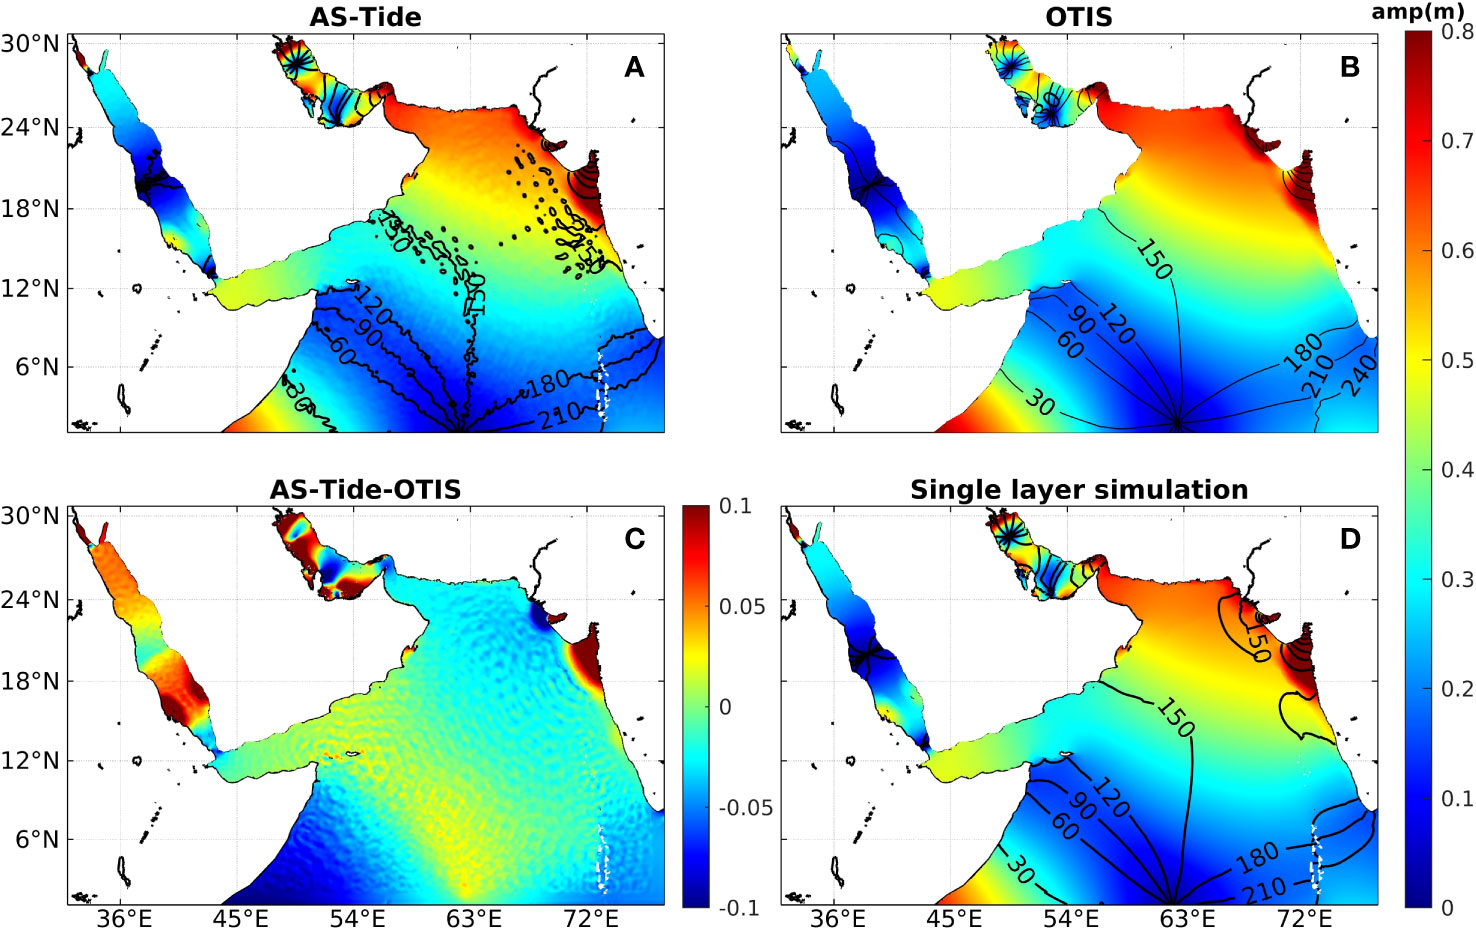
Figure 3 (A) Cotidal chart of M2 tide from AS-Tide model. (B) Cotidal chart of M2 from OTIS data. (C) Differences between (A, B). (D) Cotidal chart of M2 from the single layer simulation.
We also validated the AS-Tide model outputs through comparison with hourly sea level data from the University of Hawaii Sea Level Center (http://uhslc.soest.hawaii.edu/data/), which includes twelve gauge stations as indicated by green dots in Figure 1. Tidal elevation time series from four stations, representative of various locations throughout the Arabian Seas, were compared with the AS-Tide model results in Figure 4. The results demonstrate the model’s ability to simulate barotropic tides. While we only show results for four stations, the model was validated against all twelve gauge stations. Additionally, the AS-Tide model was compared to results revealed by satellite images based on energetics analysis, showing good consistency as further discussed in Section 4.
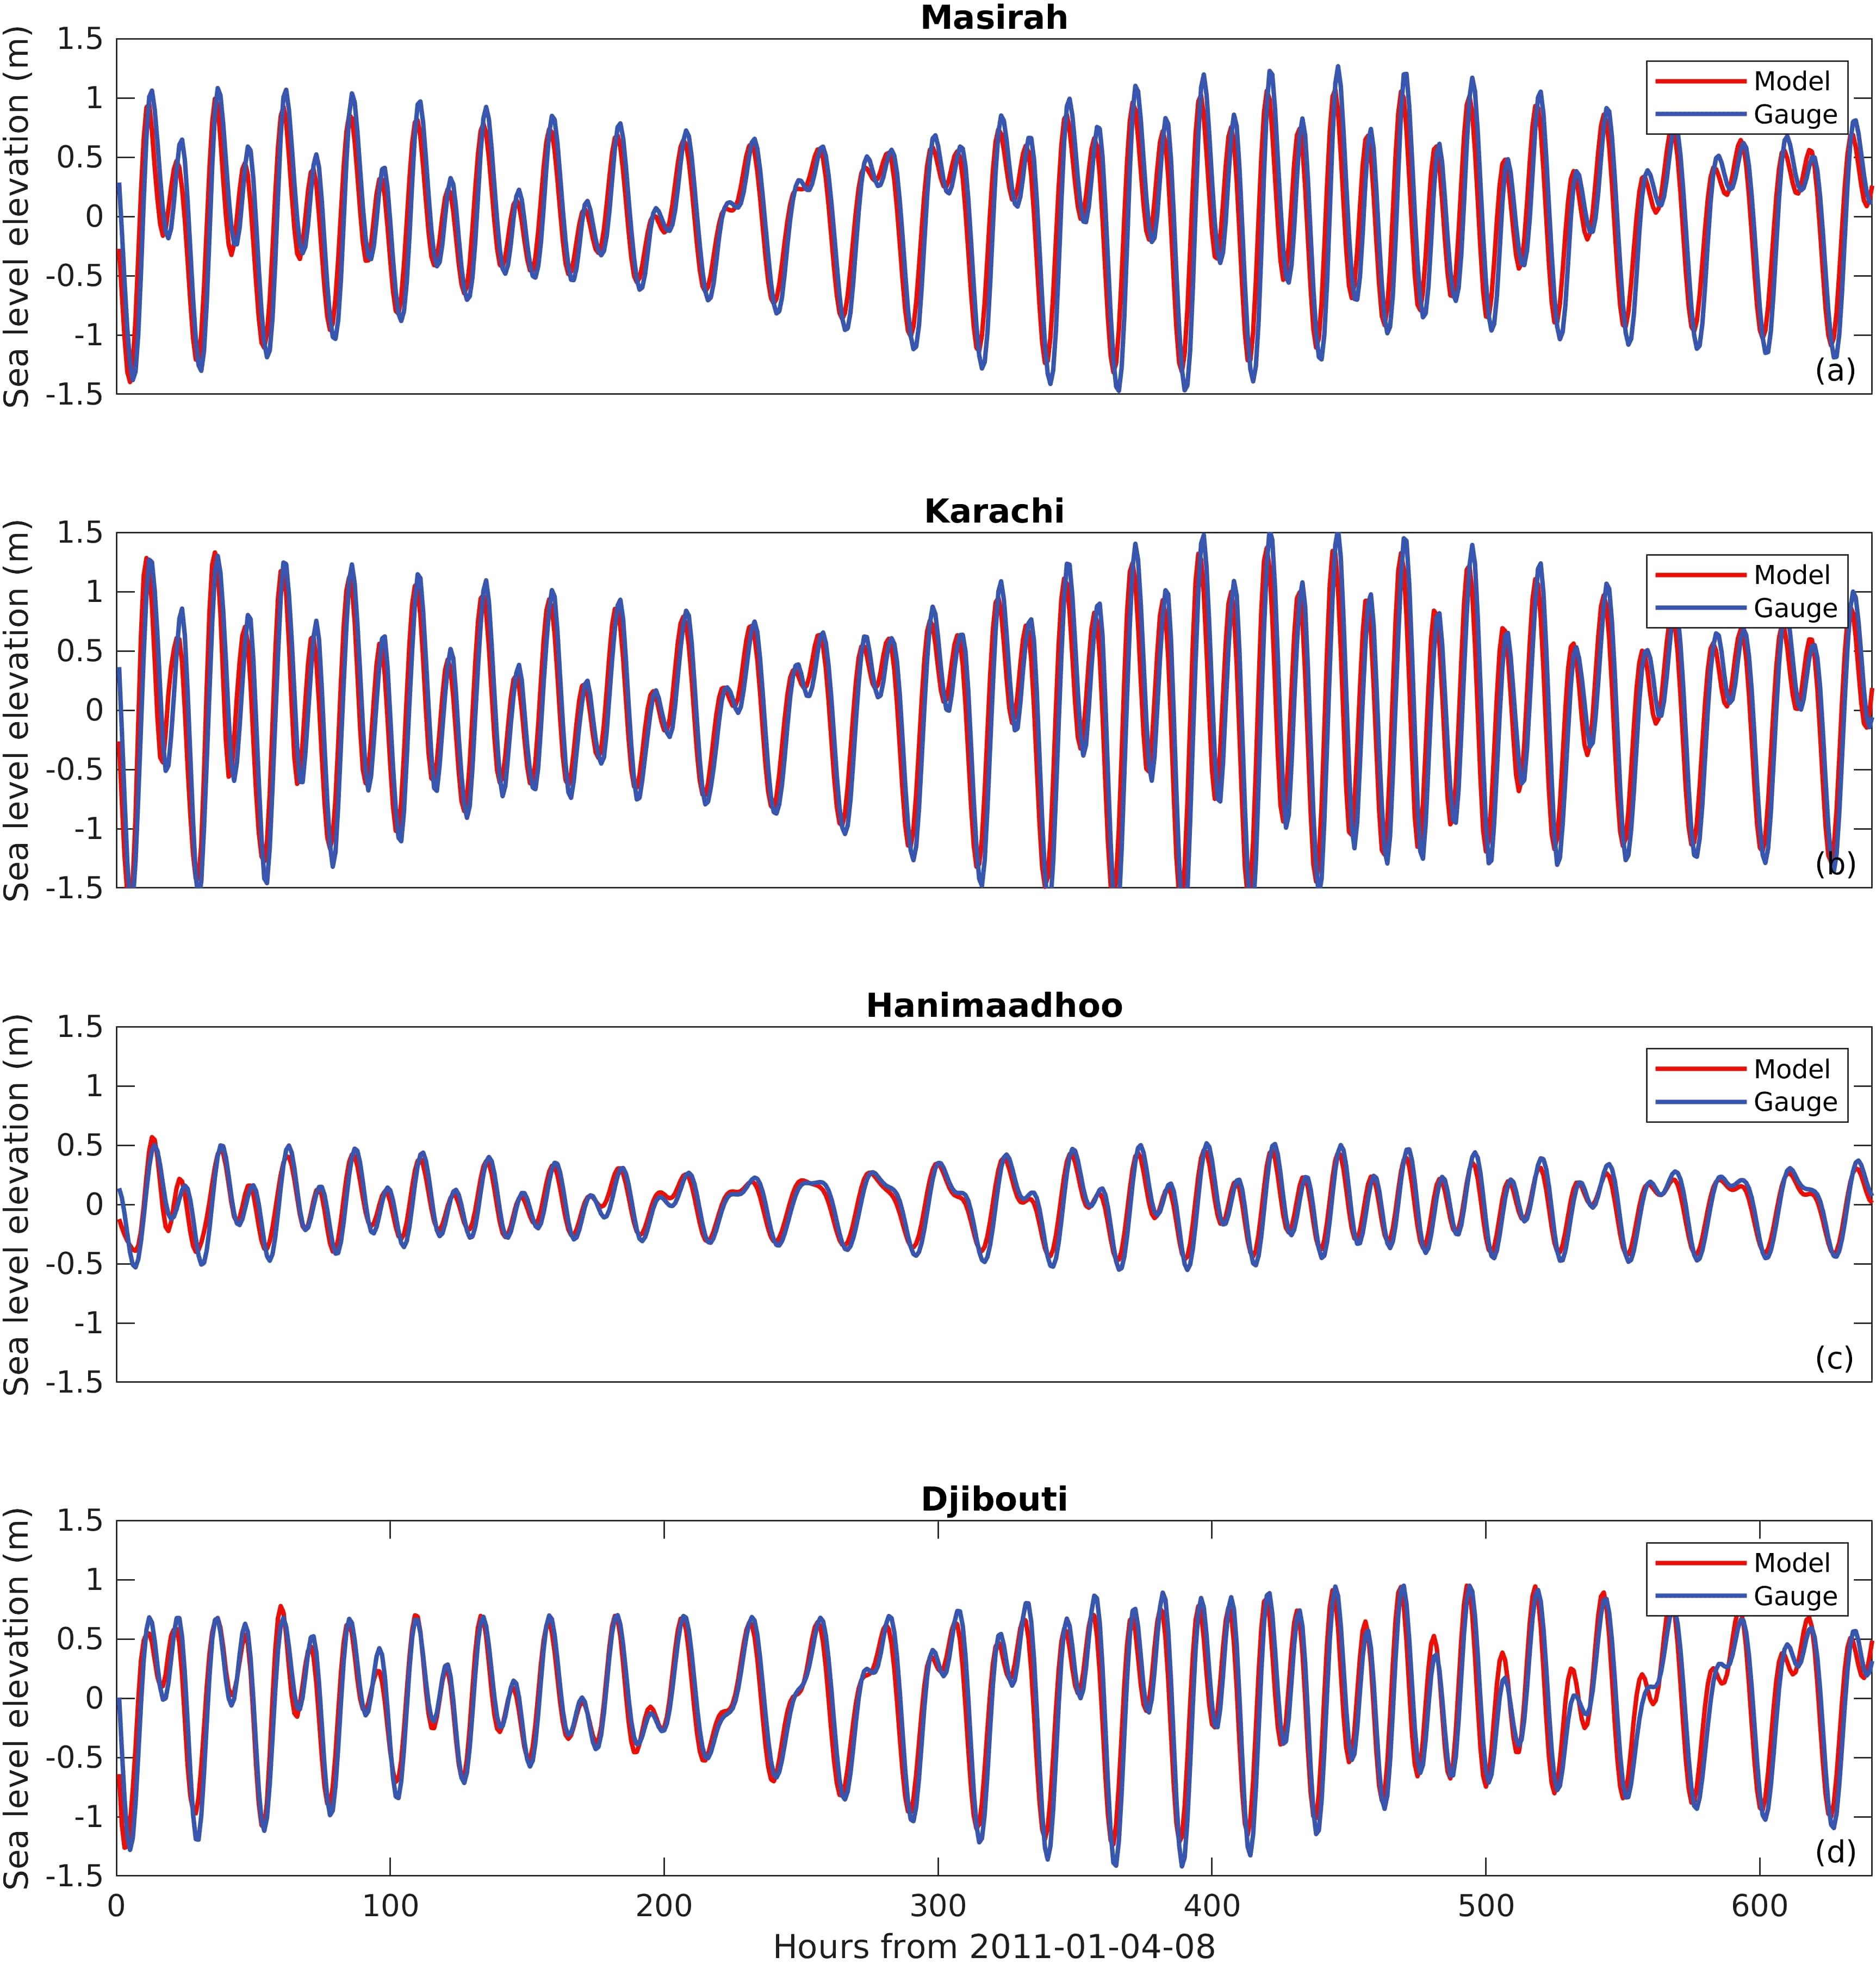
Figure 4 (A–D) Tide elevations at Masirah, Karachi, Hanimaadhoo, and Djibouti, the position of these sites are indicated in Figure 1. The red lines are the results of the model simulation and the blue lines are tidal gauge observations.
3 Results
The basic features of the internal tides and their seasonal variations in the AS are analyzed in this section. The AS-Tide model was integrated over a one-month period in both January and July, representative of the winter and summer seasons, respectively. The model outputs were saved every hour for analysis.
3.1 Forcing function
As the baroclinic signal is developed from the interaction between the barotropic tides and bottom topography, the strength of internal tides is related to the intensity of barotropic tides. Baines (1982) suggested theoretically the following forcing function to determine the potential generation of baroclinic tides:
where F is the forcing function; x, y, and z are positive eastward, positive northward, and positive upward directions; are the depth-averaged velocity along x and y; H is the time-mean water depth; and ρ0 is the background density of each layer. Figures 5A, B display the absolute values of depth-integrated F over 14 days in January and July, respectively, indicating regions favorable for internal tides generation. The areas with rough topography, including Socotra Island, the Carlsberg Ridge, the northeastern AS, the Maldives, and coastlal areas, exhibited a considerably large value of forcing function in both January and July, suggesting potential regions for the generation of intense internal tides. The amplitude of the forcing function in the RS and AG was smaller than that in the open ocean, therefore, the intensities of the internal tides in those marginal seas are expected to be weaker. According to Equation 1, F is primarily dominated by and H. We also evaluated the strength of using ellipses for the M2 and K1 currents (not shown), which suggests that not all regions with the above-mentioned rough topography had large background velocities. This means the background tidal velocities provided a limited contribution to the formation of internal tides. Furthermore, represents the slope of topography, and it features sizeable values in such regions. Therefore, the forcing function is highly related to the terrain in the AS, which mostly determines the positions susceptible to generating baroclinic tides.
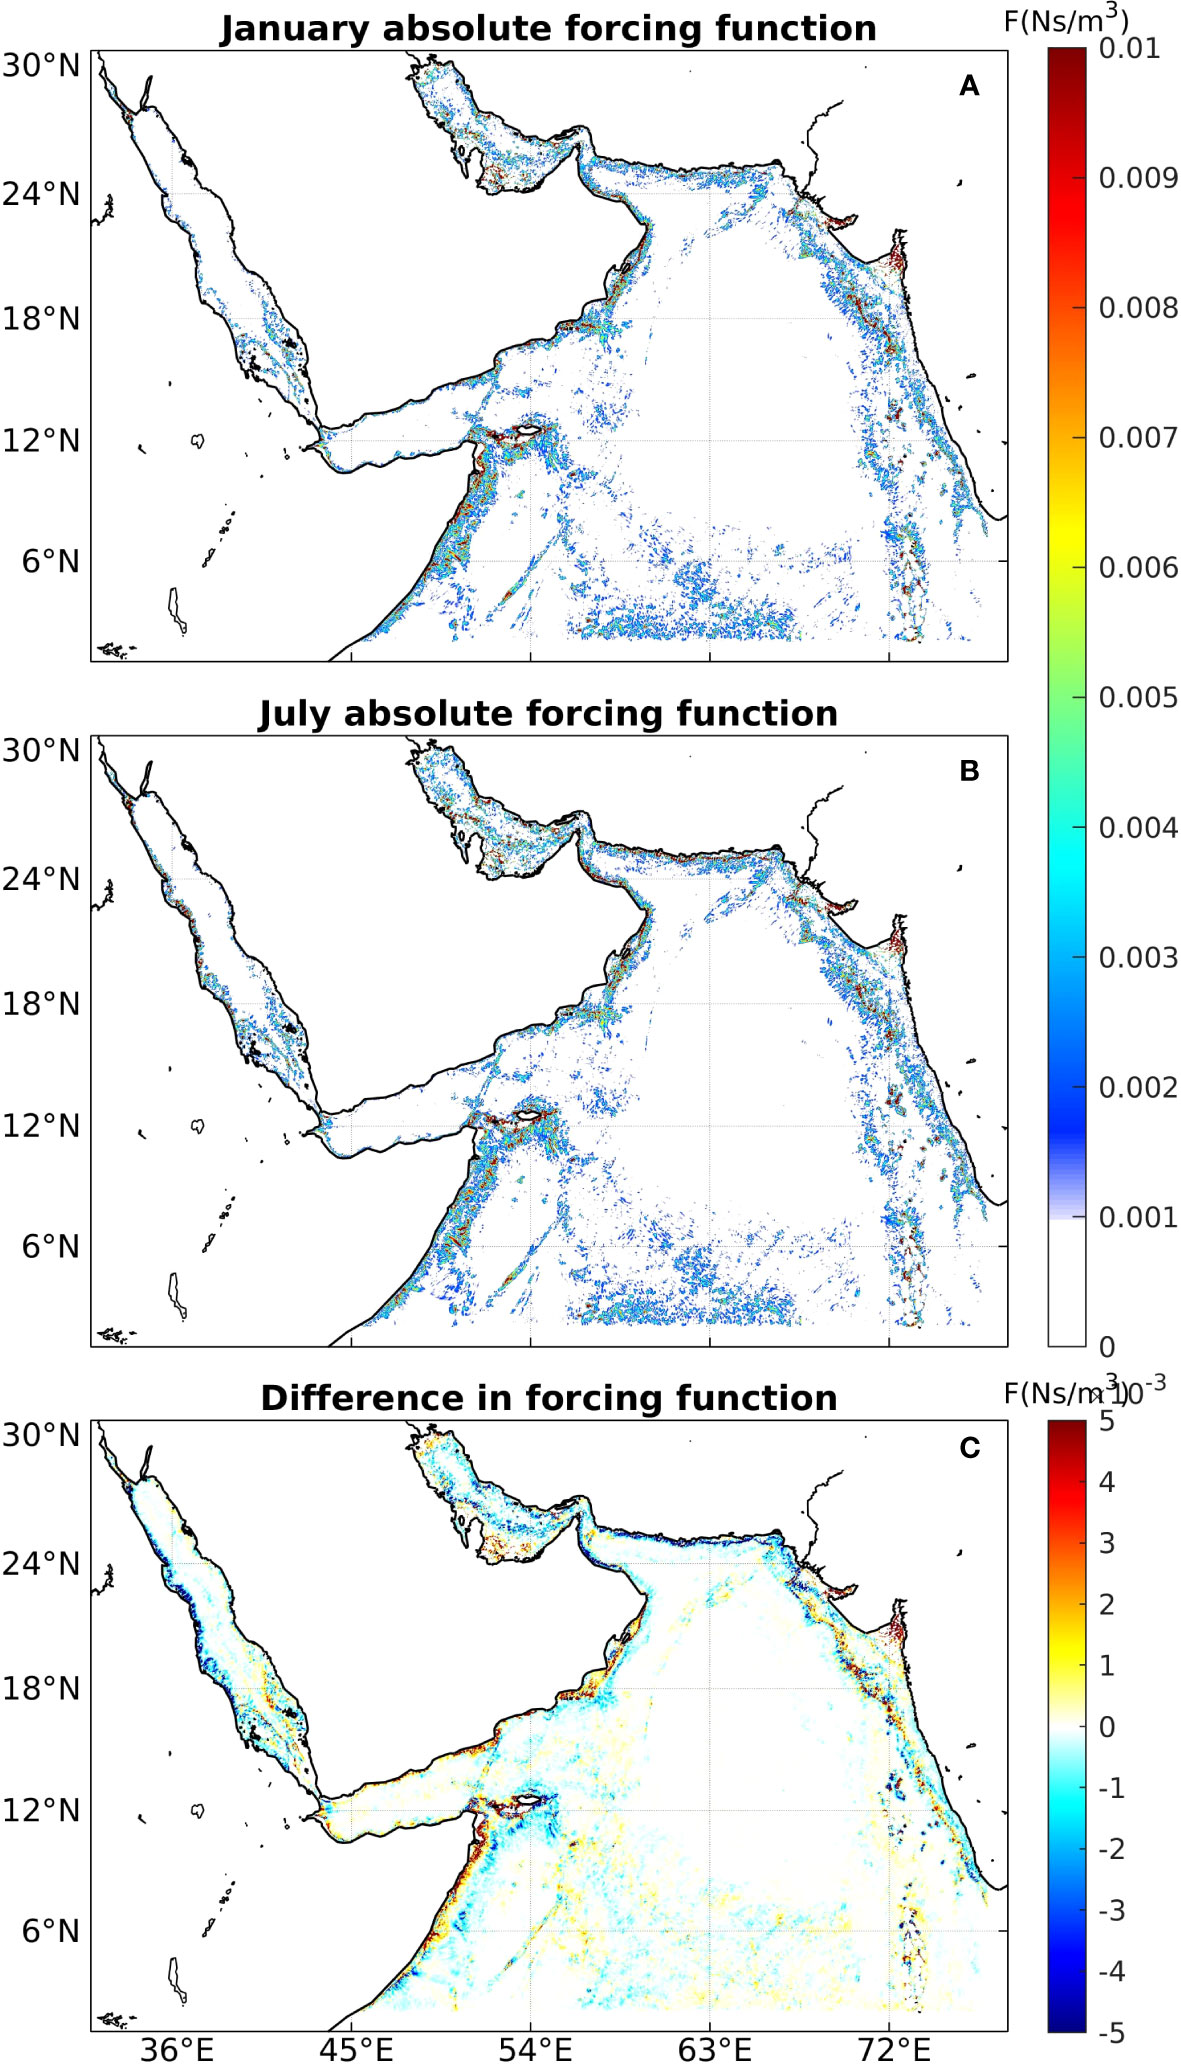
Figure 5 (A) Absolute value of the forcing function of internal tides in January. (B) Absolute values of the forcing function of the internal tides in July in the AS. (C) The difference in the forcing function between January and July in the AS.
Differences in the magnitude of the forcing function are shown in Figure 5C to examine its seasonal variability. The most significant seasonal difference was found around Socotra Island, where the forcing function has a larger magnitude in summer than that in winter, especially on the southeast of the island. However, the forcing function values along the coast of Somalia were greater in winter. The primary feature that differed between the two seasons are the barotropic velocity field and as H remained constant in different seasons. This implies that background barotropic currents and stratification determine the seasonal variability in the forcing function. However, it is noteworthy that the fundamental tidal parameters—amplitude and phase—remain consistent across different seasons. The variations in barotropic velocity predominantly stem from several dynamic variables, with a notable contribution from stratification Müller et al. (2014). Consequently, it can be inferred that stratification plays a pivotal role in controlling the seasonal disparities in the forcing function in this simulation.
3.2 Energy budget
The energy budget of internal tides is useful for evaluating the distribution and propagation pathways of internal tides (Alford et al., 2015). In this section, we analyze the basic properties of internal tides by conducting energy budget analyses in different seasons.
3.2.1 Kinetic energy
The depth-integrated baroclinic tidal KE was calculated using (Merrifield and Holloway, 2002):
Where η is the perturbation of the sea surface elevation, and are the velocities of the perturbation from spatial and temporal average along the x and y directions (Nash et al., 2004), respectively. The angle brackets are the hourly time-averaged over 14 days.
Figures 6A, B plot the distribution of KE in January and July, respectively. Basically, locations with high KE exhibited strong perturbation of internal tides, in accordance with the previous analysis from the forcing function (Equation 1). During winter, in the open AS, Socotra Island and northeastern AS exhibited substantially higher KE than those in the Maldives and the Carlsberg Ridge. KE radially decreased away from Socotra Island, dissipating gradually along the propagation of the internal tides. Moreover, KE generated in the northeastern AS splits into two branches: Branch-I moves perpendicular to the shelf, whereas Branch-II propagates more southernly, in agreement with the results revealed by satellite imagery (Ma et al., 2021). This split might be caused by the changes in topography, such as the depth and the slope of the continental shelf (Jithin et al., 2019; Marques et al., 2021). At the Maldives and Carlsberg Ridge, KE was only high in areas close to the generation sources, suggesting that the internal tides dissipated rapidly in these areas. Although KE was low in the RS and AG, several source locations can still be recognized. Three primary sources of internal tides were identified in the RS: the northern RS, southern RS, and Strait of BAM; these locations were highly consistent with the results of Guo et al. (2018). Moreover, in the AG, we identified a source close to the Strait of Hormuz. Internal tides are weak in the AG because of the shallow water depth, which forms indistinct stratification and increases the bottom friction. In comparison, summer KE was only prominent along a few directions at Socotra Island, the north of the Maldives, and marginal seas.
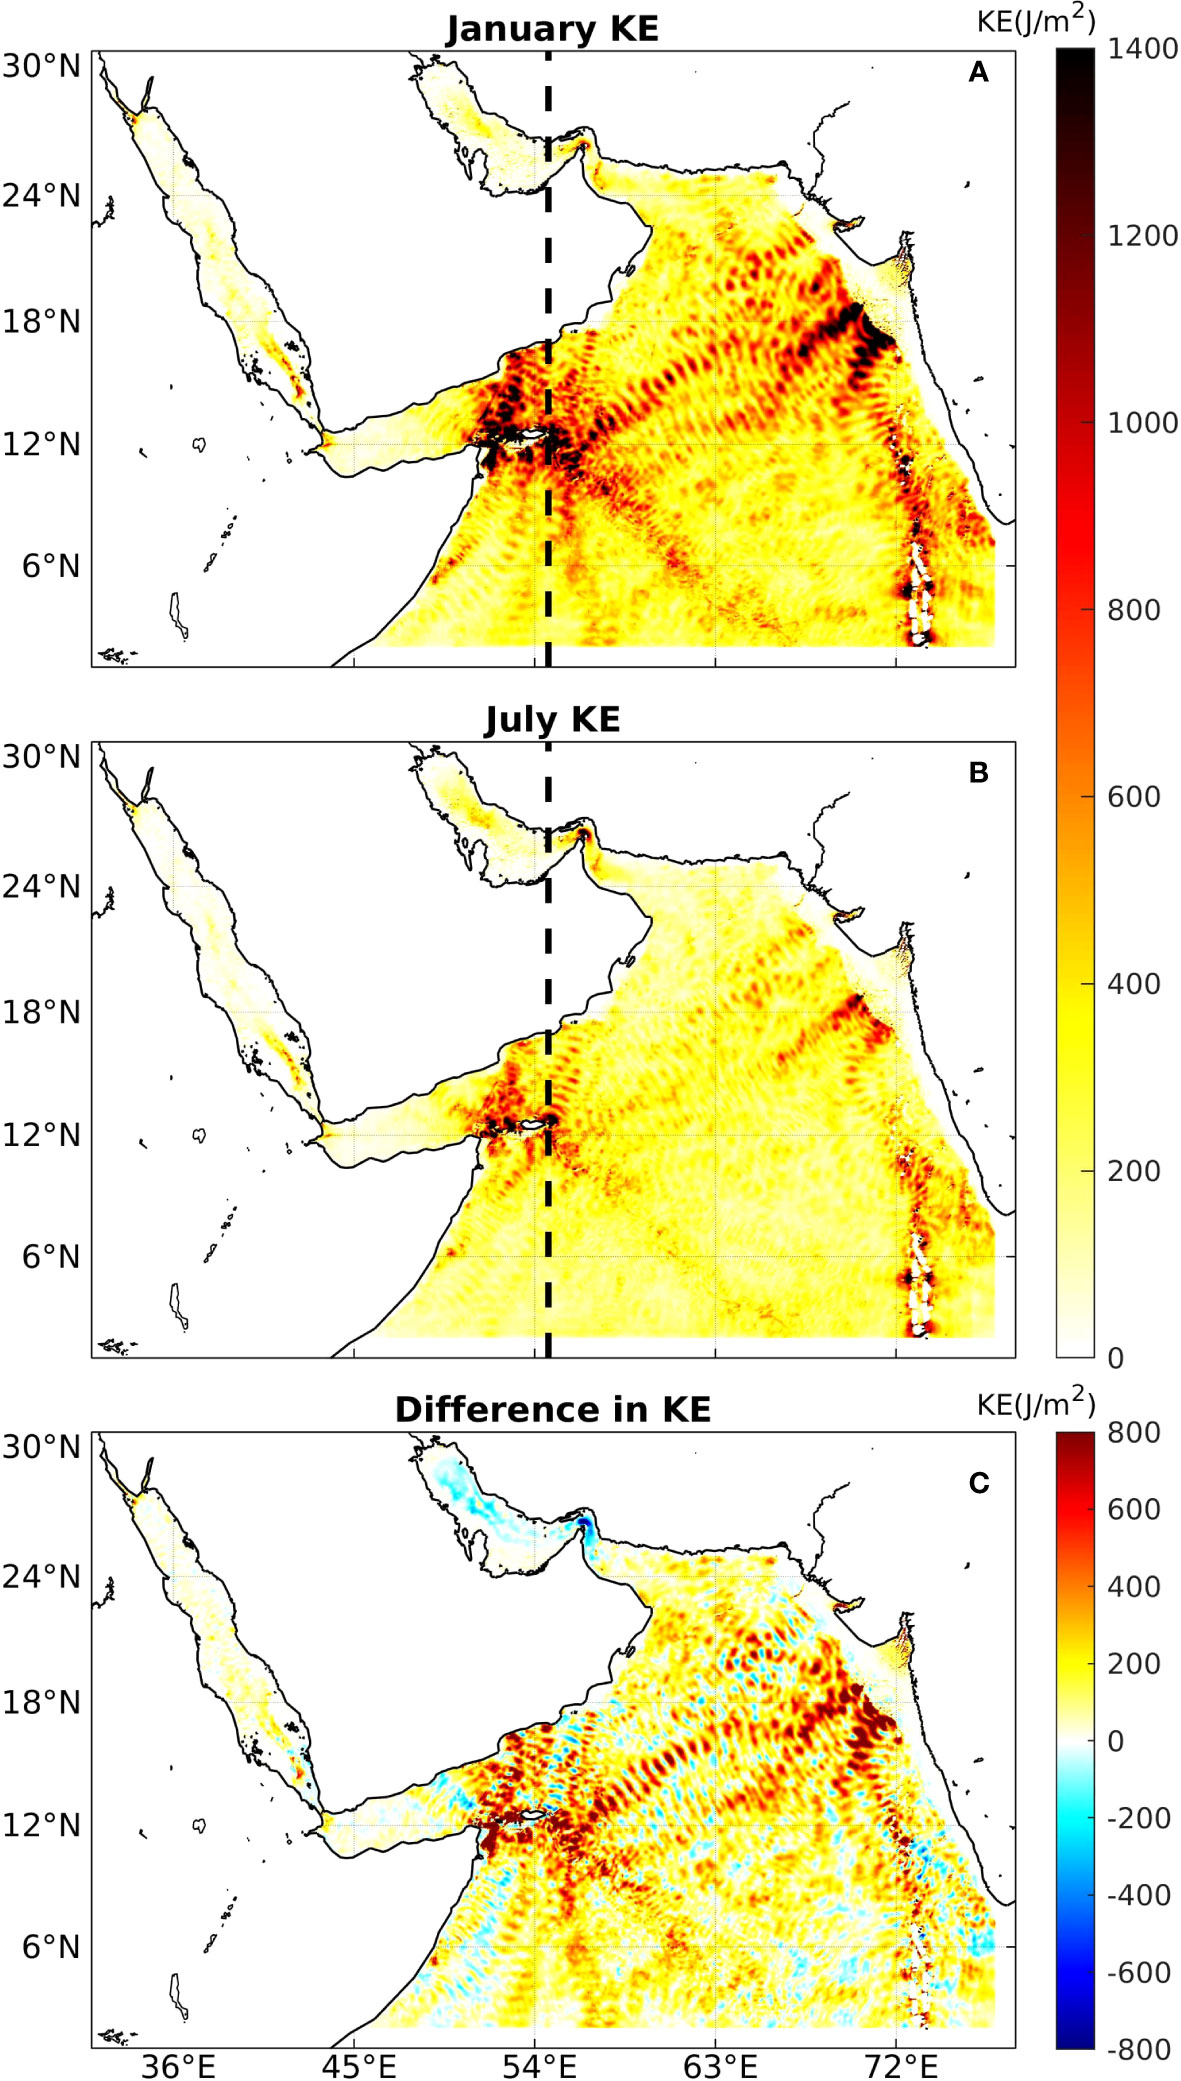
Figure 6 (A) The KE of internal tides in January. (B) KE of the internal tides in July. The dashed lines show the location of transect in Figure 7. (C) The difference in KE between January and July.
Figure 6C shows the differences in KE between summer and winter. In general, KE was larger in winter. The only factor that varies between these two seasons in AS-Tide is stratification, which suggests that this quantity plays a significant role in controlling the seasonality of KE.
Following the general description of the internal tides in the AS, we now focus on analyzing the seasonality of internal tides at distinct source locations. We explored the vertical structure of the internal tides using a representative cross-section along 54.68°E, where the seasonal differences in the internal tides were significant. Figures 7A, B show the cross-section snapshots of the horizontal velocity field , with the transect location indicated by the dashed lines in Figure 6. Clearly, beam-like rays emanated from ridges close to 6°E and 8°E. Those structures could propagate to the sea surface and bottom, where the reflections occur. After several reflections between layers, the structures were weakened and gradually disappeared, which may be attributed to that high-mode internal tides dissipated close to their generation sites and that only the low-mode waves remain (Rainville and Pinkel, 2006). Generally, the internal tides were more significant in winter than those in summer, suggesting more robust internal tides are generated during winter, consistent with the previous discussion from Section 3.2. In addition, Figures 7C, D show the KE snapshot at the same time along the cross-section. The baroclinic KE around Socotra Island is obviously intenser in winter. The reflection paths of energy are captured well: after generation around the rough topography, the energy is reflected on both the sea surface and bottom to propagate away. Interference occurs when internal tides propagated along different directions, leading to the stand wave signal of KE on the surface. This is shown clearly as strips in the time-integrated energy in Figure 6.
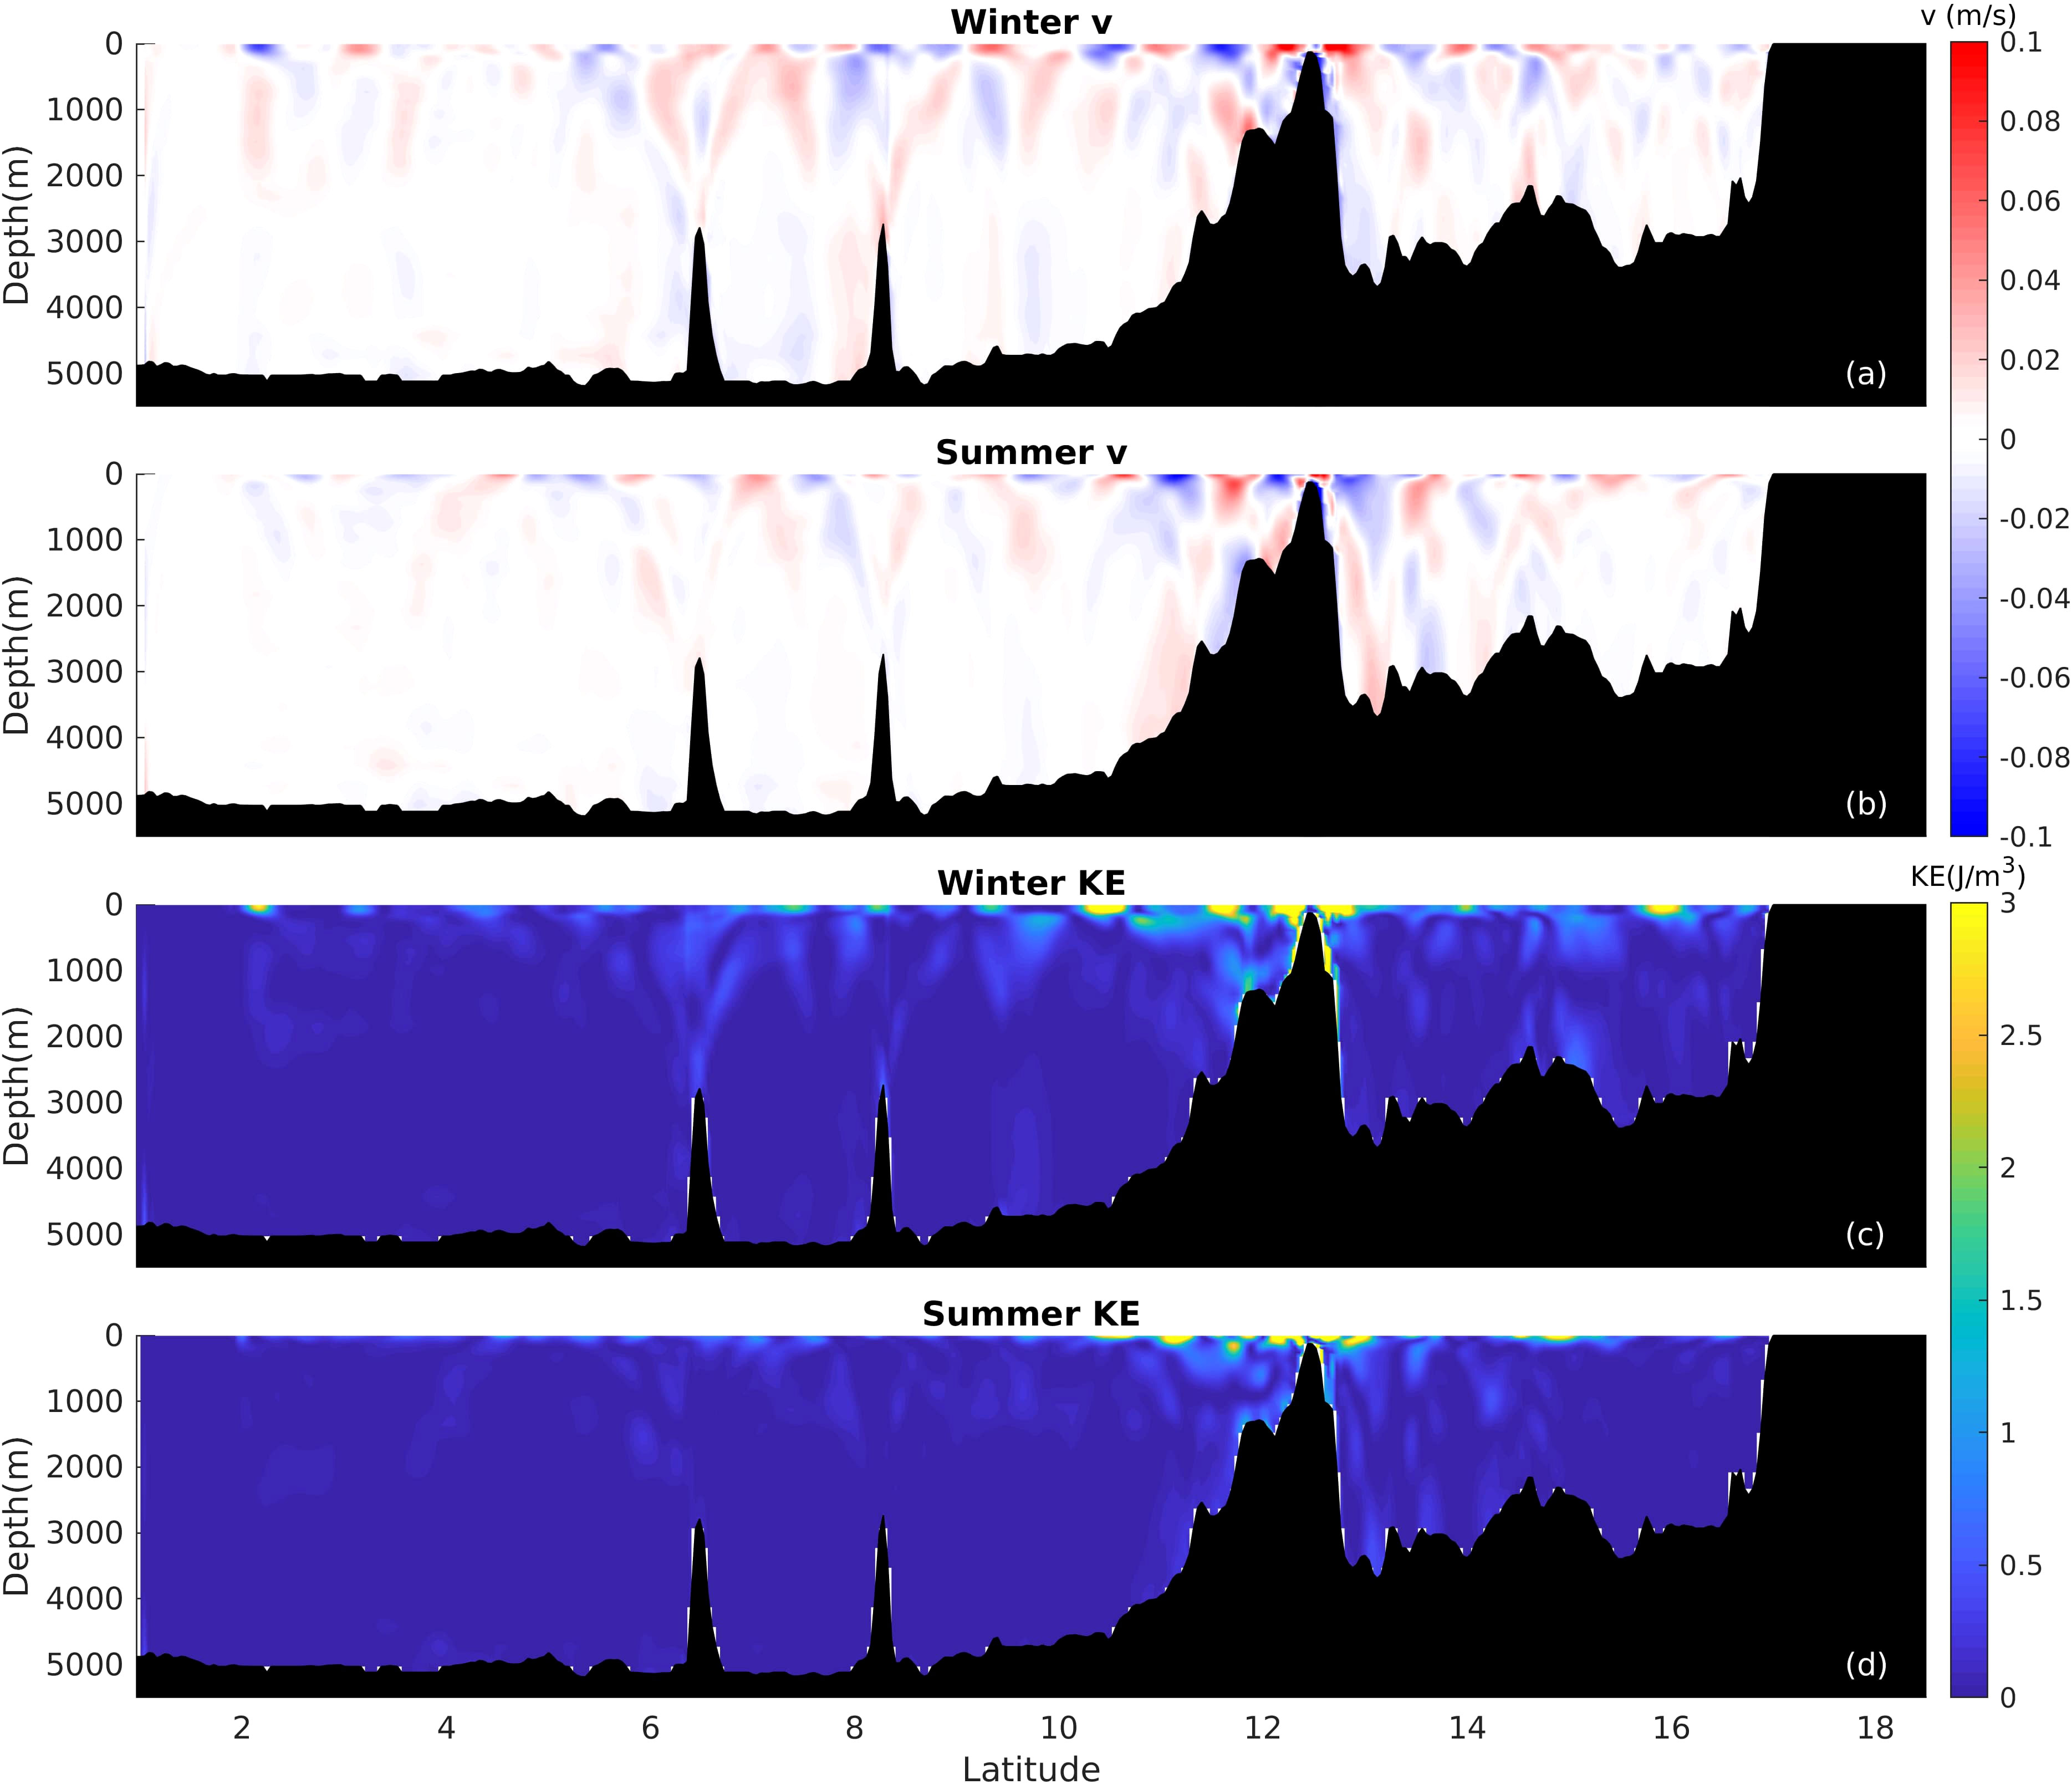
Figure 7 (A) Snapshot (12:00 pm, 28th, Jan, 2011) of velocity over the cross-section along 54.68°E at January. (B) Snapshot (12:00 pm, 28th, Jul, 2011) of velocity over the cross-section along 54.68°E in July. (C) Snapshot (12:00 pm, 28th, Jan, 2011) of KE over the cross-section along 54.68°E in January. (D) Snapshot (12:00 pm, 28th, Jul, 2011) of KE over the cross-section along 54.68°E in July.
3.2.2 Integrated energy flux
Figures 8A, B depict the distributions of the depth-integrated energy fluxes of internal tides in the AS (Ebc) in winter and summer, respectively. These values were calculated based on (Niwa and Hibiya, 2004; Guo et al., 2018):
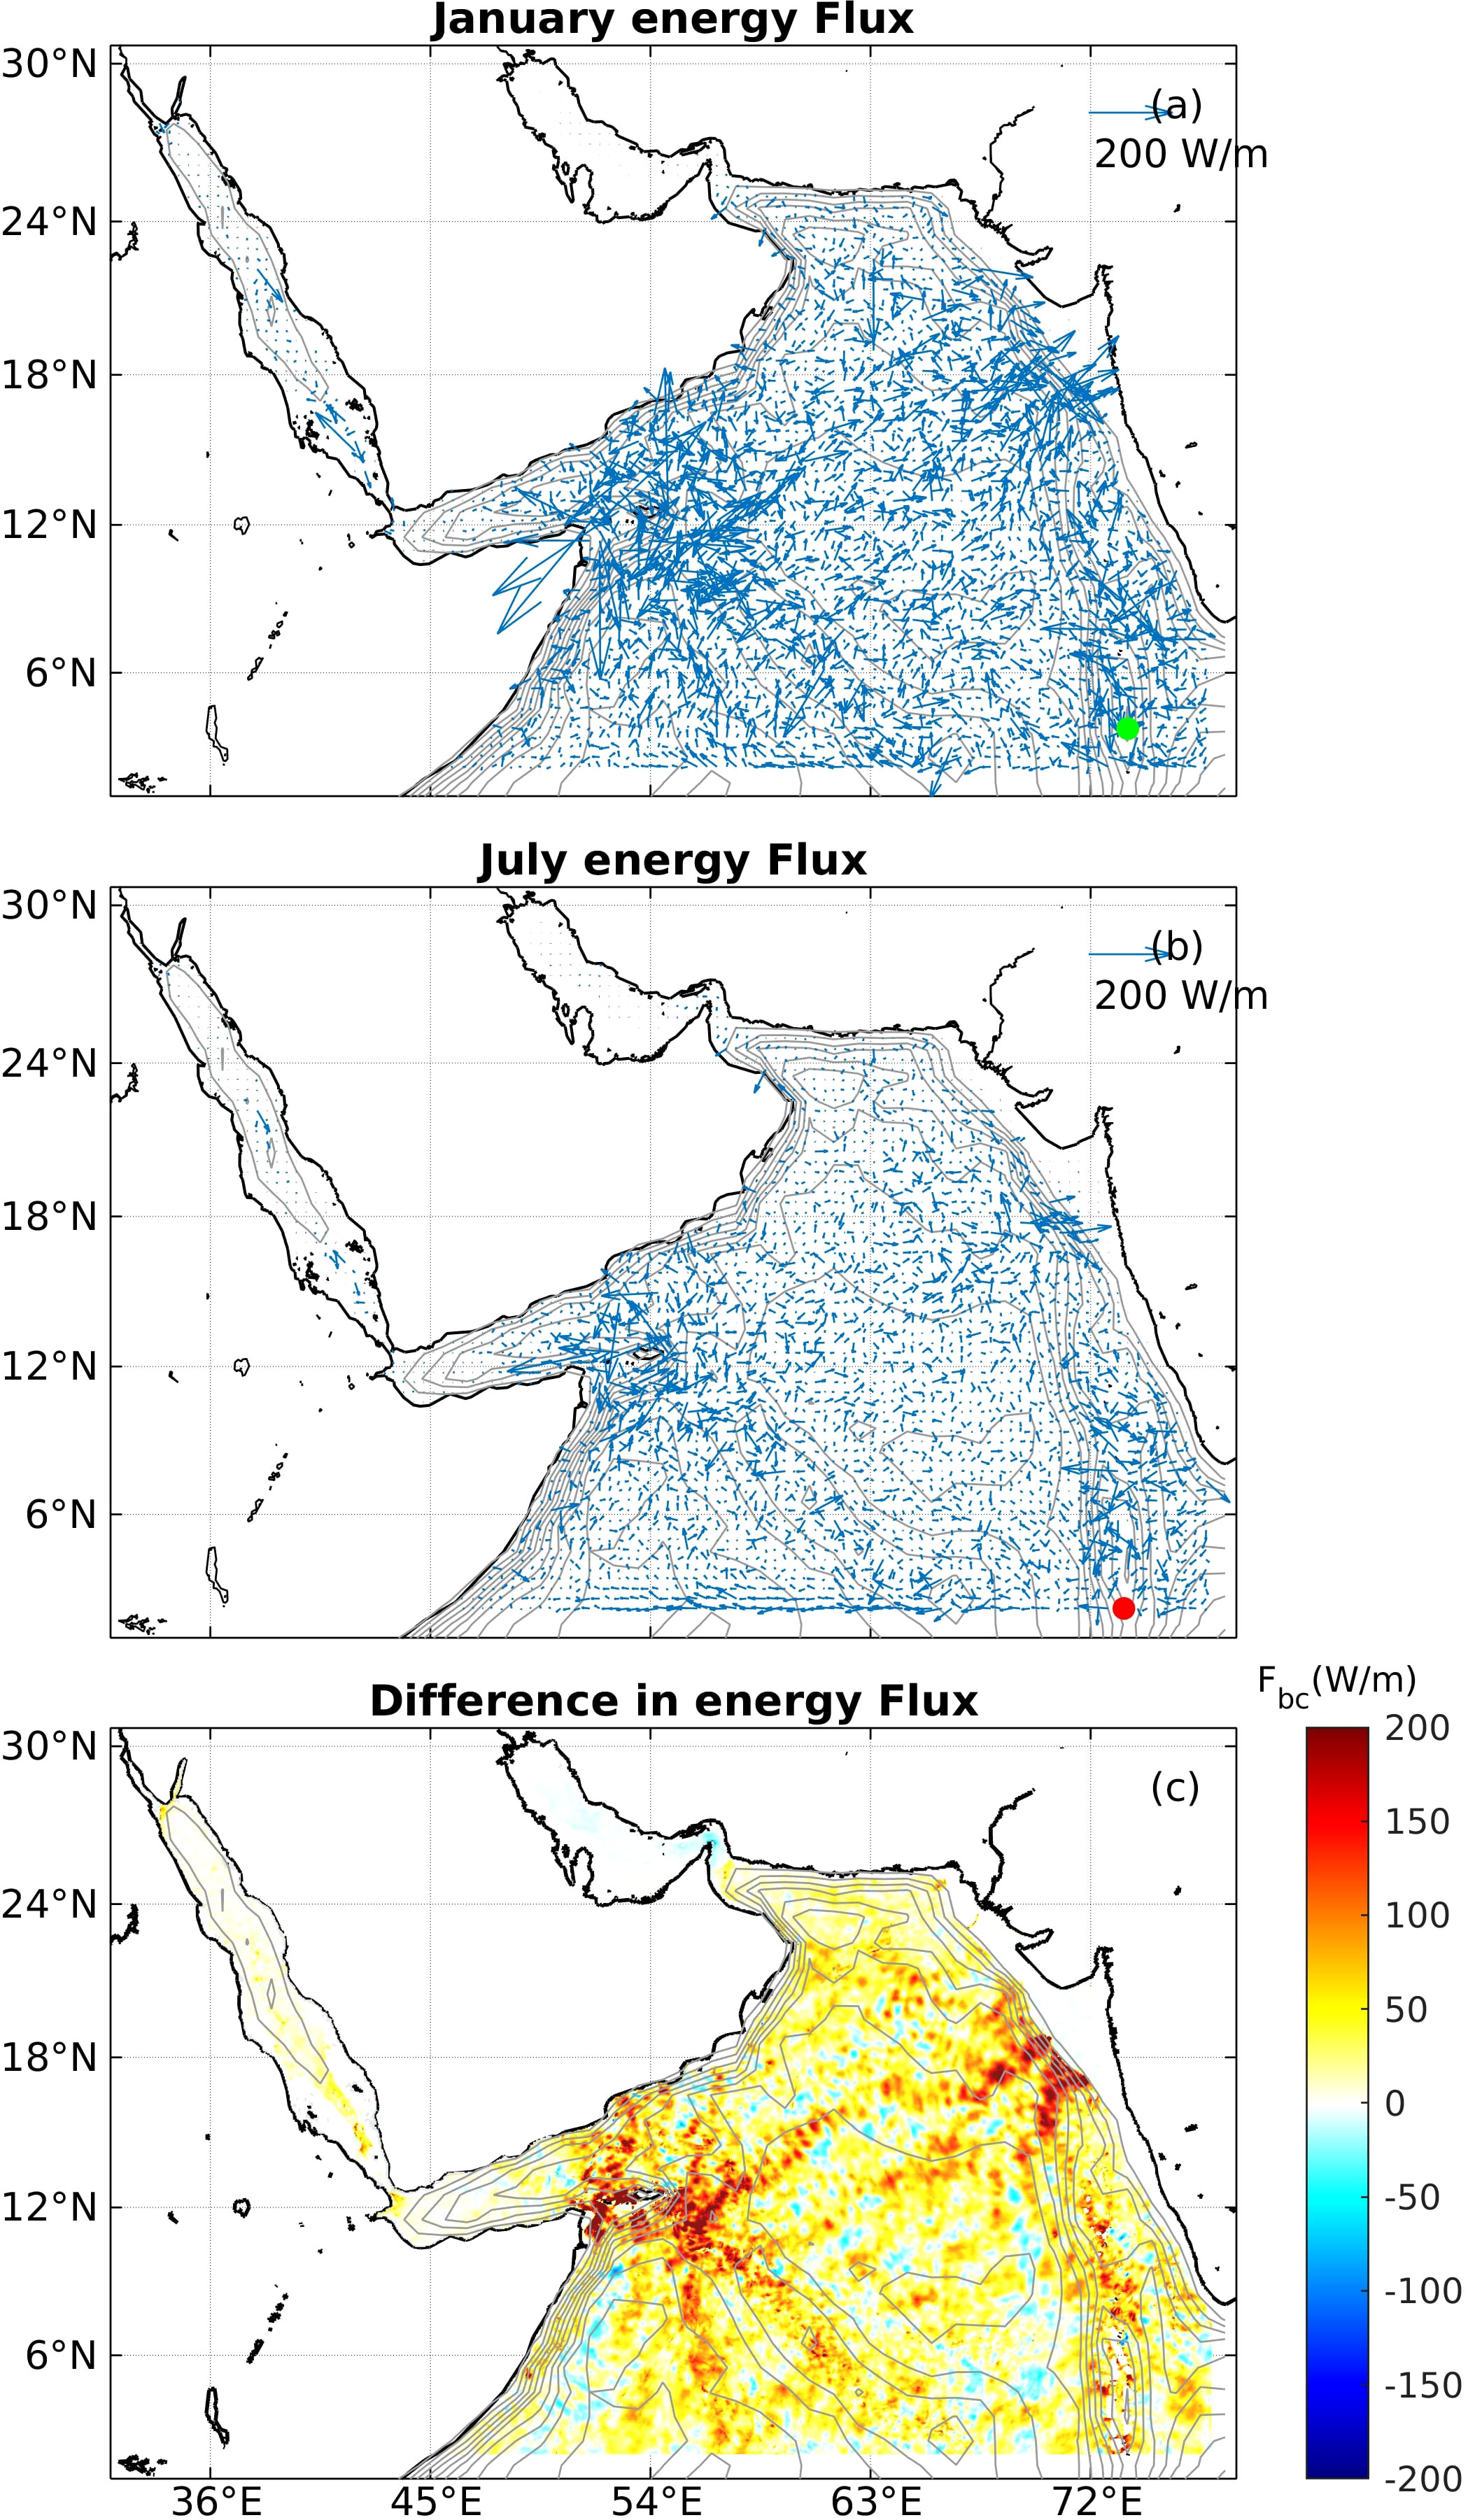
Figure 8 (A) Depth-integrated energy flux of the internal tides in January. The grey lines in the background are the depth contour. The green dot indicates the location of the maximum Ebcin January around the Maldives. (B) Depth-integrated energy flux of the internal tides in July. The red dot indicates the location of the maximum Ebcin July around the Maldives (C) Difference in depth-integrated energy flux between January and July.
where denotes the perturbation of the pressure at each model layer and can be calculated from density anomaly (Nash et al., 2004). Generally, Ebc decreased with the propagation of the internal tides. Ma et al. (2021) sketched Ebc using satellite data, which revealed similar patterns compared to the simulation results. The waves generated around Socotra Island propagate both northward and southward. During January, the maximum Ebc was 2.46 kW/m in the north of Socotra Island and 1.53 kW/m in the south. During July, Ebc was still prominent at Socotra Island, but the magnitudes were much smaller than those in January. Around Socotra Island, the maximum Ebc in July was 1.29 kW/m to the north and up to 0.46 kW/m to the south. In northeastern AS, Ebc reached a maximum of 1.42 kW/m within Branch-I and 0.53 kW/m in Branch-II in January, and the corresponding values were 0.34 kW/m and 0.30 kW/m in July, suggesting that larger internal tides during winter. Moreover, Ebc was barely generated at the Carlsberg Ridge during January. Ebc basically propagated west and east from the Maldives. Note that the maximum Ebc in January around the Maldives was 1.04 kW/m; this maximum was located east of the main Maldives, as shown by the green dot in Figure 8A. The maximum Ebc in July around the Maldives reached up to 0.64 kW/m, located next to the southeast side of the main island of Maldives, as indicated by the red dot in Figure 8B. Moreover, Figure 8C shows that the distribution of the energy flux is indistinguishable from that of KE in Figure 8C, suggesting that the difference in KE was largely responsible for the seasonal variability of Ebc.
3.2.3 Conversion and dissipation rates
Figure 9 displays the seasonal depth-integrated energy conversion rate, energy flux divergence, and energy dissipation rate of internal tides during January and July. The hourly averaged conversion rate over 14 days from barotropic to baroclinic tides was estimated using the following equation:
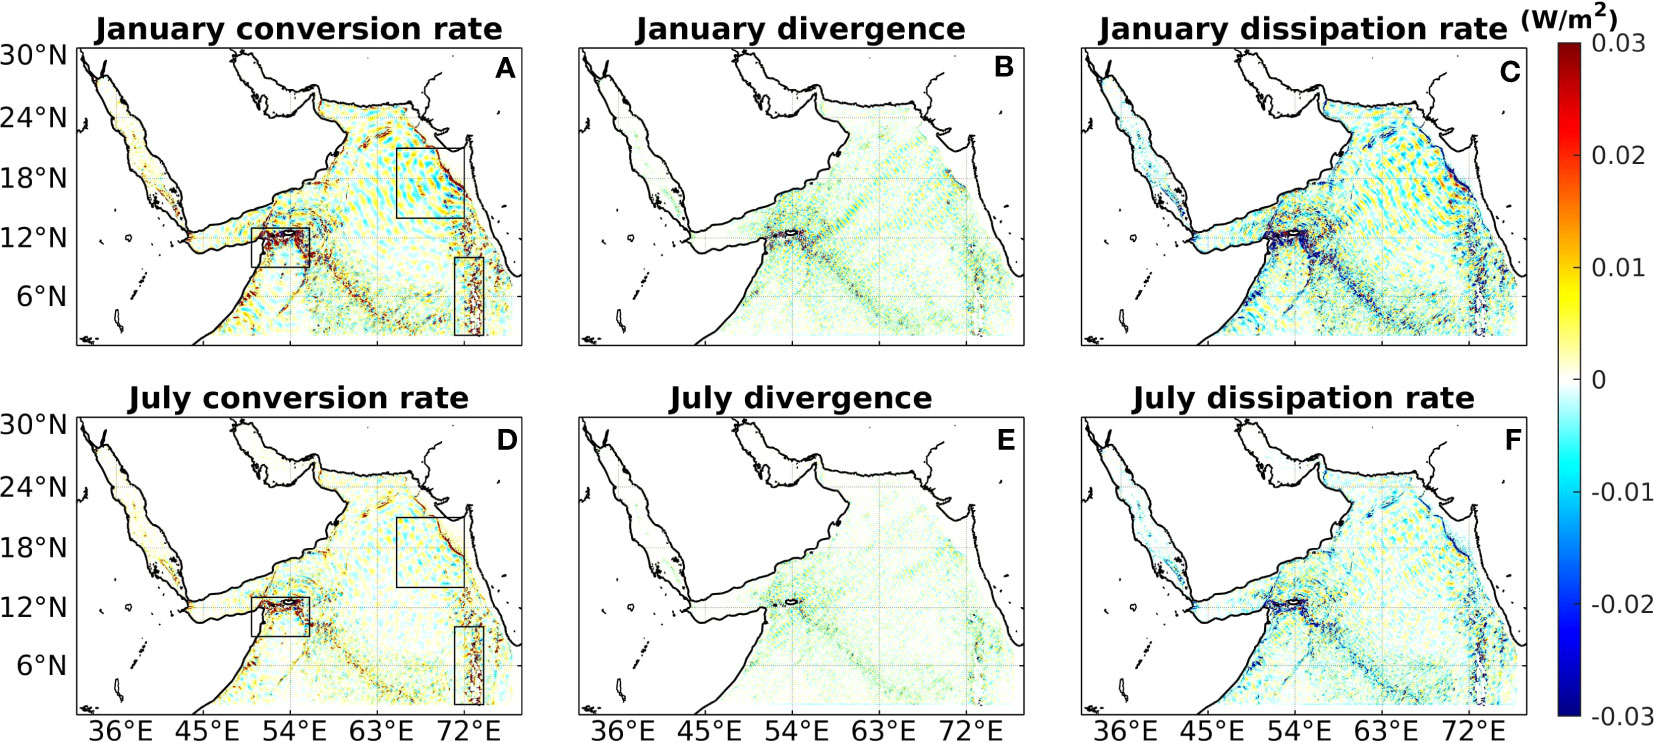
Figure 9 (A–C) The conversion rate, divergence, and dissipation rate of the internal tides in January. The black rectangles indicate the calculation regions. (D–F) The conversion rate, divergence, and dissipation rate of the internal tides in July.
where wbtis the Cartesian vertical velocity associated with the barotropic flow given by (Niwa and Hibiya, 2004):
with D ≡ H + η denotes the total depth, , and t is the time. The results suggest no significant differences in the spatial distributions between the two seasons in Figures 9A, D. We further calculated the conversion rate integrated in the main source areas and the corresponding regions are depicted in Figure 9A by black rectangles. During January, the hourly-averaged area-integrated conversion rates from barotropic-to-baroclinic tides were 5.03 GW around Socotra Island (2.52e+11 m2), 1.31 GW in northeastern AS (5.15e+11 m2), and 2.29 GW around the Maldives (2.52e+11 m2). In total, 34.28 GW of barotropic energy was converted to baroclinic energy in the AS (1.44e+13 m2). These values decreased to 2.24, 0.65, 1.75, and 20.51 GW in July, respectively. The winter internal tides were generally more energetic, consistent with the previous results in Ma et al. (2021).
The divergence of baroclinic tidal energy is calculated from:
The internal tide energy flux is the product of the horizontal velocity and the pressure perturbation, and its divergence describes how the energy is distributed in space. A positive divergence means that energy is flowing out of a region, while a negative divergence means that energy is flowing into a region. The regions with large seasonal divergence differences match the previous deduction from the forcing function. The dissipation rate could be roughly estimated as the difference between the conversion rate and divergence, under the assumption that the advection term is negligible (Niwa and Hibiya, 2004). Compared to the conversion rate, the divergence of energy flux is larger; as a result, the distribution of the dissipation rate is similar to the divergence: the dissipation mainly occurred close to Socotra Island, the northeastern AS, and the Maldives.
3.3 Simulated internal tides vs. remotely sensed data
Ma et al. (2021) investigated the distribution and energetics of the internal tides in the AS by analyzing along-track satellite altimeter datasets. We explored the difference between the results from the satellite observations and the present simulations by comparing their depth-integrated energy fluxes for the whole domain. The Ebc deducted from satellites is computed from the sea surface signals (more details are provided in Ma et al. (2021)), while that from the simulation is calculated from the perturbation of velocity and pressure, as stated in Equation 3. The values were normalized to better compare the similarity of their distributions based on three different parameters as shown in Table 1.
The Euclidean distance is defined as the smallest distance between pairs of points from two objects and has been used for thousands of years. In our case, the Euclidean distance also suggests a high degree of consistency between the model and observational data, given that the magnitudes of the energy flux are of the order of 103. The Bhattacharyya distance is a metric that bounds the misclassification probability in Bayesian analysis and measures the similarity between two probability distributions (Bhattacharyya, 1943), ranging from 0 to 1. A value close to 0 indicates a perfect match. In both January and July, this parameter remains close to 0.1, indicating a high degree of similarity in energy flux between the model outputs and observational data. A Histogram Intersection method, introduced by Swain and Ballard Lee et al. (2005); Swain and Ballard (1991), recognizes images based on the distribution of color histograms. This method also calculates the similarity of two probability distributions and produces a value between 0 and 1, with 1 indicating an identical distribution. The Histogram Intersection values obtained for both January and July are greater than 0.93, which indicates a good similarity between the model and observational data.
The analyzed three parameters of assessing consistency suggests that the estimated Ebcobtained from both satellite data and the model simulation are strongly correlated. Compared with the satellite data, the AS-Tide provides higher temporal and spatial resolution, since the limited lifespan and revisit cycle of satellites constrain the duration of their data. Moreover, as satellites are restricted to capturing signals from the sea surface and cannot explore internal tides in depth, the simulation offers greater opportunities for investigating internal tides.
3.4 AS-Tide under a different stratification
As outlined in Section 2.1, the sole disparity between the and winter months model simulations lies in their initial temperature and salinity, as well as the barotropic tidal velocity input from the boundaries. Since barotropic signals remain largely constant over extended periods, the only significant factor affecting the seasonality of internal tides is the vertical stratification. A more pronounced stratification in the thermocline during winter promotes energy conversion from barotropic to baroclinic tides and the development of baroclinic instability, resulting in greater effectiveness of energy conversion and increased energy dissipation (Wang et al., 2016). As depicted in Figure 2C, the winter stratification is stronger than in summer at depths greater than 100 meters, where the internal tides are active. This highlights the minor contribution of the strong stratification around 50 meters to the energy of internal tides.
To investigate the behavior of internal tides in AS-Tide under varying stratification, additional experiments were conducted using new initial conditions in which the pronounced summer stratification around 50 meters was mitigated. January and July were again selected to represent winter and summer, respectively, and the corresponding temperature, salinity, and buoyancy frequency profile are presented in Figures 10A–C. Generally, the winter stratification was slightly stronger than that in summer. The depth-integrated energy flux was used to examine the difference between summer and winter, and the results under the averaged stratification are shown in Figure 11. A comparison between Figures 11B, 8B reveals that internal tides under the averaged stratification exhibit a stronger depth-integrated energy flux during summer, making the distribution of the depth-integrated energy flux more similar to that in winter. Signals along the Carlsberg Ridge, which were difficult to observe in Figure 8B, are now more pronounced. The averaged summer stratification is much weaker at the depth of around 50 meters compared to the previous one, while it is slightly stronger at depths exceeding 100 meters. These findings indicate that the increased summer stratification at depths greater than 100 meters plays a significant role in enhancing the energy conversion of internal tides. Moreover, the most prominent seasonal differences in the internal tides are observed in the two primary source locations, namely the northeastern Arabian Sea and Socotra Island.
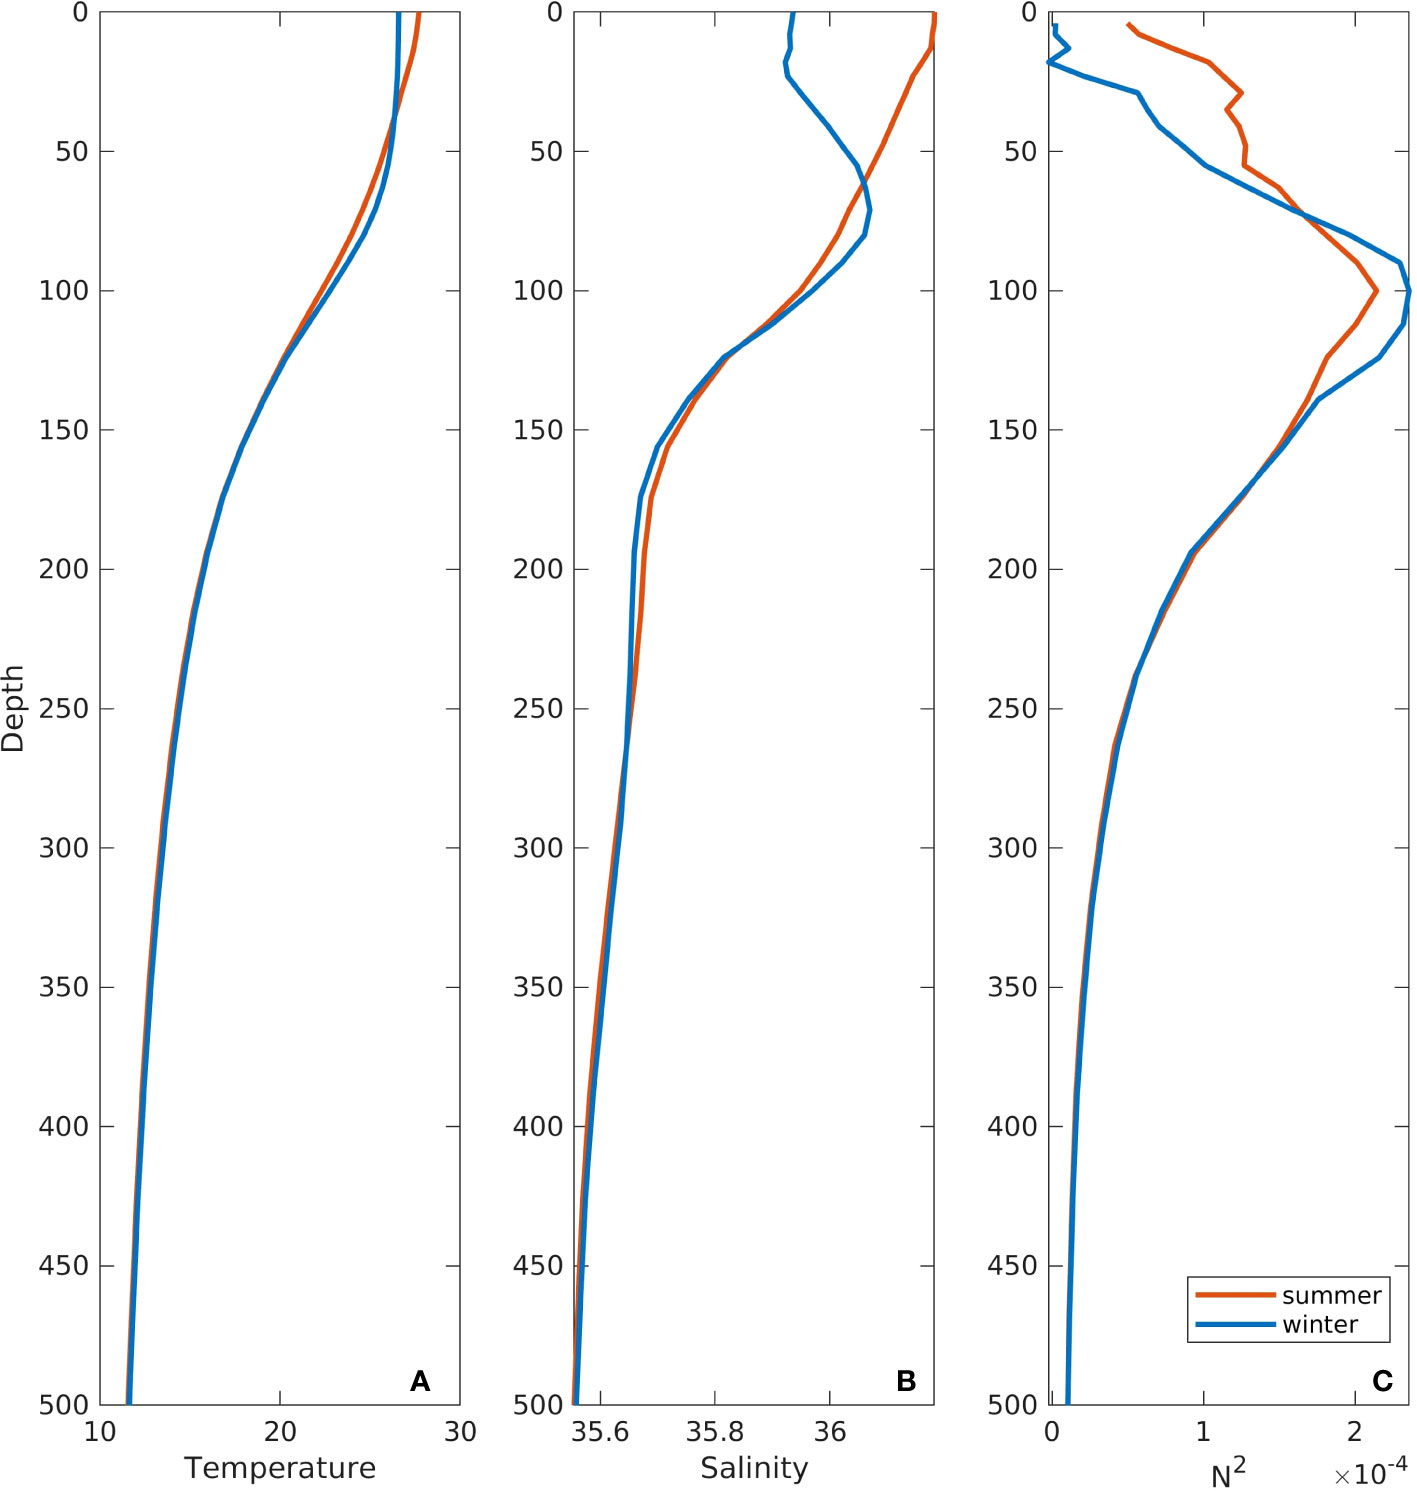
Figure 10 (A) The initial temperature profile of the new AS-Tide. (B) The initial salinity profile of the new AS-Tide. (C) The corresponding buoyancy frequency profile. The profiles are shown in red and blue colors for July and January, respectively.

Figure 11 (A) Depth-integrated energy flux of the internal tides in January under the averaged stratification. The grey lines in the background are the depth contour. (B) Depth-integrated energy flux of the internal tides in July under the averaged stratification. (C) Difference in depth-integrated energy flux between January and July.
4 Conclusions and discussion
Internal tides play an important role in ocean mixing and energy exchange. The current knowledge regarding internal tides in the Arabian Sea (AS) is limited, and there is still much to be understood about their dynamics and characteristics. This study implemented a 3D high-resolution ocean general circulation model to simulate and examine the properties and seasonal variations of internal tides in the AS. The model simulations exhibited good agreement with tidal gauge data, successfully capturing the well-known features of internal tides. Leveraging these simulations, we conducted a comprehensive analysis to explore the characteristics and seasonal variability of internal tides in the AS.
In the open AS basin, three major source locations of internal tides were identified based on the simulation results: Socotra Island, the northeastern AS, and the Maldives islands. The forcing function also shows larger values in these locations than in their surroundings. Internal tides around Socotra Island propagate both northward and southward and dissipate radially. Internal tides generated in the northeastern AS split into two branches: Branch-I propagated perpendicular to the shelf, whereas Branch-II propagated more southwards. In the Maldives, internal tides propagate to the east and west. The intensity of internal tides in marginal seas, the Red Sea and the Arabian Gulf, were considerably weaker than those in the open AS.
We also presented the results of the significant seasonal variability in the energy flux of the internal tides in the AS by examining the differences in velocity across a cross-section. Generally, internal tides are more significant in winter in terms of forcing function, energy flux, and conversion rate. The integrated conversion rates for the whole domain—including the AS, RS, and Arabian Gulf, were 34.28 GW in winter and 20.51 GW in summer. In particular, summer internal tides were only prominent along a few directions from Socotra Island, north of the Maldives, and the marginal seas. Given the limitations of the model resolution (4 km), internal tides in the marginal seas and the details of the two branches in the northeastern AS are still not well resolved and will require further investigation in the future.
AS-Tide provides a reliable simulation for internal tides in the AS, which makes it possible to further study their role in ecological environments and climate change through simulations. Certain areas exhibit high dissipation rates and happen to possess an abundance of coral reefs. The mixing resulting from the dissipation of internal tides can reduce the heat accumulation on coral reefs (Wyatt et al., 2020), and internal tides can provide thermal refugia to protect coral reefs from the effects of global warming (Storlazzi et al., 2020). Based on AS-Tide, we can build a more advanced model to investigate the contribution of internal tides to alleviate coral bleaching, which warrants further study.
Data availability statement
The original contributions presented in the study are included in the article/supplementary material. Further inquiries can be directed to the corresponding authors.
Author contributions
JM: Conceptualization, Data curation, Formal Analysis, Investigation, Methodology, Validation, Visualization, Writing – original draft. DG: Conceptualization, Formal Analysis, Methodology, Supervision, Writing – review & editing. PZ: Conceptualization, Funding acquisition, Writing – review & editing. IH: Conceptualization, Funding acquisition, Project administration, Resources, Supervision, Writing – review & editing.
Funding
The author(s) declare financial support was received for the research, authorship, and/or publication of this article. The Virtual Red Sea Initiative (Grant # REP/1/3268-01-01) and the National Natural Science Foundation of China (42276029).
Acknowledgments
This research made use of the resources from the Supercomputing Laboratory and computer clusters at KAUST. We thank all the researchers, institutions, and organizations responsible for making the WOA, GeBCO, UHSLC, and AVISO datasets publicly available.
Conflict of interest
The authors declare that the research was conducted in the absence of any commercial or financial relationships that could be construed as a potential conflict of interest.
Publisher’s note
All claims expressed in this article are solely those of the authors and do not necessarily represent those of their affiliated organizations, or those of the publisher, the editors and the reviewers. Any product that may be evaluated in this article, or claim that may be made by its manufacturer, is not guaranteed or endorsed by the publisher.
References
Alford M. H., Peacock T., MacKinnon J. A., Nash J. D., Buijsman M. C., Centurioni L. R., et al. (2015). The formation and fate of internal waves in the South China Sea. Nature 521, 65–69. doi: 10.1038/nature14399
Arbic B. K. (2022). Incorporating tides and internal gravity waves within global ocean general circulation models: A review. Prog. Oceanogr. 206, 102824. doi: 10.1016/j.pocean.2022.102824
Baines P. G. (1982). On internal tide generation models. Deep Sea Res. Part A. Oceanographic Res. Pap. 29, 307–338. doi: 10.1016/0198-0149(82)90098-X
Beal L. M., Hormann V., Lumpkin R., Foltz G. R. (2013). The response of the surface circulation of the Arabian Sea to monsoonal forcing. J. Phys. Oceanogr. 43, 2008–2022. doi: 10.1175/JPO-D-13-033.1
Bhattacharyya A. (1943). On a measure of divergence between two statistical populations defined by their probability distributions. Bull. Calcutta Math. Soc 35, 99–109.
Blumberg A. F., Mellor G. L. (1987). A description of a three-dimensional coastal ocean circulation model. Three-dimensional Coast. ocean Models 4, 1–16. doi: 10.1029/CO004p0001
Cacchione D., Pratson L. F., Ogston A. (2002). The shaping of continental slopes by internal tides. Science 296, 724–727. doi: 10.1126/science.1069803
Carter G., Merrifield M., Becker J., Katsumata K., Gregg M., Luther D., et al. (2008). Energetics of m2 barotropic-to-baroclinic tidal conversion at the Hawaiian Islands. J. Phys. Oceanogr. 38, 2205–2223. doi: 10.1175/2008JPO3860.1
Chuang W.-S., Wang D.-P. (1981). Effects of density front on the generation and propagation of internal tides. J. Phys. Oceanogr. 11, 1357–1374. doi: 10.1175/1520-0485(1981)011<1357:EODFOT>2.0.CO;2
Dushaw B. D., Howe B. M., Cornuelle B. D., Worcester P. F., Luther D. S. (1995). Barotropic and baroclinic tides in the central North Pacific Ocean determined from long-range reciprocal acoustic transmissions. J. Phys. Oceanogr. 25, 631–647. doi: 10.1175/1520-0485(1995)025<0631:BABTIT>2.0.CO;2
Egbert G. D., Erofeeva S. Y. (2002). Efficient inverse modeling of barotropic ocean tides. J. Atmospheric Oceanic Technol. 19, 183–204. doi: 10.1175/1520-0426(2002)019<0183:EIMOBO>2.0.CO;2
Egbert G. D., Ray R. D. (2003). Semi-diurnal and diurnal tidal dissipation from topex/poseidon altimetry. Geophysical Res. Lett. 30. doi: 10.1029/2003GL017676
Fu H., Wu X., Li W., Zhang L., Liu K., Dan B. (2021). Improving the accuracy of barotropic and internal tides embedded in a high-resolution global ocean circulation model of mitgcm. Ocean Model. 162, 101809. doi: 10.1016/j.ocemod.2021.101809
Guo D., Kartadikaria A., Zhan P., Xie J., Li M., Hoteit I. (2018). Baroclinic tides simulation in the red sea: Comparison to observations and basic characteristics. J. Geophysical Res.: Oceans 123, 9389–9404. doi: 10.1029/2018JC013970
Hall J. K. (2006). Gebco centennial special issue–charting the secret world of the ocean floor: the gebco project 1903–2003. Mar. Geophysical Res. 27, 1–5. doi: 10.1007/s11001-006-8181-4
Jithin A., Francis P., Unnikrishnan A., Ramakrishna S. (2019). Modeling of internal tides in the western Bay of Bengal: Characteristics and energetics. J. Geophysical Res.: Oceans 124, 8720–8746. doi: 10.1029/2019JC015319
Kelly S., Nash J. (2010). Internal-tide generation and destruction by shoaling internal tides. Geophysical Res. Lett. 37. doi: 10.1029/2010GL045598
Khatiwala S. (2003). Generation of internal tides in an ocean of finite depth: analytical and numerical calculations. Deep Sea Res. Part I: Oceanographic Res. Pap. 50, 3–21. doi: 10.1016/S0967-0637(02)00132-2
Kumar P. H., Lekshmi S., Jagadeesh P., Anilkumar K., Krishnakumar G., Rao A. (2010). Internal tides in the coastal waters of ne Arabian sea: observations and simulations. Mar. Geodesy 33, 232–244. doi: 10.1080/01490419.2010.493494
Laurent L. S., Stringer S., Garrett C., Perrault-Joncas D. (2003). The generation of internal tides at abrupt topography. Deep Sea Res. Part I: Oceanographic Res. Pap. 50, 987–1003. doi: 10.1016/S0967-0637(03)00096-7
Lee C. M., Jones B. H., Brink K. H., Fischer A. S. (2000). The upper-ocean response to monsoonal forcing in the Arabian Sea: seasonal and spatial variability. Deep Sea Res. Part II: Topical Stud. Oceanogr. 47, 1177–1226. doi: 10.1016/S0967-0645(99)00141-1
Lee S., Xin J. H., Westland S. (2005). Evaluation of image similarity by histogram intersection. Color Res. Application: Endorsed by Inter-Society Color Council Colour Group (Great Britain) Can. Soc. Color Color Sci. Assoc. Japan Dutch Soc. Study Color Swedish Colour Centre Foundation Colour Soc. Australia Centre Franc¸ais la Couleur 30, 265–274. doi: 10.1002/col.20122
Ma J., Guo D., Zhan P., Hoteit I. (2021). Seasonal m2 internal tides in the Arabian Sea. Remote Sens. 13, 2823. doi: 10.3390/rs13142823
Maier K. L., Rosenberger K. J., Paull C. K., Gwiazda R., Gales J., Lorenson T., et al. (2019). Sediment and organic carbon transport and deposition driven by internal tides along Monterey canyon, offshore California. Deep Sea Res. Part I: Oceanographic Res. Pap. 153, 103108. doi: 10.1016/j.dsr.2019.103108
Marques O. B., Alford M. H., Pinkel R., MacKinnon J. A., Klymak J. M., Nash J. D., et al. (2021). Internal tide structure and temporal variability on the reflective continental slope of southeastern Tasmania. J. Phys. Oceanogr. 51, 611–631. doi: 10.1175/JPO-D-20-0044.1
McManus J. F., Francois R., Gherardi J.-M., Keigwin L. D., Brown-Leger S. (2004). Collapse and rapid resumption of atlantic meridional circulation linked to deglacial climate changes. Nature 428, 834. doi: 10.1038/nature02494
Merrifield M. A., Holloway P. E. (2002). Model estimates of m2 internal tide energetics at the Hawaiian ridge. J. Geophysical Res.: Oceans 107, 5–1. doi: 10.1029/2001JC000996
Müller M., Cherniawsky J. Y., Foreman M. G., von Storch J.-S. (2014). Seasonal variation of the m 2 tide. Ocean Dynamics 64, 159–177. doi: 10.1007/s10236-013-0679-0
Munk W. (1997). Once again: once again—tidal friction. Prog. Oceanogr. 40, 7–35. doi: 10.1016/S0079-6611(97)00021-9
Munk W., Wunsch C. (1998). Abyssal recipes ii: Energetics of tidal and wind mixing. Deep Sea Res. Part I: Oceanographic Res. Pap. 45, 1977–2010. doi: 10.1016/S0967-0637(98)00070-3
Murthy P., Sharma G., James V., Suseela K. (1992). Internal wave characteristics in the eastern Arabian sea during summer monsoon. Proc. Indian Acad. Sciences-Earth Planetary Sci. 101, 317–327. doi: 10.1007/BF02893007
Nash J. D., Kunze E., Toole J. M., Schmitt R. W. (2004). Internal tide reflection and turbulent mixing on the continental slope. J. Phys. Oceanogr. 34, 1117–1134. doi: 10.1175/1520-0485(2004)034<1117:ITRATM>2.0.CO;2
Niwa Y., Hibiya T. (2004). Three-dimensional numerical simulation of m2 internal tides in the East China Sea. J. Geophysical Res.: Oceans 109. doi: 10.1029/2003JC001923
Ponte A. L., Klein P. (2015). Incoherent signature of internal tides on sea level in idealized numerical simulations. Geophysical Res. Lett. 42, 1520–1526. doi: 10.1002/2014GL062583
Rainville L., Pinkel R. (2006). Propagation of low-mode internal waves through the ocean. J. Phys. Oceanogr. 36, 1220–1236. doi: 10.1175/JPO2889.1
Ray R. D., Mitchum G. T. (1996). Surface manifestation of internal tides generated near Hawaii. Geophysical Res. Lett. 23, 2101–2104. doi: 10.1029/96GL02050
Schott F. A., McCreary J. P. Jr. (2001). The monsoon circulation of the Indian ocean. Prog. Oceanogr. 51, 1–123. doi: 10.1016/S0079-6611(01)00083-0
Sharples J., Moore C. M., Abraham E. R. (2001). Internal tide dissipation, mixing, and vertical nitrate flux at the shelf edge of ne New Zealand. J. Geophysical Res.: Oceans 106, 14069–14081. doi: 10.1029/2000JC000604
Shenoi S., Shankar D., Michael G., Kurian J., Varma K., Kumar M. R., et al. (2005). Hydrography and water masses in the southeastern Arabian Sea during March–June 2003. J. Earth system Sci. 114, 475–491. doi: 10.1007/BF02702024
Shriver J., Arbic B. K., Richman J., Ray R., Metzger E., Wallcraft A., et al. (2012). An evaluation of the barotropic and internal tides in a high-resolution global ocean circulation model. J. Geophysical Res.: Oceans 117. doi: 10.1029/2012JC008170
Smith J. E., Smith C. M., Vroom P. S., Beach K. L., Miller S. (2004). Nutrient and growth dynamics of halimeda tuna on conch reef, Florida keys: Possible influence of internal tides on nutrient status and physiology. Limnol. Oceanogr. 49, 1923–1936. doi: 10.4319/lo.2004.49.6.1923
St. Laurent L., Garrett C. (2002). The role of internal tides in mixing the deep ocean. J. Phys. Oceanogr. 32, 2882–2899. doi: 10.1175/1520-0485(2002)032<2882:TROITI>2.0.CO;2
Storlazzi C. D., Cheriton O. M., Van Hooidonk R., Zhao Z., Brainard R. (2020). Internal tides can provide thermal refugia that will buffer some coral reefs from future global warming. Sci. Rep. 10, 1–9. doi: 10.1038/s41598-020-70372-9
Subeesh M., Unnikrishnan A., Fernando V., Agarwadekar Y., Khalap S., Satelkar N., et al. (2013). Observed tidal currents on the continental shelf off the west coast of India. Continental Shelf Res. 69, 123–140. doi: 10.1016/j.csr.2013.09.008
Subeesh M., Unnikrishnan A., Francis P. (2021). Generation, propagation and dissipation of internal tides on the continental shelf and slope off the west coast of India. Continental Shelf Res. 214, 104321. doi: 10.1016/j.csr.2020.104321
Swain M. J., Ballard D. H. (1991). Color indexing. Int. J. Comput. Vision 7, 11–32. doi: 10.1007/BF00130487
Wang X., Peng S., Liu Z., Huang R. X., Qian Y.-K., Li Y. (2016). Tidal mixing in the South China Sea: An estimate based on the internal tide energetics. J. Phys. Oceanogr. 46, 107–124. doi: 10.1175/JPO-D-15-0082.1
Wyatt A. S., Leichter J. J., Toth L. T., Miyajima T., Aronson R. B., Nagata T. (2020). Heat accumulation on coral reefs mitigated by internal waves. Nat. Geosci. 13, 28–34. doi: 10.1038/s41561-019-0486-4
Zaron E. D. (2019). Baroclinic tidal sea level from exact-repeat mission altimetry. J. Phys. Oceanogr. 49, 193–210. doi: 10.1175/JPO-D-18-0127.1
Zeng Z., Brandt P., Lamb K., Greatbatch R. J., Dengler M., Claus M., et al. (2021). Three-dimensional numerical simulations of internal tides in the Angolan upwelling region. J. Geophysical Res.: Oceans 126, e2020JC016460. doi: 10.1029/2020JC016460
Zhan P., Guo D., Hoteit I. (2020). Eddy-induced transport and kinetic energy budget in the Arabian Sea. Geophysical Res. Lett. 47, e2020GL090490. doi: 10.1029/2020GL090490
Zhao Z., Alford M. H., Girton J. B., Rainville L., Simmons H. L. (2016). Global observations of open-ocean mode-1 m2 internal tides. J. Phys. Oceanogr. 46, 1657–1684. doi: 10.1175/JPO-D-15-0105.1
Keywords: Arabian Sea, internal tides, MITgcm, simulation, seasonal variability, energy
Citation: Ma J, Guo D, Zhan P and Hoteit I (2023) Variability and energy budget of the baroclinic tides in the Arabian Sea. Front. Mar. Sci. 10:1293814. doi: 10.3389/fmars.2023.1293814
Received: 13 September 2023; Accepted: 31 October 2023;
Published: 21 November 2023.
Edited by:
Kyung-Ae Park, Seoul National University, Republic of KoreaReviewed by:
Hailun He, Ministry of Natural Resources, ChinaYang Ding, Ocean University of China, China
Copyright © 2023 Ma, Guo, Zhan and Hoteit. This is an open-access article distributed under the terms of the Creative Commons Attribution License (CC BY). The use, distribution or reproduction in other forums is permitted, provided the original author(s) and the copyright owner(s) are credited and that the original publication in this journal is cited, in accordance with accepted academic practice. No use, distribution or reproduction is permitted which does not comply with these terms.
*Correspondence: Peng Zhan, emhhbnBAc3VzdGVjaC5lZHUuY24=; Ibrahim Hoteit, aWJyYWhpbS5ob3RlaXRAa2F1c3QuZWR1LnNh
 Jingyi Ma1
 Daquan Guo
 Peng Zhan
 Ibrahim Hoteit