 Sandrine Djakouré1*
 Mamadou Koné1,2
 Kouakou Urbain Koffi1,3
 Kouassi Yves Kouadio1Marcellin Adon2
 Ebenezer Nyadjro4,5Samuel Ta6
- 1Laboratory of Matter, Environmental and Solar Energy Sciences (LASMES), Ocean-Atmosphere Interaction Group, University Félix Houphouët-Boigny, Abidjan, Côte d’Ivoire
- 2Laboratory of Environmental Sciences and Techniques (LSTE), University Jean-Lorougnon Guédé, Daloa, Côte d’Ivoire
- 3Département des Sciences et Technologies, École Normale Supérieure, Abidjan, Côte d’Ivoire
- 4Northern Gulf Institute, Mississippi State University, Stennis Space Center, MS, United States
- 5National Oceanic and Atmospheric Administration (NOAA) National Centers for Environmental Information, Stennis Space Center, MS, United States
- 6Fundamental Research Unit (UFR) of Marine Sciences, University of San-Pédro, San-Pédro, Côte d’Ivoire
Marine heat waves (MHWs) can potentially alter ocean ecosystems with far-reaching ecological and socio-economic consequences. In this study, we characterize the MHWs in the eastern tropical Atlantic Ocean with a focus on the Gulf of Guinea (GG). The Optimum Interpolation Sea Surface Temperature (OISST) data from January 1991 to December 2020 and PIRATA network temperature data, from October 2019 to March 2020, have been used for this purpose. The results show that the eastern tropical Atlantic has experienced an annual average of 2 MHWs events in recent decades. Based on the spatial distribution of the different characteristics of these MHWs, we subdivided the eastern tropical Atlantic Ocean into three zones: the northern coast of the GG, the equatorial zone and the Congo-Gabon coastal region. The trend associated with MHWs events showed an increase in the number of MHWs since 2015 in the different zones. This increase was greater at the northern coast of the GG than at the equator and the Congo-Gabon coast. Long-duration MHWs are more frequent in the equatorial zone. High intensity MHWs were observed in different areas with sea surface temperature anomalies greater than 2°C. These anomalies are more intense at the Congo-Gabon coast. The results also revealed that the MHWs event at the equator from mid-October 2019 to March 2020 initially occurred in the subsurface before it appeared at the surface. These results also suggested that ocean temperatures are a potential predictor of MHW events.
1 Introduction
Marine heat waves (hereafter MHWs) are temporary periods of exceptionally high ocean temperature that can have severe and long-lasting effects on the structure and function of marine ecosystems (Hobday et al., 2016). MHWs are synoptic events. A MHW event lasts at least 5 consecutive days and is warmer than the 90th percentile of climatological observations (Hobday et al., 2016). These cases of high ocean temperature can last for days or even months and can extend for thousands of kilometers (Oliver et al., 2018). They can be characterized according to several factors, including frequency, duration and intensity. These extreme temperature events have been observed at various locations in the global ocean, regardless of the season (Hobday et al., 2018; Oliver et al., 2018; Atkinson et al., 2020). It should be noted that MHWs can be observed in both the surface and subsurface ocean (Hu et al., 2021).
MHWs are largely attributed to the influence of atmospheric and oceanic mechanisms (Schlegel et al., 2021), which directly affect temperature variations (Oliver et al., 2021). These processes include ocean advection, ocean-atmosphere interaction, vertical mixing (Di Lorenzo and Mantua, 2016; Schmeisser et al., 2019; Amaya et al., 2020), and others within the mixing layer (Holbrook et al., 2019), which can be modulated by remote influences via teleconnections (Oliver et al., 2018; Yao and Wang, 2021).
Studies on the impacts of MHWs have shown that, although they are not as dramatic as earthquakes and cyclones, they do have an influence on the marine environment, and the ecosystem changes can be enormous (Oliver, 2019).
; Wernberg et al., 2016). MHWs can lead to habitat loss (Wernberg et al., 2016), coral bleaching (Hughes et al., 2017), mass mortality of seabirds (Jones et al., 2018), and benthic invertebrates (Garrabou et al., 2009). It have also been observed harmful algal blooms (Trainer et al., 2020), reduced levels of surface chlorophyll (Bond et al., 2015), reduced surface area of cold upwelling waters (Koné et al., 2022) and loss of seagrass and kelp forests (Arias-Ortiz et al., 2018; Thomsen et al., 2019). Significant and progressive changes in the distribution of the main coastal seaweed species in northern Spain have been described by several studies (Fernández and Anadón, 2008; Müller et al., 2009; Fernández, 2011; Viejo et al., 2011; Duarte et al., 2013; Voerman et al., 2013; Fernández, 2016; Piñeiro-Corbeira et al., 2016; Casado-Amezúa et al., 2019; Des et al., 2020). According to Gómez-Gesteira et al. (2008), these changes are mainly associated with the observed increase in MHWs in this region, among other factors. The intensification of MHWs due to climate change compromises the endurance of key organisms and that of the ecosystem itself (Smale et al., 2019). The loss of these organisms has a negative environmental impact and threatens the maintenance of the valuable ecological services they provide. These biological impacts can in turn disrupt dependent human systems (Mills et al., 2013; Frölicher and Laufkötter, 2018) with changes in fishing practices and increased economic tensions between countries (Mills et al., 2013).
The Gulf of Guinea (hereafter GG) is a region of the tropical Atlantic where Sea Surface Temperature (SST) variability strongly impacts the climate of the surrounding countries. This region is the site of deep-water upwelling (Djakouré et al., 2014; Djakouré et al., 2017). These upwelled cold waters are rich in nutrients, which create conditions that are highly conducive to the development of a rich and complex food web. The GG is the most important area for Atlantic tuna fishing (Stretta, 1988; Koné et al., 2017). Studies by Koranteng and McGlade (2001); Hardman-Mountford and McGlade (2003) and Kouadio et al. (2013) on fluctuations in SST, along the north coast of the GG during the coastal upwelling season, have revealed a consistent trend towards warmer surface waters over the years. Recently, Koné et al. (2022) assessed the relationship between MHWs and the coastal upwelling on the north coast of the GG, and found that the cooling ocean surface weakened with the presence of MHWs. The increasing occurrence of MHWs and their ecological impacts (Oliver, 2019; Smale et al., 2019) highlight the relevance of characterizing these MHWs in all ocean basins.
In recent years, the detection of MHWs in various parts of the world has been widely reported (Bond et al., 2015; Caputi et al., 2016; Di Lorenzo and Mantua, 2016; Frölicher and Laufkötter, 2018; Holbrook et al., 2019). These extreme ocean temperature events in the GG that can impact biological productivity and the coastal upwelling supported by the food web have not yet been fully documented. Koné et al. (2022) have shown an increase in the frequency of these MHW events on the north coast of the GG since 2015. According to these authors, this increase in the frequency of MHWs is consistent with the ocean warming observed and the reduction in the cooling surface in this area. Similarly, oceanic and atmospheric surface conditions along the north coast of the GG are modified before, during and after MHW events (Koné et al., 2022).
The aim of this study is to provide a more detailed analysis of the spatio-temporal evolution of the characteristics of MHWs in the eastern tropical Atlantic from 1991 to 2020. With this in mind, the remainder of the paper is organized as follows. The datasets and methods used in this study are briefly presented in Section 2. Section 3 presents the statistical characteristics of MHWs in the eastern tropical Atlantic and in areas within the GG, together with an analysis of subsurface warming at the equator. Finally, a discussion and summary are presented in section 4.
2 Data and methods
2.1 Study area
The study is conducted in the tropical Atlantic Ocean and the GG, which is part of the eastern basin (Figure 1). The GG is bounded to the east by the African continent and to the west at about 10°W. It is an area of strong SST variability caused by the various upwellings (i.e., equatorial and coastal). The large-scale ocean circulation is composed of surface and subsurface currents. These are the Guinea Current (GC), the Northern South Equatorial Current, the Equatorial branch South Equatorial Current, the Southern South Equatorial Current, the Equatorial Undercurrent and the Guinea Undercurrent (Figure 1).
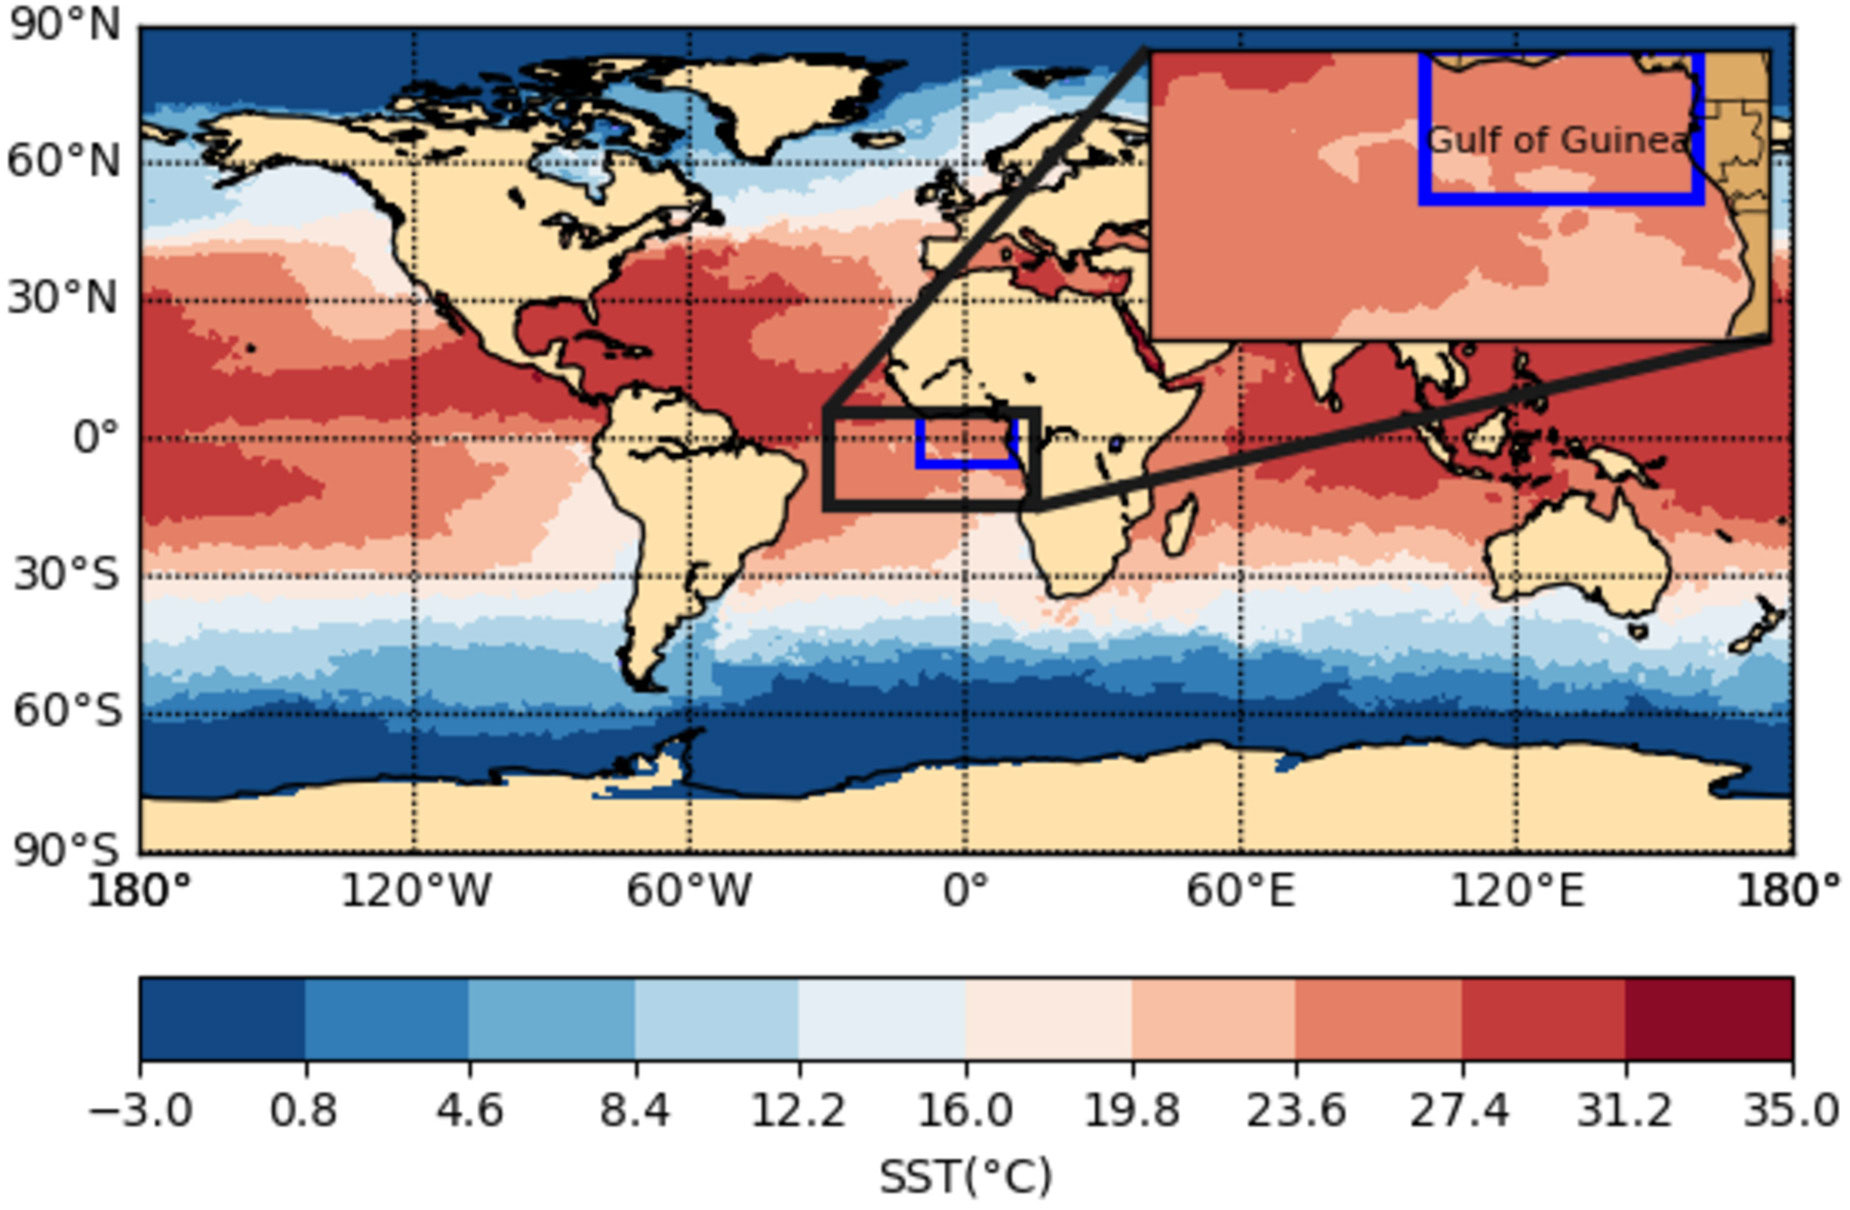
Figure 1 Sea surface temperature from OISST (https://www.psl.noaa.gov/data/gridded/data.noaa.oisst.v2.highres.html, August, 11th, 2020) for the study area (Gulf of Guinea in blue box and the eastern tropical Atlantic Ocean in black box).
2.2 Data
In order to detect and characterize MHWs, we use the National Oceanic and Atmospheric Administration’s (NOAA) sea surface temperature (SST) product, developed using optimal interpolation (NOAA-OISST, Reynolds et al., 2007) accessible from the web page (https://stateoftheocean.osmc.noaa.gov/sur/ind/dmi.php). NOAA-OISST is a global, daily, high-resolution (0.25°) gridded product. This data has a complete global grid of 1440 rows x 720 columns, or 1,036,800 grid cells. The ocean temperature included in this product represents the upper 0.5 m of the ocean, obtained by regressing the satellite measurement of the ocean skin layer against quality-controlled buoy data. We analyze this product between January 1991 and December 2020. The NOAA-OISST gridded product has been widely used in the studies of MHWs (e.g., Hobday et al., 2016; Oliver et al., 2018; Smale et al., 2019; Holbrook et al., 2019).
In addition, we use daily in situ temperature fields from the enhanced prediction and research buoy network (0°W, 0°N; buoy) in the tropical Atlantic (PIRATA, Foltz et al., 2019), which are available from September 1997 to August 2020 accessible from the web page (http://www.pmel.noaa.gov/gtmba/pmel-theme/atlantic-ocean-pirata). These data are derived from buoy measurements from the PIRATA program (Servain et al., 1998; Bourlès et al., 2008; Bourlès et al., 2019), which have passed quality control and do not require bias correction. Subsurface temperature fields are interpolated on a uniform 5 m vertical grid. Details on gap-filling procedures, error estimates and instrument bias corrections can be found in Foltz et al. (2019). The buoy measurements are analyzed from October 2019 to March 2020.
2.3 Methods
Several techniques are used to define and calculate MHWs, including the use of fixed, relative or seasonally varying thresholds. Each of these techniques has its advantages and disadvantages (Mohamed et al., 2022). In this paper, we characterized MHWs according to the criteria of Hobday et al. (2016). These latter criteria are the most widely used approach using a moving threshold. These criteria stipulate that an MHW (i) must last at least 5 consecutive days, (ii) must be warmer than the 90th percentile of climatological observations and (iii) must be based, at least, on a 30-year historical reference period.
We used the NOAA-OISST data to create an annual climatological mean. To calculate the climatological value at each grid cell, we calculated an average temperature taking into account the temperature at that grid cell in an 11-day window centered on the desired day for all years of data. For example, the climatological value for a given grid cell on January 15th is calculated by averaging the temperature values between January 10th and 20th for all years (i.e. 1991-2020). We repeat this process for each day of the year. We then calculated the 90th percentiles in the study region to determine the presence or absence of MHW conditions. To calculate the 90th percentile at each grid cell, we also considered all the temperature data for a given grid cell in an 11-day window for all years, as in the climatology calculation. If the temperature at a given location exceeds the 90th percentile for five consecutive days, we have a MHW event. Each MHW event is described by a set of metrics (Hobday et al., 2016; Hobday et al., 2018) which are: average MHW duration (average number of sequential days when the SST exceeds the 90th percentile), MHW frequency (number of MHW events per year), mean intensity (mean of the difference between temperature during the MHW event and the 90th percentile threshold [imean, °C]), and cumulative intensity (sum of daily temperature intensity anomalies [icumul, °C days]). Two consecutive MHWs events with an interval of 2 days or less are considered as a single event.
To provide a better understanding of heat stress in the GG, a categorization of MHWs according to Hobday et al. (2016) is made. This categorization is based on determining the number of times the MHW anomaly exceeds the difference between MHW climatology and the 90th percentile threshold. A weakly positive anomaly will be reported as a Category I or Moderate event while a category II or Strong event corresponds to an anomaly 2 times greater than the above-mentioned difference. Likewise, a category III or Severe event corresponds to an anomaly 3 times greater than the difference and a category IV or Extreme event corresponds to an anomaly 4 times greater than the difference. Authors such as Martìnez et al. (2023) suppressed the SST trend before applying the Hobday method for detecting MHWs. They consider that this suppression made it possible to use a fixed climatology without overestimating the properties of MHWs over time. This is not consistent with the results of Oliver (2019), which show an increase in MHWs over the coming decades. Thus trend suppression could lead to the detection of certain low MHWs. Taking into account the limited study of these events in this area, we considered it appropriate to use original detection (i.e., use of SST with trend) in order to take into account all the MHWs likely to have occurred.
Finally, temperature anomalies are calculated from temperature data from the PIRATA network (http://www.pmel.noaa.gov/gtmba/pmel-theme/atlantic-ocean-pirata) at the 0°W-0°N buoy for each day. These temperature anomalies represent the difference between the values of its subsurface temperature by the climatology of that day. These subsurface data were used to analyze changes in subsurface temperature during the MHW event that had longer duration.
As regards the division of our study area, we took into account the average frequency, average duration and average intensity in order to divide our study area into three zones. The trends in MHW frequency, MHW duration, intensity and cumulative MHW intensity were estimated at 95% significance using the Poisson method (Gelman, 2007).
3 Results
3.1 Climatology of MHWs metrics
Figure 2 illustrates the mean annual frequency (Figure 2A), mean annual duration (Figure 2B) and mean annual intensity (Figure 2C) of MHWs events in the tropical Atlantic Ocean. These metrics have been calculated over the period January 1991 to December 2020.
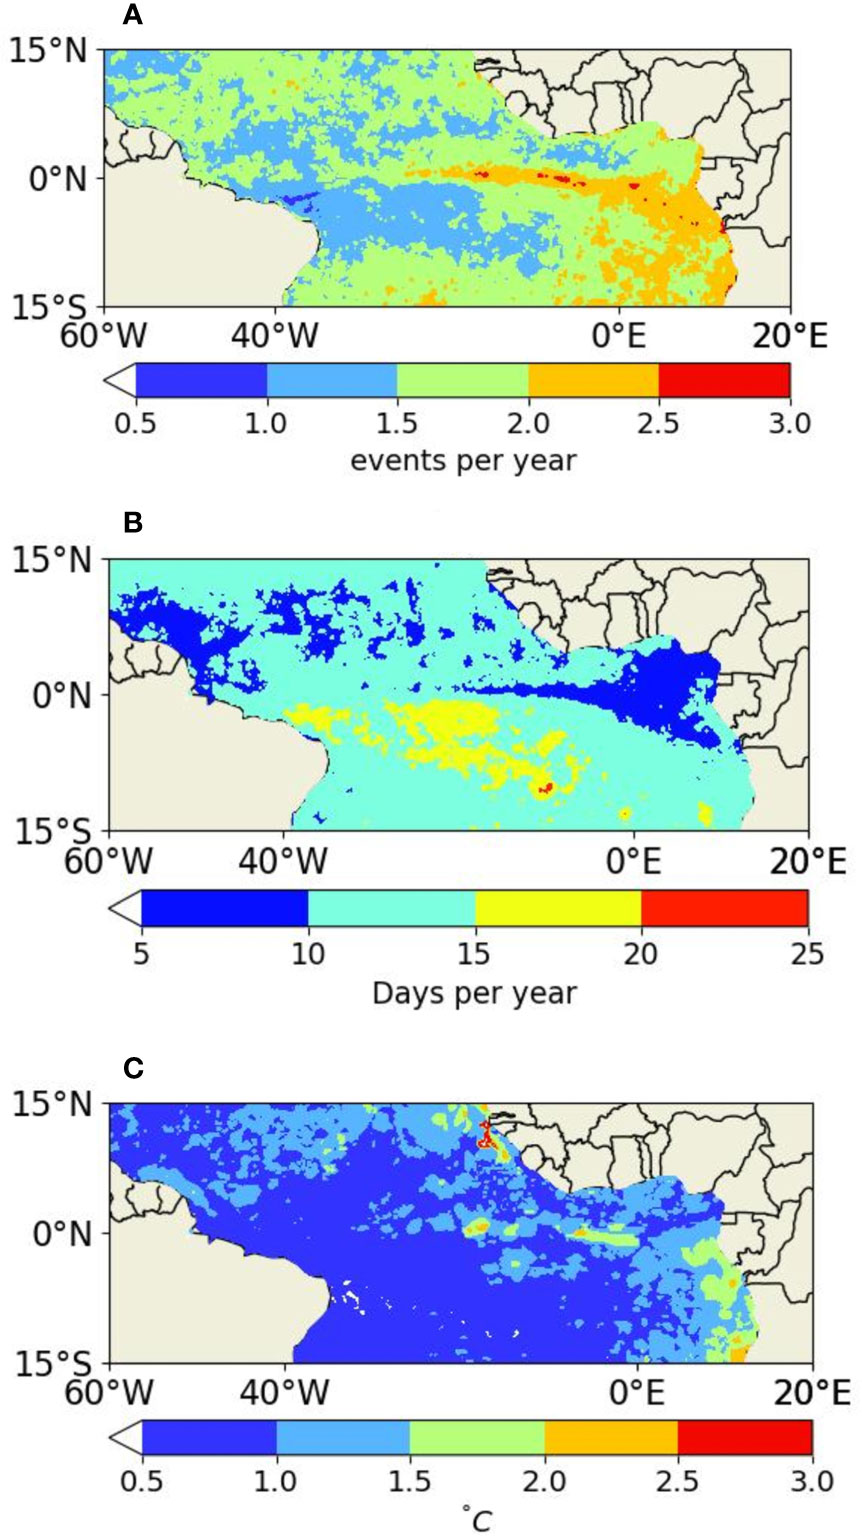
Figure 2 Annual mean spatial variation in MHWs characteristics in the tropical Atlantic Ocean from 1991-2020. The panels shown are (A) the annual number of occurrences of MHWs, (B) the mean annual duration of MHWs in days and (C) the mean annual intensity in °C.
The tropical Atlantic Ocean exhibits high spatial variability in all these MHWs characteristics. The spatial pattern of the climatological mean frequency allows us to assess the total variability of the frequency of MHWs over the 30 years period. It shows that the tropical Atlantic Ocean is dominated by an average frequency of 1.5 to 2 events per year. MHWs occur more frequently (>2) in the equatorial zone, the region between Congo and Angola, and from 0°E to the African coast (Figure 2A).
The mean annual duration of MWHs shows that the mean annual duration of MHWs is between five and twenty-five days (Figure 2B). Five days corresponds to the minimum duration of an MHW event according to the definition. Events lasting between this threshold and 10 days typically occur in the eastern and northwestern equatorial Atlantic. MHWs in the eastern tropical Atlantic are dominated by 10- to 15-day events. MHWs events lasting more than 15 days typically occur south of the equator between 10°S and 0°S. Likewise, events lasting 20 to 25 days occur south of the equator.
Finally, the average intensity (Figure 2C) varies between 0.5°C and 3°C. These intensities show that MHWs events in the study area are moderate events (2°C > imax > 1°C) and strong events (3°C > imax > 2°C). The most intense MHWs are observed in the regions close to the African coast, with the maximum value in the North Atlantic, south of Senegal. Other strong events were also observed along the Gabonese and Angolan coasts and at the equator.
To find out whether the main characteristics of the MHWs change according to SST variability of the study area, we divided the eastern topical Atlantic Ocean into three zones (Figure 3). Zone I, Zone II, and Zone III, representing areas (i) of high SST seasonal variability and (ii) where MHWs events have been observed (Figure 2A). These zones correspond respectively to the coastal upwelling region north of the GG (10°W-10 °E, 2N°- 5°N), the equatorial upwelling region (30°W-12 °E, 5S°- 2°N) and the Congo-Gabon coastal upwelling area (0°E-15 °E,15S°- 5°S).
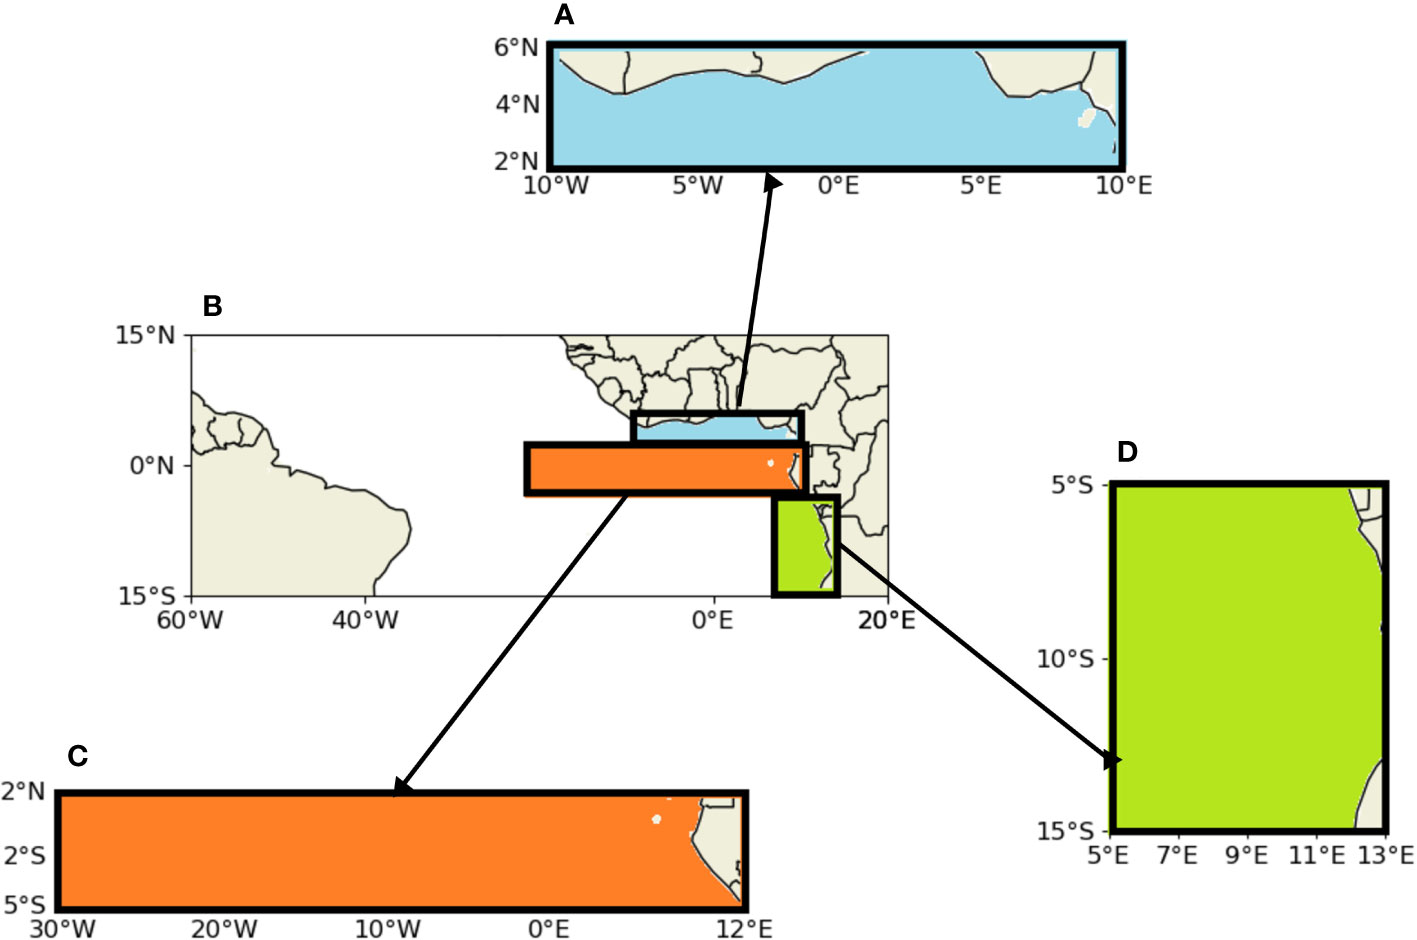
Figure 3 Subdivision of the study area (B): Zone I in blue (north coast of the GG) (A), Zone II in orange (equatorial band) (C) and Zone III in green (Congo-Gabon coast) (D). This subdivision is made on the basis of an analysis of the different characteristics of MHWs (frequency, duration and intensity), as well as an analysis of the eofs showing strong variability in the cooling surface in these different zones.
3.2 Characteristics of MHWs in different zones of the eastern tropical Atlantic Ocean
3.2.1 Frequency of MHWs
After dividing the study area into three zones, motivated by the various factors defined above, we analyzed the various characteristics (i.e., duration, frequency, average intensity, and cumulative intensity) of MHWs in the three zones.
The frequencies of MHW occurrence per year in the different zones are illustrated in Figure 4. The spatial representation of the frequency in Zone I (Figure 4A) over the 30 year period shows that the average frequency of occurrence of MHWs in the north of the GG varies from 1 to 2.25 events per year. In this zone, MHWs are more frequent in the eastern part and along the coast than in the west. The temporal distribution of these MHWs (Figure 4D) shows that the first MHWs events during the study period appeared in 1998 with a frequency of at most two events per year until 2005. From 2006 onwards, there was an increase in this frequency, especially during the most recent years, with maximum values of eight events in 2018 and 2019, giving a total of sixty-four (64) events identified in Zone I during 1991 to 2020. The increase in the frequency of MHWs in Zone I is associated with a significant upward trend of 2.1 events per year.
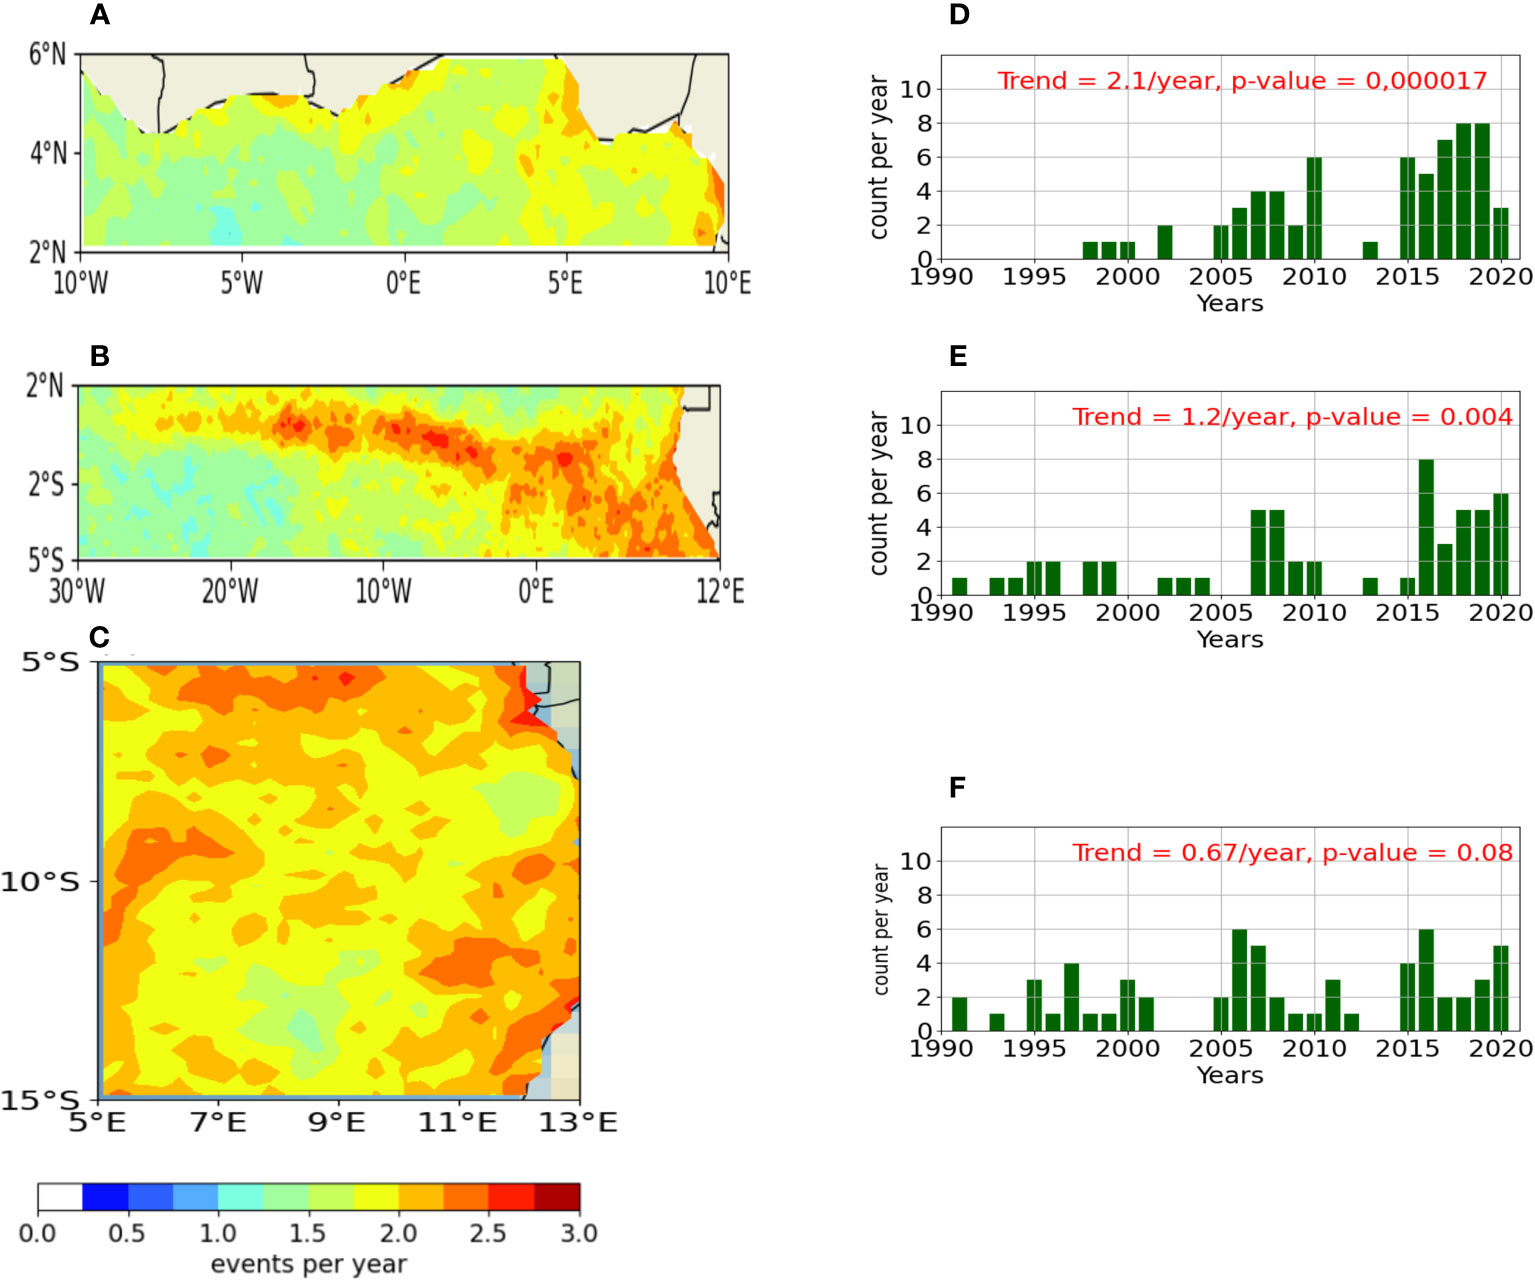
Figure 4 Spatial representations (maps) of mean annual frequency, defined as the mean number of occurrences of MHWs per year, and the associated time series (diagrams). The statistics for this frequency in Zone I are shown in panels (A, D), Zone II in panels (B, E) and Zone III in panels (C, F) for 1991-2020.
According to the spatial evolution of the frequency of MHWs (Figure 4B), MHWs are more frequent along the equator between 2°S and 2°N and along the east coast in zone II. MHWs events are observed from one to 2.75 times per year. MHWs have been occurring in Zone II, since 1991 but with a low frequency during the period 1991-2006, when they occurred around one or two times a year (Figure 4E). From 2007 onwards, an increase in frequency was observed, reaching eight (8) events in 2016. One can note a total of fifty-seven (57) events evolving according to a trend of 1.2 events per year. This trend is statistically significant at 95% using Student’s t-test.
Spatial evolution of the frequency of MHWs (Figure 4C) shows that the frequency of MHWs in Zone III varies on average between 1 and 2.5 events per year. A large part of this zone experiences at least 2 events per year on average and, as in the other two zones, MHWs are more frequent at the coast. Their temporal representation (Figure 4F) shows the existence of these events since 1991. Their frequencies are up to 4 events in 1997, during the period 1991-2006. From 2007 onwards, an increase in frequency was observed. A maximum frequency of 6 events is noted in 2007 and 2016. Herewith, a total of 61 events are recorded in Zone III, with a non-significant trend of 0.67 events per year.
Zone I is the zone with the most MHWs events in 30 years, i.e. from 1991 to 2020. This increase has an upward trend of 2.1 events on average per year, which is around twice the trend in the frequency of MHWs in Zone III.
3.2.2 Duration of MHWs
The spatial and temporal variations in duration associated with the MHWs events are illustrated in Figure 5. These durations are the number of days between the start and end dates of a MHWs event. According to the spatial variation, MHWs in Zone I last on average between 5 and 12.5 days per year (Figure 5A). Those of longer duration are located in the western part, in contrast to the spatial variation of higher frequency of occurrence in this zone. This suggests that MHWs of longer duration are less frequent than those of shorter duration in Zone I. Their temporal variation (Figure 5D) ranges from 6 to 33 days on average. The maximum duration of 33 days was observed in 1999, one year after the first appearance of MHWs over the period 1991 to 2020. A decrease is then observed from 2000 with a warming lasting between 6 and 12 days on average until 2015 when an increase is observed. This increase has a statistically insignificant trend of 1.7 days per year (p-value>0.05). One can note that according to Student’s t-test, the trend is only significant for p-values <0.05.
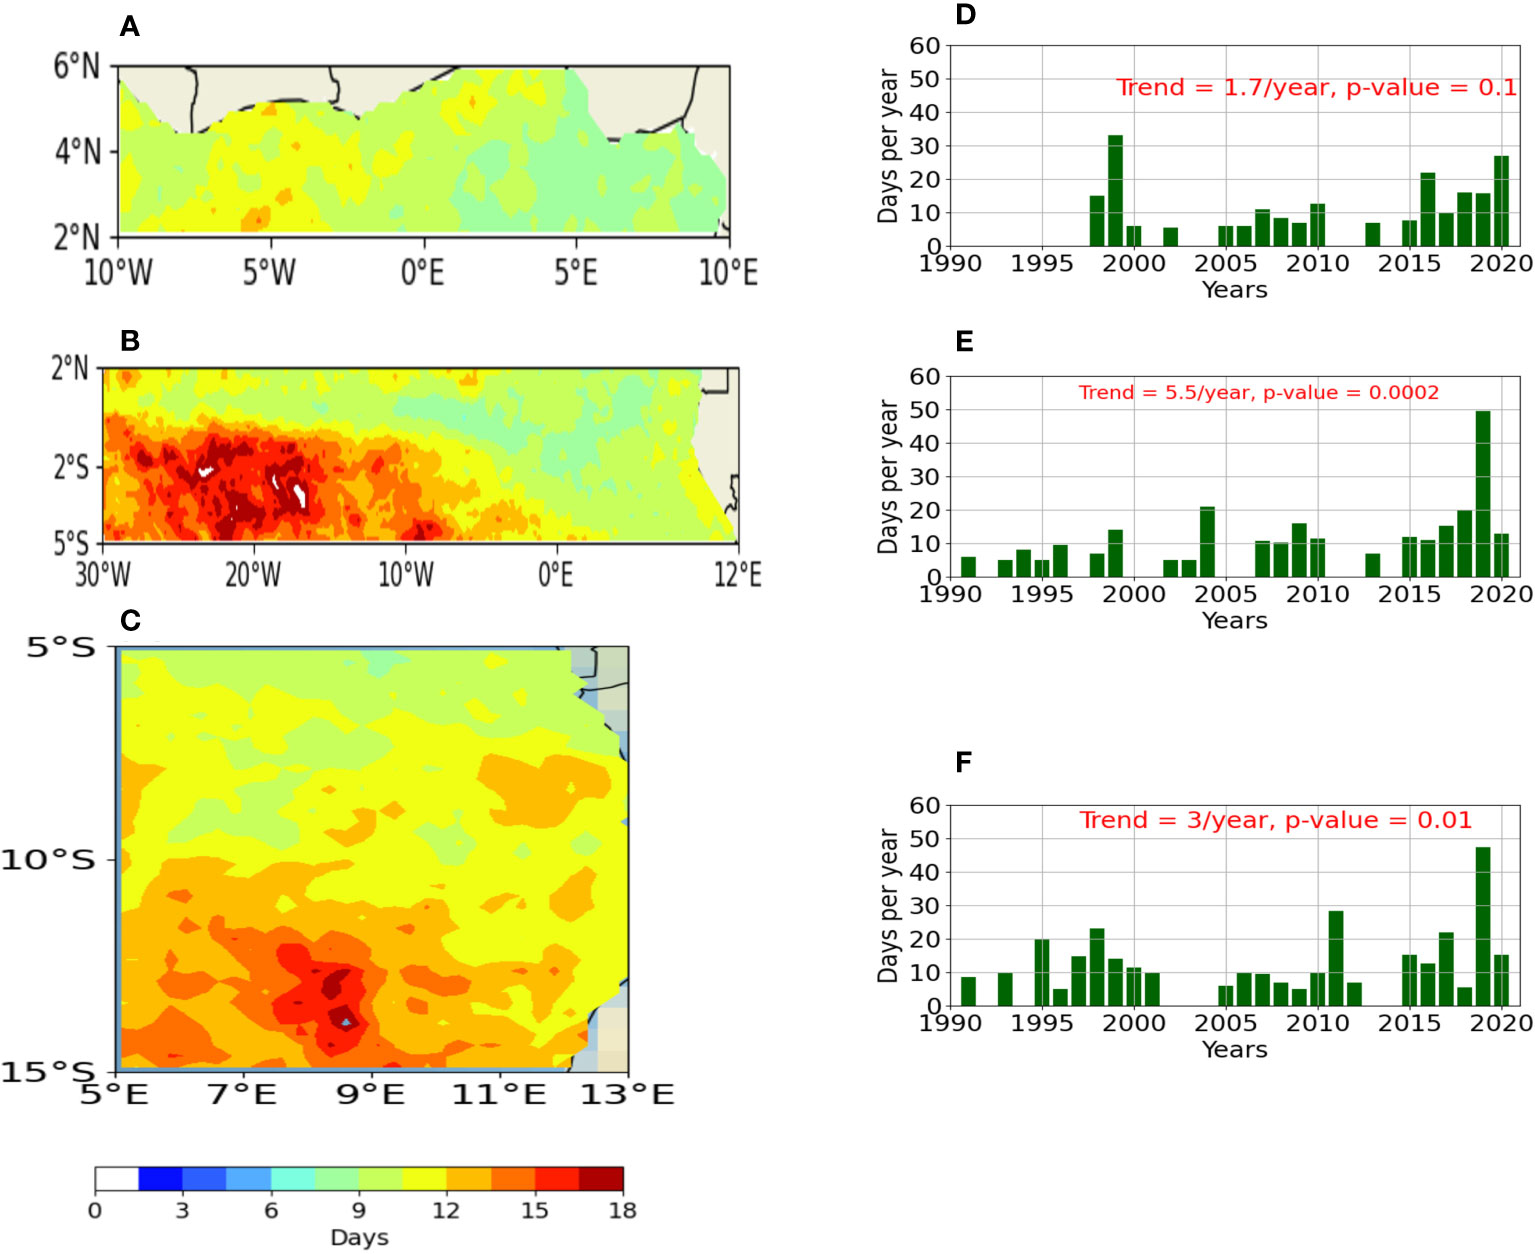
Figure 5 Annual mean spatial distributions (maps) and annual mean time series (diagrams) of the duration of MHWs, which corresponds to the average number of days per year separating the start and end of MHWs in Zone I panels (A, D), Zone II (panels B, E) and Zone III (panels C, F) from 1991-2020.
In the equatorial region (Zone II), long-lasting MHWs are observed in the south-western part of this region. A maximum duration of 18 days on average per year is noted (Figure 5B). Like Zone I, these long-duration MHWs are in the band where MHWs are less frequent. The time trend (Figure 5E) shows that MHWs lasted an average of 5 to 15 days between 1991 and 2003. From 2004 onwards, they increased in duration, reaching 49 days in 2019. This corresponds to the maximum duration of MHWs in Zone II over the study period. This sharp increase in the duration of MHWs follows a significant trend of 5.5 days per year.
In Zone III, the annual spatial trend shows that MHWs vary on average between 6 and 16.5 days per year (Figure 5C). The long-duration events are found in the southern part of the zone where it coincides with some areas of high frequency of MHW occurrence. As regards temporal evolution (Figure 5F), MHWs lasted between 5 and 24 days during the period 1991 to 2001. From 2002 to 2009, this duration reduced. From 2010 onwards the duration increased, reaching its maximum value of 47 days in 2019. The trend (pvalue=0.01) associated with this change in MHWs duration is 3 days per year.
Overall, Zone II is the zone where MHWs have evolved the most in terms of duration, with a trend three times greater than in Zone I. The year 2019 was the year in which MHWs events of the longest duration were observed in both Zones II and III.
3.2.3 Intensity of MHWs
The spatial and temporal variations of MHW intensity for the three different zones are shown in Figure 6. The cumulative intensity, which is the sum of the MHW intensities per year, is superimposed on the temporal plot (i.e., Figure 6 right panel).
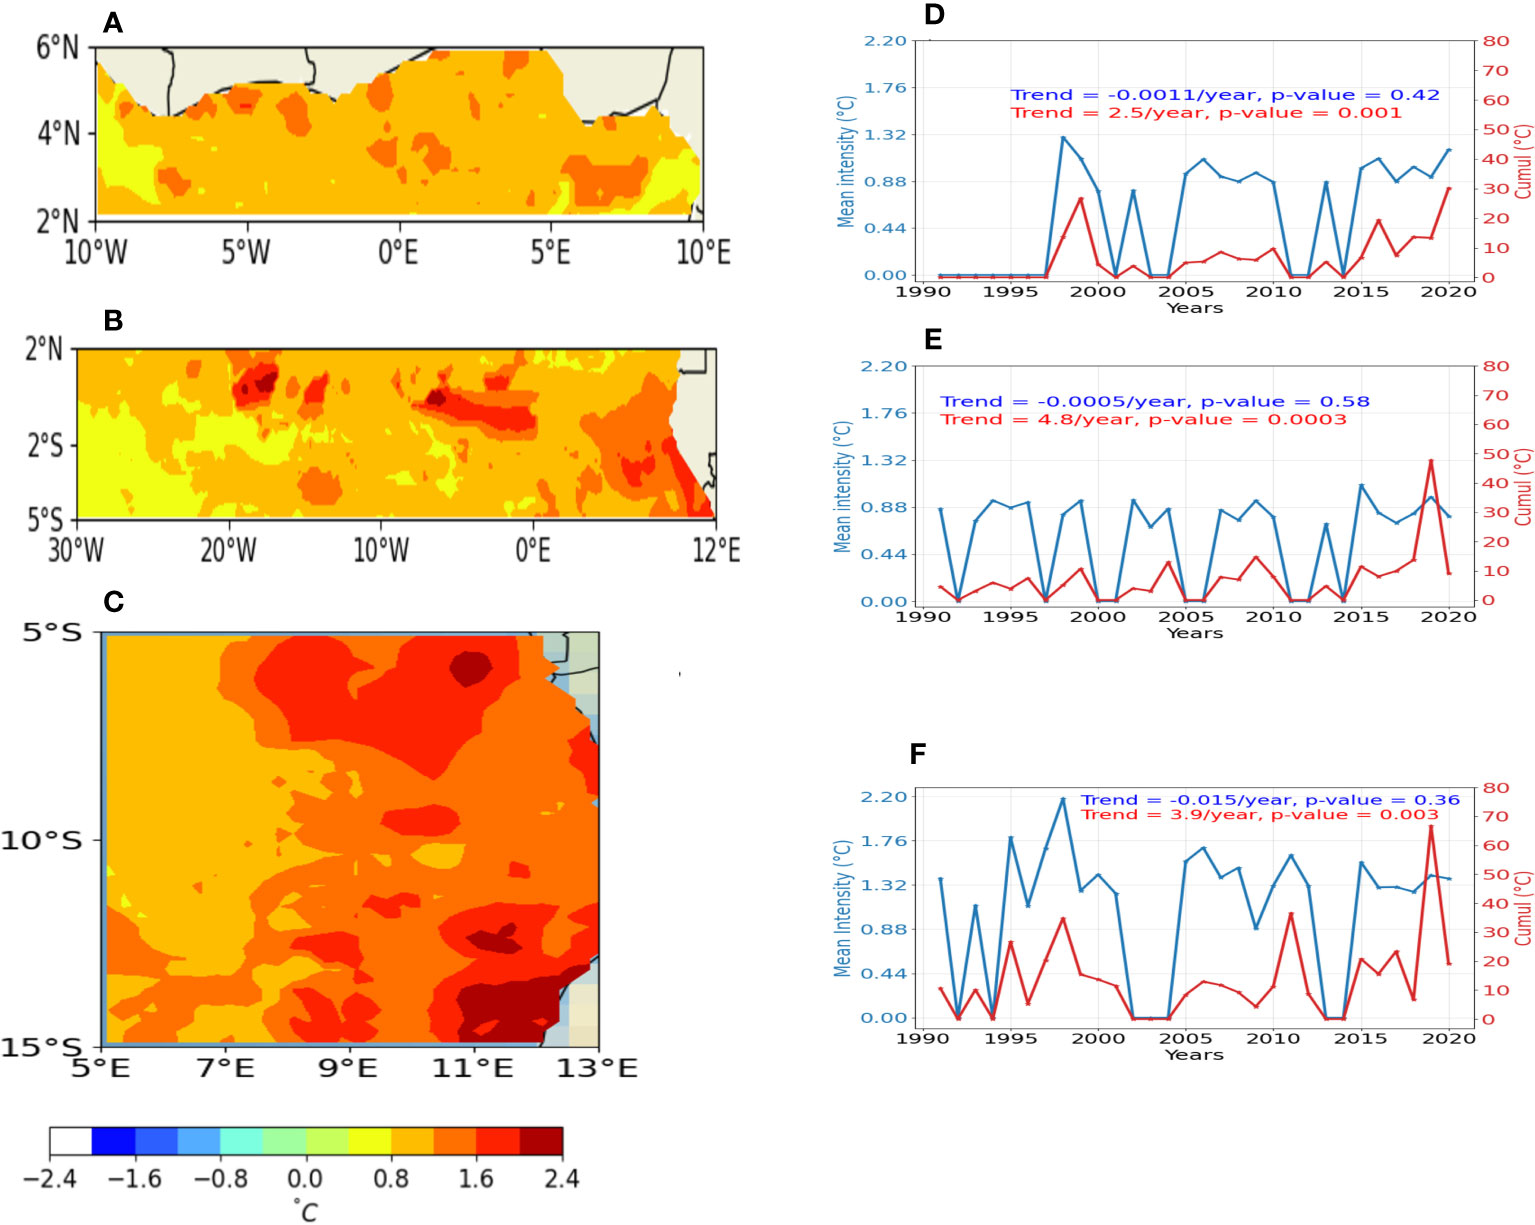
Figure 6 Spatial distributions of mean annual intensities (maps) and time series of mean annual intensities (blue curve) and cumulative annual intensity (red curve) of MHWs (°C) in Zone I (panels A, D), Zone II (panels B, E) and Zone III (panels C, F) from 1991-2020.
The mean annual intensity in Zone I varies between 0.4 and 1.3°C (Figure 6A). The temporal evolution of this average intensity indicates that the maximum value was observed in 1998, the year of the first MHW observed in this zone. The minimum value is found in 2002 (Figure 6D). The cumulative annual intensity varies between 4.8°C in 2002 and 30°C in 2020. The mean annual intensity and cumulative annual intensity follow respectively trends of -0.0011°C per year, which is not significant and 2.5°C per year, which is significant.
In Zone II, the spatial variation shows that the mean annual intensity varies between 0.77 and 2.4°C (Figure 6B). High intensity of MHWs is frequent in Zone II and can reach 2.4°C. The temporal variation of the mean annual intensity and the year-to-date gives the maximum intensity (1.1°C) in 2015 and the minimum (0.77°C) in 2013 (Figure 6E). The cumulative annual intensity associated with the MHWs varies between 4 and 48°C, with the maximum cumulative value observed in 2019. The trend associated with the mean intensity in this zone is non-significant and negative (-.0005°C). In contrast to this trend, the cumulative trend shows an increase of 4.8°C with a p-value<0.05.
The spatial evolution of MHWs in Zone III (Figure 6C) shows that the most intense MHWs are located in the eastern part of the region near the coast, with a mean annual variation of between 0.8 and 2.2°C. The most intense MHWs are frequent in Zone III. The temporal variation of the mean annual intensity shows that the maximum value of 2.2°C is obtained in 1998. The minimum value of 1.15°C is found in 1994 (Figure 6F). The cumulative annual intensity varies between 2 and 68°C, with its highest value in 2019. The mean annual intensity and the cumulative annual intensity follow respective trends of -0.015°C per year, which is not significant, and 3.9°C, which is significant.
3.3 The most important MHWs events in terms of intensity
The MHWs events with the maximum intensities for the three zones are analyzed in this section. The days with SST anomalies greater than 2°C in Zones I and III and 1.5°C in Zone II have been identified. They will be referred to as events. There are 2 stronger events in Zone I, 2 in Zone II and 3 in Zone III.
Figure 7 shows the evolution of these MHWs events described above. In the eastern part of GG (Zone 1), a strong event occurred on June 11th, 2006 (Figure 7A). The rise in SST anomaly is up to about 2.2°C. SST anomalies with values ranging between 0.2 and 0.5°C have been observed in the eastern part of GG. This MHW event occurred during the transition season for the coastal upwelling of the northern GG (defined as June-July). This transition season is characterized by a gradual decrease in SST to the north of the GG. On February 26th, 2020, a second event (Figure 7B) is observed with a maximum anomaly greater than 2°C. This second strong event occurred during the minor cold season (defined as January-March). This season is characterized by minimal seasonal variation in SST. The periods during which these two events occurred correspond to periods when the SST varies more or less to the north of the GG.
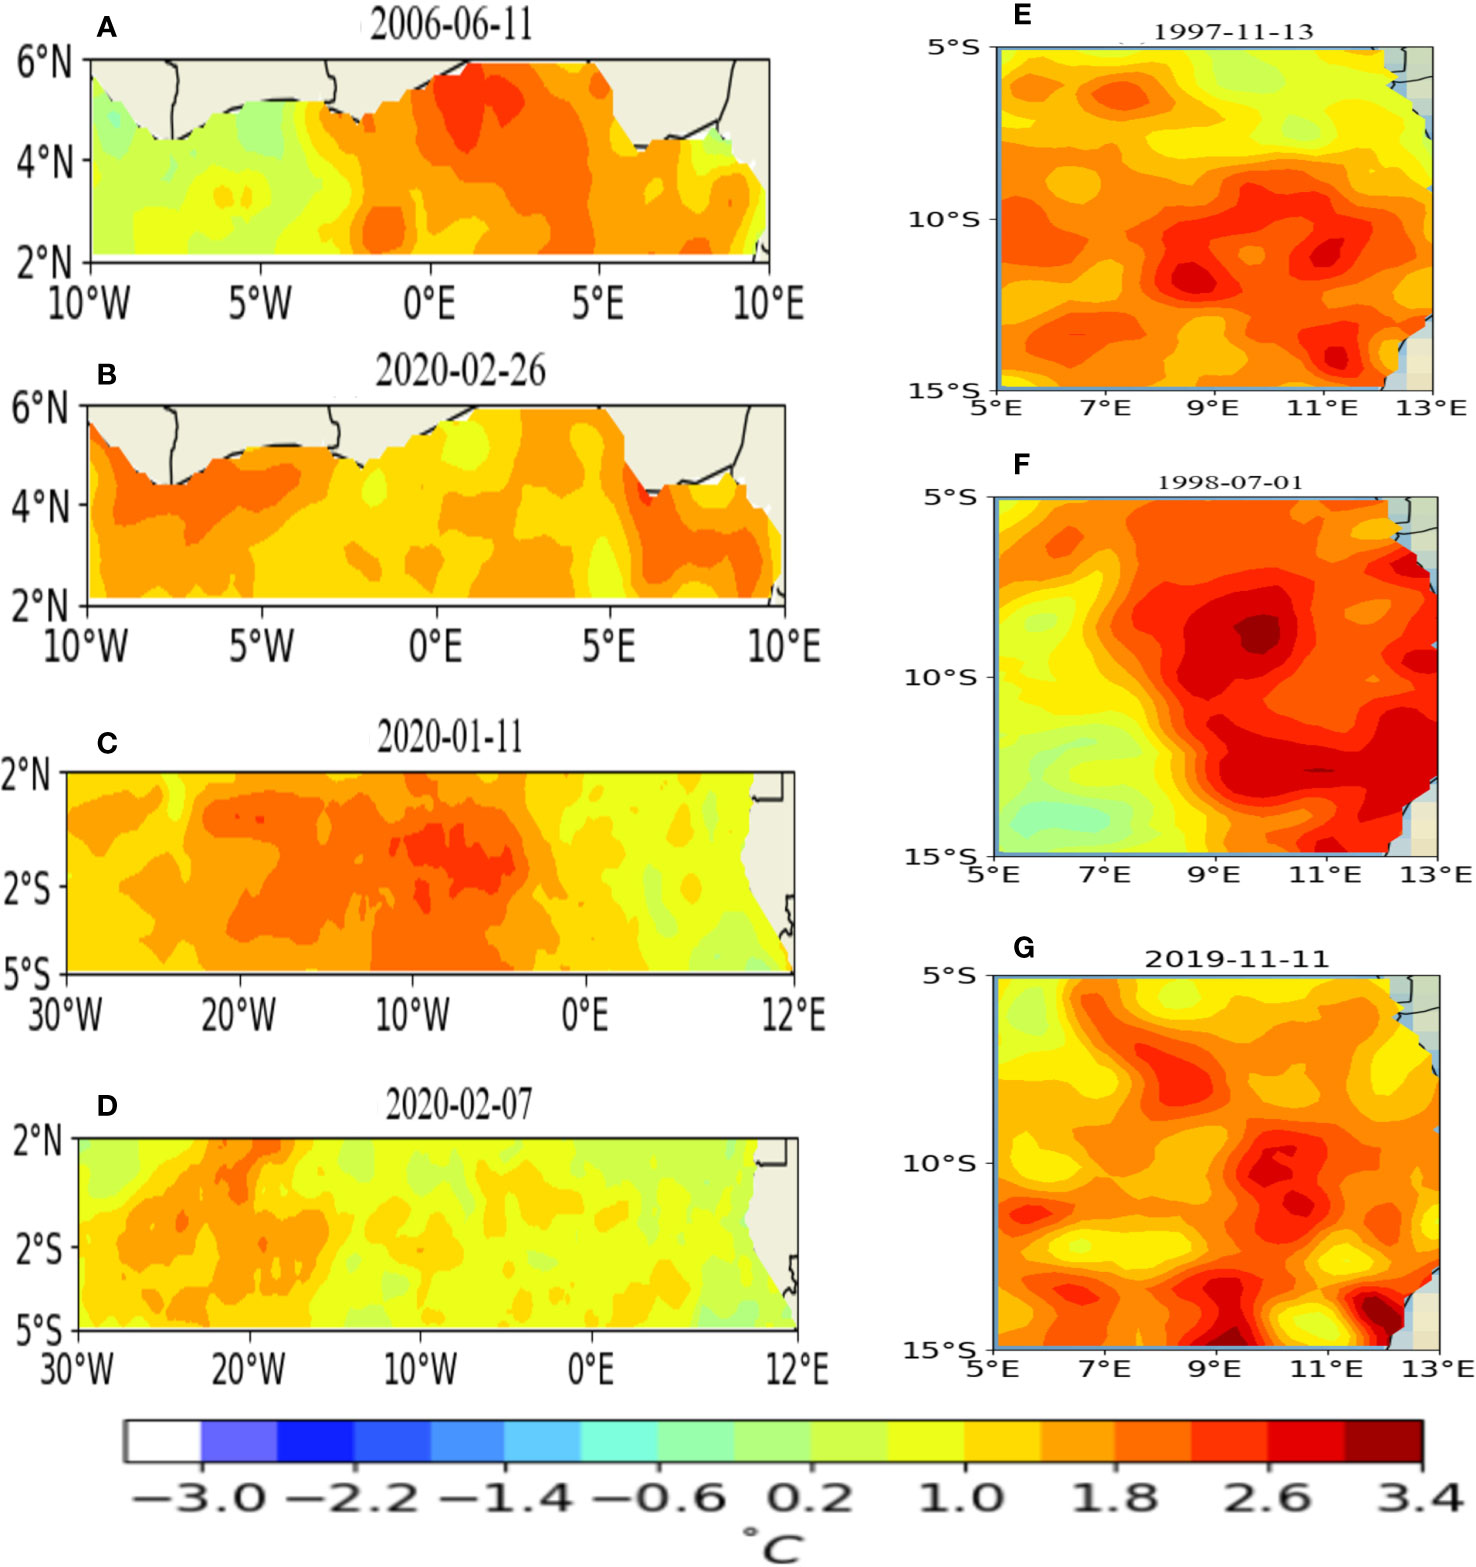
Figure 7 Spatial representations of SST anomaly (°C) of a few days of high intensity MHWs detected in the different zones. Zone I, panels (A, B) show the events of 11 June 2006 and 26 February 2020. Zone II, panels (C, D) show the events of 11 January 2020 and 07 February 202. Zone III, panels (E–G) show the events of 13 November 1997, 01 July 1998 and 11 November 2019 respectively.
In the equatorial zone (Figures 7C, D), 2 strong events were detected. The first one is on January 11th, 2020 and located between 21°W-2°W. This large part of abnormally warm area recorded a maximum SST anomaly values up to 1.8°C. The second event observed on February 7th, 2020 is located in the 30°W-15°W longitudinal band. This latter event occurred 27 days after the first one. It stretched over a smaller area and recorded lower maximum SST anomaly values than the first event. These 2 most intense events occurred outside the equatorial upwelling season.
The strong event in Zone III is reported on November 13th, 1997 (Figure 7E). This warming stretched over a large area with SST anomalies varying between 0.2°C and 3.6°C. This strong MHW event has the greatest impact on the area south of 7°S. Another intense event occurred on July 1st, 1998 (Figure 7F). This strong event, with maximum SST anomalies of ~3.6°C, resulted in significant SST increases in the eastern part of this zone. High anomalies of SST (up to 2.6°C), are found over more than 60% of this area. On November 11th, 2019, a significant rise in SST is observed in almost all regions of this zone (Figure 7G). The maximum values of SST anomalies (~3.6°C) associated with this event is located at ~9°S-10°E. These zones of high intensity shown in Figure 7 are in agreement with the results of section 3.2.c (see Figures 6A-C).
3.4 Subsurface warming and categorization of MHWs in the GG
In this section, we analyze the temporal evolution of the longest-lasting (Figure 8A) and most extreme MHWs event in the equatorial zone (Zone II). The climatology of SST, the 90th percentile and SST are represented respectively in dashed black curve, the green curve and black solid curve. The part in red represents the MHWs event. This event started on 15th October 2019 and lasted until 13th March 2020. Low intensities are observed during the period from 15th October to 30th October, and from 1st November until the end of the event. High intensities are observed, although these fluctuate to a greater or lesser extent.
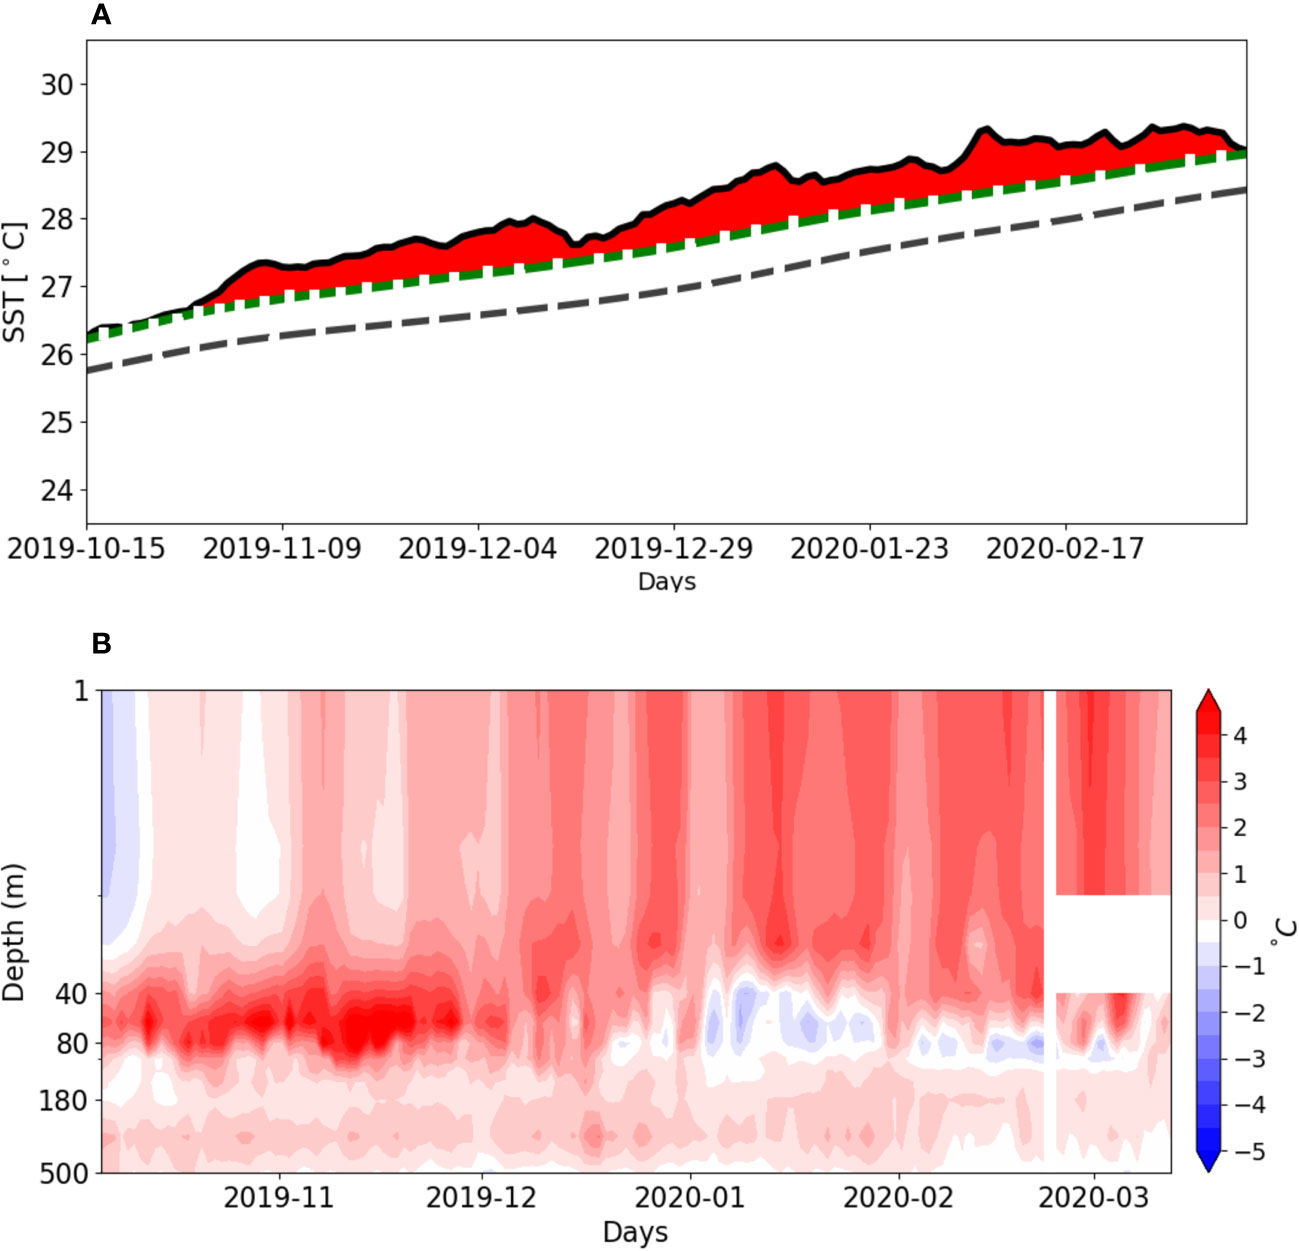
Figure 8 (A) Time series of SST (solid black curve), the 90th percentile (dashed green curve) and the climatology of SST (dashed black curve); The red part between the curve of the SST and that of the 90th percentile. (B) Hovmöller diagram of the temperature anomaly between 0 and 500 meters depth from at 0°W-0°N (PIRATA network) during the MHWs event detected from October 2019 to March 2020.
The Hovmöller diagram (Figure 8B) represents the temperature anomalies during the same MHWs event, from 15th October 2019 to 13th March 2020. This ocean temperature anomaly is calculated at the equator, with data derived from the PIRATA buoy (0°W-0°N). The temperature anomalies are positive in the subsurface (around a depth of 40 meters) before 15th October (i.e. before the start of the surface event). From 15th October onwards, these positive anomalies are observed at the surface with low values of <0.5°C. The highest values (>2°C) are located in the subsurface between 40 and 80 meters. From November onwards, between 40 and 80 meters depth, a slight cooling is observed until the end of the event.
Over the last 30 years, the MHW events detected in the various zones fall into two categories: category I and category II (Figure 9). The breakdown of these two categories shows that only 9%, 4% and 10% of the MHWs detected in Zones I, II and III respectively are from category II. The trend in the severity of MHWs is virtually the same in Zones I and II, which are also the zones with the highest number of MHW events.
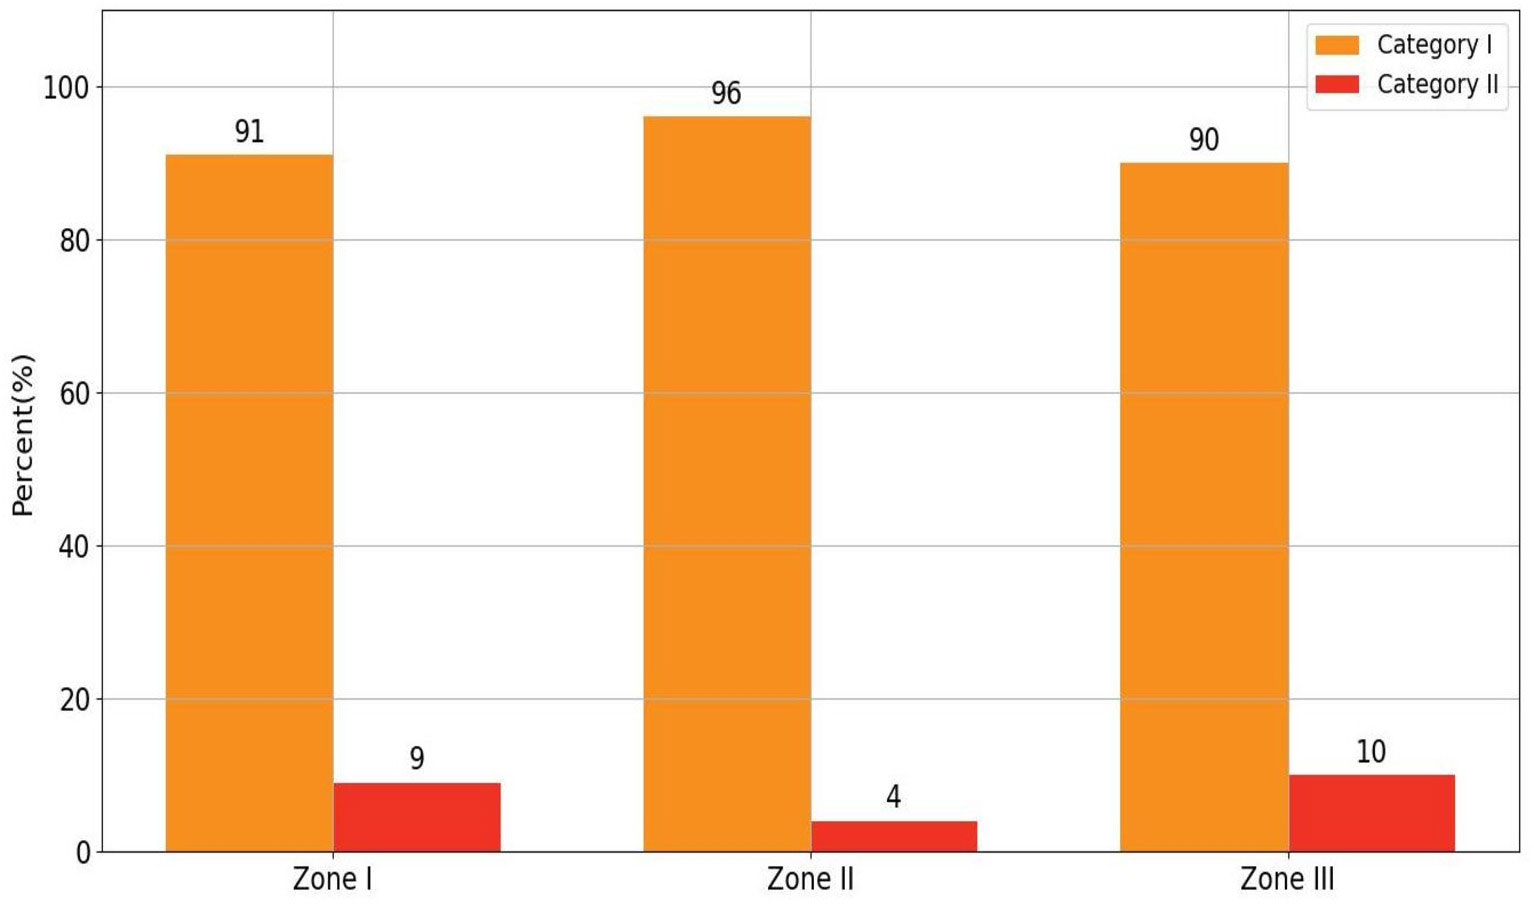
Figure 9 The distribution of MHWs categories in the different zones. This distribution is determined on the basis of multiples of the distance separating the climatology of SST from the 90th percentile threshold. The diagrams in yellow represent the percentage in category I and those in red represent the percentage in category II.
4 Discussion and conclusion
MHWs in the eastern tropical Atlantic Ocean are characterized using temperature data from OISST, from January 1991 to December 2020 and the PIRATA datasets, from October 2019 to March 2020. This eastern tropical Atlantic region is home to MHWs events in recent decades. Based on the spatial distribution of the different characteristics of these MHWs, the study area has been subdivided into three zones. The first zone is the northern coast of the GG, the second is the equatorial zone and the third is the Congo-Gabon coastal area.
Studies by (Oliver et al., 2018; Oliver, 2019) on characteristics such as the duration, intensity and frequency of MHWs using a range of climate models have shown an increase in these different characteristics. Anthropogenic warming would be one of the major causes of this long-term increase in MHWs (Oliver, 2019; Marin et al., 2021). This is in good agreement with our results highlighting high spatial and temporal variability in all features in the eastern tropical Atlantic Ocean.
First of all, spatial and temporal distributions of annual mean features of MHWs were analyzed. The results showed that the frequency of MHWs in the GG varied from about 2.1, 1.2 and 0.6 events per year respectively from Zone 1 to Zone 3. The higher frequencies are found at the GG north coast (> 2 events, Figure 4D) and the lower frequencies at the Congo-Gabon coast (Figure 4F).
This zone-dependent rate of occurrence of MHWs can be explained by the ocean conditions in these regions. The increased frequency of MHWs at the northern GG coast suggests that the oceanic heat introduced into this area is lost rapidly or indicates a residence time of water mass. In other regions, rapid changes in air-sea exchange lead to the rapid onset of MHWs (Bond et al., 2015; Jacox et al., 2019; Salinger et al., 2019).
The total number of days of MHWs events also varied significantly up to 49 days (Figure 5F). Long-duration MHWs were observed at the equator and along the Congo-Gabon coast. They have increased over the last decade and particularly during 2019. During the latter year, events lasting more than 40 days have been observed, from October 2019 to March 2020. This is in agreement with a study by Costa and Rodrigues (2021). In that study, the authors found that the presence of strong positive temperature anomalies along the equator and the Angolan coast was detected from October 2019 to February 2020. However, the events to the north of the GG are short-lived.
With regard to intensities, we have shown that there is no clear trend for the mean annual intensities in the different zones. There is also no significant change and a maximum value of -0.015°C per year along the Congo-Gabon coast is found. But unlike the mean annual intensity, the cumulative annual intensity show significant positive trends of 2.5°C/year for Zone I, 2.2°C/year for Zone II and 4.8°C/year for Zone III. This means that the areas of highest intensity are those on the Congo-Gabon coast and on the northern coast of the GG. The most intense MHWs event is located on the Congo-Gabon coast. High intensity MHWs events are detected during or after upwelling on the Congo-Gabon coast, whereas in the equatorial zone and on the north coast of the GG they occur outside the upwelling period (Djakouré et al., 2014; Djakouré et al., 2017).
The subsurface temperature results show subsurface warming between 40 and 80 meters depth at 0°W-0°N before the appearance of MHWs at the surface, in October 2019. This warming observed is in agreement with the result of Costa and Rodrigues (2021). These authors have shown temperature anomalies (>2°C) between 40 and 60 meters depth in November and also in December 2019. These MHWs events took place in the eastern equatorial Atlantic during the peak of the Benguela Niño. These strong warmings are transported to the surface a few days later, giving way to a cooling until the temperature returns to normal. These warmings could be caused by the eastward propagation of an ascending Kelvin wave induced by an ascending Rossby wave reflecting at the western boundary which is forced by westerly wind anomalies along the equator (Nagura and McPhaden, 2010; Costa and Rodrigues, 2021). Subsurface cooling could explain the fluctuations observed in the intensity of the surface event. The strong presence of MHWs from category I, observed in the eastern tropical Atlantic, is relatively common worldwide.
This study presents the different characteristics of MHWs and their evolution in the eastern tropical Atlantic. It has been shown that MHWs in this region are increasing in frequency, duration and cumulative intensity. The change in mean intensity remains low in this part of the eastern tropical Atlantic. It has also been shown that the changes in characteristics are not uniform and show regional differences. Finally, the results suggested that ocean temperatures are a potential predictability of MWHs.
Data availability statement
Publicly available datasets were analyzed in this study. This data can be found here: https://www.ncei.noaa.gov/products/optimum-interpolation-sst http://www.pmel.noaa.gov/gtmba/pmel-theme/atlantic-392.ocean-pirata or ftp://ftp.ifremer.fr/ifremer/ird/pirata/pirata-data/s).
Author contributions
SD: Conceptualization, Data curation, Formal analysis, Funding acquisition, Methodology, Resources, Software, Supervision, Validation, Visualization, Writing – original draft, Writing – review & editing. MK: Conceptualization, Data curation, Formal analysis, Investigation, Methodology, Resources, Software, Visualization, Writing – original draft, Writing – review & editing. KUK: Conceptualization, Data curation, Formal analysis, Methodology, Visualization, Writing – original draft, Writing – review & editing. KYK: Conceptualization, Data curation, Formal analysis, Investigation, Methodology, Resources, Supervision, Validation, Visualization, Writing – original draft, Writing – review & editing. MA: Conceptualization, Data curation, Formal analysis, Methodology, Supervision, Validation, Writing – review & editing. EN: Formal analysis, Validation, Visualization, Writing – original draft, Writing – review & editing. ST: Software, Writing – review & editing.
Funding
The author(s) declare financial support was received for the research, authorship, and/or publication of this article. This work is supported by the TRIATLAS project, which has received funding from the European Union’s Horizon 2020 research and innovation program under grant agreement 377 817578 and IRD JEAI IVOARE-UP.
Acknowledgments
This work contributes to the TRIATLAS and IRD JEAI IVOARE-UP projects. We thank the NOAA administration and PIRATA for making their data available.
Conflict of interest
The authors declare that the research was conducted in the absence of any commercial or financial relationships that could be construed as a potential conflict of interest.
Publisher’s note
All claims expressed in this article are solely those of the authors and do not necessarily represent those of their affiliated organizations, or those of the publisher, the editors and the reviewers. Any product that may be evaluated in this article, or claim that may be made by its manufacturer, is not guaranteed or endorsed by the publisher.
References
Amaya D. J., Miller A. J., Xie S.-P., Kosaka Y. (2020). Physical drivers of the summer 2019 North Pacific marine heatwave. Nat. Commun. 11, 1903. doi: 10.1038/s41467-020-15820-w
Arias-Ortiz A., Serrano O., Masqué P., Lavery P. S., Mueller U., Kendrick G. A., et al. (2018). A marine heatwave drives massive losses from the world’s largest seagrass carbon stocks. Nat. Climate Change 8, 338–344. doi: 10.1038/s41558-018-0096-y
Atkinson J., King N. G., Wilmes S. B., Moore P. J. (2020). Summer and winter marine heatwaves favor an invasive over native seaweeds. J. Phycology 56, 1591–1600. doi: 10.1111/jpy.13051
Bond N. A., Cronin M. F., Freeland H., Mantua N. (2015). Causes and impacts of the 2014 warm anomaly in the NE Pacific. Geophysical Res. Lett. 42, 3414–3420. doi: 10.1002/2015GL063306
Bourlès B., Araujo M., McPhaden M. J., Brandt P., Foltz G. R., Lumpkin R., et al. (2019). PIRATA: A sustained observing system for tropical Atlantic climate research and forecasting. Earth Space Sci. 6, 577–616. doi: 10.1029/2018EA000428
Bourlès B., Lumpkin R., McPhaden M. J., Hernandez F., Nobre P., Campos E., et al. (2008). The PIRATA program: History, accomplishments, and future directions. Bull. Am. Meteorological Soc. 89, 1111–1126. doi: 10.1175/2008BAMS2462.1
Caputi N., Kangas M., Denham A., Feng M., Pearce A., Hetzel Y., et al. (2016). Management adaptation of invertebrate fisheries to an extreme marine heat wave event at a global warming hot spot. Ecol. Evol. 6, 3583–3593. doi: 10.1002/ece3.2137
Casado-Amezúa P., Araújo R., Bárbara I., Bermejo R., Borja Á., Díez I., et al. (2019). Distributional shifts of canopy-forming seaweeds from the Atlantic coast of Southern Europe. Biodiversity Conserv. 28, 1151–1172. doi: 10.1007/s10531-019-01716-9
Costa N. V., Rodrigues R. R. (2021). Future summer marine heatwaves in the western South Atlantic. Geophysical Res. Lett. 48, e2021GL094509. doi: 10.1029/2021GL094509
Des M., Martínez B., DeCastro M., Viejo R. M., Sousa M. C., Gómez-Gesteira M. (2020). The impact of climate change on the geographical distribution of habitat-forming macroalgae in the Rías Baixas. Mar. Environ. Res. 161, 105074. doi: 10.1016/j.marenvres.2020.105074
Di Lorenzo E., Mantua N. (2016). Multi-year persistence of the 2014/15 North Pacific marine heatwave. Nat. Climate Change 6, 1042–1047. doi: 10.1038/nclimate3082
Djakouré S., Penven P., Bourlès B., Koné V., Veitch J. (2017). Respective roles of the Guinea Current and local winds on the coastal upwelling in the northern Gulf of Guinea. J. Phys. Oceanography 47, 1367–1387. doi: 10.1175/JPO-D-16-0126.1
Djakouré S., Penven P., Bourlès B., Veitch J., Koné V. (2014). Coastally trapped eddies in the north of the G ulf of G uinea. J. Geophys. Res.: Oceans 119, 6805–6819. doi: 10.1002/2014JC010243
Duarte L., Viejo R. M., Martínez B., deCastro M., Gómez-Gesteira M., Gallardo T. (2013). Recent and historical range shifts of two canopy-forming seaweeds in North Spain and the link with trends in sea surface temperature. Acta Oecologica 51, 1–10. doi: 10.1016/j.actao.2013.05.002
Fernández C. (2011). The retreat of large brown seaweeds on the north coast of Spain: the case of Saccorhiza polyschides. Eur. J. Phycology 46, 352–360. doi: 10.1080/09670262.2011.617840
Fernández C. (2016). Current status and multidecadal biogeographical changes in rocky intertidal algal assemblages: the northern Spanish coast. Estuarine Coast. Shelf Sci. 171, 35–40. doi: 10.1016/j.ecss.2016.01.026
Fernández C., Anadón R. (2008). La cornisa cantabrica: un escenario de cambios de distribución de comunidades intermareales. Algas 39, 30–32.
Foltz G. R., Brandt P., Richter I., Rodríguez-Fonseca B., Hernandez F., Dengler M., et al. (2019). The tropical Atlantic observing system. Front. Mar. Sci. 6, 206. doi: 10.3389/fmars.2019.00206
Frölicher T. L., Laufkötter C. (2018). Emerging risks from marine heat waves. Nat. Commun. 9, 650. doi: 10.1038/s41467-018-03163-6
Garrabou J., Coma R., Bensoussan N., Bally M., Chevaldonné P., Cigliano M., et al. (2009). Mass mortality in Northwestern Mediterranean rocky benthic communities: effects of the 2003 heat wave. Global Change Biol. 15, 1090–1103. doi: 10.1111/j.1365-2486.2008.01823.x
Gelman A. (2007). Struggles with survey weighting and regression modeling. Stat. Sci. 22 (2), 153–164. doi: 10.1214/088342307000000203
Gómez-Gesteira M., Decastro M., Alvarez I., Gómez-Gesteira J. L. (2008). Coastal sea surface temperature warming trend along the continental part of the Atlantic Arc (1985–2005). J. Geophys. Res. 113, 2007JC004315. doi: 10.1029/2007JC004315
Hardman-Mountford N. J., McGlade J. M. (2003). Seasonal and interannual variability of oceanographic processes in the Gulf of Guinea: an investigation using AVHRR sea surface temperature data. Int. J. Remote Sens. 24, 3247–3268. doi: 10.1080/0143116021000021297
Hobday A. J., Alexander L. V., Perkins S. E., Smale D. A., Straub S. C., Oliver E. C., et al. (2016). A hierarchical approach to defining marine heatwaves. Prog. Oceanography 141, 227–238. doi: 10.1016/j.pocean.2015.12.014
Hobday A. J., Oliver E. C., Gupta A. S., Benthuysen J. A., Burrows M. T., Donat M. G., et al. (2018). Categorizing and naming marine heatwaves. Oceanography 31, 162–173. doi: 10.5670/oceanog.2018.205
Holbrook N. J., Scannell H. A., Sen Gupta A., Benthuysen J. A., Feng M., Oliver E. C., et al. (2019). A global assessment of marine heatwaves and their drivers. Nat. Commun. 10, 2624. doi: 10.1038/s41467-019-10206-z
Hu S., Li S., Zhang Y., Guan C., Du Y., Feng M., et al. (2021). Observed strong subsurface marine heatwaves in the tropical western Pacific Ocean. Environ. Res. Lett. 16, 104024. doi: 10.1088/1748-9326/ac26f2
Hughes T. P., Barnes M. L., Bellwood D. R., Cinner J. E., Cumming G. S., Jackson J. B., et al. (2017). Coral reefs in the anthropocene. Nature 546, 82–90. doi: 10.1038/nature22901
Jacox M. G., Alexander M. A., Stock C. A., Hervieux G. (2019). On the skill of seasonal sea surface temperature forecasts in the California Current System and its connection to ENSO variability. Climate Dynamics 53, 7519–7533. doi: 10.1007/s00382-017-3608-y
Jones K. R., Klein C. J., Halpern B. S., Venter O., Grantham H., Kuempel C. D., et al. (2018). The location and protection status of Earth’s diminishing marine wilderness. Curr. Biol. 28, 2506–2512. doi: 10.1016/j.cub.2018.06.010
Koné M., Djakouré S., Adon M., Ta S., Kouadio Y. (2022). Marine Heatwaves, Upwelling, and Atmospheric Conditions during the Monsoon Period at the Northern Coast of the Gulf of Guinea. Climate 10, 199. doi: 10.3390/cli10120199
Koné V., Lett C., Penven P., Bourlès B., Djakouré S. (2017). A biophysical model of S. aurita early life history in the northern Gulf of Guinea. Prog. oceanography 151, 83–96. doi: 10.1016/j.pocean.2016.10.008
Koranteng K. A., McGlade J. M. (2001). Climatic trends in continental shelf waters off Ghana and in the Gulf of Guinea 1963–1992. Oceanologica Acta 24, 187–198. doi: 10.1016/S0399-1784(01)01140-9
Kouadio Y. K., Djakouré S., Aman A., Ali K. E., Koné V., Toualy E. (2013). Characterization of the boreal summer upwelling at the northern coast of the Gulf of Guinea based on the PROPAO in situ measurements network and satellite data. Int. J. Oceanography 2013. doi: 10.1155/2013/816561
Marin M., Bindoff N. L., Feng M., Phillips H. E. (2021). Slower long-term coastal warming drives dampened trends in coastal marine heatwave exposure. J. Geophysical Research: Oceans 126, e2021JC017930. doi: 10.1029/2021JC017930
Martìnez J., Leonelli F. E., Garcìa-Ladona E., Garrabou J., Kersting D. K., Bensoussan N., et al. (2023). Evolution of marine heat waves in warming seas: the case study of the Mediterranean Sea. In. Mars Sci. 10. doi: 10.3389/fmars.2023.1193164
Mills K. E., Pershing A. J., Brown C. J., Chen Y., Chiang F.-S., Holland D. S., et al. (2013). Fisheries management in a changing climate: lessons from the 2012 ocean heat wave in the Northwest Atlantic. Oceanography 26, 191–195. doi: 10.5670/oceanog.2013.27
Mohamed B., Nilsen F., Skogseth R. (2022). Marine heatwaves characteristics in the barents sea based on high resolution satellite data, (1982–2020). Front. Mar. Sci. 9, 821646. doi: 10.3389/fmars.2022.821646
Müller R., Laepple T., Bartsch I., Wiencke C. (2009). Impact of oceanic warming on the distribution of seaweeds in polar and cold-temperate waters. Bot. Mar. 52, 617–638. doi: 10.1515/BOT.2009.080
Nagura M., McPhaden M. J. (2010). Dynamics of zonal current variations associated with the Indian Ocean dipole. J. Geophys. Res.: Oceans 115, 2010JC006423. doi: 10.1029/2010JC006423
Oliver E. C. (2019). Mean warming not variability drives marine heatwave trends. Climate Dynamics 53, 1653–1659. doi: 10.1007/s00382-019-04707-2
Oliver E. C., Benthuysen J. A., Darmaraki S., Donat M. G., Hobday A. J., Holbrook N. J., et al. (2021). Marine heatwaves. Annu. Rev. Mar. Sci. 13, 313–342. doi: 10.1146/annurev-marine-032720-095144
Oliver E. C., Donat M. G., Burrows M. T., Moore P. J., Smale D. A., Alexander L. V., et al. (2018). Longer and more frequent marine heatwaves over the past century. Nat. Commun. 9, 1–12. doi: 10.1038/s41467-018-03732-9
Piñeiro-Corbeira C., Barreiro R., Cremades J. (2016). Decadal changes in the distribution of common intertidal seaweeds in Galicia (NW Iberia). Mar. Environ. Res. 113, 106–115. doi: 10.1016/j.marenvres.2015.11.012
Reynolds R. W., Smith T. M., Liu C., Chelton D. B., Casey K. S., Schlax M. G. (2007). Daily high-resolution-blended analyses for sea surface temperature. J. Climate 20, 5473–5496. doi: 10.1175/2007JCLI1824.1
Salinger M. J., Renwick J., Behrens E., Mullan A. B., Diamond H. J., Sirguey P., et al. (2019). The unprecedented coupled ocean-atmosphere summer heatwave in the New Zealand region 2017/18: drivers, mechanisms and impacts. Environ. Res. Lett. 14, 044023. doi: 10.1088/1748-9326/ab012a
Schlegel R. W., Darmaraki S., Benthuysen J. A., Filbee-Dexter K., Oliver E. C. (2021). Marine cold-spells. Prog. Oceanogr. 198, 102684. doi: 10.1016/j.pocean.2021.102684
Schmeisser L., Bond N. A., Siedlecki S. A., Ackerman T. P. (2019). The role of clouds and surface heat fluxes in the maintenance of the 2013–2016 Northeast Pacific marine heatwave. J. Geophys. Res.: Atmospheres 124, 10772–10783. doi: 10.1029/2019JD030780
Servain J., Busalacchi A. J., McPhaden M. J., Moura A. D., Reverdin G., Vianna M., et al. (1998). A pilot research moored array in the tropical Atlantic (PIRATA). Bull. Am. Meteorological Soc. 79, 2019–2032. doi: 10.1175/1520-0477(1998)079<2019:APRMAI>2.0.CO;2
Smale D. A., Wernberg T., Oliver E. C., Thomsen M., Harvey B. P., Straub S. C., et al. (2019). Marine heatwaves threaten global biodiversity and the provision of ecosystem services. Nat. Climate Change 9, 306–312. doi: 10.1038/s41558-019-0412-1
Stretta J. M. (1988). "Environnement et pêche thonière en Atlantique tropical oriental," in Ressources, pêche et biologie des thonidés tropicaux de l'Atlantique centre-est. Document Technique sur les Pêches - FAO; 292. Eds. Alain F., Jacques M.. (Rome: FAO), 269–316.
Thomsen M. S., Mondardini L., Alestra T., Gerrity S., Tait L., South P. M., et al. (2019). Local extinction of bull kelp (Durvillaea spp.) due to a marine heatwave. Front. Mar. Sci. 6, 84. doi: 10.3389/fmars.2019.00084
Trainer V. L., Moore S. K., Hallegraeff G., Kudela R. M., Clement A., Mardones J. I., et al. (2020). Pelagic harmful algal blooms and climate change: Lessons from nature’s experiments with extremes. Harmful algae 91, 101591. doi: 10.1016/j.hal.2019.03.009
Viejo R. M., Martínez B., Arrontes J., Astudillo C., Hernández L. (2011). Reproductive patterns in central and marginal populations of a large brown seaweed: drastic changes at the southern range limit. Ecography 34, 75–84. doi: 10.1111/j.1600-0587.2010.06365.x
Voerman S. E., Llera E., Rico J. M. (2013). Climate driven changes in subtidal kelp forest communities in NW Spain. Mar. Environ. Res. 90, 119–127. doi: 10.1016/j.marenvres.2013.06.006
Wernberg T., Bennett S., Babcock R. C., De Bettignies T., Cure K., Depczynski M., et al. (2016). Climate-driven regime shift of a temperate marine ecosystem. Science 353, 169–172. doi: 10.1126/science.aad8745
Keywords: marine heat waves, sea surface temperature, ocean-atmosphere interaction, eastern tropical Atlantic Ocean, Gulf of Guinea, climate change
Citation: Djakouré S, Koné M, Koffi KU, Kouadio KY, Adon M, Nyadjro E and Ta S (2023) Characterization of marine heat waves in the eastern tropical Atlantic Ocean. Front. Mar. Sci. 10:1293779. doi: 10.3389/fmars.2023.1293779
Received: 13 September 2023; Accepted: 06 November 2023;
Published: 12 December 2023.
Edited by:
Francisco Machín, University of Las Palmas de Gran Canaria, SpainReviewed by:
Wei Huang, Florida International University, United StatesJohn Roland Moisan, National Aeronautics and Space Administration (NASA), United States
Copyright © 2023 Djakouré, Koné, Koffi, Kouadio, Adon, Nyadjro and Ta. This is an open-access article distributed under the terms of the Creative Commons Attribution License (CC BY). The use, distribution or reproduction in other forums is permitted, provided the original author(s) and the copyright owner(s) are credited and that the original publication in this journal is cited, in accordance with accepted academic practice. No use, distribution or reproduction is permitted which does not comply with these terms.
*Correspondence: Sandrine Djakouré, YWdyZS5kamFrb3VyZUBpcmQuZnI=