 Michael A. Maniscalco
 Mark A. Brzezinski
 Jeffrey W. Krause2,3
 Kimberlee Thamatrakoln
- 1Marine Science Institute and The Department of Ecology, Evolution, and Marine Biology, University of California, Santa Barbara, CA, United States
- 2Dauphin Island Sea Lab, Dauphin Island, AL, United States
- 3Stokes School of Marine and Environmental Sciences, University of South Alabama, Mobile, AL, United States
- 4Department of Marine and Coastal Sciences, Rutgers, The State University of New Jersey, New Brunswick, NJ, United States
Diatoms serve as the major link between the marine carbon (C) and silicon (Si) biogeochemical cycles through their contributions to primary productivity and requirement for Si during cell wall formation. Although several culture-based studies have investigated the molecular response of diatoms to Si and nitrogen (N) starvation and replenishment, diatom silicon metabolism has been understudied in natural populations. A series of deckboard Si-amendment incubations were conducted using surface water collected in the California Upwelling Zone near Monterey Bay. Steep concentration gradients in macronutrients in the surface ocean coupled with substantial N and Si utilization led to communities with distinctly different macronutrient states: replete (‘healthy’), low N (‘N-stressed’), and low N and Si (‘N- and Si-stressed’). Biogeochemical measurements of Si uptake combined with metatranscriptomic analysis of communities incubated with and without added Si were used to explore the underlying molecular response of diatom communities to different macronutrient availability. Metatranscriptomic analysis revealed that N-stressed communities exhibited dynamic shifts in N and C transcriptional patterns suggestive of compromised metabolism. Expression patterns in communities experiencing both N and Si stress imply that the presence of Si stress may partially ameliorate N stress and dampen the impact on organic matter metabolism. This response builds upon previous observations that the regulation of C and N metabolism is decoupled from Si limitation status, where Si stress allows the cell to optimize the metabolic machinery necessary to respond to episodic pulses of nutrients. Several well-characterized Si-metabolism associated genes were found to be poor molecular markers of Si physiological status; however, several uncharacterized Si-responsive genes were revealed to be potential indicators of Si stress or silica production.
Introduction
As silicifying photoautotrophs, diatoms serve as a critical link between ocean silicon (Si), nitrogen (N), and carbon (C) biogeochemical cycles. In productive coastal regimes, wind-driven upwelling events bring deep macronutrient-rich water to the surface, fueling >30% of annual productivity (Krause et al., 2013). In the coastal upwelling zone (CUZ) near Monterey Bay, strong late spring and summer upwelling can bring water to the surface with Si(OH)4 and NO3- concentrations in excess of 25 µM in a ~1.2:1 ratio (Brzezinski et al., 1997). Diatoms can rapidly respond to the influx of nutrients and utilize Si(OH)4 and NO3- in a 1:1 ratio (Brzezinski, 1985), implying that a diatom-dominated community in Monterey Bay could account for nearly all of the new production within the system. The similarity between the mean supply and utilization ratios suggests diatoms could simultaneously drawdown NO3- and Si(OH)4 to low levels, setting up a potential scenario where diatom cells experience physiological stress related to the lack of both macronutrients. However, variations from the mean nutrient supply ratio, the amount of nitrogen regenerated in the system (Brzezinski et al., 1997), or the community nutrient consumption ratio can determine the ultimate limiting nutrient regime, which may have dramatically different impacts on cell physiology (De La Rocha and Passow, 2004; Brembu et al., 2017a; Smith et al., 2019) and bloom fate.
In response to low N availability that reduces the rate of N uptake, diatoms attempt to maintain growth by reducing cellular N quotas through decreased concentrations of chlorophyll, total protein, and other N-dependent biomolecules (Osborne and Geider, 1986; Liefer et al., 2019). This is driven by the down-regulation of genes involved in C metabolism and accompanied by a characteristic shift in the expression of N-assimilation genes (Bender et al., 2014; Smith et al., 2019). Low extracellular N availability can also lead to cellular amino acid and protein recycling (Falkowski et al., 1989; Alipanah et al., 2015) and up-regulation of the ornithine-urea cycle, which plays a key role in the redistribution of intracellular N (Allen et al., 2011). These strategies slow progression into total N starvation and cell cycle arrest, but progressively induces physiological stress that ultimately reduces growth. The loss of key metabolites in the process results in an extended lag phase upon N replenishment (De La Rocha and Passow, 2004; Hockin et al., 2012). In contrast, when diatoms are kinetically limited by low Si availability, a reduction in cellular Si quota is achieved by the production of less silicified cell walls, or frustules, allowing cells to maintain growth (Paasche, 1973; McNair et al., 2018a). Reductions in silica production could also reduce cellular N quota given the role of long-chain polyamines, derived from the urea cycle, in silicification (Kröger et al., 2000). Only when the limitation by Si exceeds the capacity of the cell to thin the frustule does growth limitation ensue; this can be due to low dissolved Si driven by bloom conditions or chronically low Si concentrations (e.g. open ocean). However, as Si is a structural component and not heavily utilized in vital intracellular machinery, Si limitation has less of an impact on C and N metabolism, thereby allowing diatoms to rapidly return to optimal growth rates upon Si replenishment (De La Rocha and Passow, 2004). Thus it has been suggested that Si limitation may be an evolutionary adaptation that allows diatoms to rapidly resume growth upon nutrient resupply (Flynn and Martin-Jézéquel, 2000; De La Rocha and Passow, 2004; Raven and Waite, 2004).
Unlike the well-characterized molecular response to N stress, the molecular response to Si stress is less defined, in part because of an incomplete understanding of the molecular mechanisms of silicification and the metabolic pathways impacted by Si stress. Numerous culture-based transcriptomic studies have explored the molecular response to Si starvation and replenishment (Mock et al., 2008; Sapriel et al., 2009; Shrestha et al., 2012; Smith et al., 2016; Brembu et al., 2017a), but the majority of genes identified in these studies encode for hypothetical or uncharacterized proteins. Proteomic-based studies confirm the role of numerous known and unknown proteins in Si metabolism, but also reveal the expression of proteins involved in cell cycle progression, amino acid synthesis, and cell wall synthesis (Du et al., 2014; Chen et al., 2018; Thangaraj et al., 2019). Among the known proteins are the silicon transporters (SITs), a family of membrane-bound proteins responsible for intracellular silicon uptake (Hildebrand et al., 1997; Hildebrand et al., 1998; Thamatrakoln and Hildebrand, 2007) when extracellular Si(OH)4 concentrations are <20 µmol L-1 (Shrestha and Hildebrand, 2015; Knight et al., 2016); above that, passive uptake occurs with Si(OH)4 freely diffusing across the cell membrane (Thamatrakoln and Hildebrand, 2008; Shrestha and Hildebrand, 2015). Other diatom-specific proteins directly involved in silica deposition (i.e. silica production) have also been characterized including silaffins (Kröger et al., 1999), silacidin (Wenzl et al., 2008), cingulins (Scheffel et al., 2011), silicalemma-associated proteins (Tesson et al., 2017), and silicanin-1 (Kotzsch et al., 2017).
Here we investigate the physiological impact of, and interplay between, N and Si stress of a diatom bloom near Monterey Bay, CA to understand how nutrient-limited communities respond when resupplied with episodic pulses of nutrients. To provide a molecular framework for the response to nutrient limitation, we used a combination of metatranscriptomic analyses and biogeochemical measurements to contextualize the resident diatom communities. We further evaluate the utility of diatom transcriptomic fingerprints in diagnosing N and Si stress.
Materials and methods
Environmental sample collection and experimental design
Incubation samples were collected during the “DYE labeling of diatoms” (DYEatom) cruise between 27 June and 05 July 2013 on board the R/V Point Sur (PS1312; 27 June-5 July 2013) off the California coast near Monterey Bay. Details about the cruise track and hydrodynamic conditions can be found elsewhere (Kranzler et al., 2019; Krause et al., 2020). Stations reflecting a progression of bloom states were initially identified using satellite derived ocean color and sea surface temperature (SST; MODIS Level-2 products, NASA), high frequency radar arrays (Kaplan and Largier, 2006); Central and Northern California Ocean Observing System, www.cencoos.org), and the vessel’s underway data acquisition and flow-through seawater systems to identify areas with high phytoplankton biomass. Stations were sampled just after local sunrise. Water was collected using a rosette containing twelve 10L Niskin bottles, Sea-Bird Electronics conductivity-temperature-depth sensor, Chelsea fluorometer, and photosynthetically active radiation (PAR) sensor from Bio-Spherical Instruments. Data from three stations, S2, S4 and S11 were analyzed for the present study.
The phytoplankton community response to silicic acid addition was investigated through a series of deckboard incubation experiments and a combination of biogeochemical measurements and metatranscriptome sequencing. Water was collected from a depth corresponding to 55% of the surface irradiance level (I0) and transferred to replicate acid-washed polycarbonate bottles. Bottles were left unamended as control (Ctrl) or amended with 18 µmol L-1 Si(OH)4 (+Si) and incubated in deckboard incubators shaded to 55% I0 with window screening and cooled to in situ temperatures with flow-through surface seawater.
Silica production rate measurements
Community biogenic silica (bSi) production rates were measured using the radiotracer 32Si. At the start of each incubation experiment a 250 mL polycarbonate bottle was filled to the brim with 304 mL of seawater, amended with 263 Bq of high-specific activity 32Si (>40 kBq μg Si−1), and incubated for 4, 12, and/or 24 h. At the termination of each incubation, samples were filtered onto 25 mm, 1.2-μm pore-size polycarbonate filters and processed for 32Si activity using low-level gas-flow proportional counting (Krause et al., 2011). Volumetric Si production rates (ρ in μmol Si L−1 d−1) were normalized to bulk bSi concentrations (μmol Si L−1) to obtain specific silicic acid uptake rates (Vb, d−1). Two methods were used to assess the degree that the ambient Si(OH)4 concentration limited bSi production (i.e. Si uptake), both of which used the same 32Si activity addition, incubation conditions, and processing as described above. The first method measured 32Si uptake as a function of silicic acid concentration along an eight-point concentration gradient between 0-18 µmol L-1 Si(OH)4, i.e. sample water was distributed into eight different bottles, and seven received added Si(OH)4 (one remained at ambient) to create the gradient. The dependence of Vb on the substrate concentration conforms to a rectangular hyperbola described by the Michaelis-Menten equation:
where Vmax is the maximum specific uptake rate and Ks is the half saturation constant. Data were fit to a non-linear curve using the self-starting Michaelis-Menten function (SSmicmen) from the R stats package v.3.6.2. The second method used bSi production rates measured at ambient Si(OH)4 concentration and +18.0 µmol L-1 Si(OH)4 to saturate Si uptake and approximate Vmax and measure Vb in Eq. 1 (Brzezinski et al., 1997). Kinetic Si-limitation, or Si-stress, was defined as the ratio of Si production at ambient Si(OH)4 concentration (Vamb) to the enhanced +18µmol L-1 [Si(OH)4] (Venh), Vamb : Venh (Nelson et al., 2001).
ere lower values correspond to greater stress. Based on the analytical error of the measurement, Si stress values >0.92 were considered within detection error and are not resolvable from a value of 1 which would indicate Si sufficiency (Krause et al., 2012).
For station S11, the end point of the kinetic incubation (4 h) differed from that of the incubation used for RNA extraction and sequencing (36 h). Thus, the initial conditions (e.g. bSi0, [Si(OH)4]0, Vmax, Vb, and Ks) were used to estimate the final specific uptake rate and Si stress. Eq. 1 was converted into Eqs. 3-4 to determine the bSi concentration (bSin) at the end of a given time-step (tn, iteration number n). The bSin and Si(OH)4 concentration after tn ([Si(OH)4]n) were then used to calculate the specific uptake rate at the end of each time-step (1 min) and iterated for each time-step from 4 to 36 h (Eqs. 5-6).
This simplified calculation assumes there was minimal dissolution of the bSi pool during the time-course of the incubation (i.e. gross production = net production), which is reasonable for this region where the average dissolution rate has been measured at ~0.05 d-1 (Brzezinski et al., 2003). Furthermore, although shifts in species composition can community alter Vmax and Ks values, the incubations were short enough (12-36 h) that we assumed these values did not change.
Nutrient and particulate analyses
Seawater samples for dissolved nutrient analysis (nitrite + nitrate, orthophosphate and silicic acid) were syringe filtered through 0.6 µm-polycarbonate filters into polypropylene scintillation vials and immediately frozen at -20°C. Concentrations of NO2- + NO3-, and PO4-3 were measured at the University of California, Santa Barbara Marine Science Institute using a Lachat Instruments QuikChem 8500 Series 2 (Parsons et al., 1984), while Si(OH)4 was quantified using the ammonium molybdate colorimetric assay (Brzezinski and Nelson, 1995). For bSi samples, 600 mL of seawater was vacuum filtered onto 0.6-µm pore-size polycarbonate filters and digested shipboard using 0.2 N NaOH digestion in Teflon tubes (Krause et al., 2010). Final neutralized bSi digests were then quantified using similar colorimetric procedures as described for Si(OH)4 samples (Krause et al., 2010). For chlorophyll measurements, samples were collected by filtration onto 0.45-µm pore-size HAWP cellulose filters (Millipore) and frozen at -20˚C. Chlorophyll a was extracted with 90% acetone at -20˚C for 24 h using the acidification method and measured with the Turner Designs 10-AU fluorometer (Strickland and Parsons, 1972; Parsons et al., 1984).
Metatranscriptome analysis
Seawater samples for metatranscriptome analysis were collected by filtration at <5 psi onto 47 mm, 1.2 µm pore-size polycarbonate membranes, flash frozen in liquid N2, and stored at -80°C. Total RNA was extracted from filters using the Trizol-RNeasy method with an additional bead beating step. In brief, filters were transferred to tubes containing RNase/DNase free 100 µm zirconia/silica beads with 1 mL of Trizol reagent, vortexed for 2 min, incubated at room temperature for 5 min, vortexed again for 2 min before following the standard Trizol RNA extraction protocol. The upper aqueous phase was transferred to a clean 1.5 mL tube with an equal volume of 70% alcohol, mixed, and added to QIAgen RNAeasy column. The standard RNeasy protocol with the optional on-column DNase treatment was followed.
RNA was quantified using a Qubit® RNA HS Assay, and RNA integrity was determined using the Agilent Bioanalyzer RNA 6000 Pico kit eukaryotic assay. Total RNA (500 ng) was used for library prep with Illumina TruSeq RNA Library Prep kit v2 with mRNA purified using Oligo-dT bead capture polyA tails. Library quality was assessed on an Agilent Bioanalyzer and quantified via Qubit before being pooled in equal quantities. The pooled libraries were sequenced at UC-Davis Genome Center on HiSeq 4000 in lanes of paired-end-150bp flow cell.
Primer and adapter sequences were removed from raw sequencing reads with trimmomatic v0.38 (Bolger et al., 2014). Paired-end reads were merged with interleave-reads.py from the khmer package v2.1.2 before removal of rRNA reads with sortmeRNA v2.0 utilizing the built in SILVA 16s, 18s, 23s, and 28s databases (Kopylova et al., 2012). Remaining reads were separated (using the deinterleave_fastq.sh https://gist.github.com/nathanhaigh/3521724) and assembled into contiguous sequences (contigs) with megahit v1.1.3 using ‘meta-large’ setting (Li et al., 2015). Open reading frames (ORFs) were predicted from assembled contigs using FragGeneScan v1.31 (Rho et al., 2010), and orfs shorter than 150 bp were removed. Reads counts for remaining orfs were estimated using salmon v0.6.0 `quant` quasi-mapping with seqBias and gcBias features.
Orfs were annotated based on best homology (lowest E-value) using BLASTP v.2.5.0+ with an E-value threshold of<10-3. Taxonomic and functional annotations were assigned using the MarineRefII (roseobase.org/data), a custom databased maintained by the Moran Lab at the University of Georgia that includes sequences from PhyloDB v.1.076 which contains 24,509,327 peptides from 19,962 viral, 230 archaeal, 4,910 bacterial and 894 eukaryotic taxa, including peptides from KEGG, GenBank, JGI, ENSEMBL, CAMERA and 410 taxa from the Marine Microbial Eukaryotic Transcriptome Sequencing Project (MMETSP), as well as the associated KEGG functional and NCBI taxonomic annotations through a related SQL database. NCBI taxonomic annotations were further curated (Cohen et al., 2017); (https://github.com/marchettilab/metatranscriptomicsPipeline) to ensure the use of consistent taxonomic ranks. KEGG Ortholog (KO) classifications of diatom urea transporters, nitrite reductase, ammonium transporters were manually verified against known gene phylogenies and edited accordingly (Smith et al., 2019).
Silaffin-like genes were identified in Pseudo-nitzschia multiseries (CLN-47 v1) genome, as described previously (Scheffel et al., 2011), using an initial signal peptide screen of translated nucleotide sequences and subsequence sliding window search for amino acid (AA) sequences containing a 100-2000 long segment with ≥10% lysine and ≥18% serine residues. Full length P. multiseries putative silaffin amino acid sequences were subsequently screened for the presence the characteristic silaffin-like motifs using the FIMO program within the Multiple EM for Motif Elicitation (MEME suite v.5.4.1) motif scanning software package (Grant et al., 2011). Additional functional annotation was performed using BLASTP with the NCBI nr database (E-value<10-10) and KEGG GhostKOALA (score<40). This process identified 157 putative unique P. multiseries silaffin-like genes (PNSLs) which were used with BLASTP+ v2.5.0 (E-value<10-5) to identify homologous sequences within our metatranscriptome assembly. To identify the distribution of these genes in diatoms and other microalgae, BLASTP was used against a database containing the 67 translated transcriptomes from the MMETSP (Keeling et al., 2014). PNSLswith no significant hits (E-value<10-10) to non-diatom genes were considered “diatom-specific”.
For genes of interest that did not have an associated KO number, such as silicon transporters (SITs) and silicanin-1 (Sin-1), manual annotation was performed as previously described (Durkin et al., 2016; Brembu et al., 2017a; Kotzsch et al., 2017) using BLASTP+ v2.5.0 best hit with e-value cutoff of 10-5. Putative SIT sequences were further classified to clade designations, using a maximum-likelihood tree constructed from a reference alignment (Durkin et al., 2016) with RAxML version 8.2.12 – PROTGAMMAWAGF substitution model and 100 bootstrap replicates (Stamatakis, 2014). A HMM-profile was constructed from the reference alignment (using hmmbuild 3.2.1) and used with hmmalign to align amino acid sequences corresponding to SIT orfs. Alignment and tree files were packaged using taxtastic v.0.8.3, and SIT orfs were placed on the reference tree using pplacer v.1.1.alpha19 with posterior probability calculated (Matsen et al., 2010). The most closely related reference sequence was assigned to each SIT orf using guppy v.1.1.alpha19 (Matsen et al., 2010).
Prior to differential abundance analysis, raw counts were aggregated within diatom genera by KO number. For genes lacking a KO number, e.g. SITs, ISIPs, Sin1, etc., aggregation was done based on gene assignment through KEGG annotation or BLASTX query of supplemental databases. Genus-specific aggregation of functionally annotated reads reduces redundancy and allows the use of tools originally designed for single organism RNAseq analysis (e.g. DESeq2, edgeR). This is necessary for microbial community transcriptomic analysis due to methodological and computational difficulties in resolving species-level, differential transcript abundance (Toseland et al., 2014; Alexander et al., 2015; Kopf et al., 2015; Cohen et al., 2017; Hu et al., 2018; Lampe et al., 2018; Cohen et al., 2021). However, this approach does not resolve species-level contig abundance, nor does it a priori resolve clade-specific abundance patterns for genes that belong to multigene families. In the case of SITs, individual clades were identified through phylogenetic analysis as described above, and manually annotated to allow interrogation of SIT transcripts at the clade level. Additionally, annotations for urea transporters 1 and 2 were grouped together because of their close phylogenic relationship and shared abundance pattern in response to nitrogen supply (Smith et al., 2019). A similar approach for other multigene families, such as ammonium transporters and nitrate transporters, was not used because abundance of these genes in response to nitrogen supply does not appear to be clade-specific (Smith et al., 2019).
Metabolic pathway groupings
Genes indicative of nitrogen limitation were selected based on culture-based studies characterizing the response of the diatom Phaeodactylum tricornutum to depletion and replenishment of nitrate, nitrite, and ammonia (Smith et al., 2019). Using independent transcriptomic studies of Si-depleted and replenished Thalassiosira pseudonana cultures (Shrestha et al., 2012; Smith et al., 2016; Brembu et al., 2017a), we identified a subset of genes conserved across those studies in either their response to silicon starvation or association with silica production and denote these here as SiLA (Si-limitation associated) or SiPA (silica production associated), respectively. SiLA genes were identified as those with a >2-fold increase in transcript abundance >4 h-post Si-starvation and that did not increase expression in response to Si replenishment. Similarly, SiPA genes were identified as those with a >2-fold increase in transcript abundance >4 h-post Si replenishment and did not increase expression in response to Si starvation. The 2-fold threshold was used to provide confidence that the response would be robust while the response time of >4 h was chosen to exclude genes involved in the initial response to changes in Si(OH)4 concentration and ensure that the change in expression was persistent. The rationale for this is that for the expression of a gene to be useful as a molecular marker in natural communities, it should be robust and persistent given that the biogeochemical history of a phytoplankton community is usually unknown prior to sampling. Putative T. pseudonana SiLA and SiPA genes were screened for RXL and KXXK silaffin motifs as described above. Gene annotations included for carbon metabolism included genes from T. pseudonana CCMP 133, F. cylindrus CP 1102, and P. tricornutum CCAP 1055 included in the KEGG modules: carbon fixation in photosynthetic organisms, photosynthesis, photosynthesis - antennae protein, as well as KEGG class-3 modules for ATP synthesis and carbon fixation. Genes annotated as carbonic anhydrase, DIC uptake, and flavodoxin were also included.
Statistical analysis
The normalization and differential abundance analysis of metatranscriptome data was analyzed within each taxonomic group using edgeR v.3.32.1 (Robinson et al., 2010). Significance between samples was determined using exactTest with tagwise dispersion and corrected for multiple testing with a significance threshold of FDR<0.05 (Benjamini and Hochberg, 1995). Significant differential abundance of genes related to carbon, nitrogen, and silicon metabolism was visualized through heatmaps. Differential enrichment of gene sets was assessed using mroast within the limma v.3.50.3 package with default settings (Wu et al., 2010) which assigns statistical significance to a set of genes within a metabolic pathway of interest and returns the number of genes detected (n), the percent of the gene set that was differentially expressed, and the p-value.
Principle component analysis was performed using the log-transformed normalized counts for the 2500 most variable genes and supplemental environmental data. PCA biplots were created with ggplot2 v.3.3.5 and factoextra v.1.0.7.
Data deposition
All cruise related data can be accessed through the Biological and Chemical Oceanography Data Management Office project number 550825 (https://www.bco-dmo.org/project/550825). All raw sequence data have been deposited in the NCBI sequence read archive and can be accessed under BioProject accession no. PRJNA790068 (BioSample accession nos SAMN11263639 and SAMN24193217-SAMN24193233). The assembled orfs and associated counts and annotation files used in this study can be found at Dryad.
Results
This study was part of the “DYE labeling of diatom silica” (DYEatom) cruise (PS1312; 27 June–05 July 2013) that set out to examine the response of diatom communities to a range of Si(OH)4 concentrations within the CUZ (Kranzler et al., 2019; Krause et al., 2020). Upwelling favorable conditions near Monterey Bay over the 10 days prior to the start of the cruise, 10-21 June 2013, coincided with decreased SST (Krause et al., 2020). Satellite imagery depicted elevated (>5 µg L-1) chlorophyll a (Chl a) concentration within and northwest of Monterey Bay throughout the duration of the study (Figure 1). In situ samples from three stations (S2, S4, and S11; Figure 1) indicated the presence of substantial diatom biomass within the phytoplankton community, with Chl a and bSi concentration to 8.74 - 11.84 µg L-1 and 5.3 - 6.7 µmol L-1, respectively (Table 1).
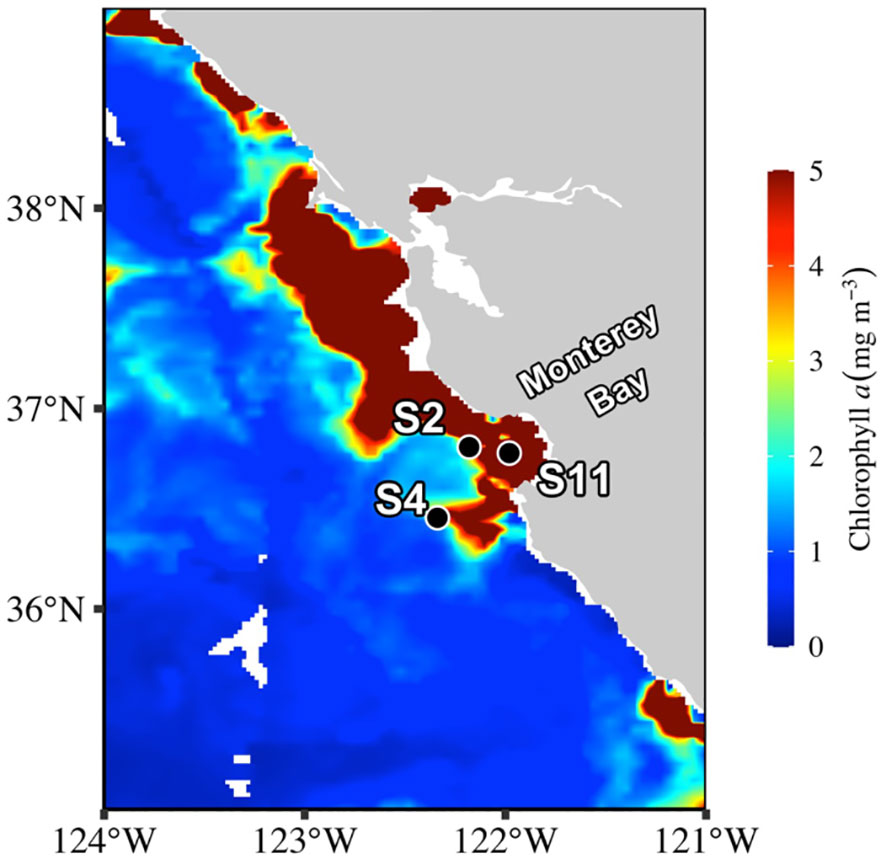
Figure 1 Sampling site locations overlayed on surface chlorophyll a concentrations from level-2 MODIS 8-day average from 2013, June 29 (https://giovanni.gsfc.nasa.gov/giovanni/).
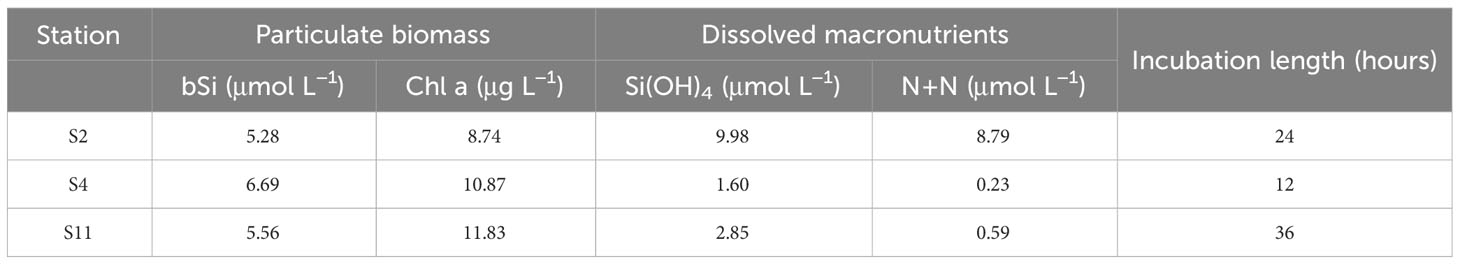
Table 1 Particulate biomass and macronutrient concentrations of initial water at each sampling site.
Initial macronutrient concentrations varied among the three stations, with the highest concentrations of NO3- + NO2-, hereafter denoted NO3-, 8.79 µmol L-1, and Si(OH)4, 9.98 µmol L-1 at S2. In contrast, the initial NO3- concentrations at both S4 and S11 were sub-micromolar, 0.23 and 0.60 µmol L-1, respectively, while Si(OH)4 concentrations were slightly higher, 1.60 and 2.85 µmol L-1, respectively. The excess Si(OH)4 relative to NO3- at S2, ~1.14:1, is typical of the Monterey Bay regime (Brzezinski et al., 1997), while the higher ratios at S4 (6.83) and S11 (4.81) may be linked to N depletion prior to station occupation. To investigate the impact of low Si and/or N on diatom physiology, bottle incubations were set up at each station with unamended controls (Ctrl) and +18 µmol L-1 Si-amended (+Si) samples.
Characterization of macronutrient status
In the first 12 h of the deckboard incubations at S2 and S11, the specific rate of silicic acid uptake (Vb) in the Ctrl treatments were similar, 0.62 - 0.66 d-1, and corresponded to a doubling of the initial bSi concentration in ~1.1 days. In contrast, Vb in the S4 Ctrl treatment was ~40% lower at 0.35 d-1 (Figure 2A). Rates measured over 24 h at S2 and S4, which both had high initial Si(OH)4 concentrations (>5 µmol L-1), were nearly identical to their respective 12 h measurements, indicating there was no diurnal pattern of Si uptake at these stations (Supplementary Table S1).
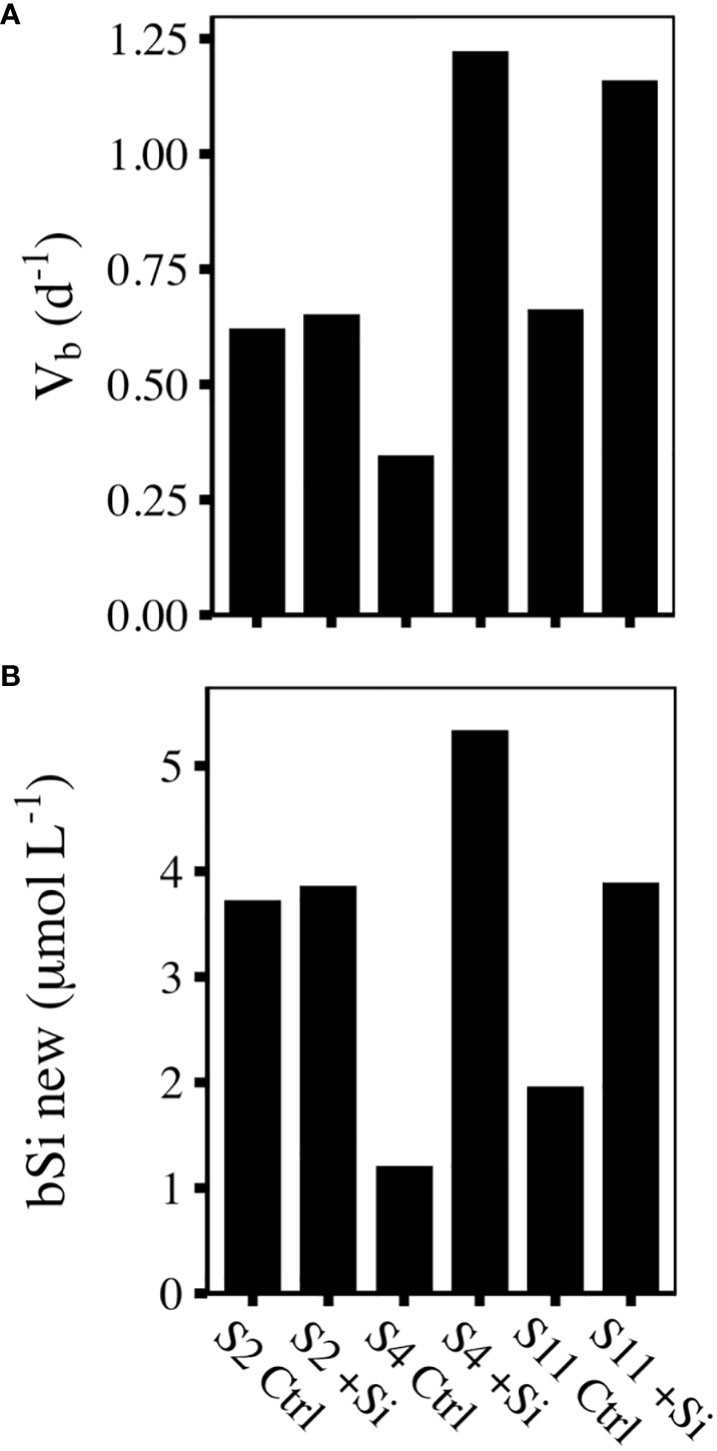
Figure 2 (A) Biomass specific Si uptake rates (d-1) and (B) new bSi produced (µmol L-1) over the first 12 h of control (Ctrl) and Si-amended (+Si) incubations at each sampling site.
Kinetic limitation of Si uptake was assessed by the ratio of Vb in Ctrl (Vamb) to +Si treatments (Venh), with values <0.3 indicative of severe Si limitation and values >0.7 indicative of no kinetic Si limitation (Nelson and Brzezinski, 1990; Krause et al., 2011). At S2, Vamb : Venh was 0.95, indicating there was no Si stress during the 24 h incubation (Supplementary Table S2). In contrast, communities at S4 exhibited signs of increasing Si stress (Vamb : Venh = 0.28) from 0-12 h, which intensified from 12 - 24 h when Vamb : Venh decreased to 0.17 (Supplementary Table S2). At S11, the community started with minor kinetic Si limitation (Vamb : Venh = 0.80 from 0-4 h), but became increasingly Si limited as Vamb : Venh decreased to 0.47 between 4-12 h (Supplementary Table S2). Although Si uptake rates were not measured at the endpoint, 36 h, of the S11 incubation, the Michaelis-Menten based model utilizing the initial biogeochemical measurements and kinetic values (see Methods) predicted low final Vamb, 0.02, and severe Si stress (Vamb : Venh = 0.03) for the Ctrl treatment (Supplementary Table S2).
In the absence of N uptake or NO3- concentration measurements at the end of each incubation, we used Vb (Eq.4) to estimate the amount of new bSi produced and, assuming a 1:1 ratio of N:Si uptake (Brzezinski, 1985), determined the likelihood of N-limitation in our incubations. At S2, 3.7 and 3.9 µmol L-1 of new bSi produced in Ctrl and +Si treatments, respectively would have only drawn down the initial Si(OH)4 and NO3- to 6.19 and 5.3 µmol L-1, which is not considered rate limiting (Figure 2B; White and Dugdale, 1997), and was unlikely to be yield limiting given the initial biomass. In contrast, at S4, the 1.2 and 5.3 µmol L-1 of new bSi produced in Ctrl and +Si treatments, respectively (Figure 2B), would have created a substantial debit against the initial 0.23 µmol L-1 of NO3- even without considering shifts in N:Si ratios of uptake of N by other taxa. Similarly, at S11, in Ctrl and +Si treatments, there was 2.0 and 3.9 µmol L-1 of new bSi produced, respectively, which would have created an associated N demand of 1.8 (Ctrl) and 2.5 µmol L-1 (+Si). Considering the initial NO3- concentration at S11 was 0.59 µmol L-1, both treatments were likely deplete of NO3- by 36 h.
Taken together, we classified each station and treatment based on the likely nutrient-driven physiological state (Supplementary Figure 1). At S2, both Ctrl and +Si treatments were classified as replete, based on the lack of Si stress and the presence of ample NO3-. At S4 and S11, the +Si treatments were considered N stressed because the amount of NO3- required to support the amount of new bSi produced exceeded the initial NO3- concentration. In contrast, the Ctrl treatments at both S4 and S11 were considered stressed by both N and Si.
Phytoplankton community composition
The relative proportion of taxonomically annotated mRNA reads from the end of each incubation showed diatoms dominated >50% of the phytoplankton transcripts at S2 and S4, but accounted for a lower percentage of transcripts at S11. Dinoflagellates and other non-diatom eukaryotes accounted for the remaining 21 - 56% of annotated mRNA reads (Figure 3C). Among the diatoms, Pseudo-nitzschia transcripts made up the majority, 52 - 87%, with the next highest representation by Leptocylindrus and Thalassiosira (1 - 15%; Figure 3D). This supports a previous description of the initial phytoplankton community based on 18s rRNA that found diatoms made up 74 - 91% of the total reads, with >90% belonging to the genus Pseudo-nitzschia (Kranzler et al., 2019; Krause et al., 2020).
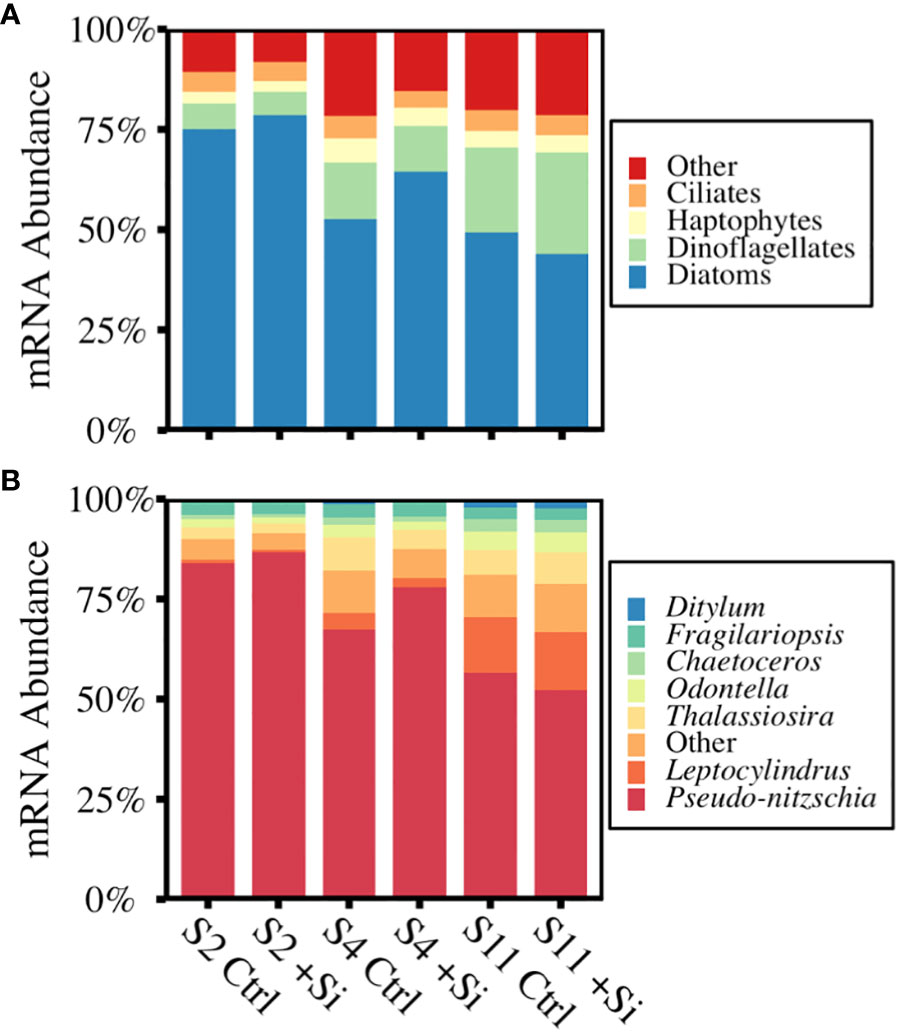
Figure 3 Percent annotated mRNA reads of the communities sampled at the end of each incubation across (A) the major phytoplankton groups and (B) diatom genera present. Data are the average of replicates (n=3).
Nutrient-driven transcriptomic response
Comparative metatranscriptomic sequence analysis was used to assess the molecular response of the diatom community to the different nutrient scenarios at each station. Principle component analysis (PCA) of the transcriptomic profiles showed substantial separation of samples based on macronutrient status. PC1 accounted for 74% of the variance between samples and primarily separated the N-replete samples at S2 (Ctrl, +Si) from the N-deplete samples (+Si) and the N- and Si-deplete samples (Ctrl) from S4 and S11 (Figure 4). Furthermore, based on the loading of the biogeochemical supplemental variables, PC1 described the absence of NO3- and presence of Chl a, informed by the high cosine square values that represented the importance of the PC to a given observation. PC2 only represented 8% of the variance between samples and appeared to separate samples by geographic location. The substantial separation between N-deplete samples relative to the N-replete sample and the small degree of separation between Ctrl and +Si samples suggests that co-occurring Si stress did not add to the transcriptomic changes that were already occurring due to N stress.
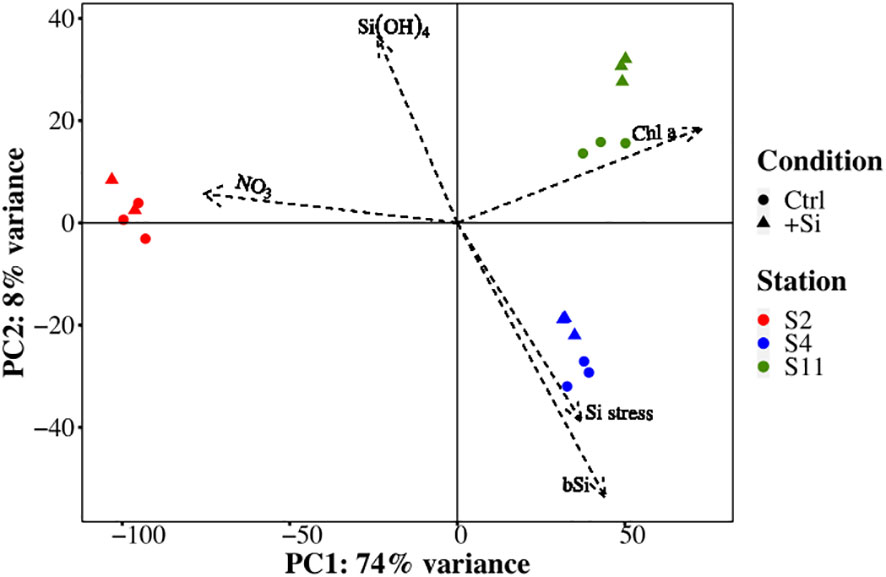
Figure 4 Principle component analysis biplot of gene transcript abundance (loading of principle components) and the relationship with treatment (shape), sampling site (color), and supplemental environmental variables.
To interrogate the transcriptomic response of the diatom community to the differing nutrient regimes, a focused rotation gene set testing (ROAST) approach (Wu et al., 2010) was used in combination with individual gene expression analysis. While gene-by-gene comparisons are useful for assessing the expression of key, rate-limiting steps within a metabolic pathway, a multivariate approach for gene set analysis (GSA) is considered more robust (Rahmatallah et al., 2014). The response to N stress was characterized by comparing the gene expression profiles between replete (Ctrl and +Si treatments at S2) to N deplete samples (+Si treatments at S4 and S11; Supplementary Figure 1). Expression profiles of samples that were both N and Si deplete (Ctrl treatment at S4 and S11) were compared to replete samples (Ctrl and +Si treatments at S2) to assess the response to co-occurring N and Si stress. Lacking samples that exclusively experienced Si stress, the response to Si stress was assessed by comparing samples that experienced both N and Si stress (Ctrl treatments at S4 and S11) to those that were solely N stressed (+Si treatments at S4 and S11; Supplementary Figure 1). These comparisons can potentially disentangle the Si stress response from the shared response to N stress and identify changes in transcript abundance that explain the lower silica production rates in the communities experiencing co-occurring N and Si stress relative to those experiencing exclusively N stress. Furthermore, we aimed to identify transcriptomic changes that could be attributed to kinetic Si limitation and/or triggered by the interplay between Si and N stress. Given the dominance of Pseudo-nitzschia transcripts, the subsequent sections focus on this genus, but when available, leverage data from Thalassiosira and Leptocylindrus to highlight conserved responses.
Carbon metabolism
The GSA of carbon assimilation-related genes in Pseudo-nitzschia, which include genes related to the light harvesting complex (LHC), photosynthetic electron transport (pet), photosystem I (psa), photosystem II (psb), and glycolysis, revealed a significant proportion of the gene set had lower transcript abundance under N stress relative to replete conditions (n=40, 78% of gene set, FDR<0.001; Figure 5). Carbon assimilation gene sets in Thalassiosira and Leptocylindrus also decreased (Thalassiosira: n=56, 80% of gene set, FDR<0.001; Leptocylindrus: n=29, 55% of gene set, FDR<0.001; Supplementary Dataset 1). Compared to replete conditions, similar reductions were observed when both N and Si stress were present (n=40, 78% of gene set, FDR<0.001, Figure 5), but interestingly, when comparing N- and Si-stressed communities to N-stressed communities, Si stress appeared to up-regulate carbon assimilation relative to N stress (n=40, 43% of gene set, FDR<0.01, Figure 5). This was also apparent on an individual gene level where transcripts for some genes were less abundant under N stress, but more abundant under Si stress (FDR<0.05; Figure 6A). This included genes involved in the pentose phosphate pathway – PGK and PRK; glycolysis – TPI; the citric acid cycle – PEPC; and photosystem II – psb27, psb28, psbO, and psbU.
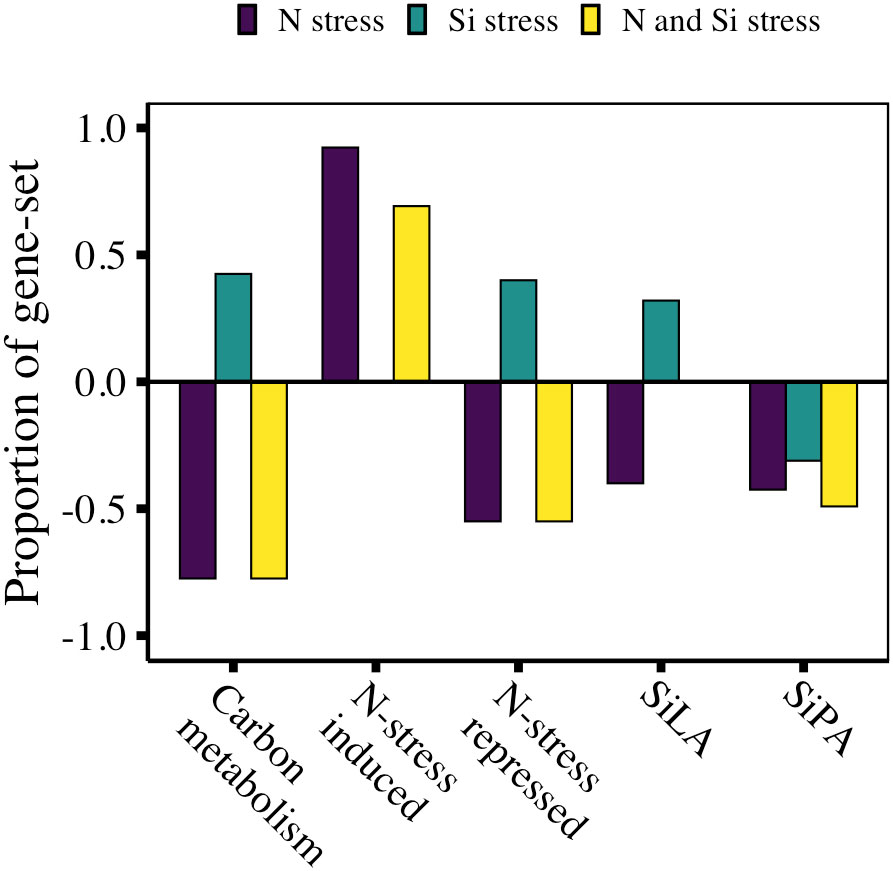
Figure 5 Gene set expression analysis showing the proportion of gene set for each metabolic pathway for Pseudo-nitzschia assemblages under N stress, Si stress, or N and Si stress. Summary statistics for GSA are provided in Supplementary Dataset 1.
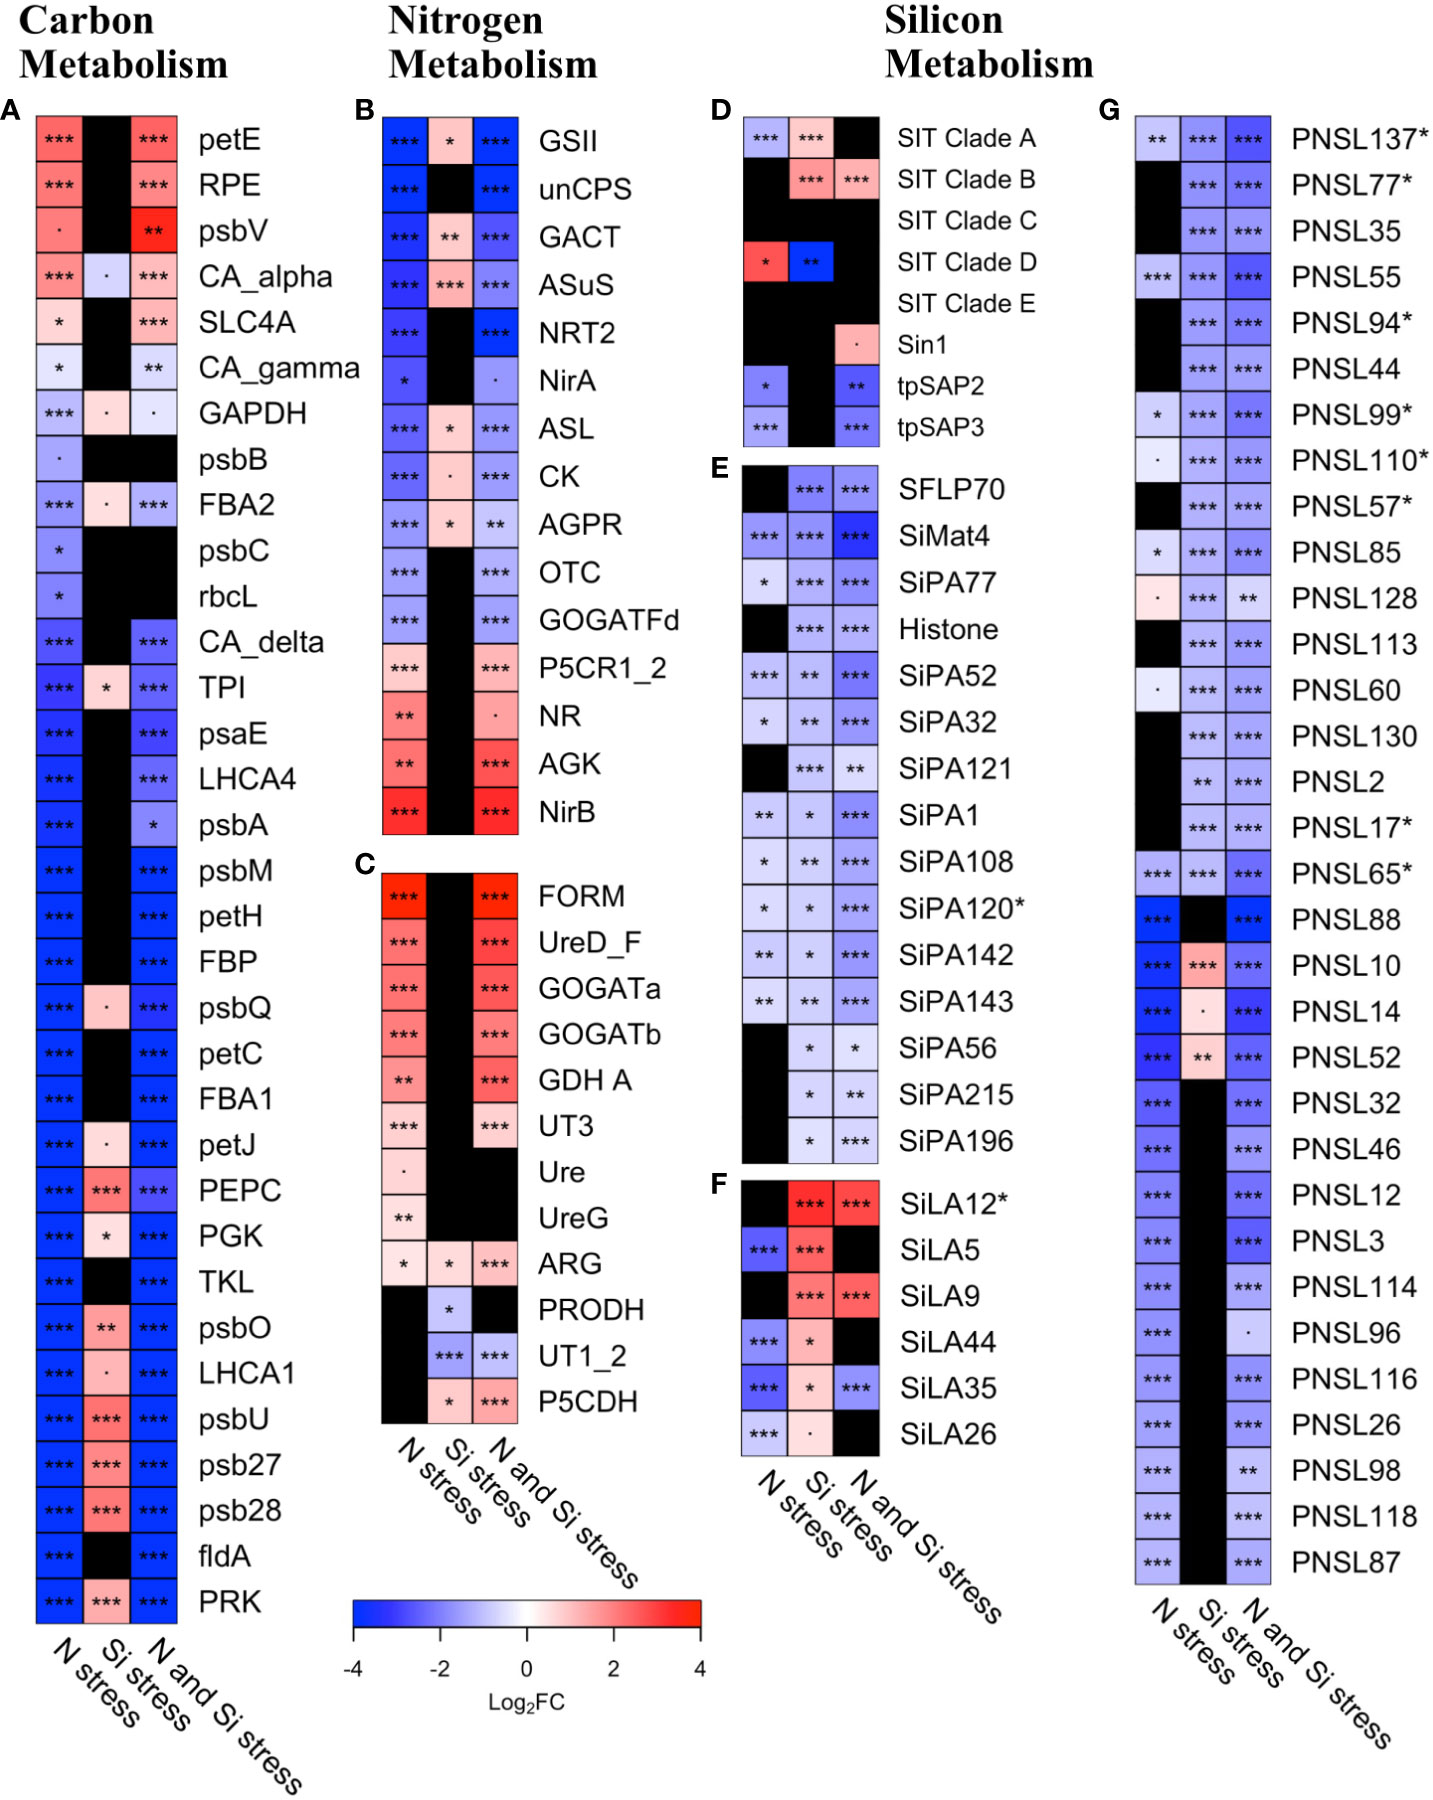
Figure 6 Heatmap of transcript abundance (log2 fold-change) for Pseudo-nitzschia under Si, N, or N and Si stress for (A) carbon metabolism genes (B) genes expected to be repressed under N-stress (N-stress repressed), (C) genes expected to be induced under N-stress (N-stress induced), (D) silicon transporters, Sin-1, and tpSAPs, (E) silica-production associated (SiPA) genes, (F) Si-stress associated genes (SiLA), and (G) Pseudo-nitzschia silaffin like (PNSL) genes. Black boxes indicate genes that were not differentially abundant. Asterisks denote the false discovery rate (FDR):·< 0.1, *< 0.05, **< 0.01, ***< 0.001. Abbreviations are as follows A) Phosphoribulokinase (PRK), Flavodoxin (fldA), photosystem II 13kDa protein (psb28), photosystem II protein (psb27), photosystem II PsbU protein (psbU), light-harvesting complex I chlorophyll a/b binding protein 1 (LHCA1), photosystem II oxygen-evolving enhancer protein 1 (psbO), Transketolase (TKL), Phosphoglycerate kinase (PGK), Phosphoenolpyruvate carboxylase (PEPC), cytochrome c6 (petJ), photosystem II oxygen-evolving enhancer protein 3 (psbQ), Fructose bisphosphatase (FBP), ferredoxin–NADP+ reductase [EC:1.18.1.2] (petH), photosystem II PsbM protein (psbM), photosystem II P680 reaction center D1 protein [EC:1.10.3.9] (psbA), light-harvesting complex I chlorophyll a/b binding protein 4 (LHCA4), photosystem I subunit IV (psaE), Triose phosphate isomerase (TPI), Carbonic anhydrase_delta (CA_delta), Ribulose-1,5-Bisphosphate carboxylate, large subunit (rbcL), photosystem II CP43 chlorophyll apoprotein (psbC), FBA class 2 (Fructose-1, 6-bisphosphate aldolase, FBA2), photosystem II CP47 chlorophyll apoprotein (psbB), Glyceraldehyde-3-phosphate dehydrogenase (GAPDH), carbonic anhydrase_gamma (CA_gamma), solute carrier family 4 (anion exchange, SLC4A), carbonic anhydrase_alpha (CA_alpha), photosystem II cytochrome c550 (psbV), Ribulose-5-P (Ru-5-P) epimerase (RPE), plastocyanin (petE), Formamidase (FORM), Urea active transporter, mitochondrial (UT3), proline dehydrogenase (PRODH), Urease (Ure), mitochondria (GDH A), Urea transporter, extracellular (UT1_2), arginase (ARG), 1-pyrroline-5-carboxylate dehydrogenase (P5CDH), UreaseG (UreG), UreaseD_F (UreD_F), Cyanate lyase (CL), mitochondria (GOGATb), mitochondria (GOGATb); C) ornithine carbamoyl transferase, mitochondrial (OTC), Argininosuccinate synthase (ASuS), N-acetyl-gamma-glutamyl-phosphate reductase (AGPR), Glutamine synthetase, chloroplast (GSII), Carbamoyl phosphate synthase (ammonia, unCPS), pyrroline-5-carboxylate reductase (P5CR1_2), Glutamate synthase (ferredoxin), chloroplast (GOGATFd), Nitrate transporter (NRT2), Nitrate reductase (NADH) (NR), Carbamate kinase (CK), acetylglutamate kinase (AGK), Ferredoxin-Nitrite Reductase (NirA), glutamate N-acetyltransferase (GACT), Nitrite reductase (NADPH), chloroplast (NirB), Si matrix protein 4 (SiMat4), silicon transporter (SIT). Asterisks next to gene names denote those that are specific to diatoms. Summary statistics are provided in Supplementary Dataset 2.
Nitrogen assimilation
The transcriptomic response to N availability consists of genes that are expected to increase in response to N limitation (N-stress induced) and those expected to decrease (N-stress repressed). Consistent with a culture study of T. pseudonana (Smith et al., 2019), N-stressed Pseudo-nitzschia was significantly enriched with N-stress induced genes (n=13, 92% of gene set, FDR<0.001, Figure 5). Of the N-stress repressed genes, 55% of the gene set was less abundant in N-stress compared to replete conditions (n=20, FDR<0.001, Figure 5). On an individual gene level, there was a small subset of genes typically repressed under N-limited conditions that were significantly (FDR<0.05) more abundant in our analysis – ferredoxin-independent nitrite reductase (nirB, 6.6-fold), nitrate reductase (NR, 3.9-fold) and acetylglutamate kinase (AGK, 4.5-fold; Figure 6B).
When N and Si stress co-occurred, GSA of N-stress induced and N-stress repressed gene sets recapitulated the pattern observed under N stress alone (Figure 5). However, similar to C assimilation, Si stress appeared to reverse the pattern of expression of N-stress repressed genes, enriching them on both a gene set (n=20, 40% of gene set, FDR<0.01, Figure 5) and individual gene level (Figure 6B). For example, transcripts for glutamine synthetase (GSII) and glutamate N-acetyltransferase (GACT), were more abundant under Si stress, and less abundant under N stress (Figure 6B). Si stress also appeared to reduce the transcript abundance of two urea cycle-related genes, proline dehydrogenase (PRODH, 1.8-fold) and urea transporters 1 and 2 (UT1_2, 3.0-fold; Figure 6C), neither of which were altered under N stress alone.
Silicon metabolism-related genes
The impact of N and Si stress on Si metabolism was explored by examining changes in transcript abundance of individual genes with well-described roles in silicification. Transcripts of clades A and D SITs were both significantly differentially abundant under N stress with clade A SITs being 2.4-fold less abundant and clade D SITS being 5.3-fold more abundant compared to the replete condition (FDR<0.05; Figure 6D). In contrast, while Si stress led to a 1.7-fold increase in transcript abundance of clade A SITs and an 8-fold decrease in clade D SIT transcript abundance (FDR<0.05). These opposing impacts of N and Si stress on SIT transcript abundance manifested as no significant change in clades A and D transcript abundance under co-occurring N and Si stress (Figure 6D). In contrast, transcript abundance for clade B SITs were 3.2-fold elevated (FDR<0.001; Figure 6D).
There was no significant impact of any of the stress regimes on the transcript abundance of cingulins or silicidins, proteins in the silaffin-like family that play a role in silica polymerization. Transcripts for two silicalemma-associated proteins – tpSAP2 and tpSAP3 – were significantly less abundant under N stress (4.0- and 2.8-fold, respectively, FDR<0.05), as well as under combined N and Si stress (5.3- and 4.3-fold, respectively, FDR<0.05, Figure 6D). This appeared to be driven primarily by N stress as the abundance was not significantly different under Si stress (Figure 6D). Transcripts for Silicanin-1 (Sin-1) were 2.5-fold more abundant only under combined N and Si stress (FDR=0.05, Figure 6D). Although, silaffins directly facilitate the polymerization of silica in diatoms (Kröger et al., 2002), the gene sequences are not well-conserved, precluding the identification of them in metatranscriptomes through homology-based searches. Therefore, the Pseudo-nitzschia genome was screened using established guidelines (see Methods) to identify putative Pseudo-nitzschia silaffin like genes (PNSLs). Of the 157 candidates identified in the genome, 142 were detected across all of the metatranscriptomes (Supplementary Dataset 2). When bSi production was low, as was the case in samples with co-occurring N and Si stress (Supplementary Table S1), 45 of the 68 significantly differentially abundant PNSLs were lower when compared to replete conditions (1.5- to 8-fold, FDR<0.05, Figure 6G, Supplementary Dataset 2), consistent with their predicted role in silica production. Similarly, under Si stress, the majority of the >1.5-fold differentially expressed PNSLs were less abundant (21 out of 24, Figure 6G, Supplementary Dataset 2). There was a more even distribution of differentially abundant PNSLs (29 more abundant, 24 less abundant) when N-stressed samples were compared to replete samples, possibly related to the bSi production rates being similar in these conditions, or that some of the PNSL candidates identified in silico may not be true silaffins. In a more rigorous analysis, the 8 putative PNSL genes that are found only in diatoms were specifically assessed (Figure 6G). Intriguingly, all eight (PNSL17, PNSL57, PNSL65, PNSL77, PNSL94, PNSL99, PNSL110, PNSL137) were less abundant in the combined N- and Si-stressed samples when bSi production was low. Only two of these (PNSL65 and PNSL137) were also less abundant in N-stressed samples compare to replete, while the remaining six were unaffected by N-stress alone, highlighting that these six are strong candidates for a role in silica production.
To identify other potential silicification-related genes a priori, we leveraged multiple transcriptomic culture-based studies that investigated the response of diatoms to Si starvation and subsequent Si replenishment (Shrestha et al., 2012; Smith et al., 2016; Brembu et al., 2017a). Comparing these distinct datasets, a subset of 230 Si starvation and 48 Si replenishment genes were identified and termed Si-limitation associated (SiLA) and silica production associated (SiPA) genes, respectively (Supplementary Dataset 2). Although the majority of these genes are annotated as hypothetical proteins with no known function, their conserved expression profile across different studies suggests they play a role in some aspect of silicon metabolism. Of the 278 total genes identified, 25 SiLA and 106 SiPA genes were detected in Pseudo-nitzschia. GSA revealed that 40% and 42% of the SiLA and SiPA gene sets, respectively, were less abundant under N stress compared to replete conditions (FDR≤0.001; Figure 5). When N- and Si-stress co-occurred, 49% of the SiPA gene set was less abundant (n=106, FDR<0.001) than replete conditions, but there was no significant difference in transcript abundance of the SiLA gene set. Interestingly, when N- and Si-stressed samples were compared to N-stressed samples, the additional Si stress had minimal impact on SiLA and SiPA abundance. Only 32% of SiLA gene sets were more abundant (n=25, FDR<0.01) and 31% of SiPA gene sets were less abundant (n=106, FDR<0.01) in Si-stressed Pseudo-nitzschia.
On an individual gene level, there were 5 SiLA genes (SiLA5, SiLA9, SiLA12, SiLA35, SiLA44) that were significantly more abundant when Si stress was present (1.6-6.5 fold, FDR<0.05, Figure 6F). Two of these, SiLA9 and SiLA12, were among the most highly differentially abundant genes within the SiLA gene set and were also significantly more abundant when N and Si stress co-occurred (4.8- and 5.6-fold, respectively). Both were also unaffected by N stress alone, highlighting a potential role of these two genes in a response to Si stress. Both encode for hypothetical proteins, with SiLA12 being found only in diatoms.
Within the SiPA gene set, of the 15 genes that significantly differentially abundant in Si-stressed samples (1.5-4.3-fold), the majority of them (11) were less abundant compared to samples that were not Si stressed (Figure 6E). This is consistent with a role for SiPAs in bSi production as the rate of bSi production was low in the Si-stressed samples (Supplementary Table S1). Similarly, 68% of the differentially abundant SiPA genes (25 out of 37, 1.7-7.5-fold) were lower when N and Si stress co-occurred, where bSi production was also low, compared to replete. There were 28 SiPA genes with significantly different transcript abundances during N stress compared to replete, with 11 being more abundant (2.2-8.3-fold) and 17 being less abundant (1.5-5-fold; Figure 6E). Given that bSi production was high under both replete and N-stressed conditions (Supplementary Table S1), these particular SiPAs may be more representative of a response to N stress than an association with bSi production.
Discussion
Persistence and physiological status of Monterey Bay diatom blooms
Satellite imagery and biogeochemical stock measurements revealed a persistent phytoplankton bloom in and near Monterey Bay during the study period dominated by the diatom Pseudo-nitzschia. Blooms of Pseudo-nitzschia were observed in the three years preceding this study (McCabe et al., 2016), making the Monterey Bay area a “hot spot” for this toxigenic diatom (Trainer et al., 2000; Trainer et al., 2012). The addition of Si in bottle incubations led to an increase in the specific rate of Si(OH)4 uptake at 2 of the 3 stations (S4 and S11), despite low concentrations of NO3-. This may have been supported by regenerated sources of N, but may also be due to the plasticity of diatoms to repartition intracellular N and reduce cellular Si quotas when nutrients are growth limiting. It is reasonable to presume that co-addition of Si(OH)4 and NO3- would have stimulated diatom bSi production even more. Regardless, increased Si uptake upon Si(OH)4 addition demonstrates that the diatom communities at these stations were substrate-limited. Ambient Si uptake rates that were a low fraction of saturated rates (Vamb : Vmax< 0.3) suggest the Si stress was severe and near the threshold (~0.25) used to infer when diatoms likely progress beyond kinetic Si limitation and into growth limitation (Martin-Jézéquel et al., 2000). The dramatically reduced bSi production rate in these samples is also consistent with Si-limited growth (Paasche, 1973; Brzezinski et al., 1990). However, sub-micromolar concentrations of NO3- suggests there was likely simultaneous N stress, even if the diatoms were utilizing Si:N in a ratio lower than the typical 1.1:1 when conditions are optimal (Brzezinski, 1985). Although not directly measured, organic nitrogen also appeared to be limiting given the increased abundance of transcripts for genes associated with the urea cycle. In contrast, station S2 had moderately high concentrations of both Si(OH)4 and NO3- and an Si stress value of 0.95, indicating the diatom communities were unlikely to be stressed by Si or N. Taken together, we categorized our bottle treatments as nutrient replete (Ctrl and +Si at S2), N stressed (+Si at S4 and S11), or both N and Si stressed (Ctrl at S4 and S11) allowing us to evaluate the molecular response of Pseudo-nitzschia to each scenario.
The diatom community transcriptomic profile is driven more by N stress than Si stress
There was a far greater number of transcripts altered by N stress than Si stress in Pseudo-nitzschia. Transcriptomic profiles exhibited a large degree of separation along PC1 that explained ~75% of the variance and correlated with NO3- concentration (Figure 4). In contrast, there was only a modest separation between Si-replete and Si-stressed samples even at the two stations (S4 and S11) where Si(OH)4 amendment showed a significant response by the diatom community. This was somewhat unexpected given culture studies have shown a clear transcriptomic response of diatoms to Si(OH)4 availability (Shrestha et al., 2012; Smith et al., 2016; Brembu et al., 2017a). One explanation may be that because Si stress co-occurred with N stress, any additional impact on gene expression already imposed by N stress was minor. Given that stress induced by either low N or Si can result in slowed growth and cell cycle arrest (Olson and Chisholm, 1986; Vaulot et al., 1987; Brzezinski et al., 1990; Du et al., 2014), there may be a general macronutrient stress response that minimizes any additive response when both nutrients are limiting. Alternatively, as silicon is primarily required for cell wall synthesis, there may be only a small fraction of genes that are specific to silicon metabolism.
Si stress dampens the molecular response to N stress
A gene set analysis approach to elucidate changes in key metabolic pathways (Figure 7) was used to attribute changes in cellular physiology to specific nutrient stress responses. As changing nutrient concentrations can have a complex and cascading impact on genome-wide transcription and physiology (Smith et al., 2019), interpretation of metatranscriptomic data is still dependent on, and in some cases lacking, a strong foundation of how transcript abundance should be expected to change under individual and multi-stressor environmental conditions (e.g. macronutrients, vitamins, trace metals, temperature, diurnal rhythm). Even individual genes that are strong transcriptomic markers of a seemingly single process may be unreliable in a mixed community exposed to a multitude of varying environmental conditions. For example the diatom iron-starvation-induced-protein 2A and ferritin, both of which have been used as indicators of Fe limitation, are also strongly modulated by N availability, likely because both of these limitation scenarios impact photosynthetic processes (Bender et al., 2014; Marchetti et al., 2017). Another example where cross-talk between metabolic pathways can complicate interpretation is in the case of phosphorus limitation where the expression pattern of two “highly nitrate sensitive” genes – nitrate reductase and glutamine synthetase (Smith et al., 2019) – is also regulated by phosphorus availability (Helliwell et al., 2021). With an increase in available reference genomes and transcriptomes, extensive mapping of metabolic pathways (Armbrust et al., 2004; Bowler et al., 2008; Keeling et al., 2014; Tully et al., 2018), and the increasing availability of culture-based, genome-wide expression data under numerous conditions (Thamatrakoln et al., 2012; Nymark et al., 2013; Alipanah et al., 2015; Brembu et al., 2017b; a; Smith et al., 2019; Moreno et al., 2020), analysis of larger gene sets of metabolic processes provides a more robust and reliable method to infer cellular physiology (Rahmatallah et al., 2014).
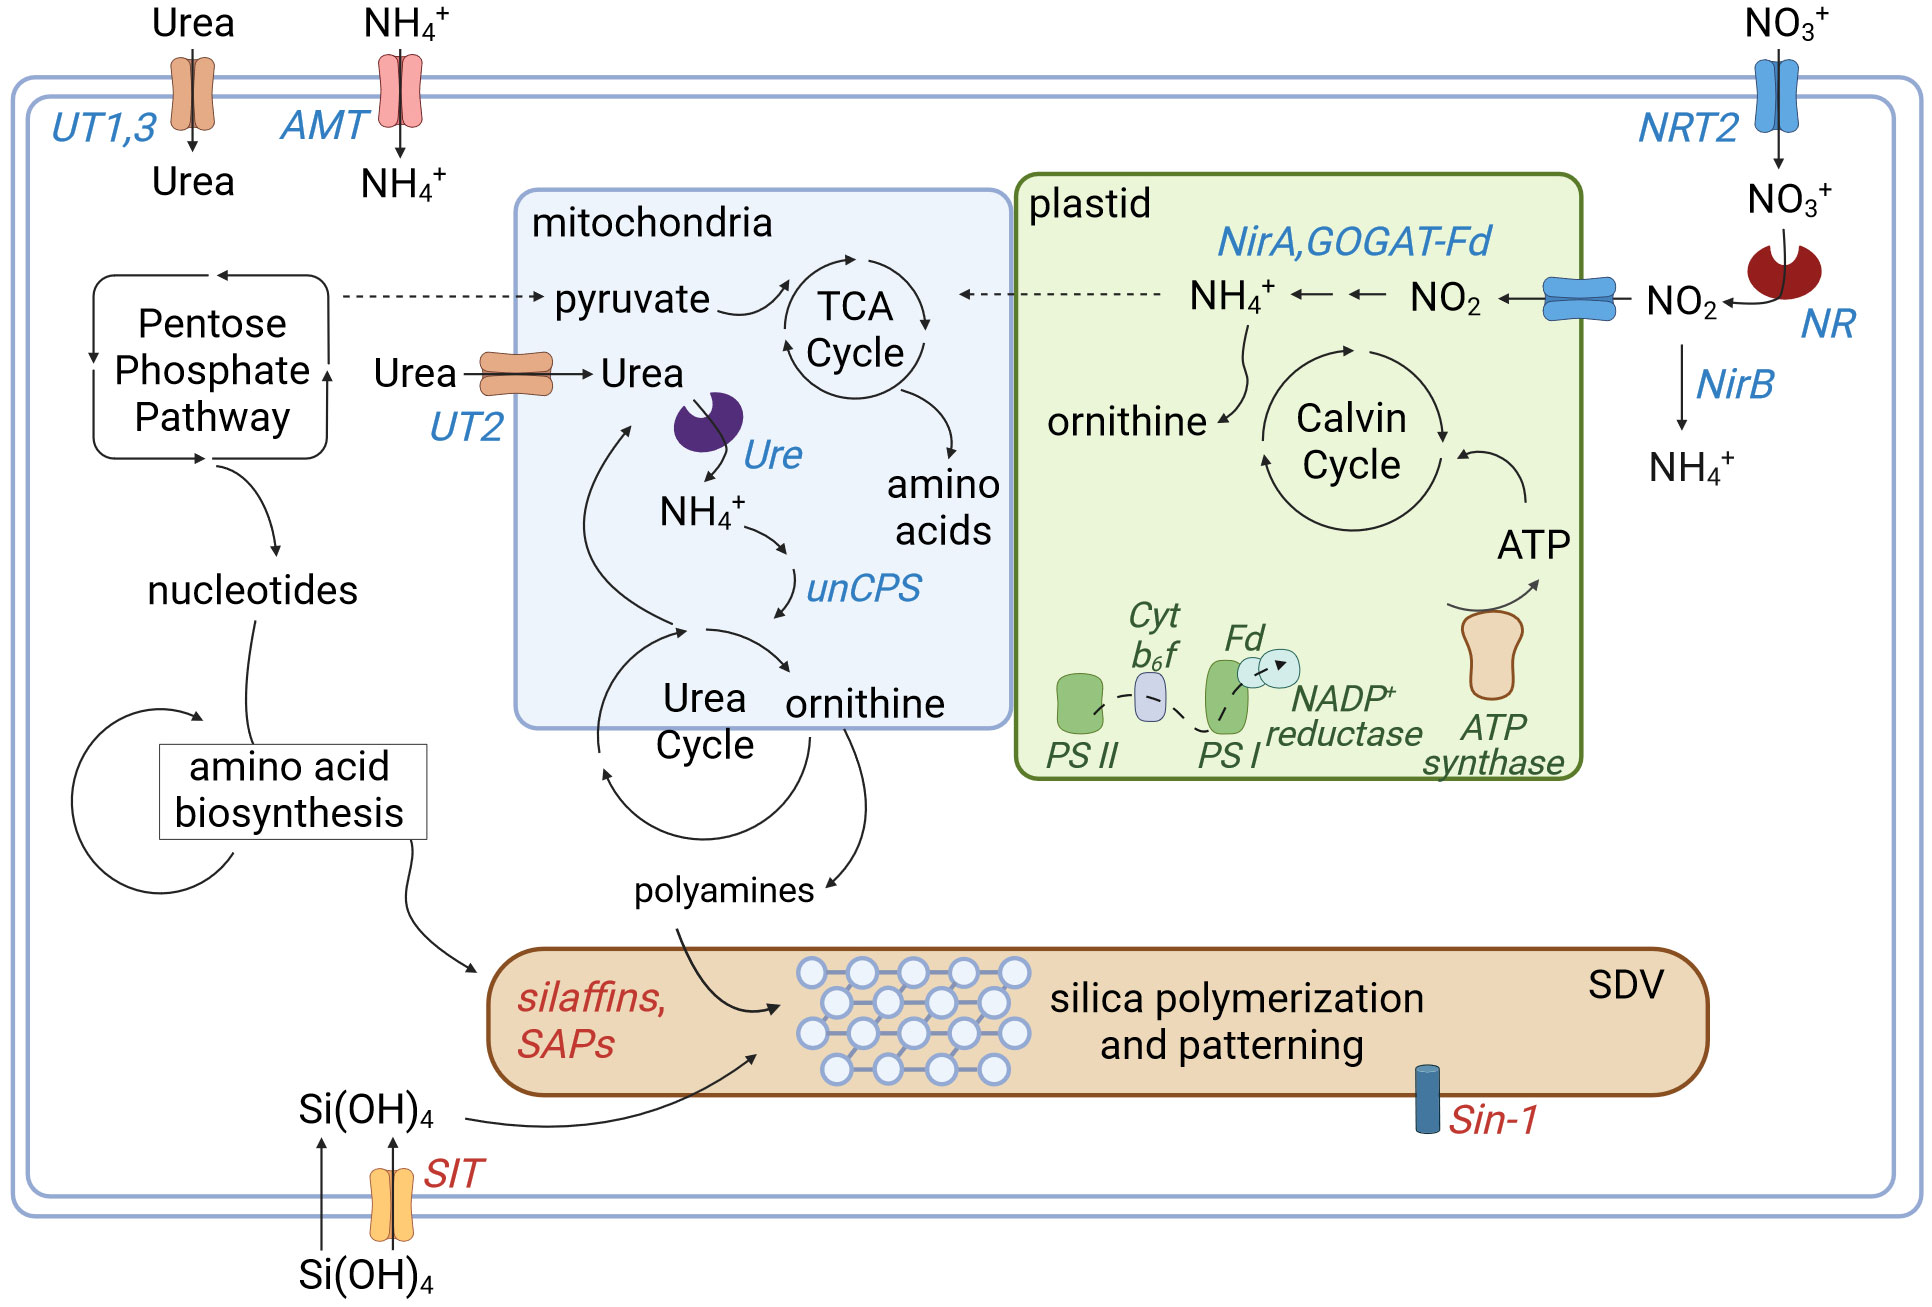
Figure 7 Simplified schematic depicting cellular nitrogen, carbon, and silicon metabolism. Genes associated with proteins involved in nitrogen metabolism are shown in blue, carbon in green and silicon in red with arrows depicting the general movement of molecules. The SDV denotes the silica deposition vesicle where silica polymerization and patterning of the frustule occurs. Abbreviations are listed in Figure 6. Created with BioRender.com.
The transcriptomic changes driven by N stress resulted in substantial decreases in the expression of genes involved in carbon metabolism and those expected to decrease in response to N stress (e.g. N-stress repressed), consistent with changes observed in culture studies (Bender et al., 2014; Smith et al., 2019). Similar decreases were observed when both N- and Si- stress co-occurred. However, in Si-stressed Pseudo-nitzschia, 43% and 40% of the carbon assimilation and N-stress repressed gene sets increased, respectively, reversing the decreases observed in samples were N- alone or N- and Si-stressed. This reversal of expression was even more apparent on an individual gene level. For example, where genes associated with photosystem II (e.g psbU, psb27, and psb28) were ~15-fold less abundant under N stress, the same genes were only 10-11-fold less abundant under N- and Si-stress, offset by the ~4-fold increase in abundance observed when Si stress was present. Furthermore, there was a decrease in the abundance of genes associated with the urea cycle (UT1_2, PRODH) under Si stress. Given that polyamines, produced by the urea cycle, are required for silica precipitation and pattern formation (Kröger et al., 2000), decreased expression of these genes may reflect a reduction in the cellular N demand. Taken together, we posit that growth-limiting concentrations of Si insulate Pseudo-nitzschia from further impact imposed by low concentrations of N, rather than low Si and N acting synergistically and intensifying cellular physiological stress. Such a response is consistent with Liebig’s Law of the Minimum that states growth is ultimately controlled by a single macronutrient (Liebig, 1840; Rhee, 1978).
Si limitation as an ecological advantage
De La Rocha and Passow (2004) proposed that Si limitation of diatoms confers an ecological advantage by slowing growth through limitation of cell wall synthesis such that diatoms are able to maintain key cellular constituents (e.g. proteins and chlorophyll) that allow them to more rapidly respond to episodic nutrient injection events, such as those that occur during upwelling. If the cell division rate of diatoms is set by the speed at which the silicified cell wall can be produced, carbon and nitrogen metabolism may become insulated from the nutrient regulating growth (i.e. Si) and can adjust independently beyond the adjustments necessary to accommodate slower growth imposed by Si limitation. While physiological adjustments in response to low levels of non-growth-limiting macronutrients are possible, such responses may be independent of the response to Si, which is largely confined to cell wall formation. This would explain how Si-starved diatoms maintain near Redfield C:N ratios and the capacity to rapidly recover upon Si replenishment (De La Rocha and Passow, 2004). Although we did not sample diatom assemblages that were solely Si limited, our data illustrates relatively minimal impact of additional Si stress on N-stressed diatom assemblages. Although we cannot discern how much of the N-stress response would have occurred under Si stress alone, it is clear that the addition of Si stress dampened the cellular impact of N stress, corroborating previous work that demonstrated the efficiency of Si-limited diatoms to recover upon Si replenishment (Flynn and Martin-Jézéquel, 2000; De La Rocha and Passow, 2004).
Potential transcriptomic markers of bSi production or Si stress
Despite the numerous studies exploring the molecular regulation of silicon metabolism in diatoms (Mock et al., 2008; Shrestha et al., 2012; Smith et al., 2016; Brembu et al., 2017a), we still lack a comprehensive molecular framework for silicification. Therefore, using a holistic, a priori approach, we leveraged culture-based transcriptomic studies to identify a putative subset of SiLA and SiPA genes. GSA revealed that neither of these gene sets had a particularly strong transcriptomic response to Si stress with only ~30% of the gene sets being differentially expressed compared to non Si-stress conditions. In addition, transcript abundance of several SiPA genes appeared more affected by N depletion rather than exclusive Si stress. This does not exclude the possibility that these genes are directly involved in silicification, but rather the lack of response to Si may be due to feedbacks between slower growth under N stress that demand a reduction in the rate of cell wall formation (Harrison et al., 1977).
Given that a large proportion of both SiLA and SiPA gene sets are hypothetical or proteins with unknown function, many of them may not be specifically involved in silicon metabolism, but rather play a general role in growth, cell cycle progression, or the cytoskeleton. It might also be because the gene sets were derived from T. pseudonana and, given the striking lack of shared genes among relatively closely related diatom species (Bowler, 2008), may simply not have homologs in Pseudo-nitzschia, which was the focus of our analysis here. However, the low proportion of differentially abundant transcripts of genes involved with carbon metabolism and nitrogen assimilation supports the notion that additional Si stress had a relatively minor effect on the already N-stressed community. It is also possible that although Pseudo-nitzschia was numerically dominant, it may not have been responsible for the equivalent proportion of the community silica production or may not have experienced the bulk of the measured Si stress. Indeed, taxon-specific differences in silica production have been observed in mixed communities and relatively minor constituents of the community can be the major contributors (McNair et al., 2018a; McNair et al., 2018b).
Although powerful in contextualizing the physiological state of cells to changing environmental conditions, gene set analysis is most powerful when applied to well-characterized and well-defined metabolic pathways, which is not the case for silicon metabolism. Until there is a more comprehensive understanding of the molecular framework for silicification, our ability to harness the growing number of marine metagenomic and metatranscriptomic sequence data from individual researchers, as well as large collaborative projects such as EXPORTS (Siegel et al., 2016), BIOS-SCOPE, BioGEOTRACES (Biller et al., 2018), Global Ocean Sampling (Rusch et al., 2007), Tara Oceans (Bork et al., 2015), and Bio-GO-SHIP (Larkin et al., 2021) for understanding diatom community responses to Si availability is limited. With an interest in linking cellular metabolism with ocean processes, we aimed to test the relationship of putative silicification-related gene expression with biogeochemical stocks and rate measurements.
Through an in silico screen of the P. multiseries genome, 8 diatom-specific PNSL genes were identified in our metatranscriptomes. Intriguingly all 8 were less abundant in samples where the rate of bSi production was low, consistent with the role of silaffins in silica production (Kröger et al., 1999). While these may be candidate gene markers for silica production, poor sequence conservation among silaffin genes across species may preclude their use beyond communities dominated by Pseudo-nitzschia (Poulsen and Kröger, 2004). In contrast, high sequence conservation among genes encoding for SITs make SIT expression an attractive potential marker of silicon uptake or low Si(OH)4 concentrations given that SITs are primarily responsible for Si(OH)4 uptake at <20 µmol L-1 Si(OH)4 concentrations (Thamatrakoln and Hildebrand, 2007; Shrestha and Hildebrand, 2015). Si-stressed communities had significantly higher abundance of clade B SITs in Pseudo-nitzschia compared to non-Si stressed communities, consistent with findings in laboratory cultures (Durkin et al., 2012). However, N stress alone also altered SIT transcript abundance, decreasing clade A SIT abundance and increasing clade D SIT abundance. When Si stress co-occurred with N stress, transcript abundance of clade A and D SITs was unaffected. Taken together with previous findings that all clades of SIT genes increased in response to Fe limitation (Maniscalco et al., 2022), these data suggest SIT transcript abundance should not be used as a field marker for Si uptake or production, nor should it be used as a molecular proxy for Si limitation, as previously done (Zielinski et al., 2016), given the variable response of different clades to different nutrient stressors. It is possible that SIT protein expression might be a more reliable proxy for Si status in natural communities, given the disconnect between SIT transcript and protein abundance (Thamatrakoln and Hildebrand, 2007), but this would require further investigation. While other genes with documented roles in silicon metabolism were detected in our metatranscriptome data (e.g. cingulin, Sin-1, tpSAP2, and tpSAP3), none of them were differentially impacted by Si stress or had expression patterns consistent with a role in bSi production. Furthermore, we did not find any differentially expressed genes that were shared across the three transcriptionally dominant diatoms (Pseudo-nitzschia, Thalasssioria, and Leptocylindrus). This might be due to there not being enough reads associated with Thalassiosira and Leptocylindrus to resolve their response, but could also underscore taxon-specific differences that has been observed from both a silica production perspective (McNair et al., 2018a; b) and a transcriptomic perspective (Durkin et al., 2012). While genes that are diatom-specific have potential to be used collectively to characterize Si stress in diatom communities, a more comprehensive understanding beyond SITs and silaffin-like proteins of the molecular regulation of silicification is needed.
Interestingly, a few putative SiLA and SiPA genes emerged as potentially useful markers of silicon metabolism. SiLA9 and SiLA12 both encode hypothetical proteins in T. pseudonana (Thaps_25507 and Thapss_3250, respectively) with SiLA12 being found exclusively in diatoms. Both of these genes were more abundant when Si(OH)4 concentrations were kinetically limiting and neither were differentially abundant under N stress alone, making them potentially specific to kinetic Si limitation. Six SiPA genes (SiPA16, SiPA32, SiPA41, SiPA52, SiPA77, SiPA167) were less abundant when bSi production was low making them potential candidates as molecular markers silica production. However, SiPA52, a PT-repeat protein (Thaps_12192) and SiPA41, a silica matrix protein, SiMat4 (Thaps_25912; Kotzsch et al., 2016) were also less abundant in N-stressed assemblages. Given that producing the siliceous diatom frustule is intimately linked to cell growth and division, these particular genes might be related to a generalized response to macronutrient-limited growth. Likewise, SiPA32 (Thaps_8522), a ribonucleoside-diphosphate reductase and, SiPA167, histone H1, may be more related to DNA synthesis and nucleosome stability, respectively. SiPA41 (Thaps_4922), a subtilisin-like serine protease, is also unlikely to be specific to silica production. SiPA16 (Thaps_24597), however, encodes a protein belonging to the silaffin-like family (SFLP70; Scheffel et al., 2011), making it a strong potential marker of bSi production.
Conclusions
Through manipulative incubation experiments of a natural diatom bloom near Monterey Bay, CA, this study investigated the diatom response to N stress and co-occurring N and Si stress. Biogeochemical measurements of silica production and bulk macronutrient concentrations was used to diagnose Si and N stress along with analysis of the diatom community response using metatranscriptomics. Compared to N stress alone, combined N- and Si- stress did not lead to a substantial additive response on a transcriptomic level, implying a shared molecular response to these two stressors. Furthermore, the addition of Si stress to N-stressed communities appeared to reverse the transcriptional expression pattern of key genes involved in carbon metabolism and nitrogen assimilation, indicating a decoupling of Si and organic matter metabolism under these conditions. These findings that Si stress can dampen the impact of N limitation adds to previous ideas that Si limitation may potentially be advantageous given observations that Si-stressed diatoms recover faster than those experiencing other forms of macronutrient limitation (Flynn and Martin-Jézéquel, 2000; De La Rocha and Passow, 2004; Raven and Waite, 2004). Our results point to an additional advantage of Si stress in lessening the overall impact of other nutrient stressors in episodic environments where multiple nutrients can be simultaneously depleted. This added benefit broadens the adaptive advantages of Si stress and helps explain the prevalence of Si limitation across the global ocean including in coastal systems (Nelson and Dortch, 1996; Brzezinski and Phillips, 1997; Krause et al., 2015), high latitudes (Nelson et al., 2001; Krause et al., 2018), and deep water upwelling regions (Brzezinski et al., 2008). To the extent that the degree of Si stress in these systems limits growth diatoms that become Si limited prior to the onset of N stress will be better poised to rapidly capitalize on nutrient pulses.
We found that genes with well-characterized roles in silicon metabolism – SITs, cingulins, SAPs, and Sin-1 – do not appear to have a specific or consistent correlation with silica production or silicon stress, making them unreliable molecular markers of these processes. While Pseudo-nitzschia silaffin-like genes did appear to correlate with high silica production, lack of sequence similarity across species and taxon-specific differences in silica production may limit their utility in mixed diatom communities. Two potential markers of kinetic Si limitation and one for silica production were identified, making them ideal candidates for further study of their role in silicon metabolism.
Data availability statement
The datasets presented in this study can be found in online repositories. The names of the repository/repositories and accession number(s) can be found in the article/Supplementary Material.
Author contributions
MM: Formal Analysis, Investigation, Software, Validation, Visualization, Writing – original draft, Writing – review & editing, Data curation, Methodology, Project administration. MB: Funding acquisition, Resources, Supervision, Validation, Writing – review & editing, Conceptualization, Data curation, Investigation, Methodology, Project administration, Visualization. JK: Funding acquisition, Resources, Writing – review & editing, Investigation, Project administration, Visualization. KT: Conceptualization, Funding acquisition, Investigation, Methodology, Resources, Supervision, Validation, Writing – review & editing, Project administration, Visualization.
Funding
The author(s) declare financial support was received for the research, authorship, and/or publication of this article. We acknowledge funding from the National Science Foundation (OCE-1334387 to MB, OCE-1333929 and OCE-2049386 to KT, OCE-1155663 to JK). Computing resources were administered by the Center for Scientific Computing (CSC) with funds from the National Science Foundation (CNS-1725797). The CSC is supported by the California NanoSystems Institute and the Materials Research Science and Engineering Center (MRSEC; NSF DMR 1720256) at UC Santa Barbara.
Acknowledgments
We thank the captain and crew of R/V Point Sur. We also like to thank Janice Jones, Eric Lachenmyer, Heather McNair, Israel Marquez for assistance during the cruise.
Conflict of interest
The authors declare that the research was conducted in the absence of any commercial or financial relationships that could be construed as a potential conflict of interest.
Publisher’s note
All claims expressed in this article are solely those of the authors and do not necessarily represent those of their affiliated organizations, or those of the publisher, the editors and the reviewers. Any product that may be evaluated in this article, or claim that may be made by its manufacturer, is not guaranteed or endorsed by the publisher.
Supplementary material
The Supplementary Material for this article can be found online at: https://www.frontiersin.org/articles/10.3389/fmars.2023.1291294/full#supplementary-material
References
Alexander H., Rouco M., Haley S. T., Wilson S. T., Karl D. M., Dyhrman S. T. (2015). Functional group-specific traits drive phytoplankton dynamics in the oligotrophic ocean. Proc. Natl. Acad. Sci. U.S.A. 112, E5972–E5979. doi: 10.1073/pnas.1518165112
Alipanah L., Rohloff J., Winge P., Bones A. M., Brembu T. (2015). Whole-cell response to nitrogen deprivation in the diatom Phaeodactylum tricornutum. J. Exp. Bot. 66, 6281–6296. doi: 10.1093/jxb/erv340
Allen A. E., Dupont C. L., Oborník M., Horák A., Nunes-Nesi A., McCrow J. P., et al. (2011). Evolution and metabolic significance of the urea cycle in photosynthetic diatoms. Nature 473, 203–207. doi: 10.1038/nature10074
Armbrust V. E., Berges J. A., Bowler C., Green B. R., Martinez D., Putnam N. H., et al. (2004). The genome of the diatom Thalassiosira Pseudonana: Ecology, evolution, and metabolism. Science (1979) 306, 79–86. doi: 10.1126/science.1101156
Bender S. J., Durkin C. A., Berthiaume C. T., Morales R. L., Armbrust V. E. (2014). Transcriptional responses of three model diatoms to nitrate limitation of growth. Front. Mar. Sci. 1. doi: 10.3389/fmars.2014.00003
Benjamini Y., Hochberg Y. (1995). Controlling the false discovery rate: a practical and powerful approach to multiple testing. J R Stat Soc Series B Stat Methodol 57, 289–300. doi: 10.1111/j.2517-6161.1995.tb02031.x
Biller S. J., Berube P. M., Dooley K., Williams M., Satinsky B. M., Hackl T., et al. (2018). Marine microbial metagenomes sampled across space and time. Sci. Data 5, 1 5: 1–1 5: 7. doi: 10.1038/sdata.2018.176
Bolger A. M., Lohse M., Usadel B. (2014). Trimmomatic: A flexible trimmer for Illumina sequence data. Bioinformatics 30, 2114–2120. doi: 10.1093/bioinformatics/btu170
Bork P., Bowler C., de Vargas C., Gorsky G., Karsenti E., Wincker P. (2015). Tara Oceans studies plankton at Planetary scale. Science (1979) 348, 873. doi: 10.1126/science.aac5605
Bowler C. (2008). Genomics and evolution of microbial eukaryotes. J. Phycol. 44, 1625–1627. doi: 10.1111/j.1529-8817.2008.00613.x
Bowler C., Allen A. E., Badger J. H., Grimwood J., Jabbari K., Kuo A., et al. (2008). The Phaeodactylum genome reveals the evolutionary history of diatom genomes. Nature 456, 239–244. doi: 10.1038/nature07410
Brembu T., Chauton M. S., Winge P., Bones A. M., Vadstein O. (2017a). Dynamic responses to silicon in Thalasiossira pseudonana - Identification, characterisation and classification of signature genes and their corresponding protein motifs. Sci. Rep. 7, 4865. doi: 10.1038/s41598-017-04921-0
Brembu T., Mühlroth A., Alipanah L., Bones A. M. (2017b). The effects of phosphorus limitation on carbon metabolism in diatoms. Philos. Trans. R. Soc. B.: Biol. Sci. 372, 20160406. doi: 10.1098/rstb.2016.0406
Brzezinski M. A. (1985). The Si:C:N ratio of marine diatoms: interspecific variability and the effect of some environmental variables. J. Phycol. 21, 347–357. doi: 10.1111/j.0022-3646.1985.00347.x
Brzezinski M. A., Dumousseaud C., Krause J. W., Measures C. I., Nelson D. M. (2008). Iron and silicic acid concentrations together regulate Si uptake in the equatorial Pacific Ocean. Limnol. Oceanogr. 53, 875–889. doi: 10.4319/lo.2008.53.3.0875
Brzezinski M. A., Jones J. L., Bidle K. D., Azam F. (2003). The balance between silica production and silica dissolution in the sea: Insights from Monterey Bay, California, applied to the global data set. Limnol. Oceanography 5 (48), 1846–1854. doi: 10.4319/lo.2003.48.5.1846
Brzezinski M. A., Nelson D. M. (1995). The annual silica cycle in the Sargasso Sea near Bermuda. Deep-Sea Res. Part I 42, 1215–1237. doi: 10.1016/0967-0637(95)93592-3
Brzezinski M. A., Olson R., Chisholm S. S. W. (1990). Silicon availability and cell-cycle progression in marine diatoms. Mar. Ecol. Prog. Ser. 67, 83–96. doi: 10.3354/meps067083
Brzezinski M. A., Phillips D. R. (1997). Evaluation of 32Si as a tracer for measuring silica production rates in marine waters. Limnol. Oceanogr. 42, 856–865. doi: 10.4319/lo.1997.42.5.0856
Brzezinski M. A., Phillips D. R., Chavez F. P., Friederich G. E., Dugdale R. C. (1997). Silica production in the Monterey, California, upwelling system. Limnol. Oceanogr. 42, 1694–1705. doi: 10.4319/lo.1997.42.8.1694
Chen X. H., Li Y. Y., Zhang H., Liu J. L., Xie Z. X., Lin L., et al. (2018). Quantitative proteomics reveals common and specific responses of a marine diatom Thalassiosira pseudonana to different macronutrient deficiencies. Front. Microbiol. 9. doi: 10.3389/fmicb.2018.02761
Cohen N. R., Ellis K. A., Lampe R. H., McNair H. M., Twining B. S., Maldonado M. T., et al. (2017). Diatom transcriptional and physiological responses to changes in iron bioavailability across ocean provinces. Front. Mar. Sci. 4, 1–20. doi: 10.3389/fmars.2017.00360
Cohen N. R., McIlvin M. R., Moran D. M., Held N. A., Saunders J. K., Hawco N. J., et al. (2021). Dinoflagellates alter their carbon and nutrient metabolic strategies across environmental gradients in the central Pacific Ocean. Nat. Microbiol. 6, 173–186. doi: 10.1038/s41564-020-00814-7
De La Rocha C. L., Passow U. (2004). Recovery of Thalassiosira weissflogii from nitrogen and silicon starvation. Limnol. Oceanogr. 49, 245–255. doi: 10.4319/lo.2004.49.1.0245
Du C., Liang J. R., Chen D. D., Xu B., Zhuo W. H., Gao Y. H., et al. (2014). ITRAQ-based proteomic analysis of the metabolism mechanism associated with silicon response in the marine diatom Thalassiosira pseudonana. J. Proteome Res. 13, 720–734. doi: 10.1021/pr400803w
Durkin C. A., Koester J. A., Bender S. J., Armbrust V. E. (2016). The evolution of silicon transporters in diatoms. J. Phycol. 52, 716–731. doi: 10.1111/jpy.12441
Durkin C. A., Marchetti A., Bender S. J., Truong T., Morales R. L., Mock T., et al. (2012). Frustule-related gene transcription and the influence of diatom community composition on silica precipitation in an iron-limited environment. Limnol. Oceanogr. 57, 1619–1633. doi: 10.4319/lo.2012.57.6.1619
Falkowski P. G., Sukenik A., Herzig R. (1989). Nitrogen limitation in isochrysis galbana (Haptophyceae). Ii. Relative abundance of chloroplast proteins. J. Phycol. 25, 471–478. doi: 10.1111/j.1529-8817.1989.tb00252.x
Flynn K. J., Martin-Jézéquel V. (2000). Modeling Si–N-limited growth of diatoms. J. Plankton Res. 22, 447–472. doi: 10.1093/plankt/22.3.447
Grant C. E., Bailey T. L., Noble W. S. (2011). FIMO: scanning for occurrences of a given motif. Bioinformatics 27, 1017–1018. doi: 10.1093/BIOINFORMATICS/BTR064
Harrison P. J., Conway H. L., Holmes R., Davis C. (1977). Marine diatoms grown in chemostats under silicate or ammonium limitation. III. Chaetoceros debilis, Skeletonema costatum, and Thalassiosira gravida*. Mar. Biol. 43, 19–31. doi: 10.1007/BF00392568
Helliwell K. E., Harrison E. L., Christie-Oleza J. A., Rees A. P., Kleiner F. H., Gaikwad T., et al. (2021). A novel ca2+ Signaling pathway coordinates environmental phosphorus sensing and nitrogen metabolism in marine diatoms. Curr. Biol. 31, 978–989.e4. doi: 10.1016/J.CUB.2020.11.073
Hildebrand M., Dahlin K., Volcani B. E. (1998). Characterization of a silicon transporter gene family in Cylindrotheca fusiformis: Sequences, expression analysis, and identification of homologs in other diatoms. Mol. Gen. Genet. 260, 480–486. doi: 10.1007/S004380050920/METRICS
Hildebrand M., Volcani B. E., Gassmann W., Schroeder J. I. (1997). A gene family of silicon transporters. Nature 385, 6618 385: 688–689. doi: 10.1038/385688b0
Hockin N. L., Mock T., Mulholland F., Kopriva S., Malin G. (2012). The response of diatom central carbon metabolism to nitrogen starvation is different from that of green algae and higher plants. Plant Physiol. 158, 299–312. doi: 10.1104/pp.111.184333
Hu S. K., Liu Z., Alexander H., Campbell V., Connell P. E., Dyhrman S. T., et al. (2018). Shifting metabolic priorities among key protistan taxa within and below the euphotic zone. Environ. Microbiol. 20, 2865–2879. doi: 10.1111/1462-2920.14259
Kaplan D. M., Largier J. L. (2006). HF radar-derived origin and destination of surface waters off Bodega Bay, California. Deep-Sea Res. Part II 25–26, 2906–2930. doi: 10.1016/J.DSR2.2006.07.012
Keeling P. J., Burki F., Wilcox H. M., Allam B., Allen E. E., Amaral-Zettler L. A., et al. (2014). The marine microbial eukaryote transcriptome sequencing project (MMETSP): illuminating the functional diversity of eukaryotic life in the oceans through transcriptome sequencing. PloS Biol. 12, e1001889. doi: 10.1371/journal.pbio.1001889
Knight M. J., Senior L., Nancolas B., Ratcliffe S., Curnow P. (2016). Direct evidence of the molecular basis for biological silicon transport. Nat. Commun. 7, 1–11. doi: 10.1038/ncomms11926
Kopf A., Kostadinov I., Wichels A., Quast C., Glöckner F. O. (2015). Metatranscriptome of marine bacterioplankton during winter time in the North Sea assessed by total RNA sequencing. Mar. Genomics 19, 45–46. doi: 10.1016/j.margen.2014.11.001
Kopylova E., Noé L., Touzet H. (2012). SortMeRNA: Fast and accurate filtering of ribosomal RNAs in metatranscriptomic data. Bioinformatics 28, 3211–3217. doi: 10.1093/bioinformatics/bts611
Kotzsch A., Gröger P., Pawolski D., Bomans P. H. H., Sommerdijk N. A. J. M., Schlierf M., et al. (2017). Silicanin-1 is a conserved diatom membrane protein involved in silica biomineralization. BMC Biol. 15, 9–11. doi: 10.1186/s12915-017-0400-8
Kotzsch A., Pawolski D., Milentyev A., Shevchenko A. A., Scheffel A., Poulsen N., et al. (2016). Biochemical composition and assembly of biosilica-associated insoluble organic matrices from the diatom Thalassiosira pseudonana. J. Biol. Chem. 291, 4982–4997. doi: 10.1074/jbc.M115.706440
Kranzler C. F., Krause J. W., Brzezinski M. A., Edwards B. R., Biggs W. P., Maniscalco M., et al. (2019). Silicon limitation facilitates virus infection and mortality of marine diatoms. Nat. Microbiol. 4, 1790–1797. doi: 10.1038/s41564-019-0502-x
Krause J. W., Brzezinski M. A., Jones J. L. (2011). Application of low-level beta counting of 32Si for the measurement of silica production rates in aquatic environments. Mar. Chem. 127, 40–47. doi: 10.1016/j.marchem.2011.07.001
Krause J. W., Brzezinski M. A., Landry M. R., Baines S. B., Nelson D. M., Selph K. E., et al. (2010). The effects of biogenic silica detritus, zooplankton grazing, and diatom size structure on silicon cycling in the euphotic zone of the eastern equatorial Pacific. Limnol. Oceanogr. 55, 2608–2622. doi: 10.4319/lo.2010.55.6.2608
Krause J. W., Brzezinski M. A., Largier J. L., McNair H. M., Maniscalco M., Bidle K. D., et al. (2020). The interaction of physical and biological factors drives phytoplankton spatial distribution in the northern California Current. Limnol. Oceanogr. 65, 1974–1989. doi: 10.1002/lno.11431
Krause J. W., Brzezinski M. A., Siegel D. A., Thunell R. C. (2013). Biogenic silica standing stock and export in the Santa Barbara Channel ecosystem. J. Geophys Res. Oceans 118, 736–749. doi: 10.1029/2012JC008070
Krause J. W., Brzezinski M. A., Villareal T. A., Wilson C. (2012). Increased kinetic efficiency for silicic acid uptake as a driver of summer diatom blooms in the North Pacific subtropical gyre. Limnol. Oceanogr. 57, 1084–1098. doi: 10.4319/lo.2012.57.4.1084
Krause J. W., Duarte C. M., Marquez I. A., Assmy P., Fernández-Méndez M., Wiedmann I., et al. (2018). Biogenic silica production and diatom dynamics in the Svalbard region during spring. Biogeosciences 15, 6503–6517. doi: 10.5194/BG-15-6503-2018
Krause J. W., Stukel M. R., Taylor A. G., Taniguchi D. A. A., De Verneil A., Landry M. R. (2015). Net biogenic silica production and the contribution of diatoms to new production and organic matter export in the Costa Rica Dome ecosystem. J. Plankton Res. 38, 216–229. doi: 10.1093/plankt/fbv077
Kröger N., Deutzmann R., Bergsdorf C., Sumper M. (2000). Species-specific polyamines from diatoms control silica morphology. Proc. Natl. Acad. Sci. U.S.A. 97, 14133–14138. doi: 10.1073/pnas.260496497
Kröger N., Deutzmann R., Sumper M. (1999). Polycationic peptides from diatom biosilica that direct silica nanosphere formation. Science (1979) 286, 1129–1132. doi: 10.1126/science.286.5442.1129
Kröger N., Lorenz S., Brunner E., Sumper M. (2002). Self-assembly of highly phosphorylated silaffins and their function in biosilica morphogenesis. Science (1979) 298, 584–586. doi: 10.1126/science.1076221
Lampe R. H., Mann E. L., Cohen N. R., Till C. P., Thamatrakoln K., Brzezinski M. A., et al. (2018). Different iron storage strategies among bloom-forming diatoms. Proc. Natl. Acad. Sci. 115, E12275–E12284. doi: 10.1073/pnas.1805243115
Larkin A. A., Garcia C. A., Garcia N., Brock M. L., Lee J. A., Ustick L. J., et al. (2021). High spatial resolution global ocean metagenomes from Bio-GO-SHIP repeat hydrography transects. Sci. Data 8, 1 8, 1–6. doi: 10.1038/s41597-021-00889-9
Li D., Liu C. M., Luo R., Sadakane K., Lam T. W. (2015). MEGAHIT: An ultra-fast single-node solution for large and complex metagenomics assembly via succinct de Bruijn graph. Bioinformatics 31, 1674–1676. doi: 10.1093/bioinformatics/btv033
Liebig J. (1840). Die organische Chemie in ihrer Anwendung auf Agricultur und Physiologie (Braunschweig, Germany: Friedrich Vieweg und Sohn Publishing Company). doi: 10.5962/bhl.title.42117
Liefer J. D., Garg A., Fyfe M. H., Irwin A. J., Benner I., Brown C. M., et al. (2019). The macromolecular basis of phytoplankton C:N:P under nitrogen starvation. Front. Microbiol. 10. doi: 10.3389/fmicb.2019.00763
Maniscalco M. A., Brzezinski M. A., Lampe R. H., Cohen N. R., McNair H. M., Ellis K. A., et al. (2022). Diminished carbon and nitrate assimilation drive changes in diatom elemental stoichiometry independent of silicification in an iron-limited assemblage. ISME Commun. 2, 1 2: 1–10. doi: 10.1038/s43705-022-00136-1
Marchetti A., Moreno C. M., Cohen N. R., Oleinikov I., deLong K., Twining B. S., et al. (2017). Development of a molecular-based index for assessing iron status in bloom-forming pennate diatoms. J. Phycol. 53, 820–832. doi: 10.1111/jpy.12539
Martin-Jézéquel V., Hildebrand M., Brzezinski M. A. (2000). Silicon metabolism in diatoms: Implications for growth. J. Phycol. 36, 821–840. doi: 10.1046/j.1529-8817.2000.00019.x
Matsen F. A., Kodner R. B., Armbrust V. E. (2010). pplacer: linear time maximum-likelihood and Bayesian phylogenetic placement of sequences onto a fixed reference tree. BMC Bioinf. 11, 538. doi: 10.1186/1471-2105-11-538
McCabe R. M., Hickey B. M., Kudela R. M., Lefebvre K. A., Adams N. G., Bill B. D., et al. (2016). An unprecedented coastwide toxic algal bloom linked to anomalous ocean conditions. Geophys Res. Lett. 43, 10,366–10,376. doi: 10.1002/2016GL070023
McNair H. M., Brzezinski M. A., Krause J. W. (2018a). Diatom populations in an upwelling environment decrease silica content to avoid growth limitation. Environ. Microbiol. 20, 4184–4193. doi: 10.1111/1462-2920.14431
McNair H. M., Brzezinski M. A., Till C. P., Krause J. W. (2018b). Taxon-specific contributions to silica production in natural diatom assemblages. Limnol. Oceanogr. 63, 1056–1075. doi: 10.1002/lno.10754
Mock T., Samanta M. P., Iverson V., Berthiaume C., Robison M., Holtermann K., et al. (2008). Whole-genome expression profiling of the marine diatom Thalassiosira pseudonana identifies genes involved in silicon bioprocesses. Proc. Natl. Acad. Sci. U.S.A. 105, 1579–1584. doi: 10.1073/pnas.0707946105
Moreno C. M., Gong W., Cohen N. R., DeLong K., Marchetti A. (2020). Interactive effects of iron and light limitation on the molecular physiology of the Southern Ocean diatom Fragilariopsis kerguelensis. Limnol. Oceanogr. 65, 1511–1531. doi: 10.1002/lno.11404
Nelson D., Brzezinski M. A. (1990). Kinetics of silicic acid uptake by natural diatom assemblages in two Gulf Stream warm-core rings. Mar. Ecol. Prog. Ser. 62, 283–292. doi: 10.3354/meps062283
Nelson D. M., Brzezinski M. A., Sigmon D. E., Franck V. M. (2001). A seasonal progression of Si limitation in the Pacific sector of the Southern Ocean. Deep Sea Res. 2 Top. Stud. Oceanogr. 48, 3973–3995. doi: 10.1016/S0967-0645(01)00076-5
Nelson D. M., Dortch Q. (1996). Silicic acid depletion and silicon limitation in the plume of the Mississippi River: evidence from kinetic studies in spring and summer. Mar. Ecol. Prog. Ser. 136, 163–178. doi: 10.3354/meps136163
Nymark M., Valle K. C., Hancke K., Winge P., Andresen K., Johnsen G., et al. (2013). Molecular and photosynthetic responses to prolonged darkness and subsequent acclimation to re-illumination in the diatom phaeodactylum tricornutum. PloS One 8, e7743. doi: 10.1371/journal.pone.0058722
Olson R. J., Chisholm S. W. (1986). Effects of light and nitrogen limitation on the cell cycle of the dinoflagellate Amphidinium carteri. J. Plankton Res. 8, 785–793. doi: 10.1093/PLANKT/8.4.785
Osborne B. A., Geider R. J. (1986). Effect of nitrate-nitrogen limitation on photosynthesis of the diatom Phaeodactylum tricornutum Bohlin (Bacillariophyceae). Plant Cell Environ. 9, 617–625. doi: 10.1111/J.1365-3040.1986.TB01619.X
Paasche E. (1973). Silicon and the ecology of marine plankton diatoms. I. Thalassiosira pseudonana (Cyclotella nana) grown in a chemostat with silicate as limiting nutrient. Mar. Biol. 19, 117–126. doi: 10.1007/BF00353582
Parsons T. R., Maita Y., Lalli C. M. (1984). A manual of chemical and biological methods for seawater analysis (Elmsford, New York: Pergamon Press).
Poulsen N., Kröger N. (2004). Silica morphogenesis by alternative processing of silaffins in the diatom Thalassiosira pseudonana. J. Biol. Chem. 279, 42993–42999. doi: 10.1074/jbc.M407734200
Rahmatallah Y., Emmert-Streib F., Glazko G. (2014). Comparative evaluation of gene set analysis approaches for RNA-Seq data. BMC Bioinf. 15, 1–15. doi: 10.1186/S12859-014-0397-8/FIGURES/5
Raven J. A., Waite A. M. (2004). The evolution of silicification in diatoms: inescapable sinking and sinking as escape? New Phytol. 162, 45–61. doi: 10.1111/J.1469-8137.2004.01022.X
Rhee G.-Y. (1978). Effects of N:P atomic ratios and nitrate limitation on algal growth, cell composition, and nitrate uptake 1. Limnol. Oceanogr. 23, 10–25. doi: 10.4319/LO.1978.23.1.0010
Rho M., Tang H., Ye Y. (2010). FragGeneScan: Predicting genes in short and error-prone reads. Nucleic Acids Res. 38, 1–12. doi: 10.1093/nar/gkq747
Robinson M. D., McCarthy D. J., Smyth G. K. (2010). edgeR: a Bioconductor package for differential expression analysis of digital gene expression data. Bioinformatics 26, 139–140. doi: 10.1093/bioinformatics/btp616
Rusch D. B., Halpern A. L., Sutton G., Heidelberg K. B., Williamson S., Yooseph S., et al. (2007). The sorcerer II global ocean sampling expedition: northwest atlantic through eastern tropical pacific. PloS Biol. 5, e77. doi: 10.1371/JOURNAL.PBIO.0050077
Sapriel G., Quinet M., Heijde M., Jourdren L., Tanty V., Luo G., et al. (2009). Genome-wide transcriptome analyses of silicon metabolism in Phaeodactylum tricornutum reveal the multilevel regulation of silicic acid transporters. PloS One 4, e7458. doi: 10.1371/journal.pone.0007458
Scheffel A., Poulsen N., Shian S., Kröger N. (2011). Nanopatterned protein microrings from a diatom that direct silica morphogenesis. Proc. Natl. Acad. Sci. 108, 3175–3180. doi: 10.1073/pnas.1012842108
Shrestha R. P., Hildebrand M. (2015). Evidence for a regulatory role of diatom silicon transporters in cellular silicon responses. Eukaryot. Cell 14, 29. doi: 10.1128/EC.00209-14
Shrestha R. P., Tesson B., Norden-Krichmar T., Federowicz S., Hildebrand M., Allen A. E. (2012). Whole transcriptome analysis of the silicon response of the diatom Thalassiosira pseudonana. BMC Genomics 13, 1. doi: 10.1186/1471-2164-13-499
Siegel D. A., Buesseler K. O., Behrenfeld M. J., Benitez-Nelson C. R., Boss E., Brzezinski M. A., et al. (2016). Prediction of the export and fate of global ocean net primary production: The exports science plan. Front. Mar. Sci. 3, 22. doi: 10.3389/FMARS.2016.00022/BIBTEX
Smith S. R., Dupont C. L., McCarthy J. K., Broddrick J. T., Oborník M., Horák A., et al. (2019). Evolution and regulation of nitrogen flux through compartmentalized metabolic networks in a marine diatom. Nat. Commun. 10, 4552. doi: 10.1038/s41467-019-12407-y
Smith S. R., Glé C., Abbriano R. M., Traller J. C., Davis A. K., Trentacoste E., et al. (2016). Transcript level coordination of carbon pathways during silicon starvation-induced lipid accumulation in the diatom Thalassiosira pseudonana. New Phytol. 210, 890–904. doi: 10.1111/nph.13843
Stamatakis A. (2014). RAxML version 8: A tool for phylogenetic analysis and post-analysis of large phylogenies. Bioinformatics 30, 1312–1313. doi: 10.1093/bioinformatics/btu033
Strickland J. D. H., Parsons T. R. (1972). Practical handbook of seawater analysis 2nd edition. Ottawa, Canada: Fisheries Research Board of Canada. doi: 10.25607/OBP-1791
Tesson B., Lerch S. J. L., Hildebrand M. (2017). Characterization of a new protein family associated with the silica deposition vesicle membrane enables genetic manipulation of diatom silica. Sci. Rep. 7, 1–13. doi: 10.1038/s41598-017-13613-8
Thamatrakoln K., Hildebrand M. (2007). Analysis of Thalassiosira pseudonana silicon transporters indicates distinct regulatory levels and transport activity through the cell cycle. Eukaryot. Cell 6, 271–279. doi: 10.1128/EC.00235-06
Thamatrakoln K., Hildebrand M. (2008). Silicon uptake in diatoms revisited: A model for saturable and nonsaturable uptake kinetics and the role of silicon transporters. Plant Physiol. 146, 1397–1407. doi: 10.1104/pp.107.107094
Thamatrakoln K., Korenovska O., Niheu A. K., Bidle K. D. (2012). Whole-genome expression analysis reveals a role for death-related genes in stress acclimation of the diatom Thalassiosira pseudonana. Environ. Microbiol. 14, 67–81. doi: 10.1111/j.1462-2920.2011.02468.x
Thangaraj S., Shang X., Sun J., Liu H. (2019). Quantitative Proteomic Analysis Reveals Novel Insights into Intracellular Silicate Stress-Responsive Mechanisms in the Diatom Skeletonema dohrnii. Int. J. Mol. Sci. Article 20, 2540. doi: 10.3390/ijms20102540
Toseland A., Moxon S., Mock T., Moulton V. (2014). Metatranscriptomes from diverse microbial communities: Assessment of data reduction techniques for rigorous annotation. BMC Genomics 15, 1–7. doi: 10.1186/1471-2164-15-901
Trainer V. L., Adams N. G., Bill B. D., Stehr C. M., Wekell J. C., Moeller P., et al. (2000). Domoic acid production near California coastal upwelling zones, June 1998. Limnol. Oceanogr. 45, 1818–1833. doi: 10.4319/LO.2000.45.8.1818
Trainer V. L., Bates S. S., Lundholm N., Thessen A. E., Cochlan W. P., Adams N. G., et al. (2012). Pseudo-nitzschia physiological ecology, phylogeny, toxicity, monitoring and impacts on ecosystem health. Harmful Algae 14, 271–300. doi: 10.1016/J.HAL.2011.10.025
Tully B. J., Graham E. D., Heidelberg J. F. (2018). The reconstruction of 2,631 draft metagenome-assembled genomes from the global oceans. Sci. Data 5, 1 5: 1–1 5: 8. doi: 10.1038/sdata.2017.203
Vaulot D., Merkel S., Olson R. J., Chilsholm S. W. (1987). Cell-cycle response to nutrient starvation in two phytoplankton species, Thalassiosira weissflogii and Hymenomonas carterae. Mar. Biol. 630, 625–630. doi: 10.1007/BF00393106
Wenzl S., Hett R., Richthammer P., Sumper M. (2008). Silacidins: Highly acidic phosphopeptides from diatom shells assist in silica precipitation in vitro. Angewandte Chem. - Int. Ed. 47, 1729–1732. doi: 10.1002/anie.200704994
White K. K., Dugdale R. C. (1997). Silicate and nitrate uptake in the Monterey Bay upwelling system. Cont. Shelf. Res. 17, 455–472. doi: 10.1016/S0278-4343(96)00042-8
Wu D., Lim E., Vaillant F., Asselin-Labat M. L., Visvader J. E., Smyth G. K. (2010). ROAST: rotation gene set tests for complex microarray experiments. Bioinformatics 26, 2176–2182. doi: 10.1093/BIOINFORMATICS/BTQ401
Keywords: diatom, biogenic silica production, metatranscriptomics, silicon metabolism, nitrogen assimilation, carbon metabolism, nutrient limitation, gene set analysis
Citation: Maniscalco MA, Brzezinski MA, Krause JW and Thamatrakoln K (2023) Decoupling silicon metabolism from carbon and nitrogen assimilation poises diatoms to exploit episodic nutrient pulses in a coastal upwelling system. Front. Mar. Sci. 10:1291294. doi: 10.3389/fmars.2023.1291294
Received: 08 September 2023; Accepted: 02 November 2023;
Published: 22 November 2023.
Edited by:
Lihua Ran, Ministry of Natural Resources, ChinaReviewed by:
Haimanti Biswas, Council of Scientific and Industrial Research (CSIR), IndiaXin Lin, Xiamen University, China
Copyright © 2023 Maniscalco, Brzezinski, Krause and Thamatrakoln. This is an open-access article distributed under the terms of the Creative Commons Attribution License (CC BY). The use, distribution or reproduction in other forums is permitted, provided the original author(s) and the copyright owner(s) are credited and that the original publication in this journal is cited, in accordance with accepted academic practice. No use, distribution or reproduction is permitted which does not comply with these terms.
*Correspondence: Kimberlee Thamatrakoln, dGhhbWF0QG1hcmluZS5ydXRnZXJzLmVkdQ==
†Present addresses: Michael A. Maniscalco, Ocean Ecology Lab (Code 616), NASA Goddard Space Flight Center, Greenbelt, MD, United States
Hydrosphere, Biosphere, Geophysics Support Group, Science Systems and Applications, Inc., Greenbelt, MD, United States