 Jaewoon Jeong1
 Babafela Awosile1,2
 Krishna K. Thakur1*
 Henrik Stryhn1
 Brad Boyce3
 Raphael Vanderstichel1,4
- 1Department of Health Management, Atlantic Veterinary College, University of Prince Edward Island, Charlottetown, PE, Canada
- 2School of Veterinary Medicine, Texas Tech University, Amarillo, TX, United States
- 3MOWI Canada West, Campbell River, BC, Canada
- 4Department of Veterinary Clinical Sciences, College of Veterinary Medicine, Long Island University, Brookville, NY, United States
Dissolved oxygen (DO), an important water-quality parameter required to support aquatic life, is a critical factor for determining the general biological health of the aquatic ecosystem, and the concentration of DO is a critical factor in determining salmon growth and welfare. This study used longitudinal DO concentration, recorded hourly from 21 aquaculture sites, each with loggers in three separate cages, in four areas in British Columbia, Canada, between 2015 and 2017. The measurements were evaluated based on the recommended DO concentrations for protection of salmonids from hypoxia. Using a two-stage time-series analysis, we described variations in DO concentrations measured over the study period and their associations with environmental factors. Based on the water quality criteria for DO concentration, 42.3, 56.5, and 1.2% of the hourly DO data from the overall 21 aquaculture sites were classified as ‘optimal’, ‘sub-optimal’, and ‘stressed’, respectively. The frequency of hypoxic episodes differed substantially among seasons, aquaculture sites and even among cages within sites. The effects of environmental variables on DO concentration had markedly different patterns depending on the season. Significant associations with DO concentrations were observed for temperatures in the summer and winter months, and both wind direction and remotely-sensed estimated absorption from phytoplankton [aph(443)] in the winter months. The time-series regression model results showed overall (year-round) associations of temperature, wind speed, and aph(443) with DO concentrations. Describing DO measurements at these aquaculture sites provided an understanding of how much they deviated from the recommended DO concentrations, as well as provide baseline information for future water resource planning, including continued and improved water quality monitoring in aquaculture areas.
1 Introduction
Dissolved oxygen (DO) is one of the most critical parameters in aquaculture water-quality assessment and monitoring, as its appropriate level is required to support aquatic ecosystems. Fish and other aquatic species are sensitive to reduced DO levels, yet global oceanic DO content has been in steady decline (Schmidtko et al., 2017). The effect of DO on the growth and production of salmonids has been studied for decades, and adequate DO concentrations were found to have a critical role in maintaining their health, productivity and survival (Carter, 2005; Mallya, 2007). DO requirements of aquatic species vary and depend on numerous factors, including fish species, aquaculture system, water temperature, and fish life stages. Direct and indirect effects of reduced DO levels on fish health have been recognized (Mallya, 2007). Direct effects include the changes that significantly affect physiology, growth and developmental stages, feeding activities, reproduction, swimming capability, ability to withstand environmental stressors, behavior, and reproductive abilities of aquatic species (Thomas and Rahman, 2012; Langseth et al., 2014), as well as high-mortality events in severe cases (Shimps et al., 2005). Indirect effects are related to ecological disruption of spatiotemporal interactions between the targeted resources and fish distribution (Stramma et al., 2012). Therefore, minimum acceptable DO concentrations are recommended to prevent these negative impacts of hypoxic episodes in farmed fish.
Monitoring of DO concentrations and other water quality parameters is an important management practice necessary for maintaining the biological health and functioning capacity of aquatic ecosystems (Abdul-Aziz et al., 2007). In particular, DO monitoring serves as an indirect measure of the health of aquaculture systems (Pollock et al., 2007), and the establishment of efficient DO monitoring programs have become an integral part of aquaculture productions (Burke et al., 2021). Real-time continuous monitoring, using DO probes to monitor DO levels 24 h/day and intermittent monitoring with hand-held DO probes at specific times of the day, have become common practices in aquaculture industry (Wei et al., 2019). In both cases, data are repeatedly collected over a period of time and evaluated according to established criteria, some of which include a temporal component when determining thresholds. Our understanding indicates that despite numerous studies investigating the impact of dissolved oxygen (DO) concentration on the health of salmon, only a limited number of these have established a direct link between DO concentration threshold and salmon health. Specifically, it has been generally noted that Atlantic salmon are critically affected when DO concentrations fall below 4 mg/L (Stevens et al., 1998). Furthermore, one set of widely-used and well-established DO criteria in salmon aquaculture, provided by the United States Environmental Protection Agency (US EPA; U.S. Environmental Protection Agency, 1986), describe the impact of several levels of DO concentrations on various salmon life stages, and over various time periods (i.e. 0 [instant measurement], 7 and 30 days).
The availability of DO for aquatic organisms depends on complex interactions between a variety of biotic and abiotic factors. DO levels in an aquatic environment physically depend on the water temperature, with warming sea temperatures causing a significant decline in oxygen solubility and a reduced oxygenation of deeper sea waters (Remen et al., 2016). Atmospheric pressure also influences the exerting capacity of atmospheric wind on the water surface and, ultimately, the solubility of oxygen in the water body (Cox, 2003). The presence of chlorophyll-a pigment in most aquatic plants results in an increased release of oxygen through photosynthesis, which is estimated to have a more significant global impact than that of terrestrial plants (Peña et al., 2010; Correa-González et al., 2014). Concurrently, the coexistence of other living organisms, organic matter, and nitrogenous deposits in aquatic environments creates competition with fish for available DO (Gammons et al., 2011). This intricate interplay between DO levels and various environmental factors highlights the need for a clearer understanding of these local relationships to improve the management of DO levels at salmon aquaculture sites. This improved understanding should be valuable for the development of a mathematical model to predict DO levels in salmon cages (Alver et al., 2022).
A large-scale report of DO levels of salmon aquaculture sites in the Southwestern New Brunswick region of the Bay of Fundy (Page et al., 2005), stressed the importance of coastal water temperatures (with seasonal fluctuations) and movements (tidal), along with wind (air-sea oxygen exchange) as contributing factors. The researchers were interested in building regional predictive models, so also discussed anthropogenic influences from the release of organic waste in certain bays, where local fish processing plants or pulp mill effluent was found to severely reduce DO levels. Their empirical data came from a few single time series taken over the span of a few weeks in surrounding waters (near an aquaculture site) and from one cage within an aquaculture site. Interestingly, they recorded DO concentrations during an algal bloom event that lasted approximately 6 days, demonstrating huge variations (spikes and troughs) in DO levels, presumably from abnormal local levels of algae-induced photosynthesis and respiration.
This study was initiated as part of active water quality monitoring of all MOWI aquaculture sites in British Columbia (BC), Canada. Previous observations of intermittently low DO measurements in some aquaculture sites in BC brought up the need for a more detailed description and detection of any significant deviation from acceptable standards and recommended DO concentrations for the protection of various salmonid life-stages (Fisheries and Oceans Canada, 2015). Also, our study was motivated by the limited knowledge of DO patterns in aquaculture sites in our study area, and the unique large-scale availability of DO data in the region during the span of an entire farmed salmonid production cycle. The objectives of this study were two folds: first we wanted to describe the measurement of DO, based on the US EPA recommended DO concentrations (U.S. Environmental Protection Agency, 1986), evaluating low DO (hypoxic) episodes from aquaculture sites, and better understand the within- and among-site patterns of DO. Then, we investigated the potential effects of environmental factors such as temperature, wind speed, wind direction, precipitation, and remotely-sensed (sea surface) estimated absorption from phytoplankton, on DO levels on aquaculture sites.
2 Materials and methods
2.1 Dissolved oxygen data
Dissolved oxygen data provided by the salmon site operators for this study included time-series data from 21 marine aquaculture sites from four areas of BC, Canada: Quatsino Sound, Port Hardy, Broughton Archipelago, and Discovery Islands (Figure 1). At each site, DO concentration and water temperature were continuously recorded in real-time using in-cage DO loggers (Oxygen Optode 4531, Aanderaa Norway). The DO logger data were available from October 2nd 2015, to May 18th 2017, corresponding to one marine production cycle. At each site, three DO loggers were placed in different cages, two in arbitrarily-chosen separate cages (Cage 1 and 2) and one always near the feeding barge (Cage 3), except at Site 6, which included the data from only two cages (one of which was always near the feeding barge). Personnel were instructed to place the DO loggers at a 5 m depth. Most loggers were set to capture data on a 5-minute interval (77.8% of observations), but intervals ranged from every minute (1.2%) to hourly (<0.1%), as such, all measurements were aggregated on an hourly basis.
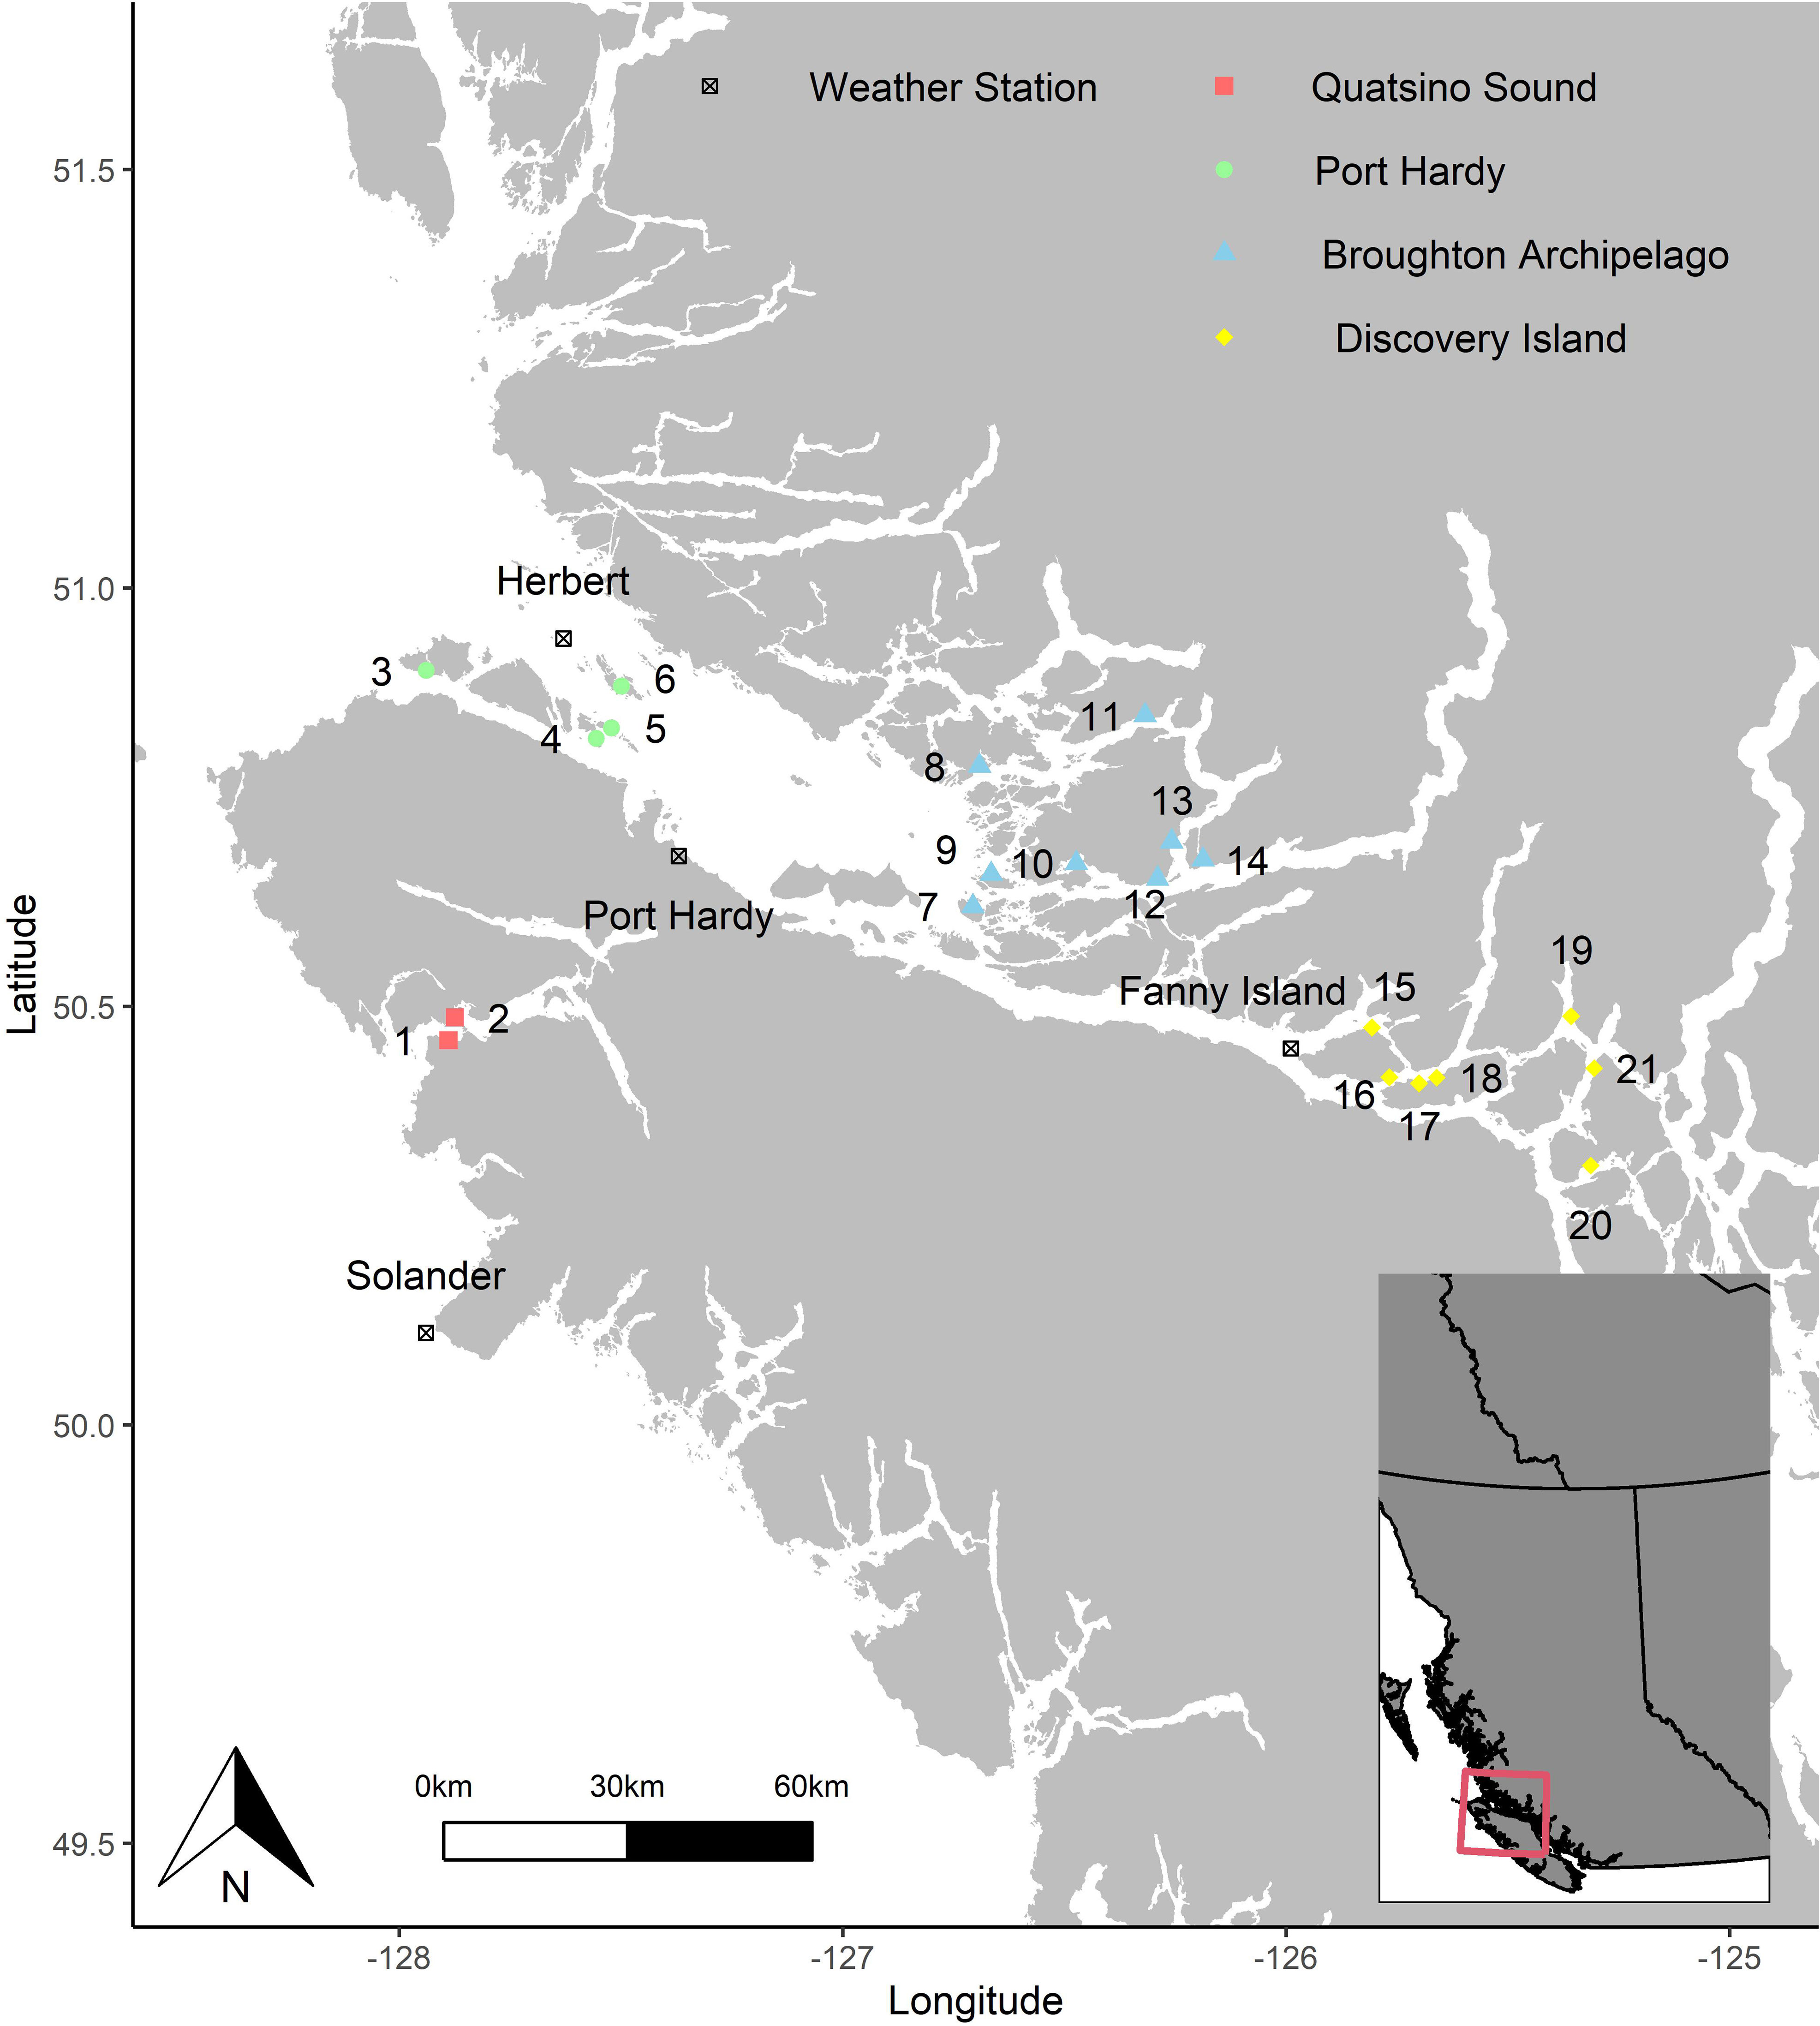
Figure 1 Locations of the 21 salmon aquaculture sites and the four weather stations in British Columbia, Canada. The sites are numbered from 1 to 21 and grouped into four areas (Red: Quatsino Sound, Green: Port Hardy, Blue: Broughton Archipelago, and Yellow: Discovery Island). The four black symbols (boxed ‘x’) mark the weather stations that provided the environmental data.
Hourly temperature and DO data from the data logger database from each of the 21 sites were inspected for erroneous measurements, which may presumably be due to interference with DO loggers from debris, loggers being temporarily/intermittently out of the water, or instrumentation error. The hourly temperature and DO data were initially plotted over the study period for visual inspection for anomalous observations, and the temperature values were compared to the regional weather buoy values, operated by the National Oceanic and Atmospheric Administration (NOAA), and stationed in the Strait of Juan de Fuca. The buoy provided reference air and water temperatures (at a height of 3.4 m above and a depth of 2 m below water, respectively), in 20-minute intervals, and DO observations were removed at the very start and end of each series until the loggers’ temperatures were similar to the expected water temperatures. Sudden changes in logger DO and temperature values deemed inaccurate were removed. Following the recommendations by Abdul-Aziz et al. (2007), changes in DO concentrations that exceeded or fell below the average concentration within an interval of 6 hours by a rate of 1.5 mg/L/h were removed from further analyses. Additionally, changes in loggers’ temperatures greater than 5°C/h were removed from further analyses.
2.2 Production impairment classification, two-number criteria and low DO episodes
The hourly DO measurements (n= 275,206) were summarized for each cage within each site for the duration of the study period from October 2015 to May 2017. DO values were aggregated into hourly intervals, capturing hourly minimum, mean and maximum. Mean hourly DO values were categorized into the following exposures: stressed DO levels (<4 mg/L), sub-optimal DO levels (4 to ≤7 mg/L), or optimal DO levels (>7 mg/L), as per the production impairment classification for salmonids (U.S. Environmental Protection Agency, 1986). Other criteria provided by the US EPA (U.S. Environmental Protection Agency, 1986) include the so-called ‘two-number criteria’, which differ from the production impairment classification in that the two-number criteria cover a certain period of time. The criteria include three rolling averages, namely: the 7-day minimum, 7-day mean, and 30-day mean that were calculated for each cage within each site in our study. The 7-day minimum DO concentration was calculated as a rolling 7-day average of the daily minimum DO concentrations; this measurement is deemed necessary to prevent short-term exposure of other salmonid life stages to potentially critical low DO concentrations. The 7-day mean DO concentrations (necessary to protect the short-duration and most-sensitive early-life stages in salmonids) were calculated as a rolling 7-day average of the mean daily DO concentrations. The 30-day mean DO concentration (a necessary reporting time frame to protect later salmonid life stages) was calculated as a rolling 30-day average of the mean daily DO concentrations (U.S. Environmental Protection Agency, 1986). We compared the three ‘two-number criteria’ for each cage from each site to the US EPA recommended threshold DO concentrations of 5 mg/L for the 7-day minimum and 6.5 mg/L for the 7-day mean and 30-day mean (U.S. Environmental Protection Agency, 1986).
2.3 Time-series regression modelling
Daily minimum DO concentration in each cage in a site were calculated and then the average DO concentration of the three minimum DO concentrations was obtained for each day and each site. These DO concentrations will hereafter be called ‘daily average minimum DO concentration’ (n=7,114). We initially described the daily average minimum DO concentration data from the 21 sites using a time-series plot. We used a time-series regression modeling approach to investigate the effects of daily maximum water temperature, daily total precipitation (sum of rainfall and snowfall), daily wind speed (maximum gust above 30 km/h, constant value of 30 when gust was ≤ 30 km/h), daily wind direction (maximum gust above 30 km/h, missing value when gust is ≤ 30 km/h), and daily regionally-averaged spectral absorption coefficient from phytoplankton [aph(443)], on the daily average minimum DO concentrations over the study period. Historical data of daily total precipitation and daily wind speed during the study period were retrieved from the weather archive of the Government of Canada (Government of Canada, 2018). The total precipitation, wind speed and wind direction data were retrieved from four weather stations nearest to the four geographical regions where the aquaculture sites were located. Weather data for farms 1 and 2 were retrieved from Solander, weather data for farms 3 to 6 were retrieved from Herbert, weather data for farm 7 and farm 9 were retrieved from Port Hardy, and weather data for the rest of farms were retrieved from Fanny Island (Figure 1). The remotely-sensed data for the sea surface estimates of daily absorption from phytoplankton, reported as a coefficient of aph(443 nm) m-1, a surrogate measure of phytoplankton cell abundance, were made available through the OceanColor Data website (NASA Ocean Color, 2018) at 4 km resolution (grids), which is curated by the National Aeronautics and Space Administration (NASA Goddard Space Flight Center et al., 2018). With these daily aph(443 nm) coefficients, a daily regional average, covering the study region, was extracted from the following spatial extent: -128.25 and -125.0 (Longitude), and 50.25, and 51.25 (Latitude), and days with missing values, presumably from cloud-cover, were replaced with a constant minimum value of 0.003 (representing halfway between the minimum value in the dataset and zero).
As a first step to the analyses, we described the distribution of the predictor values by season, and then the relationships between the predictors and daily average minimum DO concentrations through Spearman’s correlation. Then, in the model-building processes, we controlled for the long-term trends in the data since our focus was a short-term association between the predictors and daily average minimum DO measurements; i.e. in our example, whether day-to-day changes in daily average minimum DO concentrations were related to: daily maximum temperature, daily total precipitation, daily maximum wind speed, daily wind direction (max. gust), and daily regionally-averaged aph(443) coefficient (Bhaskaran et al., 2013). However, the daily average minimum DO concentrations data were shown to be dominated by seasonal patterns and long-term trends, which made it necessary to control for these patterns in the regression model to effectively separate them out from the short-term associations between daily average minimum DO concentrations and the predictor variables [temperature, precipitation, wind, and aph(443)]. We achieved this by fitting a cubic spline function to time by using 7 knots per year, which has been reported to provide adequate control for long-term trends in time-series (Bhaskaran et al., 2013). In total, we used 11 knots, corresponding to the period of one 18-month marine production cycle. Then, we used two-stage time-series regression models to establish the effects of the predictors on the daily average minimum DO concentrations. First, a mixed regression model with an exponential autocorrelation was fitted with the predictors as fixed effects for each aquaculture site, then we used a random-effects meta-analysis to generate overall effect estimates for each predictor across all aquaculture sites. A forest plot was used to present the variability in the estimates with the 95% confidence interval for the predictors across the aquaculture sites. Statistical significance was set at P < 0.05.
This time-series regression model was first used to investigate the effects of the predictors on DO for each season (defined by their respective solstice/equinox dates for summer, autumn, winter, and spring), focusing on each predictor by including only one environmental predictor in each model (univariable association) for each season. For this investigation, only observations from 13 sites (Site 3, 4, 7, 8, 9, 11, 13, 14, 16, 17, 18, 19, and 21) were used because the observations from the remaining eight sites did not span all four seasons. Second, the two-stage time-series regression model was used to identify significantly influential predictors on DO and inform the multivariable model-building process in the first step, regardless of season. The model selection process also included the addition of linear splines for those predictors which were visually determined to require the placement of a knot, based on locally-weighted smoothing (LOWESS) scatterplots. As a result, daily maximum temperatures had a knot placed at 10°C, and the daily maximum wind speed at 55 km/h, thus producing linear estimates of DO concentrations for each section of each spline (i.e. two estimates per predictor).
3 Results
3.1 Two-number criteria, production impairment classification
The distributions for hourly observation of DO for the 21 aquaculture sites, across their three cage locations, are presented as boxplots in Supplementary Figure 1, along with production impairment classification cutoffs at 4 and 7 mg/L (Table 1). The overall proportions of the hourly DO measurements for the 21 aquaculture sites were 42.3, 56.5, and 1.2% in the ‘optimal’, ‘sub-optimal’, and ‘stressed’ classifications, respectively. The hourly observation of DO for the total 21 sites were also presented by the two-number criteria (Figure 2 and Table 1). The overall proportions of 21 sites that did not meet the criteria were 20.2, 40.4, and 40.3% for 7-day minimum, 7-day mean, and 30-day mean, respectively. No site managed to perfectly meet or exceed all three types of the two-number criteria during the study period across all three cages. Cages 1 and 3 in Site 5, and Cage 2 in Site 1, 12 and 16 showed that the DO concentrations were higher than the three types of the two-number criteria during the study period.
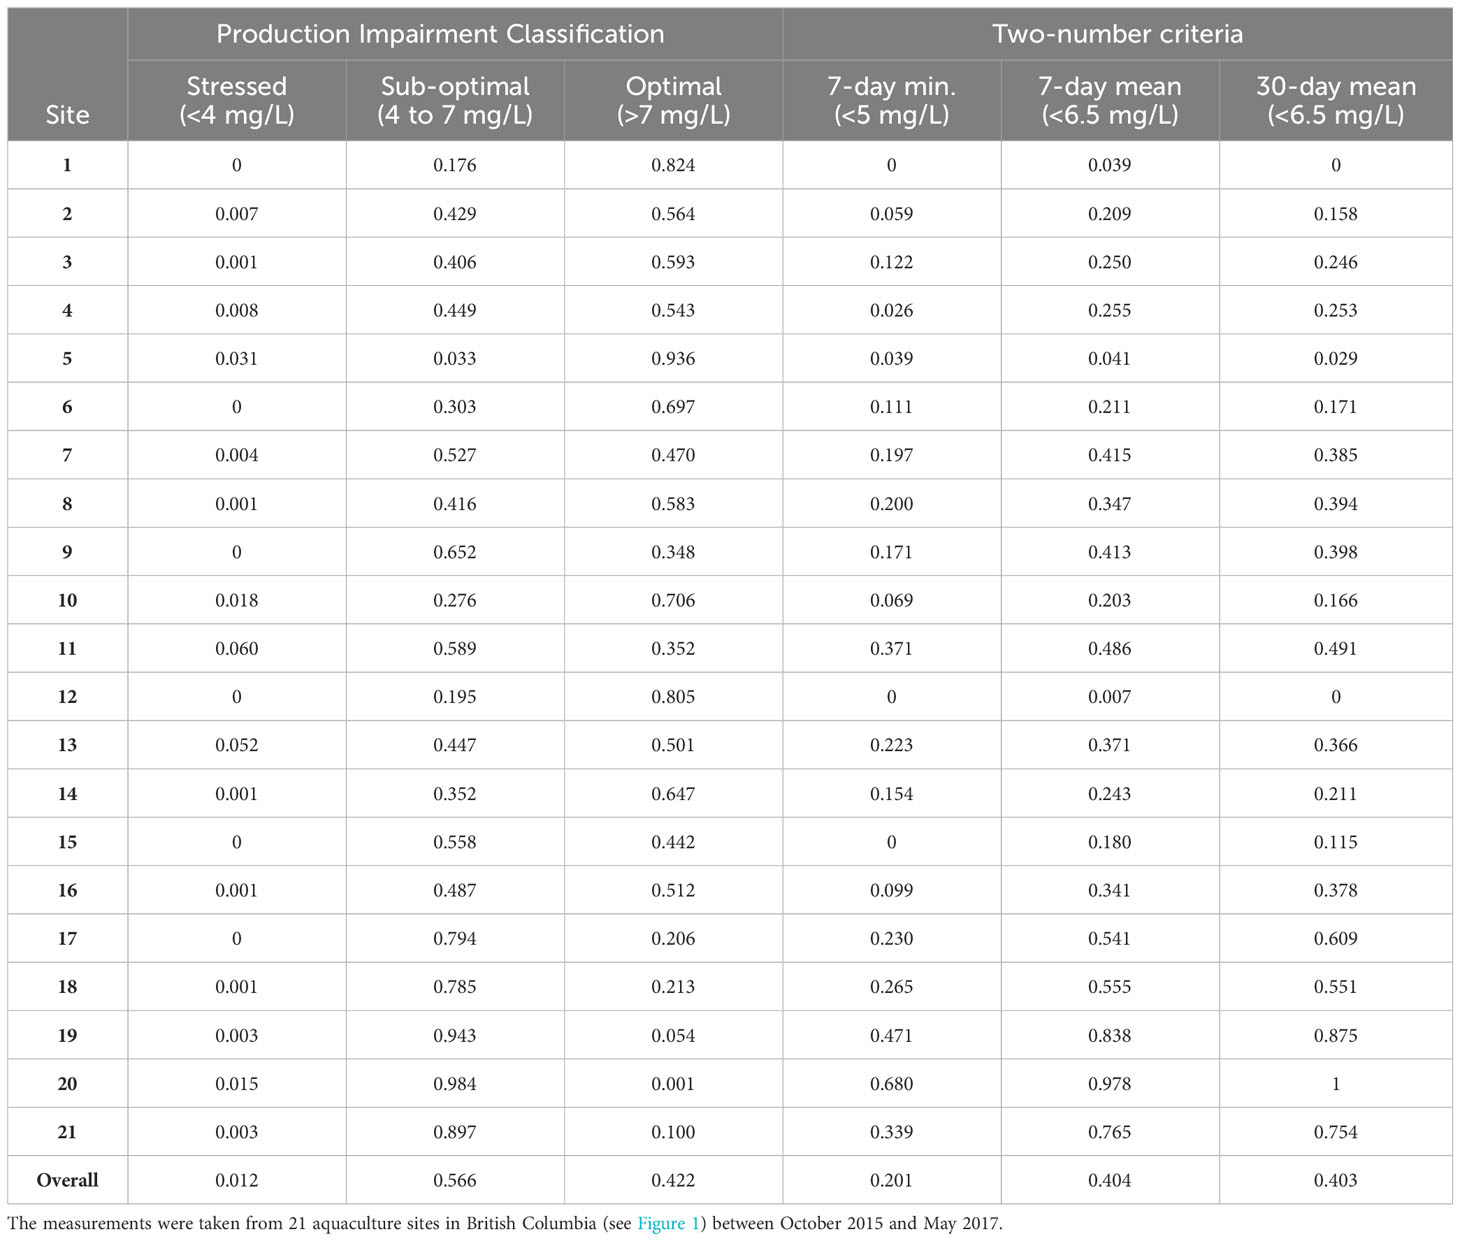
Table 1 Proportion of hourly observations of dissolved oxygen concentration, based on ‘Production Impairment Classification’ and ‘Two-number Criteria’, as described by the United States Environmental Protection Agency.
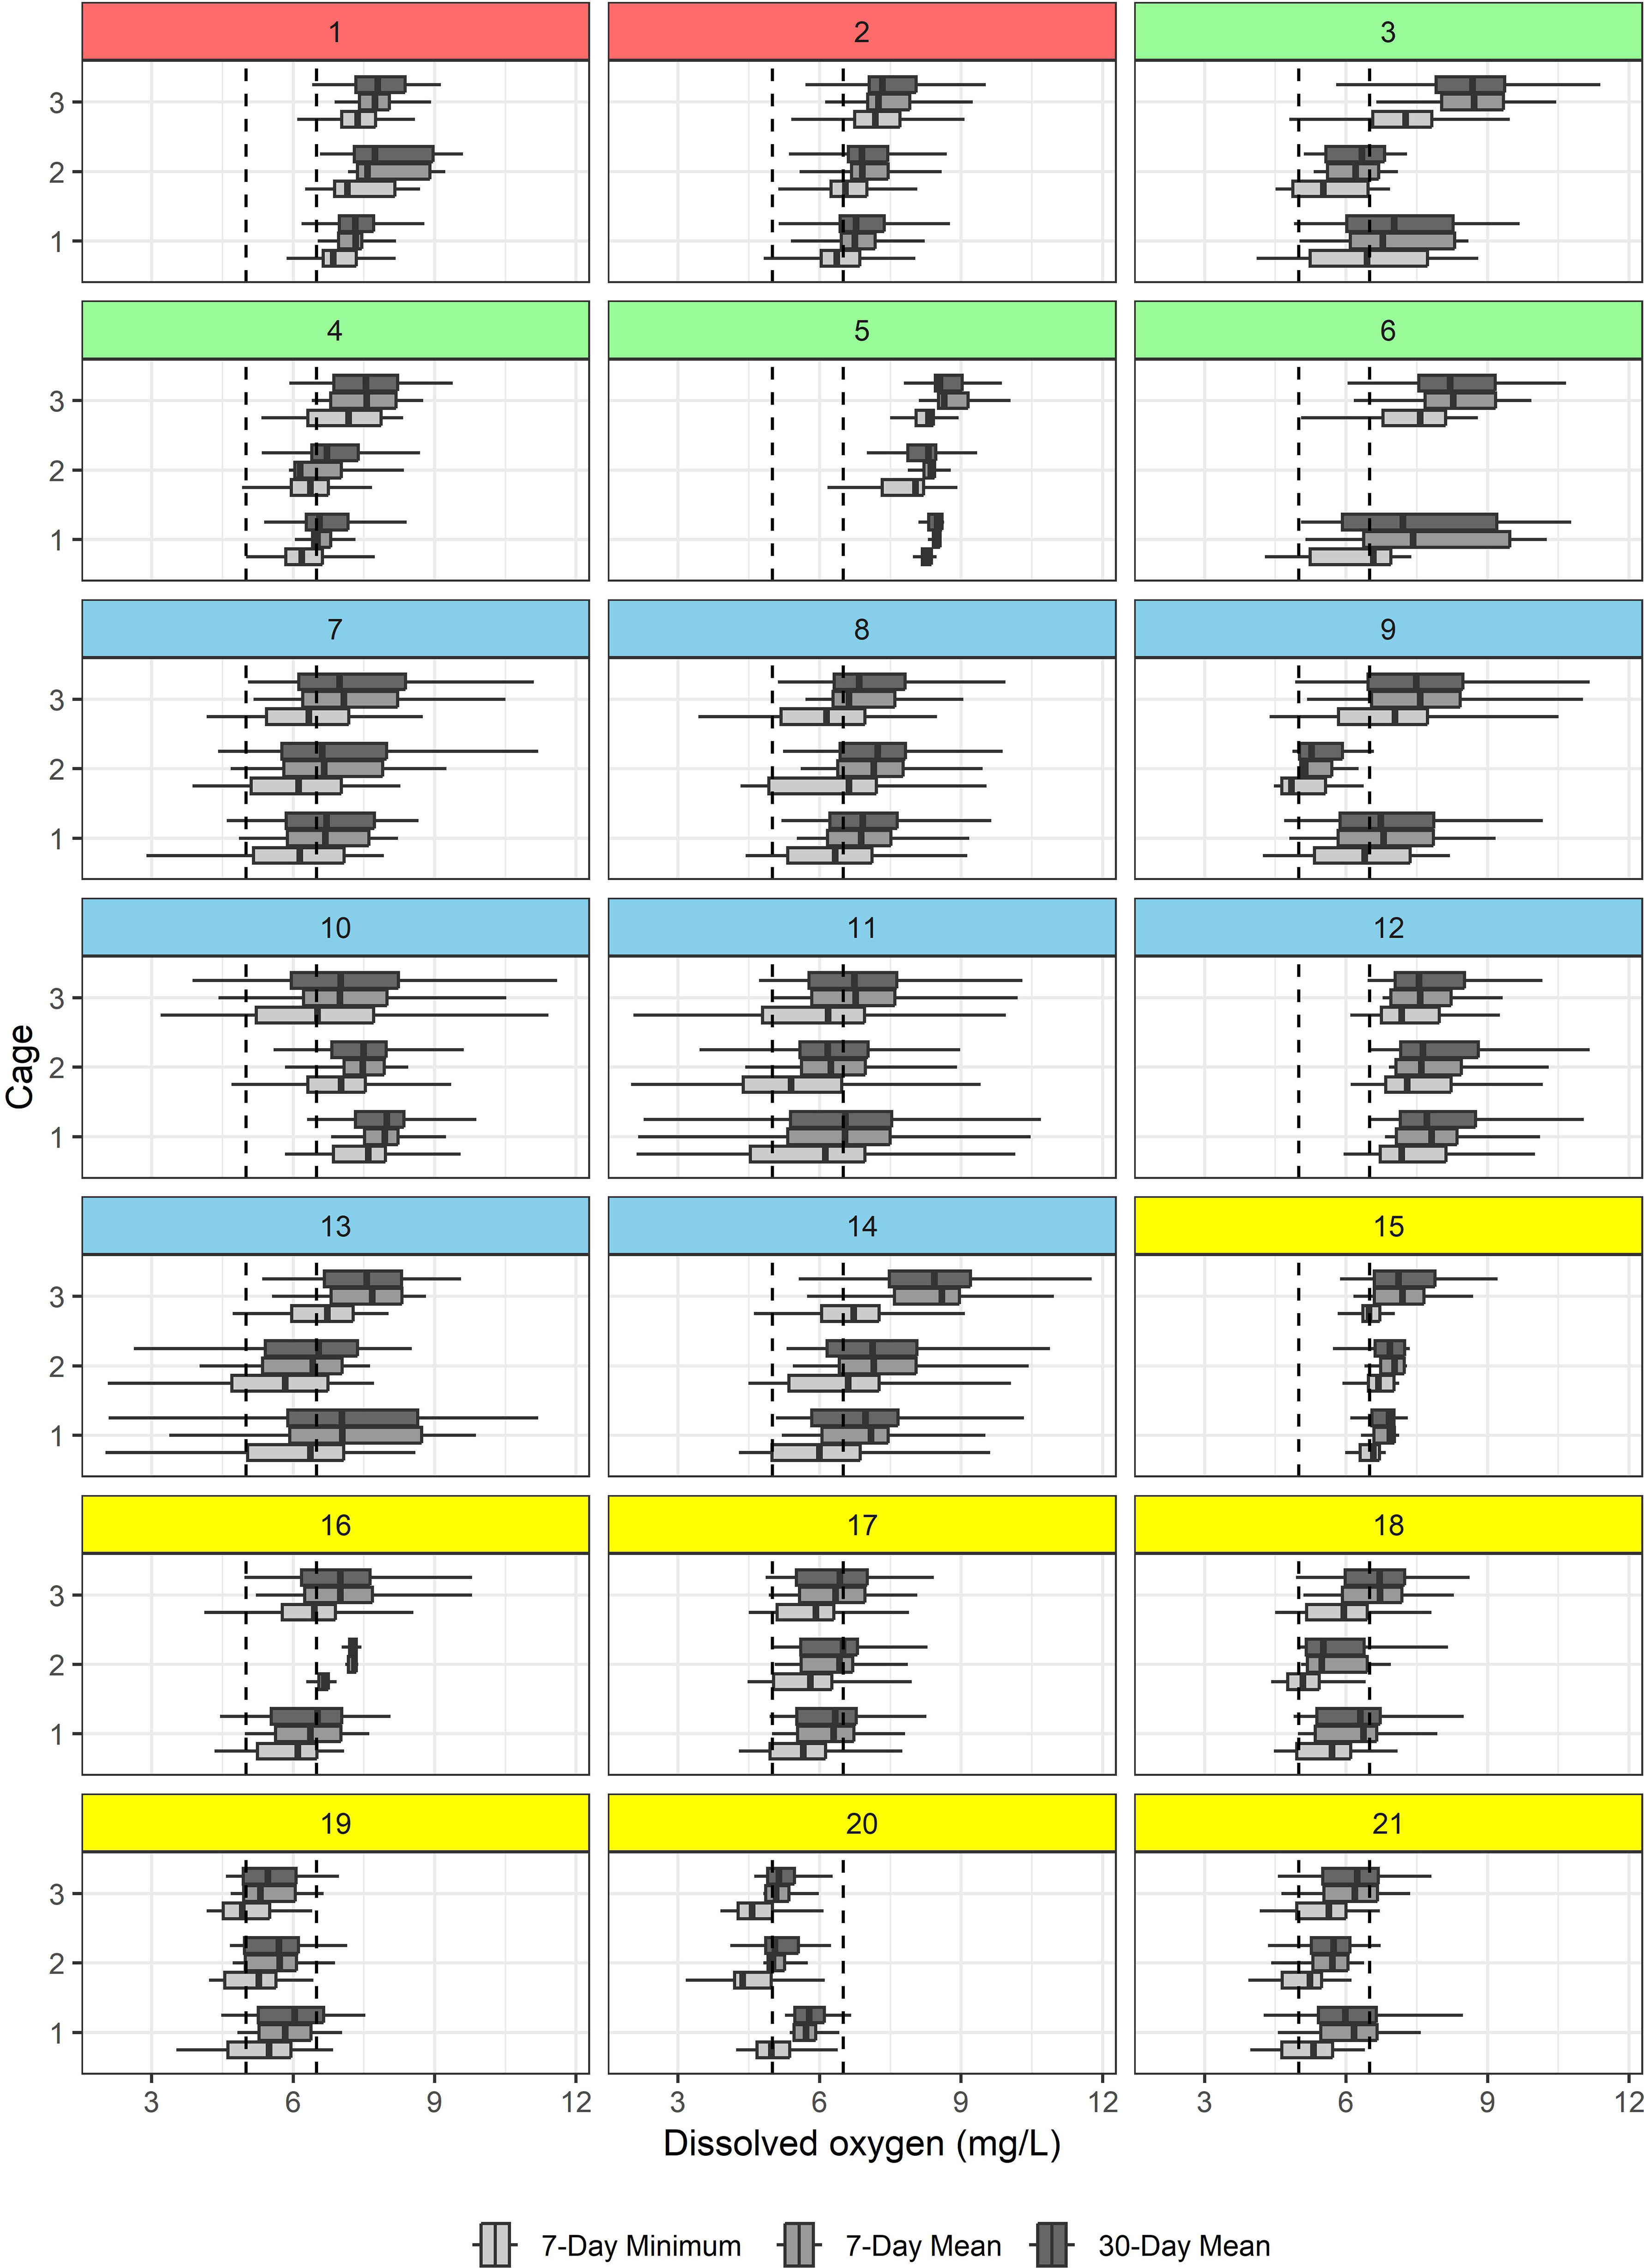
Figure 2 Two-number criteria summaries of 7-day minimum, 7-day mean, and 30-day mean. The dashed vertical black lines at 5 mg/L represent the criterion for 7-day minimum, and the dashed vertical black lines at 6.5 mg/L represent the criteria for the 7-day mean and the 30-day mean. The color for each site corresponds to its respective aquaculture area (see Figure 1).
The proportion of time points classified as either ‘sub-optimal’ or ‘stressed’, according to production impairment classifications (DO <7 mg/L; also referred to as hypoxic episodes) for the 21 sites revealed spatiotemporal trends (Figure 3). The proportion of hypoxic episodes was shown to be higher in the southeastern region than its northwestern counterpart. In addition, there was a visual seasonal trend to the hypoxic episodes among the 21 farms, where starting in August, until November, there was a remarkably higher proportion of hypoxic episodes (DO <7 mg/L), while in contrast, the time period from February to May appeared to have the lowest proprotions.
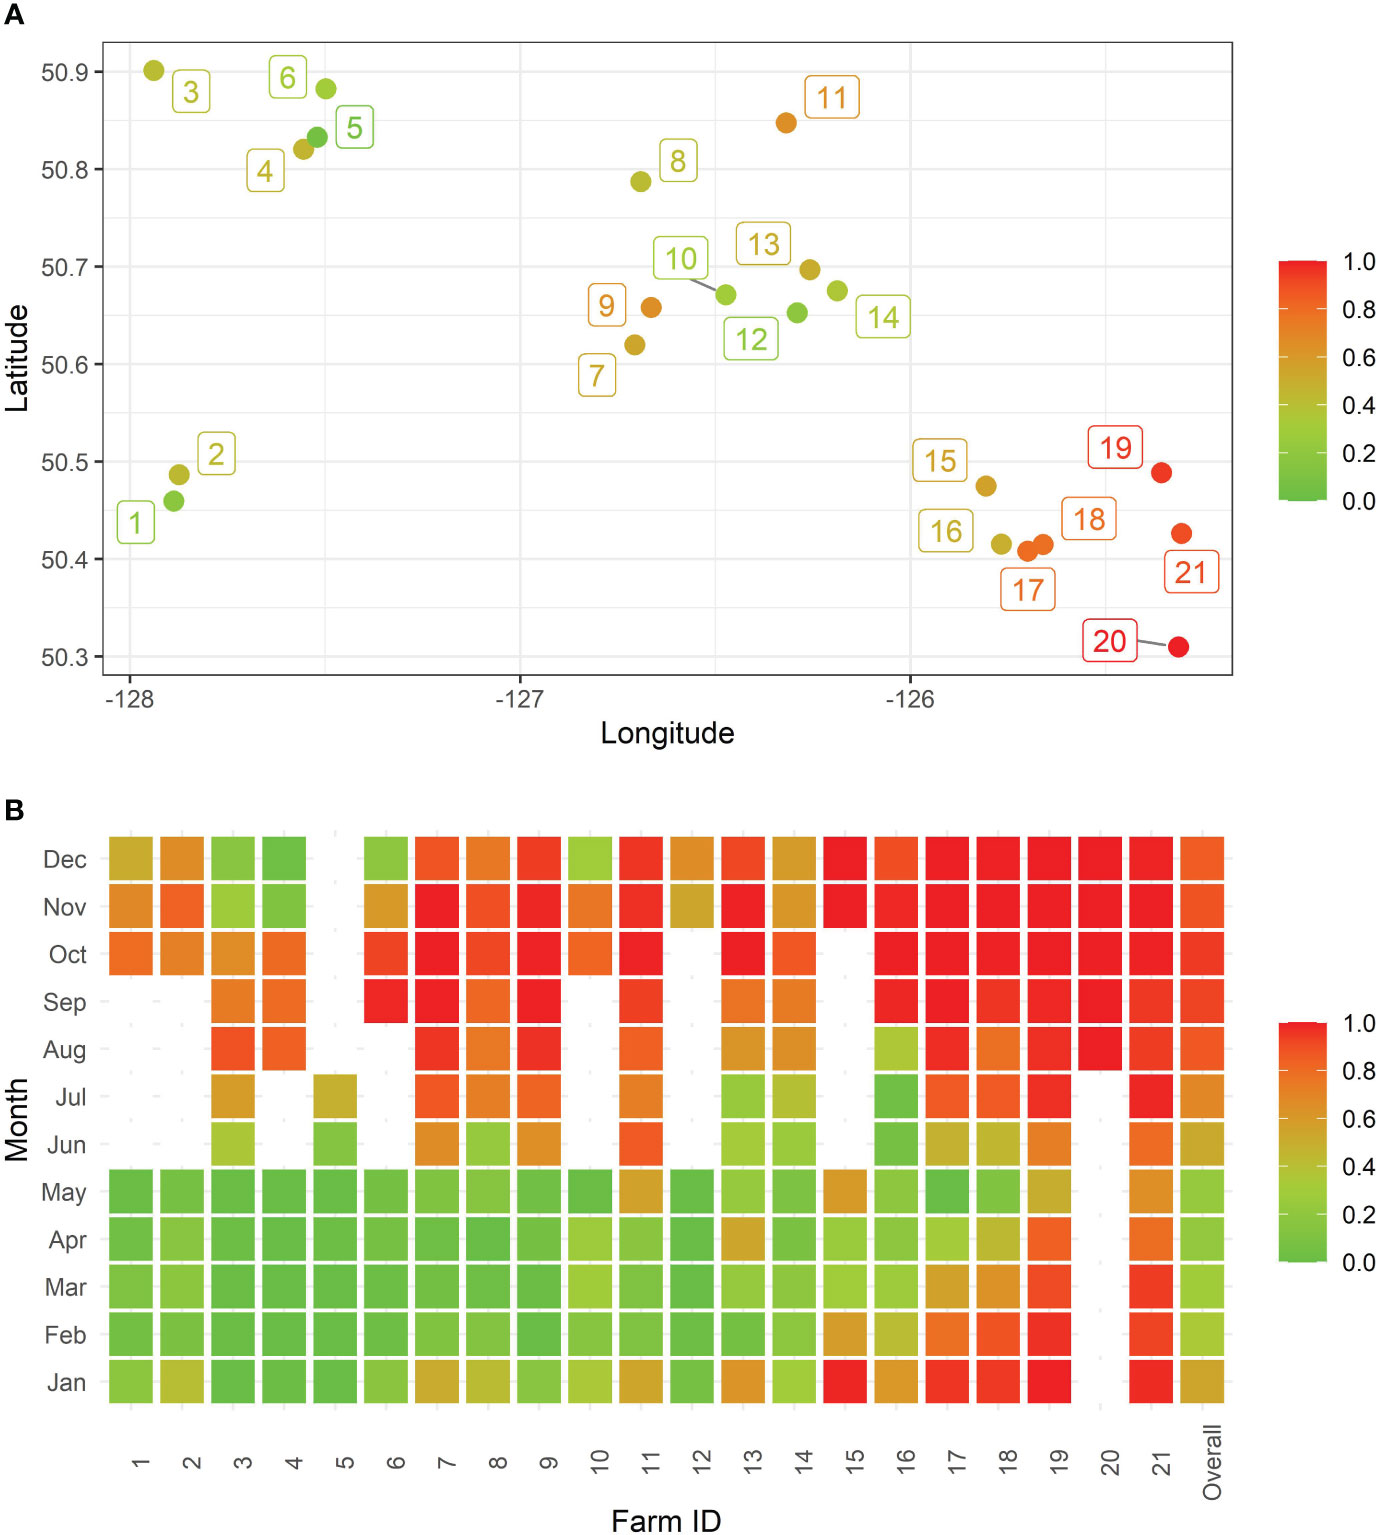
Figure 3 Proportions of hypoxic episodes, calculated as the number of hours with dissolved oxygen concentrations less than 7 mg/L divided by the total number of observed hours, stratified across aquaculture sites to show (A) geographical and (B) temporal distributions. Note that blank months represent those months with missing DO values.
3.2 Association between DO and other environmental factors
The relation of daily average minimum DO concentration and daily maximum temperature revealed distinct patterns based on whether the temperatures at the aquaculture sites were below or above 10°C (Figure 4). At lower temperatures (≤10°C), rising temperatures were linearly associated with decreasing DO concentrations, whereas at higher temperatures, increasing temperatures were associated with an increase in DO concentrations. In addition, it was found that DO concentrations were substantially different among cages, even in the same aquaculture site, as shown in the case of farms 3, 5, 11, and 13 (Figure 4).
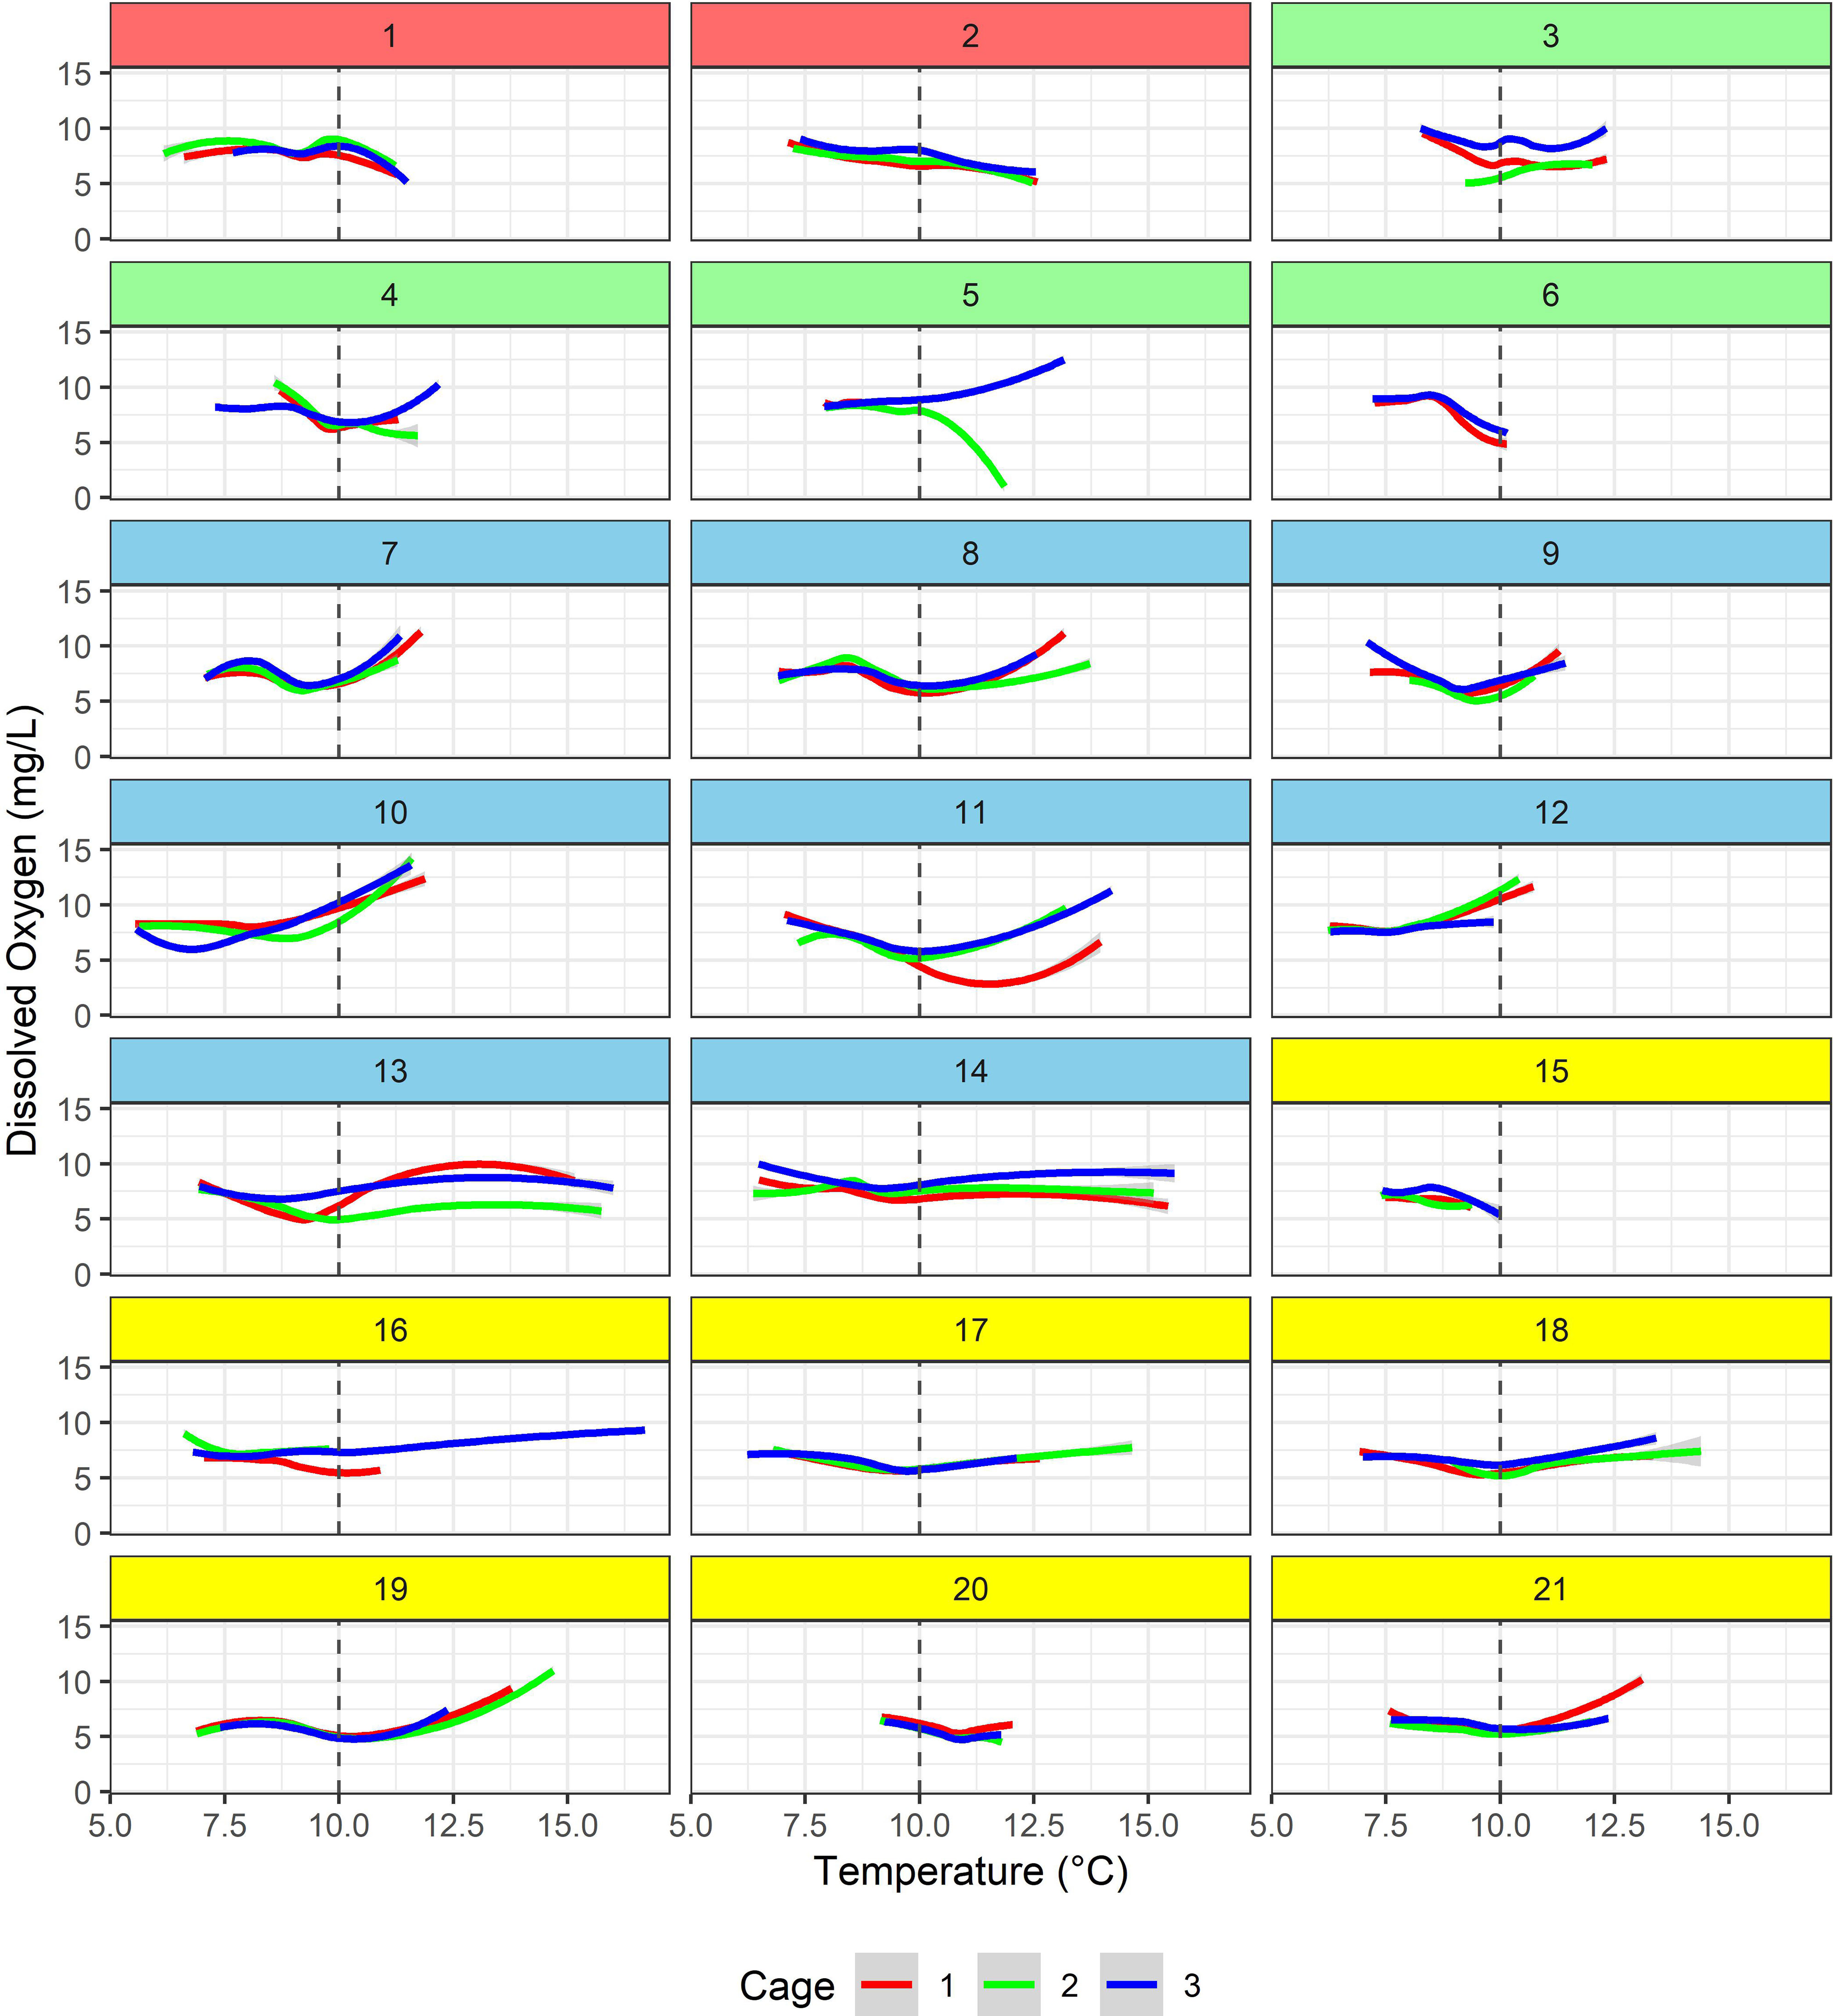
Figure 4 Locally-weighted smoothing (LOWESS) line plots showing the relationship between hourly dissolved oxygen concentration and temperature for each cage within each of the 21 aquaculture sites. The time-series regression models included temperature as a linear spline, with a knot placed at 10°C, marked here for reference (dashed vertical lines). The color for each site corresponds to its respective aquaculture area (see Figure 1).
In the dataset of daily average minimum DO concentrations from the 21 aquaculture sites, 95% of the values fell within the range of 2.94 to 8.44 mg/L, with a median value of 5.87 mg/L. These sites exhibited relatively lower DO concentrations during summer and autumn, whereas they recorded relatively higher DO concentrations during spring and winter (Figure 5). The daily maximum temperature had a 95% range between 6.89 and 13.29°C with a median value of 9.22°C, and the temperature showed a seasonal trend that was inversely related to DO. Daily precipitation ranged from none (<1 mm) to 76.80 mm, and 45% of the days during the study period had no precipitation (<1 mm), while 55% of the total precipitation data recorded had ≥1 mm of precipitation (averaging 8.45 mm). The minimum recorded wind speed (maximum daily gust) was 30 km/h, as expected since that is the minimum reported by the weather stations, with the maximum speed as high as 163.00 km/h, with 18% of the observations with winds less than 30 km/h. The wind speed showed similar distributions across seasons, although average wind speed was the highest and the lowest in summer and winter, respectively. When aph(443) values were available, the minimum recorded aph(443) coefficient value was 0.006, with the maximum at 0.352, however, 72% of the observations had missing values and were given a constant of 0.003. The aph(443) values increased from spring to a peak in the summer with the smallest average values in autumn and winter. The distribution of wind direction displayed a very clear bimodal shape, in which the observations of wind direction concentrated either near 100° or near 300°. Westerly winds were dominant in the spring and summer months, while easterly winds were more prominent in the autumn and winter months. Consequently, wind direction was also categorized as ‘southwest wind’ and ‘northeast wind’.
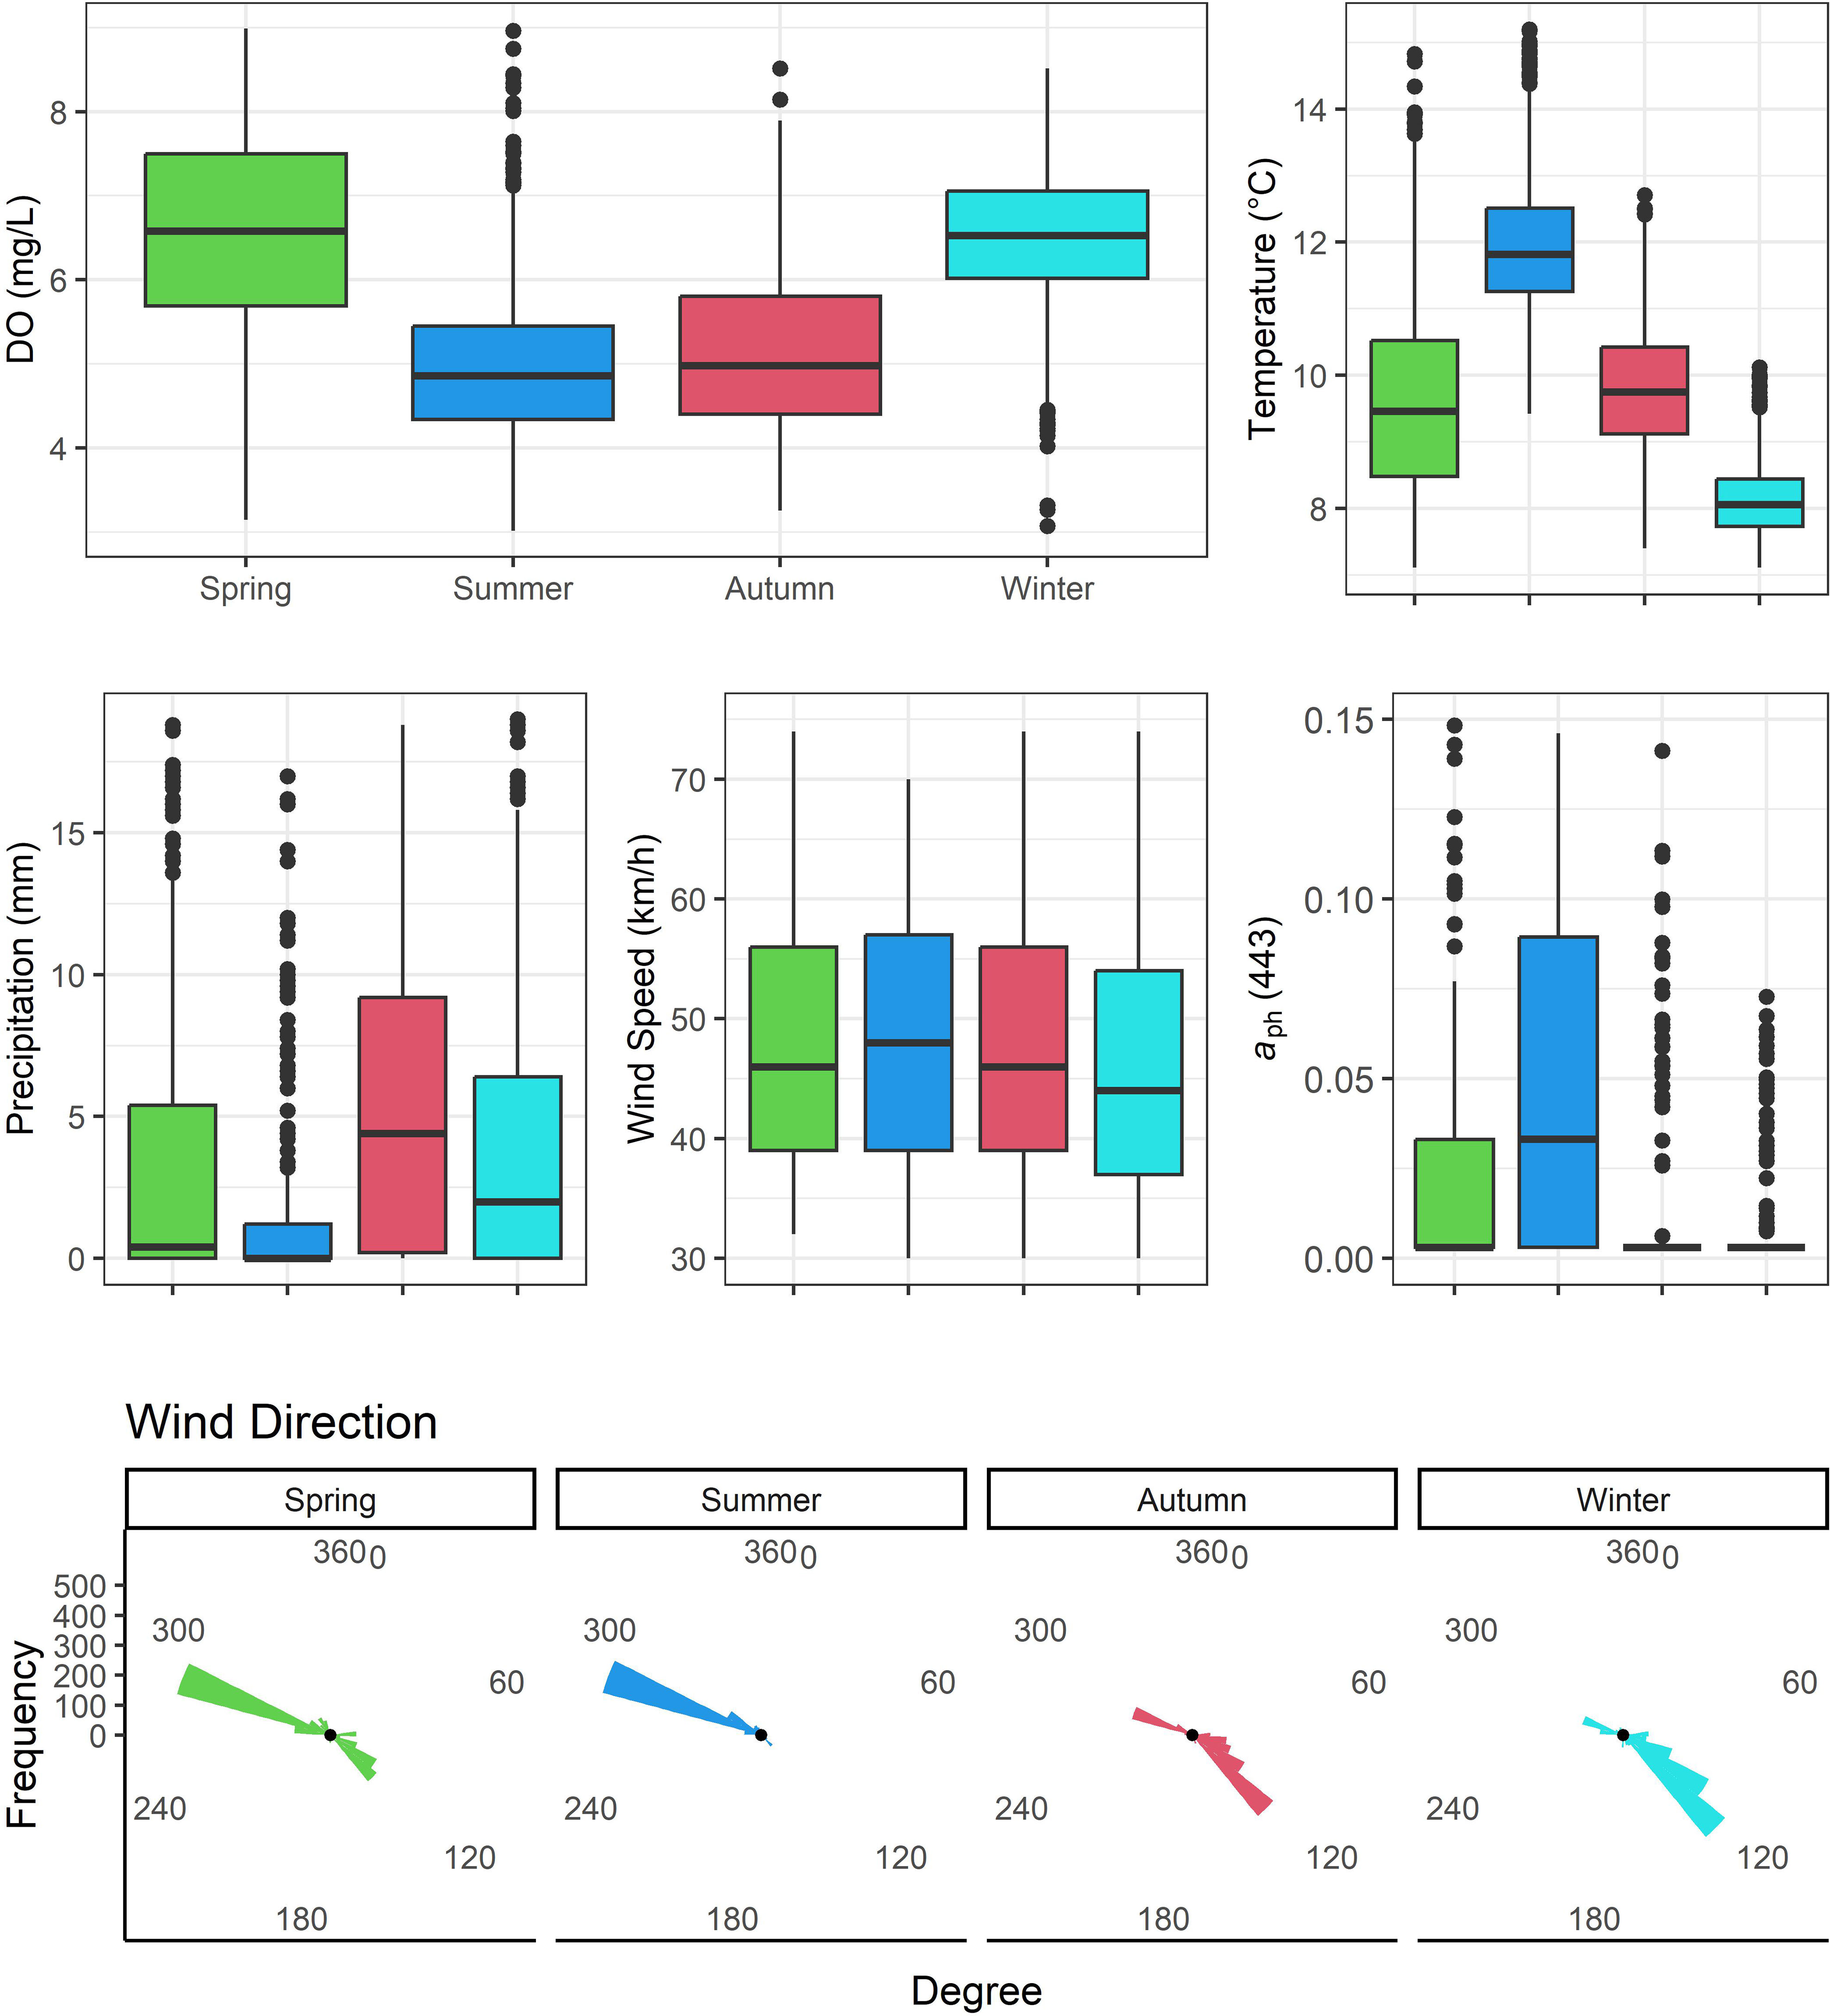
Figure 5 Distributions of daily minimum dissolved oxygen concentration, daily maximum temperature, daily total precipitation, daily wind speed (max. gust above 30 km/h), and daily regionally-averaged aph(443) coefficients, stratified by seasons (identical colors in all plots) for all 21 aquaculture sites. Bottom panel shows circular histograms of daily wind direction (max. gust above 30 km/h; N = 360°), also stratified by seasons.
The correlation matrices of daily average minimum DO concentrations and environmental predictors showed markedly different patterns depending on seasons (Supplementary Figure 2). For example, the season for which maximum temperature had the strongest correlation with DO concentrations was in spring (ρ = -0.24), with changes in direction and magnitude in other seasons (summer ρ = 0.12; autumn ρ = -0.15, and winter ρ = -0.12). In the case of wind speed, daily average minimum DO was shown to have mildly positive correlations in autumn and winter (ρ = 0.32 and 0.28, respectively), but nearly no correlations in spring and summer (ρ = -0.05 and 0.05, respectively). The aph(443) values produced the strongest negative correlation with daily average minimum DO in autumn (ρ= -0.29), with very weak negative correlations in the spring and summer (ρ = -0.05 and -0.09, respectively), and nearly no correlation in the winter months (ρ = 0.03).
3.3 Time-series regression modelling
As observed in Figure 6, there were temporal gaps in the data recorded from the loggers, where most sites (n=13) included some data for all four seasons, while others were more intermittent and managed to only include a couple of seasons. Initial time-series plots of daily average minimum DO concentrations and daily maximum temperature seemed to reveal an inverse relationship (Figure 6). However, during summer the decrease in daily average minimum DO concentration did not appear to correspond to the increase in daily maximum temperature. The observations of daily average minimum DO concentration and daily maximum temperature showed different patterns depending on the recorded temperature (colder [ ≤ 10°C] vs. warmer water [>10°C]), and this trend was commonly observed across 21 aquaculture sites (Figure 4). Without stratifying the effect of colder and warmer water with a linear spline, the overall estimate of the effect of daily maximum temperature (β=0.01; 95% CI: -0.04, 0.06) on daily average minimum DO concentration in univariable analysis was not significant. However, with the addition of a spline, the overall estimates of the effect of daily maximum temperature on daily average minimum DO concentration was significant for both groups (colder water [β=-0.17; 95% CI: -0.30, -0.04] and warmer water [β=0.07; 95% CI: 0.04, 0.11]).
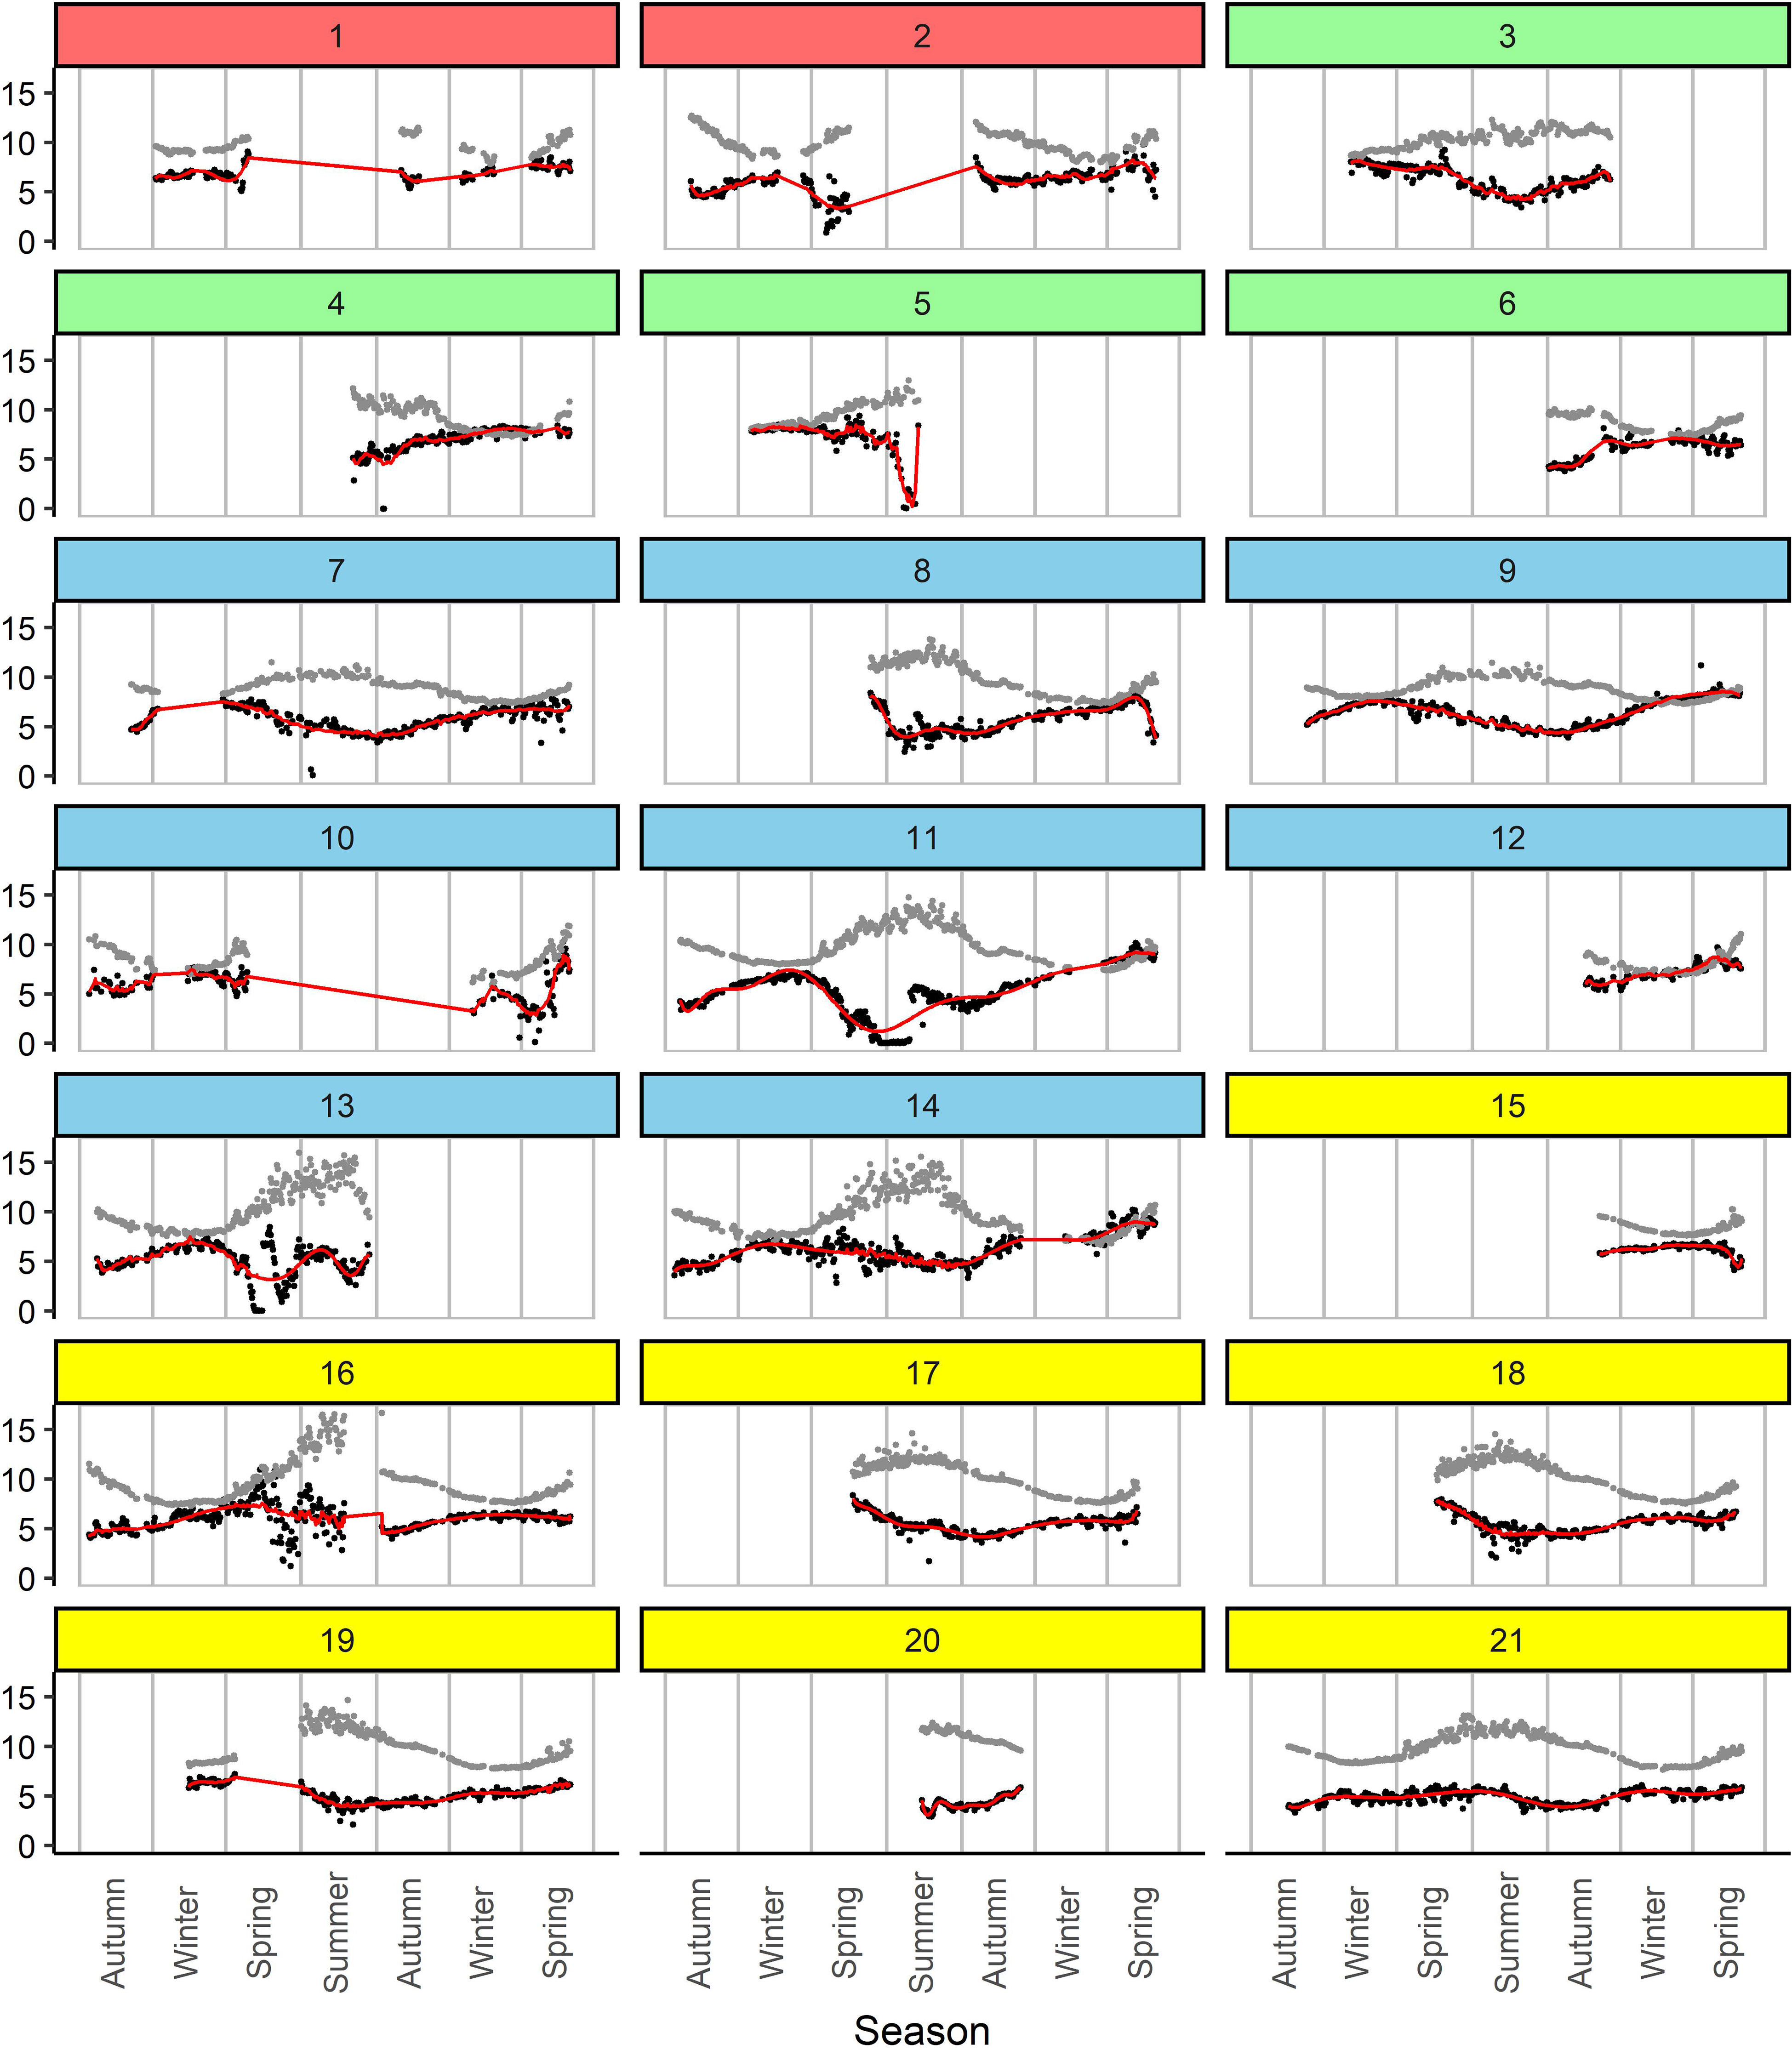
Figure 6 Time-series plots of daily average minimum dissolved oxygen (DO) concentration (black dots) and daily maximum temperature (gray dots) across the 21 aquaculture sites in British Columbia between October 2015 and May 2017. Y-axis represents both DO concentration (mg/L) and temperature (°C). The color for each site corresponds to its respective aquaculture area (see Figure 1).
Seasonal trends were assessed with complete data from 13 aquaculture sites. The overall effect for daily maximum temperature was positive in the spring and summer (β = 0.115, P = 0.083; β = 0.095, P = 0.007, respectively) and negative in the autumn and winter (β = -0.073, P = 0.458; β = -0.532, P < 0.001, respectively), noting that both summer and winter were statistically significant (Table 2). None of the remaining environmental predictors were found to be statistically significant (P > 0.05) in all four seasons, except for both wind direction (SW vs. NE; P = 0.016) and aph(443) (P = 0.002) during the winter period.
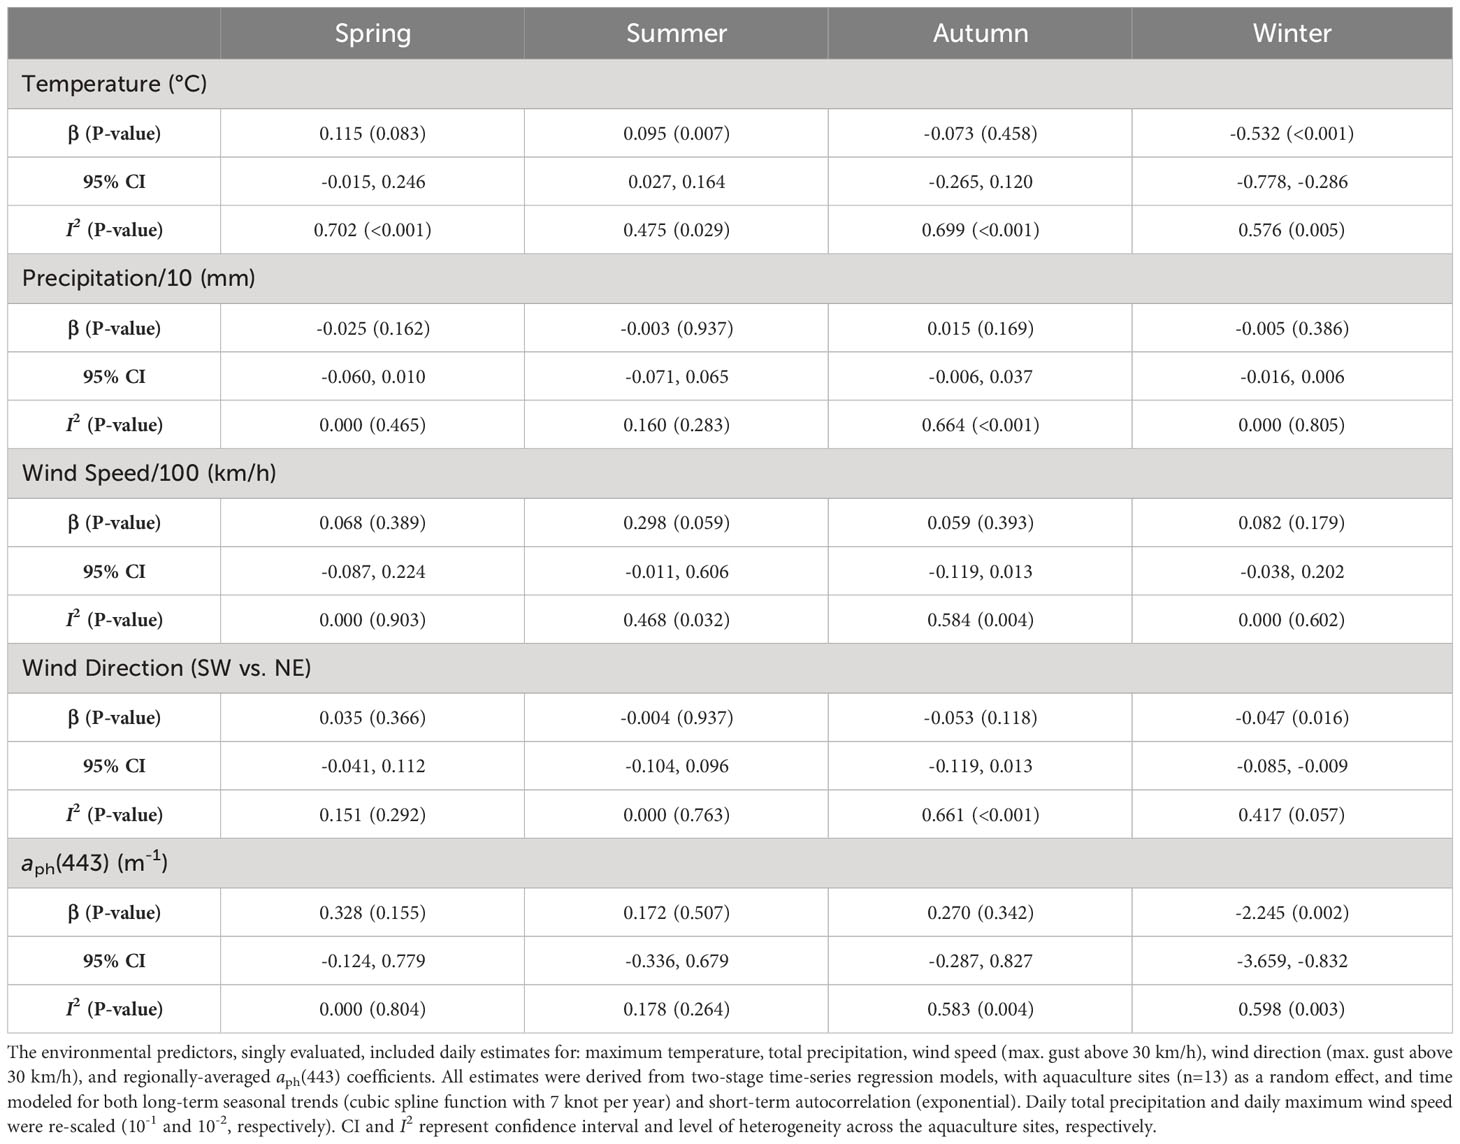
Table 2 Estimates produced from univariable associations between the average daily minimum dissolved oxygen concentration and various environmental predictors, stratified by seasons.
The most parsimonious model with statistically significant predictors included the following environmental predictors: daily maximum temperature (spline, with knot at 10°C), daily maximum wind speed (spline, with knot at 55 km/h), and daily regionally-averaged aph(443) coefficient (pooled estimates presented in Figure 7). Across all 21 aquaculture sites, higher temperatures (>10°C), faster wind speeds (>55 km/h), and daily regionally-averaged aph(443) coefficients were all positively associated with daily average minimum DO concentrations (P = 0.010, P = 0.043, and P = 0.047, respectively). When accounting for temperature, wind speeds and aph(443), precipitation and wind direction were not statistically significant predictors (P = 0.532 and P = 0.169, respectively; models not shown).
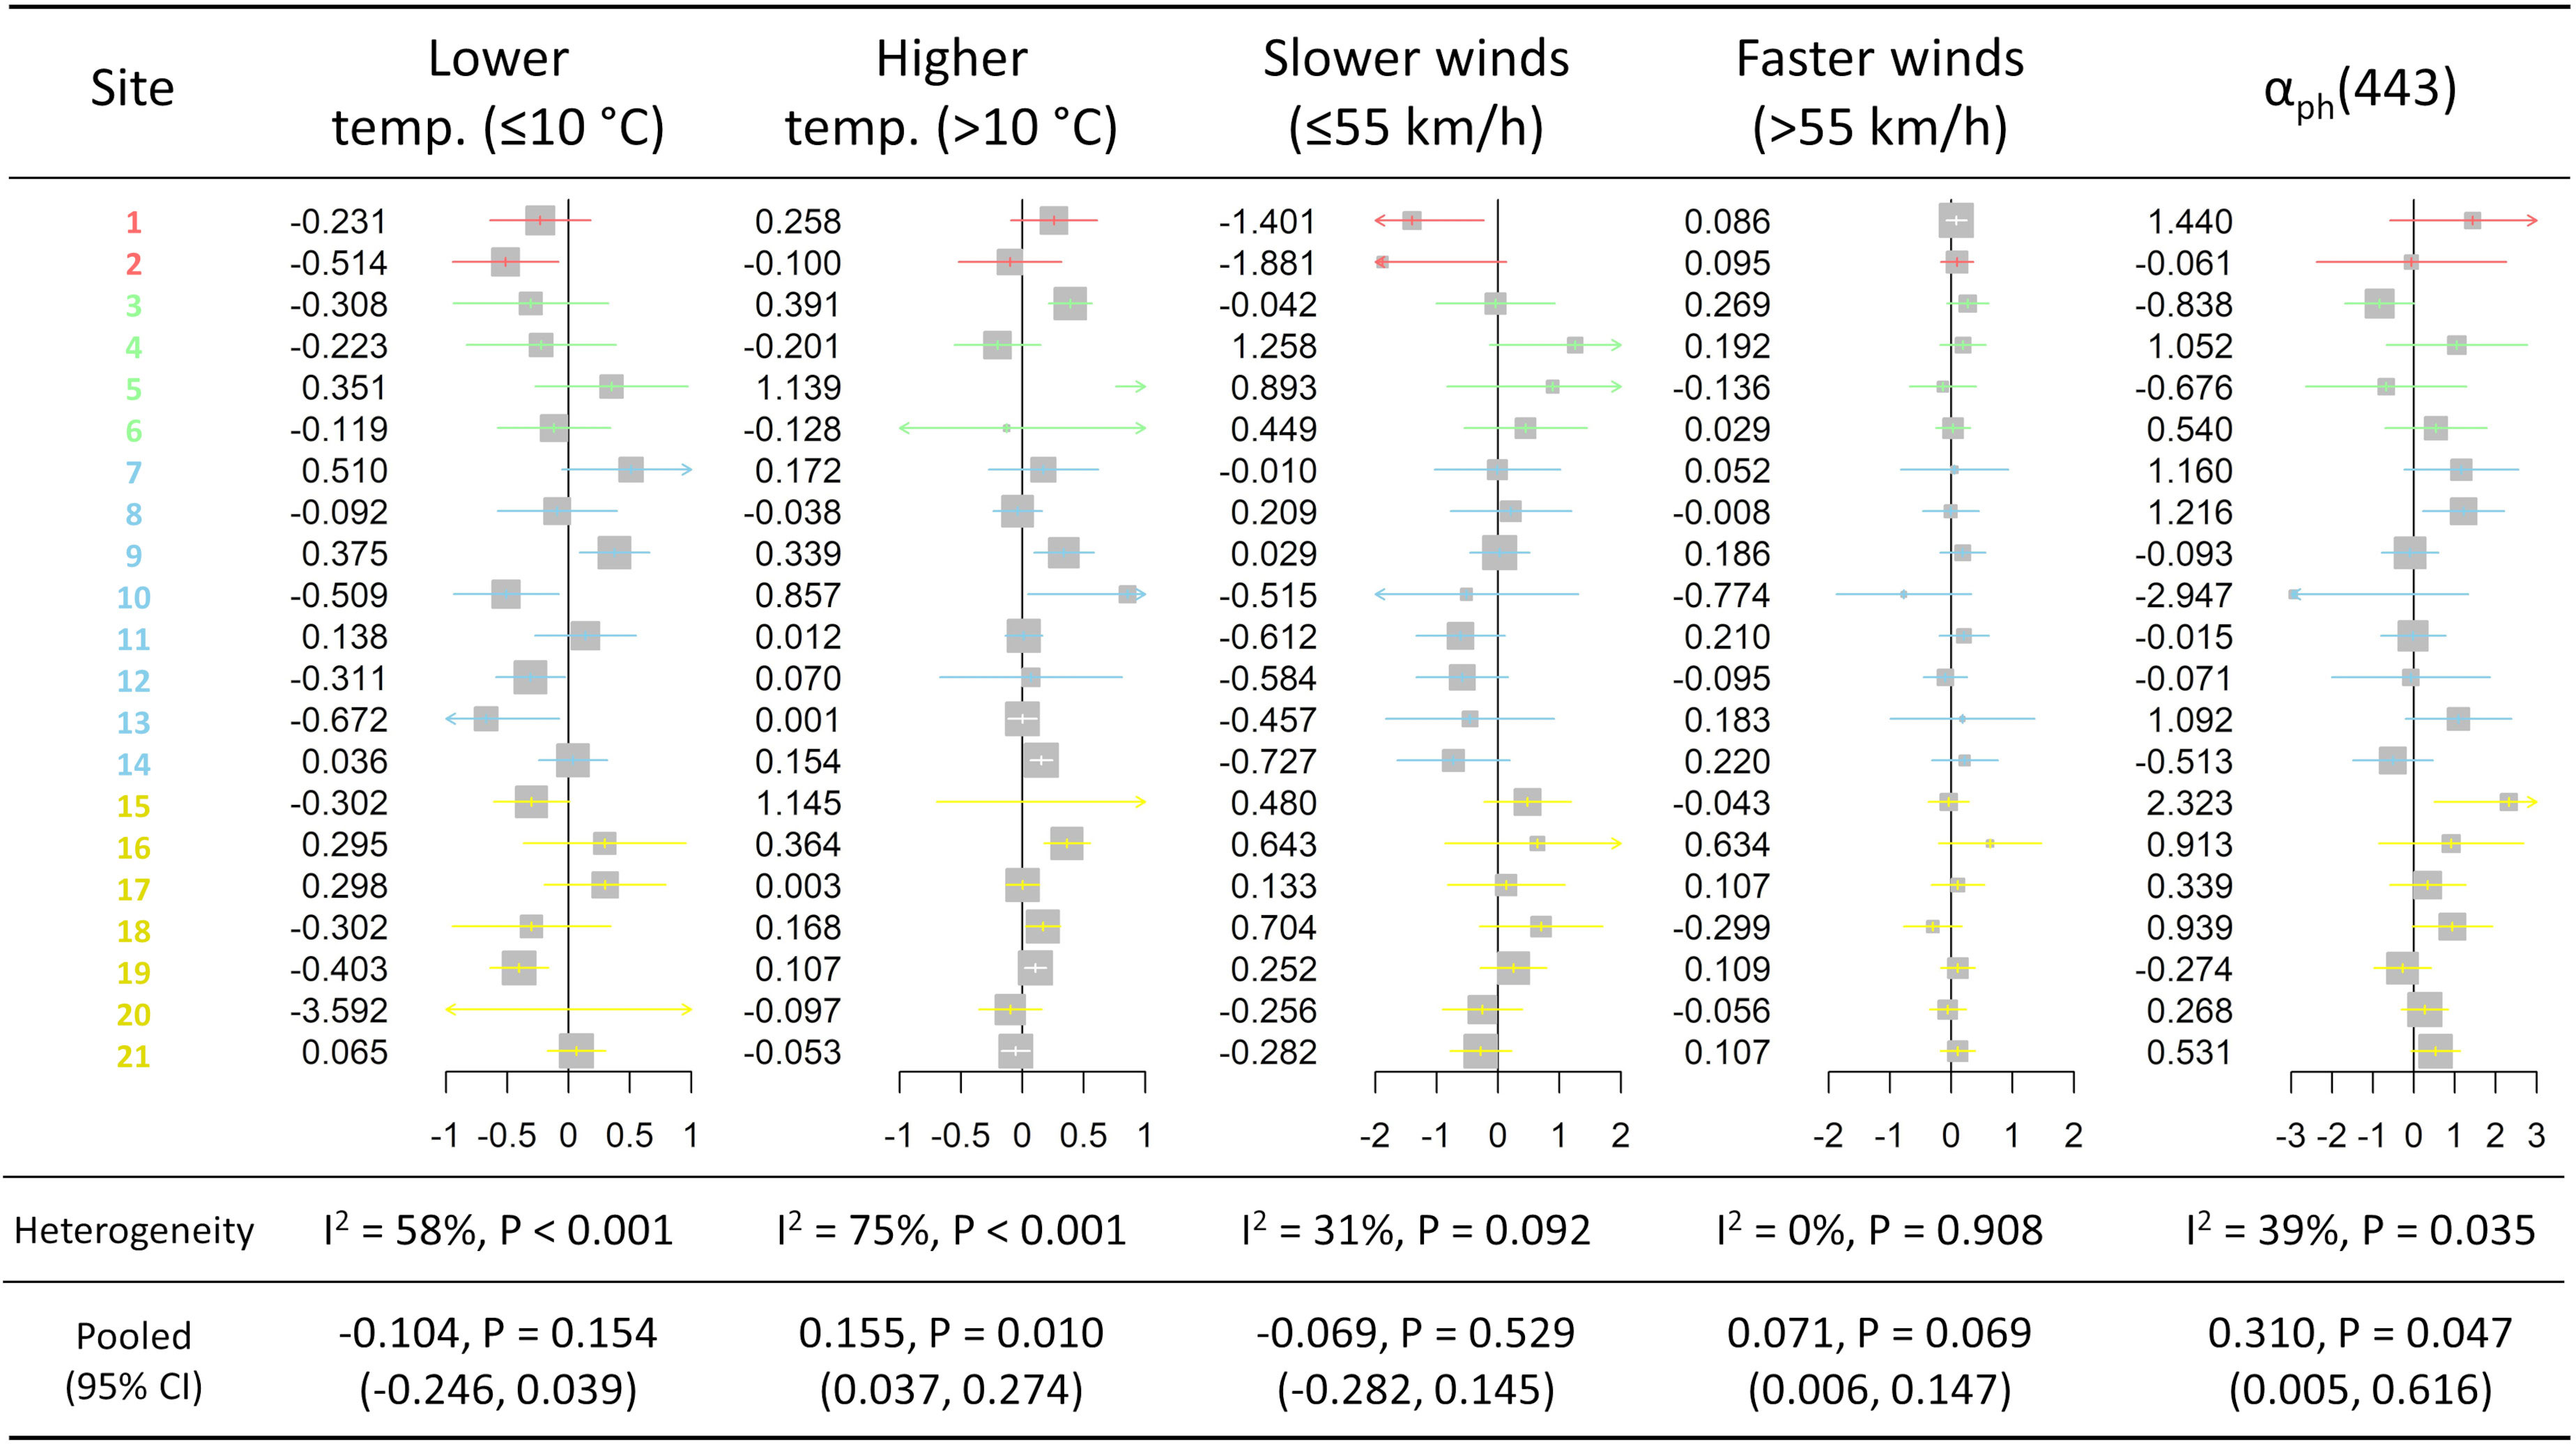
Figure 7 Forest plots produced from the two-stage time-series analysis, showing the meta-analysis results, across all 21 aquaculture sites, from coefficients derived from mixed multivariable regressions of the average daily minimum dissolved oxygen concentration as the outcome and various environmental predictors as fixed effects, with both long-term seasonal trends (cubic spline function with 7 knot per year) and short-term autocorrelation (exponential). The environmental predictors included daily estimates for maximum temperature (spline with knot placed at 10°C) with lower temperature estimates (≤10°C) and higher temperature estimates (>10°C), wind speed (max. gust above 30 km/h; spline with knot placed at 55 km/h and re-scaled [10-2]) with slower wind speed estimates (≤55 km/h) and faster wind speed estimates (>55 km/h), and regionally-averaged aph(443) coefficients. I2 represent the level of heterogeneity across the aquaculture sites, and the confidence interval color for each site corresponds to its respective aquaculture areas (see Figure 1). Pooled estimates from all 21 aquaculture sites are also presented with their 95% confidence intervals.
The results of the meta-analysis of the effect of daily maximum temperature on daily average minimum DO concentration were shown with their respective forest plots (Figure 7). For the lower temperature estimates (≤10°C), the 95% confidence interval of the estimate marginally included 0, while the 95% confidence interval of the estimate for the higher temperature group entirely fell on the positive side. The overall linear association between lower temperature (≤10°C) and daily average minimum DO was not statistically significant (P = 0.154), while the pooled linear association between higher temperature (>10°C) and daily average minimum DO across all sites was statistically significant (P = 0.010) (Figure 7). Interestingly, there did not appear to have a geographical pattern to the association of DO with either lower or higher temperatures with wide variety of effects among sites within areas. The 95% confidence interval of estimate of the group of slower wind speed marginally included 0, while the 95% confidence interval of estimate of the group of faster wind speed entirely fell on the positive side (Figure 7). The association between daily maximum wind gust speed and daily average minimum DO, for slower maximum speeds (≤55 km/h), was not statistically significant (P = 0.505), while it was statistically significant (P = 0.043) for faster maximum speeds (>55 km/h) (Figure 7). The 95% confidence interval of estimate of aph(443) was above 0 (Figure 7). The daily regionally-averaged aph(443) coefficient was positive and statistically significant (P = 0.047) (Figure 7), while there was no obvious geographical trend to the effect of aph(443) on daily average minimum DO concentrations – perhaps with the exception of the Discovery Islands area (yellow horizontal lines from Site 15 to 21 in Figure 7), where aph(443) appears to have a slightly more consistent effect on daily average minimum DO concentrations than the remaining areas.
4 Discussion
By using in-cage DO logger data concurrently with historical remotely-sensed and regional weather data, we were able to analyze spatiotemporal patterns of DO concentrations in relation to environmental variables. The frequency of hypoxic episodes was substantially different among aquaculture sites and among seasons. The time-series regression modelling results emphasized the significance of seasonal effect on DO concentrations, and how much the effect of environmental variables on DO concentrations varied among the aquaculture sites.
The results from the two-number criteria, demonstrating the frequency of hypoxic episodes from 7-day minimum, 7-day mean and 30-day mean thresholds, suggests that both acute and chronic exposures to low DO were occurring simultaneously in aquaculture production systems. This is an important finding, especially when considering that the 30-day mean criterion is deemed to be a period sufficient to produce negative effects on the growth and reproduction of adult salmonids (U.S. Environmental Protection Agency, 1986). In our study, the chronic exposures (30-day mean) to low DO occurred at any moment in all of three cages in 14 of the 20 sites with data for all three cages (Sites 2, 4, 7, 8, 9, 11, 13, 14, 15, 17, 18, 19, 20, and 21; excluded Site 6 with only two cages) during the study period. The low DO concentration resulted from either a series of frequent short-term exposures or prolonged exposures to low DO concentration over a long period of time. Continuous exposure of fish to DO concentrations less than 6.5 mg/L in benthic waters or in vertical stratification have been reported to alter fish physiological processes and spatial distribution (Zhang et al., 2015). To comprehend the impact of low dissolved oxygen (DO) concentrations on overall aquaculture performance, it is crucial to assess fish health, growth and mortality. Unfortunately, we did not have access to health events or mortality data, fish weight information, or feed conversion rate data for the aquaculture sites in our study. Consequently, the effect of chronic exposure to low DO concentrations on the growth and reproductive capacity of salmonids in the study sites remains purely speculative and should be approached with caution. Producers, however, have observed increased mortalities associated with lower DO in fish with pre-existing conditions (e.g. gill damage, deformities, etc.), and during fish-handling events (e.g. sea lice treatments and harvesting). Nevertheless, the observation of short- and long-term hypoxic episodes in these 14 sites are worth noting and likely have an impact on the suitability of these sites for growing salmon, either because of a direct influence on mortality and productivity, or simply by having populations of fish more susceptible to sudden fluctuations in oxygen levels in coastal waters.
Spatial variation in DO concentrations across aquaculture areas and sites was observed in this study, and the variation was more obvious for low DO episodes, as defined by the production impairment classification and the two-number criteria. Previous publications also found substantial spatial variation in DO levels of salmon sea cages (Johansson et al., 2006; Johansson et al., 2007; Oppedal et al., 2011; Solstorm et al., 2018). This variation might be related to aquaculture management practices, geological or geographical locations of the aquaculture sites (Page et al., 2005), environmental and climatic factors, and the oxygen fluctuation and consumption conditions within sites. Geographically, we found that the proportion of hypoxic episodes, based on the production impairment classification, varied among areas (Figure 3A), suggesting that some of the causes of low DO may be occurring at a larger regional scale.
Although we did not have information on the stocking density of each cage in our study, presence of fish within cages and their stocking density have been found to relate to variations in DO levels and cage-level oxygen consumption dynamics (Johansson et al., 2007). Larger cages with increased total biomass is linked to a decrease in DO levels and an increased risk of hypoxia due to greater oxygen consumption rate (Alver et al., 2023). Also, other factors such as the horizontal variability in water current speed and direction, sea cage physical structure (including netting), net fouling, and even the position of the cages within aquaculture sites may be responsible for some of the spatial and cage-level variations in hypoxic patterns (Johansson et al., 2006; Johansson et al., 2007; Solstorm et al., 2018). When producers observe hypoxic events on sites and/or in specific cages, they likely will adapt their feeding strategies, run air diffusers (passing air bubbles through deeper waters to oxygenate and create water movement) and increase net cleaning frequencies to improve water circulation.
The application of the time-series regression modeling approach to water quality and other environmental data allows the assessment of potential relationships between water quality and environmental parameters (Huang and Schmitt, 2014). The variables that we examined in the time-series regression analyses have been previously recognized as potential influential factors for DO concentrations within sea cages (Li et al., 2018). Importantly, the chosen time scale for a study can also have a potentially large impact on the observed associations between the environmental variables and DO concentrations (Rajwa-Kuligiewicz et al., 2015). Thus, for our study to focus on the short-term association between DO concentration and the environmental predictors, we controlled for long-term trends (i.e. seasonality) by a piecewise polynomial function in our time-series regression analyses, as demonstrated in Figure 4 with smoothed curves of DO concentration over time (Bhaskaran et al., 2013).
Previously published studies reported that low levels of DO concentration were commonly observed during the warmer months (Page et al., 2005; Mansour et al., 2008), and it is a well-known fact that the amount of oxygen that can dissolve in water is inversely proportional to the temperature of water. However, our findings show a pattern for the higher temperature ranges, both in the summer months (Table 2) and with a linear spline (knot at 10°C; Figure 7), that there is more dissolved oxygen (measured as daily average minimum DO) as the water gets warmer (Figure 4). Similarly, the seasonal trend of DO concentration was not necessarily the lowest during summer (Huang and Schmitt, 2014). Interestingly, Rajwa-Kuligiewicz et al. (2015) have also reported that higher concentration of DO was observed with higher water temperature over both short and long-time scales, in which the relation of DO concentration and water temperature appeared to make a hysteretic loop, rather than an inversely proportional linear relation. This loop may be caused by the cyclical patterns of other climatic conditions, such as a light-driven photosynthesis of algae, than from strictly water temperatures. In our study, looking at seasonal patterns for DO and environmental predictors (Figure 5), we can see relatively consistent temperature profiles in spring and autumn, while we observed high DO concentration during spring and low DO concentration during autumn, in conjunction with relatively high aph(443) in spring and low aph(443) in autumn, and completely opposite wind directions between the two seasons – all of which may have contributed to these results. Therefore, while oxygen solubility and DO concentration in aquatic ecosystems are primarily temperature-dependent (Remen et al., 2014), the effect of temperature on DO concentration in salmon aquaculture sites in BC, Canada may be reversed by other driving factors, in what are most likely multifactorial hypoxic episodes.
In our study, no significant association was observed between daily average minimum DO concentration and total precipitation, which is consistent with previous studies (Tyler et al., 2009; Rajwa-Kuligiewicz et al., 2015). From our time-series regression analysis, however, maximum wind gust speed >55 km/h tended to increase daily average minimum DO concentration across the sites (Figure 7). This finding further supports the evidence that increased wind-speed, which improves the air-water oxygen transfer process, does lead to a better DO supply in the water column. Effects of wind mixing include the diffusion of atmospheric oxygen through air-water interface, vertical mixing, and breaking up of any vertical stratification of the water column, all of which may lead to relieving hypoxia (Scully, 2010; Jonasson et al., 2012; Ni et al., 2016).
Lastly, the association between DO concentration and aph(443) was found to be significant. The ability to successfully capture remotely sensed data, such as sea surface aph(443) coefficients, depends heavily on having clear (cloud-free) skies. During the study period, we had aph(443) data for only about 28% of the days, and the missing data were replaced with a constant minimum value of 0.003 (representing halfway between the minimum value and zero). Considering that phytoplankton activity is related to sunlight, this was deemed biologically appropriate for these analyses, however, knowledge of the effects of clouds on aph(443) coefficients would better inform these assumptions. For example, future adjustments could be based not only on the use of missing absorption data, but also on using cumulative or historical sunlight data to better capture both temporal exposure and intensity to solar radiation. Ideally, researchers would be able to estimate regional amounts of phytoplankton biomass and know if this biomass is alive and undergoing photosynthesis or respiration, or if it is dead/dying and consuming oxygen as it naturally decays in the coastal waters. Part of the issue also relates to defining an appropriate geographical region, and currently, the resolution is set at 4 km, which is problematic for coastal waters surrounded by land. One solution, as was done for this study, is to average all aph(443) measurements taken in the larger study region, but ideally, future resolution of remotely-sensed data would allow for site-level information to be captured.
One limitation of this study is the somewhat irregular interval in the measurement of DO concentration across the sites. There were many missing data points and temporal gaps over days and weeks, and at some sites and cages there were gaps of missing data for months. These temporal gaps may have introduced some biases into our analysis, especially in the analysis of seasonal periodicity in the DO time-series (Burke et al., 2021). Consequently, due to limited availability of data, we investigated the effects of the environmental factors only on the average daily average minimum DO concentrations, not on the hourly DO concentration, in the time-series regression modelling. Other explanatory variables such as water flow, salinity, microalgal biomass, salmon stocking density, feeding patterns, disease incidence, amount of available sunlight (solar radiation), pH, inorganic nutrients, and other aquaculture management practices (including cage-level aeration with diffusers and increased net cleaning frequencies) may affect DO dynamics and thus ultimately salmon health and productivity. This study also highlighted the importance of measuring DO over a long period, across multiple seasons, to capture and better understand long-term seasonal trends in DO time-series. Moreover, the availability of ambient dissolved oxygen (DO) concentration data would enable a valuable comparison with the DO observations within fish cages, potentially enhancing the analytical depth of our study. This is due to the fact that the distribution of DO levels within a fish cage is contingent on ambient DO levels, which can exhibit seasonal variations (Alver et al., 2022).
In summary, our study confirms that certain aquaculture areas, in British Columbia, do experience repeated short- and long-term hypoxic episodes, below the recommended optimal concentrations (>7 mg/L), with some sites reaching ‘stressed’ levels of DO concentration (<4 mg/L). The DO dynamics among aquaculture sites showed substantial variations across areas and across cages within sites. Our study provided some evidence that DO concentration is not necessarily inversely proportional to temperature in aquaculture sites, but rather that it depends on multiple other environmental factors. Using time-series regression analysis, temperature, wind (gust) speed, and absorption due to phytoplankton [aph(443)] were found to be important variables for predicting DO levels. Exploring DO dynamics is not only necessary for understanding the current biological state and detecting deviation from recommended concentrations to safeguard salmonids but also useful to plan for active monitoring of water quality parameters. Furthermore, the information from this study can help inform baseline parameters for predictive and simulation-type models for regional DO concentrations (Eze and Ajmal, 2020).
Data availability statement
The data analyzed in this study is subject to the following licenses/restrictions: The dataset used in the study is proprietary data generated by salmon farms. Requests to access these datasets should be directed to Krishna Thakura3RoYWt1ckB1cGVpLmNh.
Author contributions
JJ: Data curation, Formal Analysis, Investigation, Visualization, Writing – original draft. BA: Data curation, Writing – original draft. KT: Conceptualization, Formal Analysis, Project administration, Resources, Writing – original draft, Writing – review & editing. HS: Methodology, Validation, Writing – review & editing. BB: Data curation, Writing – review & editing. RV: Conceptualization, Investigation, Methodology, Project administration, Resources, Supervision, Validation, Writing – review & editing.
Funding
The author(s) declare financial support was received for the research, authorship, and/or publication of this article. Funding for this work was provided in part by the Canada Excellence Research Chair in Aquatic Epidemiology.
Acknowledgments
We thank Drs Diane Morrison and Mykolas Kamaitis for their inputs in early discussions on study design and with the preliminary results, along with collecting data from farm sites.
Conflict of interest
The authors declare that the research was conducted in the absence of any commercial or financial relationships that could be construed as a potential conflict of interest.
The author(s) declared that they were an editorial board member of Frontiers, at the time of submission. This had no impact on the peer review process and the final decision.
Publisher’s note
All claims expressed in this article are solely those of the authors and do not necessarily represent those of their affiliated organizations, or those of the publisher, the editors and the reviewers. Any product that may be evaluated in this article, or claim that may be made by its manufacturer, is not guaranteed or endorsed by the publisher.
Supplementary material
The Supplementary Material for this article can be found online at: https://www.frontiersin.org/articles/10.3389/fmars.2023.1289375/full#supplementary-material
References
Abdul-Aziz O. I., Wilson B. N., Gulliver J. S. (2007). An extended stochastic harmonic analysis algorithm: Application for dissolved oxygen. Water Resour. Res. 43, W08417. doi: 10.1029/2006WR005530
Alver M. O., Føre M., Alfredsen J. A. (2022). Predicting oxygen levels in Atlantic salmon (Salmo salar) sea cages. Aquaculture 548, 737720. doi: 10.1016/j.aquaculture.2021.737720
Alver M. O., Føre M., Alfredsen J. A. (2023). Effect of cage size on oxygen levels in Atlantic salmon sea cages: A model study. Aquaculture 562, 738831. doi: 10.1016/j.aquaculture.2022.738831
Bhaskaran K., Gasparrini A., Hajat S., Smeeth L., Armstrong B. (2013). Time series regression studies in environmental epidemiology. Int. J. Epidemiol. 42, 1187–1195. doi: 10.1093/ije/dyt092
Burke M., Grant J., Filgueira R., Stone T. (2021). Oceanographic processes control dissolved oxygen variability at a commercial Atlantic salmon farm: application of a real-time sensor network. Aquaculture 533, 736143. doi: 10.1016/j.aquaculture.2020.736143
Carter K. (2005). The effects of dissolved oxygen on steelhead trout, coho salmon, and chinook salmon biology and function by life stage. Calif. Reg. Water Qual. Control Board North Coast. Reg. 10.
Correa-González J. C., Chávez-Parga Ma. d. C., Cortés J. A., Pérez-Munguía R. M. (2014). Photosynthesis, respiration and reaeration in a stream with complex dissolved oxygen pattern and temperature dependence. Ecol. Model. 273, 220–227. doi: 10.1016/j.ecolmodel.2013.11.018
Cox B. (2003). A review of dissolved oxygen modelling techniques for lowland rivers. Sci. Total Environ. 314–316, 303–334. doi: 10.1016/S0048-9697(03)00062-7
Eze E., Ajmal T. (2020). Dissolved oxygen forecasting in aquaculture: A hybrid model approach. Appl. Sci. 10, 7079. doi: 10.3390/app10207079
Fisheries and Oceans Canada (2015). Regulating and monitoring British Columbia's marine finfish aquaculture facilities: 2011-2014. Aquaculture Manage. Division 24–29.
Gammons C. H., Babcock J. N., Parker S. R., Poulson S. R. (2011). Diel cycling and stable isotopes of dissolved oxygen, dissolved inorganic carbon, and nitrogenous species in a stream receiving treated municipal sewage. Chem. Geol. 283 (1-2), 44–55. doi: 10.1016/j.chemgeo.2010.07.006
Government of Canada (2018) Historical data. Available at: http://climate.weather.gc.ca/historical_data/search_historic_data_e.html (Accessed August 08, 2018).
Huang Y., Schmitt F. G. (2014). Time dependent intrinsic correlation analysis of temperature and dissolved oxygen time series using empirical mode decomposition. J. Mar. Syst. 130, 90–100. doi: 10.1016/j.jmarsys.2013.06.007
Johansson D., Juell J.-E., Oppedal F., Stiansen J.-E., Ruohonen K. (2007). The influence of the pycnocline and cage resistance on current flow, oxygen flux and swimming behaviour of Atlantic salmon (Salmo salar L.) in production cages. Aquaculture 265, 271–287. doi: 10.1016/j.aquaculture.2006.12.047
Johansson D., Ruohonen K., Kiessling A., Oppedal F., Stiansen J.-E., Kelly M., et al. (2006). Effect of environmental factors on swimming depth preferences of Atlantic salmon (Salmo salar L.) and temporal and spatial variations in oxygen levels in sea cages at a fjord site. Aquaculture 254, 594–605. doi: 10.1016/j.aquaculture.2005.10.029
Jonasson L., Hansen J. L. S., Wan Z., She J. (2012). The impacts of physical processes on oxygen variations in the North Sea-Baltic Sea transition zone. Ocean Sci. 8, 37–48. doi: 10.5194/os-8-37-2012
Langseth B. J., Purcell K. M., Craig J. K., Schueller A. M., Smith J. W., Shertzer K. W., et al. (2014). Effect of changes in dissolved oxygen concentrations on the spatial dynamics of the gulf menhaden fishery in the northern gulf of Mexico. Mar. Coast. Fish. 6, 223–234. doi: 10.1080/19425120.2014.949017
Li C., Li Z., Wu J., Zhu L., Yue J. (2018). A hybrid model for dissolved oxygen prediction in aquaculture based on multi-scale features. Inf. Process. Agric. 5 (1), 11–20. doi: 10.1016/j.inpa.2017.11.002
Mallya Y. J. (2007). The effects of dissolved oxygen on fish growth in aquaculture. United Nations Univ. Fisheries Training Programme Final Project. Available at: https://www.grocentre.is/static/gro/publication/58/document/yovita07prf.pdf.
Mansour A., Hamoutene D., Mabrouk G., Puestow T., Barlow E. (2008). Evaluation of some environmental parameters for salmon aquaculture cage sites in fortune bay, newfoundland: emphasis on the oc. Can. Tech. Rep. Fish. Aquat. Sci. 2814, 1–28.
NASA Goddard Space Flight Center, Ocean Ecology Laboratory, Ocean Biology Processing Group (2018). Moderate-resolution imaging spectroradiometer (MODIS) aqua inherent optical properties data (Greenbelt, MD, USA: Reprocessing. NASA OB.DAAC). doi: 10.5067/AQUA/MODIS/L3M/IOP/2018
NASA Ocean Color (2018) Ocean data. Available at: https://oceandata.sci.gsfc.nasa.gov (Accessed August 08 2018).
Ni X., Huang D., Zeng D., Zhang T., Li H., Chen J. (2016). The impact of wind mixing on the variation of bottom dissolved oxygen off the Changjiang Estuary during summer. J. Mar. Syst. 154, 122–130. doi: 10.1016/j.jmarsys.2014.11.010
Oppedal F., Dempster T., Stien L. H. (2011). Environmental drivers of Atlantic salmon behaviour in sea-cages: A review. Aquaculture 311, 1–18. doi: 10.1016/j.aquaculture.2010.11.020
Page F. H., Losier R., McCurdy P., Greenberg D., Chaffey J., Chang B. (2005). Dissolved oxygen and salmon cage culture in the southwestern New Brunswick portion of the Bay of Fundy. Environ. Effects Mar. Finfish Aquaculture 5, 1–28. doi: 10.1007/b136002
Peña M. A., Katsev S., Oguz T., Gilbert D. (2010). Modeling dissolved oxygen dynamics and hypoxia. Biogeosciences 7, 933–957. doi: 10.5194/bg-7-933-2010
Pollock M. S., Clarke L. M. J., Dubé M. G. (2007). The effects of hypoxia on fishes: from ecological relevance to physiological effects. Environ. Rev. 15, 1–14. doi: 10.1139/a06-006
Rajwa-Kuligiewicz A., Bialik R. J., Rowiński P. M. (2015). Dissolved oxygen and water temperature dynamics in lowland rivers over various timescales. J. Hydrol. Hydromech. 63, 353–363. doi: 10.1515/johh-2015-0041
Remen M., Aas T. S., Vågseth T., Torgersen T., Olsen R. E., Imsland A., et al. (2014). Production performance of Atlantic salmon (Salmo salar L.) postsmolts in cyclic hypoxia, and following compensatory growth. Aquac. Res. 45, 1355–1366. doi: 10.1111/are.12082
Remen M., Sievers M., Torgersen T., Oppedal F. (2016). The oxygen threshold for maximal feed intake of Atlantic salmon post-smolts is highly temperature-dependent. Aquaculture 464, 582–592. doi: 10.1016/j.aquaculture.2016.07.037
Schmidtko S., Stramma L., Visbeck M. (2017). Decline in global oceanic oxygen content during the past five decades. Nature 542, 335–339. doi: 10.1038/nature21399
Scully M. E. (2010). Wind modulation of dissolved oxygen in chesapeake bay. Estuaries Coasts 33, 1164–1175. doi: 10.1007/s12237-010-9319-9
Shimps E. L., Rice J. A., Osborne J. A. (2005). Hypoxia tolerance in two juvenile estuary-dependent fishes. J. Exp. Mar. Biol. Ecol. 325, 146–162. doi: 10.1016/j.jembe.2005.04.026
Solstorm D., Oldham T., Solstorm F., Klebert P., Stien L. H., Vågseth T., et al. (2018). Dissolved oxygen variability in a commercial sea-cage exposes farmed Atlantic salmon to growth limiting conditions. Aquaculture 486, 122–129. doi: 10.1016/j.aquaculture.2017.12.008
Stevens E. D., Sutterlin A., Cook T. (1998). Respiratory metabolism and swimming performance in growth hormone transgenic Atlantic salmon. Can. J. Fish. Aquat. Sci. 55 (9), 2028–2035. doi: 10.1139/f98-078
Stramma L., Prince E. D., Schmidtko S., Luo J., Hoolihan J. P., Visbeck M., et al. (2012). Expansion of oxygen minimum zones may reduce available habitat for tropical pelagic fishes. Nat. Clim. Change 2, 33–37. doi: 10.1038/nclimate1304
Thomas P., Rahman M. (2012). Extensive reproductive disruption, ovarian masculinization and aromatase suppression in Atlantic croaker in the northern Gulf of Mexico hypoxic zone. Proc. R. Soc B Biol. Sci. 279, 28–38. doi: 10.1098/rspb.2011.0529
Tyler R. M., Brady D. C., Targett T. E. (2009). Temporal and spatial dynamics of diel-cycling hypoxia in estuarine tributaries. Estuaries Coasts 32, 123–145. doi: 10.1007/s12237-008-9108-x
U.S. Environmental Protection Agency (1986). Ambient water quality criteria for dissolved oxygen (Washington, DC: Environmental Protection Agency). Available at: https://www3.epa.gov/region1/npdes/merrimackstation/pdfs/ar/AR-1236.pdf.
Wei Y., Jiao Y., An D., Li D., Li W., Wei Q. (2019). Review of dissolved oxygen detection technology: from laboratory analysis to online intelligent detection. Sensors 19, 3995. doi: 10.3390/s19183995
Keywords: Salmo salar, salmon, aquaculture, hypoxia, dissolved oxygen
Citation: Jeong J, Awosile B, Thakur KK, Stryhn H, Boyce B and Vanderstichel R (2024) Longitudinal dissolved oxygen patterns in Atlantic salmon aquaculture sites in British Columbia, Canada. Front. Mar. Sci. 10:1289375. doi: 10.3389/fmars.2023.1289375
Received: 05 September 2023; Accepted: 18 December 2023;
Published: 08 January 2024.
Edited by:
Andrew M. Fischer, University of Tasmania, AustraliaReviewed by:
Torstein Kristensen, Nord University, NorwaySrikanta Samanta, Central Inland Fisheries Research Institute (ICAR), India
Copyright © 2024 Jeong, Awosile, Thakur, Stryhn, Boyce and Vanderstichel. This is an open-access article distributed under the terms of the Creative Commons Attribution License (CC BY). The use, distribution or reproduction in other forums is permitted, provided the original author(s) and the copyright owner(s) are credited and that the original publication in this journal is cited, in accordance with accepted academic practice. No use, distribution or reproduction is permitted which does not comply with these terms.
*Correspondence: Krishna K. Thakur, a3RoYWt1ckB1cGVpLmNh