- 1CAS Key Laboratory of Ocean Circulation and Waves, Institute of Oceanology, Chinese Academy of Sciences, Qingdao, China
- 2Pilot National Laboratory for Marine Science and Technology, Qingdao, China
- 3Center for Ocean Mega‑Science, Chinese Academy of Sciences, Qingdao, China
- 4CAS Engineering Laboratory for Marine Ranching, Institute of Oceanology, Chinese Academy of Sciences, Qingdao, China
- 5University of Chinese Academy of Sciences, Beijing, China
Tremendous amounts of materials and energy are transported from the East China Sea (ECS) to the East/Japan Sea (EJS) through the Korea/Tsushima Strait (KTS). Tides undoubtedly play an important role in regulating ocean circulation on the broad continental shelf of the ECS, while the effects of tides on the water exchange between the ECS and EJS remain unclear. Using a three-dimensional Regional Oceanic Modeling System (ROMS) circulation model, we conducted numerical experiments with tides, without tides, and only barotropic tides. The results showed that the water flux across the KTS can increase by up to 13% (in summer) when excluding tides from the numerical simulation. To understand how tidal forcing regulates the KTS water flux, we performed a dynamic diagnostic analysis and revealed that the variation in sea surface height under tidal effect is the main reason for the water flux variation across the KTS. The tidal effect can adjust the sea surface height, weaken the pressure gradient and reduce the water flux across the KTS, which affect the intensity of water exchange between the ECS and EJS. The tidal effect can alter sea level difference between the Taiwan Strait and the KTS, which influences the KTS water flux. Tides can also influence the KTS water flux by altering the sea surface height through interaction with topography and stratification. We also found that tidal effect weakens the northward intrusion of the Yellow Sea Warm Current in winter and in turn enhances the water flux across the KTS according to volume conservation. These modeling results imply that tides must be considered when simulating the ocean environment of the northwestern Pacific Ocean.
1 Introduction
Vast amounts of water, heat, salt and nutrients are transported from the East China Sea (ECS) to the East/Japan Sea (EJS) by the Tsushima Warm Current (TSWC) (Isobe et al., 2002; Yoon et al., 2008; Morimoto et al., 2012) through the Korea/Tsushima Strait (KTS), which is divided into the eastern and western channels (hereafter referred to as the EC and WC, respectively) by Tsushima Island. Before reaching the KTS, the TSWC splits into two branches to the southeast of Jeju Island: one branch flows northeastward into the KTS, while the other branch flows northwestward into the Yellow Sea (Isobe, 1999; Kim et al., 2005; Guo et al., 2006; Isobe, 2008; Cho et al., 2009). Acoustic Doppler Current Profiler (ADCP) observations and modeling results in many previous studies have revealed that the annual mean volume transport through the KTS is 2.60–3.05 Sv (1 Sv=106 m3·s-1) and that through the WC (1.45–1.54 Sv) is stronger than that through the EC (1.10–1.20 Sv) (Takikawa et al., 1999; Teague et al., 2002; Kim et al., 2004; Takikawa and Yoon, 2005; Fukudome et al., 2010; Qi et al., 2017; Shin et al., 2022).
To date, most researchers have focused on the controlling factors affecting the TSWC. Interannual variation of the TSWC is mainly regulated by wind stress over the open Pacific Ocean, and the subpolar winds located to the north of Japan and the wind stress in the ECS drive the seasonal variation of the TSWC (Tsujino et al., 2008; Ma et al., 2012; Cho et al., 2013; Kida et al., 2016; Yang et al., 2020). The wind stress in the ECS also affects the freshwater transport and heat transport through the KTS (Kim et al., 2014; Seo et al., 2014). In addition, Ma et al. (2010) suggested that the Kuroshio Extension maintains the TSWC by determining the sea level difference or pressure difference between the east and west coasts of Japan. Kim et al. (2019) analyzed the dynamic effects of the surface heat flux and continental slopes on the surface pattern of the TSWC by conducting various numerical experiments. Moreover, other researchers have reported that tides have an important regulating effect on shelf circulation. Tides can enhance the degrees of water mixing and bottom friction and alter the intensity of circulation (Moon et al., 2009; Kim et al., 2013; Wu and Wu, 2018; Li et al., 2020; Lin et al., 2020). Tidally induced residual currents play a critical role in influencing the ECS shelf circulation pattern (Li and Rong, 2012; Xuan et al., 2016). Wu et al. (2014) and Xuan et al. (2016) suggested that the circulation in the northern Jiangsu Shoal is controlled mainly by tidal residual currents. However, few studies have addressed how tides affect the water exchange between the ECS and EJS.
To evaluate the tidal effect on the water flux across the KTS, we conducted a series of numerical experiments. The remainder of this paper is organized as follows. Section 2 describes the model configuration, data sources and the calculation of the water flux. Section 3 presents the modeling results. Section 4 discusses the contribution of tidal effect on the water flux in different aspects. Finally, the conclusions are drawn in section 5.
2 Methods
2.1 Model configuration
To understand the tidal effect on the water flux across the KTS, we use the Regional Oceanic Modeling System (ROMS), which is a three-dimensional hydrostatic, free-surface, primitive equation ocean model in an s-coordinate system (Shchepetkin and McWilliams, 2005). In the horizontal direction, the primitive equations are evaluated using boundary-fitted, orthogonal curvilinear coordinates on a staggered Arakawa C-grid. In the vertical direction, the primitive equations are discretized over variable topography using stretched terrain-following coordinates (Song and Haidvogel, 1994). The model domain is bounded by 21°N–41°N and 116°E–136°E (Figure 1A) with a horizontal resolution of 1/12°×1/12°cosφ (where φ is latitude) and 26 sigma layers in the vertical direction.
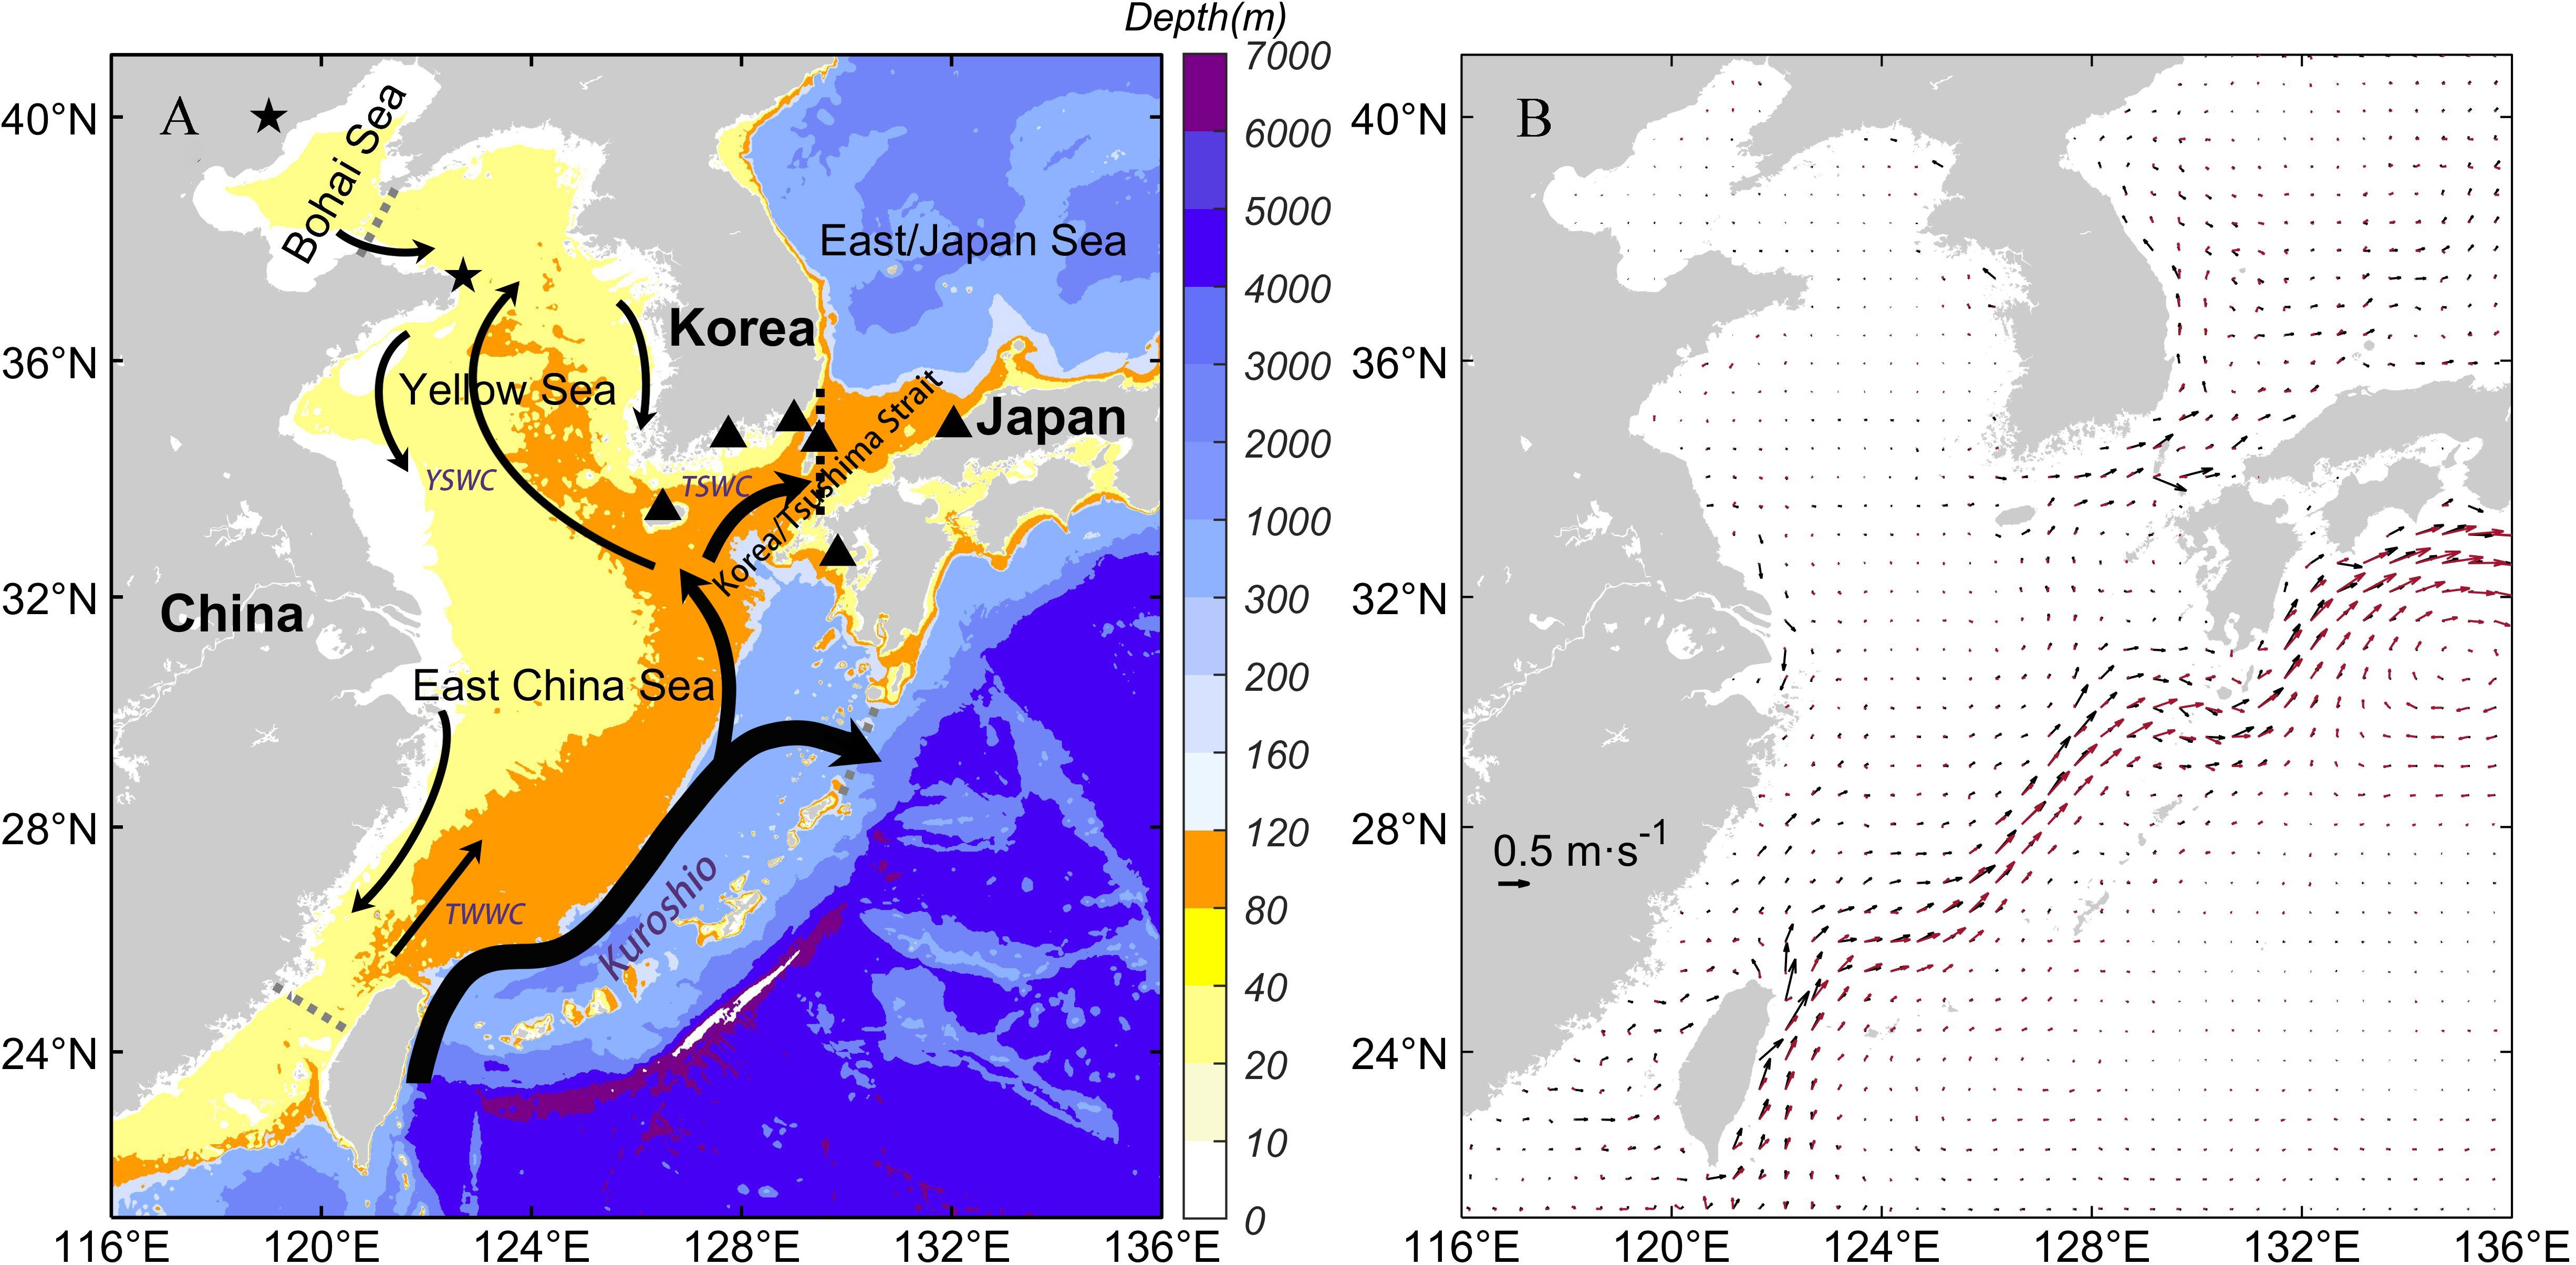
Figure 1 (A) Bathymetry of the study region and the wintertime regional circulation in the Yellow Sea and the East China Sea. TWWC: Taiwan Warm Current; TSWC: Tsushima Warm Current; YSWC: Yellow Sea Warm Current. The black dotted line is the location of the Korea/Tsushima Strait section. The gray dotted lines are the Bohai Strait, the Tokara Strait and the Taiwan Strait, respectively. The black pentagrams are the locations of Qinhuangdao and Chengshan Cape (from north to south). The black triangles are tide gauge stations for Jeju, Yeosu, Busan, Tsushima, Nagasaki, and Hamada (from west to east). (B) The annual mean sea surface geostrophic current field calculated by satellite altimetry data and modeled sea surface height (SSH) data. The black vectors are the modeled current, and the red vectors are from the Archiving, Validation and Interpretation of Satellite Oceanographic (AVISO).
The open boundary conditions and initial fields of temperature, salinity, current and elevation are interpolated from the coarse-resolution ocean model covering the Pacific Ocean (Yang et al., 2011). The model is forced by climatological monthly mean wind stress, heat flux, freshwater flux from the Comprehensive Ocean-Atmosphere Data Set (COADS) and tidal forcing (10 constituents, including M2, S2, N2, K2, K1, O1, P1, Q1, Mf, Mm) from the TPXO7, which is derived from Oregon State University Tidal Inversion Software (Diaz et al., 2002; Egbert and Erofeeva, 2002). For the details of the model configuration, please refer to Yang et al. (2011). The model is run for a spin-up period of ten model years. Then, starting from the 11th model year.
We run the model for two more model years both with and without tides (TIDE and NO_TIDE, respectively), the time period of the simulation is from January 1, 2021 to December 31, 2021. The monthly mean data from the last model year are used to perform the dynamic analysis.
For better analysis, we add a year simulation forced only by the barotropic tides. In this experiment, the improved Flather boundary condition is used for the two-dimensional flow open boundary to introduce the barotropic velocities and the sea surface height (Patrick Marchesiello et al., 2001). The external circulation velocity and sea surface height are set to 0 and only tidal forcing is applied to the open boundaries, and there is no oceanic, atmospheric or river forcing. In addition, the initial conditions of this simulation are set to the spatially uniform temperature (10 ˚C) and salinity (34 PSU), and vertically also uniform, without considering the baroclinic temperature and salinity process. The details of the model configuration are shown in Table 1.
2.2 Data sources
The absolute dynamic topology (ADT) data are processed by SSALTO/DUACS and distributed by AVISO+ (https://www.aviso.altimetry.fr) with support from CNES. The dataset is global gridded data with an average horizontal resolution of 0.25°×0.25° and a time range from January 1, 2015 to December 31, 2019. The hourly tide gauges data for Nagasaki and Hamada are from the official website of the University of Hawaii Sea Level Center (UHSLC) (Caldwell et al., 2015). The data of tide gauge in Tsushima are from Japan Oceanographic Data Center (https://www.jodc.go.jp/jodcweb/), and the data of three tide gauges in Republic of Korea are from Korea Hydrographic and Oceanographic Agency (http://www.khoa.go.kr/).
2.3 Calculation of the water flux
The water flux is calculated as follows. , where Fv is the water flux through the section, v is the velocity perpendicular to the section, dx is the meridional distance along the KTS section, LN(LS) is northern (southern) end point of the KTS section, η is the sea surface height, hB is the water depth of sea floor and dz is the water depth. The location of the section is shown in Figure 1A.
3 Results
3.1 Model validation
As shown in Figure 1B, the main ocean circulation is accurately reproduced by the model. The formula for calculating geostrophic current is , , where u and v are the geostrophic velocities, η is the sea surface height, g is the acceleration of gravity, and f is the Coriolis parameter. The Kuroshio, a strong western boundary current flowing northeastward along the ECS shelf, is the most prominent feature of the circulation in the ECS. To the west of the Tokara Strait, the Kuroshio mainstream bifurcates, producing a branch that flows northwestward and then merges into the TSWC. In addition, major current systems in offshore China are depicted in Figure 1B.
Table 2 shows previous estimates of the water flux across the KTS and the results of our model simulation. The good agreement among these fluxes indicates that the model can well reproduce the water flux of the KTS as well as the fluxes through the eastern and western channels.

Table 2 Studies on the water flux across the Korea/Tsushima Strait (unit: Sv) (WC, Western Channel; EC, Eastern Channel).
These features of the current system are consistent with observations, and the modeled ocean circulation and hydrographic characteristics have been verified by cruise data and ADCP data (Yang et al., 2011; Yang et al., 2012; Xu et al., 2018). In this paper, we focus mainly on the tidal modulation of the water flux across the KTS. Thus, the tidal modeling skill is evaluated as follows.
Figure 2 plots the distributions of the co-amplitude and co-phase lines of four principal tidal constituents (M2, S2, K1, and O1) from the model simulation. The locations of the amphidromic points, the amplitude and phase lag distributions are basically consistent with those reported in previous studies (Zeng et al., 2012; Fang et al., 2013; He et al., 2022; Wei et al., 2022). From the cotidal charts shown in Figure 2, semidiurnal tides enter the Bohai Sea from the Bohai Strait, and the westward propagation of these tides is blocked by the west coast of the Bohai Sea, which results in the formation of two amphidromic points near Qinhuangdao and the Yellow River estuary in the Bohai Sea. There are also two amphidromic points in the Yellow Sea near Chengshan Cape and the South Yellow Sea at 34.5°N. Under the influence of bottom friction, all four amphidromic points move westward of the tidal waves propagation path and approach the coastline of mainland China. The tidal waves propagate southward from the ECS, forming a degenerated semidiurnal amphidromic point in the northern part of the Taiwan Island. The tidal waves enter the KTS from the ECS, propagate northward and meet with southward propagating tidal waves, forming an amphidromic point on the east side of Korea. Moreover, as shown in Figure 2, the diurnal tides form two amphidromic points in the western Bohai Strait and the central Yellow Sea. The present results agree well with these recent empirical cotidal charts, indicating that our model can properly capture the characteristics of tidal waves in the ECS and the KTS.
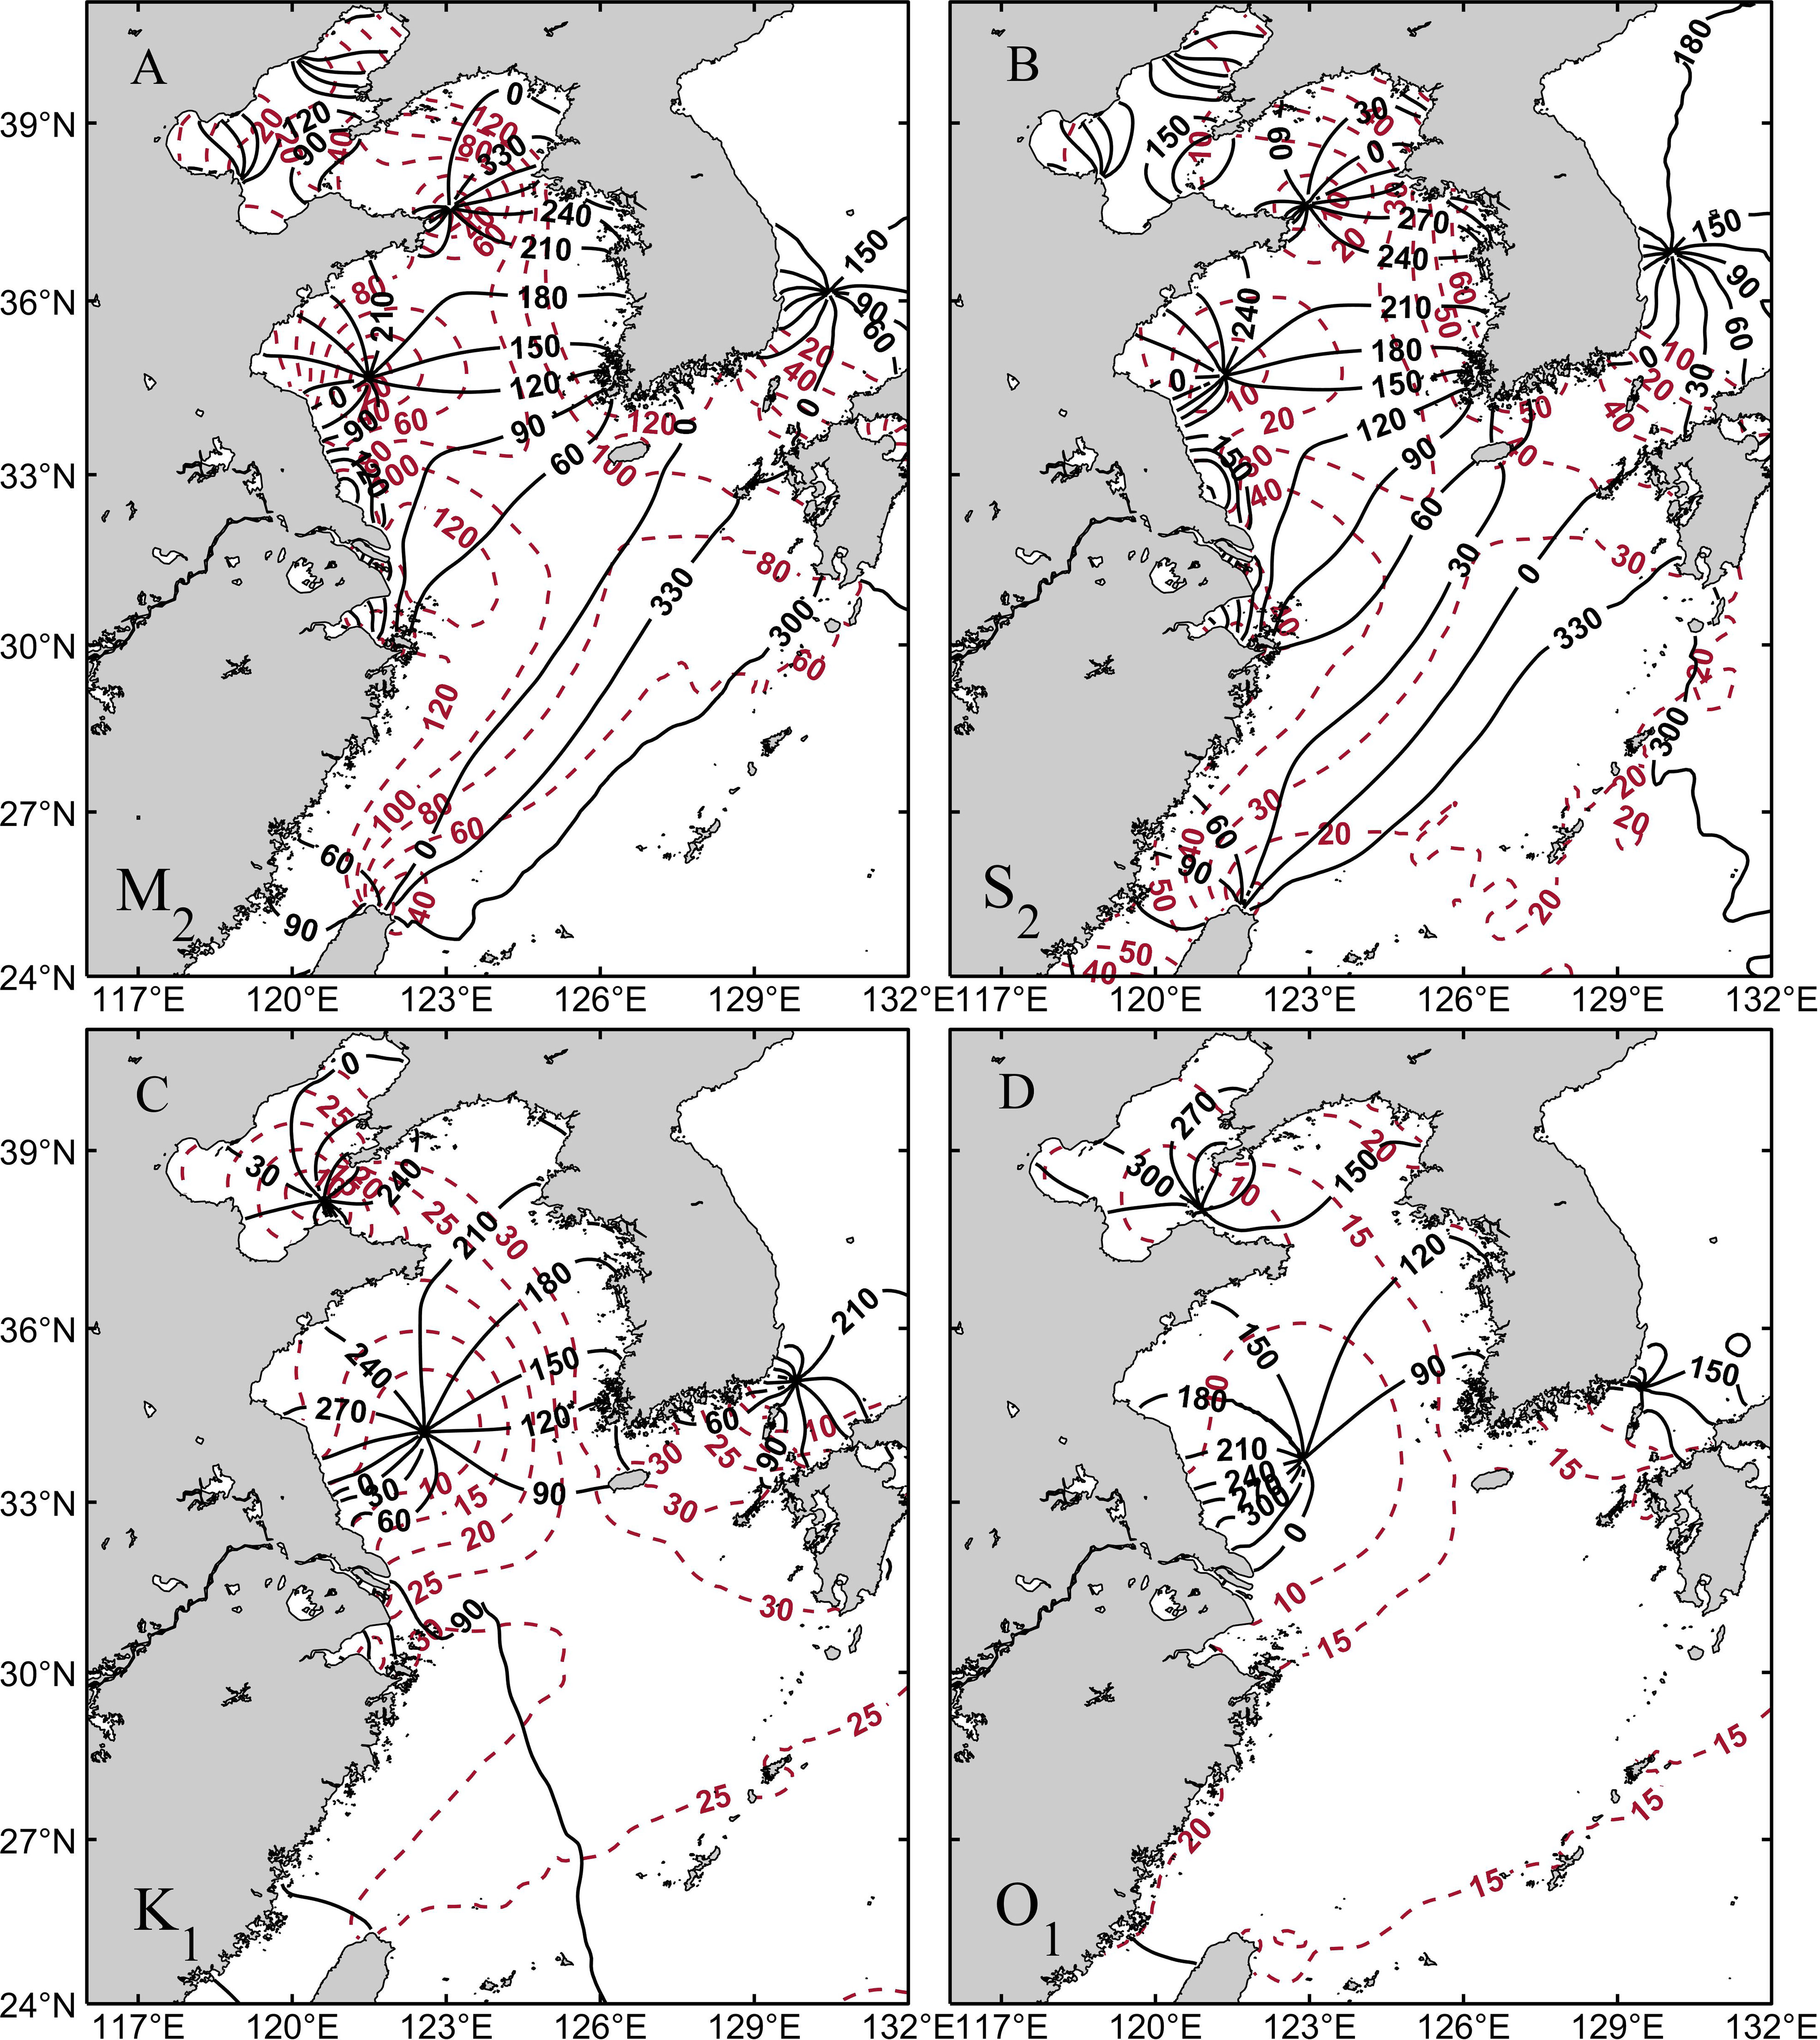
Figure 2 Distributions of the co-amplitude and co-phase lines of the (A) M2, (B) S2, (C) K1, and (D) O1 tidal constituents. The red dashed lines are the amplitude (cm), and the black solid lines are the phase lag (°) referred to the coordinated universal time (UTC).
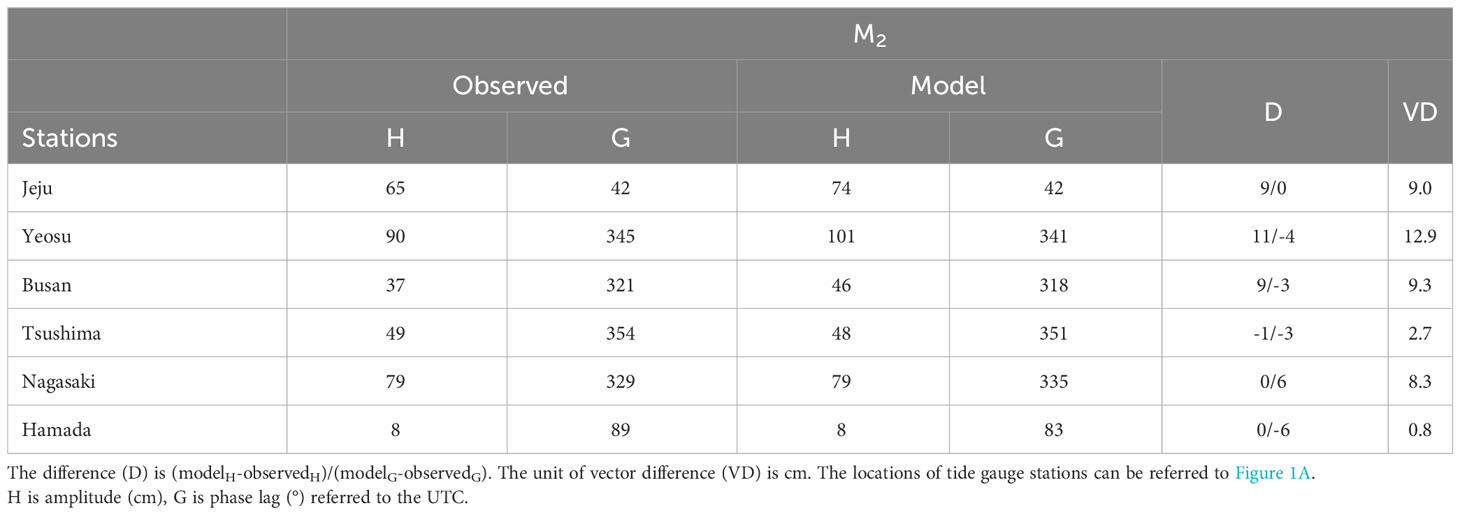
In addition, we compare the model results with observations from six tide gauge stations by calculating the tidal harmonic constants of the dominant constituent M2 (Table 3). Besides looking separately at amplitude and phase lag errors in the tidal constituent, we use the vector difference (VD) to assess the combined effect of these errors. The vector difference is defined as (Provost et al., 1995).
where Hm and Gm represent the modeled amplitude (in centimeter) and phase lag (in degree), while Ho and Go represent the observed amplitude and phase lag.
It can be seen that the simulated M2 amplitudes of several stations on the southern side of Korean Peninsula are relatively high. There are a lot of small islands to the south of Korean Peninsula, which cannot be well resolved by our model resolution and they may influence the model skill of tides.
3.2 The tidal effect on the water flux across the KTS
Next, we compute the volume transport through the KTS both with and without tidal forcing (Figure 3). The annual mean volume transport through the KTS without tidal forcing is 2.88 Sv with a standard deviation of 0.9 Sv, whereas the annual mean value decreases to 2.66 Sv with a standard deviation of 0.7 Sv with tidal forcing. The volume transport variation is strong in summer and autumn, with a gradual increase in transport from January to August, and the transport reaches its maximum in August (VTnotide: 3.97 Sv, VTtide: 3.52 Sv; VT: volume transport) before decreasing to a minimum in January (VTnotide: 1.28 Sv; VTtide: 1.55 Sv). The difference in volume transport with/without tides reaches a maximum value (0.45 Sv) in August, which implies an increase of 13% when excluding tides from the numerical simulation. And the volume transport amounts are equal at a point between February and March.
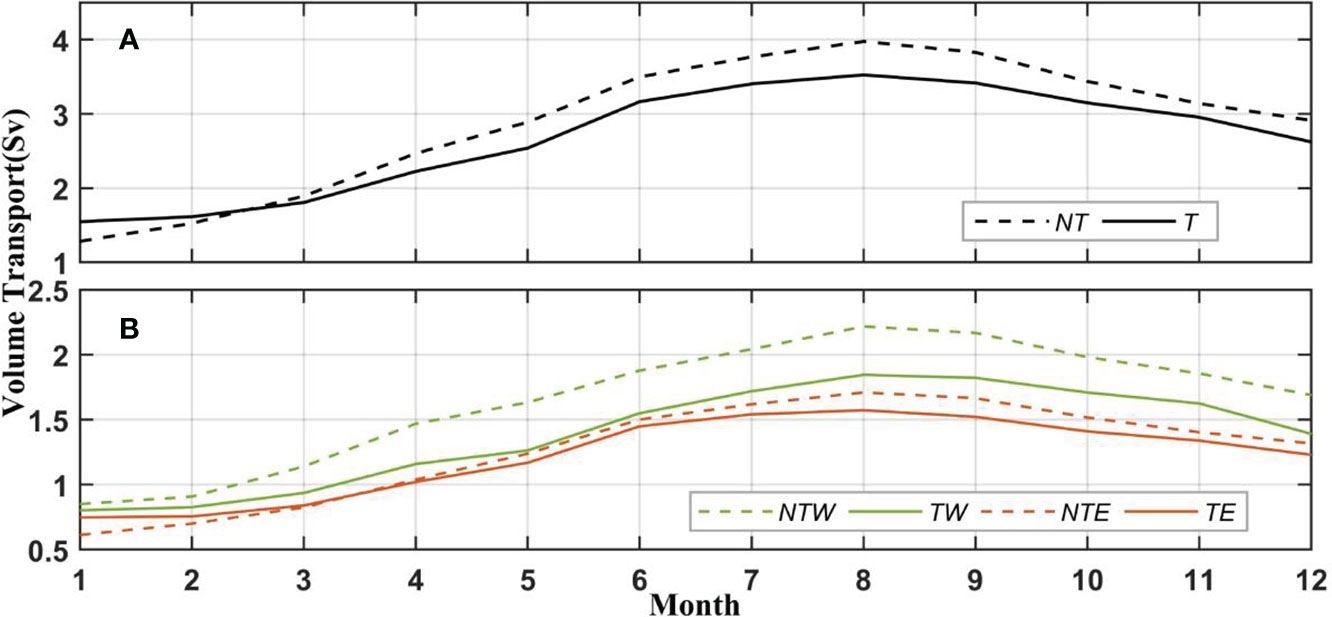
Figure 3 Monthly mean water flux across the KTS calculated considering (A) circulation with no tides (NT) and circulation with tides (T) and including the corresponding fluxes separately across the (B) Western Channel (NTW/TW) and Eastern Channel (NTE/TE).
The seasonal variations in volume transport through the EC and WC are similar. The volume transport through the WC gradually increases from winter to summer and reaches a maximum in August (VTnotide: 2.22 Sv; VTtide: 1.84 Sv); likewise, the volume transport through the EC gradually increases from winter to summer and reaches a maximum in August (VTnotide: 1.71 Sv, VTtide: 1.57 Sv). The volume transport through the WC is larger than that across the EC in all seasons with large seasonal variations, regardless of the presence of tides. The mean volume transport through the EC is 1.26 Sv with a standard deviation of 0.38 Sv without tidal forcing, while the mean value decreases to 1.22 Sv with a standard deviation of 0.31 Sv when tides are included in the model. Similarly, the mean volume transport through the WC is 1.65 Sv with a standard deviation of 0.47 Sv without tidal forcing, while the mean value decreases to 1.39 Sv with a standard deviation of 0.38 Sv when incorporating tides into the simulation. The difference in volume transport with/without tides in the EC is small throughout the year, and the transport quantities are equivalent at a point between March and April. Furthermore, in January and February, tidal forcing has little effect on the volume transport through the WC, but this effect increases gradually throughout the year. In addition, tidal forcing reduces the difference in transport between the EC and WC.
It is interesting to note that when applying tides, the KTS water flux increased in January and February, while decreased in other months as shown in Figure 3, this special phenomenon is analyzed in section 5. To understand how does tidal forcing influence the KTS water flux, we quantified the contribution of tidal effect on the water flux in different aspects in the next section.
4 Discussion
4.1 Dynamical analysis
The monthly mean water flux variation across the KTS (Figure 3) indicates that tides affect the water flux across the KTS. To study the main dynamic mechanism and key factors driving this variation and to understand how tides modulate ocean circulation, we inspect the meridional momentum balance as follows:
where u and v are the zonal and meridional velocities, f is the Coriolis parameter, is the horizontal gradient operator, and vH and vv are the horizontal and vertical eddy viscosity coefficients, respectively. Uaccel is the net acceleration term, Uadv is the advection term, Uprsgrd is the pressure gradient term, Uhvisc is the horizontal viscosity term, and Uvvisc is the vertical viscosity term.
As shown in Figures 4 and 5, the contributions of the horizontal viscosity term (Uhvisc) and the local acceleration term (Uaccel) are relatively small in the KTS, and the meridional pressure gradient term accounts for the largest part of the zonal component. In general, the meridional pressure gradient term shows significant variation after including tides. Moreover, the contributions of each term to zonal current are different between summer and winter.
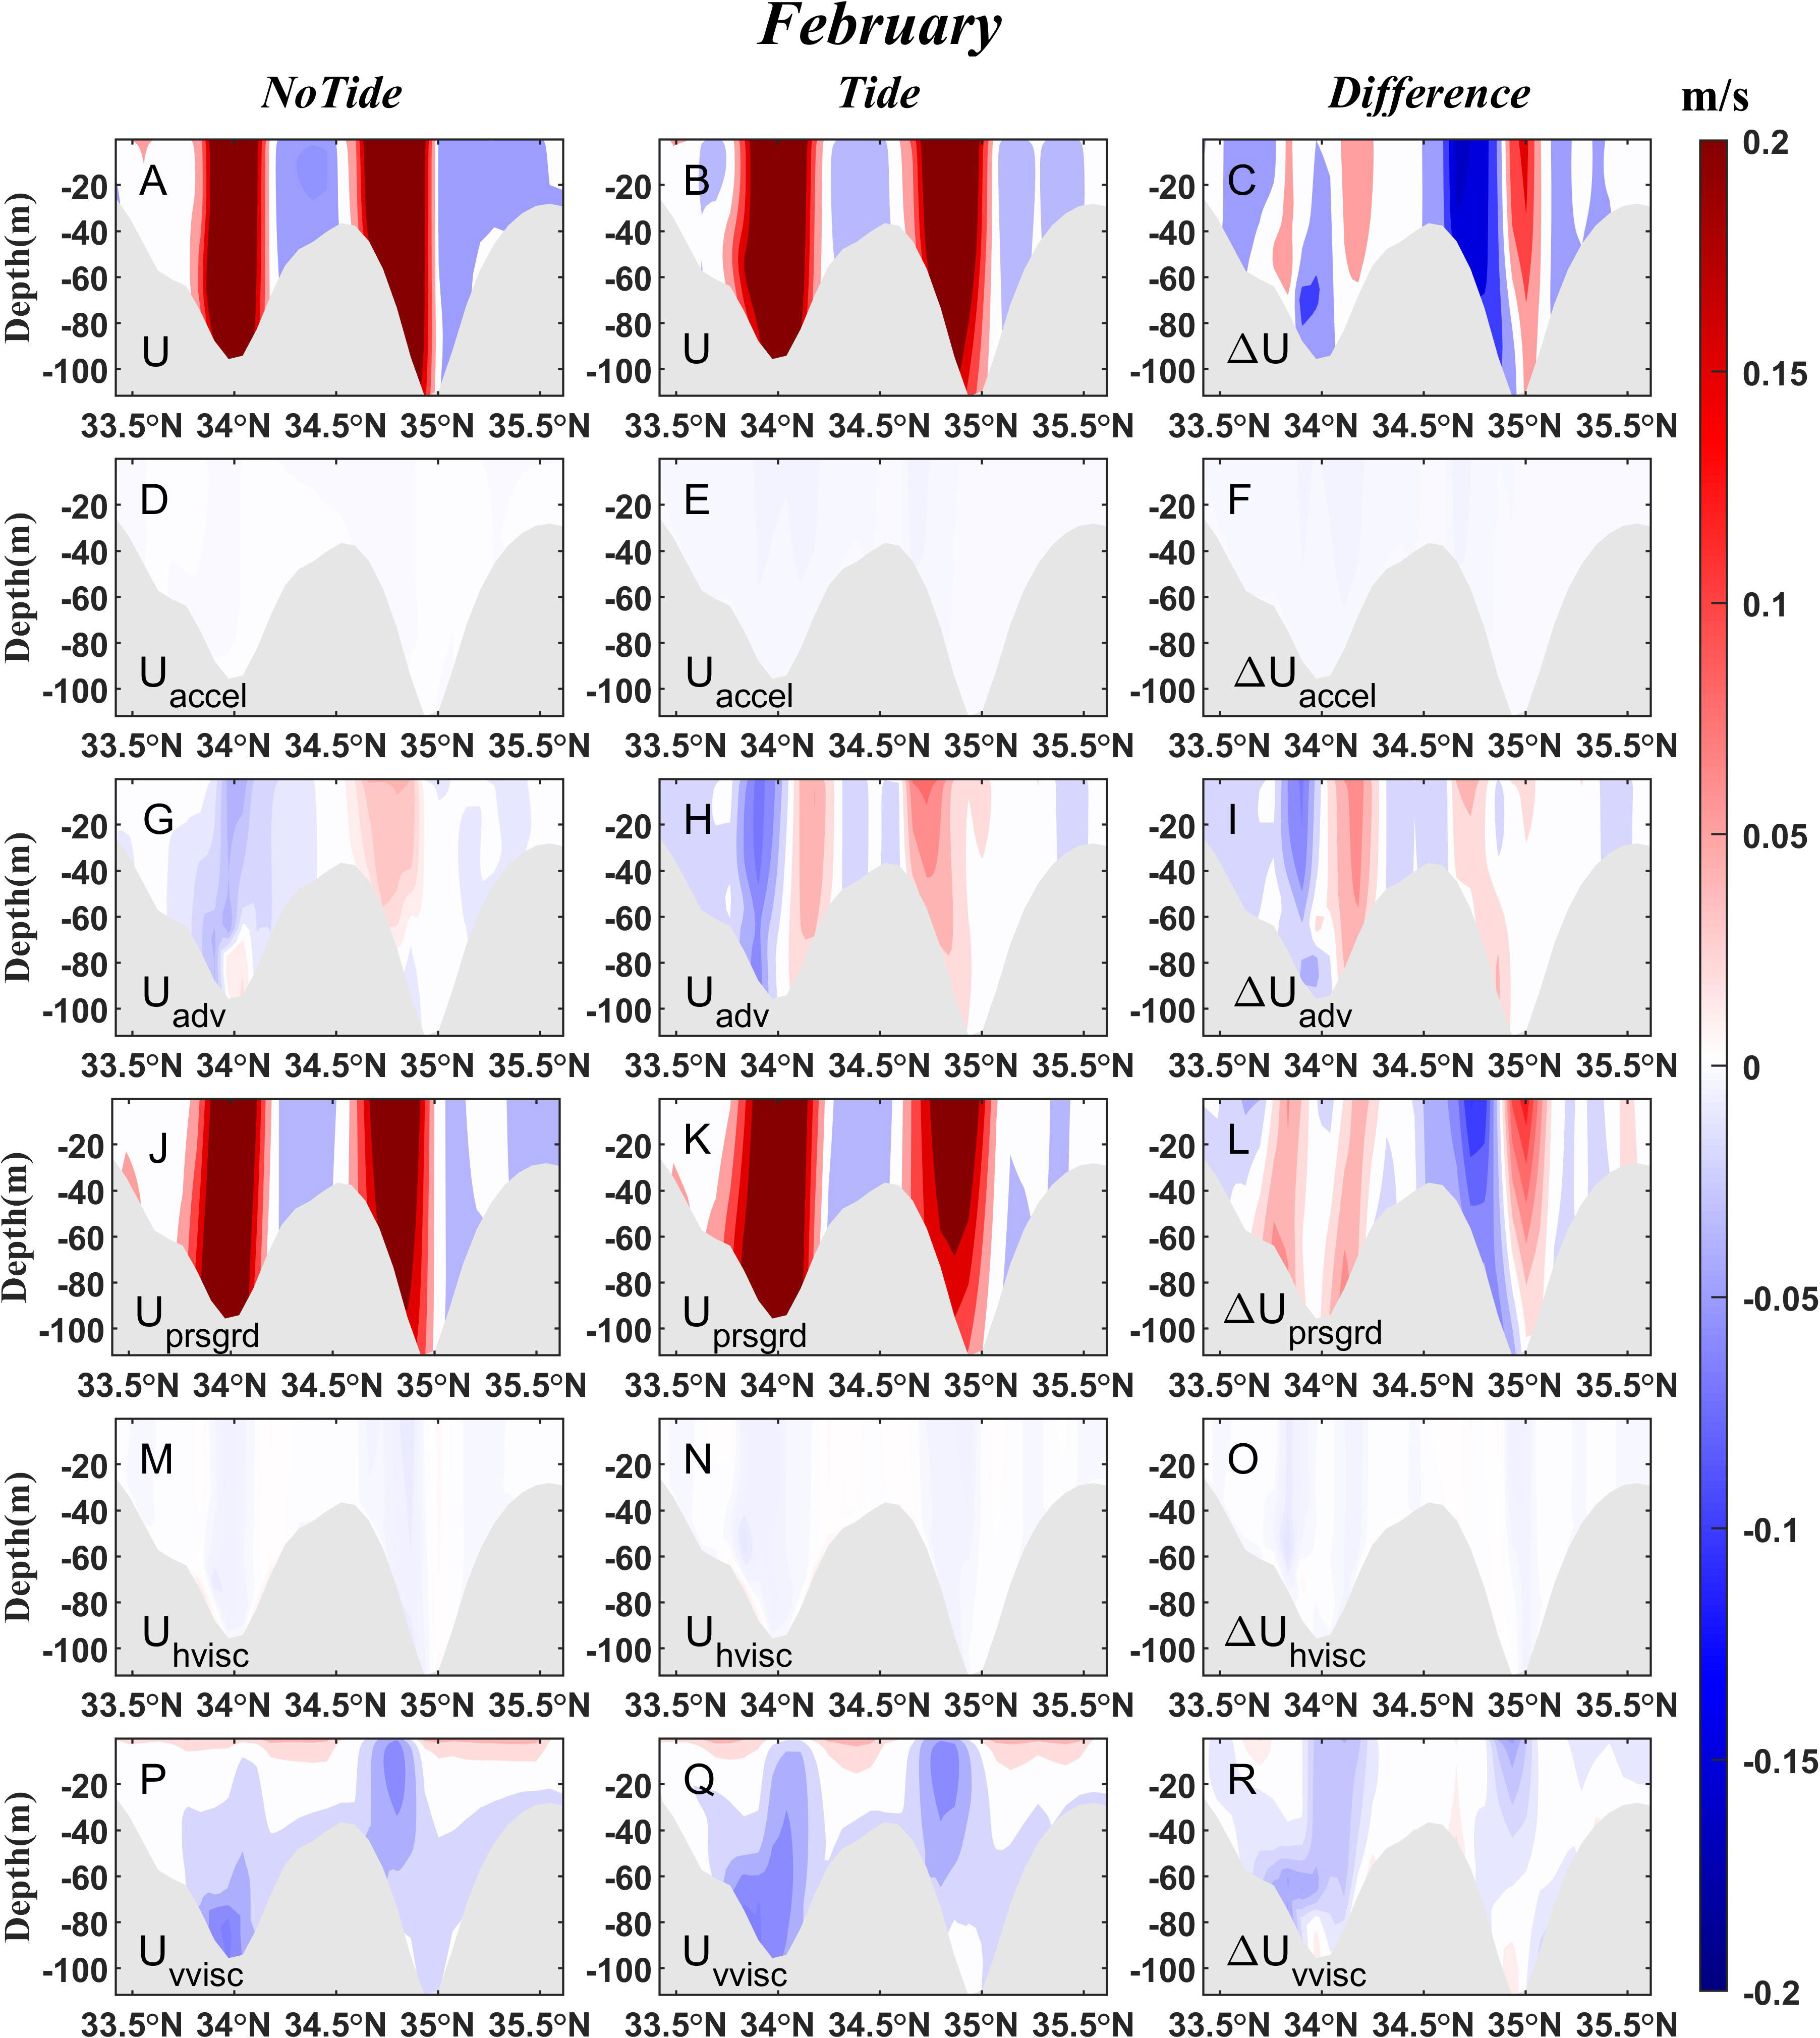
Figure 4 (A-C) Current velocity (m/s) through the KTS transect and (D-R) each term in the momentum balance equation in February 2021. The left panel is the case without tides, the middle panel is the case with tides, and the right panel is the difference (Tide- NoTide) between the experiments with and without tides.
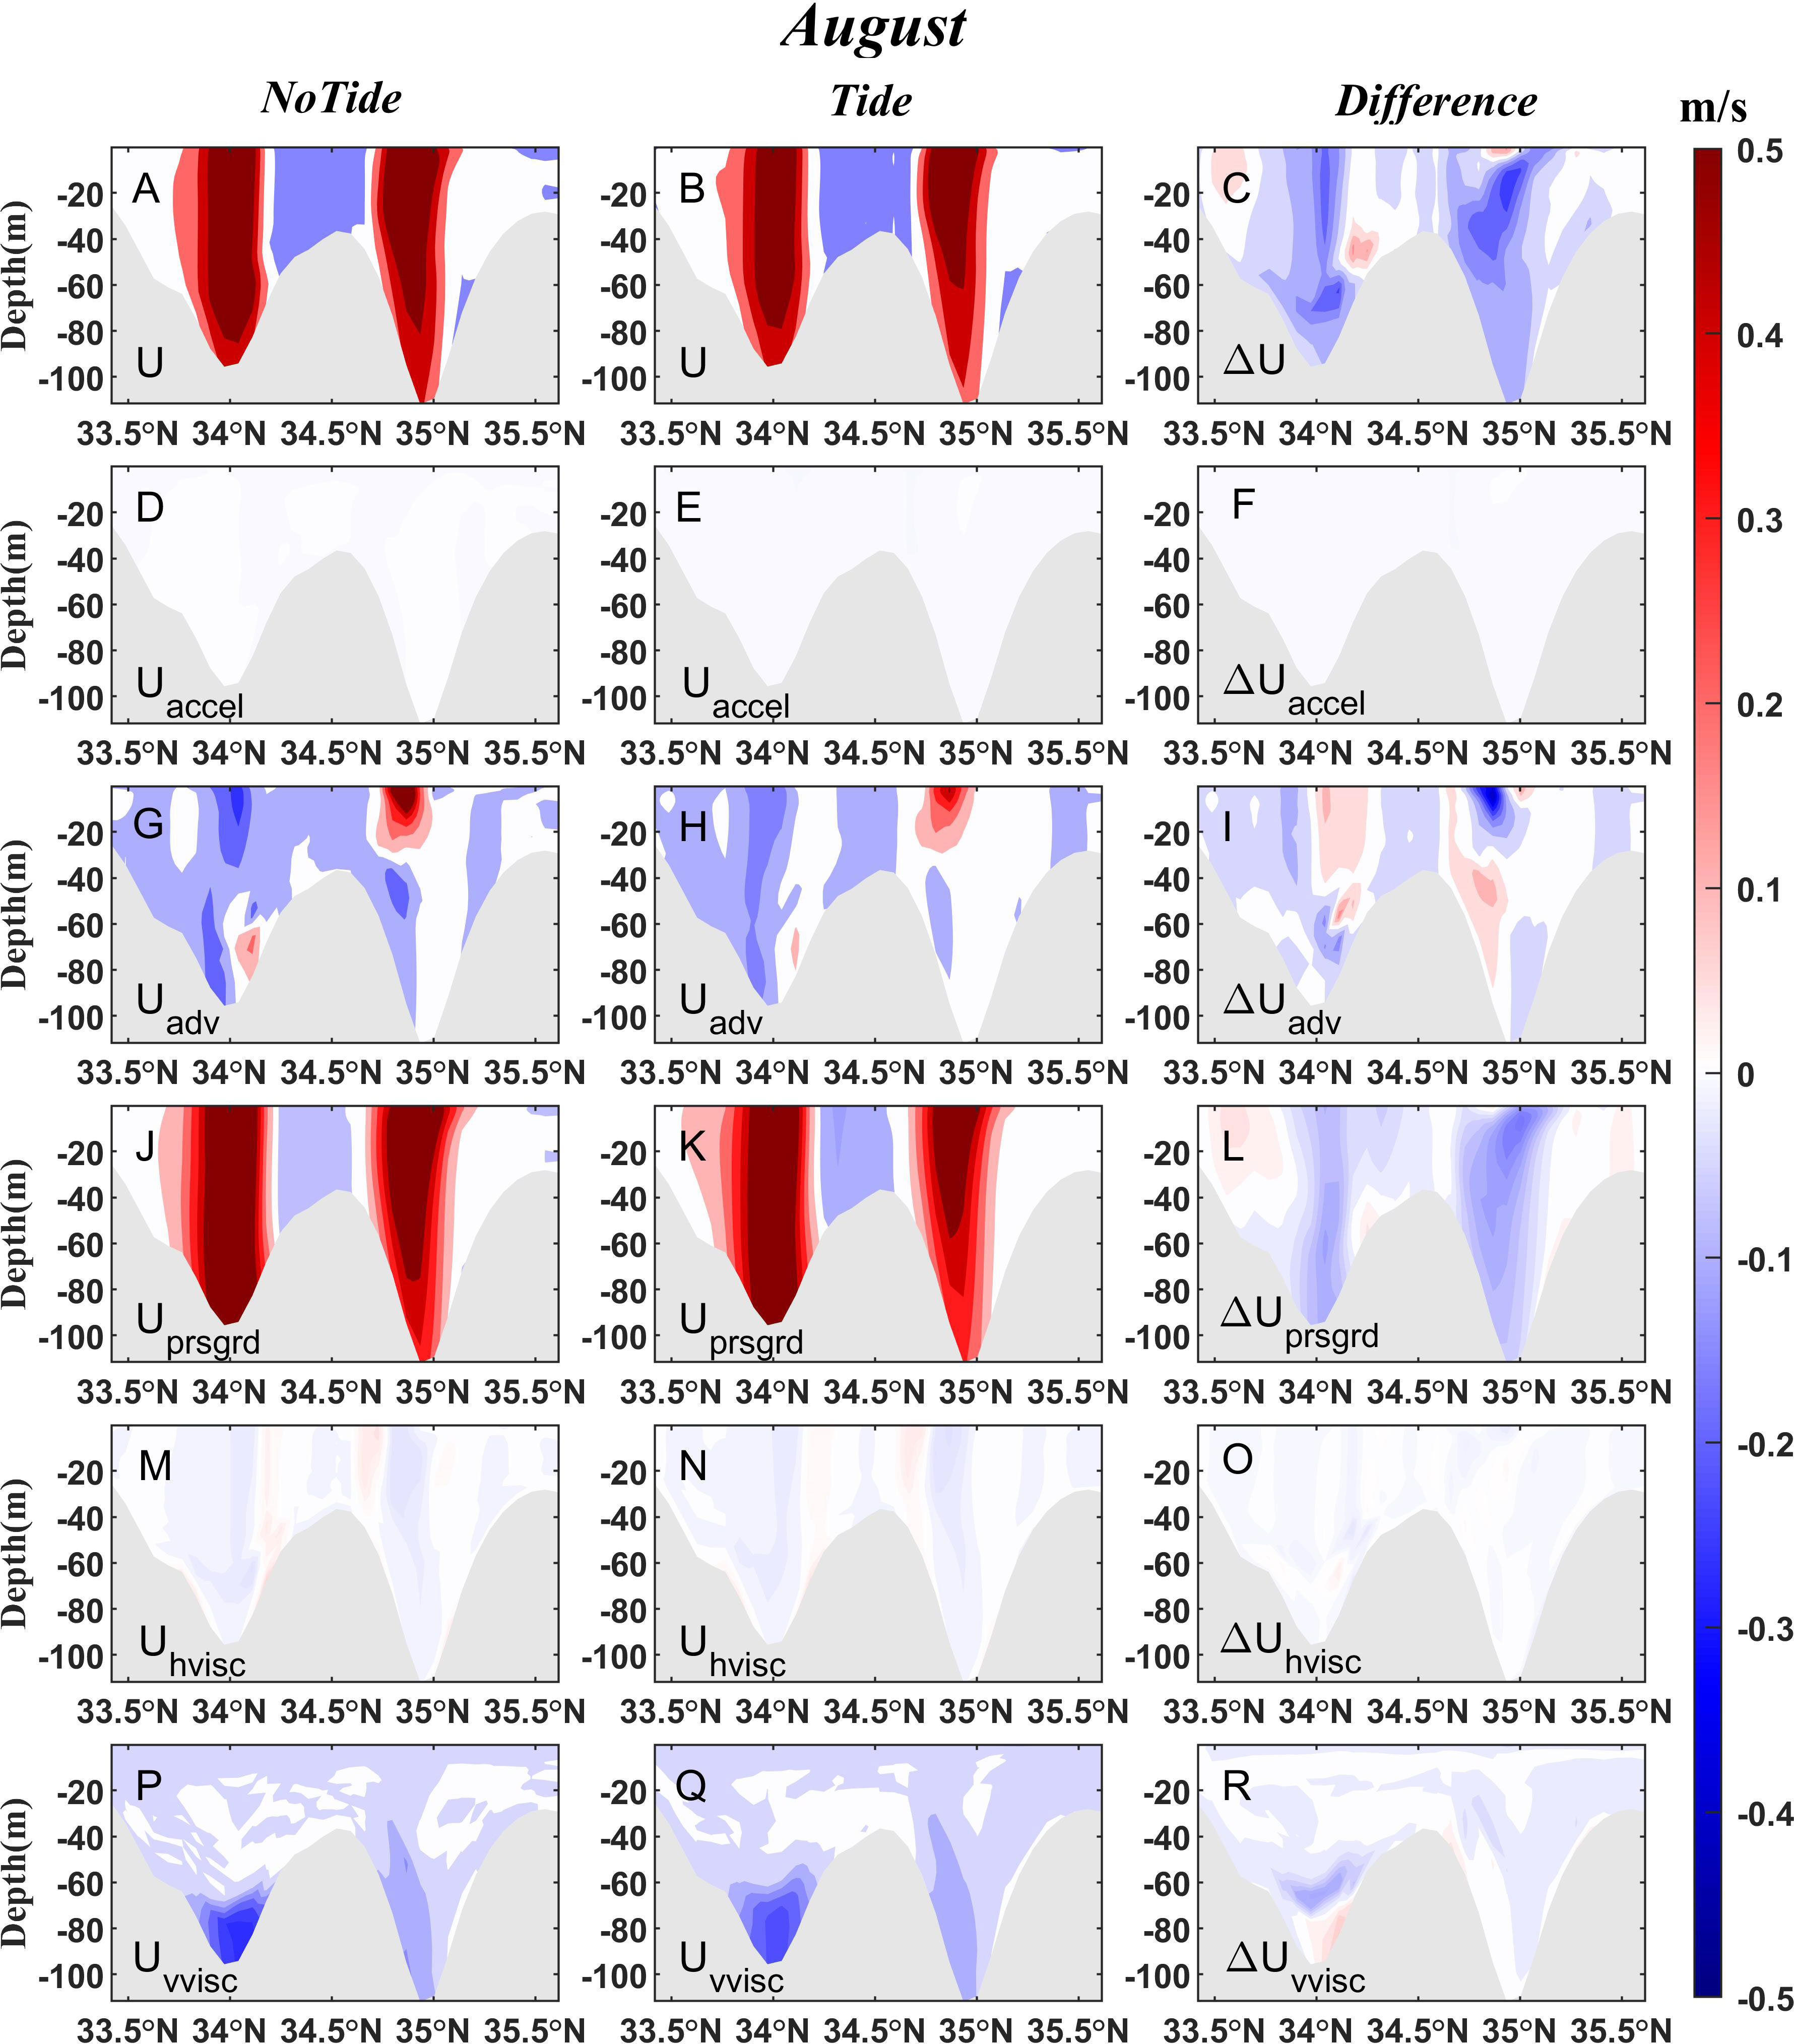
Figure 5 It is same as Figure 4 but for August 2021.
In August, the zonal flow weakens when tidal forcing is applied. The zonal flow is dominated by the meridional pressure gradient term (Uprsgrd), whose contribution weakens after adding tides to the model. The contribution of the advection term (Uadv) is complicate after including tides, and there is a special region near 34.9°N where it significantly weakens (about 0.3 m/s). The contribution of the vertical viscosity term (Uvvisc) is relatively large at the bottom and is enhanced with the incorporation of tides.
In February, the zonal current in the KTS is also dominated by the meridional pressure gradient term, but this term enhance except a narrow area near boundaries after adding tides to the model. The advection term contribution increases on both sides of Tsushima Island after applying tides.
Although the nonlinear advection term and the vertical viscosity term may weaken the flow by dampening the horizontal pressure gradient when incorporating tides into the model, the KTS water flux is dominated by the horizontal pressure gradient. To look closely at the horizontal pressure gradient, we write the pressure gradient term as two components according to equation (2):
where ρ0 is the density at the sea surface, considered a constant, η is the sea surface height, and pρ is the baroclinic pressure caused by density variations. The first term (①) represents the barotropic pressure gradient corresponding to the slope of the sea surface, and the second term (②) represents the baroclinic pressure gradient (Pond and Pickard, 1981; Guo, 1994). To study the changes in the pressure gradient influenced by tides, we next examine the barotropic and baroclinic components.
Using Eq. (3), we calculated the barotropic and baroclinic contributions with model results. A comparison between the two pressure gradient terms (Figure 6) shows that the barotropic pressure gradient term is the major contributor to the pressure gradient. From Eq. (3), the sea surface height gradient is the major factor that determines the zonal geostrophic flow.
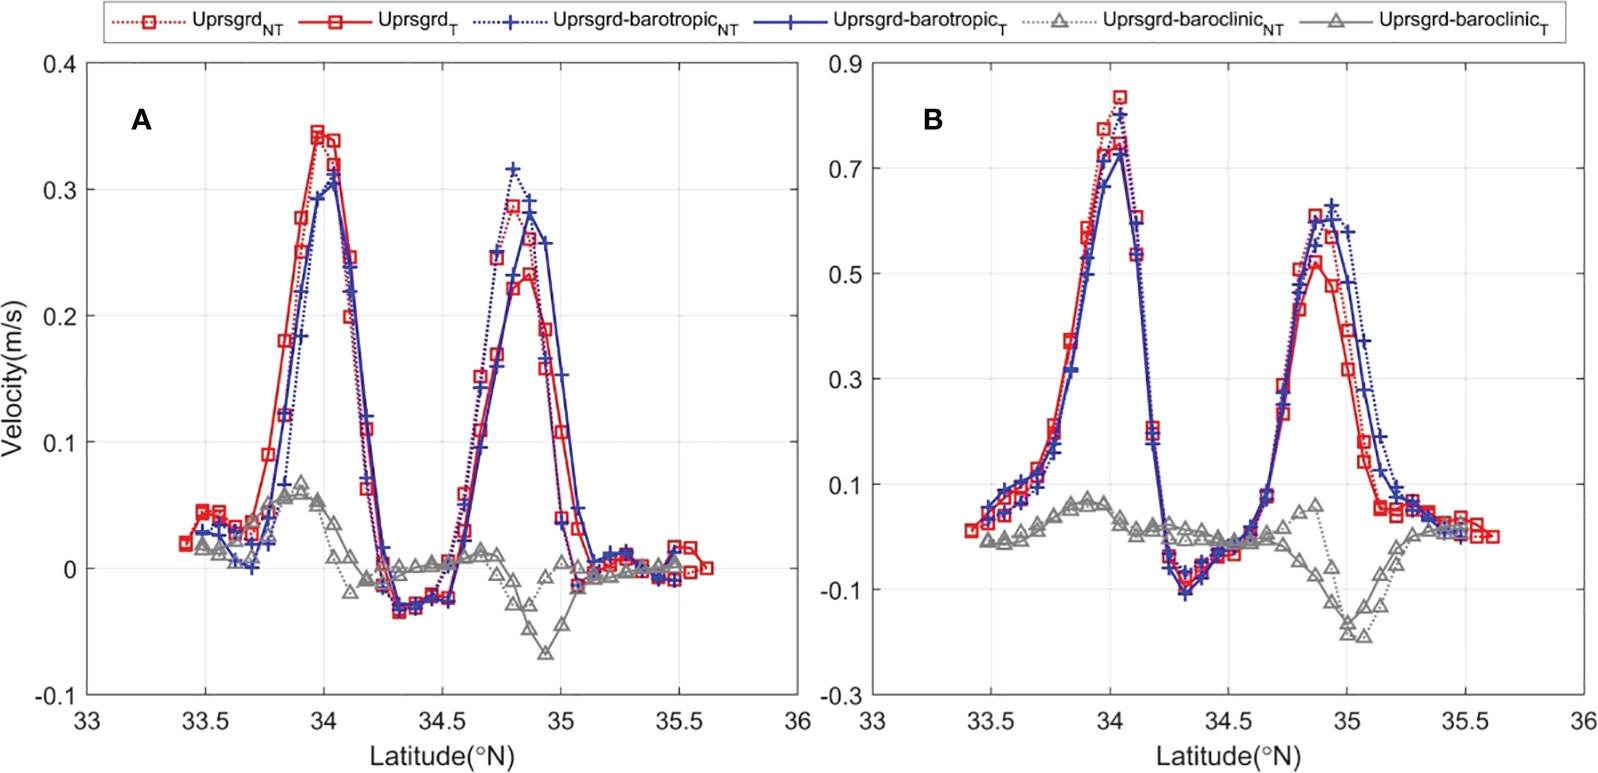
Figure 6 The decomposition of the vertical integrated pressure gradient term through the KTS transect in (A) February and (B) August.
4.2 Factors related to variations in the sea surface height
From the dynamical analysis of the KTS in Section 4.1, it follows that the sea surface height gradient is the major factor causing the variation in the KTS water flux under tidal effect. There are several factors that may affect the SSH gradient by analyzing the entire simulated region. Previous studies suggested the “Taiwan-Tsushima Warm Current” system and the strong correlation between the TWWC and the TSWC using observed data and numerical model (Fang, 1995; Zheng et al., 2009). The sea level difference between the northeastern South China Sea and the eastern side of the Tsugaru-Soya Strait is considered to be the main driving force for forming this system. Thus, we calculated the water flux across these two straits and there is a significant positive correlation between them (Figure 7), and the correlation coefficient is 0.53. The variations in the pressure gradient terms in the two straits are consistent with the water flux variation tendency, and the correlation coefficient is also 0.53. Tidal forcing releases the sea level difference between the Taiwan Strait and the KTS as shown in Figure 7C, which weakens the “Taiwan-Tsushima Warm Current” system and then decreases the KTS water flux. This result implies that the tidal forcing modulates the water level difference over the ECS continental shelf and then change the water flux across the KTS.
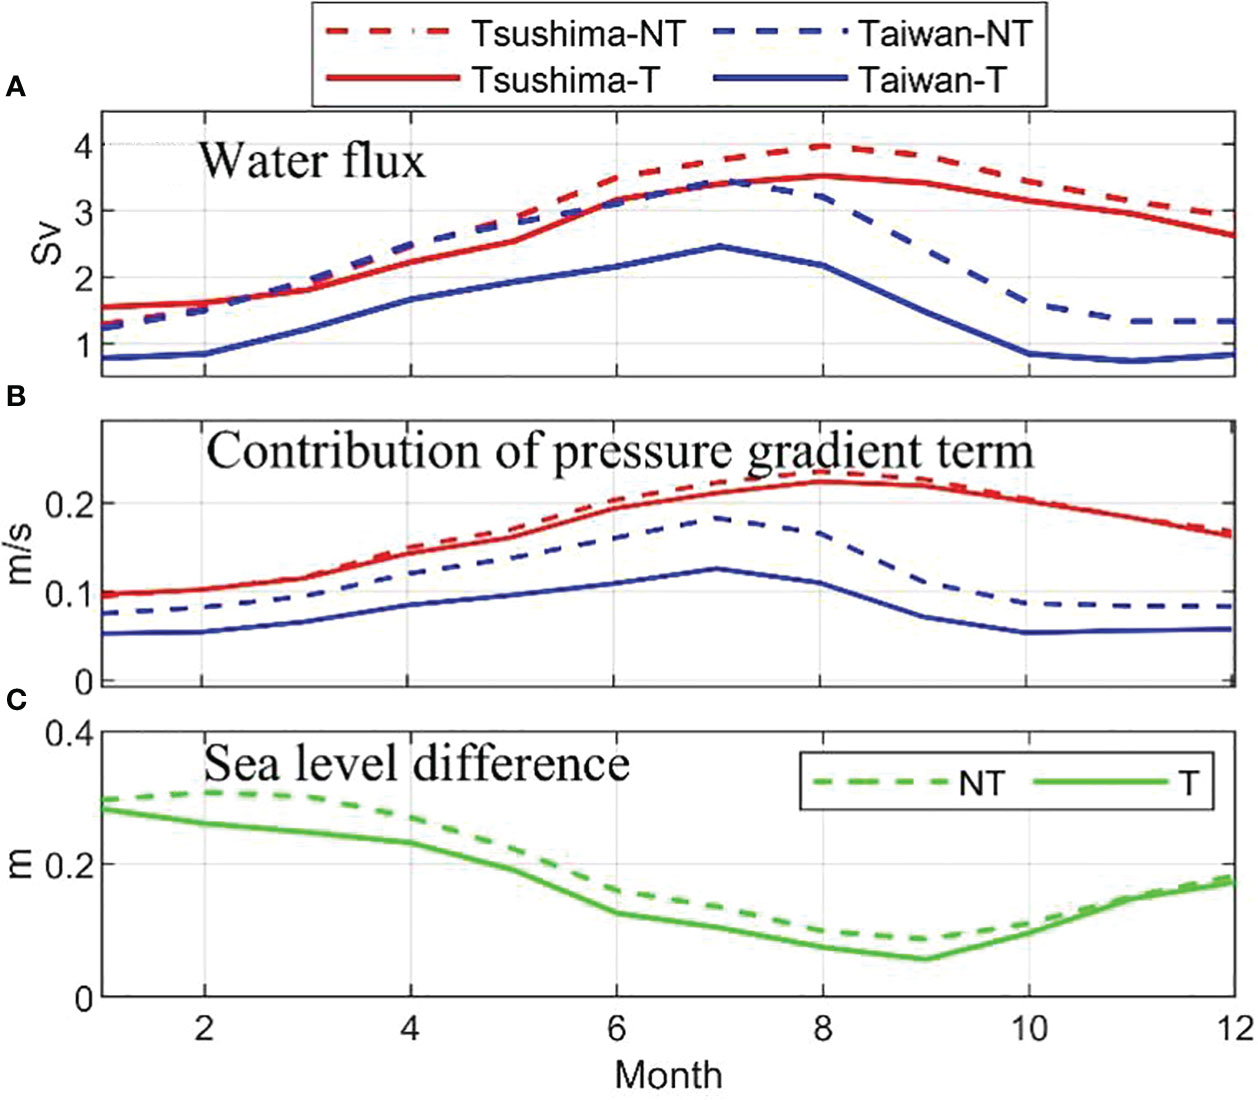
Figure 7 (A) Water flux (Sv) across the Korea/Tsushima Strait and Taiwan Strait and (B) the contribution of vertical integrated pressure gradient term (m/s). (C) The sea level difference (m) between the two straits. Where NT represents no tides, T represents tides. The contribution of pressure gradient term is detailed in section 4.2.
Moreover, tides affect the ocean circulation through the interaction of barotropic tides with topography generating residual currents (Huthnance, 1973; Loder, 1980; Polton, 2014). Tides also indirectly affect the currents through their interaction with stratification generating baroclinic tides that can enhance mixing, modify the density gradient and so alter the ocean circulation (Katavouta et al., 2022). In order to study how tides affect the sea surface height gradient, we conducted a new simulation forced only by the barotropic tides, where no oceanic, atmospheric and river forcing.
The current is split into contributions from three terms according to Katavouta et al. (2022),
where the overbar denotes time-averaged, u is the current driven by the atmospheric, oceanic, river and tidal forcing, corresponding to the model with tidal forcing in this paper. uback is the background current driven by the atmospheric, oceanic and river forcing, corresponding to the model without tidal forcing in this paper. uBTtide is the current driven by the barotropic tides and its interaction with topography, uinter is the current driven by the interaction between tides and stratification.
By substituting equation (4) into the calculation equation of water flux in section 2.3, the effect of tides on the water flux across the KTS can be divided into
where u is the zonal current perpendicular to the KTS section. The first term on the right-hand side of equation (5) corresponds to the residual water flux due to the barotropic tides and its interaction with topography. The second term on the right-hand side of equation (5) corresponds to the residual water flux due to the interaction between the barotropic tides and stratification. We shorten them to barotropic flux and interaction flux, respectively. Then we get that the water flux variation affected by tides is 0.22 Sv (annual average), where the barotropic flux is 0.04 Sv and the interaction flux is 0.18 Sv. The greatest variation is 0.45 Sv in summer, with an interaction flux of 0.41 Sv, which means that there is a high residual water flux due to the interaction between the barotropic tides and stratification in summer.
Tides and their interaction with topography and stratification drive the residual current, it flows from the EJS to the ECS through the KTS, flows northward along the west coast of the Korean Peninsula, and forms a counterclockwise circulation with the southward residual current of the Yellow Sea Trough (Figure 8). The residual current driven by the interaction between tides and stratification is stronger than that driven by the barotropic tides and its interaction with topography in most regions. In section 4.1, we found the sea surface height gradient determines the zonal geostrophic flow in the KTS. As shown in Figure 9, it is interesting to note that tides and their interaction with topography and stratification can adjust the whole circulation pattern in the Yellow Sea and East China Sea and lead to the variation of sea surface height gradient in the KTS. In other words, tides and their interaction with topography and stratification lead to the variation of sea surface height gradient in the KTS, then affect the current across the KTS and finally induce a flux change of 0.22 Sv.
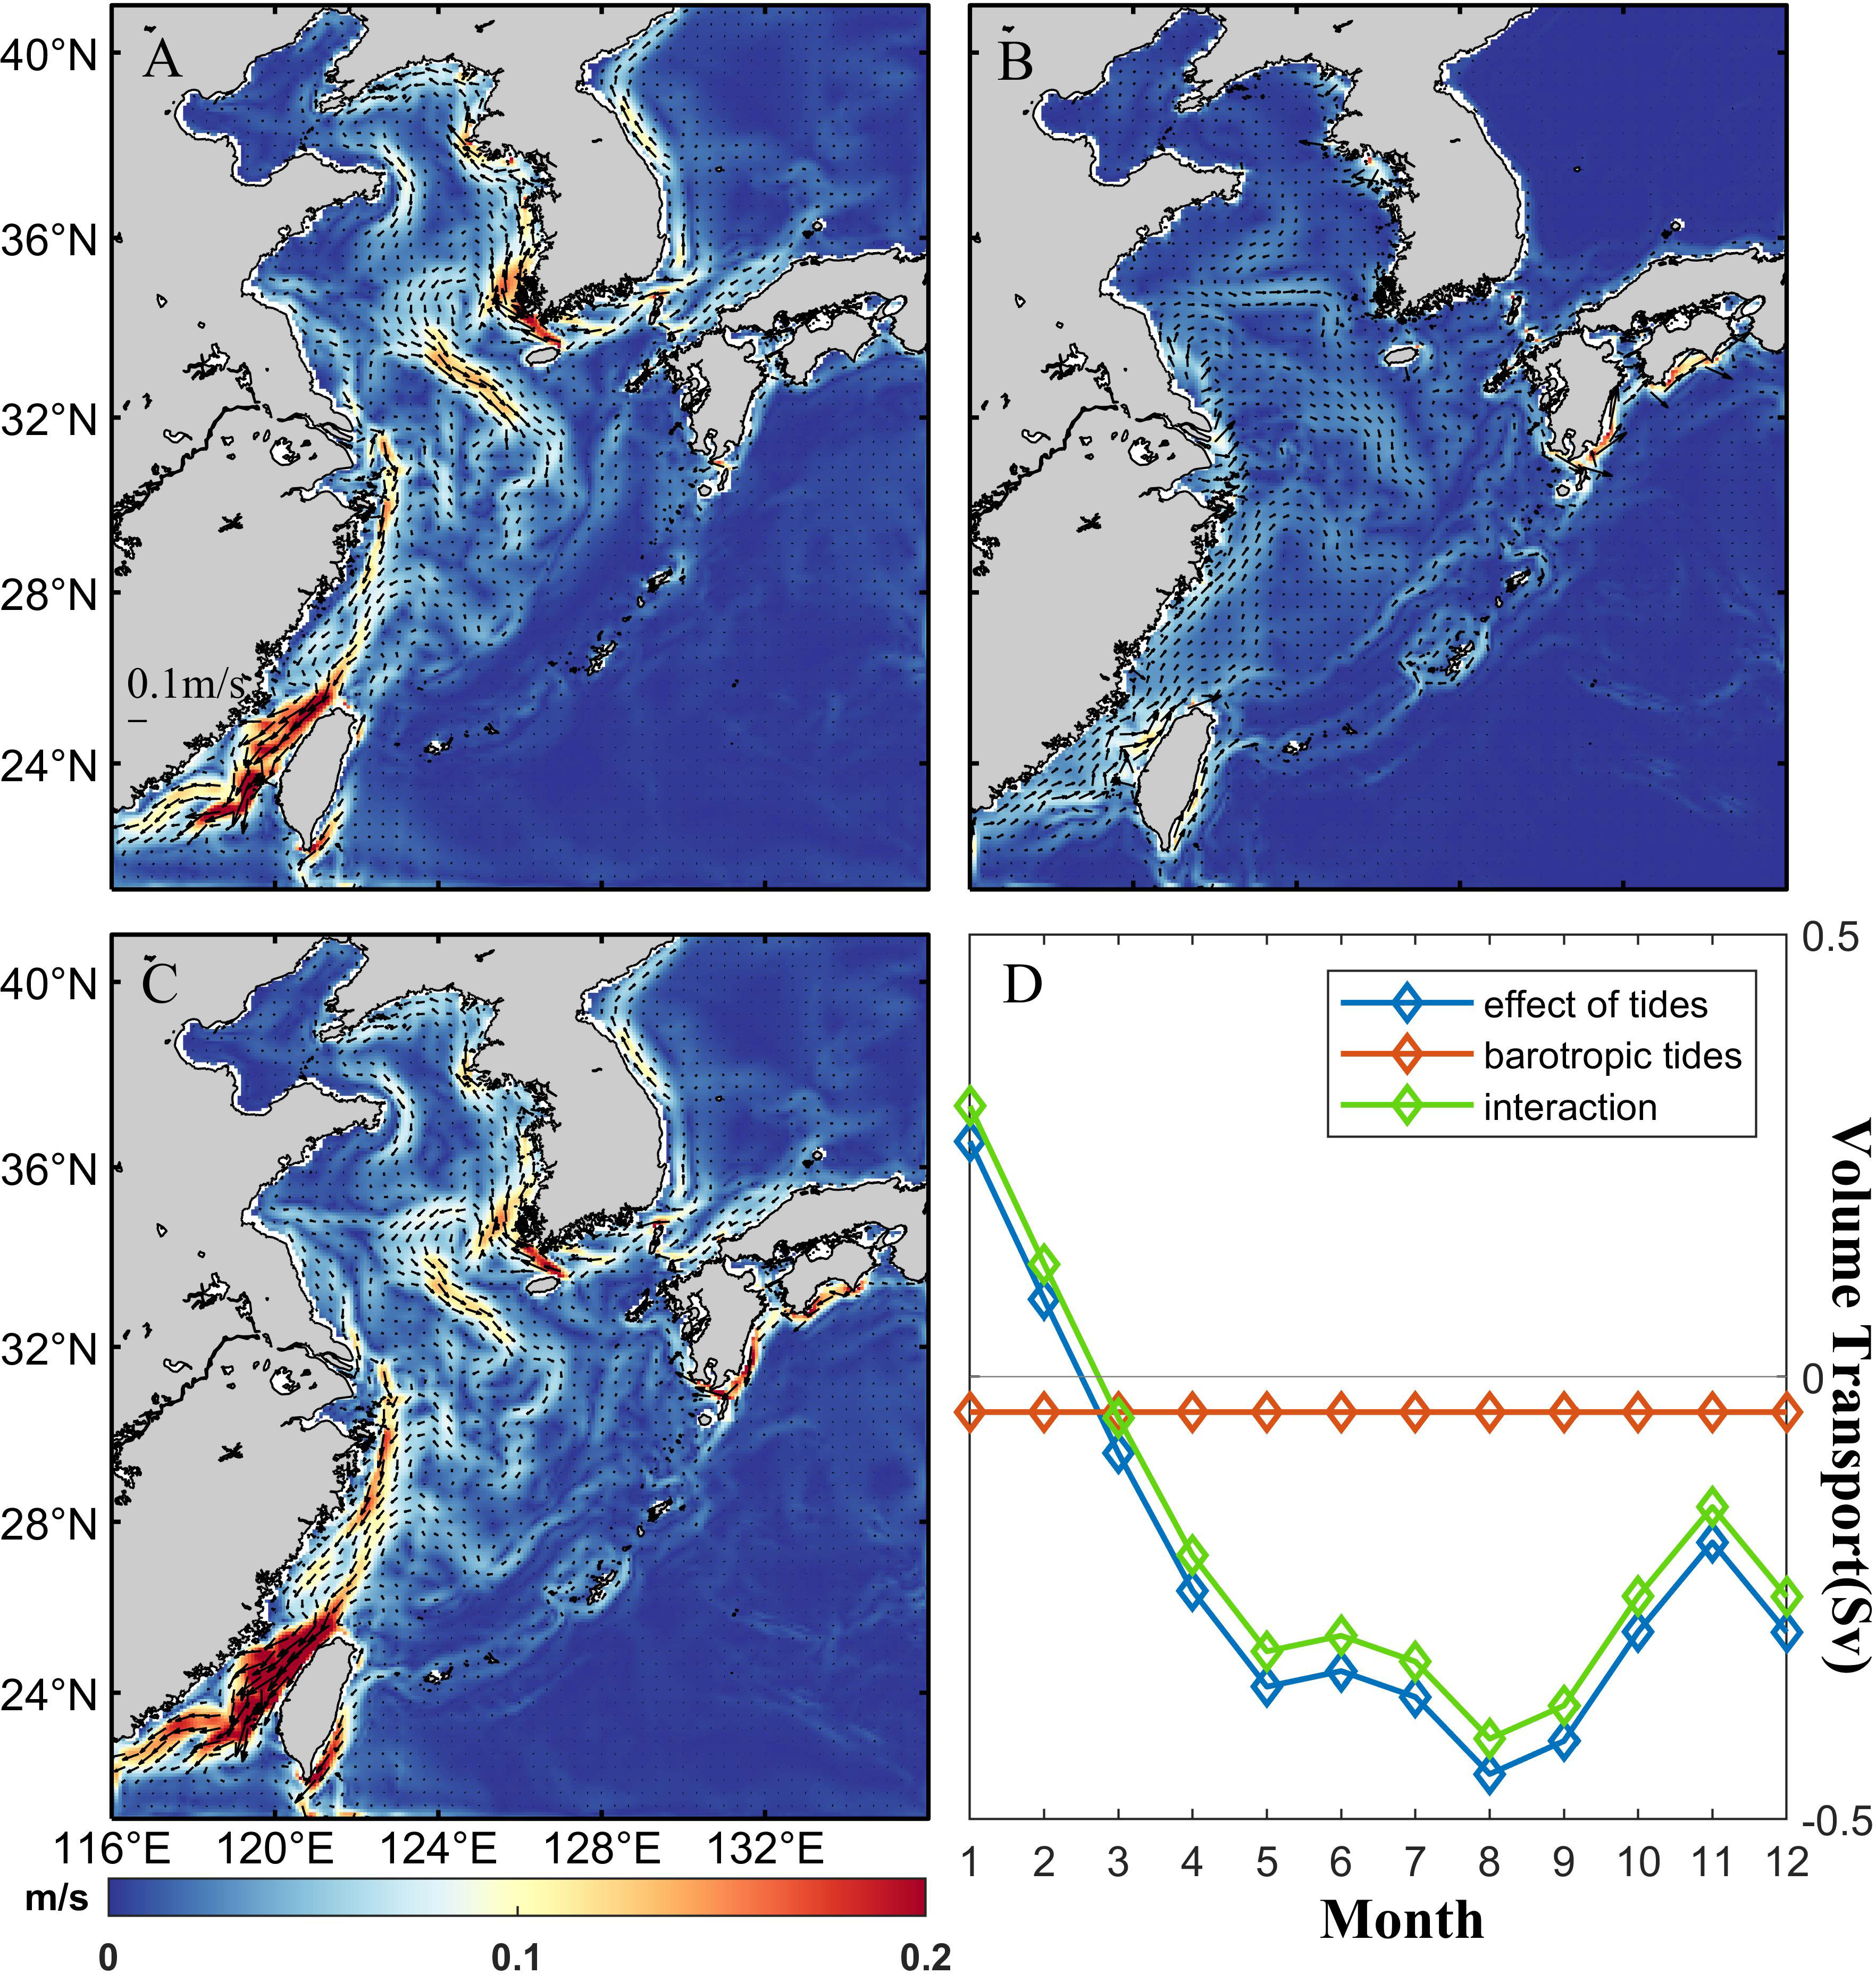
Figure 8 The annual average (A) tidal residual circulation under effect of tides (uBTtide+uinter in equation 4), (B) barotropic tidal residual circulation (uBTtide in equation 4), (C) tidal residual circulation related to the interaction of stratification (uinter in equation 4). And (D) the contributions of different terms to fluxes across the KTS.
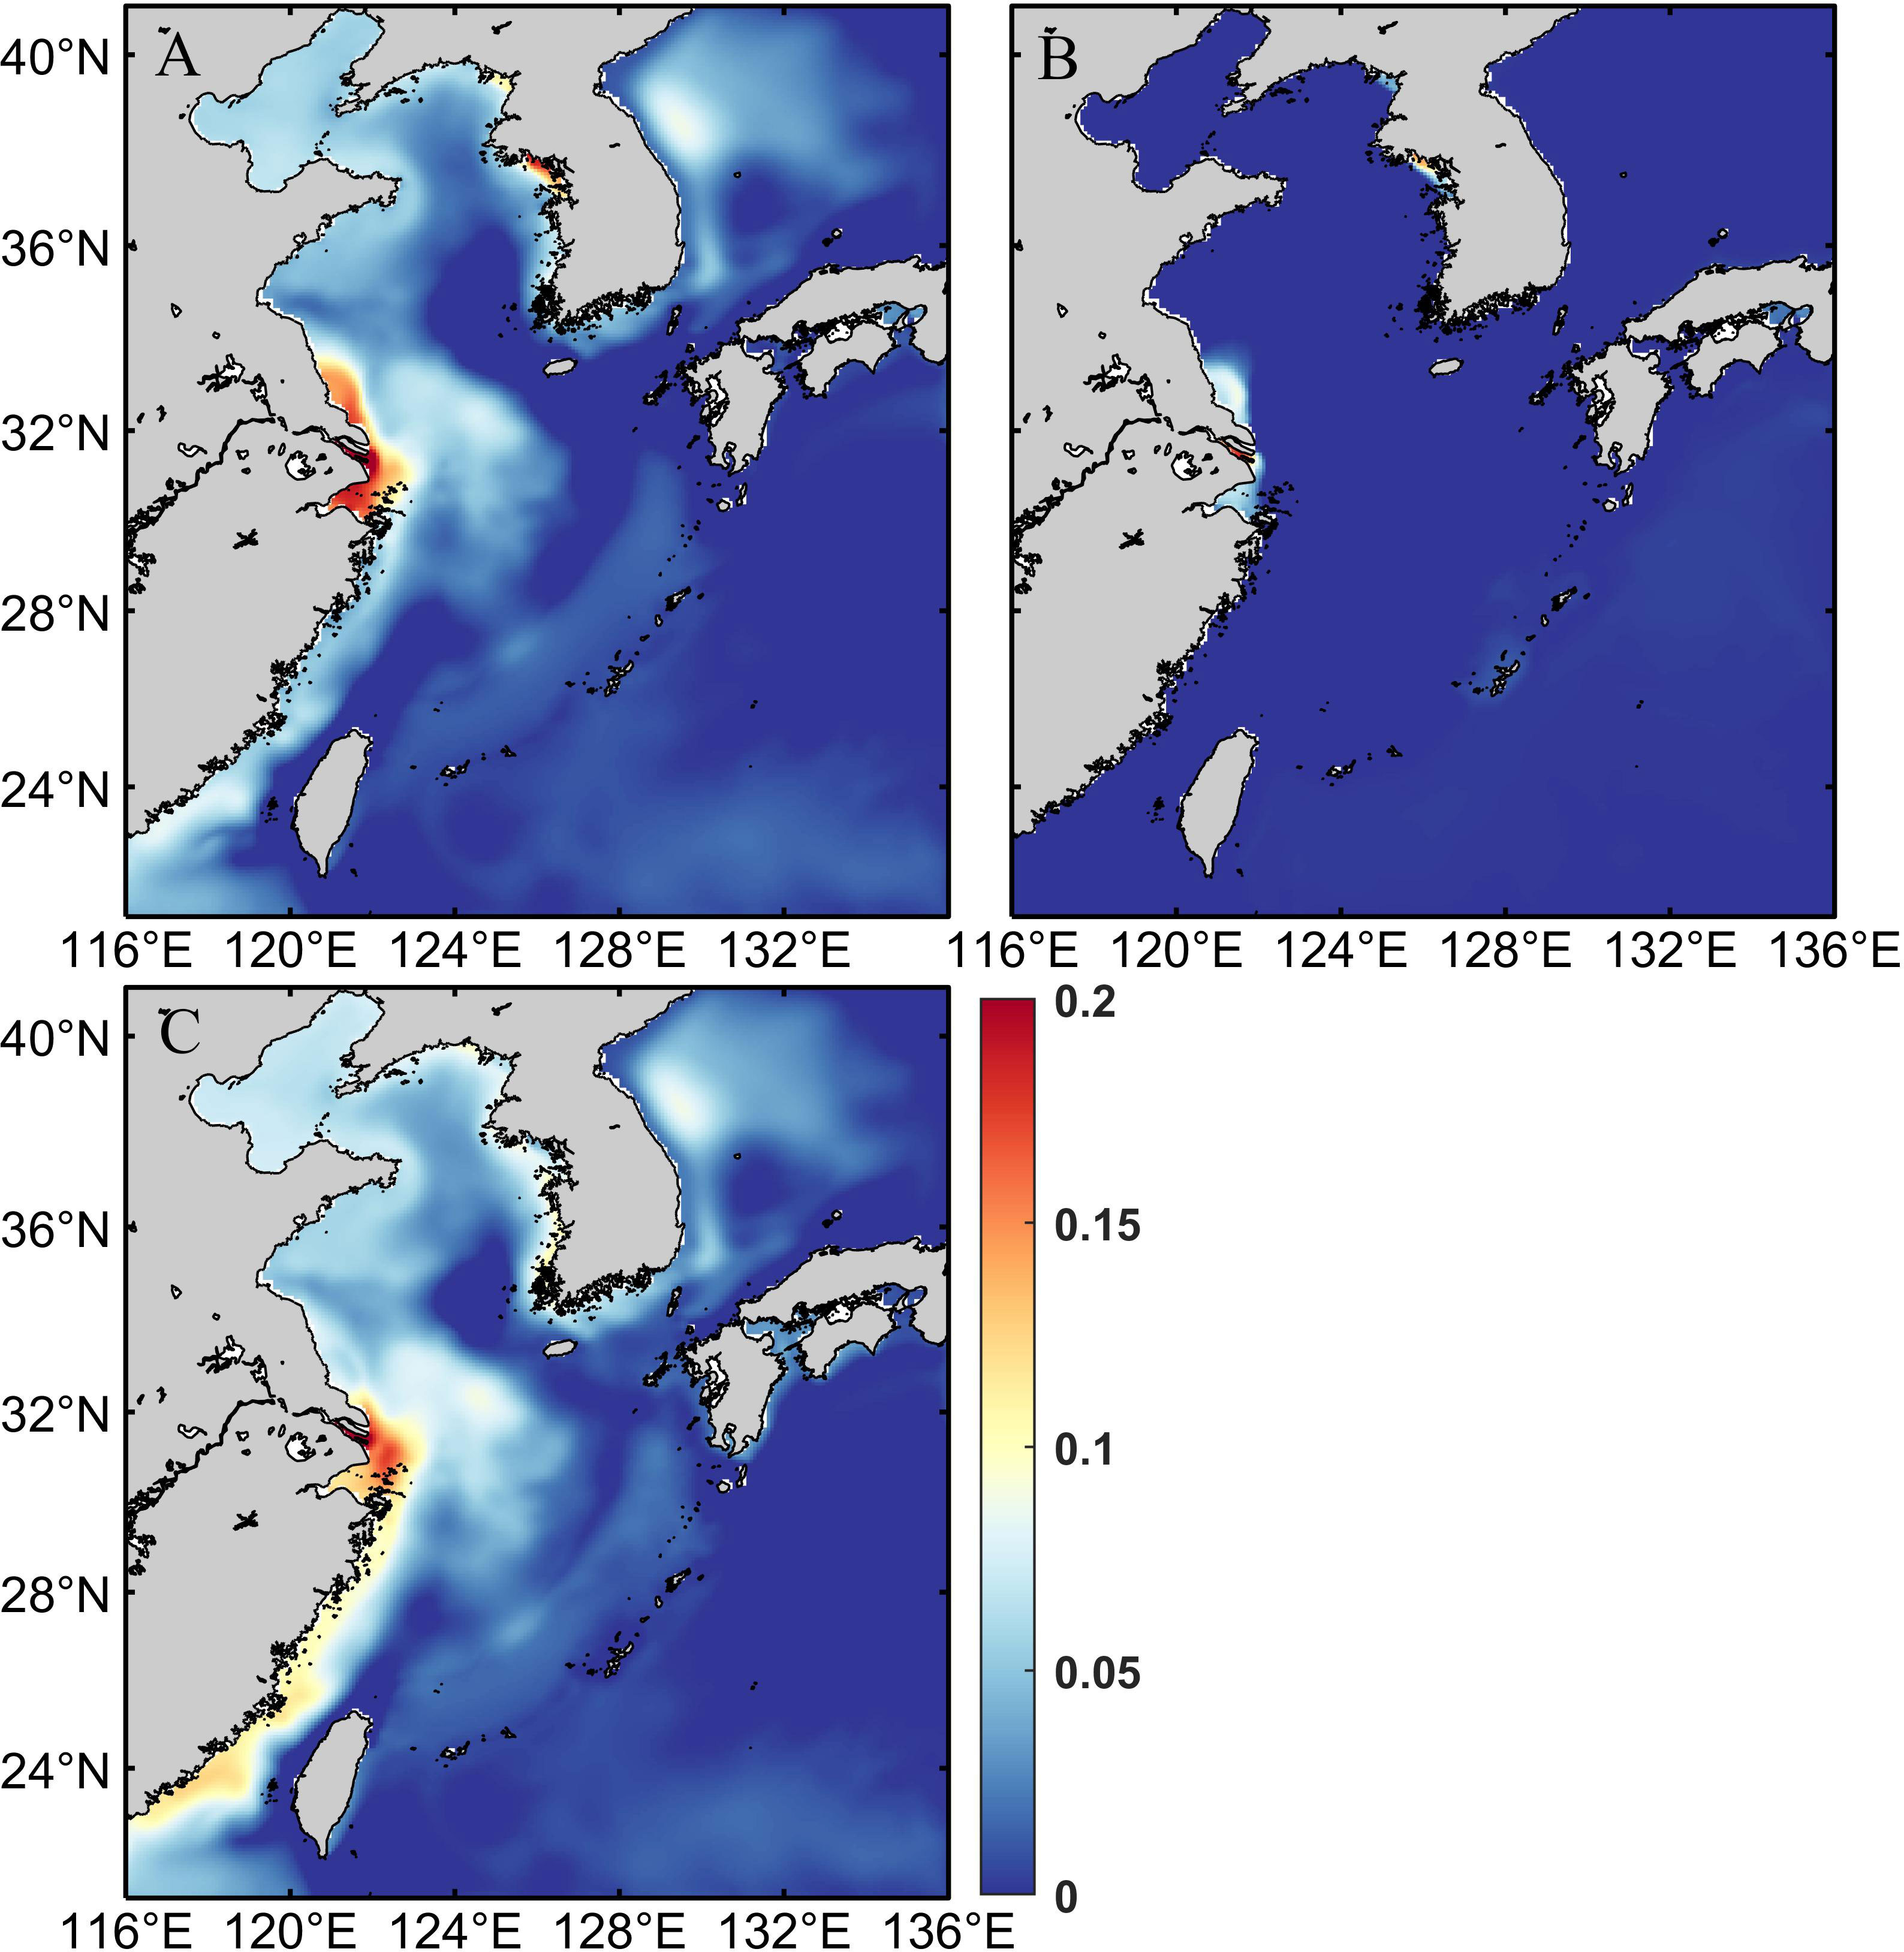
Figure 9 The annual average sea surface height (m) distribution (A) under effect of tides (zetacontrol–zetaback), (B) with barotropic experiment (zetaBTtide), (C) related to the interaction of stratification (zetainter).
Based on the above analysis, it is theorized that tides change the sea surface gradient in the KTS by decreasing the sea level difference between the Taiwan Strait and the KTS, as well as by the interaction with topography and stratification, thereby reducing the water flux through KTS throughout the year.But it is interesting to note that tidal effect enhances the KTS water flux in winter although it decreases the water flux in most months (Figure 10D). To address this abnormal behavior of tidal effect in winter, we checked the water flux across the 35°N transect. The monthly mean of vertically integrated current fields in the experiments with and without tides in February are shown in Figures 10A, B. The addition of tidal forcing induces significant changes in the North Jiangsu coastal current, and the flow along the west side of the Korean Peninsula. In addition, the YSWC also weakened in February. As shown in Figure 10C, the current velocity decreases in the 123–124°E region, corresponding to the weakening of the YSWC after applying tides in winter. The current velocity decreases in the coastal region near 126°E, corresponding to the weakening of the southward coastal current along the west side of the Korean Peninsula after applying tides. The northward intrusion of the YSWC is significantly weakened after applying tides (Figures 10A-C), and tidal forcing plays a key role in preventing the inflow of warm water. As shown in Figures 10A, B, the tidal forcing has little effect on the flow velocities in the source regions of the YSWC and TSWC, so we assume that the transport allocation between these two currents is based on a constant total transport. Due to the YSWC in winter, there is the strong temperature fronts on the both sides of the YSWC, the tidal effect enhances there, levels the steep SSH near the fronts and hinders its intrusion to the Yellow Sea. Then, more warm water flows eastward through the KTS into the EJS, resulting in the increase of water flux across the KTS in winter.
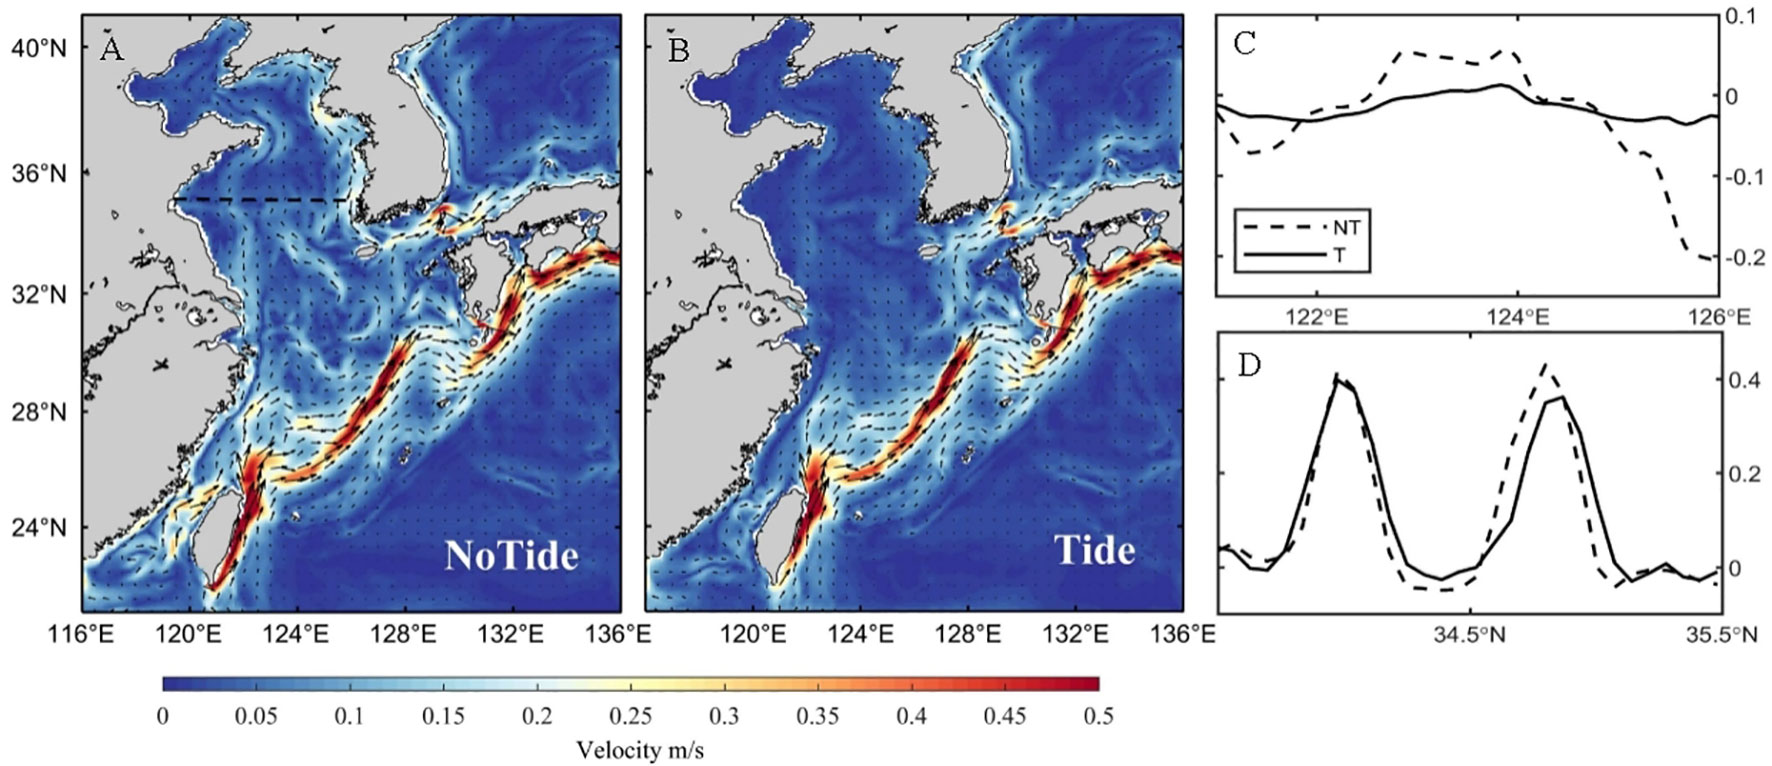
Figure 10 (A, B) Monthly mean of vertically integrated current fields in February. (C) The vertical mean v component (m/s) across the 35°N section in February. Positive denotes the northward current. The black dashed line is the 35°N section in Figure 10A. (D) The vertical mean u component (m/s) across the KTS section in February. Positive denotes the eastward current. The black dotted line is the KTS section in Figure 1A.
5 Conclusions
The volume transport through the KTS transect between the simulations with and without tides shows a remarkable difference, it increases by up to 13% (in summer) when excluding tides from the numerical simulation. The difference is generated by tidal effects including tidal mixing, tidal current advection, and so on. We examined the dynamic mechanism underlying this difference.
It can be concluded from the dynamical analysis that the pressure gradient term contributes the most to the zonal velocity in the KTS, while the contributions of the local acceleration term and the horizontal viscosity term are negligible. The current at the KTS is dominated by geostrophic flow driven by the pressure gradient. By quantifying the contributions of barotropic and baroclinic pressure gradients, we find that the barotropic pressure gradient is the main contributor to the pressure gradient; that is, the variation in sea surface height under tidal effect is the main reason for the water flux variation across the KTS. In addition, we calculated the correlation between the water flux variation across the Taiwan Strait and the KTS and found that tides can change the water level difference between Taiwan Strait and the KTS and then change the KTS water flux. And tides and their interaction with topography and stratification could adjust the whole circulation pattern in the Yellow Sea and East China Sea by residual current, then it leads to the variations of the sea surface height and the water flux through the KTS.
In general, tidal forcing will reduce the water flux across the KTS. However, due to the special existence of the YSWC in winter, the tidal effect hinders its intrusion to the Yellow Sea, and more warm water flows eastward through the KTS into the TSWC, resulting in an increase in water flux across the KTS in winter.
Green tides and jellyfish blooms are increasingly reported offshore of northern Jiangsu. Quantitatively evaluating the tidal effect on the water exchange between the ECS and EJS is useful for studying the tidal effect on the entry of materials into the EJS from offshore northern Jiangsu and helps to better characterize the hydrographic conditions and circulation structures in offshore China and the EJS. Hence, these research results are of great practical significance for analyzing the tidal effect on the circulation mechanism.
Data availability statement
The original contributions presented in the study are included in the article/supplementary material. Further inquiries can be directed to the corresponding author.
Author contributions
WJ: Writing – original draft. DY: Writing – review & editing. LX: Writing – review & editing. ZH: Writing – review & editing. XC: Writing – review & editing. BY: Writing – review & editing.
Funding
The author(s) declare financial support was received for the research, authorship, and/or publication of this article. This study was supported by the Key Research Infrastructures in the Field Stations of Chinese Academy of Sciences (KFJ-SW-YW047), Laoshan Laboratory Science and Technology Innovation Project (No. LSKJ202202504 and LSKJ2022020103), the National Natural Science Foundation of China (NSFC) (Nos. 92158202 and 42076022), the Strategic Priority Research Program, CAS (Nos. XDB42000000), and the CAS‐CSIRO BAU project (No. 133137KYSB20180141). It was also supported by the High-Performance Computing Center at the Institute of Oceanology, CAS (IOCAS), the East China Sea ocean observation and research station of OMORN, and the Youth Innovation Promotion Association, CAS.
Conflict of interest
The authors declare that the research was conducted in the absence of any commercial or financial relationships that could be construed as a potential conflict of interest.
Publisher’s note
All claims expressed in this article are solely those of the authors and do not necessarily represent those of their affiliated organizations, or those of the publisher, the editors and the reviewers. Any product that may be evaluated in this article, or claim that may be made by its manufacturer, is not guaranteed or endorsed by the publisher.
References
Caldwell P. C., Merrifield M. A., Thompson P. R. (2015). Data from: Sea level measured by tide gauges from global oceans-the Joint Archive for Sea Level holdings (NCEI Accession 0019568). Version 5.5 (NOAA National Centers for Environmental Information). doi: 10.7289/V5V40S7W
Cho Y. K., Seo G. H., Choi B. J., Kim S., Kim Y. G., Youn Y. H., et al. (2009). Connectivity among straits of the northwest Pacific marginal seas. J. Geophys. Res. 114, C06018. doi: 10.1029/2008JC005218
Cho Y. K., Seo G. H., Kim C. S., Choi B. J., Shaha D. C. (2013). Role of wind stress in causing maximum transport through the Korea Strait in autumn. J. Mar. Syst. 115, 33–39. doi: 10.1016/j.jmarsys.2013.02.002
Diaz H., Folland C., Manabe P., Reynolds D., Woodruff S. (2002). Workshop on advances in the use of historical marine climate data. Bull. World Meteorol. Organ. 51 (4), 377–380.
Egbert G. D., Erofeeva S. Y. (2002). Efficient inverse modeling of barotropic ocean tides. J. Atmos. Oceanic Technol. 19, 183–204. doi: 10.1175/1520-0426(2002)019<0183:EIMOBO>2.0.CO;2
Fang G. H. (1995). The structure of the Taiwan-Tsushima-Tsugaru current system and its relation to the Kuroshio. Mar. Sci. 4, 43–48.
Fang G. H., Xu X. Q., Wei Z. X., Wang Y. G., Wang X. Y. (2013). Vertical displacement loading tides and self-attraction and loading tides in the Bohai, Yellow, and East China Seas. Sci. China Earth Sci. 56, 63–70. doi: 10.1007/s11430-012-4518-9
Fukudome K. I., Yoon J. H., Ostrovskii A., Takikawa T., Han I. S. (2010). Seasonal volume transport variation in the Tsushima Warm Current through the Tsushima Straits from 10 years of ADCP observations. J. Oceanogr. 66 (4), 539–551. doi: 10.1007/s10872-010-0045-5
Guo B. H. (1994). Discussion on the barotropic current and baroclinic current in the ocean. J. Oceanogr. Huanghai Bohai Seas 12 (3), 65–69.
Guo X., Miyazawa Y., Yamagata T. (2006). The Kuroshio onshore intrusion along the shelf break of the East China Sea: the origin of the Tsushima warm current. J. Phys. Oceanogr. 36, 2205–2231. doi: 10.1175/JPO2976.1
He Z. Y., Zhu S. X., Sheng J. Y. (2022). Numerical study of circulation and seasonal variability in the Southwestern Yellow Sea. J. Mar. Sci. Eng. 10, 912. doi: 10.3390/jmse10070912
Huthnance J. M. (1973). Tidal current asymmetries over the Norfolk Sandbanks. Estuar. Coast. Mar. Sci. 1 (1), 89–99. doi: 10.1016/0302-3524(73)90061-3
Isobe A. (1999). On the origin of the Tsushima Warm Current and its seasonality. Continental Shelf Res. 19, 117–133. doi: 10.1016/S0278-4343(98)00065-X
Isobe A. (2008). Recent advances in ocean-circulation research on the Yellow Sea and East China Sea shelves. J. Oceanogr. 64, 569–584. doi: 10.1007/s10872-008-0048-7
Isobe A., Ando M., Watanabe T., Senjyu T., Sugihara S., Manda A. (2002). Freshwater and temperature transports through the Tsushima-Korea Straits. J. Geophys. Res. 107 (C7), 3065. doi: 10.1029/2000JC000702
Katavouta A., Polton J. A., Harle J. D., Holt J. T. (2022). Effect of tides on the Indonesian seas circulation and their role on the volume, heat and salt transports of the Indonesian throughflow. J. Geophys. Res.: Oceans 127 (8), e2022JC018524. doi: 10.1029/2022JC018524
Kida S., Qiu B., Yang J. Y., Lin X. P. (2016). The annual cycle of the Japan Sea throughflow. J. Phys. Oceanogr. 46, 23–39. doi: 10.1175/JPO-D-15-0075.1
Kim C. S., Cho Y. K., Choi B. J., Jung K. T., You S. H. (2013). Improving a prediction system for oil spills in the Yellow Sea: Effect of tides on subtidal flow. Mar. pollut. Bull. 68 (1-2), 85–92. doi: 10.1016/j.marpolbul.2012.12.018
Kim C. S., Cho Y. K., Seo G. H., Choi B. J., Jung K. T., Lee B. G. (2014). Interannual variation of freshwater transport and its causes in the Korea Strait: A modeling study. J. Mar. Syst. 132, 66–74. doi: 10.1016/j.jmarsys.2014.01.007
Kim D., Shin H. R., Kim C. H., Hirose N. (2019). Characteristics of the East Sea (Japan Sea) circulation depending on surface heat flux and its effect on Branching of the Tsushima Warm Current. Continental Shelf Res. 192, 104025. doi: 10.1016/j.csr.2019.104025
Kim K., Lyu S. J., Kim Y. G., Choi B. H., Taira K., Perkins H. T., et al. (2004). Monitoring volume transport through measurement of cable voltage across the Korea Strait. J. Atmos. Oceanic Technol. 21, 671–682. doi: 10.1175/1520-0426(2004)021<0671:MVTTMO>2.0.CO;2
Kim K. R., Cho Y. K., Kang D. J., Ki J. H. (2005). The origin of the Tsushima Current based on oxygen isotope measurement. Geophys. Res. Lett. 32, L03602. doi: 10.1029/2004GL021211
Li Y. N., Curchitser E. N., Wang J., Peng S. Q. (2020). Tidal effects on the surface water cooling northeast of Hainan Island, South China Sea. J. Geophys. Res.: Oceans 125 (10), e2019JC016016. doi: 10.1029/2019JC016016
Li M., Rong Z. R. (2012). Effects of tides on freshwater and volume transports in the Changjiang River plume. J. Geophys. Res. 117, C06027. doi: 10.1029/2011JC007716
Lin L., Liu D. Y., Guo X. Y., Luo C. X., Cheng Y. (2020). Tidal effect on water export rate in the Eastern Shelf Seas of China. J. Geophys. Res.: Oceans 125 (5), e2019JC015863. doi: 10.1029/2019JC015863
Loder J. W. (1980). Topographic rectification of tidal currents on the sides of Georges Bank. J. Phys. Oceanogr. 10 (9), 1399–1416. doi: 10.1175/1520-0485(1980)010<1399:TROTCO>2.0.CO;2
Ma C., Wu D. X., Lin X. P., Yang J. Y., Ju X. (2012). On the mechanism of seasonal variation of the Tsushima Warm Current. Continental Shelf Res. 48, 1–7. doi: 10.1016/j.csr.2012.08.013
Ma C., Yang J. Y., Wu D. X., Lin X. P. (2010). The Kuroshio Extension: a leading mechanism for the seasonal sea-level variability along the west coast of Japan. Ocean Dyn. 60 (3), 667–672. doi: 10.1007/s10236-009-0239-9
Marchesiello P., McWilliams J. C., Shchepetkin A. (2001). Open boundary conditions for long-term integration of regional oceanic models. Ocean Model. 3 (1-2), 1–20. doi: 10.1016/S1463-5003(00)00013-5
Moon J. H., Hirose N., Yoon J. H. (2009). Comparison of wind and tidal contributions to seasonal circulation of the Yellow Sea. J. Geophys. Res. 114, C08016. doi: 10.1029/2009JC005314
Morimoto A., Watanabe A., Onitsuka G., Takikawa T., Moku M., Yanagi T. (2012). Interannual variation in material transport through the eastern channel of the Tsushima/Korea Straits. Prog. Oceanogr. 105, 38–46. doi: 10.1016/j.pocean.2012.04.011
Polton J. A. (2014). Tidally induced mean flow over bathymetric features: A contemporary challenge for high-resolution wide-area models. Geophys. Astrophysical Fluid Dyn. 109 (3), 207–215. doi: 10.1080/03091929.2014.952726
Provost C. L., Genco M. L., Lyard F. (1995). “Modeling and predicting tides over the world ocean. Quantitative skill assessment for coastal ocean models,” in Coastal and Estuarine Series. Eds. Lynch D., Davies A. (Washington, DC: American Geophysical Union), 47.
Qi J. F., Yin B. S., Zhang Q. L., Yang D. Z., Xu Z. H. (2017). Seasonal variation of the Taiwan Warm Current Water and its underlying mechanism. Chin. J. Oceanol. Limnol. 5, 61–76. doi: 10.1007/s00343-017-6018-4
Seo G. H., Cho Y. K., Choi B. J. (2014). Variations of heat transport in the northwestern Pacific marginal seas inferred from high-resolution reanalysis. Prog. Oceanogr. 121, 98–108. doi: 10.1016/j.pocean.2013.10.005
Shchepetkin A. F., McWilliams J. C. (2005). The Regional Ocean Modeling System: A split-explicit, free-surface, topography following coordinates oceanic model. Ocean Model. 9 (4), 347–404. doi: 10.1016/j.ocemod.2004.08.002
Shin H. R., Lee J. H., Kim C. H., Yoon J. H., Hirose N., Takikawa T., et al. (2022). Long-term variation in volume transport of the Tsushima warm current estimated from ADCP current measurement and sea level differences in the Korea/Tsushima Strait. J. Mar. Syst. 232, 103750. doi: 10.1016/j.jmarsys.2022.103750
Song Y., Haidvogel D. B. (1994). A semi-implicit ocean circulation model using a generalized topography-following coordinate system. J. Comput. Phys. 115 (1), 228–244. doi: 10.1006/jcph.1994.1189
Takikawa T., Yoon J. H. (2005). Volume transport through the Tsushima Straits estimated from sea level difference. J. Oceanogr. 61 (4), 699–708. doi: 10.1007/s10872-005-0077-4
Takikawa T., Yoon J. H., Hase H., Cho K. D. (1999). Monitoring of the Tsushima current at the Tsushima/Korea Straits. In Proceedings 3rd CREAMS International Symposium. (Fukuoka, Japan), 15–18.
Tawara S., Miita T., Fujiwara T. (1984). The hydrography and variability in the Tsushima Straits. Bull. Coast. Oceanogr. 22, 50–58.
Teague W. J., Hwang P. A., Jacobs G. A., Book J. W., Perkins H. T. (2005). Transport variability across the Korea/Tsushima Strait and the Tsushima Island Wake. Deep Sea Res. Part II Topical Stud. Oceanogr. 52 (11), 1784–1801. doi: 10.1016/j.dsr2.2003.07.021
Teague W. J., Jacobs G. A., Perkins H. T., Book J. W. (2002). Low-frequency current observations in the Korea-Tsushima Strait. J. Phys. Oceanogr. 32, 1621–1641. doi: 10.1175/1520-0485(2002)032<1621:LFCOIT>2.0.CO;2
Tsujino H., Nakano H., Motoi T. (2008). Mechanism of currents through the straits of the Japan Sea: Mean state and seasonal variation. J. Oceanogr. 64, 141–161. doi: 10.1007/s10872-008-0011-7
Wei Z. X., Pan H. D., Xu T. F., Wang Y. G., Wang J. (2022). Development history of the numerical simulation of tides in the East Asian marginal seas: an overview. J. Mar. Sci. Eng. 10, 984. doi: 10.3390/jmse10070984
Wu H., Shen J., Zhu J. R., Zhang J., Li L. (2014). Characteristics of the Changjiang plume and its extension along the Jiangsu Coast. Continental Shelf Res. 76, 108–123. doi: 10.1016/j.csr.2014.01.007
Wu T. N., Wu H. (2018). Tidal mixing sustains a bottom-trapped river plume and buoyant coastal current on an energetic continental shelf. J. Geophys. Res.: Oceans 123 (11), 8026–8051. doi: 10.1029/2018JC014105
Xu L. J., Yang D. Z., Benthuysen J. A., Yin B. S. (2018). Key dynamical factors driving the Kuroshio subsurface water to reach the Zhejiang coastal area. J. Geophys. Res.: Oceans 123 (12), 9061–9081. doi: 10.1029/2018JC014219
Xuan J. L., Yang Z. Q., Huang D. J., Wang T. P., Zhou F. (2016). Tidal residual current and its role in the mean flow on the Changjiang Bank. J. Mar. Syst. 154, 66–81. doi: 10.1016/j.jmarsys.2015.04.005
Yang D. Z., Huang R. X., Feng X. R., Qi J. F., Gao G. D., Yin B. S. (2020). Wind stress over the Pacific Ocean east of Japan drives the shelf circulation east of China. Continental Shelf Res. 201, 104122. doi: 10.1016/j.csr.2020.104122
Yang D. Z., Yin B. S., Liu Z. L., Bai T., Qi J. F., Chen H. Y. (2012). Numerical study on the pattern and origins of Kuroshio branches in the bottom water of southern East China Sea in summer. J. Geophys. Res.: Oceans 117, C02014. doi: 10.1029/2011JC007528
Yang D. Z., Yin B. S., Liu Z. L., Feng X. R. (2011). Numerical study of the ocean circulation on the East China Sea shelf and a Kuroshio bottom branch northeast of Taiwan in summer. J. Geophys. Res.: Oceans 116 (C5), C05015. doi: 10.1029/2010JC006777
Yoon W. D., Yang J. Y., Shim M. B., Kang H. K. (2008). Physical processes influencing the occurrence of the giant jellyfish Nemopilema nomurai (Scyphozoa: Rhizostomeae) around Jeju Island, Korea. J. Plankton Res. 30 (3), 251–260. doi: 10.1093/plankt/fbm102
Zeng G. N., Hu J. Y., Hong H. S., Qi Y. Q. (2012). Numerical study on M2 tidal system in the Taiwan Strait. Proc. Environ. Sci. 12, 702–707. doi: 10.1016/j.proenv.2012.01.337
Keywords: Korea/Tsushima Strait, Tsushima warm current, East China Sea, tide, numerical modeling
Citation: Jiang W, Yang D, Xu L, He Z, Cui X and Yin B (2023) Numerical study of tidal effect on the water flux across the Korea/Tsushima Strait. Front. Mar. Sci. 10:1287611. doi: 10.3389/fmars.2023.1287611
Received: 04 September 2023; Accepted: 03 November 2023;
Published: 20 November 2023.
Edited by:
Yang-Ki Cho, Seoul National University, Republic of KoreaReviewed by:
Do-Seong Byun, Korea Hydrographic and Oceanographic Agency, Republic of KoreaYang Ding, Ocean University of China, China
Copyright © 2023 Jiang, Yang, Xu, He, Cui and Yin. This is an open-access article distributed under the terms of the Creative Commons Attribution License (CC BY). The use, distribution or reproduction in other forums is permitted, provided the original author(s) and the copyright owner(s) are credited and that the original publication in this journal is cited, in accordance with accepted academic practice. No use, distribution or reproduction is permitted which does not comply with these terms.
*Correspondence: Dezhou Yang, eWFuZ2RlemhvdUBxZGlvLmFjLmNu
 Wenxin Jiang
 Dezhou Yang
 Lingjing Xu
 Zhiwei He1,2,3,4
 Xuan Cui
 Baoshu Yin
