 Yin Cao
 Qing Wang*
- Institute of Coastal Research, Ludong University, Yantai, China
The Yellow River Delta has undergone significant changes, developing a temperate chalk-sand silty coast with expansive and level tidal flats. However, the area is currently facing the threat of erosion due to coastal area construction, decreased river sediment discharge into the sea, and intensified marine hydrodynamic forces. Remote sensing technology has important applications in spatial and temporal monitoring of tidal flats. This study employs tidal data to establish the threshold range for the extraction of tidal flats in the Yellow River Qingshuigou sub-delta, using the water frequency method based on the image element proposed by previous authors. The study successfully identifies and analyzes the range of tidal flats, and further delves into their evolutionary process and underlying mechanisms. The study concludes that the area of tidal flats has shown a decreasing trend and was divided into a “rapid decline phase” and an “overall stabilization phase” with 2006 as the boundary. The spatial and temporal evolution of tidal flats is primarily influenced by three main factors: river sediment discharges, marine hydrodynamic forces, and anthropogenic reclamation activities. Specifically, the river sediment discharges and marine hydrodynamic forces impact the extent of tidal flats by modifying the boundary conditions, primarily at the sea boundary. Reclamation activities have a direct and rapid effect on the extent of tidal flats, primarily at the land boundary. In this study, we determined the contribution of three factors to the spatial and temporal evolution of tidal flats in different periods. During the two phases of the tidal flats’ spatial and temporal evolution in the Yellow River Qingshuigou sub-delta, the driving mechanisms were identified as “reclamation - marine hydrodynamic forces - river sediment discharges” and “marine hydrodynamic forces - river sediment discharges - reclamation”.
1 Introduction
Tidal flats are a crucial component of the estuarine delta system, with their dynamic changes in area and boundaries influencing the extent of marine and terrestrial areas and providing various ecosystem services (Chen and Lee, 2022; Murray et al., 2019). They support diverse ecosystems, provide habitat for numerous species, and contribute to nutrient cycling and sediment stabilization. Tidal flats also play a role in mitigating coastal erosion and storm surge impacts by dissipating wave energy. However, human activities, such as coastal development and reclamation, have led to the conversion of tidal flat areas into urban or industrial zones, resulting in habitat loss and fragmentation (Arkema et al., 2013; Passeri et al., 2015; Khojasteh et al., 2021). The reduction of riverine sedimentation into the sea, caused by factors such as dam construction and sediment trapping, can disrupt the natural processes that sustain and replenish tidal flats, leading to their degradation and erosion. Coastal erosion, exacerbated by factors such as sea-level rise and intensified marine hydrodynamic forces, further exacerbates the loss of tidal flat areas. These pressures have implications for the ecosystems and species that depend on them, as well as the services they provide, such as shoreline protection and carbon sequestration. Approximately 16% of the global tidal flats have been lost in the period 1984-2016, covering an area of more than 20,000 km2 (Murray et al., 2019). It is crucial to address these threats and implement measures to conserve and restore tidal flats for their ecological and societal values.
Remote sensing images have become increasingly popular for extracting the extent of tidal flats due to their advantages over traditional field surveys (Tong et al., 2020; Kang et al., 2023). There are three main methods for extracting the extent of tidal flats from remote sensing imagery. The first approach is based on water margin extraction, which involves selecting remote sensing images captured during high and low tide moments and extracting the instantaneous water margins to determine the extent of the tidal flats. This methodology has been previously employed in the extraction of tidal flats in the South Yellow Sea (Kang et al., 2023) and Jiaozhou Bay (Yan et al., 2021). This method is highly reliant on the temporal resolution of the remote sensing images and the prevailing weather conditions during the corresponding moments. The second approach is the supervised classification-based method, which involves utilizing training data to obtain distinctive features associated with tidal flats and extract their extent. This methodology has demonstrated successful applications in tidal flat studies conducted both in China (Zhang et al., 2019; Wang et al., 2020; Jia et al., 2021) and globally (Murray et al., 2019). However, this method heavily relies on the availability and quality of the training data, which can pose challenges in terms of cost and time consumption. The third method is based on the extraction of image inundation probability, which involves overlaying land and water-classified remote sensing images to calculate the inundation probability for each image. By setting a threshold value, the tidal flat range can be extracted. This methodology has demonstrated successful applications in tidal flat studies conducted in Australia (Sagar et al., 2017), Bohai Bay (Liu et al., 2016), and the Yellow River Delta (Wang et al., 2023). This method offers a relatively objective means of determining the extent of tidal flats and has been successfully applied in various tidal flat studies. However, the accuracy of this method relies on the appropriate selection of the threshold value, which is crucial to ensure a more accurate extraction of the tidal flat extent.
In contrast to the sandy coast formed by an ancient lagoon-sand dam system in the northwestern Shandong Peninsula on the eastern shore of Laizhou Bay, the modern Yellow River Delta exhibits a distinctive temperate chalk-sand silty coast. This unique coastal landscape features expansive and flat intertidal tidal flats, which have formed due to the accumulation of substantial amounts of Yellow River sediment into the sea and neotectonic subsidence (Wang et al., 2016; Li et al., 2018; Zhang et al., 2019). However, like other major river deltas, the tidal flats in the Yellow River Delta have faced erosion threats in recent decades due to coastal zone construction (Wang et al., 2023), reduced sediment inflow from the river (Wang et al., 2015), and intensified marine hydrodynamics (Zhang et al., 2018). Current research on the spatial and temporal evolution of tidal flats in the Yellow River Delta and their influencing mechanisms primarily focuses on shoreline variability (Fan et al., 2018; Zhang et al., 2018; Zhu et al., 2021), inversion of tidal flat elevation, changes in tidal flat area over time, and the analysis of driving forces (Zhang et al., 2019; Wang et al., 2023 However, these studies mainly investigate the impacts of human activities, such as salt fields and aquaculture ponds, while there is a lack of comprehensive analysis of the spatial and temporal evolution of tidal flats in the Qingshuigou sub-delta from 1996 to the present. Furthermore, there is a scarcity of quantitative exploration into the mechanisms underlying tidal flat evolution under the combined effects of human activities, river sediment discharges, and marine dynamic conditions.
To address the remaining challenges in the previous studies, this research aims to integrate tidal data with the tidal flats range extraction method based on image element inundation probability. By determining an appropriate threshold range, we will extract the intertidal flats range of the Yellow River Qingshuigou sub-delta from 1996 to 2021. Furthermore, we will combine visual interpretation, analysis of Yellow River sediment discharges, and hydrodynamic modeling to explore the spatial and temporal evolution process and underlying mechanisms of the tidal flats in this area. Additionally, we will analyze the driving forces that influence the spatial and temporal evolution of tidal flats in the Yellow River Qingshuigou sub-delta. The outcomes of this study will contribute to a deeper understanding of tidal flat evolution in estuarine environments, while also supporting ecological preservation and economic development in the delta region.
2 Study area
The Yellow River estuary is a typical weakly tidal estuary characterized by multiple sediment types and frequent mouth-gate migration (Xu et al., 2019). The lower reaches of the modern Yellow River exhibit a dynamic system with multi-sand sediment and continuous migration. Since 1855, the estuary has undergone north-south migration and river seaward extension, leading to the formation of a large fan-shaped delta comprising several sub-deltas (Ye et al., 2007).
The Yellow River Delta faces a significant challenge to balance development and ecological protection in the current era. The Qingshuigou sub-delta, located within the Yellow River Delta Nature Reserve, serves as the core area of the Yellow River Delta High-Efficiency Eco-Economic Zone. It is adjacent to the Shengli Oilfield, Bohai Oil and Gas Field, and Dongying Harbor. The stability of its flats is vital for the economic development, resource utilization, and ecological preservation of the delta region. Furthermore, the abandoned estuary of the Qingshuigou sub-delta coexists with the current estuary and undergoes dynamic changes of erosion and siltation, making it highly representative. Therefore, this study focuses on the tidal flats of the Yellow River Qingshuigou sub-delta as the study area, which includes the abandoned estuary area of Qingshuigou and the current estuary area of Qing8 (Figure 1).
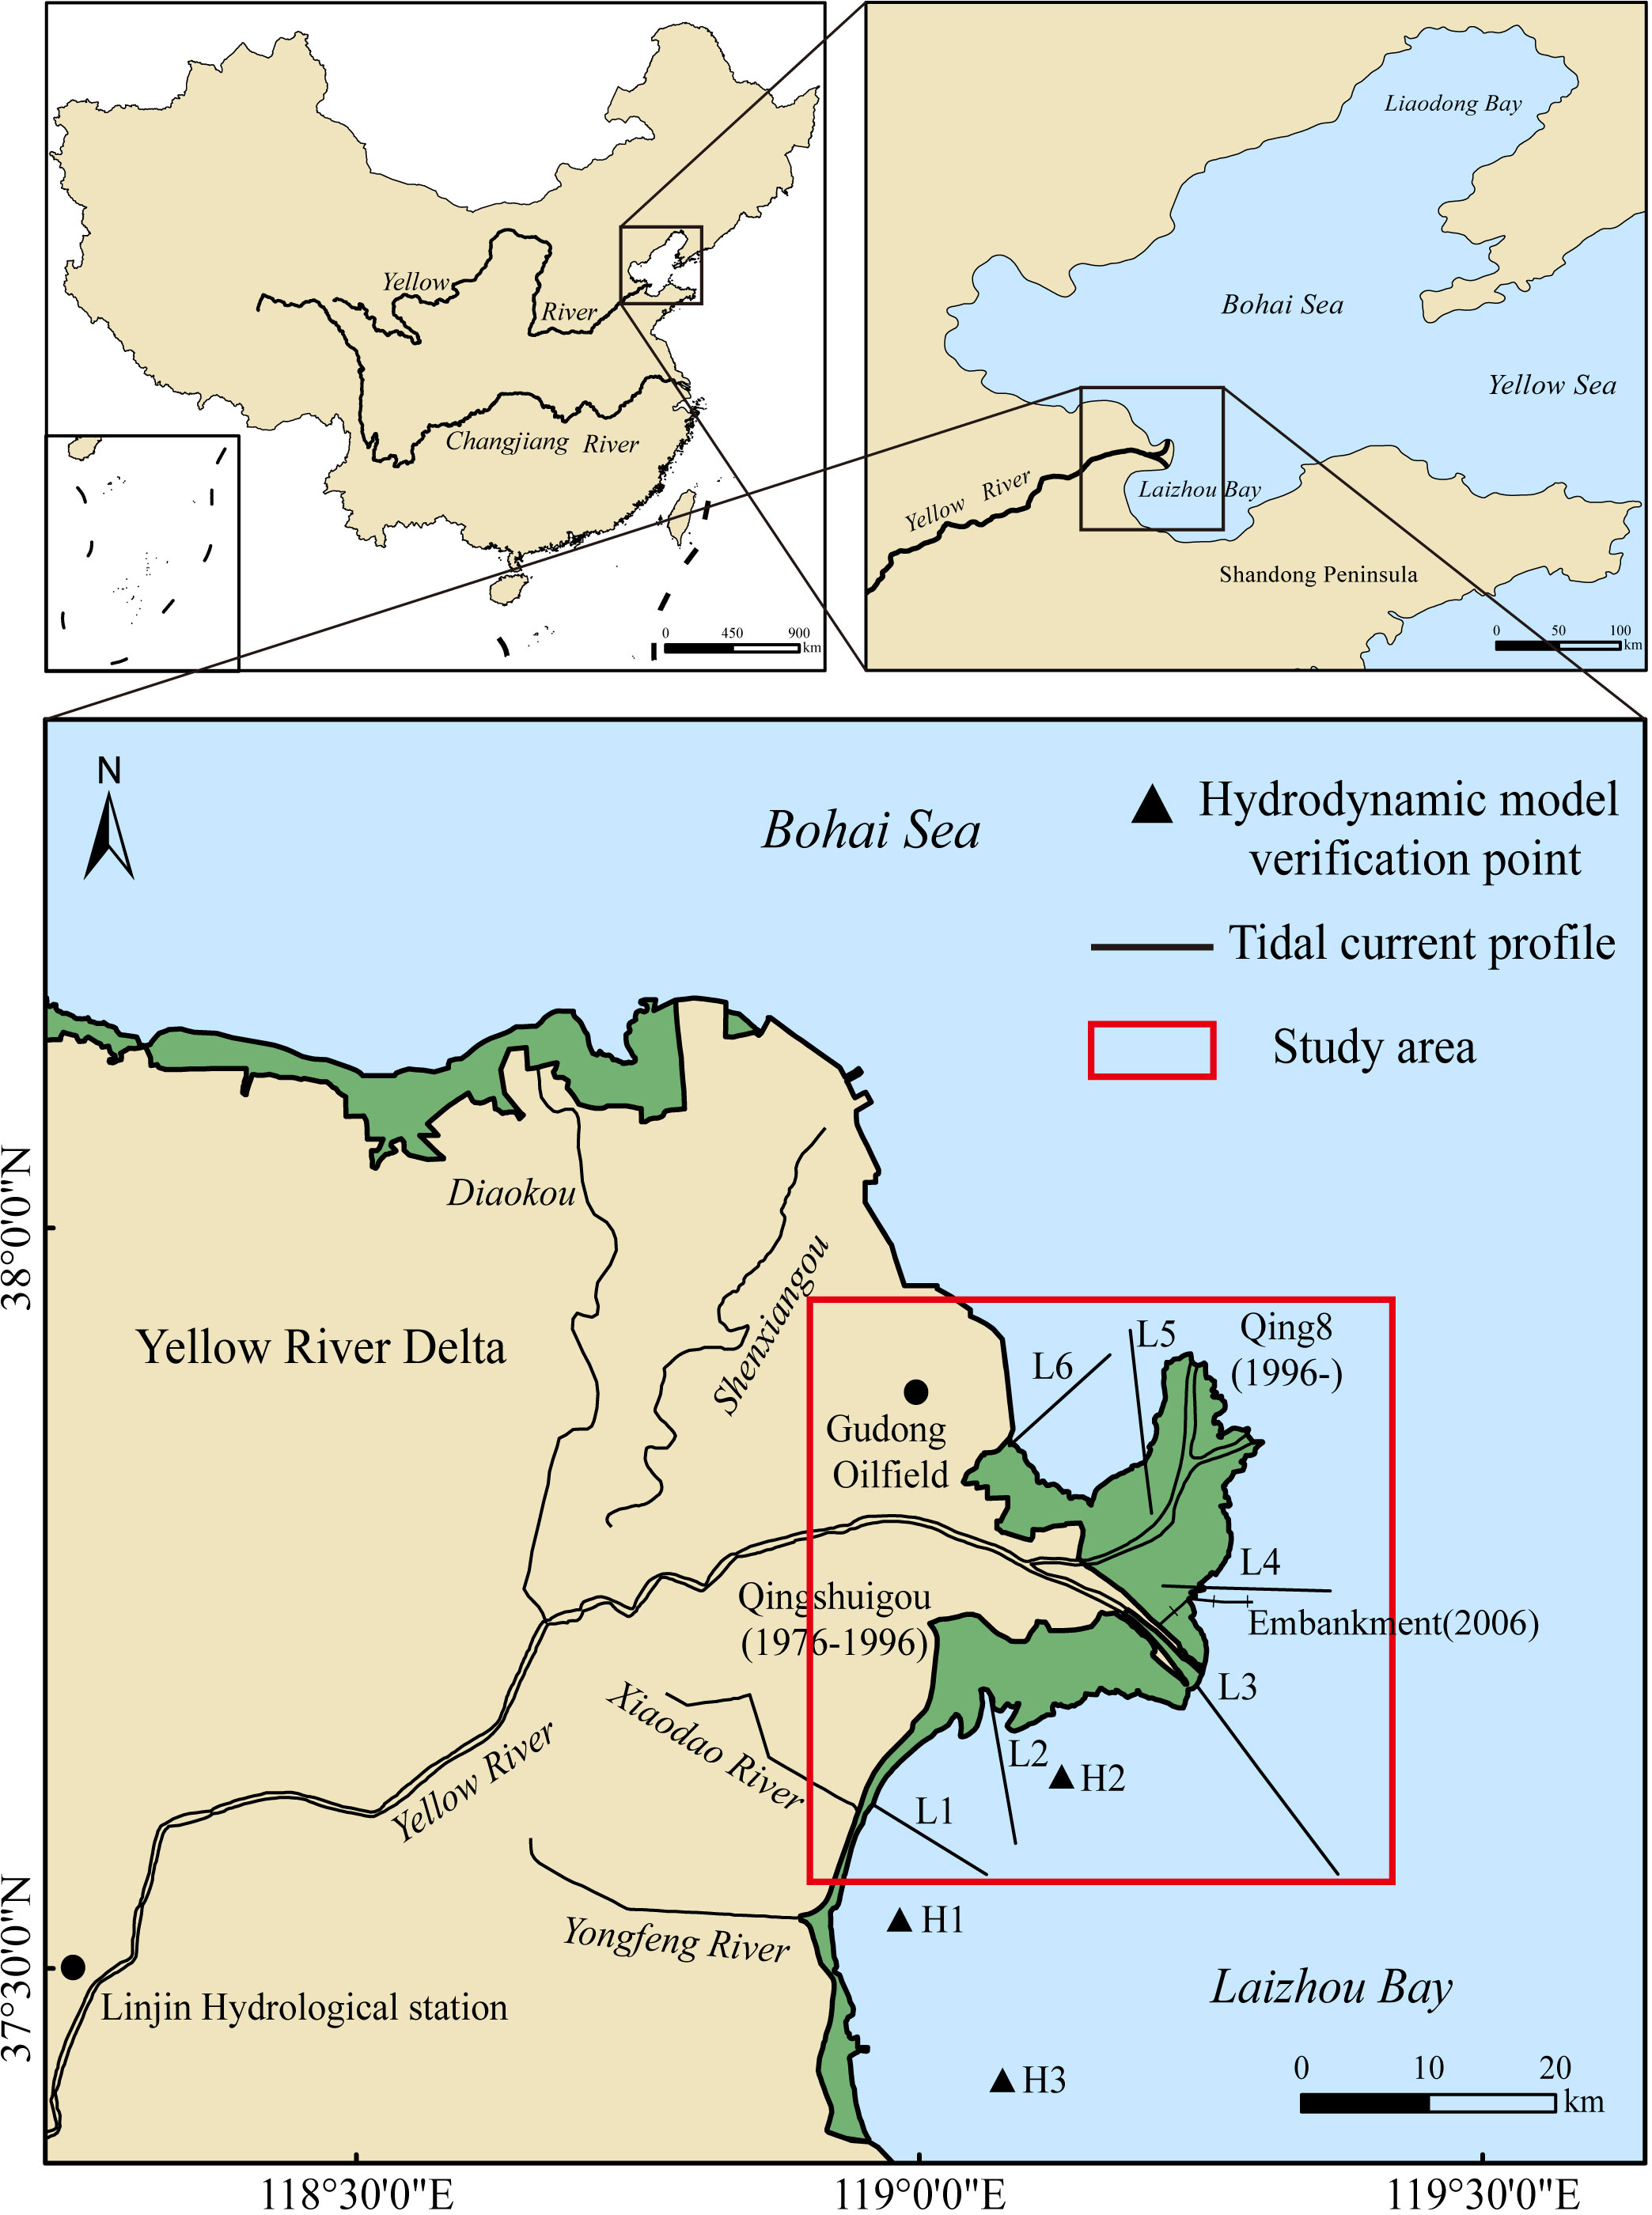
Figure 1 The geographical location of the Yellow River Qingshuigou sub-delta, and the spatial distribution of hydrodynamic model validation sites and tidal current profile.
The Yellow River Qingshuigou sub-delta is situated in the temperate monsoon climate zone, characterized by simultaneous rain and heat. The wave patterns in this region are mainly influenced by the monsoon and the wave directions are mainly S, NE-NNE, and NNW. The tidal currents are primarily governed by semidiurnal tides, with reciprocating currents and littoral flow. The average tidal range ranges from 0.8 to 2.6 m, indicating a typical river-controlled weakly tidal delta (Zhang et al., 2018).
The sediment in this sub-delta primarily originates from the Loess Plateau region in the middle reaches of the Yellow River. It is predominantly composed of chalky sand and clay, resulting in the development of expansive shoals of chalky sandy silt in the tidal flats (Li et al., 2018).
3 Data sources and methods
3.1 Data sources
In this study, 262 Landsat series satellite images including TM (Thematic Mapper), ETM+ (Enhanced Thematic Mapper Plus), and OLI (Operational Land Imager) imagery. The images were obtained from the Earth Resources Observation and Science Center (http://glovis.usgs.gov). Figure 2A shows the type and temporal distribution of these remote-sensing images.
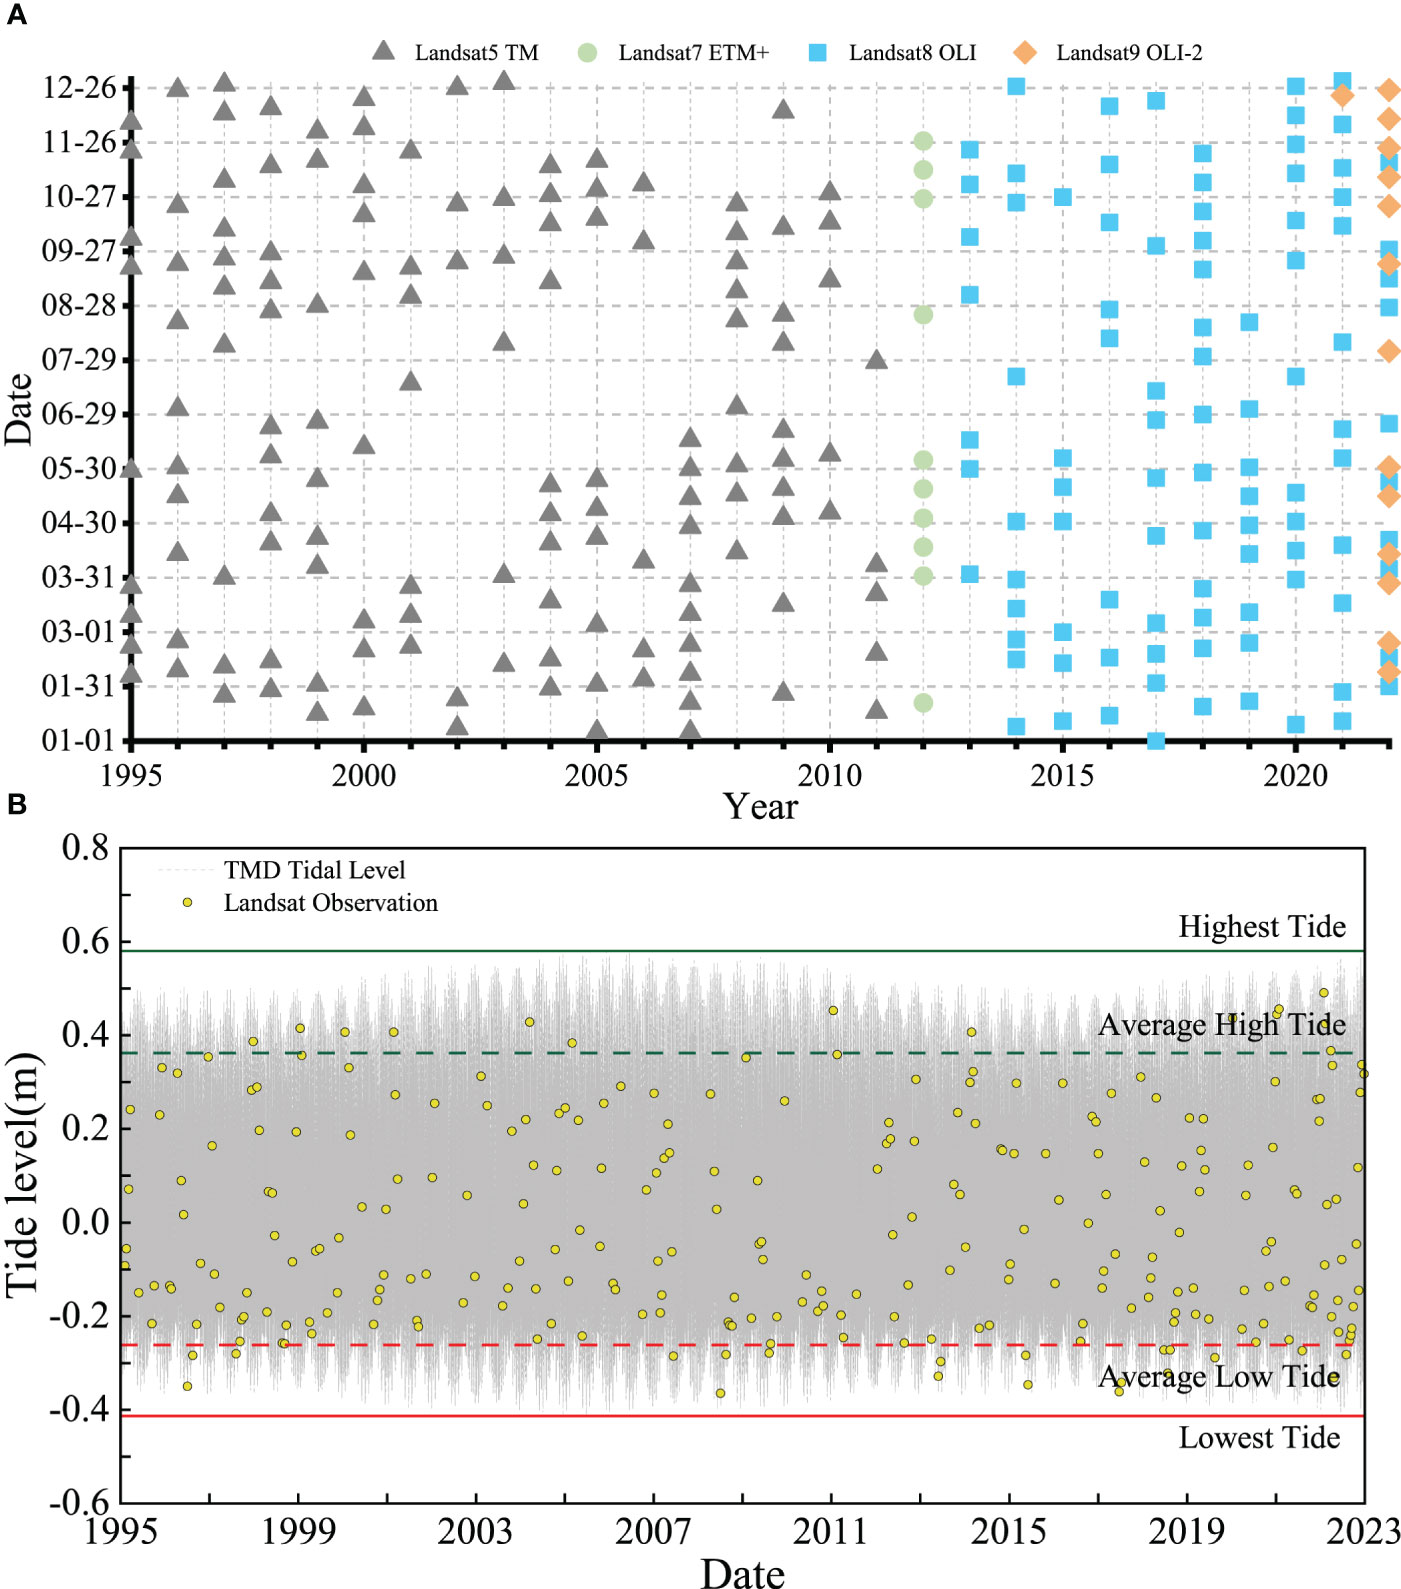
Figure 2 (A) means Temporal distribution of remote sensing images, (B) means Tide Model Driver Model Tide Level Simulation Results and Tidal Height at the Moment of Transit from Remote Sensing Imagery.
Due to the limited availability of long-term measured tidal data in the study area, tidal data for this research were obtained using a tidal modulation model. The Tide Model Driver (TMD) tidal model, developed by Oregon State University and the Institute for Earth and Space Studies, was utilized. This model is widely employed for predicting tidal heights and tidal current information (Padman et al., 2005; Riedel et al., 2018). In this study, the TMD model was employed to calculate tide level information in the Yellow River Delta region spanning from 1995 to 2022. This facilitated the determination of multi-year mean high tide levels and mean low tide levels for each year, which were subsequently used for tidal flats range extraction (Figure 2B).
Sediment data from the Yellow River entering the sea were obtained from the annual sand transport measurements at the Lijin hydrological station (118°18′E,37°31′N), located approximately 104 km from the river mouth. These data were sourced from the Chinese River Sediment Communique (http://www.mwr.gov.cn) and cover the period from 1996 to 2021.
Furthermore, this study involved the observation of tidal and current conditions in the sea area near the Yellow River Delta using Acoustic Doppler Current Profilers (ADCP). These data will be utilized to validate the hydrodynamic model.
3.2 Methods
3.2.1 Calculation of the probability of flooding of the image element
A tidal flat is usually the portion that is periodically inundated by seawater (Murray et al., 2019) and in this paper refers to the area between the mean high tide line and the mean low tide line of a multi-year high tide. In this study, the tidal flats extent was extracted based on previous studies using a method that utilizes image inundation frequency from multi-year remote sensing data combined with tidal data (Figure 3).
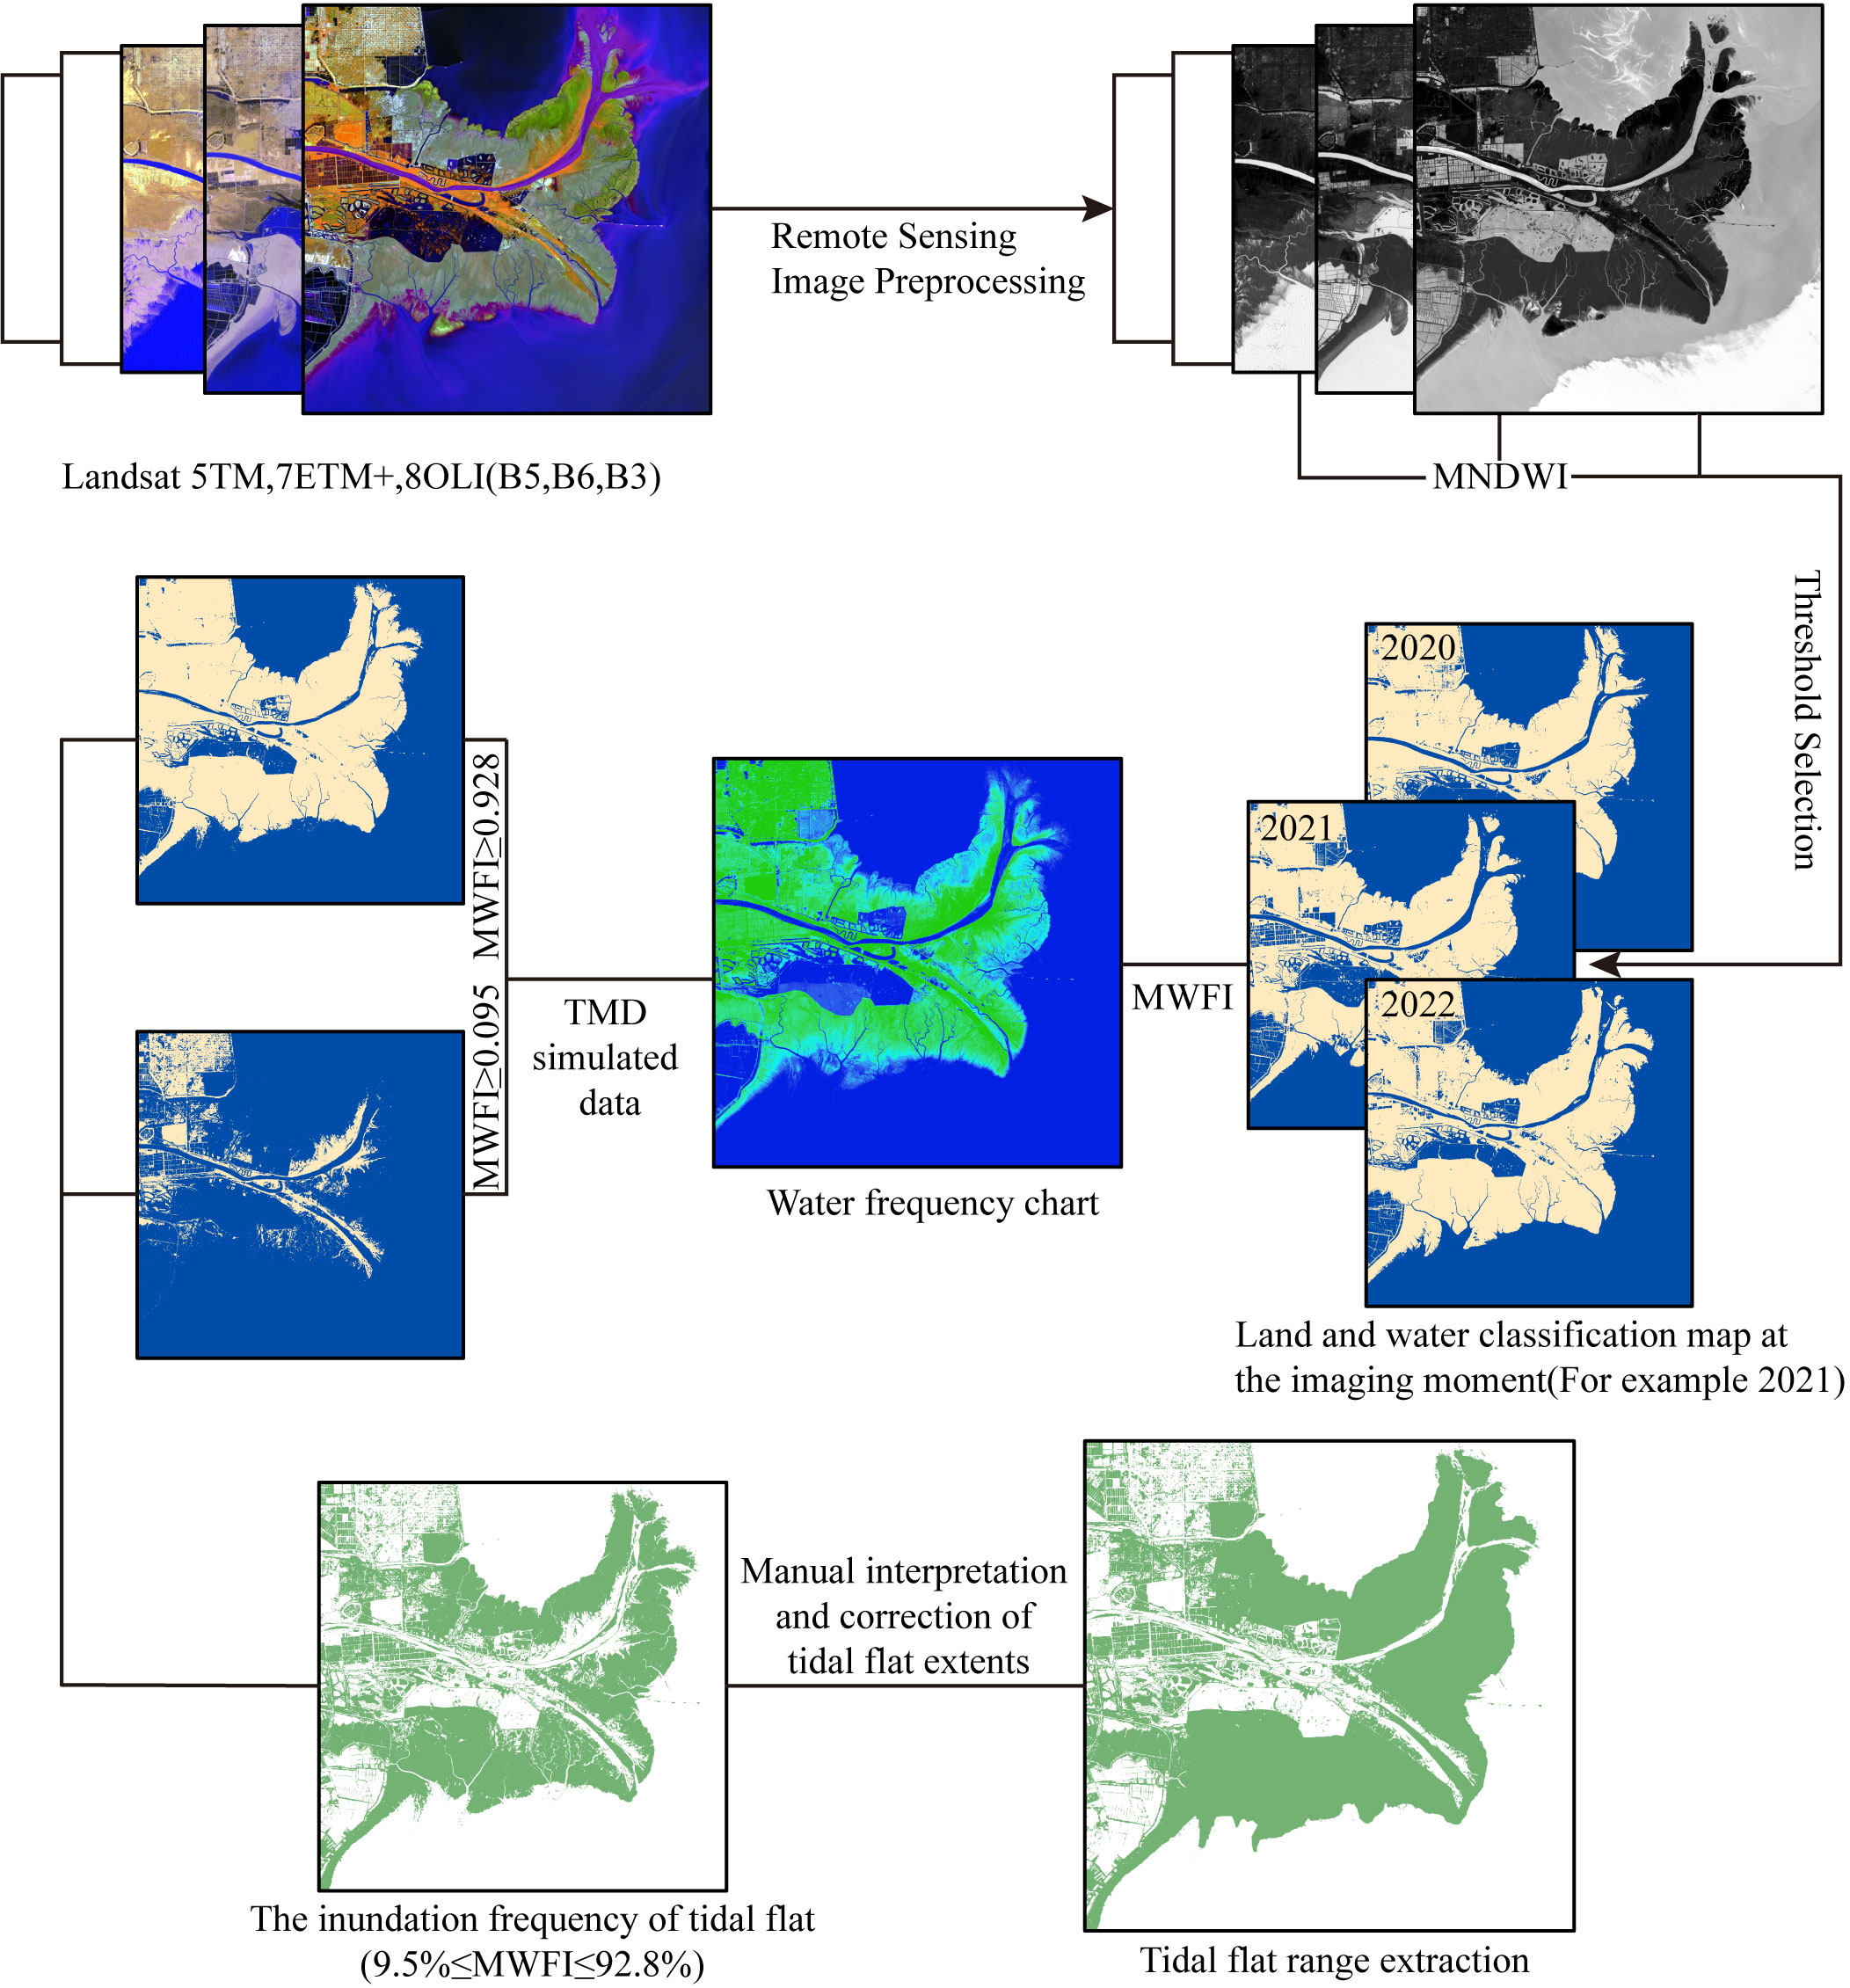
Figure 3 Technical route of the tidal flats extraction method.
First, we pre-processed the collected 262 remote sensing images, including cropping, radiometric calibration, atmospheric correction, and geographic alignment, to make them have high accuracy. Among them, the geographic alignment was based on the remote sensing image on November 12, 2021, and the error was kept within 0.5 image elements after processing.
Subsequently, we used the Modified Normalized Difference Water Index (MNDWI) to classify the water and land for each image. It was chosen for water body extraction because, compared with other water body indices, the MNDWI has better application for the Yellow River Delta region, where the content of suspended sediments is high, to effectively eliminate the images of water bodies from shadows, such as suspended sediments and artificial structures, and has been widely used in previous studies (Cui et al., 2020; Liu et al., 2020; Jia et al., 2021).
Where Green represents the green light band of the remote sensing image and MIR represents the mid-infrared band of the remote sensing image, which is calculated to lie between -1 and 1. Combined with the corresponding remote sensing images (TM and ETM+ images are synthesized as 4, 5, and 3, and OLI images are synthesized as bands 5, 6, and 4) the appropriate thresholds are chosen to classify each image element into land and water bodies.
After MNDWI processing of each remote sensing image, we obtained the histogram of each MNDWI result. Subsequently, combining their corresponding remote sensing images (TM and ETM+ images are synthesized as 4, 5, 3, and OLI images are synthesized as bands 5, 6, 4) to select the appropriate threshold value for the MNDWI results to divide the land and water with the instantaneous water edge line of each image as the boundary, and to classify each image element as land or water body, and to obtain the land and water classification map of each remote sensing image. At this point, all image elements of Landsat satellite images were classified as land or water bodies. Subsequently, we stacked the land-water classification maps for each year and the years before and after it, which were used to calculate the number of pixels classified as land or water body at each location. After that, the probability of each pixel being classified as a water body in that year, i.e., the probability of inundation of each pixel, was calculated based on the Multi-Year Water Frequency Index (MWFI), which was calculated as follows (Almonacid-Caballer et al., 2016; Xu, 2018; Quang et al., 2021):
Where and are the number of pixels in which each pixel was categorized as land or water, respectively, for that year of calculation and the years before and after. The resulting MWFI map lies in the interval 0-1. Such land vs. water maps were used to characterize the annual average coastline positions, which can minimize the impact of short-term coastal changes resulting from sea level variations, the length of wave run-up, sedimentary seasonal changes in the beach profile, and coastal storms.
3.2.2 Extracting tidal flats
After obtaining the MWFI distribution map, i.e., the image element inundation probability map, we need to choose an appropriate threshold to extract the tidal flat extent. Unlike previous authors who usually chose 0.05 and 0.95 as the thresholds for tidal flats range extraction (Zhao et al., 2020; Wang et al., 2023), in this paper, we simulated the tidal level data of the study area from 1995 to 2022 by using the TMD model and used it to calculate the multi-year maximum tidal level, the minimum tidal level, as well as the multi-year high-tide mean high-tide level and the mean low-tide level. Subsequently, they were normalized to obtain the thresholds for the range of tidal flats extraction in different years (Table 1), which were calculated using the following formulas:
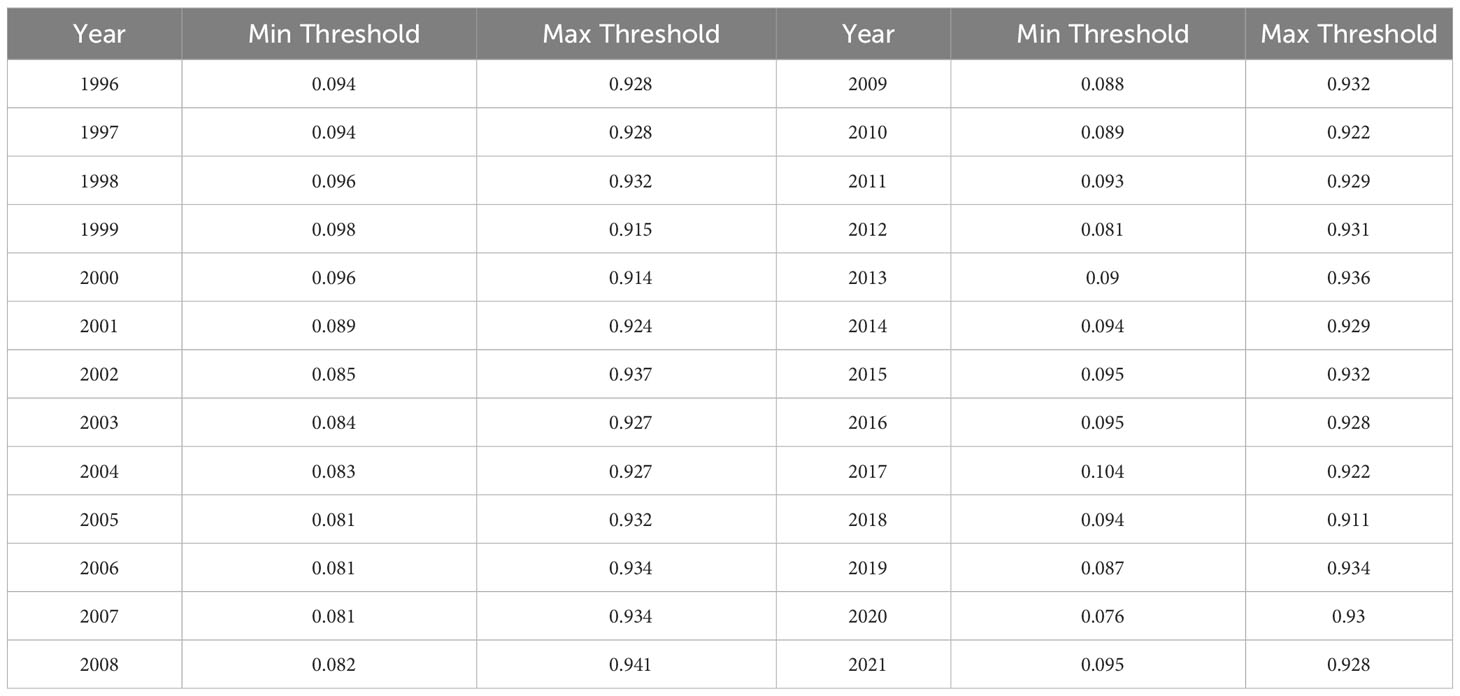
Table 1 The range of thresholds selected for tidal flat extraction in different years.
Where denotes the range of thresholds selected for the tidal flats extraction process, denotes the multi-year high tide mean high tide, denotes the multi-year low tide mean low tide, denotes the multi-year high tide maximum tide, denotes the multi-year high tide minimum tide, and the result of the calculation of also lies in a range between 0-1, which is the range that will be applied to the results of MWFI This result will be applied to the range of MWFI results.
Furthermore, it is important to note that tidal flats also exist between the land boundary of the Yellow River Delta and the artificial shoreline. To account for this, we conducted a correction by interpreting remote sensing images from each period. This correction involved adjusting the land boundary of the tidal flats using the artificial shoreline.
Using the aforementioned approach, we successfully extracted the extent of tidal flats in the Yellow River Qingshuigou sub-delta for each year spanning from 1996 to 2021. To further analyze the spatial and temporal changes, we overlayed the tidal flat extents of adjacent years. Additionally, we conducted a visual interpretation of the changing areas within the tidal flats to examine the direction of these changes. The visual interpretation involved categorizing the areas into land, tidal flats, and water bodies.
3.2.3 Hydraulic numerical simulation
To investigate the changing marine hydrologic conditions in the waters surrounding the Yellow River Qingshuigou sub-delta, we employed the MIKE21FM model developed by DHI. This hydrodynamic model is based on the two-dimensional (2D) shallow-water equations. The model utilizes a triangular mesh that effectively captures the complex land boundaries of the Yellow River delta, making it widely used in hydrodynamic simulations of the region (Zhu et al., 2018; Huang et al., 2022).
The simulation model encompasses the entire Bohai Sea, spanning from 117°33′-122°16′E and 37°5′-40°54′N (Figure 4). A triangular unstructured grid was employed, with mesh refinement applied in the study area. The computational domain of the engineering sea area consisted of 29,053 grid nodes and 56,950 grid cells. The simulation was conducted for the years 1996, 2006, 2021, and 2022.
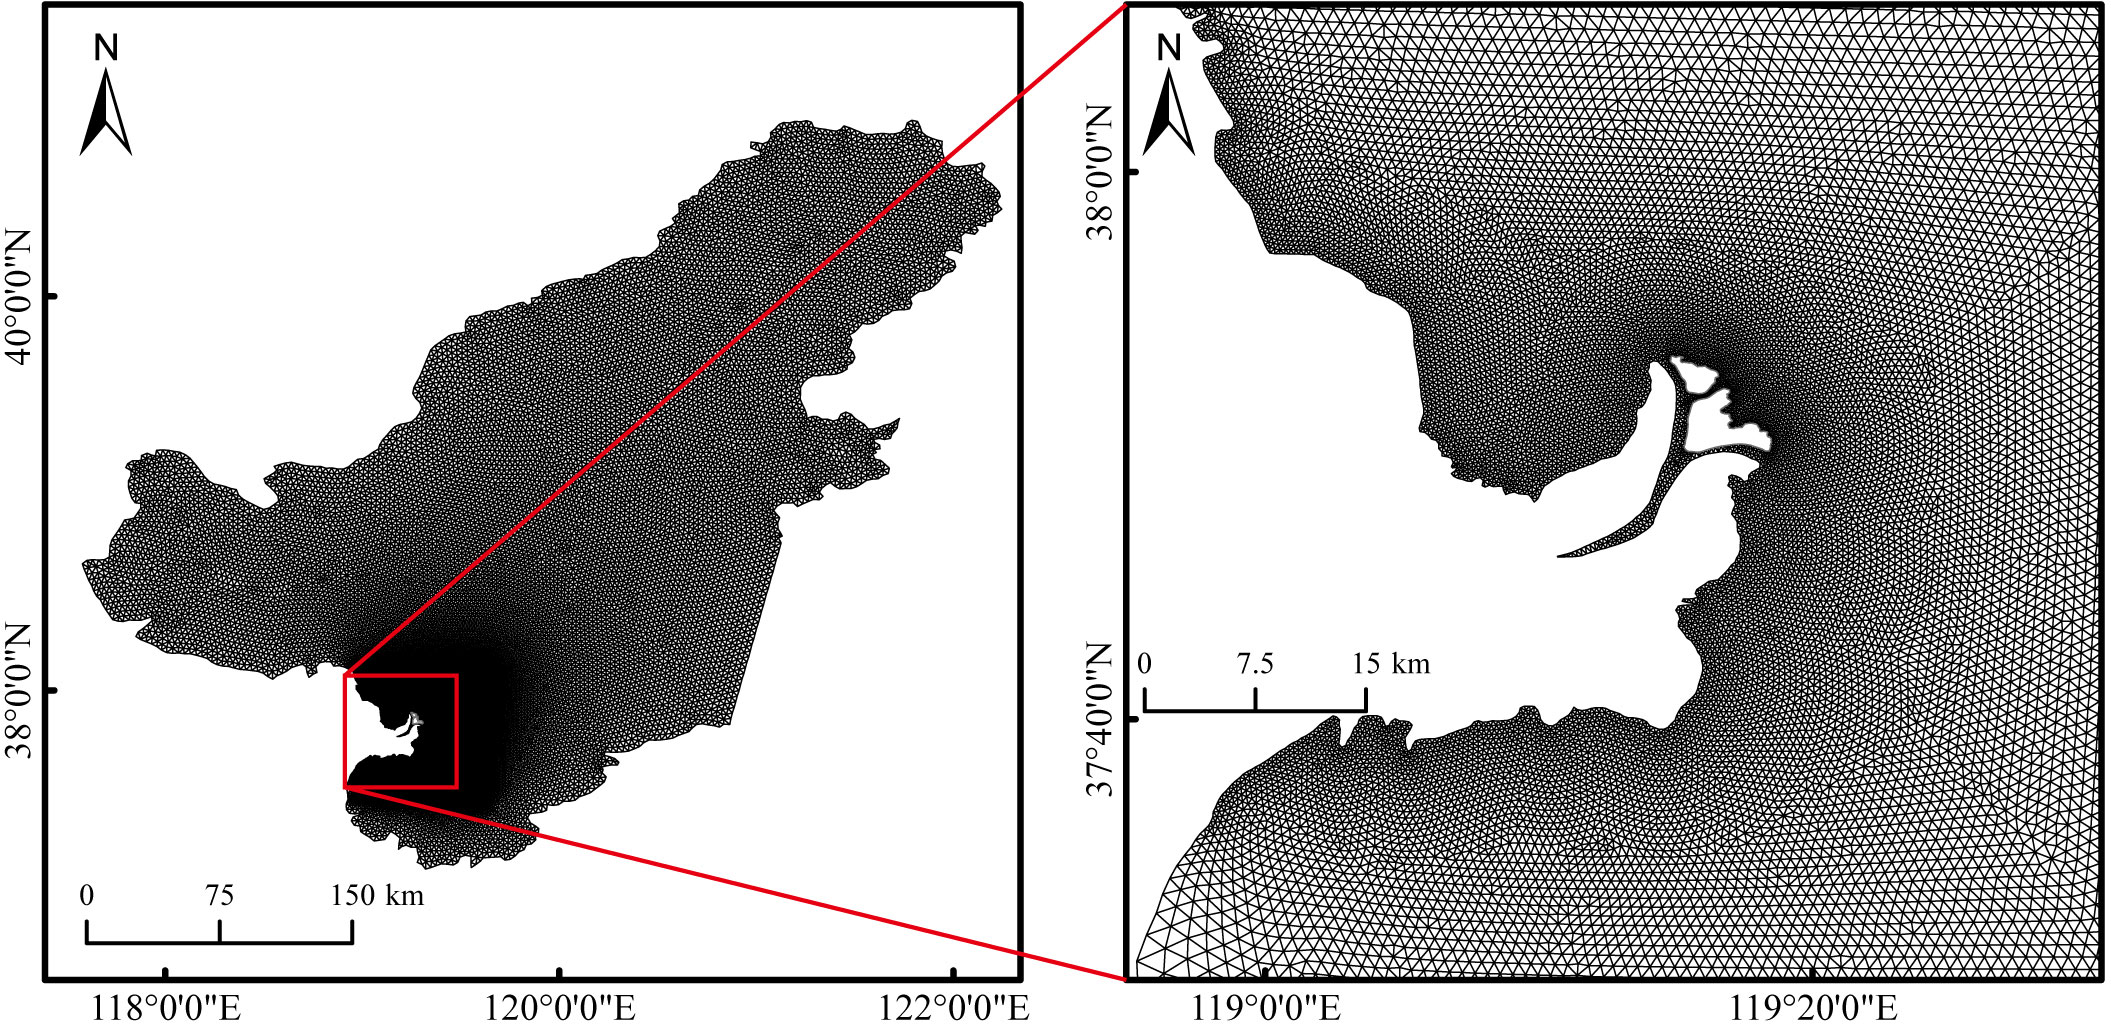
Figure 4 Hydrodynamic modeling computational domain.
Bathymetry data for the Bohai Sea was obtained from the global ETOPO1 bathymetry dataset. For the surrounding waters of the study area, bathymetry data from 1:150000 charts were utilized. However, due to the limited availability of chart data, the 2006 hydrodynamic numerical simulation in this study used bathymetry data from 2005. These bathymetry data were standardized to WGS-84 coordinates after extraction.
In the model boundary conditions, the land and water boundaries are used for the closed boundary and the tidal harmonic constant forecast in MIKE is used for the open boundary. The MIKE model land boundary uses the seaward boundary of the tidal flats of the corresponding year to obtain the flow field in the sea area around the tidal flats of the Yellow River Qingshuigou sub-delta at different times. In the model initial conditions, the density was modeled as positive pressure, the water temperature and salinity fields were taken as constants at 20°C and 32 PSU, respectively. the initial water level and current velocity fields were set to zero, the Manning’s number was set to a constant of 70 (m1/3/s) over the model range, and the Coriolis force was set to vary with latitude.
In order to match the model results with the measured data for validation, the time of model calculation is set from August 25, 2022, to September 24, 2022, and a set of data is output every 1h. The first 16 days are used for the stabilization time of the numerical model, and the later data are output for analysis, calculation, and validation.
After successful model validation, the hydrodynamic models for 1996, 2006, and 2021 were built to analyze the tidal changes in the sea area around the Qingshuigou sub-delta by adjusting the coastal boundaries and water depths in different years while keeping the above parameters constant.
4 Results
4.1 Accuracy evaluation
4.1.1 Tidal flats accuracy verification
Due to the flatness of the tidal flats in the sub-delta of the Yellow River, it is very difficult to obtain the observation data of the tidal flats in the sub-delta of the Yellow River through traditional measurement means, such as GPS-RTK, and obtain the actual measurement data is still a difficulty in the current study. The validation of tidal flat extraction results using high-resolution images such as Google Earth Pro is a common validation method. Zhang et al. (2019) observed tidal flats along the east coast of China, Wang et al. (2020) observed coastal tidal flats along the coast of China, and Wang et al. (2023) observed tidal flats along the Yellow River delta and Laizhou Bay all used this method for validation. Among them, although Wang et al. conducted field surveys when extracting the tidal wetlands in the Yellow River estuary and Laizhou Bay, the survey points likewise did not involve the tidal flats in the Yellow River Qingshuigou sub-delta. Therefore, we also used Google Earth high-resolution remote sensing images to verify the extracted tidal flats results. We used ArcMap10.8 to randomly generate 4000 sample points for our extracted tidal flats layer and loaded them into Google Earth in Keyhole Markup Language (KML) format, and the results showed that the overall extraction accuracy of the tidal flats was 0.84.
4.1.2 Model accuracy verification
To verify the accuracy of the hydrodynamic model, the measured data from three stations in the Bohai Sea area, H1 (118°59.213′E, 37°31.385′N), H2 (118°08.012′E, 37°37.019′N), and H3 (119°04.509′E, 37°24.779′N), are compared with the simulation results from September 11, 2022 at 14:00 to September 12, 2022 at 15:00 (Figure 5), where H1 and H3 are used for the tides. The correlation coefficients(R) and root-mean-square errors(RMSE) were calculated for H1 and H3 for tide level verification, and for H2 and H3 for tidal current velocity and flow direction verification with the following formulas:
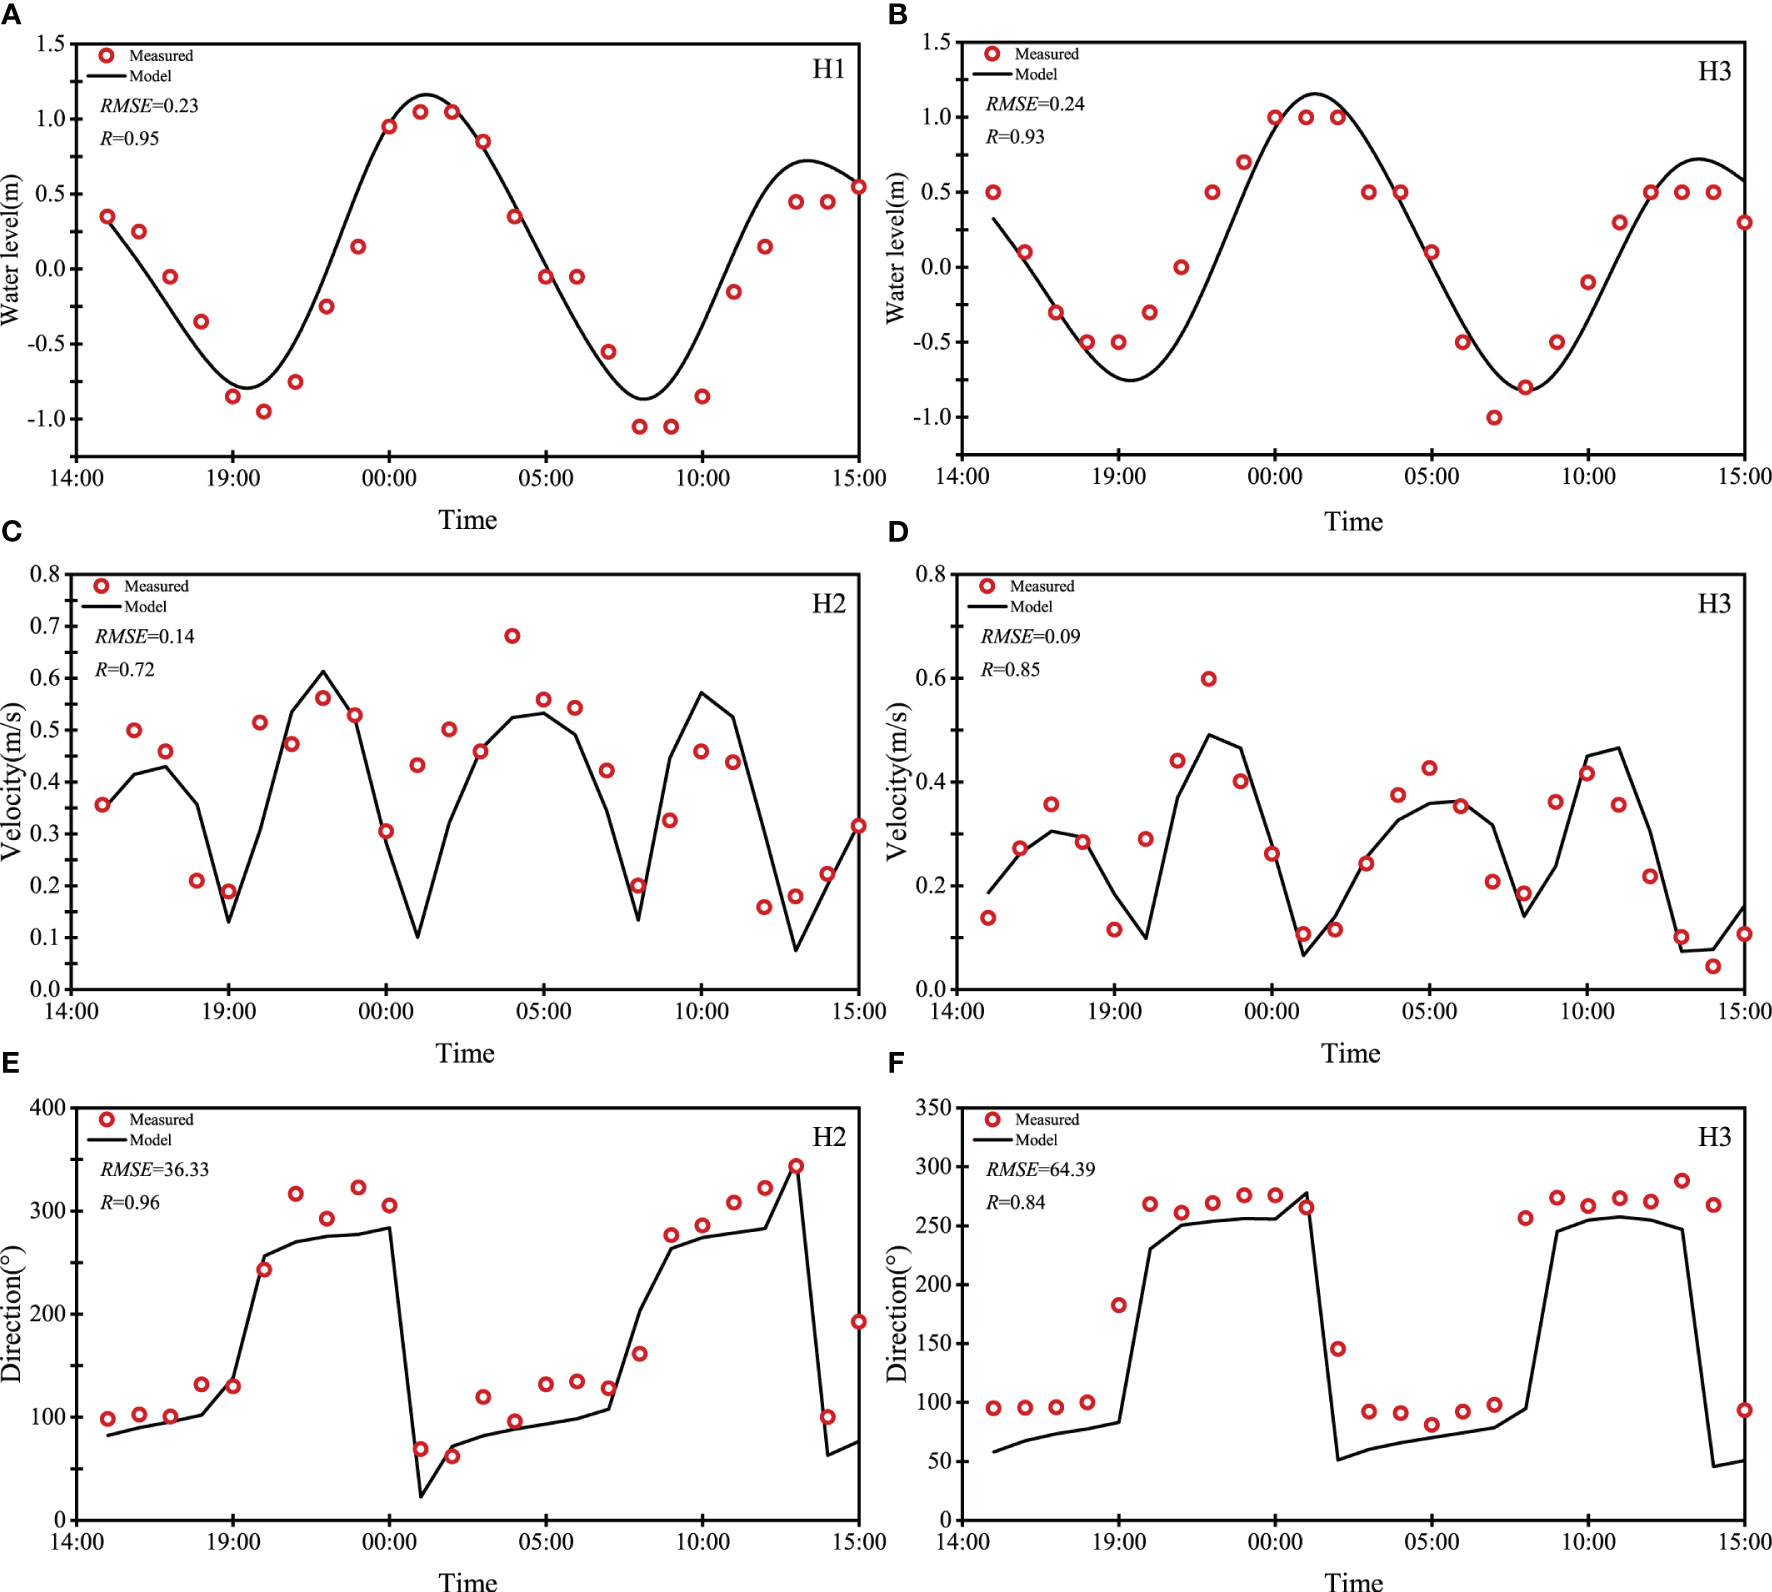
Figure 5 Hydrodynamic model validation [(A, B) are tide level validation for H1 and H3, and (C-F) are tidal current speed and direction validation for H2 and H3].
where and are the model simulated values and field measurements, respectively; and are the arithmetic mean of the modeled and measured values, respectively, and N is the number of statistical variables. It is verified that the average R of the simulated and measured data of tide level is 0.94, and the average RMSE is 0.23 m. The average R of the simulated and measured data of flow velocity is 0.78, and the average RMSE is 0.11 m/s. The average R of the simulated and measured data of flow direction is 0.90, and the average RMSE is 50.36°. The overall trend of the simulated and measured values remained consistent, indicating that the model has high reliability and can better reflect the hydrodynamic conditions in the study area.
4.2 Evolution of tidal flats
Figure 6 illustrates the results of tidal flat extraction for each year. The findings indicate a consistent decline in the tidal flat area of the Yellow River Qingshuigou sub-delta between 1996 and 2021. Specifically, the area decreased from 352.34 km2 in 1999 to 268.79 km2 in 2021, resulting in a total reduction of 83.55 km2. This reduction accounted for 23.71% of the tidal flat area in 1996 (Figure 7A). Additionally, based on the trend of the tidal flats (Figure 7A), we divided the period of 1996-2021 into two stages: a “rapid reduction stage” from 1996 to 2006 and an “overall stabilization stage” from 2006 to 2021. During the “rapid reduction stage,” the tidal flats experienced a decrease of 79.50 km2, which accounted for 95.15% of the total reduction. In contrast, during the “overall stabilization stage,” the tidal flats exhibited a decrease of 4.05 km2, representing only 4.85% of the total reduction.
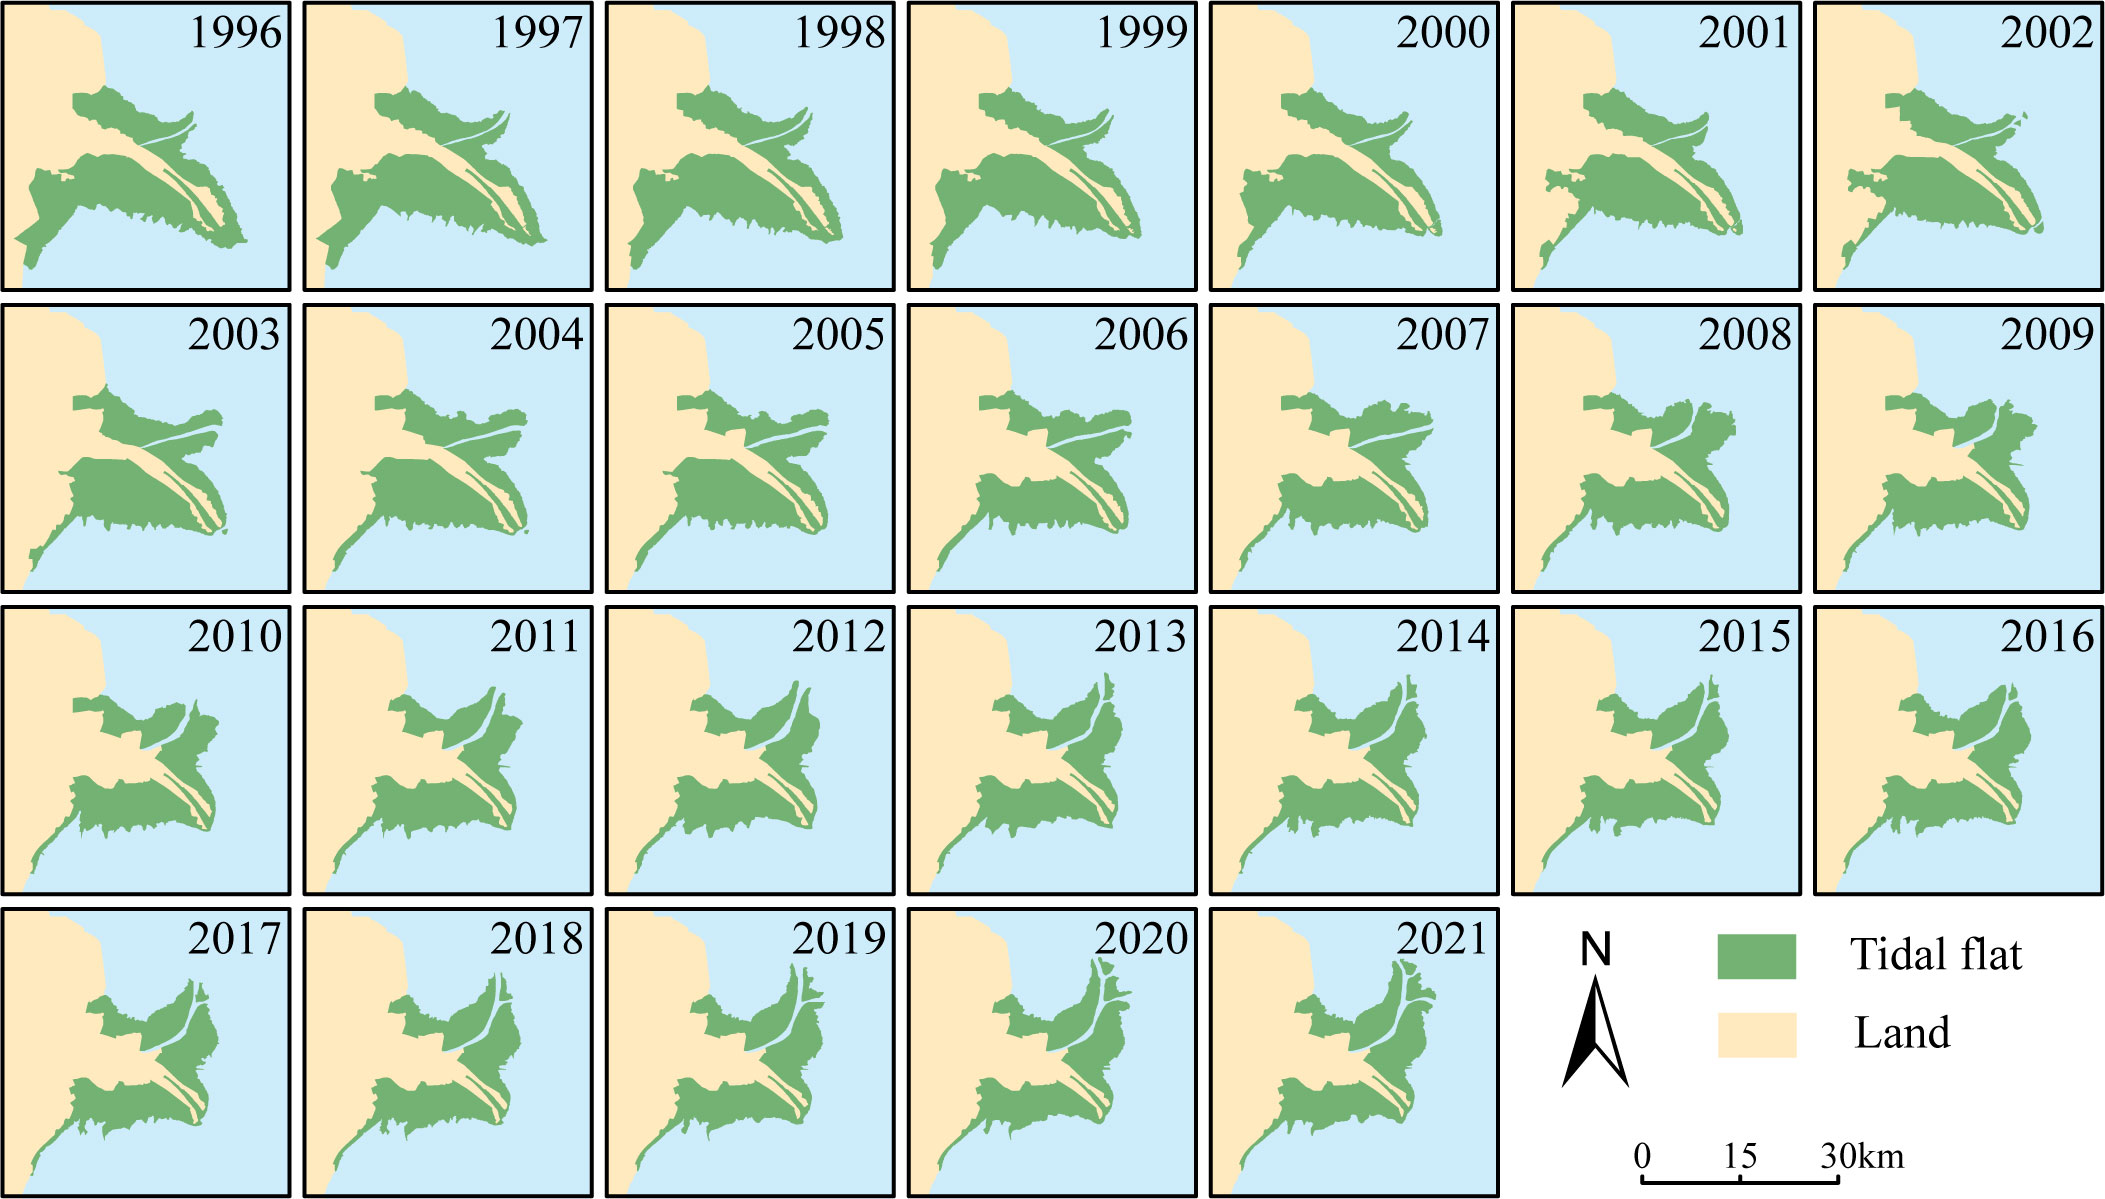
Figure 6 Tidal flats extraction results for 1996-2021.
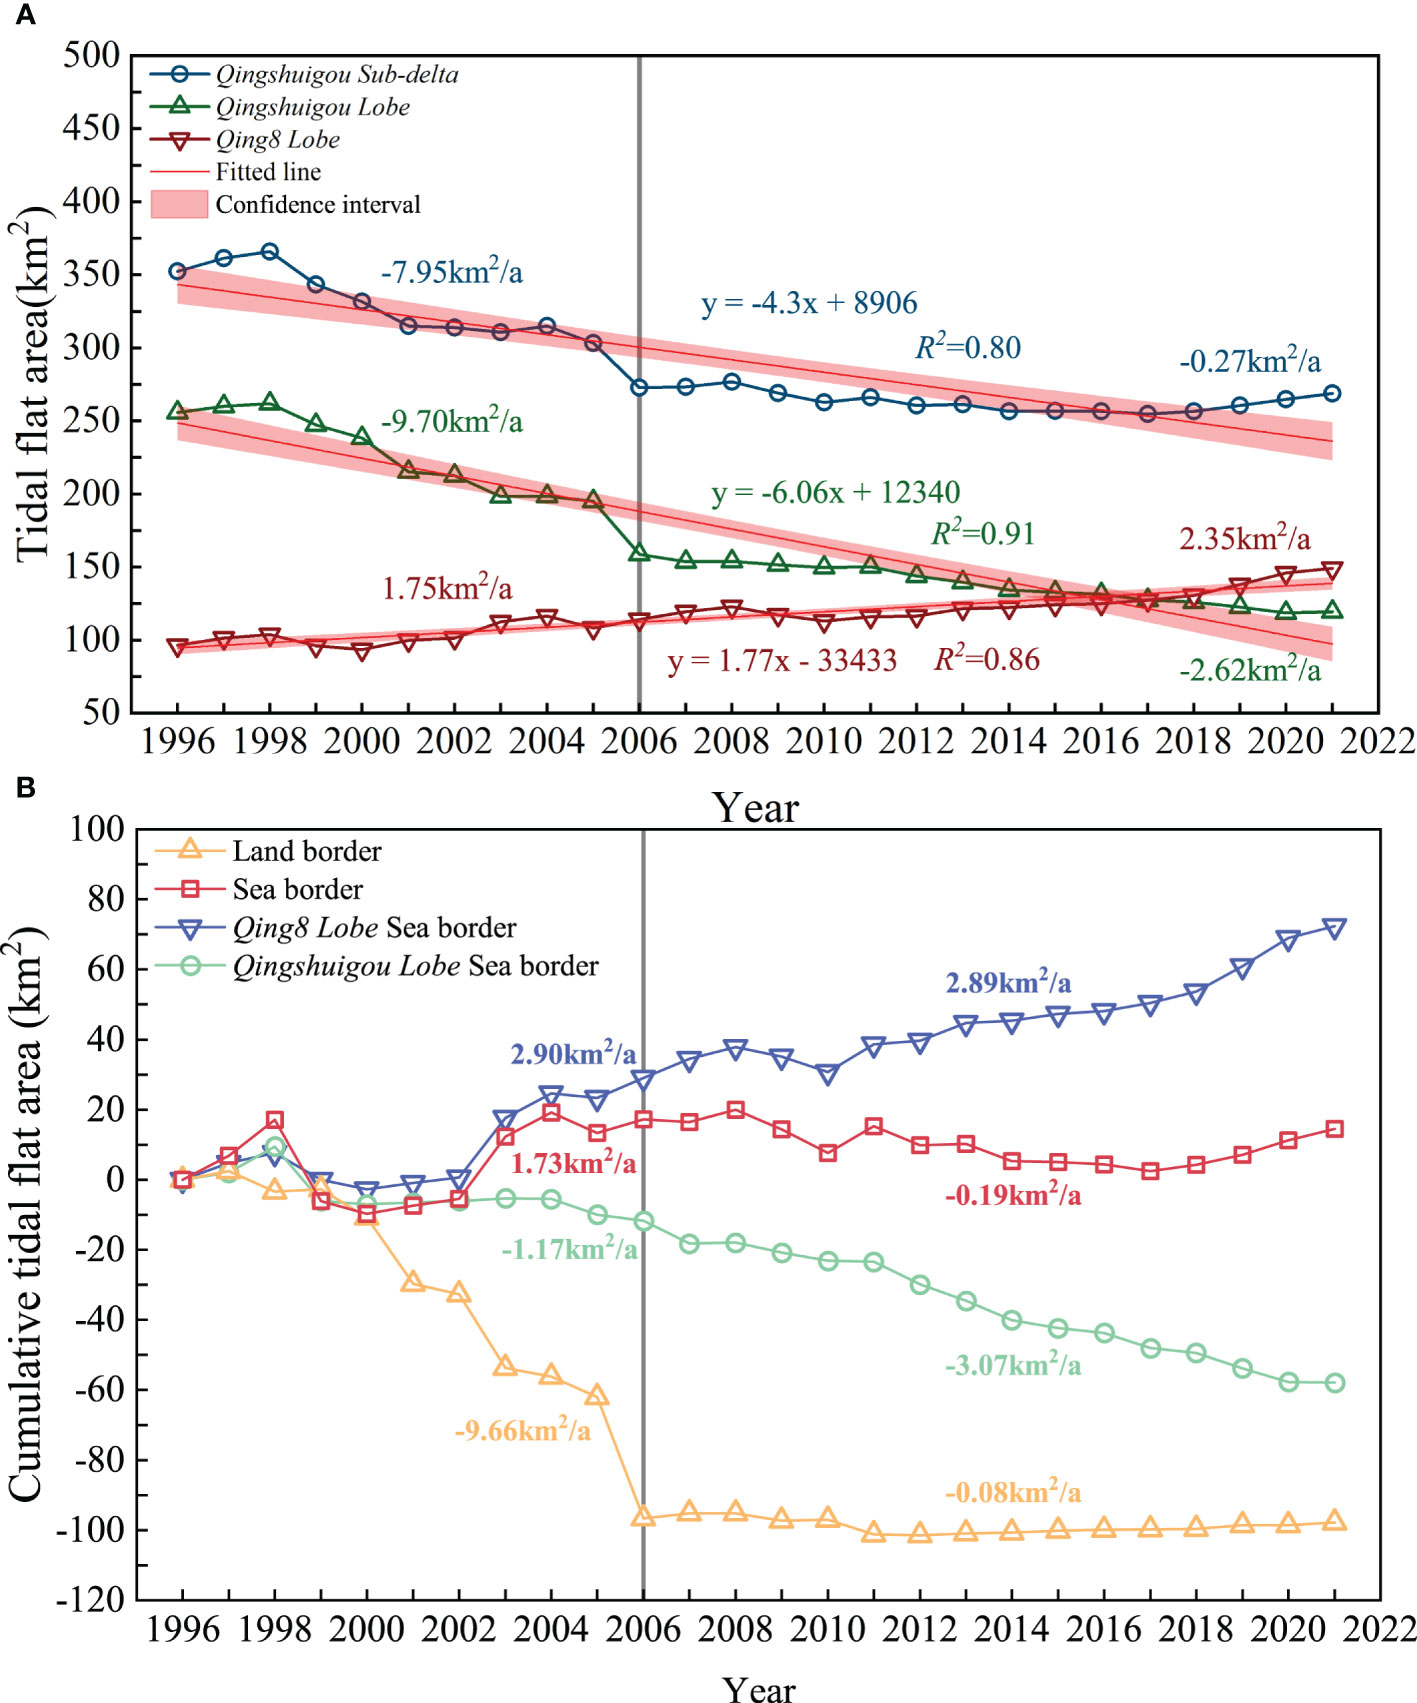
Figure 7 (A) means Changes in the tidal flat area over time for the Qingshuigou sub-delta, Qingshuigou lobe, and Qing8 lobe, (B) means Changes in the tidal flat area over time due to changes in sea-land boundaries.
To investigate the spatial and temporal changes of the tidal flats in the Yellow River in the Qingshuigou sub-delta, we divided the study area into two sections: the “Qingshuigou lobe” and the “Qing8 lobe” based on the convex dyke constructed in 2006 (Figure 1).
The tidal flat area of the Qingshuigou lobe exhibited a continuous decline from 1996 to 2021, with a total reduction of 136.33 km2. This reduction accounted for 53.30% of the original area of the Qingshuigou lobe. Similar to the overall changes in the study area, the tidal flat area in the Qingshuigou lobe experienced two distinct phases: a “rapid decrease” and a “slow decrease,” with the boundary of 2006 serving as the dividing line. The “rapid decrease” phase accounted for 71.18% of the total reduction in area, while the “slow decrease” phase accounted for the remaining 28.82% (Figure 7A).
Conversely, the Qing8 lobe, located at the current Yellow River estuary, has been expanding continuously towards the sea due to the river sediment discharges. Consequently, the tidal flat area in this region has shown consistent growth, increasing from 96.55 km2 in 1996 to 149.33 km2 in 2021.
4.3 Tidal flat boundary changes
The expansion and recession of the sea-land boundary play a crucial role in determining changes in tidal flat area. Hence, we focused our study on analyzing the variations in the sea-land boundary of the tidal flats. Our findings reveal significant spatial and temporal variability in the sea-land boundary changes within the Yellow River Qingshuigou sub-delta. Moreover, it is evident that the factors driving these changes are not uniform throughout the study area.
The study findings demonstrate a distinct stage in the changes observed in the land boundary area of the tidal flats within the Yellow River Qingshuigou sub-delta. This stage division aligns with the stages identified in the overall changes of the tidal flat area in the study area, namely the “rapid decline stage” and the “overall stabilization stage,” with the boundary of 2006 (Figures 7B, 8). From 1996 to 2006, the land boundary area decreased by 96.64 km2 at an average annual rate of change of -9.66 km2/a. The most significant decrease in tidal flat area occurred between 2005 and 2006, with a reduction of 34.57 km2. Subsequently, after 2006, the land boundary remained relatively stable, with an average annual rate of change in the tidal flat area caused by changes in the land boundary of only -0.08 km2/a.
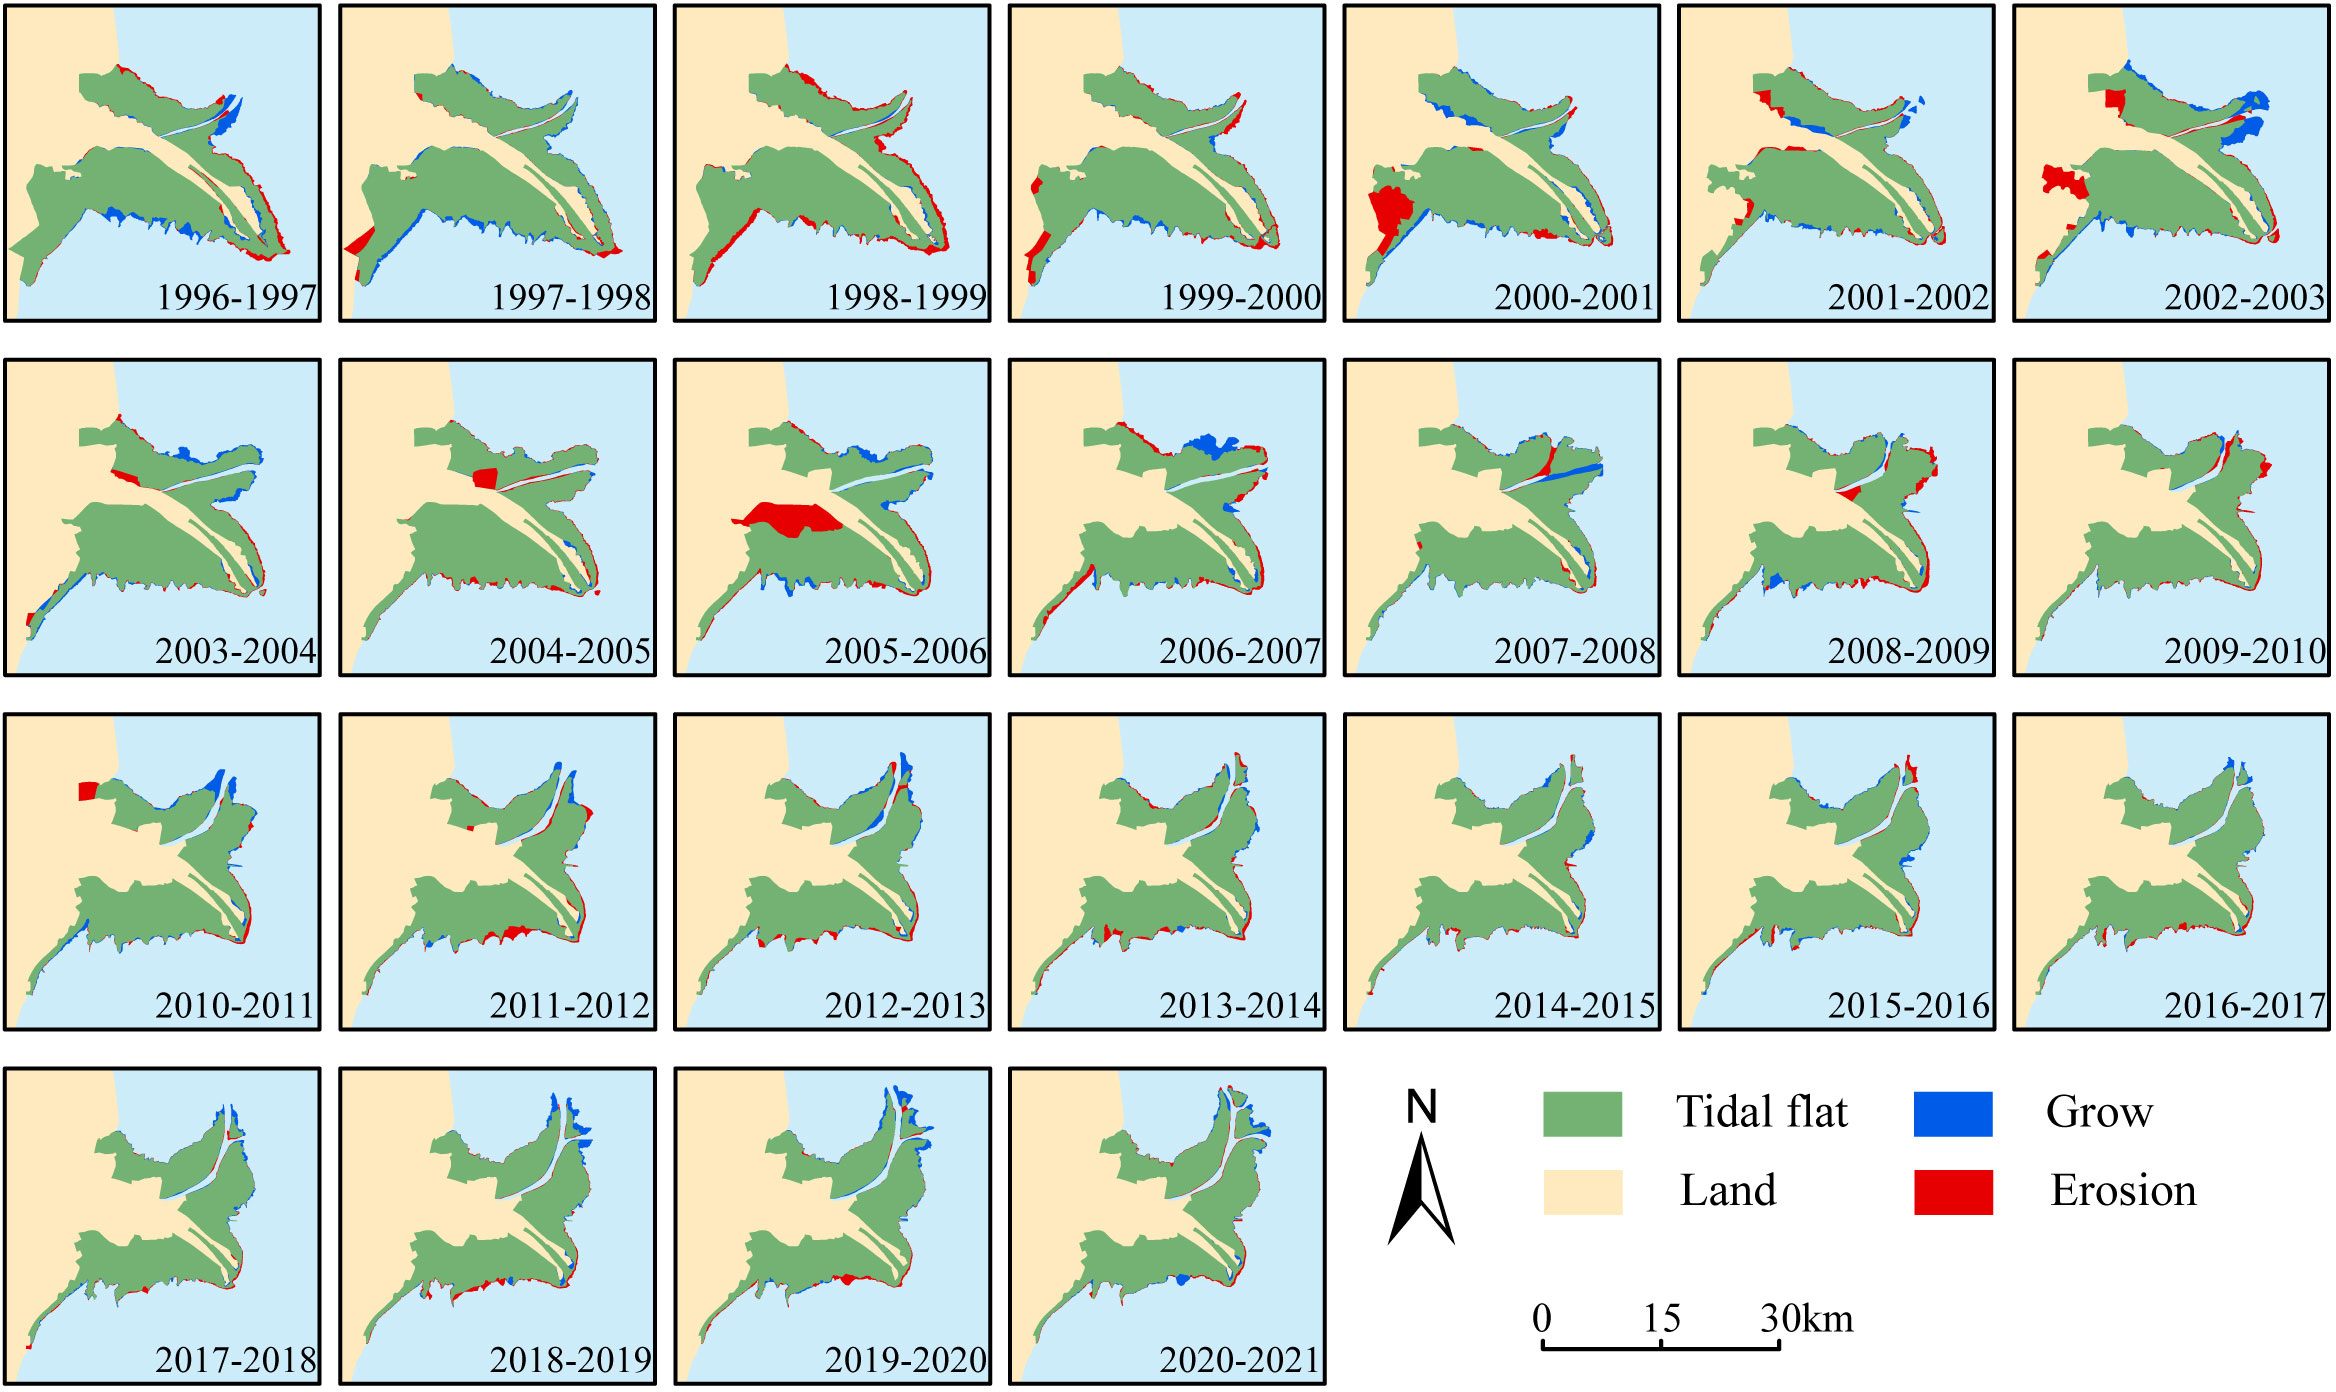
Figure 8 Plot of tidal flats change over time (blue indicates flats growth, red indicates flats erosion).
In contrast to the changes observed in the land boundary, the variations in tidal flat area resulting from changes in the sea boundary are more complex. From 1996 to 2021, the tidal flat area at the sea boundary increased by 14.49 km2, with an average annual rate of change of 0.58 km2/a. The sea boundary of the Qingshuigou lobe primarily experienced erosion, resulting in a decrease of 57.83 km2 during the period, with an average annual rate of change of -2.31 km2/a. Conversely, the sea boundary of the Qing8 lobe demonstrated siltation dominance, with a slightly larger increase in tidal flat area compared to the attenuation caused by changes in the sea boundary of the Qingshuigou lobe. The annual average rate of change for the Qing8 lobe was 2.89 km2/a, and the area increased by 72.31 km2 (Figures 7B, 8).
4.4 Changes in marine hydrodynamic forces
The sea area around the Yellow River Qingshuigou sub-delta is dominated by irregular semidiurnal tides. In the process of high tide, the sea current flows in the clockwise direction, and the flow direction is basically the same as the shoreline direction. Under the complex topographic constraints of the Yellow River estuary, the direction of the flow along the shoreline is more complicated and the size of the flow rate is different. The state of the sea current during low tide is basically opposite to that of high tide, and the sea current flows in a counterclockwise direction. There are high current velocity zones as well as tidal shear fronts between the current estuary and the abandoned estuary (Figure 9).
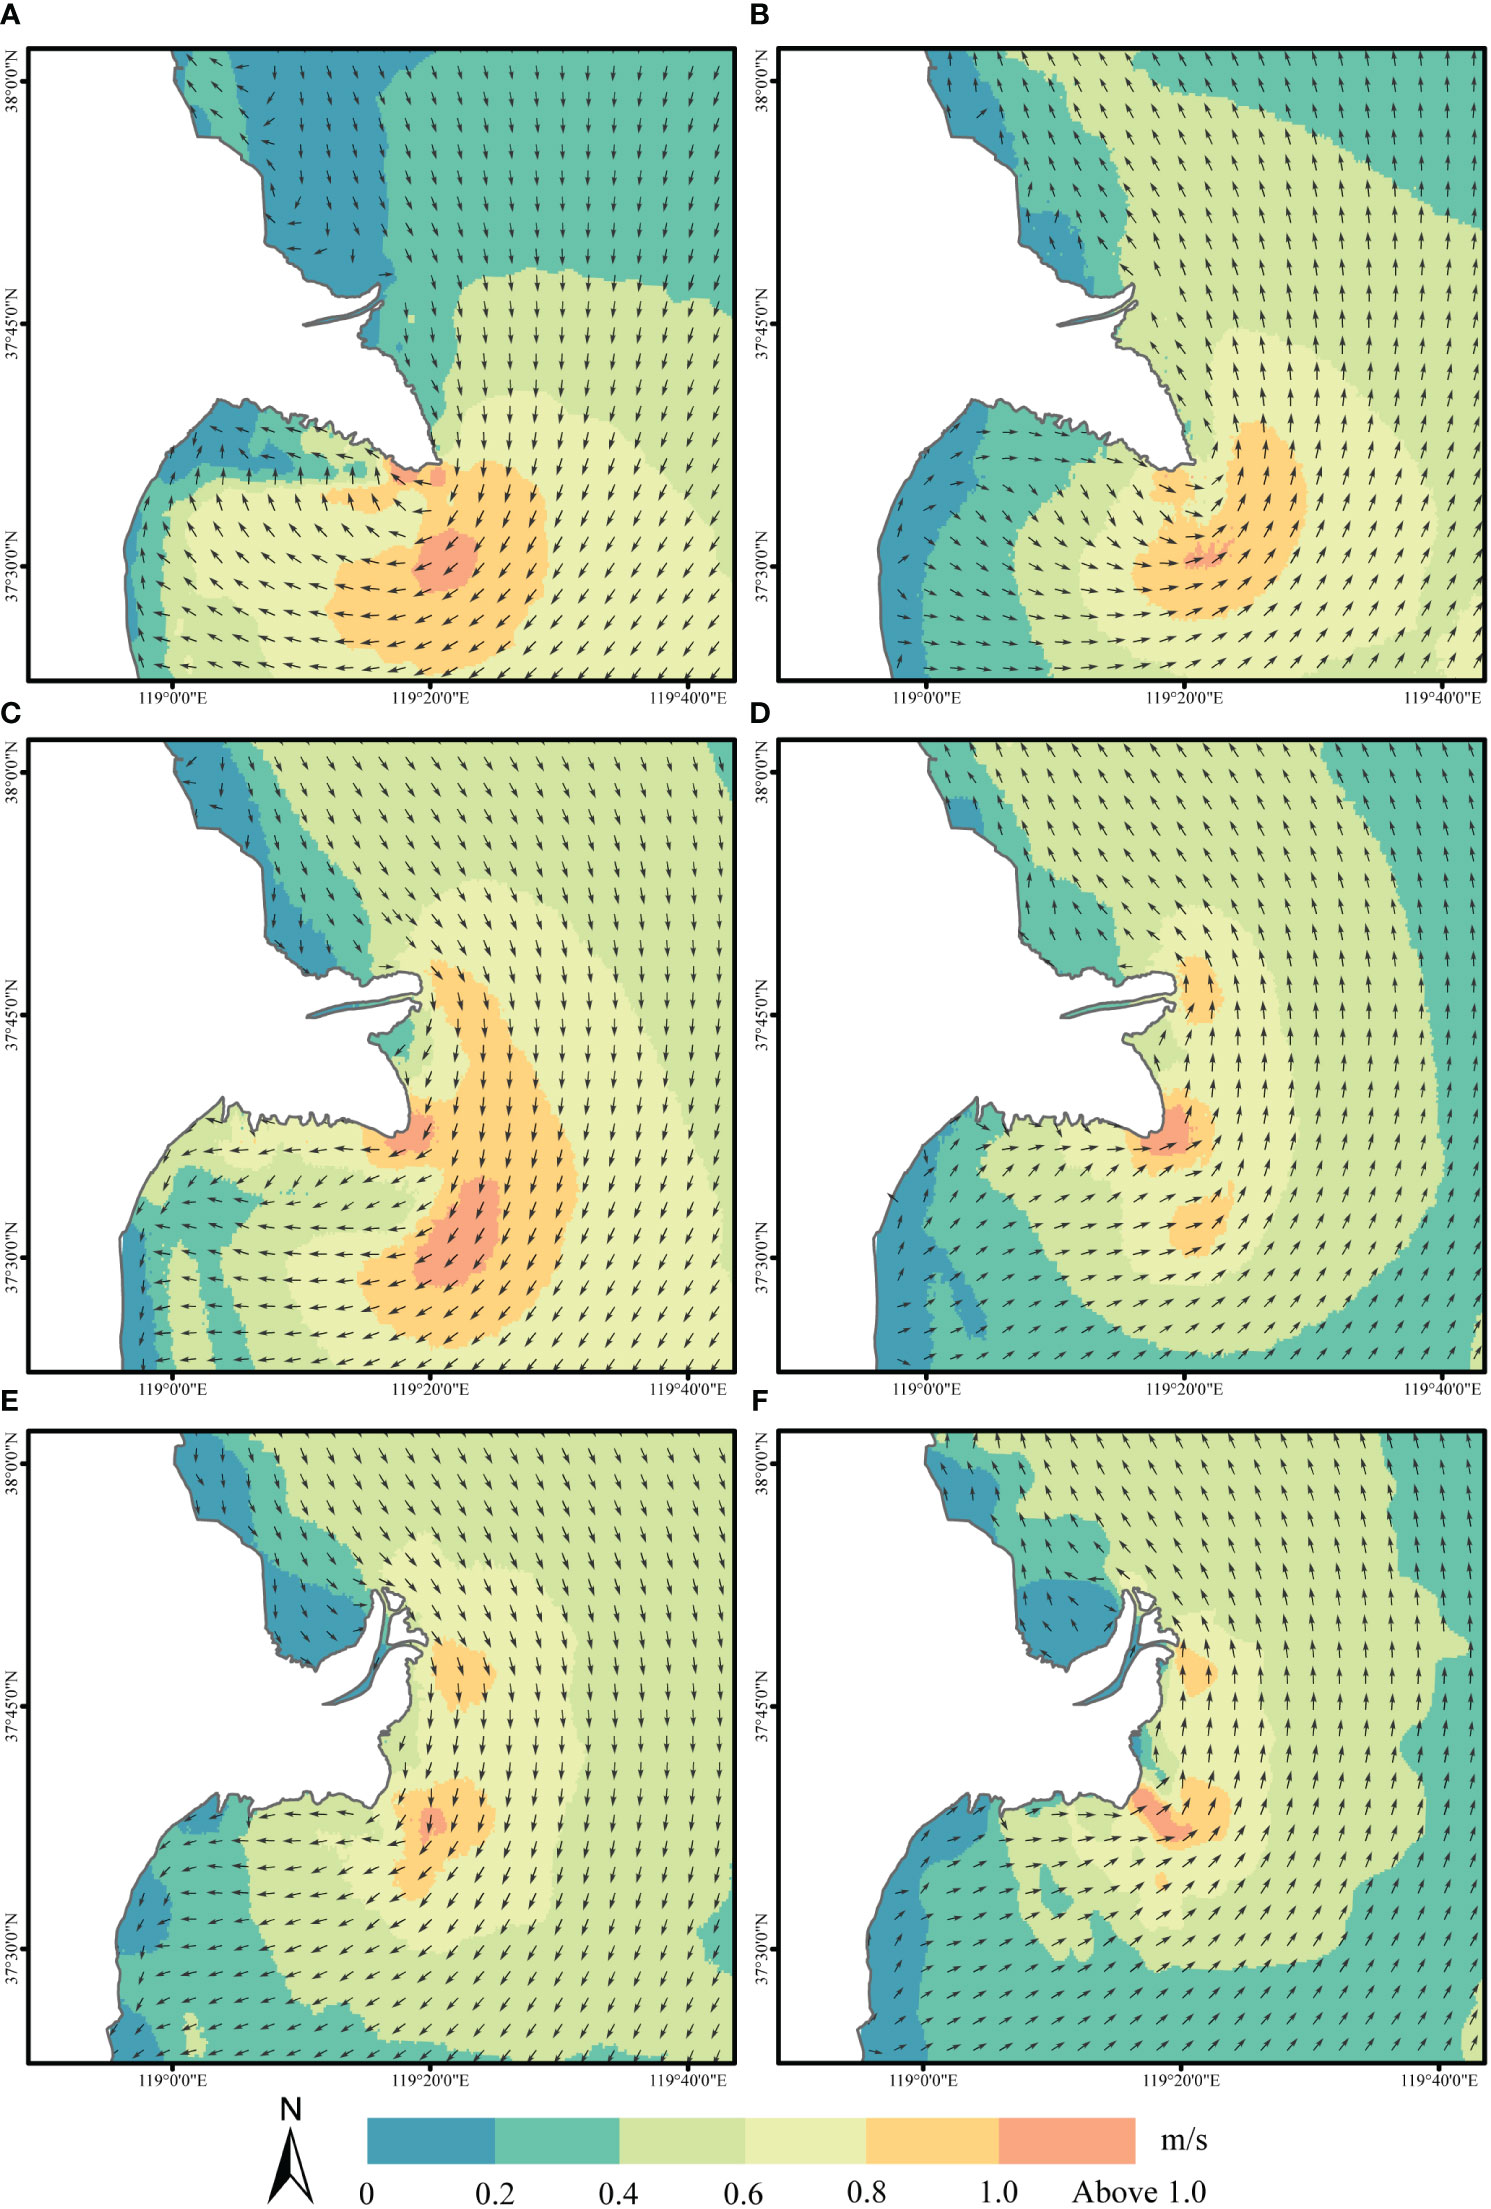
Figure 9 Tidal field simulated by the hydrodynamic model [where (A, C, E) denote tidal conditions at the flood tide surge in 1996, 2006, and 2021, and (B, D, F) denote tidal conditions at the ebb tide surge in 1996, 2006 and 2021].
In this study, we established six representative sections to visualize the marine hydrodynamics represented by tidal currents and their impact on the change of the sea boundary of the tidal flats during different periods (Figure 1). Specifically, we selected flood and ebb tide moments during the high tide period to compare the changes in current velocity across different periods. The results indicate that the average current velocities of the six sections during the flood moments were 0.32 m/s in 1996, 0.47 m/s in 2006, and 0.41 m/s in 2021 (Figures 10L1, L3, L5). Similarly, the average current velocities during the ebb moments followed a similar trend, measuring 0.35 m/s, 0.46 m/s, and 0.38 m/s in the respective years (Figures10L2, L4, L6). These findings suggest that the hydrodynamic conditions in the sea area surrounding the delta’s tidal flats were strongest in 2006, followed by 2021 and 1996, respectively. Consequently, the marine dynamic action between 2006-2021 exerted a greater influence on the delta tidal flats compared to 1996-2006, as supported by the results in Section 5.2.
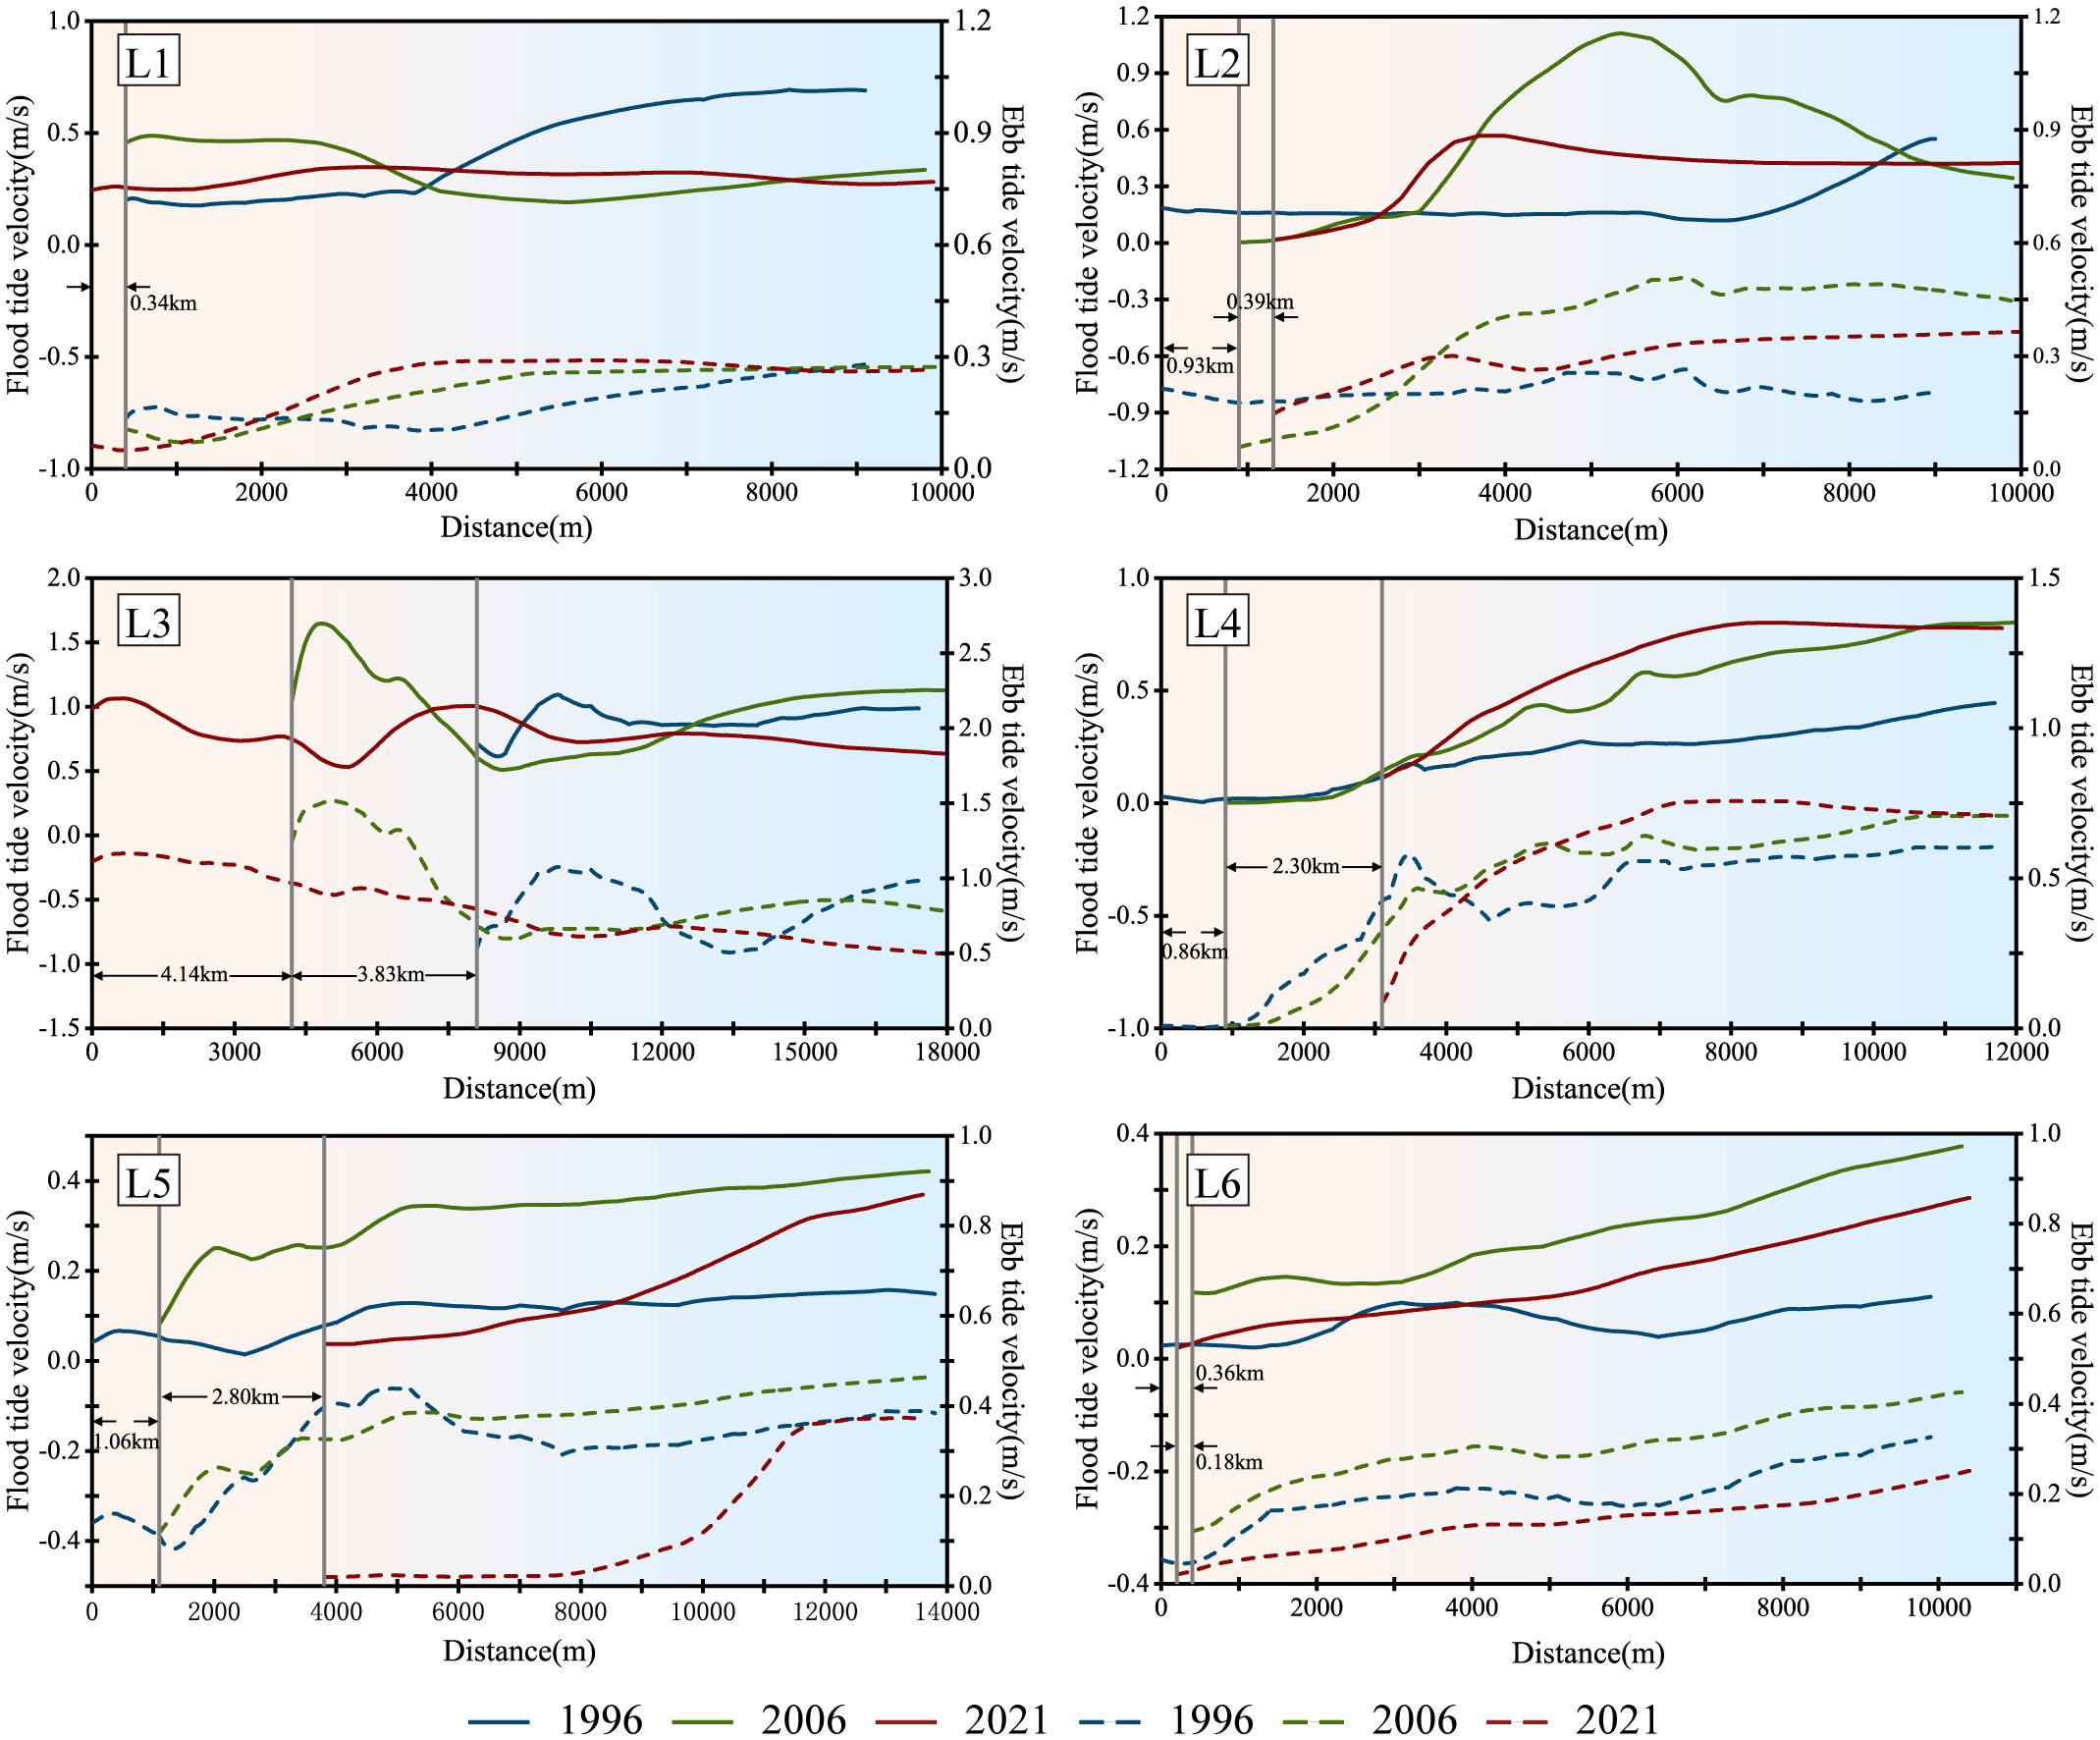
Figure 10 Changes in flow velocity at the L1-L6 section (where the solid line indicates the flow velocity situation at the moment of the flood tide and the dashed line indicates the flow velocity situation at the moment of the ebb tide).
Furthermore, the intensity of tidal currents varies across different regions at the same moment in time. Overall, the sea area around the Qingshuigou lobe represented by profile L1-3 experiences stronger tidal action compared to the sea area around the Qing8 lobe represented by profile L4-6 (Figure 10). This suggests that the marine hydrodynamics represented by tidal action have a stronger influence on the tidal flat evolution in the Qingshuigou lobe region.
Additionally, both L3 and L4 current profiles exhibit an increasing trend as they extend offshore, even indicating a peak in the L3 profile (Figures 10L3, L4). This indicates that the current velocity intensifies near the estuary location due to picking currents, and also suggests the existence of a high-velocity zone between the abandoned estuary and the current estuary.
5 Discussion
5.1 The main factors influencing the progradation of tidal flats
5.1.1 River sediment discharges
The main source of sediment for tidal flats is usually river sediment input. In the case of the Yellow River Delta, sediment transport from the Yellow River and erosion from abandoned deltas (Bi et al., 2014; Bi et al., 2021; Ji et al., 2022) are the main sources of sediment to the tidal flats. The Yellow River Qingshuigou sub-delta exhibits spatial variability caused by the migration of the delta channel. Moreover, temporal variability in the river sediment discharges from the Yellow River into the sea occurs due to anthropogenic activities and the influence of climate change. Historically, the Yellow River channel used to flow through the delta and directly input sediment into the tidal flats. However, human activities, such as the construction of embankments and channelization, have changed the course of the Yellow River, resulting in the isolation of the river channel from the tidal flats in some areas. This has led to a decrease in sediment inflow from the river to the tidal flats at these particular locations. Nevertheless, it is worth noting that relevant studies have shown (Bi et al., 2014; Ji et al., 2020; Wu et al., 2023) that sediments from the Yellow River estuary can still reach and extend to the tidal flats near the estuary. Sediment transport processes, including littoral and tidal currents, can distribute sediments along the shoreline, allowing sediments to accumulate and expand the tidal flat area far from the estuary. This suggests that the spatial extent of tidal flats is not limited to the vicinity of estuaries, but can also extend to adjacent coastal areas. However, there are obvious differences in the magnitude of Yellow River inlet sediments that can be received in different spatial areas, which are mainly deposited near the current estuary, and the amount of sediments that can be received near the abandoned estuary of Qingshuigou and the Gudong Sea is 7% and 3% of the total amount of Yellow River inlet sediments, respectively.
The impact of the river sediment discharges on the boundary of the tidal flats is manifested through sediment accumulation, which drives the expansion of the boundary. In 1996, with the northward migration of the Yellow River delta channel to the Qing8 lobe, the Qingshuigou lobe experienced a lack of sediment supply, resulting in the conversion of its tidal flats to an eroded state.
In contrast to the continuous erosion observed in the tidal flats of the abandoned delta lobe flap due to interrupted sediment supply, the area of the tidal flats in the Qing8 lobe alternated between siltation and erosion in response to changes in sediment input (Figures 7A, 8). The cumulative amount of sediment entering the sea during different stages of the Yellow River is closely associated with the cumulative change in the tidal flats, particularly with the cumulative change in the area of the sea boundary of the tidal flats, indicating that the river sediment discharges plays a dominant role in the expansion process of the sea boundary of the tidal flats (Figure 11). It is worth noting that the correlation between the cumulative amount of sediment entering the sea and the cumulative change in the tidal flats is consistently smaller than the correlation with the cumulative change in the area of the sea boundary of the tidal flats in the Qing8 lobe area, suggesting the presence of other factors influencing the change in the land boundary of the tidal flats.
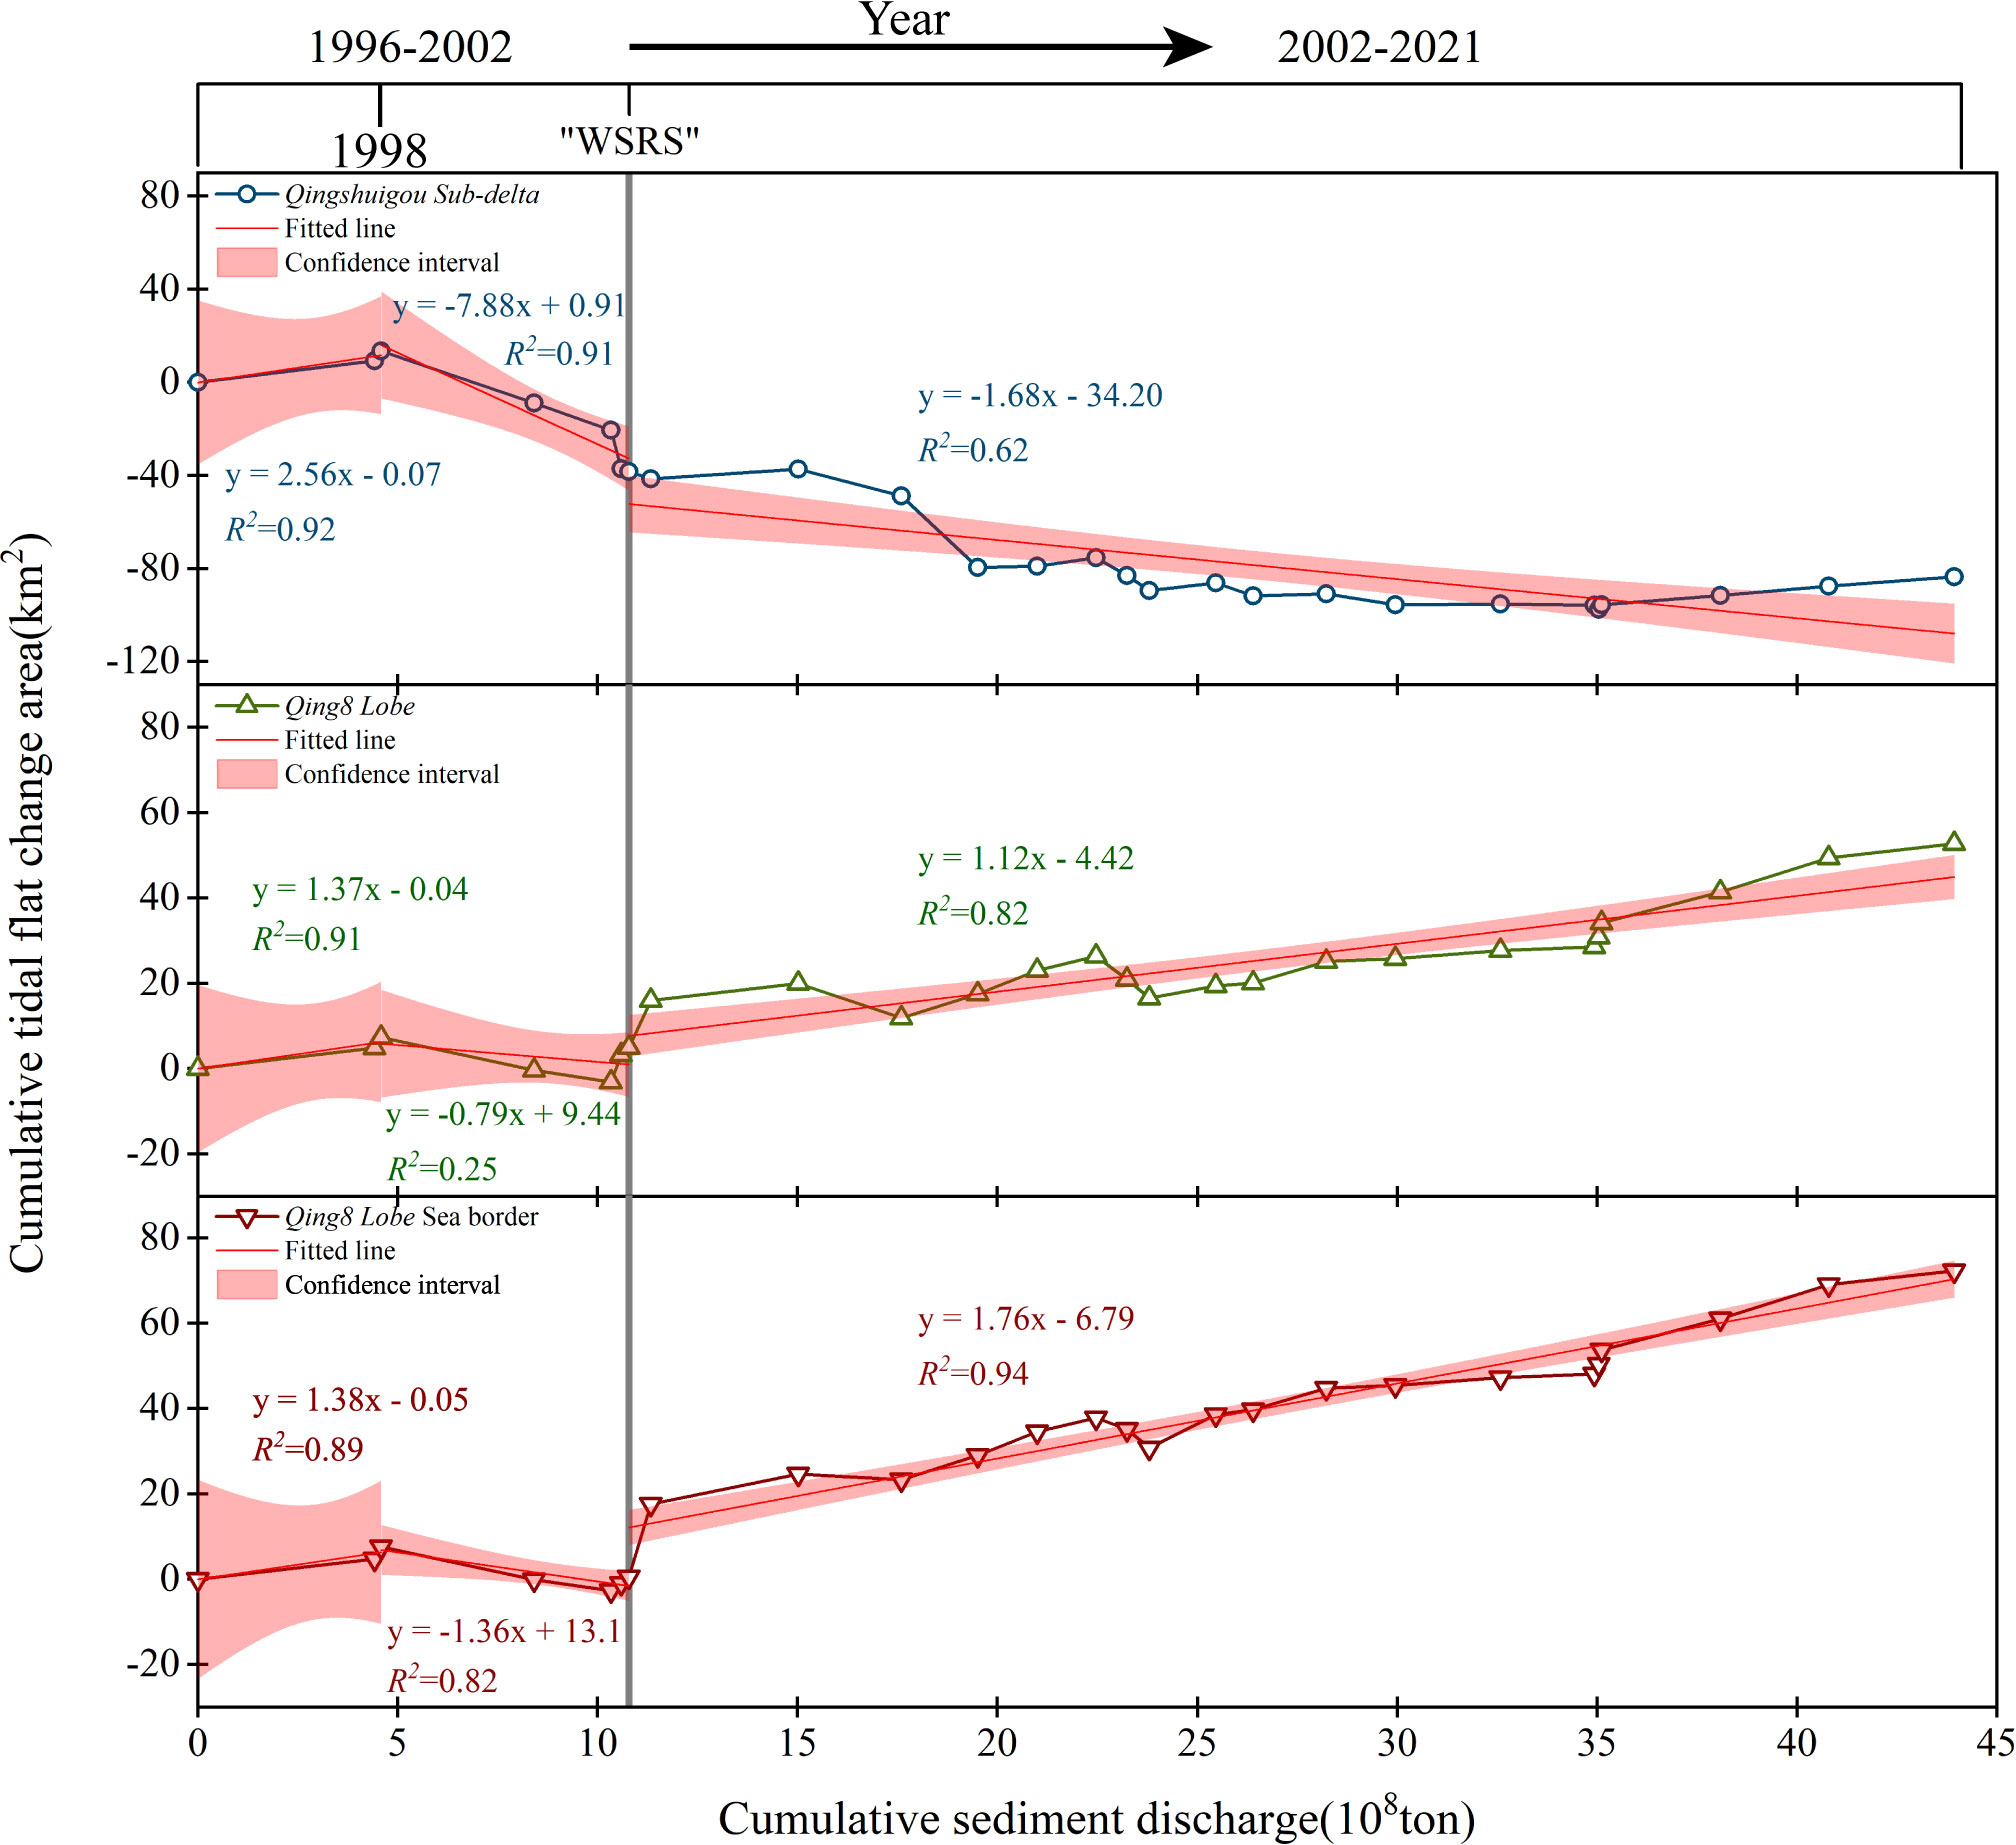
Figure 11 Relationship between the cumulative area of tidal flats change and the cumulative amount of sediment entering the sea (The X-axis also indicates the direction of year change).
The degree of correlation between the amount of the river sediment discharges and the cumulative change in the area of the sea boundary of the tidal flats varied over time (Figure 11). The negative correlation observed in 1998-2002 can be attributed to the fact that the mean annual sand input during this period was significantly lower (0.60×10⁸ t) compared to the average sand input of 2.80 ×10⁸ t and 1.84×10⁸ t in the years 1996-1998 and 2002-2021, respectively. This amount is insufficient to sustain the critical sand transport required for delta development (Cui and Li, 2011; Kong et al., 2015). Consequently, during this period, sea erosion of the marine boundary of the Qing8 lobe tidal flats occurred, leading to a reduction in the area of the tidal flats. In contrast, the average annual sand transport from 1996-1998 and 2002-2021 exceeded the critical sand transport for maintaining delta development (Cui and Li, 2011; Kong et al., 2015), resulting in the seaward expansion of the measured boundary of the Qing8 lobe tidal flats and an increase in the area of the tidal flats.
Furthermore, it was observed that the cumulative annual change in the area of the tidal flats in this region was 3.77 km2/a from 2002 to 2021, which was greater than the 2.53 km2/a observed from 1996 to 1998. This phenomenon may be attributed to the increase in sediment grain size carried by the Yellow River into the sea. Since the implementation of the “Artificial Water and Sediment Regulation Scheme(WSRS)” project in 2002, the sediment size from the Yellow River has increased, leading to accelerated deposition rates and more sediment being deposited in the estuary. Consequently, compared to the period of 1996-1998, the area of the tidal flats in the Qing8 lobe flats from 2002-2021 exhibited a larger expansion despite a lower average annual sand delivery (Ji et al., 2022; Wang et al., 2022).
5.1.2 Marine hydrodynamic forces
Marine dynamics encompass various phenomena, including tides and waves, which play a significant role in shaping the characteristics of tidal flats. During high tide, the intensification of tidal currents leads to sediment transport and siltation. Waves, on the other hand, exert erosive effects on both the land boundary of the tidal flats and the nautical boundary, resulting in changes in their positions. As a result, the influence of marine dynamics on the sea boundary of the tidal flats is realized through the movement of tidal currents and waves, ultimately driving changes in the boundary.
Marine dynamics can likewise have an impact on tidal flats boundary changes. In the current estuary, the turbulent marine dynamics sweep up and transport a substantial amount of fine-grained sediment carried by the Yellow River. This portion of the littoral sediment transport moves seaward under the influence of marine dynamics, whereas another portion moves towards the abandoned estuary due to southward littoral currents. During this process, the sediment is heavily deposited in the depression on the northeast side of the Qingshuigou lobe. This is attributed to the continuous weakening of the hydrodynamic effect and the blockage caused by the tidal shear front and convex dyke (Figures 8, 12) (Li et al., 2021; Ji et al., 2022). In contrast, at the abandoned estuary of Qingshuigou, marine dynamics have a significant impact due to the absence of river sediment discharges. The tidal flats in this abandoned estuary have experienced continuous erosion towards the land since the diversion of the Yellow River in 1996. A substantial amount of sediment has been carried away by wave-induced sand lifting and tidal sediment transport. Additionally, this sediment, apart from being transported to the outer sea, moves southward along the coast due to littoral currents. Shielded by the deltaic continental body, the dynamic action weakens, resulting in sediment deposition on the southwestern side of Qingshuigou (Figures 8, 12). While on the one hand marine dynamics pushes seaward by impeding the sea boundary of the tidal flats, on the other hand, there is a redistribution of the spatial distribution of the tidal flats in the study area. Thus, marine dynamics reshape the tidal flat morphology.
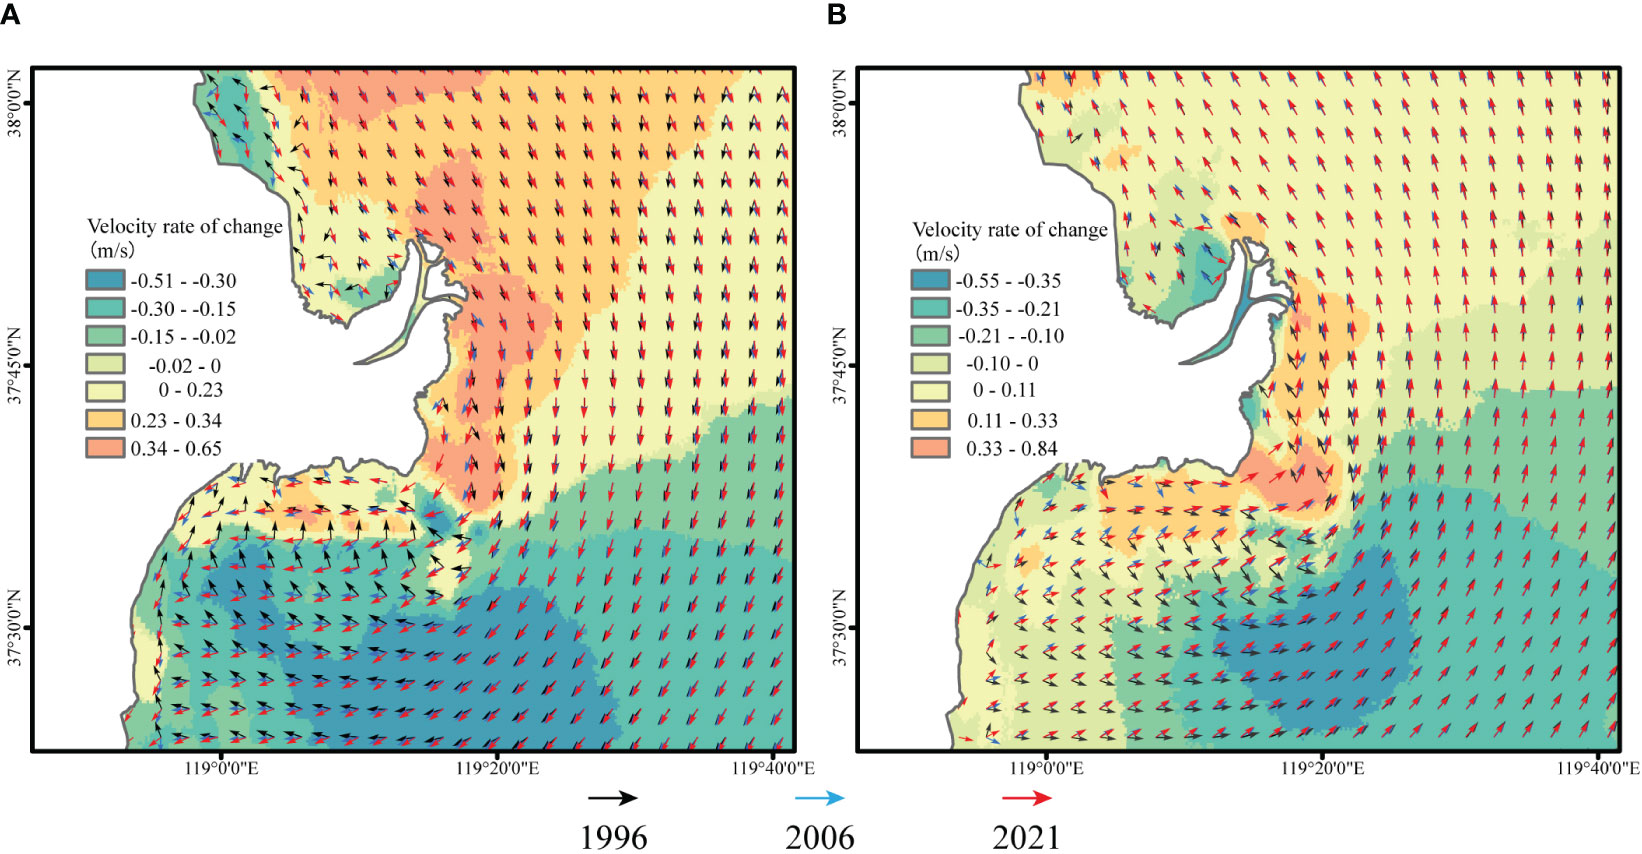
Figure 12 Comparison of tidal fields in 1996, 2006, and 2021 [(A, B) indicate the moments of flood and ebb, respectively, and the background color band shows the tide velocity rate of change from 1996 to 2021].
5.1.3 Reclamation activities
Reclamation activities can directly modify land cover types, leading to rapid and immediate changes in the extent of tidal flats within a short timeframe (Xu et al., 2023). These changes occur through the direct alteration of the land-sea boundary. In the spatial and temporal evolution of tidal flats in the Yellow River Qingshuigou sub-delta, reclamation activities emerge as the primary factors influencing the change in their land boundaries.
The analysis of the extent of tidal flats change impacted by reclamation activities from 1996 to 2006 and 2006 to 2021 demonstrates that these activities predominantly occurred at the land boundaries of the tidal flats. Throughout 1996 to 2021, the reclamation of 175.20 km2 resulted in a reduction in the tidal flats area by the same amount, accounting for 94.66% of the total decrease (Figure 13).
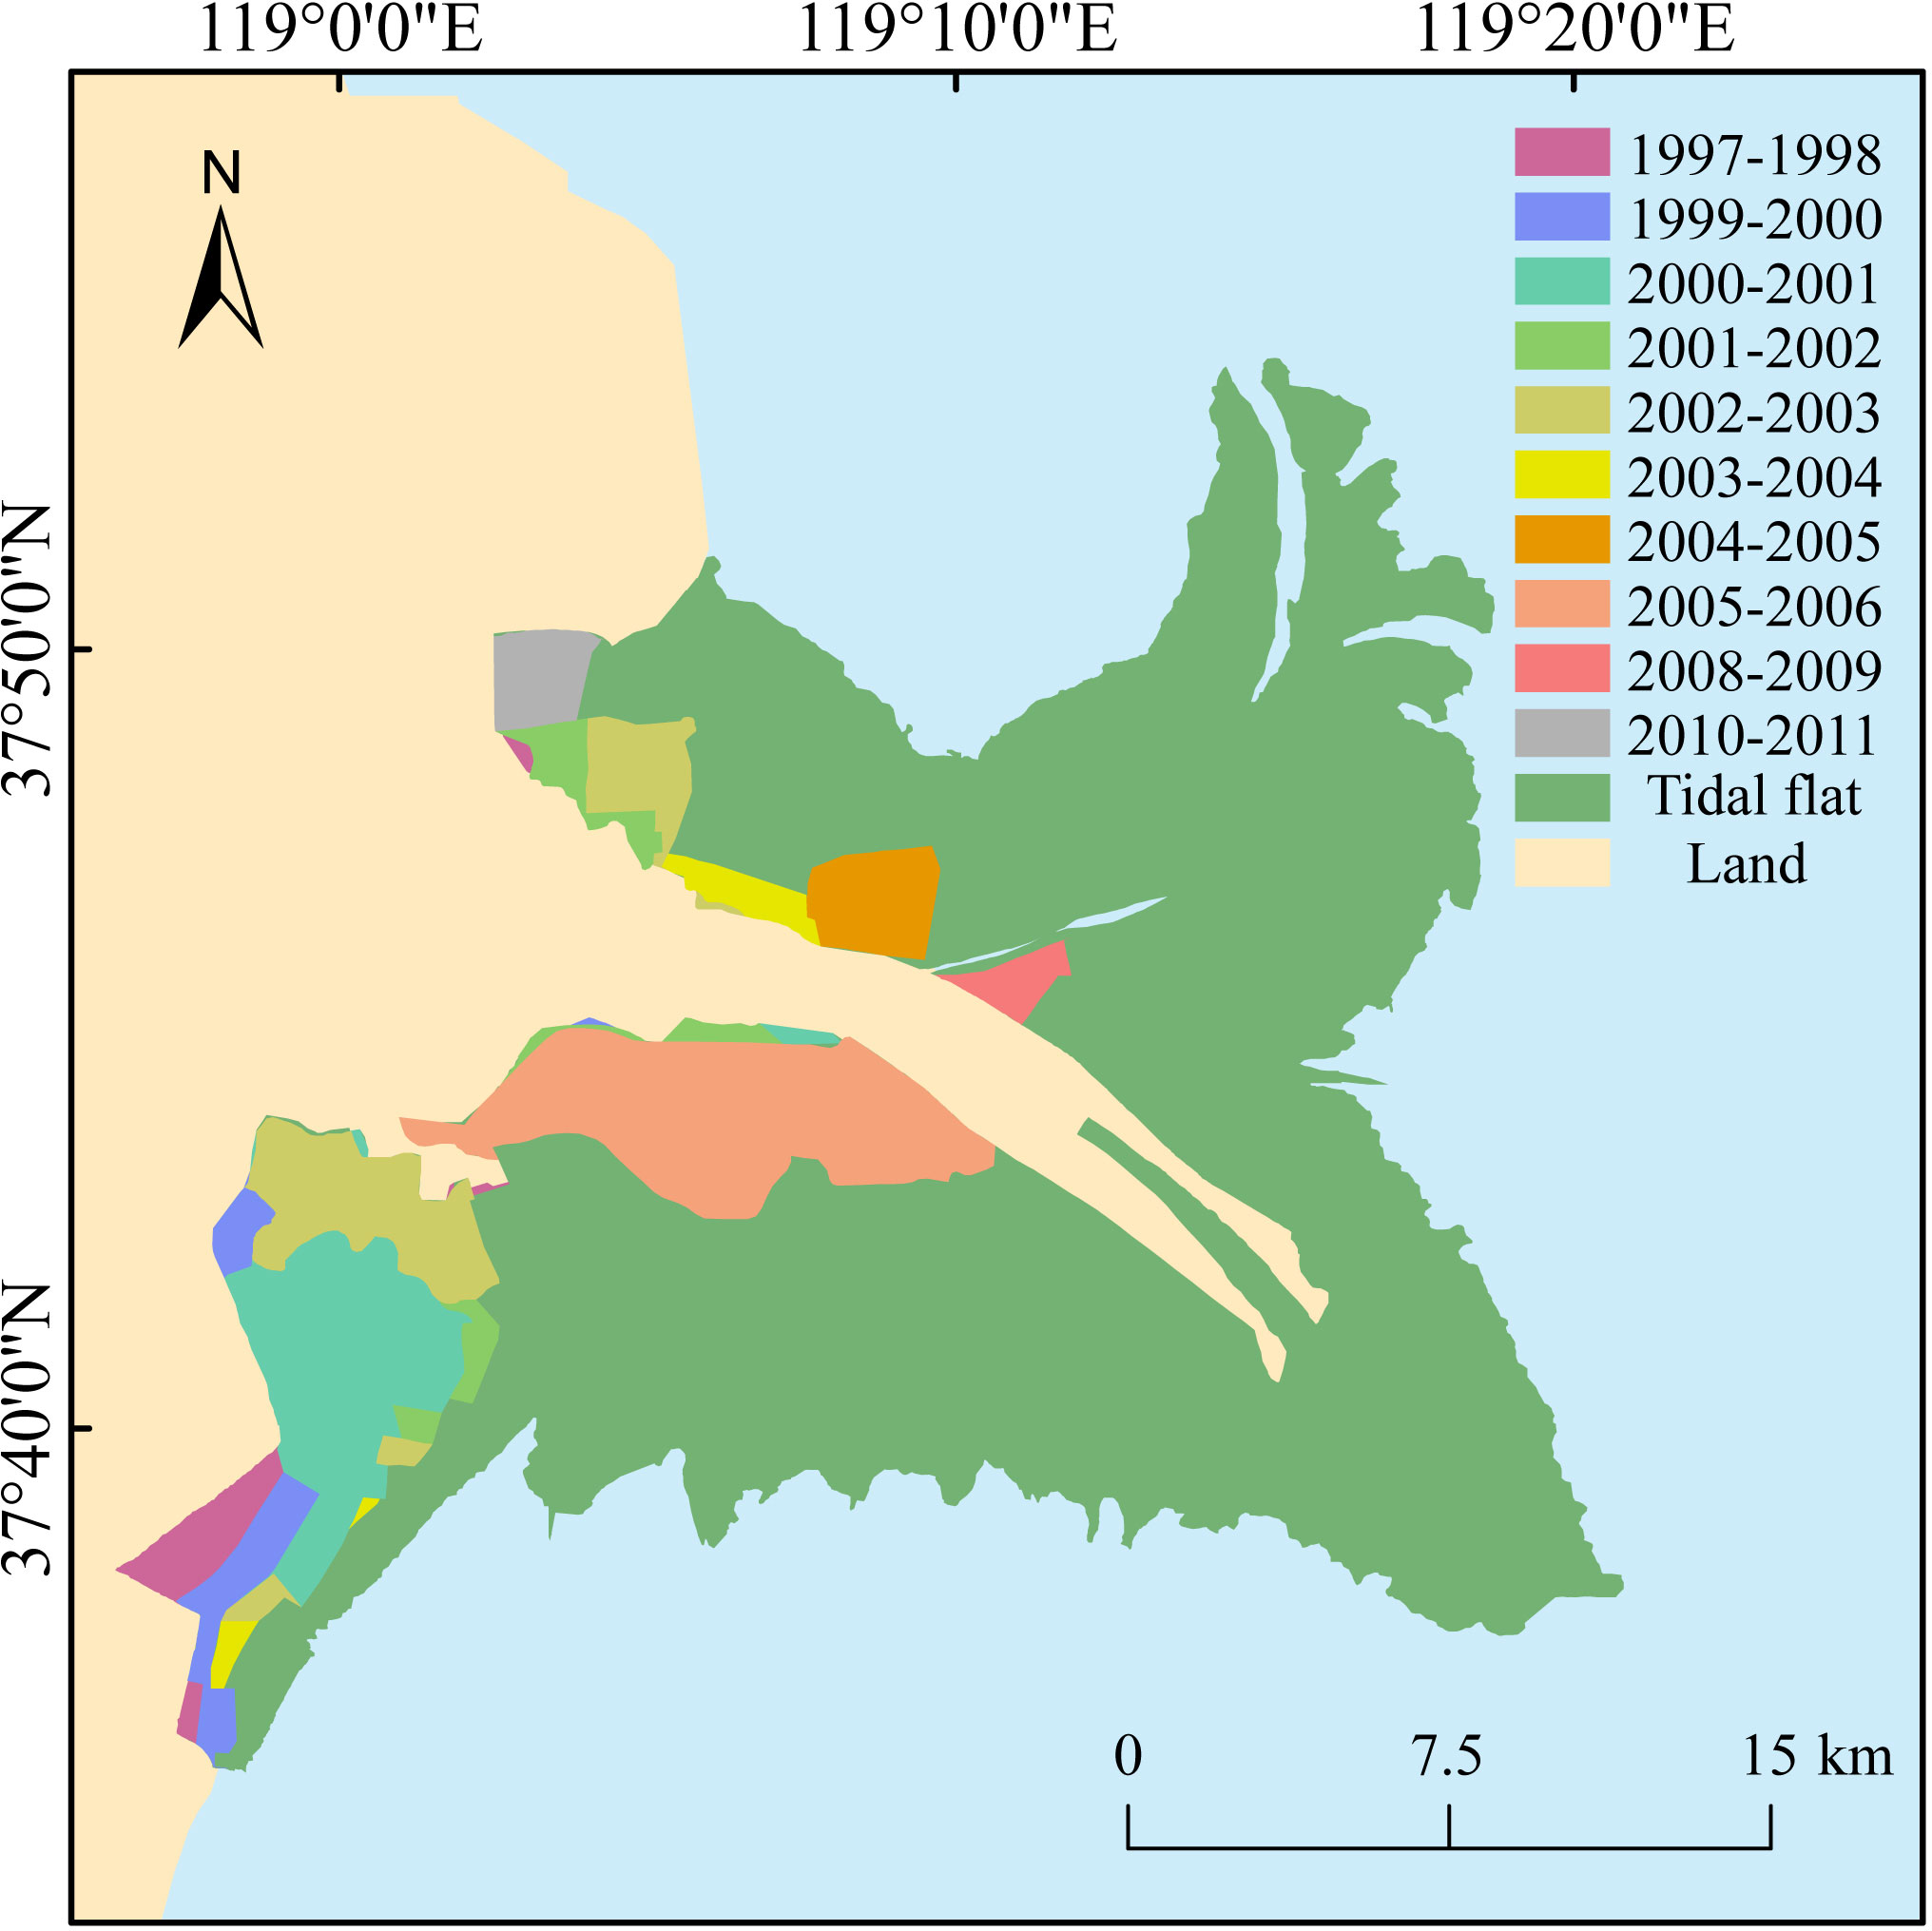
Figure 13 Spatial and temporal distribution of reclamation activities.
While reclamation activities have a direct influence on the evolution of the land boundary of tidal flats, the intensity of this effect varies across different periods. Notably, the land boundary experienced significant changes during the period from 1996 to 2006. In this period, a total of 101.45 km2 of tidal flats were converted to land, with 105.77 km2 reclaimed through anthropogenic activities, accounting for 71.19% of the overall reduction (Figure 13). Reclamation activities continue to exert control over the evolution of the land boundary. In the subsequent period from 2006 to 2021, compared to the previous period, the influence of reclamation activities on the land boundary of the Yellow River Qingshuigou sub-delta further intensified. During this period, the land boundary remained relatively stable, with only 8.64 km2 of tidal flats converted to land. However, the area reclaimed through anthropogenic activities reached 8.56 km2, accounting for 99.08% of the land change area. It is important to note that the total decrease in tidal flats from 2006 to 2021 amounted to 61.20 km2. Hence, while reclamation activities continue to impact the spatial and temporal evolution of the land boundary of tidal flats during this period, their overall influence on the entire tidal flats system is somewhat diminished.
Regarding specific types of man-made reclamation, apart from the year 2005-2006 when the construction of the “100,000 Mu Ecological Restoration Project” resulted in a reduction of 35.08 km2 in tidal flat area, the remaining years’ reclamation activities were primarily driven by socio-economic projects such as salt flats, aquaculture ponds, and oil fields. Consequently, we contend that the pursuit of social benefits serves as the primary motivation behind reclamation activities.
Unlike man-made reclamation activities, such as the construction of salt flats and aquaculture ponds, which directly change the boundaries between land and sea, the construction of artificial embankments protrudes from the tidal flats and penetrate deep into the sea. This influence manifests in the spatial changes of delta tidal flats by altering the direction of nearshore tidal currents and impeding sediment movement. The effects of this phenomenon were particularly evident before and after the construction of the Ding Dam in the delta in 2006, where the north and south tidal flats exhibited contrasting patterns of southern erosion and northern siltation (Li et al., 2021).
5.2 Dynamic evolution of driving forces of tidal flats’ evolution
The spatial and temporal evolution of tidal flats in the Yellow River Qingshuigou sub-delta is influenced by a combination of river sediment discharges, marine hydrodynamics forces, and reclamation activities. However, it is important to note that the mechanisms governing tidal flat evolution are not constant, and the driving forces behind the spatial and temporal changes in tidal flats vary across different periods.
Reclamation activities have shifted the land boundary of tidal flats seaward through reclamation and landfilling, resulting in a reduction in tidal flat area. The impact of reclamation activities on the spatial and temporal evolution of tidal flats is directly reflected in the extent of reclamation. River sediment discharges are a crucial source for the formation of tidal flats in the delta. When the river transports sediment to the ocean, it is deposited near the estuary, expanding the area of tidal flats. These sediments continue to accumulate, gradually expanding the sea boundary of tidal flats towards the sea. The contribution of river sediment discharges to the spatial and temporal evolution of tidal flats is primarily observed in the sea boundary of the tidal flats in the current estuary section of the Qing8 lobe. The extent of its contribution is influenced by changes in the amount of sediment entering the sea, calculated from Figure 11.
In the current estuary section of the Qing8 lobe, the sea boundary of delta tidal flats moves under the combined influence of the river sediment discharges and marine hydrodynamics forces. On the other hand, in the abandoned estuary of Qingshuigou lobe, there is no direct input of sand from the river, and sediment recharge from the existing estuary to the abandoned estuary is limited by the blocking effect of the estuarine tidal shear front and the convex dike (Ji et al., 2020; Li et al., 2021; Ji et al., 2022; Wu et al., 2023). Therefore, changes in the tidal flat area at the sea boundary of the abandoned estuary of the Qingshuigou lobe are primarily controlled by marine hydrodynamics forces.
Based on the above, we quantified the spatial and temporal changes in the delta tidelands area by studying the extent to which anthropogenic reclamation activities (Creclamation), river sediment discharges (Csediment), and marine hydrodynamic conditions(Cmarine) contributed to the changes in the delta tidelands area in different periods (Figure 14), with the following formulas:
Where denotes the area of tidal flat change, denotes the area of anthropogenic reclamation activities, denotes the area of tidal flat change due to the influence of river sediment, denotes the area of tidal flat change due to the influence of marine hydrodynamic conditions, denotes the area of tidal flats changed due to the cumulative change of incoming sediment in the n-year period, and the calculation formula is derived from Figure 11, and denotes the amount of incoming sediment in the n-year period, where notes the year, and denotes the area of tidal flats changed due to the change of the seaside boundary.
The impacts of reclamation activities on the spatial and temporal evolution of tidal flats are typically abrupt and short-lived, rather than displaying prominent and continuous natural regularity in the time series. However, these impacts are often significant. Over the 13 years of influence on tidal flat evolution, the contribution rate exceeded 30% for 9 years. The highest contribution rate of 88.70% occurred in 2005-2006 due to the construction of the “100,000 Mu Ecological Restoration Project,” while the smallest contribution rate of 0.72% occurred in 2009-2010 (Figure 14).
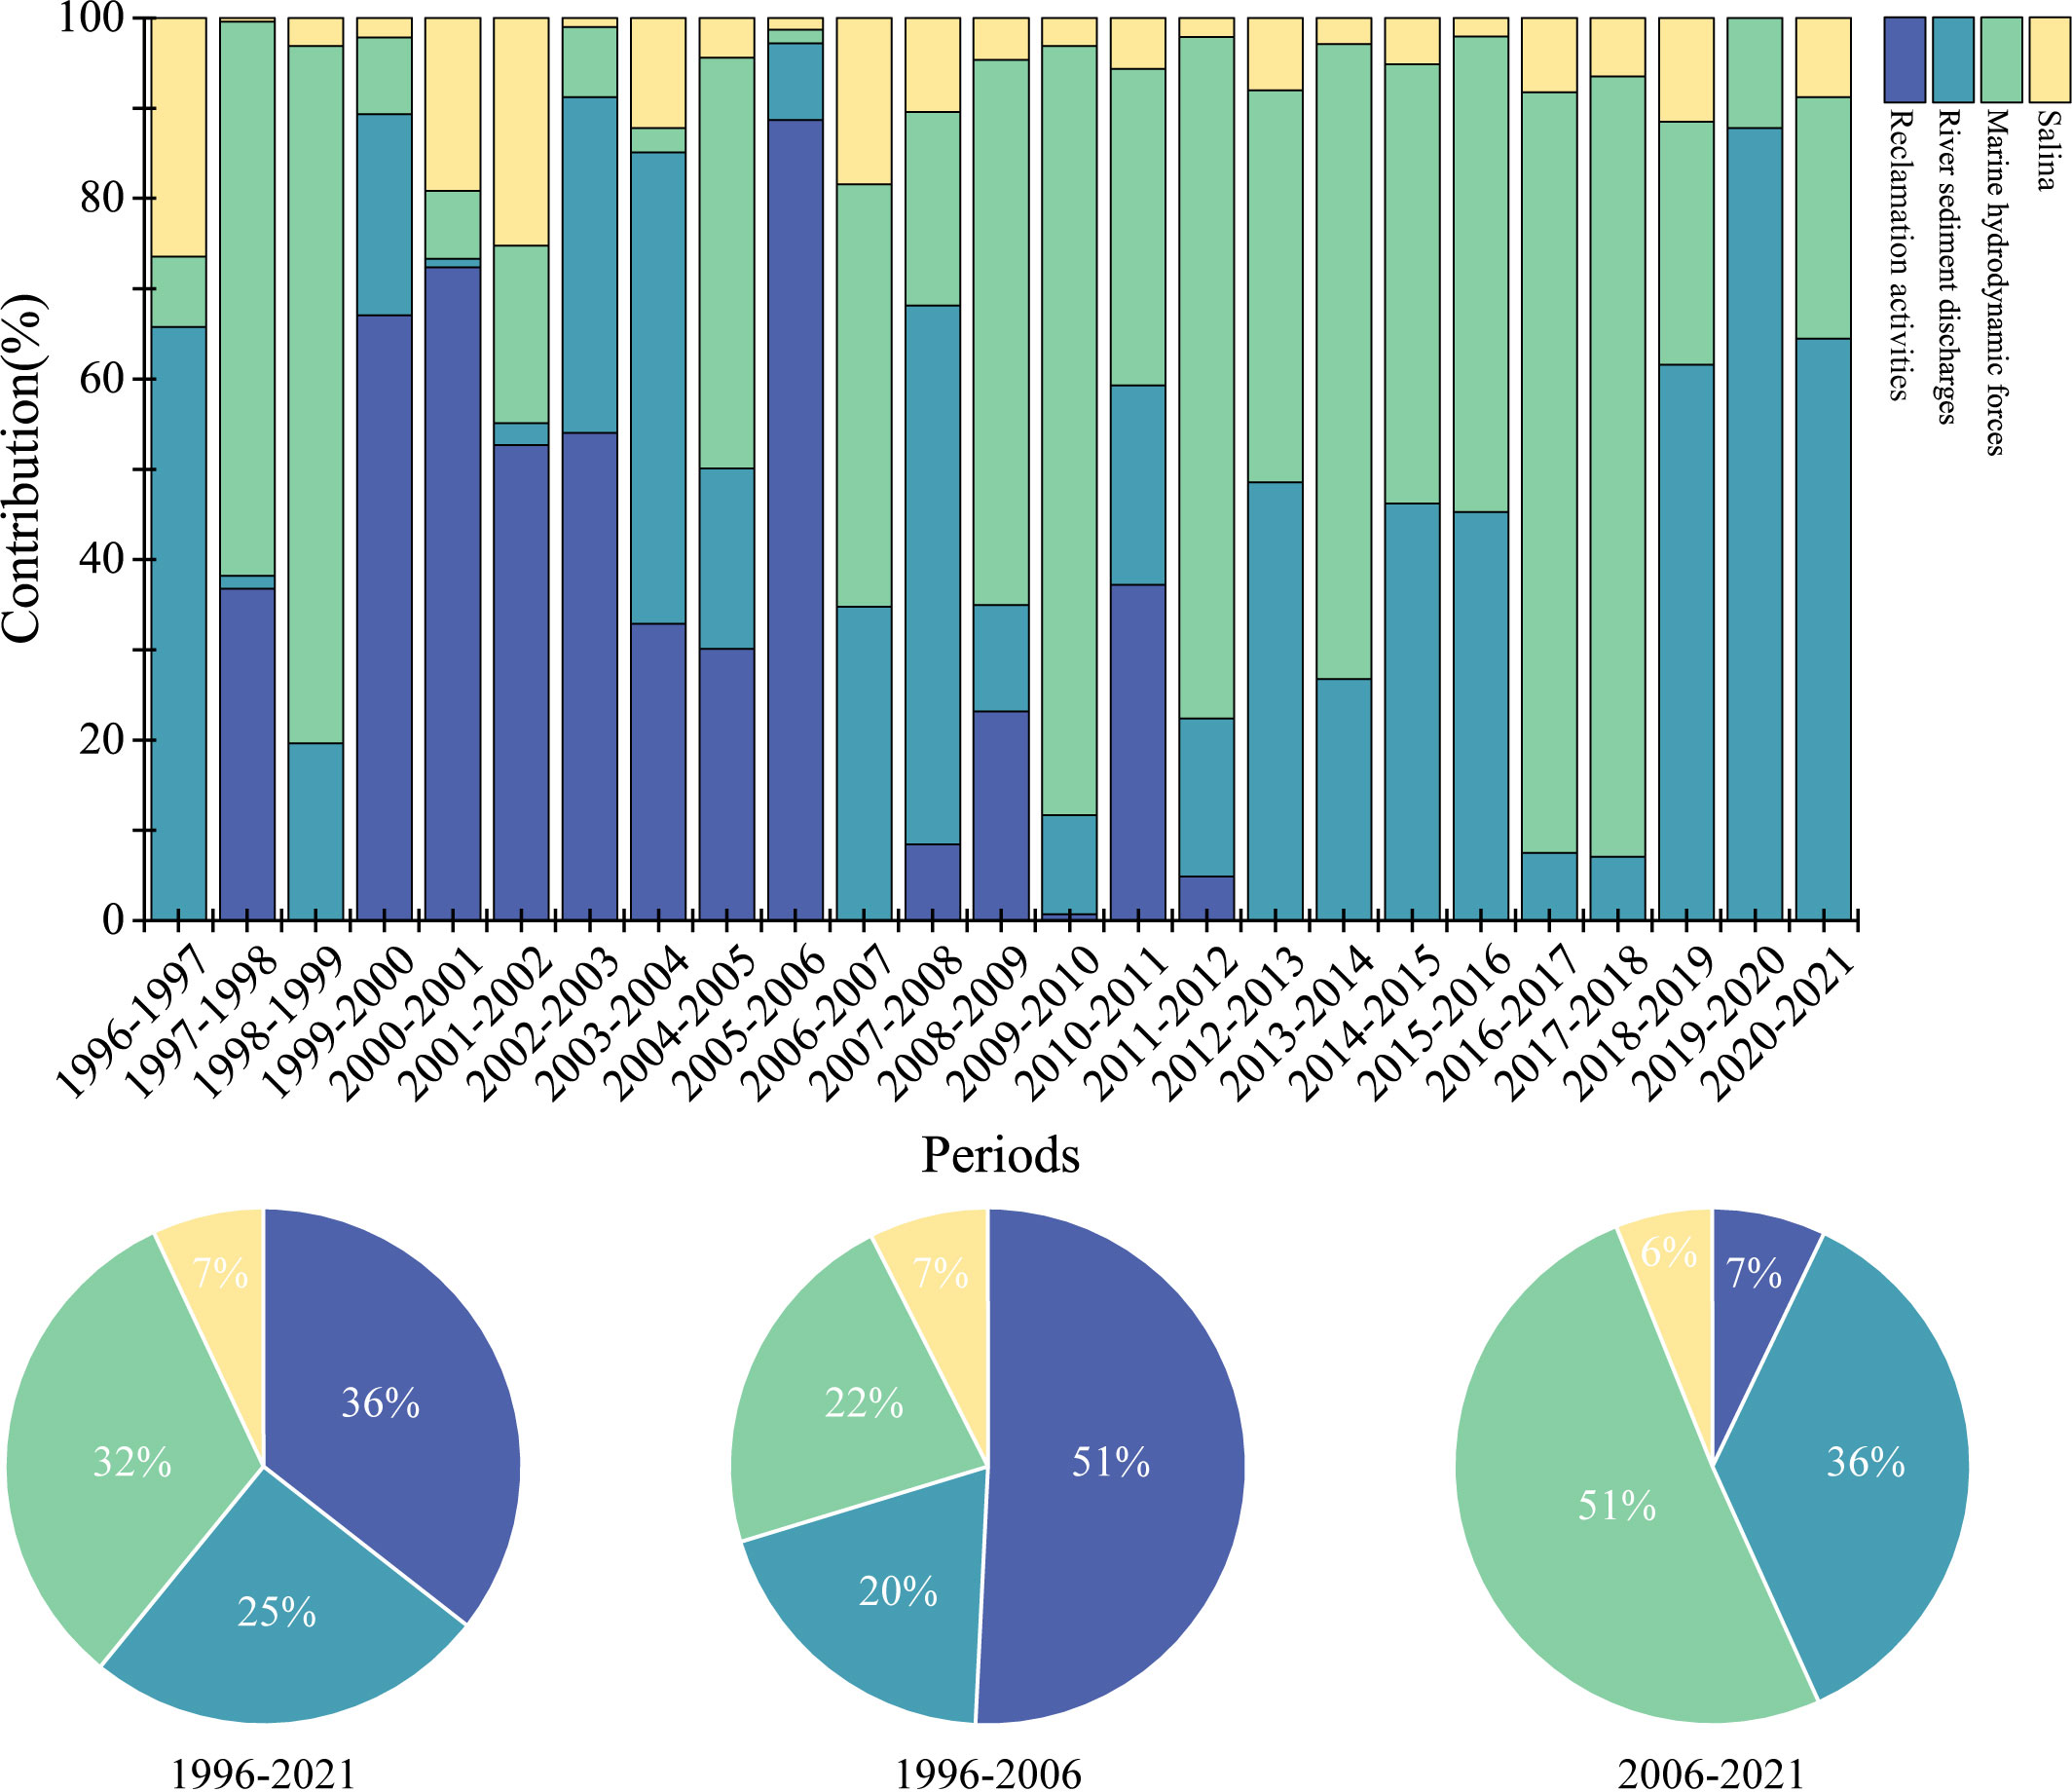
Figure 14 Contribution of Reclamation activities, River sediment discharges, Marine hydrodynamic forces, Salina to the spatial and temporal evolution of the tidal flats in different periods (the pie charts show the percentage of the degree of contribution of each driver in the spatial and temporal evolution of the tidal flats in the periods 1996-2021, 1996-2006, and 2006-2021, respectively).
In contrast to reclamation activities, the impacts of the river sediment discharges and marine hydrodynamics forces are continuous. Riverine sand transport provides a constant source of sediment to the tidal flats and fuels their seaward expansion, and the extent of its contribution is directly controlled by changes in the amount of incoming seawater sand. The average contribution of the river sediment discharges over the 25 years was 31.30%, with only 18.74% from 1996 to 2002. Following the implementation of the “WSRS” program in 2002, the average contribution increased significantly to 35.27% from 2002 to 2021, with a maximum contribution of 87.79% in 2019-2020. The temporal and spatial changes in the tidal flat area driven by marine hydrodynamics forces are primarily inhibitory, with an average contribution rate of 40.63% (Figure 14). Different stages exhibit varying degrees of influence on tidal flat changes, and the temporal trends of contributions from the river sediment discharges and marine hydrodynamics forces are generally opposite.
In the attribution analysis of changes in tidal flat areas, we observed a redistribution process in the spatial evolution of tidal flats driven by tidal currents. This may be attributed to sediment transport caused by tidal currents and variations in the submerged shoreline slope across different regions, resulting in different amounts of sediment influencing tidal flat area changes in different areas. Consequently, marine hydrodynamics forces may also contribute to the expansion of the tidal flat area in studies examining the degree of contribution to spatial and temporal evolution.
It is important to note that there are other factors influencing the spatial and temporal evolution of tidal flats in the Yellow River Qingshuigou sub-delta. Further analysis of remote sensing images revealed that the main effect is on the land boundary of tidal flats, manifested in dynamic changes in vegetation such as saline algae.
In summary, from 1996 to 2021, 93% of the tidal flats in the Yellow River Qingshuigou sub-delta will be controlled by “reclamation activities-marine hydrodynamics forces-river sediment discharges”. In the two phases of tidal flat spatial and temporal evolution, the mechanisms driving the spatial and temporal evolution of the tidal flats in the Yellow River Qingshuigou sub-delta are “ reclamation activities-marine hydrodynamics forces-river sediment discharges” and “marine hydrodynamics forces- river sediment discharges-reclamation activities”, respectively.
6 Conclusions
In this study, we successfully extracted the tidal flat extent of the Yellow River Qingshuigou sub-delta from 1996 to 2021 by combining the tide level data generated by the TMD model with the tidal flats extraction method based on the image inundation frequency. Additionally, we analyzed the driving factors affecting the spatial and temporal evolution of tidal flats in the Yellow River Qingshuigou sub-delta by combining incoming sediment, hydrodynamic modeling, and visual interpretation of anthropogenic reclamation activities. We also explored their evolution mechanisms in different periods. The main conclusions are as follows:
(1) The area of tidal flats in the Yellow River Qingshuigou sub-delta shows an overall decreasing trend, with a total area decrease of 83.55 km2 in 26 years. The area is divided into a “rapid decrease stage” and an “overall stabilization stage” with the year 2006 as the interval. Among them, the area of the tidal flats of the existing estuary increased continuously with continuous sediment supply, while the area of the abandoned estuary of Qingshuigou lobe decreased continuously after the loss of sediment supply.
(2) The spatial and temporal evolution of the tidal flats is influenced by river sediment discharges, marine hydrodynamics forces, and reclamation activities. There is a difference in the way of spatial and temporal evolution of the tidal flats among these factors. The river sediment discharges into the sea and promotes the expansion of the boundary through sediment accumulation. Marine hydrodynamics forces drive boundary changes through tidal currents and wave motion. Reclamation activities are capable of directly altering land cover types, producing rapid and direct changes to the extent of tidal flats in a short period. Among them, river sediment discharges and marine hydrodynamics forces mainly affect the sea boundary of the tidal flats, while human reclamation activities mainly affect the land boundary.
(3) The contribution of river sediment discharges, marine hydrodynamics forces, and reclamation activities to the spatial and temporal evolution of tidal flats varies in different periods. In the two phases of the spatial and temporal evolution of tidal flats, the mechanisms driving their evolution in the Yellow River Qingshuigou sub-delta are “reclamation activities-marine hydrodynamic forces-river sediment discharges” and “marine hydrodynamic forces- river sediment discharges-reclamation activities”.
Data availability statement
The original contributions presented in the study are included in the article/supplementary material. Further inquiries can be directed to the corresponding authors.
Author contributions
YC: Conceptualization, Data curation, Formal Analysis, Investigation, Methodology, Validation, Visualization, Writing – original draft, Writing – review & editing, Resources, Software. QW: Conceptualization, Funding acquisition, Project administration, Resources, Software, Supervision, Writing – review & editing, Writing – original draft. CZ: Conceptualization, Funding acquisition, Resources, Software, Supervision, Validation, Writing – review & editing. RL: Methodology, Software, Visualization, Writing – original draft. ZQ: Data curation, Investigation, Writing – original draft. LW: Investigation, Project administration, Supervision, Writing – review & editing. XL: Software, Supervision, Validation, Writing – review & editing. JZ: Methodology, Software, Supervision, Writing – review & editing. HS: Investigation, Software, Validation, Writing – review & editing. YL: Conceptualization, Formal Analysis, Methodology, Writing – original draft.
Funding
The author(s) declare financial support was received for the research, authorship, and/or publication of this article. We are grateful for financial support from the National Natural Science Foundation of China (Grant No. 42330406), and the Youth Innovation and Technology Program Team of Shandong University (2020KJH002).
Conflict of interest
The authors declare that the research was conducted in the absence of any commercial or financial relationships that could be construed as a potential conflict of interest.
Publisher’s note
All claims expressed in this article are solely those of the authors and do not necessarily represent those of their affiliated organizations, or those of the publisher, the editors and the reviewers. Any product that may be evaluated in this article, or claim that may be made by its manufacturer, is not guaranteed or endorsed by the publisher.
References
Almonacid-Caballer J., Sánchez-García E., Pardo-Pascual J. E., Balaguer-Beser A. A., Palomar-Vázquez J. (2016). Evaluation of annual mean shoreline position deduced from Landsat imagery as a mid-term coastal evolution indicator. Mar. Geology 372, 79–88. doi: 10.1016/j.margeo.2015.12.015
Arkema K. K., Guannel G., Verutes G., Wood S. A., Guerry A., Ruckelshaus M., et al. (2013). Coastal habitats shield people and property from sea-level rise and storms. Nat. Climate Change 3 (10), 913–918. doi: 10.1038/nclimate1944
Bi N., Wang H., Wu X., Saito Y., Xu C., Yang Z. (2021). Phase change in the evolution of the modern Huanghe (Yellow River) Delta: Process, pattern, and mechanisms. Mar. Geology 437, 106516. doi: 10.1016/j.margeo.2021.106516
Bi N., Wang H., Yang Z. (2014). Recent changes in the erosion–accretion patterns of the active Huanghe (Yellow River) delta lobe caused by human activities. Continental Shelf Res. 90, 70–78. doi: 10.1016/j.csr.2014.02.014
Chen Z. L., Lee S. Y. (2022). Tidal flats as a significant carbon reservoir in global coastal ecosystems. Front. Mar. Sci. 9. doi: 10.3389/fmars.2022.900896
Cui B.-L., Li X.-Y. (2011). Coastline change of the Yellow River estuary and its response to the sediment and runoff, (1976–2005). Geomorphology 127 (1-2), 32–40. doi: 10.1016/j.geomorph.2010.12.001
Cui Y., Xiao R., Zhang M., Wang C., Ma Z., Xiu Y., et al. (2020). Hydrological connectivity dynamics and conservation priorities for surface-water patches in the Yellow River Delta National Nature Reserve, China. Ecohydrology Hydrobiology 20 (4), 525–536. doi: 10.1016/j.ecohyd.2020.03.005
Fan Y., Chen S., Zhao B., Pan S., Jiang C., Ji H. (2018). Shoreline dynamics of the active Yellow River delta since the implementation of Water-Sediment Regulation Scheme: A remote-sensing and statistics-based approach. Estuarine Coast. Shelf Sci. 200, 406–419. doi: 10.1016/j.ecss.2017.11.035
Huang L., Chen S., Pan S., Li P., Ji H. (2022). Impact of storm surge on the yellow river delta: simulation and analysis. Water 14 (21), 3439. doi: 10.3390/w14213439
Ji H., Chen S., Pan S., Xu C., Tian Y., Li P., et al. (2022). Fluvial sediment source to sink transfer at the Yellow River Delta: Quantifications, causes, and environmental impacts. J. Hydrology 608, 12762. doi: 10.1016/j.jhydrol.2022.127622
Ji H., Pan S., Chen S. (2020). Impact of river discharge on hydrodynamics and sedimentary processes at Yellow River Delta. Mar. Geology 425, 106210. doi: 10.1016/j.margeo.2020.106210
Jia M., Wang Z., Mao D., Ren C., Wang C., Wang Y. (2021). Rapid, robust, and automated mapping of tidal flats in China using time series Sentinel-2 images and Google Earth Engine. Remote Sens. Environ. 255, 112285. doi: 10.1016/j.rse.2021.112285
Kang Y., Lei J., Wang M., Li G., Ding X. (2023). Topographic evolution of tidal flats based on remote sensing: an example in Jiangsu coast, Southern Yellow Sea. Front. Mar. Sci. 10. doi: 10.3389/fmars.2023.1163302
Khojasteh D., Glamore W., Heimhuber V., Felder S. (2021). Sea level rise impacts on estuarine dynamics: A review. Sci. Total Environ. 780, 146470. doi: 10.1016/j.scitotenv.2021.146470
Kong D., Miao C., Borthwick A. G. L., Duan Q., Liu H., Sun Q., et al. (2015). Evolution of the Yellow River Delta and its relationship with runoff and sediment load from 1983 to 2011. J. Hydrology 520, 157–167. doi: 10.1016/j.jhydrol.2014.09.038
Li P., Ke Y., Wang D., Ji H., Chen S., Chen M., et al. (2021). Human impact on suspended particulate matter in the Yellow River Estuary, China: Evidence from remote sensing data fusion using an improved spatiotemporal fusion method. Sci. Total Environ. 750, 141612. doi: 10.1016/j.scitotenv.2020.141612
Li W., Lv X., Ruan J., Yu M., Song Y. B., Yu J., et al. (2018). Variations in soil bacterial composition and diversity in newly formed coastal wetlands. Front. Microbiol. 9. doi: 10.3389/fmicb.2018.03256
Liu X., Gao Z., Ning J., Yu X., Zhang Y. (2016). An improved method for mapping tidal flats based on remote sensing waterlines: A case study in the Bohai Rim, China. IEEE J. Selected Topics Appl. Earth Observations Remote Sens. 9 (11), 5123–5129. doi: 10.1109/jstars.2016.2616514
Liu Z., Xu N., Wang J. (2020). Satellite-observed evolution dynamics of the yellow river delta in 1984–2018. IEEE J. Selected Topics Appl. Earth Observations Remote Sens. 13, 6044–6050. doi: 10.1109/jstars.2020.3026708
Murray N. J., Phinn S. R., DeWitt M., Ferrari R., Johnston R., Lyons M. B., et al. (2019). The global distribution and trajectory of tidal flats. Nature 565 (7738), 222–225. doi: 10.1038/s41586-018-0805-8
Padman L., Erofeeva S. J. E., research S. (2005). Tide model driver (TMD) manual (Seattle, Washington, USA: Earth and Space Research).
Passeri D. L., Hagen S. C., Medeiros S. C., Bilskie M. V., Alizad K., Wang D. (2015). The dynamic effects of sea level rise on low-gradient coastal landscapes: A review. Earth's Future 3 (6), 159–181. doi: 10.1002/2015ef000298
Quang D. N., Ngan V. H., Tam H. S., Viet N. T., Tinh N. X., Tanaka H. (2021). Long-term shoreline evolution using DSAS technique: A case study of Quang Nam province, Vietnam. J. Mar. Sci. Eng. 9 (10), 1124. doi: 10.3390/jmse9101124
Riedel M., Scherwath M., Romer M., Veloso M., Heesemann M., Spence G. D. (2018). Distributed natural gas venting offshore along the Cascadia margin. Nat. Commun. 9 (1), 3264. doi: 10.1038/s41467-018-05736-x
Sagar S., Roberts D., Bala B., Lymburner L. (2017). Extracting the intertidal extent and topography of the Australian coastline from a 28-year time series of Landsat observations. Remote Sens. Environ. 195, 153–169. doi: 10.1016/j.rse.2017.04.009
Tong S. S., Deroin J. P., Pham T. L. J. E., Science S. (2020). An optimal waterline approach for studying tidal flat morphological changes using remote sensing data: A case of the northern coast of Vietnam. Estuar. Coast. Shelf Sci. 236, 106613. doi: 10.1016/j.ecss.2020.106613
Wang J., Shi B., Yuan Q., Zhao E., Bai T., Yang S. (2022). Hydro-geomorphological regime of the lower Yellow river and delta in response to the water–sediment regulation scheme: Process, mechanism, and implication. Catena 219, 10646. doi: 10.1016/j.catena.2022.106646
Wang Q., Zhong S., Li X., Zhan C., Wang X., Liu P. (2016). Supratidal Land Use Change and Its Morphodynamic Effects along the Eastern Coast of Laizhou Bay during the Recent 50 Years. J. Coast. Res. 74, 83–94. doi: 10.2112/si74-008.1
Wang S., Fu B., Piao S., Lü Y., Ciais P., Feng X., et al. (2015). Reduced sediment transport in the Yellow River due to anthropogenic changes. Nat. Geosci. 9 (1), 38–41. doi: 10.1038/ngeo2602
Wang X., Xiao X., Zou Z., Chen B., Ma J., Dong J., et al. (2020). Tracking annual changes of coastal tidal flats in China during 1986–2016 through analyses of Landsat images with Google Earth Engine. Remote Sens. Environ.238, 110987. doi: 10.1016/j.rse.2018.11.030
Wang Z., Gao Z., Jiang X. (2023). Analysis of the evolution and driving forces of tidal wetlands at the estuary of the Yellow River and Laizhou Bay based on remote sensing data cube. Ocean Coast. Manage. 237, 106535. doi: 10.1016/j.ocecoaman.2023.106535
Wu G., Wang K., Liang B., Wu X., Wang H., Li H., et al. (2023). Modeling the morphological responses of the yellow river delta to the water-sediment regulation scheme: the role of impulsive river floods and density-driven flows. Water Resour. Res. 59 (7), e2022WR033003. doi: 10.1029/2022wr033003
Xu N. (2018). Detecting coastline change with all available landsat data over 1986–2015: A case study for the state of Texas, USA. Atmosphere 9 (3), 107. doi: 10.3390/atmos9030107
Xu X., Chen Z., Feng Z. (2019). From natural driving to artificial intervention: Changes of the Yellow River estuary and delta development. Ocean Coast. Manage. 174, 63–70. doi: 10.1016/j.ocecoaman.2019.03.009
Xu H., Jia A., Song X., Bai Y. (2023). Extraction and spatiotemporal evolution analysis of tidal flats in the Bohai Rim during 1984–2019 based on remote sensing. J. Geographical Sci. 33 (1), 76–98. doi: 10.1007/s11442-023-2075-0
Yan J., Zhao S., Su F., Du J., Feng P., Zhang S. (2021). Tidal flat extraction and change analysis based on the RF-W model: A case study of Jiaozhou Bay, East China. Remote Sens. 13 (8), 1436. doi: 10.3390/rs13081436
Ye Q., Chen S., Huang C., Xue Y., Tian G., Chen S., et al. (2007). Characteristics of landscape information Tupu of the Yellow River swings and its subdeltas during 1855–2000. Sci. China Ser. D: Earth Sci. 50 (10), 1566–1577. doi: 10.1007/s11430-007-0056-2
Zhang K., Dong X., Liu Z., Gao W., Hu Z., Wu G. (2019). Mapping tidal flats with landsat 8 images and google earth engine: A case study of the China’s Eastern Coastal Zone circa 2015. Remote Sens. 11 (8), 924. doi: 10.3390/rs11080924
Zhang X., Lu Z., Jiang S., Chi W., Zhu L., Wang H., et al. (2018). The progradation and retrogradation of two newborn Huanghe (Yellow River) Delta lobes and its influencing factors. Mar. Geology 400, 38–48. doi: 10.1016/j.margeo.2018.03.006
Zhao C., Qin C.-Z., Teng J. (2020). Mapping large-area tidal flats without the dependence on tidal elevations: A case study of Southern China. ISPRS J. Photogrammetry Remote Sens. 159, 256–270. doi: 10.1016/j.isprsjprs.2019.11.022
Zhu L., Hu R., Zhu H., Jiang S., Xu Y., Wang N. (2018). Modeling studies of tidal dynamics and the associated responses to coastline changes in the Bohai Sea, China. Ocean Dynamics 68 (12), 1625–1648. doi: 10.1007/s10236-018-1212-2
Keywords: the Yellow River Qingshuigou sub-delta, tidal flat, hydrodynamic model, reclamation activities, river sediment discharges
Citation: Cao Y, Wang Q, Zhan C, Li R, Qian Z, Wang L, Liu X, Zhu J, Shi H and Li Y (2023) Evolution of tidal flats in the Yellow River Qingshuigou sub-delta: spatiotemporal analysis and mechanistic changes (1996-2021). Front. Mar. Sci. 10:1286188. doi: 10.3389/fmars.2023.1286188
Received: 31 August 2023; Accepted: 19 October 2023;
Published: 07 November 2023.
Edited by:
Yifei Zhao, Nanjing Normal University, ChinaReviewed by:
Ruihu Zhu, Hohai University, ChinaXiaochuan Ma, Chinese Academy of Sciences (CAS), China
Copyright © 2023 Cao, Wang, Zhan, Li, Qian, Wang, Liu, Zhu, Shi and Li. This is an open-access article distributed under the terms of the Creative Commons Attribution License (CC BY). The use, distribution or reproduction in other forums is permitted, provided the original author(s) and the copyright owner(s) are credited and that the original publication in this journal is cited, in accordance with accepted academic practice. No use, distribution or reproduction is permitted which does not comply with these terms.
*Correspondence: Qing Wang, c2NoaW5nd2FuZ0AxMjYuY29t; Chao Zhan, emhhbmNoYW8wMjI2QDE2My5jb20=