 Dong Li
 Chuanxu Chen1*
 Shiguo Wu
- 1Institute of Deep-Sea Science and Engineering, Chinese Academy of Sciences, Sanya, China
- 2University of Chinese Academy of Sciences, Beijing, China
We employed seismic tomography to examine the velocity structure of the upper mantle in the Southernmost Mariana subduction zone. Our study focuses on data collected during a six-month experiment from 15 December 2016 to 12 June 2017, using 11 ocean bottom seismometers. By examining over 3700 local arrival times, we are able to determine the three-dimensional Vp and Vs structure. The subducting slab in this region displays a P- and S-wave velocity 2~6% higher than normal mantle and a lower Vp/Vs, with an average dip of 45° at depths ranging from 50 to 100 km. Additionally, our velocity images also shed new lights to the velocity anomalies of the mantle wedge region on top of the subducting slab, from the trench to the remnant arc. We observed slower velocity anomalies in the mantle wedge beneath the Southwest Mariana Rift, the West Mariana Ridge, and the forearc. In the outer forearc, a low-velocity anomaly is observed at depths shallower than 50 km, indicating mantle serpentinization and the presence of water. Additionally, a melt production region is observed beneath the central part of the forearc block at a depth of 40–60 km suggesting the possibility of melting processes in this region.
1 Introduction
Subduction zones play a vital role in Earth’s geological systems and provide important insights into the processes of material circulation (Stern, 2002). In order to enhance our understanding of subduction zones and accurately estimate features such as the magma system and slab geometry, it is essential to obtain dependable information about the subsurface. Seismic tomography serves as a valuable technique for constructing three-dimensional models that capture seismic velocity variations, thus providing valuable insights into the underlying structures of the subsurface (Zhao, 2001). For instance, seismic tomography has revealed in numerous subduction settings sharp contrasts in velocities indicative of important geological interfaces between cold oceanic lithosphere undergoing subduction and potentially warmer magma pockets embedded within the overlying crust and shallow mantle (Nakajima et al., 2001; Husen et al., 2003; Wiens et al., 2008; Zhao, 2012; Barklage et al., 2015).
The Mariana subduction system is considered a quintessential model of an intraoceanic subduction system, and its isolation from continental influences, such as sedimentation and magmatism, makes it a perfect location for investigating subduction mechanisms (Stern et al., 2003). Previously, seismic tomography studies were conducted in the central Mariana region (Pozgay et al., 2007; Takahashi et al., 2007; Takahashi et al., 2008; Pozgay et al., 2009; Pyle et al., 2010; Barklage et al., 2015; Cai et al., 2018). The main findings of the studies in the central Mariana region include the presence of slow mantle velocities beneath the Mariana arc and the West Mariana Ridge (WMR), lower-velocity lower crust beneath the volcanic front and adjacent to the Mariana Trough, and high-velocity lower crust at the boundaries between the arc and back-arc regions, suggesting complex processes of crustal growth, mantle interactions, and magmatic activity in the Mariana system. There are still few studies in southernmost Mariana. Wan et al. (2019) conducted a study that successfully imaged the shallow structure beneath the Southernmost Mariana using data from an active-source ocean bottom seismometer (OBS). With a maximum discernible depth of 20 km, the study identified a low-velocity zone in the uppermost mantle of the incoming Pacific plate and overriding plate, which was interpreted as peridotite serpentinization. In the study by Zhu et al. (2021), Rayleigh wave tomographic methods were employed to obtain the Vs structure of the southernmost Mariana. In the vicinity of the trench axis, it was observed that the incoming Pacific Plate exhibited low velocity within the upper approximately 25 km of the mantle. However, our understanding of the distribution of partial melt within the mantle wedge and the geometry of the subducting slab remains limited due to insufficient data coverage.
In the southernmost Mariana subduction zone, the characteristics of tectonic deformation exhibit notable distinctions compared to the central and northern part (He et al., 2023). During the process of subduction rollback, the presence of the Caroline Ridge acts as an obstacle, resulting in a reduction in the rate of rollback and an increase in the subduction angle (McCabe and Uyeda, 1983; Gvirtzman and Stern, 2004; Fan et al., 2022; Zhang et al., 2023). The combination of a steeper subduction angle and slower rollback rate compresses the forearc wedge within a narrower lateral extent in that region. This unique geological environment provides an ideal experimental site for studying high-angle subduction. We believe that this fundamental subduction framework model offers new insights into explaining the enigmatic features of the Southwest Mariana Rift (SWMR) and the absence of an arc.
In this study, we aim to investigate the three-dimensional seismic velocity structure of the southernmost Mariana by analyzing local earthquake data obtained from two arrays consisting of 11 OBSs. Subsequently, we examine the velocity anomalies in relation to the geometry of the subducting slab and the way in which partial melt is distributed within the mantle wedge.
2 Geological background
The Mariana subduction zone is formed by the subduction of the Pacific plate, which originated during the Jurassic period, into the mantle beneath the Philippine Sea plate (Stern et al., 2003). According to Kato et al. (2003), the convergence rate in the northern region of Mariana was approximated to be around 3.5–4.5 cm/yr, while it increased to approximately 6–7 cm/yr towards the southern region. The Mariana subduction zone is characterized by a complex and faulted forearc that features actively serpentinite mud seamounts (Fryer, 1995; Fryer et al., 2020). The region also includes a remnant island arc, an active island arc, and a back-arc spreading center (Stern et al., 2003).
The southernmost Mariana margin exhibits notable distinctions when compared to the central-north Mariana margins (Stern et al., 2003). At latitudes south of 13.8°N, the southernmost segment of the Mariana margin displays an east-west orientation, diverging from the predominantly north-south trend that characterizes most of the Mariana margin farther to the north (Martinez et al., 2018; Zhu et al., 2021). Additionally, the southernmost Mariana margin lacks a well-developed volcanic arc. Instead, it is characterized by scattered and small volcanic structures with irregular spacing (Ribeiro et al., 2020). Tectonic activity is greater in the southernmost Mariana forearc area compared to portions of the forearc located more northerly. It experiences significant extension along the strike and perpendicular to the trench, indicating intense deformation (Martinez et al., 2018). Unlike the northern Mariana forearc, where serpentinite volcanoes such as Big Blue and Celestial Seamounts are found roughly 30-120 km away from the trench axis (Fryer et al., 2000), there is no known occurrence of serpentinite volcanoes along the southernmost Mariana forearc. However, it is worth noting that serpentinized peridotites have been retrieved from the inner trench slope in the southernmost Mariana (Ohara et al., 2012). There is a lower degree of serpentinization in the forearc mantle of the southernmost Mariana region compared to the central Mariana region (Zhu et al., 2021). In the southernmost Mariana margin, the geometry of the subducting slab is significantly different from that in the central. Unlike the central Mariana where the subducting slab extends deeper into the lower mantle, the subducting slab in the southernmost Mariana has a limited depth of around 250 km (Miller et al., 2006).
3 Data and method
In this study, the data was obtained through two passive-source OBS experiments conducted in the vicinity of the Challenger Deep, spanning the Southernmost Mariana Trench. Our analysis relied on P- and S-arrival times determined by Chen et al. (2022), which were picked from waveforms recorded at 11 OBSs during the period of 15 December 2016 to 12 June 2017 (Figure 1). Figure S1 presents a depiction of the observations recorded by OBSs during a local earthquake. The initial seismic data catalogue picked from OBSs contained 6753 P-wave arrivals and 4989 S-wave arrivals from 891 earthquakes. To select a subset of data suitable for seismic tomography, three criteria were applied: (a) only events with at least 9 total P and S picks were included, (b) events had to be within 100 km of the nearest seismic station, and (c) residual travel times after locating the events using a 1D velocity model had to be less than 2 s for P-waves and 3 s for S-waves (Raoof et al., 2017; Koulakov et al., 2023). After applying these selection criteria, the refined data set contained 3755 total picks, comprising 1993 P-wave picks and 1762 S-wave picks, from 298 events that met all the requirements.
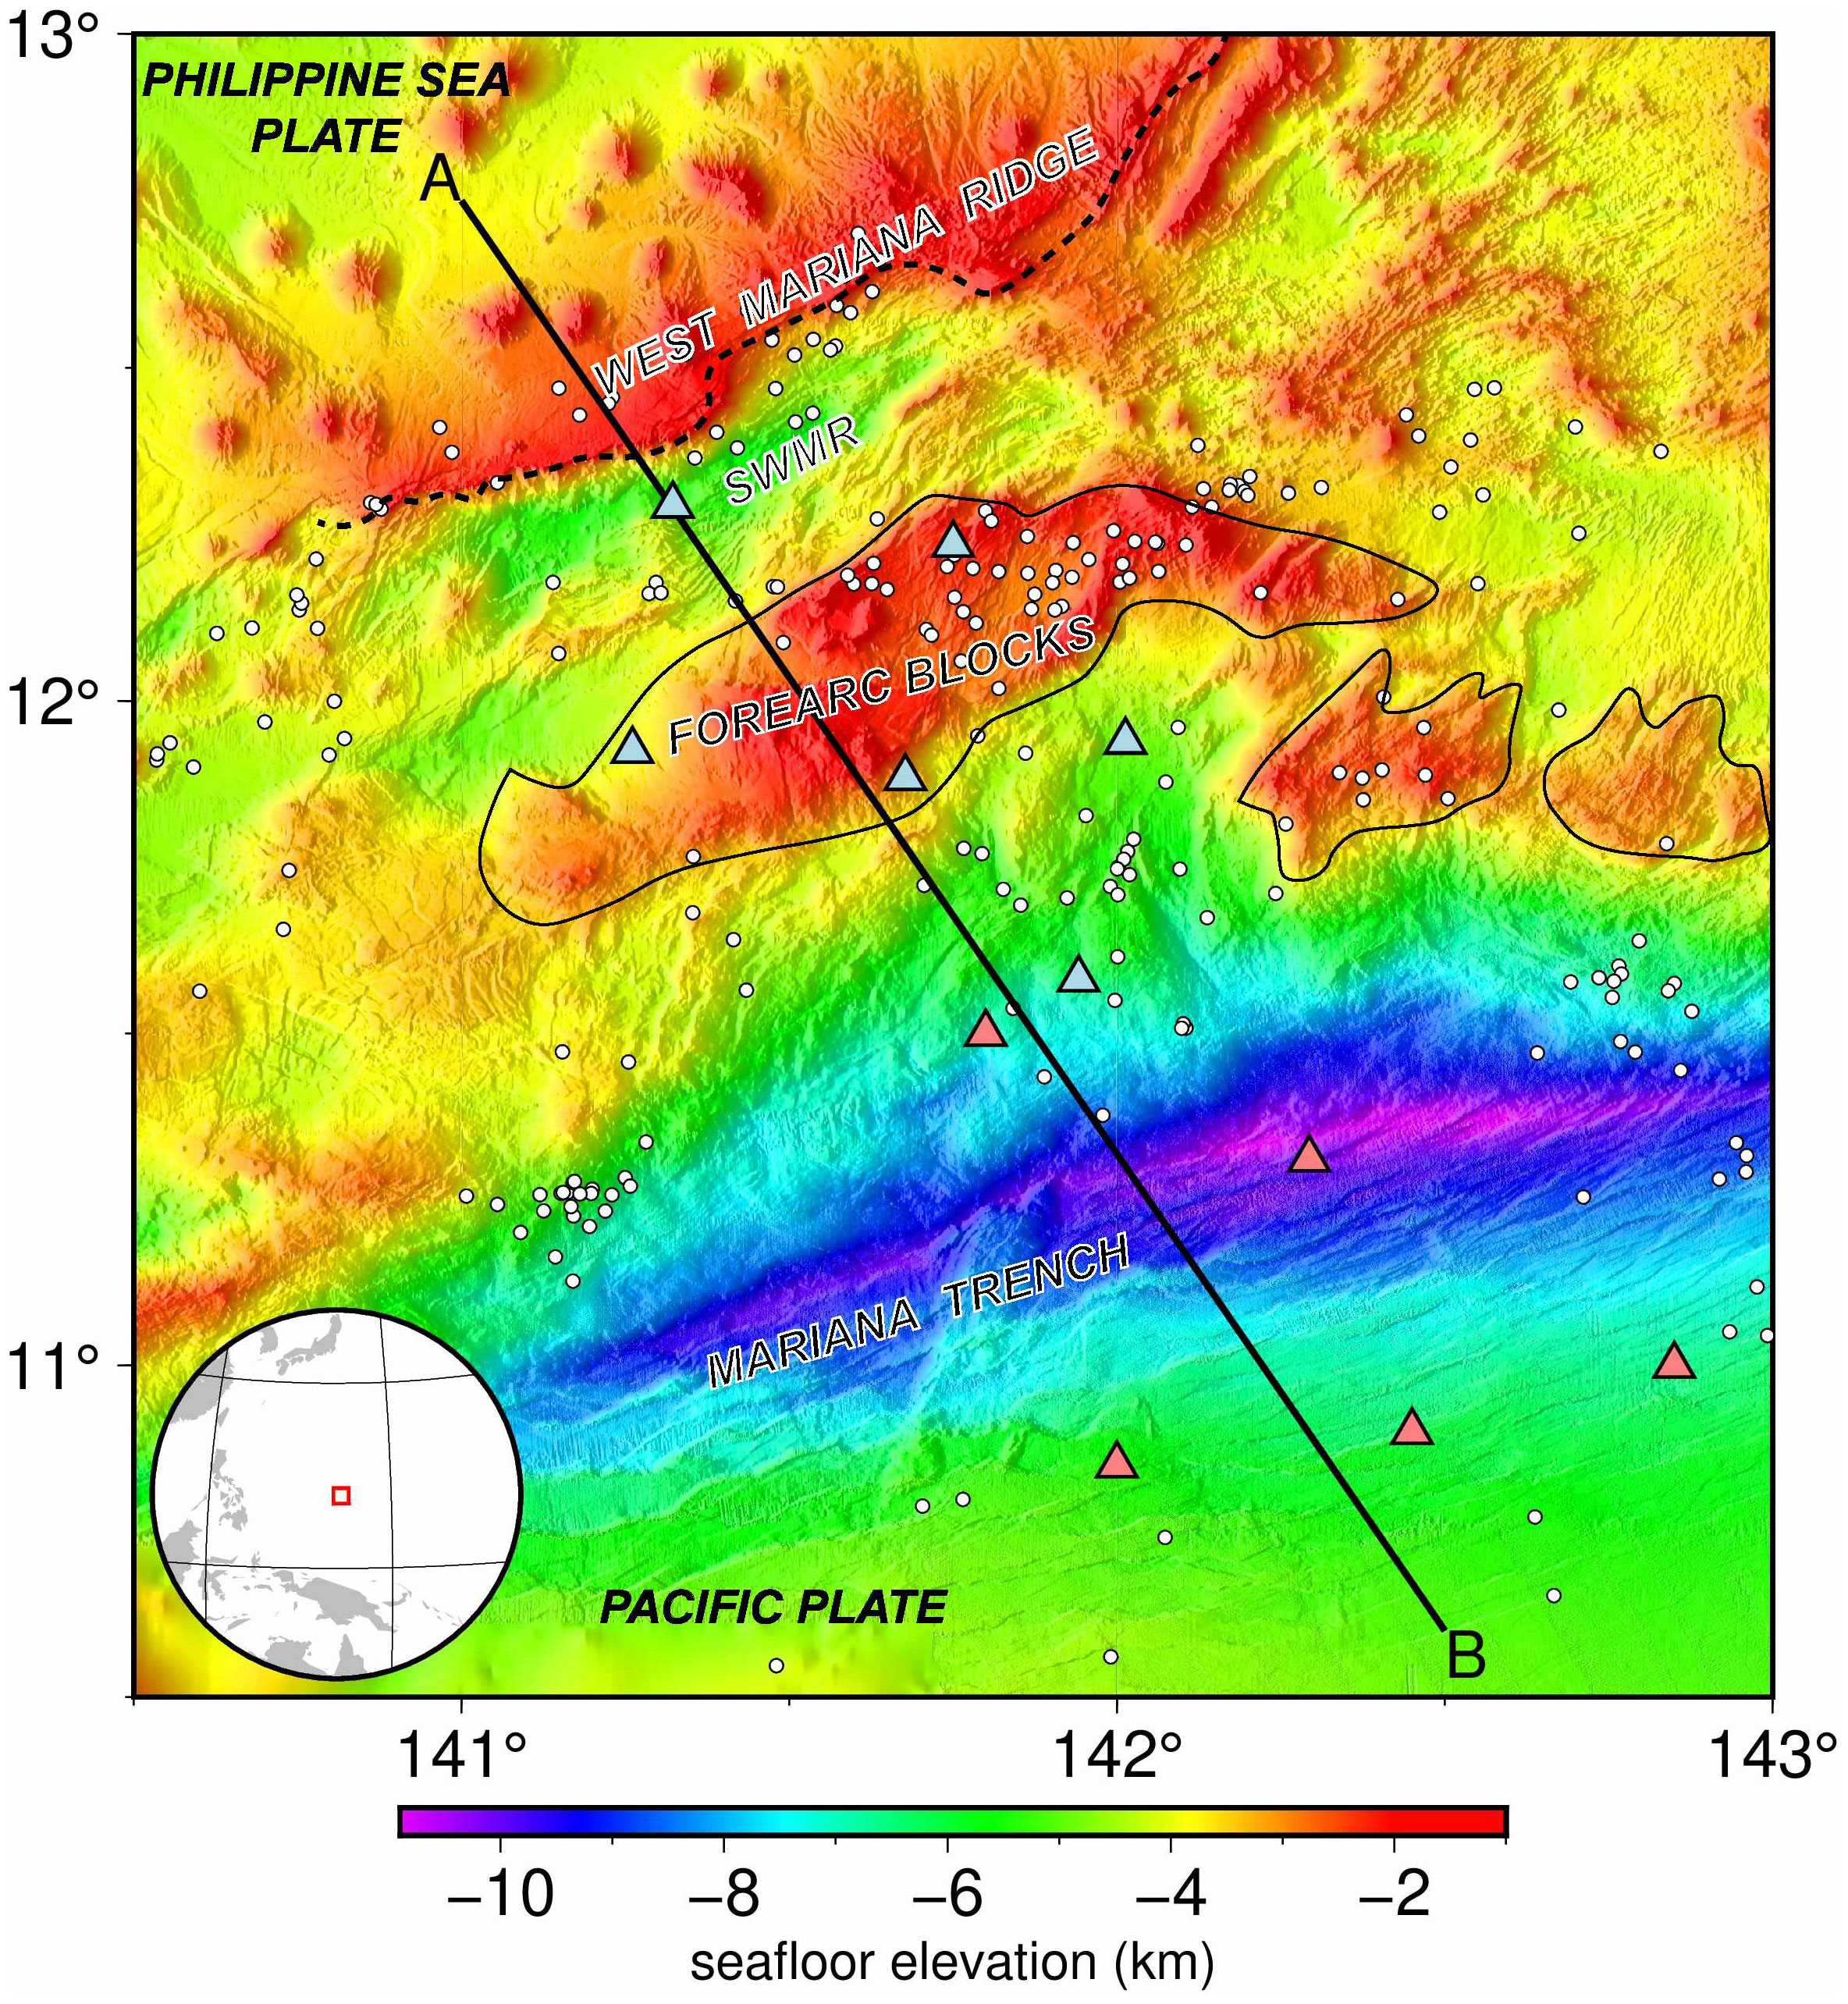
Figure 1 Map showing the distribution of 11 stations (white triangles) and seismicity used in this study from 15 December 2016 to 12 June 2017. Locations of the Southwest Mariana Rift (SWMR) and forearc blocks are as identified by Martinez et al. (2018).
For the local tomographic inversion, we employed the LOTOS (Local Tomography Software) algorithm developed by Koulakov (2009). LOTOS iteratively inverts P- and S-wave arrival times from local and regional earthquakes to jointly determine three-dimensional Vp and Vs structures and source locations. The tomographic inversion process consists of multiple steps to accurately determine the subsurface velocity model. Firstly, a travel time table is calculated using an initial 1-D velocity model. This table includes travel times for various combinations of source depths and epicentral distances, computed using analytical formulas. Next, a preliminary source location is determined using the grid search method. A reference table, generated from the travel time table calculated in the previous step, is utilized during this process. Once the preliminary source locations are identified, the tomographic inversion proceeds to locate the sources in the 3-D velocity model. This refined relocation algorithm utilizes gradient-based optimization techniques along with bending ray tracing to minimize travel time residuals (Um and Thurber, 1987; Koulakov, 2009). In the first iteration, the starting 1-D velocity model is employed, while in subsequent iterations, the updated 3-D velocity models from previous iterations are used. Then, the inversion for the velocity model is carried out using parameterization grid. This step is repeated in conjunction with the source location determination, with iterations performed alternately.
To parameterize the velocity model, we utilized a grid of nodes that were distributed throughout the study volume based on the ray density. In the map view, the nodes were evenly spaced with a 20 km interval, but only in areas with a ray density of at least 10% of the average ray density. In the vertical direction, the spacing between nodes was inversely proportional to the ray density. In regions where the number of rays is limited, the spacing between nodes is increased. To prevent an excessive clustering of nodes in areas with a high density of rays, we establish a minimum spacing of 10 km between nodes. This value is considerably smaller than the typical size of the anticipated anomalies. Overall, the grid utilized in our study consisted of 300 nodes for the Vp model and 313 nodes for the Vs model. We performed multiple inversions in grids with various basic orientations (0, 22, 45, and 66°) to minimize the effects of node distribution on the results (Koulakov et al., 2023). Finally, we stacked the results into one model. We utilized the LSQR algorithm (Paige and Saunders, 1982) to invert a sparse matrix for velocity anomalies, station corrections, source coordinates, and origin times. We performed a total of four iterations for both real and synthetic data inversions, which was an optimal balance between model stability and computational efficiency. The tomography inversion process enabled us to obtain three-dimensional distributions of the anomalies in Vp and Vs. By dividing the absolute values of the resulting Vp and Vs, we were able to calculate the Vp/Vs ratio. Table 1 displays the primary controlling parameters utilized in the inversion process. We determined the optimal values for these parameters by analyzing the trade-off curves (Figure 2), which illustrate the relationship between travel-time residuals and velocity perturbations for various damping and smoothing values (Eberhart-Phillips, 1986). The corner area of the trade-off curve represents the region where optimal values of parameters can be identified and implemented for the inversion process.
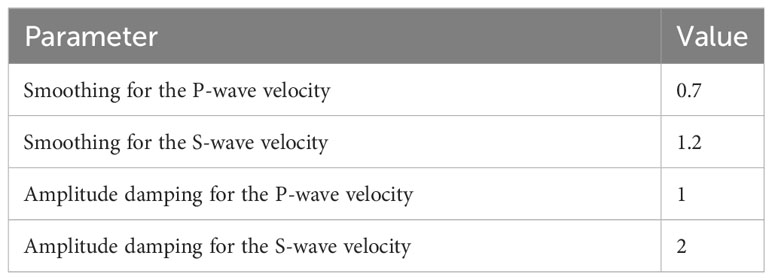
Table 1 Major controlling parameters used for calculation of the main tomographic model.
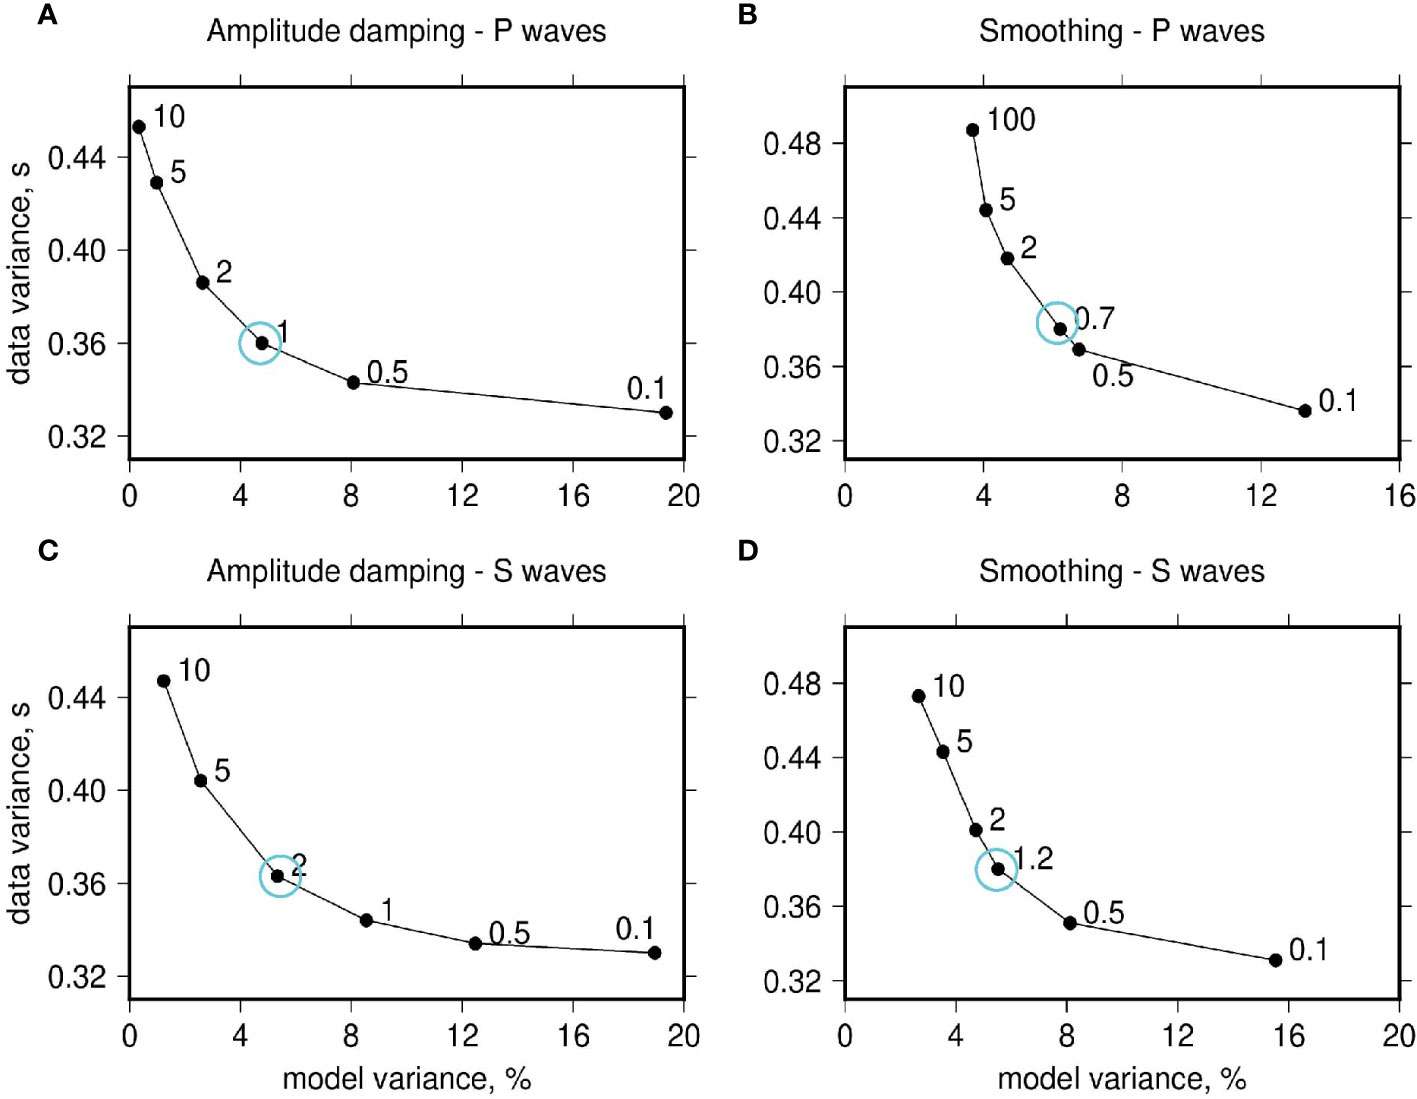
Figure 2 Trade-off curve for the variance of model and data.
4 Synthetic tests
We conducted synthetic tests to evaluate the reliability of our tomographic results prior to presenting the main results with the 3D Vp and Vs structure. We performed horizontal and vertical checkerboard tests to assess the resolution of the data set in both dimensions. This synthetic testing process closely mirrored the processing steps used for the experimental data. To generate synthetic travel times, we used the same source and receiver locations from the experimental data inversion. We then calculated the synthetic travel times through the 3D velocity model using the bending ray tracing algorithm (Um and Thurber, 1987; Koulakov, 2009), matching the approach used for the real data inversion. We added random noise with an average deviation of 0.1 s to these computed synthetic travel times. Once synthetic travel times were produced, we removed any knowledge of the velocity models and source locations employed in their generation. We subsequently repeated our entire data processing workflow.
We present the results of horizontal resolution checkerboard test in Figures 3, 4. This test utilized an initial model comprised of regularly alternating synthetic anomalies. Each anomaly covered an area of 30 × 30 km and was separated from the next by a 10 km gap devoid of anomalies (Figure S2). Moreover, all anomalies exhibited uniform amplitudes of ±7% that persisted consistently across all depths within the model. We have observed that the main patterns of Vp and Vs anomalies are accurately depicted up to depths of approximately 60 km. Anomalies exhibit smearing at diagonals in places, but the sequence of alternating anomalies remains discernible at the appropriate locations.
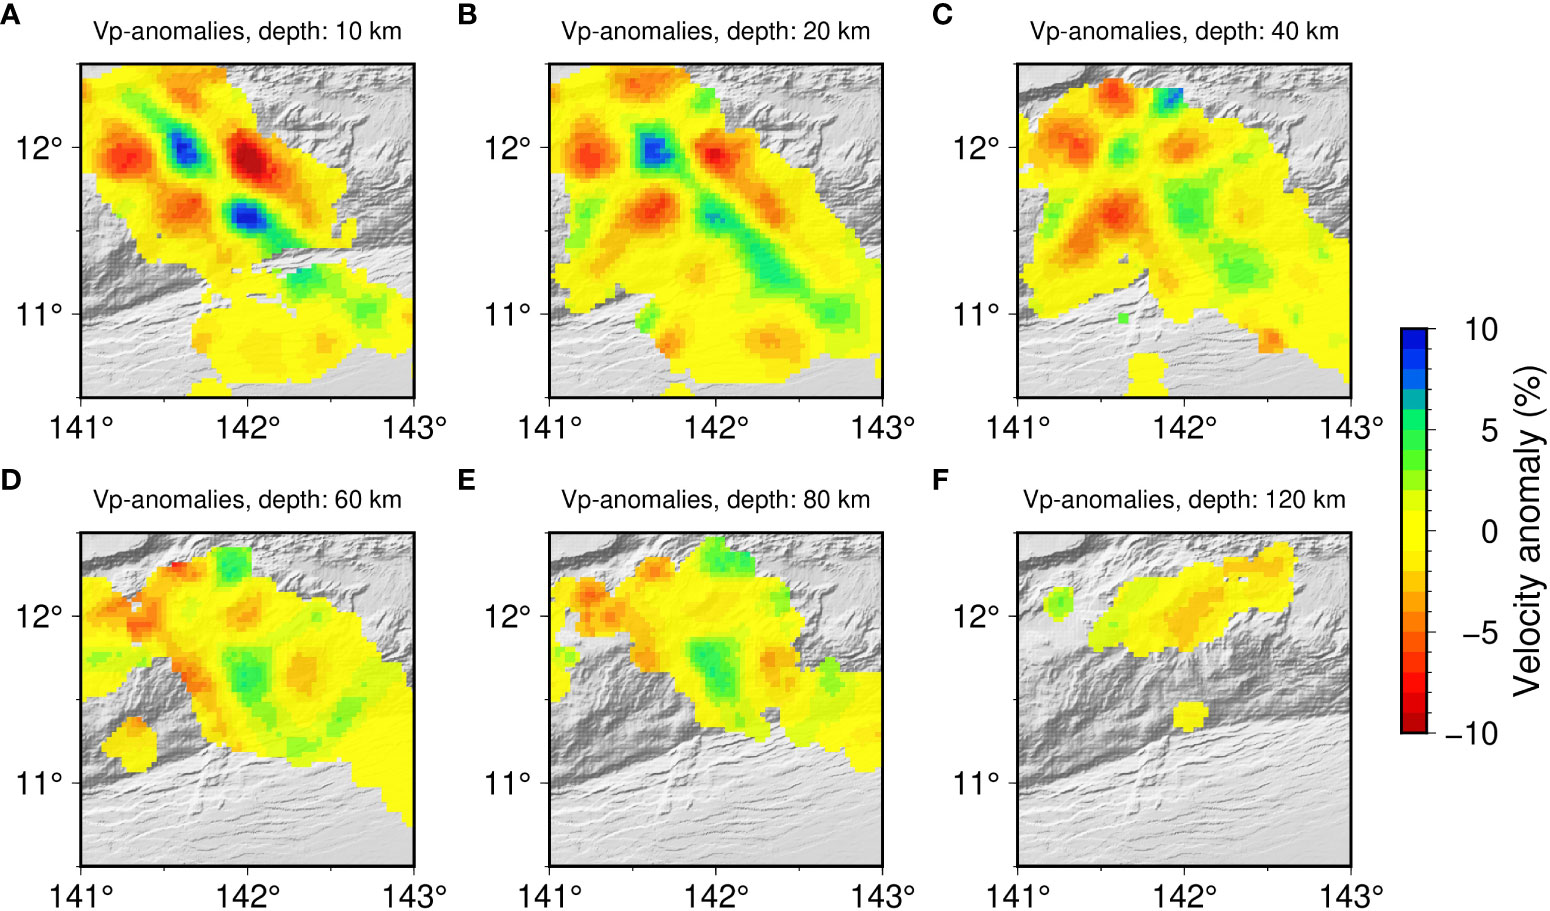
Figure 3 Vp anomalies of checkerboard test for horizontal resolution.
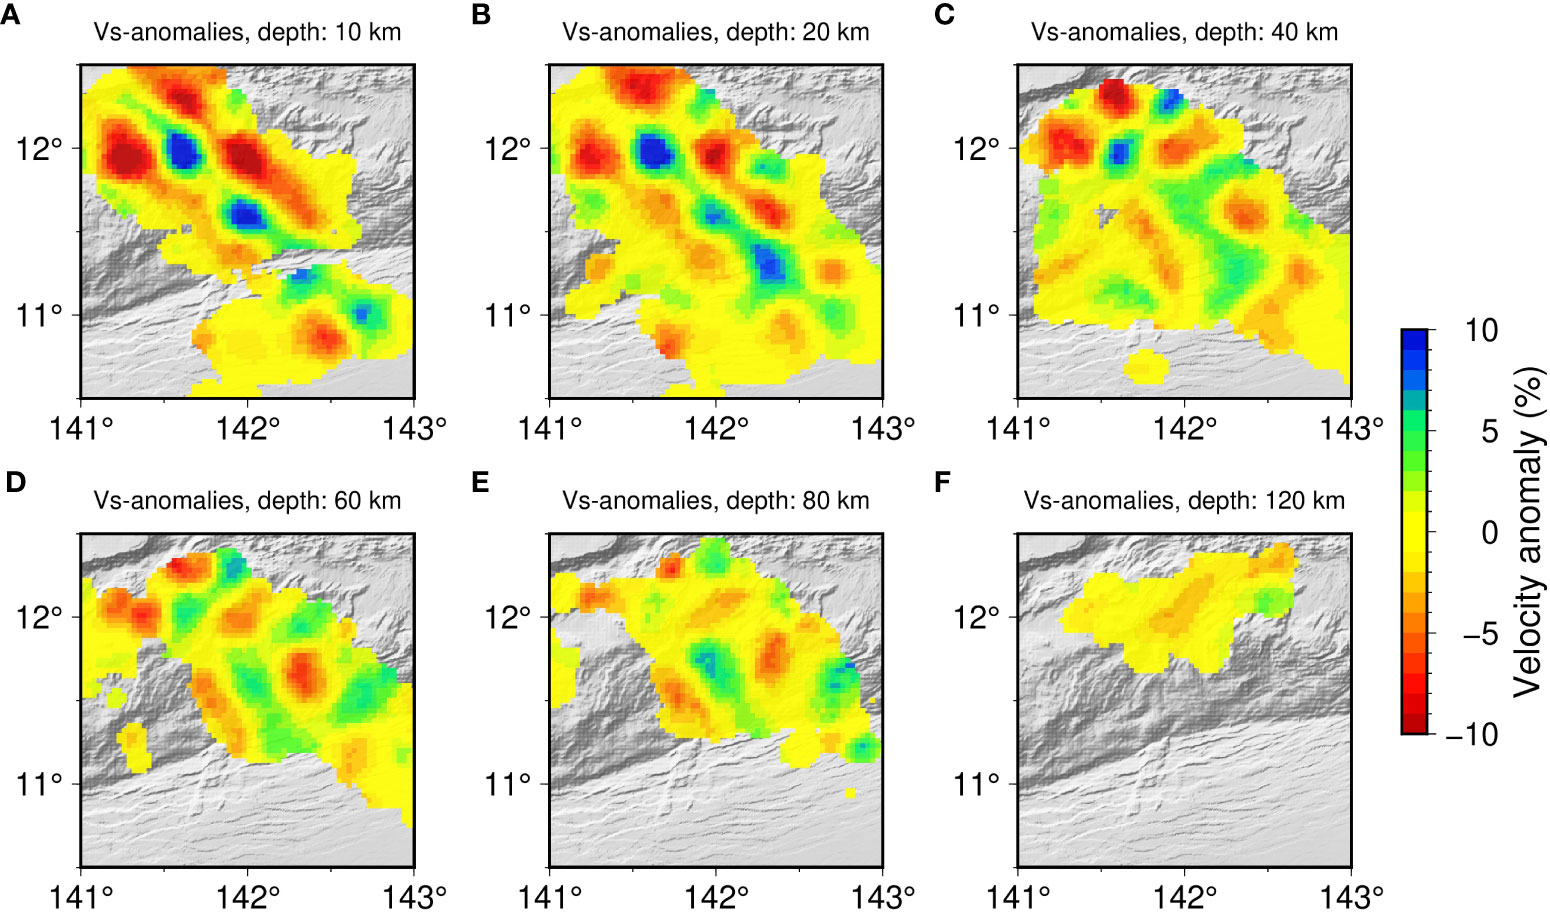
Figure 4 Vs anomalies of checkerboard test for horizontal resolution.
To further assess the vertical resolution, additional test was conducted (Figure 5) using the same profile where the anomalies were defined for presenting the main results. Figure S3 displays the input model used for the vertical resolution tests. The model consists of synthetic alternated anomalies with amplitudes of ±7% were defined in squared cells of 30 km size. In the majority of cases, the inversion process successfully achieved a robust recovery of anomalies within depths of less than 60 km. The anomalies are still visible but appear to be smudged at depths greater than 60 km. This observation should be taken into account when interpreting the main model.
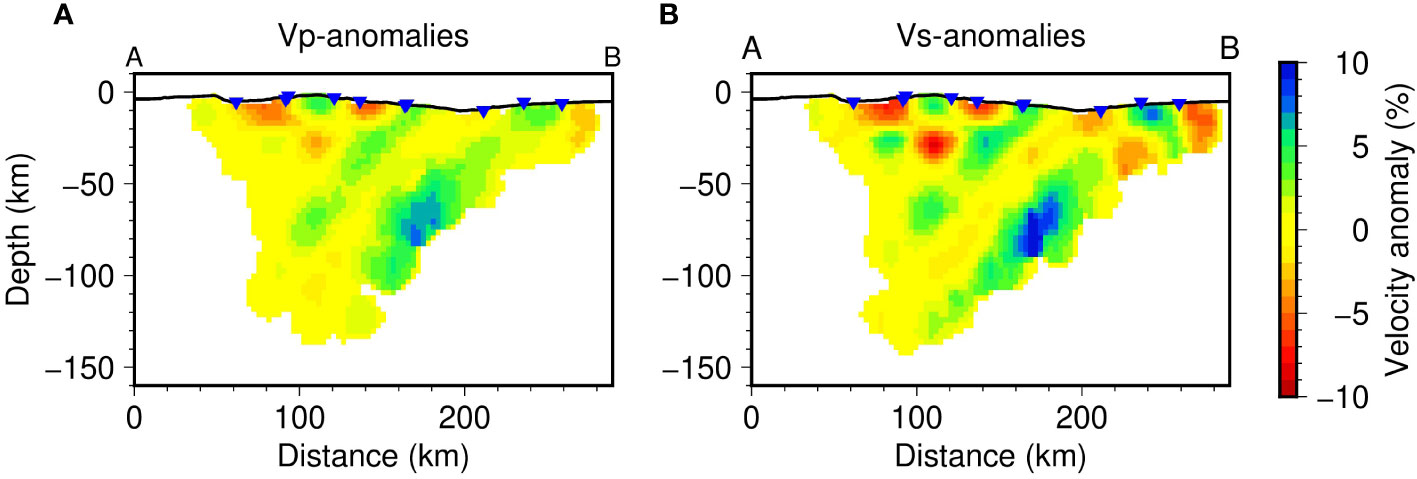
Figure 5 Results of checkerboard test for vertical resolution along the profile AB. The locations of the section are shown in Figure 1.
5 Results
As a result of the inversion process, the 3D Vp and Vs anomaly distributions were obtained as percentages relative to the 1D reference model shown in Table 2. The inversion procedure resulted in a reduction of residuals from 0.571 s to 0.395 s for the P data, corresponding to a variance reduction of 30.88%. Similarly, for the S data, the residuals decreased from 0.748 s to 0.436 s, indicating a variance reduction of 41.78%. The values of the root-mean-square (RMS) residuals during iterations are presented in Figure S4. Figures 6–9 depict both horizontal and vertical sections displaying anomalies in Vp and Vs. High-velocity changes are depicted in blue, while low-velocity changes are represented by red in the visualization. The Vp/Vs values are displayed as absolute values in the visualization.
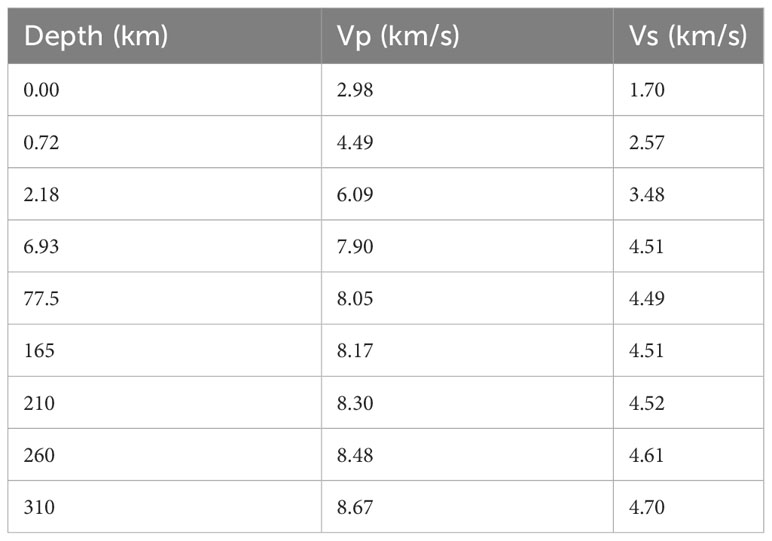
Table 2 Initial 1-D velocity model used in this study. The velocity corresponds to the value at the top of each layer.
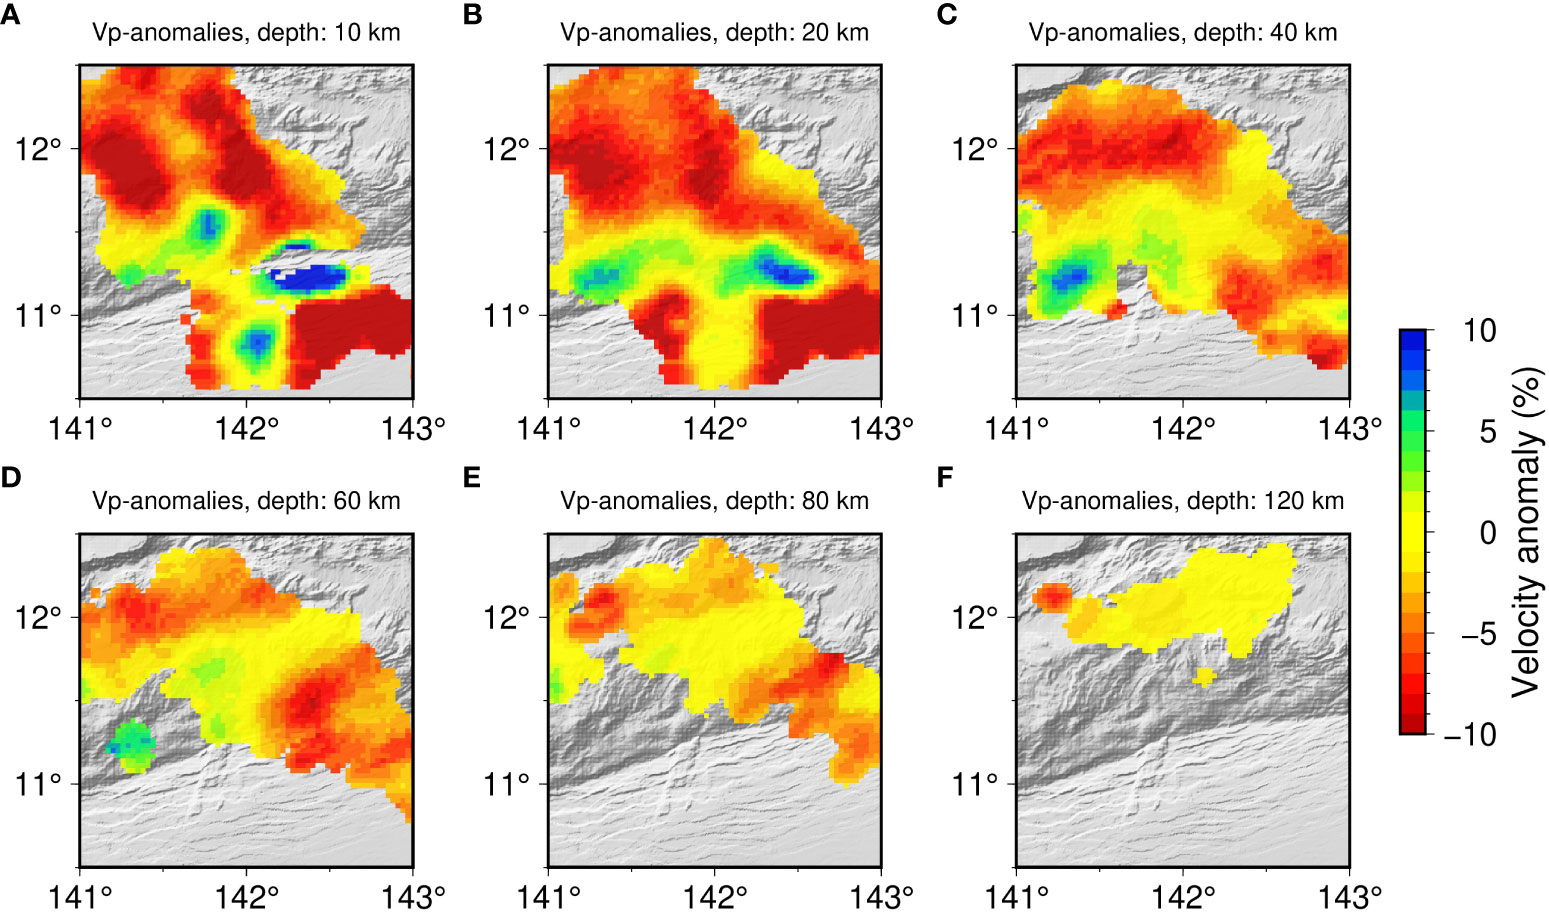
Figure 6 The distributions of the resulting anomalies of Vp at 10 km, 20 km, 40 km, 60 km, 80 km, and 120 km depth levels.
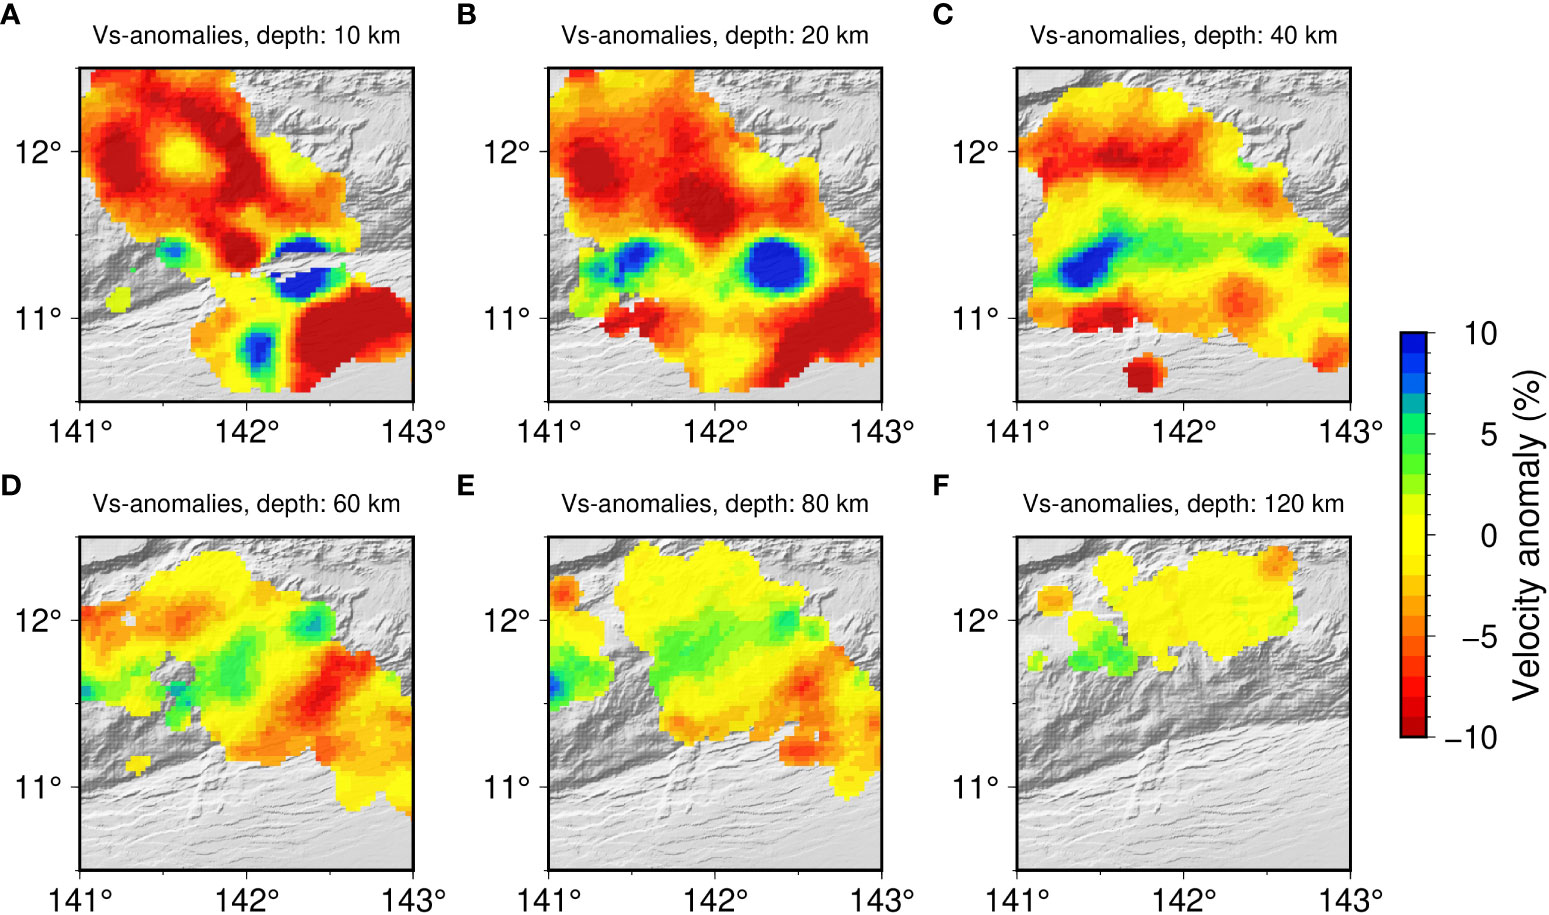
Figure 7 The distributions of the resulting anomalies of Vs at 10 km, 20 km, 40 km, 60 km, 80 km, and 120 km depth levels.
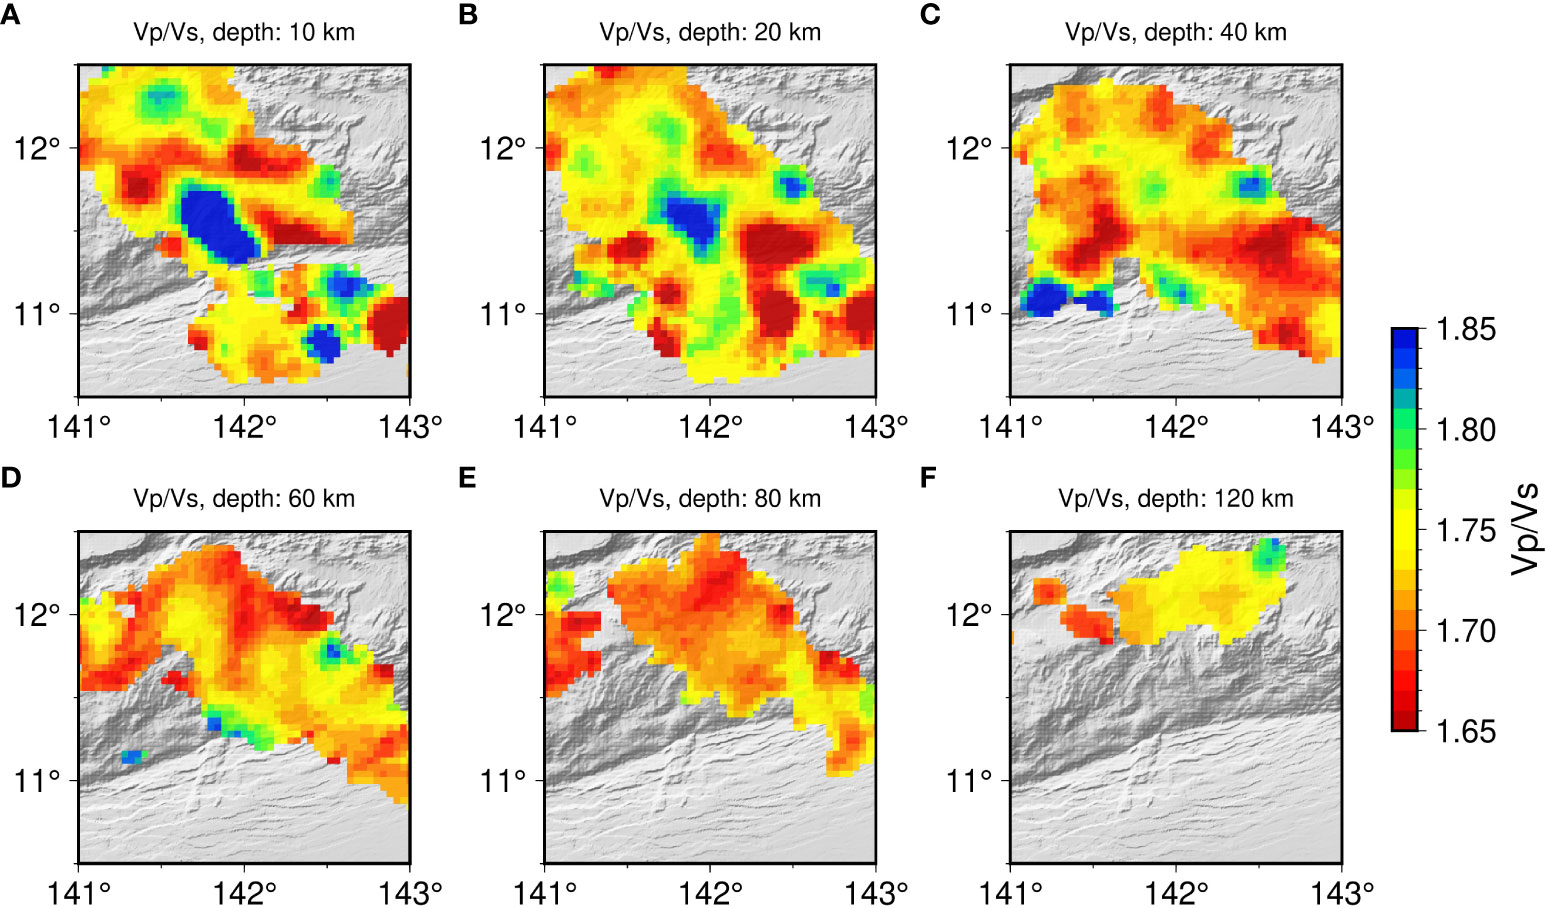
Figure 8 The distributions of the resulting anomalies of Vp/Vs ratio at 10 km, 20 km, 40 km, 60 km, 80 km, and 120 km depth levels.
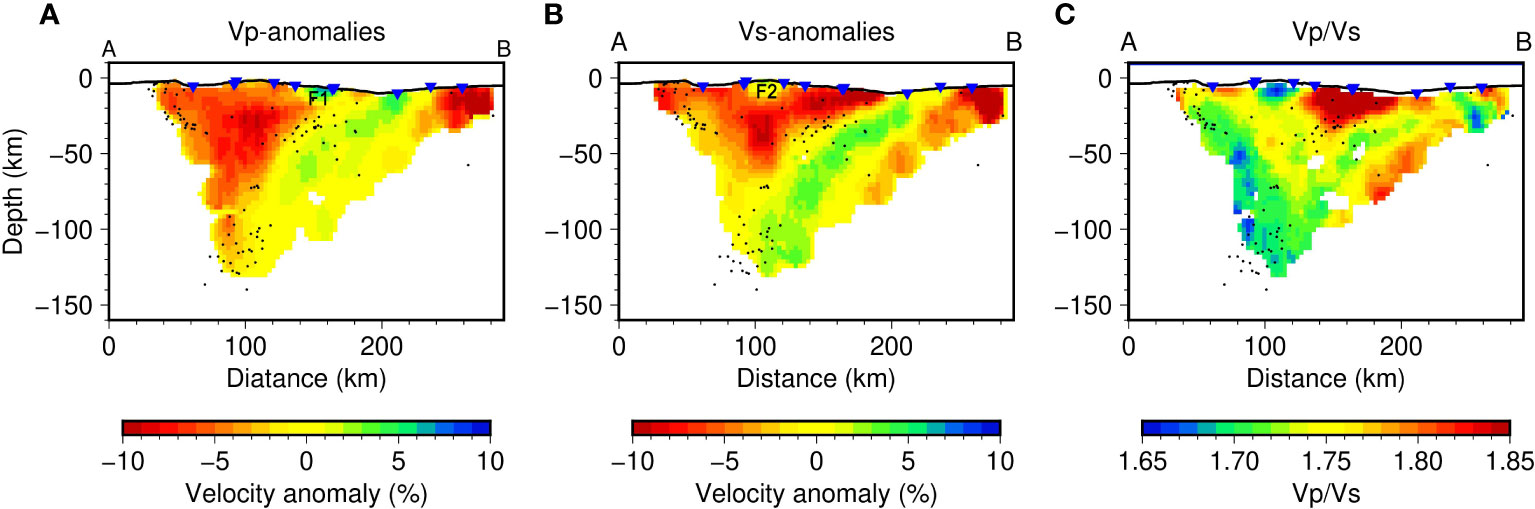
Figure 9 The distributions of the resulting anomalies of Vp, Vs, and Vp/Vs ratio in vertical section AB with the location shown in Figure 1. The black dots indicate the projections of seismic events located at distances of less than 50 km from the profile.
Both the Vp and Vs results reveal a fast-subducting slab in the southern Mariana subduction zone, accompanied by slower velocity in the mantle wedge. The imaging results provide clear evidence of a continuous subducting slab, characterized by velocity anomalies ranging from 2% to 6% compared to the average regional model. Notably, a significant velocity anomaly of 6% is detected in the Vp results at a depth of 20 kilometers within the forearc region, situated directly above the subducting slab. The anomaly denoted as F1 in Figure 9, is observed on cross section AB but does not appear in the Vs results. A second high-velocity feature (F2) is identified at depths shallower than 20 km beneath the central region of the forearc. There are distinct slow velocity anomalies detected in the mantle wedge beneath the SWMR, the WMR, and the forearc mantle. The most significant velocity anomaly, reaching a maximum of –9%, is situated at a depth of 40–60 km beneath the central region of the forearc.
Figure 9C illustrates the most prominent aspect of the Vp/Vs structure, which is the presence of remarkably high Vp/Vs ratios within the outer forearc region. These ratios exceed 1.85 and persist from the uppermost mantle down to 50 km depth. High Vp/Vs ratios of 1.8 are also present beneath the central region of forearc block at depths of 40–60 km. The central region of the forearc exhibits an exceptionally low Vp/Vs ratio at shallow depths. Low Vp/Vs ratio also occur in the slab.
6 Discussion
6.1 The subducting slab geometry
The geometry of the subducting slab is a fundamental aspect in the study of subduction zones, which could be delineated by seismicity in the Wadati-Benioff zone (WBZ) (Katsumata & Sykes, 1969; Nakamura et al., 1998; Peacock, 2001; Shiobara et al., 2010; Zhu et al., 2019). However, Seismicity in the WBZ has limitations in fully characterizing subducting slabs due to limited spatial coverage. Our tomography results now offer enhanced constraints on the geometry and properties of the subducting slab. The subducting slab has been accurately identified through the identification of regions with high velocities and a low Vp/Vs ratio. Our findings reveal an average dip of 45° at depths ranging from 50 to 100 km, indicating a slightly steeper dip compared to the Slab2.0 model at the same depth (Hayes et al., 2018). Notably, earthquakes are also observed in this area, down to a depth of 130 km, coinciding with the presence of the slab. However, it is important to acknowledge that our model lacks precise resolution below 60 km depth.
The southern and central regions of the Mariana subduction zone exhibit differences in the present-day geometry of the subducting slab. Beneath the northern region, the subducting slab extends into the lower mantle. Between depths of 100–200 km, the subducting slab exhibits a notable curvature, resulting in a distinct contrast between a predominantly vertical lower portion and a more gently inclined upper segment, which is inclined at approximately 16°–17° within the depth range of 50–100 km (Gvirtzman and Stern, 2004). In contrast, the slab underneath the southern region is relatively shorter (~100–240 km depth) (Zhu et al., 2019).
A strong correlation exists between the dip of the subducting slab and the strain experienced by the upper plate (Lallemand et al., 2005). Subducting at a smaller slab dip angle is believed to significantly help transfer compressive stress to the upper plate by creating a larger contact area between the two plates (Ruff and Kanamori, 1980; Lallemand et al., 2005). Our results confirm that the subducting slab is steeper in the southern Mariana (~45°) compared to the central Mariana (∼16°–17°) at depth of 50–100 km. This observation suggests a relatively lower compressional stress in the southern Mariana and indicates a possible decrease in the extent of the plate coupling zone or a weakening of the coupling between the plates (Gvirtzman and Stern, 2004; Zhu et al., 2019).
6.2 Forearc Structure and Serpentinization
A distinct and prominent low-velocity feature is detected within the outer forearc region, specifically at depths less than 50 km. This anomaly is characterized by an 8% decrease in Vs velocity and elevated Vp/Vs ratios exceeding 1.85. This distinct low-velocity feature is primarily confined to mantle of the forearc and is positioned just above the interface where the subducting slab is located. The occurrence of low seismic velocities and high Vp/Vs ratios is frequently attributed to the serpentinization process in the forearc mantle (Hyndman and Peacock, 2003). Large Vp/Vs ratios serve as a diagnostic characteristic of serpentinized peridotite due to the significantly lower shear modulus of serpentine compared to the bulk modulus (Christensen, 1996). By considering the experimental correlation between seismic velocities and the degree of serpentinization (Ji et al., 2013) (Vp/Vs = 1.78 + 0.31Φ, where Φ is the serpentine volume fraction), Vp/Vs between 1.85 and 1.9 are likely related to serpentinization of 22–38%, corresponding to water content of 3–5% (Carlson and Miller, 2003). The serpentinization degree in the forearc of the southernmost Mariana region is comparatively lower when compared to the central Mariana region (30–60% serpentinization, corresponding to water content of 4–6%) (Barklage et al., 2015). This observation is reinforced by the abundance of serpentine mud seamounts in the central Mariana region, contrasting with the lack of such features in the southernmost Mariana region. (Ohara et al., 2012).
Another intriguing aspect of the forearc is the notable occurrence of elevated velocities in the outer forearc region, specifically at depths shallower than 20 km. Within the mantle wedge, this region exhibits some of the most elevated velocities, displaying a 6% anomaly in Vp. High velocity in the forearc indicates a cold environment and a lack of serpentinized peridotite. Similar feature is observed in central Mariana (Barklage et al., 2015). As a result of the subducting plate detaching from the forearc, this region is interpreted as the cold stagnant part of the mantle wedge (Wada et al., 2011). However, this feature is not clearly discernible in the Vs results.
6.3 Magma production region
Concentrated low-velocity feature is detected beneath the forearc block, spanning from the uppermost mantle to 80 km depth. Low-velocity feature of this type have been recorded at comparable depths and locations underneath island arcs across different regions all over the world (Zhao, 2001; Syracuse et al., 2008; Barklage et al., 2015). The most prominent anomaly is found around 50 km depth, exhibiting a maximum velocity anomaly of -9% and a Vp/Vs ratio of 1.81. The observed values align with the average of 1.85 documented in numerous tomographic studies of island arcs in different regions worldwide (Wiens et al., 2008). The anomaly delineates the region in the mantle where magma is produced, which correlates with the reduced seismic velocity caused by the presence of partial melt. Therefore, we consider the forearc block to be more akin of an arc. However, there is limited dehydration of the subducting plate, meaning a lack of sufficient water supply, the magma may not be able to ascend to the surface and erupt. We image a 7% velocity anomaly beneath the SWMR and Vp/Vs of 1.8. The anomaly outlines the area below the spreading center where basaltic melts are created through the process of decompression melting.
7 Conclusion
We have generated tomographic pictures of Vp, Vs, and the Vp/Vs ratio under the southernmost Mariana trench. These three-dimensional visualizations of the seismic structure offer valuable understanding about the mechanisms happening in the subduction zone. The images contribute to understanding the water cycle associated with subduction zones. They provide constraints on processes ranging from the release of fluids into the mantle wedge to the formation of water-rich magmas. The outer Mariana forearc is marked by a low P-wave and S-wave velocities and a high Vp/Vs ratio, suggesting a significant volume of water has been transported into the forearc mantle through the serpentinization of 22-38% of mantle minerals. Furthermore, we have visualized a distinct low-velocity anomaly, which symbolizes the region beneath the forearc block where melt generation takes place.
Additionally, the tomography results provide improved constraints on the geometry and characteristics of the subducting slab. The subducting slab is steeper in the southernmost Mariana compared to the central Mariana. This finding implies a comparatively lower level of compressional stress in the southern Mariana region.
Data availability statement
The datasets presented in this study can be found in online repositories. The names of the repository/repositories and accession number(s) can be found below: https://doi.org/10.6084/m9.figshare.18266960.v2.
Author contributions
DL: Conceptualization, Methodology, Software, Visualization, Writing – original draft. CC: Conceptualization, Funding acquisition, Supervision, Writing – review & editing. SW: Funding acquisition, Project administration, Supervision, Writing – review & editing.
Funding
The author(s) declare financial support was received for the research, authorship, and/or publication of this article. This work was funded by the National Natural Science Foundation of China (Grant No. 92058213), the Major Science and Technology Research Project of Sanya Yazhou Bay Science and Technology City (Grant No. SKJC-2021-01-001), the National Key Research and Development Program of China (Grant No. 2022YFC2806003).
Acknowledgments
We are very grateful to the pilots, the captain, and the crews of the R/V Shiyan 3 for the deployment and recovery of the OBS. All figures in this study were made by using the Generic Mapping Tools [GMT, (Wessel and Smith, 1991)].
Conflict of interest
The authors declare that the research was conducted in the absence of any commercial or financial relationships that could be construed as a potential conflict of interest.
The author(s) declared that they were an editorial board member of Frontiers, at the time of submission. This had no impact on the peer review process and the final decision.
Publisher’s note
All claims expressed in this article are solely those of the authors and do not necessarily represent those of their affiliated organizations, or those of the publisher, the editors and the reviewers. Any product that may be evaluated in this article, or claim that may be made by its manufacturer, is not guaranteed or endorsed by the publisher.
Supplementary material
The Supplementary Material for this article can be found online at: https://www.frontiersin.org/articles/10.3389/fmars.2023.1284881/full#supplementary-material
References
Barklage M., Wiens D. A., Conder J. A., Pozgay S., Shiobara H., Sugioka H. (2015). P and Svelocity tomography of the Mariana subduction system from a combined land-sea seismic deployment. Geochemistry Geophysics Geosystems 16 (3), 681–704. doi: 10.1002/2014gc005627
Cai C., Wiens D. A., Shen W., Eimer M. (2018). Water input into the Mariana subduction zone estimated from ocean-bottom seismic data. Nature 563 (7731), 389–392. doi: 10.1038/s41586-018-0655-4
Carlson R. L., Miller D. J. (2003). Mantle wedge water contents estimated from seismic velocities in partially serpentinized peridotites. Geophysical Res. Lett. 30 (5), 1250. doi: 10.1029/2002gl016600
Chen H., Yang H., Zhu G., Xu M., Lin J., You Q. (2022). Deep outer-rise faults in the Southern Mariana subduction zone indicated by a machine-learning-based high-resolution earthquake catalog. Geophysical Res. Lett. 49 (12), e2022GL097779. doi: 10.1029/2022gl097779
Christensen N. I. (1996). Poisson's ratio and crustal seismology. J. Geophysical Research: Solid Earth 101 (B2), 3139–3156. doi: 10.1029/95jb03446
Eberhart-Phillips D. (1986). Three-dimensional velocity structure in northern California Coast Ranges from inversion of local earthquake arrival times. Bull. Seismological Soc. America 76 (4), 1025–1052. doi: 10.1785/bssa0760041025
Fan J., Zheng H., Zhao D., Dong D., Bai Y., Li C., et al. (2022). Seismic structure of the Caroline plateau-yap trench collision zone. Geophysical Res. Lett. 49 (6), e2022GL098017. doi: 10.1029/2022GL098017
Fryer P. (1995). “Geology of the mariana trough,” in Backarc Basins: Tectonics and Magmatism. Ed. Taylor B. (Boston, MA: Springer US), 237–279.
Fryer P., Lockwood J. P., Becker N., Phipps S., Todd C. S. (2000). “Significance of serpentine mud volcanism in convergent margins,” in Ophiolites and oceanic crust: new insights from field studies and the Ocean Drilling Program, vol. 349 . Eds. Dilek Y., Moores E. M., Elthon D., Nicolas A. (Boulder, CO, US: Geological Society of America), 35–51.
Fryer P., Wheat C. G., Williams T., Kelley C., Johnson K., Ryan J., et al. (2020). Mariana serpentinite mud volcanism exhumes subducted seamount materials: implications for the origin of life. Philos. Trans. A Math Phys. Eng. Sci. 378 (2165), 20180425. doi: 10.1098/rsta.2018.0425
Gvirtzman Z., Stern R. J. (2004). Bathymetry of Mariana trench-arc system and formation of the Challenger Deep as a consequence of weak plate coupling. Tectonics 23 (2), TC2011 TC2011. doi: 10.1029/2003tc001581
Hayes G. P., Moore G. L., Portner D. E., Hearne M., Flamme H., Furtney M., et al. (2018). Slab2, a comprehensive subduction zone geometry model. Science 362 (6410), 58–61. doi: 10.1126/science.aat4723
He E., Qiu X., Chen C., Wang Y., Xu M., Zhao M., et al. (2023). Deep crustal structure across the Challenger Deep: Tectonic deformation and strongly serpentinized layer. Gondwana Res. 118, 135–152. doi: 10.1016/j.gr.2023.02.020
Husen S., Quintero R., Kissling E., Hacker B. (2003). Subduction-zone structure and magmatic processes beneath Costa Rica constrained by local earthquake tomography and petrological modelling. Geophysical J. Int. 155 (1), 11–32. doi: 10.1046/j.1365-246X.2003.01984.x
Hyndman R. D., Peacock S. M. (2003). Serpentinization of the forearc mantle. Earth Planetary Sci. Lett. 212 (3-4), 417–432. doi: 10.1016/s0012-821x(03)00263-2
Ji S., Li A., Wang Q., Long C., Wang H., Marcotte D., et al. (2013). Seismic velocities, anisotropy, and shear-wave splitting of antigorite serpentinites and tectonic implications for subduction zones. J. Geophysical Research: Solid Earth 118 (3), 1015–1037. doi: 10.1002/jgrb.50110
Kato T., Beavan J., Matsushima T., Kotake Y., Camacho J. T., Nakao S. (2003). Geodetic evidence of back-arc spreading in the Mariana Trough. Geophysical Res. Lett. 30 (12), 1625. doi: 10.1029/2002gl016757
Katsumata M., Sykes L. R. (1969). Seismicity and tectonics of the western Pacific: Izu-Mariana-Caroline and Ryukyu-Taiwan regions. J. Geophysical Res. (1896-1977) 74 (25), 5923–5948. doi: 10.1029/JB074i025p05923
Koulakov I. (2009). LOTOS code for local earthquake tomographic inversion: benchmarks for testing tomographic algorithms. Bull. Seismological Soc. America 99 (1), 194–214. doi: 10.1785/0120080013
Koulakov I., D'Auria L., Prudencio J., Cabrera-Pérez I., Barrancos J., Padilla G. D., et al. (2023). Local earthquake seismic tomography reveals the link between crustal structure and volcanism in Tenerife (Canary islands). J. Geophysical Research: Solid Earth 128 (3), e2022JB025798. doi: 10.1029/2022JB025798
Lallemand S., Heuret A., Boutelier D. (2005). On the relationships between slab dip, back-arc stress, upper plate absolute motion, and crustal nature in subduction zones. Geochemistry Geophysics Geosystems 6 (9), Q09006. doi: 10.1029/2005gc000917
Martinez F., Stern R. J., Kelley K. A., Ohara Y., Sleeper J. D., Ribeiro J. M., et al. (2018). Diffuse extension of the Southern Mariana margin. J. Geophysical Research: Solid Earth 123 (1), 892–916. doi: 10.1002/2017jb014684
McCabe R., Uyeda S. (1983). Hypothetical model for the bending of the Mariana Arc. Washington DC Am. Geophysical Union Geophysical Monograph Ser. 27, 281–293. doi: 10.1029/GM027p0281
Miller M. S., Gorbatov A., Kennett B. L. N. (2006). Three-dimensional visualization of a near-vertical slab tear beneath the southern Mariana arc. Geochemistry Geophysics Geosystems 7 (6), Q06012. doi: 10.1029/2005gc001110
Nakajima J., Matsuzawa T., Hasegawa A., Zhao D. (2001). Three-dimensional structure of Vp, Vs, and Vp/Vs beneath northeastern Japan: Implications for arc magmatism and fluids. J. Geophysical Research: Solid Earth 106 (B10), 21843–21857. doi: 10.1029/2000JB000008
Nakamura M., Ando M., Ohkura T. (1998). Fine structure of deep Wadati–Benioff zone in the Izu–Bonin region estimated from S-to-P converted phase. Phys. Earth Planetary Interiors 106 (1), 63–74. doi: 10.1016/S0031-9201(97)00109-X
Ohara Y., Reagan M. K., Fujikura K., Watanabe H., Michibayashi K., Ishii T., et al. (2012). A serpentinite-hosted ecosystem in the Southern Mariana Forearc. Proc. Natl. Acad. Sci. 109 (8), 2831–2835. doi: 10.1073/pnas.1112005109
Paige C. C., Saunders M. A. (1982). LSQR: an algorithm for sparse linear equations and sparse least squares. ACM Trans. Math. Software 8 (1), 43–71. doi: 10.1145/355984.355989
Peacock S. M. (2001). Are the lower planes of double seismic zones caused by serpentine dehydration in subducting oceanic mantle? Geology 29 (4), 299–302. doi: 10.1130/0091-7613(2001)029<0299:Atlpod>2.0.Co;2
Pozgay S. H., Wiens D. A., Conder J. A., Shiobara H., Sugioka H. (2007). Complex mantle flow in the Mariana subduction system: evidence from shear wave splitting. Geophysical J. Int. 170 (1), 371–386. doi: 10.1111/j.1365-246X.2007.03433.x
Pozgay S. H., Wiens D. A., Conder J. A., Shiobara H., Sugioka H. (2009). Seismic attenuation tomography of the Mariana subduction system: Implications for thermal structure, volatile distribution, and slow spreading dynamics. Geochemistry Geophysics Geosystems 10 (4), Q04X05. doi: 10.1029/2008gc002313
Pyle M. L., Wiens D. A., Weeraratne D. S., Shore P. J., Shiobara H., Sugioka H. (2010). Shear velocity structure of the Mariana mantle wedge from Rayleigh wave phase velocities. J. Geophysical Res. 115 (B11), B11304. doi: 10.1029/2009jb006976
Raoof J., Mukhopadhyay S., Koulakov I., Kayal J. R. (2017). 3-D seismic tomography of the lithosphere and its geodynamic implications beneath the northeast India region. Tectonics 36 (5), 962–980. doi: 10.1002/2016TC004375
Ribeiro J. M., Ishizuka O., Lee C.-T. A., Girard G. (2020). Evolution and maturation of the nascent Mariana arc. Earth Planetary Sci. Lett. 530, 115912. doi: 10.1016/j.epsl.2019.115912
Ruff L., Kanamori H. (1980). Seismicity and the subduction process. Phys. Earth Planetary Interiors 23 (3), 240–252. doi: 10.1016/0031-9201(80)90117-X
Shiobara H., Sugioka H., Mochizuki K., Oki S., Kanazawa T., Fukao Y., et al. (2010). Double seismic zone in the North Mariana region revealed by long-term ocean bottom array observation. Geophysical J. Int. 183 (3), 1455–1469. doi: 10.1111/j.1365-246X.2010.04799.x
Stern R. J., Fouch M. J., Klemperer S. L. (2003). An overview of the Izu-Bonin-Mariana subduction factory. Geophysical Monograph Ser. 138, 175–222. doi: 10.1029/138gm10
Syracuse E. M., Abers G. A., Fischer K., MacKenzie L., Rychert C., Protti M., et al. (2008). Seismic tomography and earthquake locations in the Nicaraguan and Costa Rican upper mantle. Geochemistry Geophysics Geosystems 9 (7), Q07S08. doi: 10.1029/2008GC001963
Takahashi N., Kodaira S., Klemperer S. L., Tatsumi Y., Kaneda Y., Suyehiro K. (2007). Crustal structure and evolution of the Mariana intra-oceanic island arc. Geology 35 (3), 203–206. doi: 10.1130/g23212a.1
Takahashi N., Kodaira S., Tatsumi Y., Kaneda Y., Suyehiro K. (2008). Structure and growth of the Izu-Bonin-Mariana arc crust: 1. Seismic constraint on crust and mantle structure of the Mariana arc–back-arc system. J. Geophysical Res. 113 (B1), B01104. doi: 10.1029/2007jb005120
Um J., Thurber C. (1987). A fast algorithm for two-point seismic ray tracing. Bull. Seismological Soc. America 77 (3), 972–986. doi: 10.1785/BSSA0770030972
Wada I., Rychert C. A., Wang K. (2011). Sharp thermal transition in the forearc mantle wedge as a consequence of nonlinear mantle wedge flow. Geophysical Res. Lett. 38 (13), L13308. doi: 10.1029/2011gl047705
Wan K., Lin J., Xia S., Sun J., Xu M., Yang H., et al. (2019). Deep seismic structure across the Southernmost Mariana trench: implications for arc rifting and plate hydration. J. Geophysical Research: Solid Earth 124 (5), 4710–4727. doi: 10.1029/2018jb017080
Wessel P., Smith W. H. F. (1991). Free software helps map and display data. Eos Trans. Am. Geophysical Union 72 (41), 441–446. doi: 10.1029/90EO00319
Wiens D. A., Conder J. A., Faul U. H. (2008). The seismic structure and dynamics of the mantle wedge. Annu. Rev. Earth Planetary Sci. 36 (1), 421–455. doi: 10.1146/annurev.earth.33.092203.122633
Zhang J., Zhang G., Wu J. (2023). Geochemical and geochronological constraints on the tectonic and magmatic evolution of the southwestern Mariana subduction zone. Deep Sea Res. Part I: Oceanographic Res. Papers 197, 104039. doi: 10.1016/j.dsr.2023.104039
Zhao D. (2001). Seismological structure of subduction zones and its implications for arc magmatism and dynamics. Phys. Earth Planetary Interiors 127 (1), 197–214. doi: 10.1016/S0031-9201(01)00228-X
Zhao D. (2012). Tomography and dynamics of western-pacific subduction zones. Monogr. Environment Earth Planets 1 (1), 1–70. doi: 10.5047/meep.2012.00101.0001
Zhu G., Wiens D. A., Yang H., Lin J., Xu M., You Q. (2021). Upper mantle hydration indicated by decreased shear velocity near the Southern Mariana trench from Rayleigh wave tomography. Geophysical Res. Lett. 48 (15), e2021GL093309. doi: 10.1029/2021gl093309
Keywords: southernmost Mariana Trench, seismic tomography, subduction zone, mantle wedge, ocean bottom seismometer
Citation: Li D, Chen C and Wu S (2023) Local earthquake seismic tomography of the Southernmost Mariana subduction zone. Front. Mar. Sci. 10:1284881. doi: 10.3389/fmars.2023.1284881
Received: 29 August 2023; Accepted: 10 November 2023;
Published: 27 November 2023.
Edited by:
Nan Wu, Tongji University, ChinaReviewed by:
Hiroyuki Matsumoto, Japan Agency for Marine-Earth Science and Technology (JAMSTEC), JapanPınar Büyükakpınar, National Institute of Geophysics and Volcanology, Italy
Copyright © 2023 Li, Chen and Wu. This is an open-access article distributed under the terms of the Creative Commons Attribution License (CC BY). The use, distribution or reproduction in other forums is permitted, provided the original author(s) and the copyright owner(s) are credited and that the original publication in this journal is cited, in accordance with accepted academic practice. No use, distribution or reproduction is permitted which does not comply with these terms.
*Correspondence: Chuanxu Chen, Y2hlbmN4QGlkc3NlLmFjLmNu