
95% of researchers rate our articles as excellent or good
Learn more about the work of our research integrity team to safeguard the quality of each article we publish.
Find out more
ORIGINAL RESEARCH article
Front. Mar. Sci. , 27 September 2023
Sec. Marine Biogeochemistry
Volume 10 - 2023 | https://doi.org/10.3389/fmars.2023.1283061
This article is part of the Research Topic Broadband Seafloor Sediment Acoustic Property and Multi-Parameter Geoacoustic Model View all 11 articles
 Jing Li1,2,3
 Yanliang Pei1,2,3Chenguang Liu1,2,3Liancheng Zhang4
 Xiaohu Luo1,2,3
 Kai Liu1,2,3*Weilu Li5
Deep-towed multichannel seismic exploration technology has better applicability and more development potential when utilized to invert the geoacoustic properties of deep-sea sediment. The accurate geometric inversion results of the receiving array are crucial for fine submarine sediment imaging and physical property parameter inversion based on deep-towed multichannel seismic data. Thus, this study presents an array geometry inversion method suitable for complex seafloors to address the challenge of precise source-receiver positioning. The objective function of the deep-towed seismic array geometry inversion is built using the shortest path algorithm according to the traveltimes of direct waves and seafloor reflections, and the particle swarm optimization algorithm is used to achieve high-precision inversion of the source-receiver position. The results showed that the proposed method is shown to have incomparable applicability and effectiveness in obtaining exact source-receiver positions for deep-towed multichannel seismic systems. Regardless of the complexity of the seabed morphology, seismic image processing techniques using the source-receiver position data obtained by the suggested method produce fine seismic imaging profiles that clearly and accurately reflect the structural characteristics of sediments. These findings provide insights for the accuracy and reliability of the proposed geometric shape inversion method for deep-towed seismic arrays in practical applications to meet the requirements of near-bottom acoustic detection for fine imaging of deep-sea seabed strata and precise inversion of geoacoustic parameters.
A deep-towed multichannel seismic system is a novel deep-sea near-bottom acoustic detection technology that drags an artificial high-frequency seismic source and seismic receiving streamer placed near the seabed to acquire seismic data (Breitzke and Bialas, 2003; Gettrust et al., 2004). This system has better lateral and vertical resolution, better signal-to-noise ratio (SNR), and deeper stratigraphic detection capacity than traditional high-resolution multichannel seismic systems. Moreover, this system has better applicability and more development potential when utilized to invert the geoacoustic properties of deep-sea sediment.
Researchers in many countries worldwide have conducted research on deep-towed seismic exploration technology to improve their deep-sea near-bottom investigation capabilities and have successfully developed representative deep-towed multichannel seismic systems. In the 1980s, the United States Naval Research Laboratory (NRL) designed and produced the deep-towed acoustic geophysical system (DTAGS) (Gettrust et al., 1988; Rowe and Gettrust, 1993; Wood et al., 2003), which consists of a Helmholtz resonator source (220-820 Hz) and a 622 m hydrophone cable. At the beginning of this century, the French Research Institute for Exploitation of the Sea (Ifremer) developed the SYstème SIsmique Fond de mer (SYSIF) (Marsset et al., 2010; Marsset et al., 2014), which includes two sets of Helmholtz resonators with different frequency bands, 580-2200 Hz and 220-1050 Hz, and a seismic streamer composed of 52 digital hydrophones arranged with a channel spacing of 2 m. Recently, researchers at the First Institute of Oceanography of Ministry of Natural Resources (FIO, MNR) developed the Kuiyang-ST2000 (Pei et al., 2022), which includes a deep-towed sparker source (150-1200 Hz) and a 48-channel digital seismic streamer. Moreover, the Research and Development Partnership for Next Generation Technology of Marine Resources Survey (J-MARES) developed the deep-towed autonomous cable seismic (ACS) system (Hutapea et al., 2020). The seismic source in this system is based on the iXBlue Echos 1500 subbottom profiler (700-2250 Hz), and the data acquisition device utilizes a 32-channel seismic receiving cable with a channel spacing of 5 m. In addition, deep-towed multichannel seismic systems are usually equipped with ultrashort baselines (USBLs), depth transducers, altimeters and attitude sensors to monitor the attitude and positioning of the systems in real time.
Given the unparalleled advantages of deep-towed seismic data acquisition systems, such as their high resolution and SNR, deep-towed multichannel seismic exploration technology has played an increasingly important role in deep-sea mineral resource surveys, marine engineering exploration, and deep-sea geohazard evaluation and has achieved remarkable application results (Talukder et al., 2007; Ker et al., 2014; Riboulot et al., 2018). For example, Marsset et al. (2010) confirmed that SYSIF can effectively optimize the imaging quality of submarine stratigraphic structures such as pockmarks, carbonate mounds, submarine landslides and underground faults and is thus very suitable for deep-sea geohazard studies. Sultan et al. (2014) utilized high-resolution seismic imaging profiles obtained by SYSIF to assess pockmark formation and evolution in deep water in Nigeria; in addition, they combined their results with seafloor drill rig data, in situ geotechnical measurements, and pore water analyses. Colin et al. (2020a); Colin et al. (2020b) developed a fine velocity model of gas hydrate-bearing sedimentary layers using SYSIF data acquired in the western Black Sea, revealing an anomalous free gas distribution, which might suggest the ongoing migration of the base of the gas hydrate stability zone (GHSZ). Chapman et al. (2002) and He et al. (2009) employed high-resolution DTAGS data to finely image the structure of a hydrate-related cold vent offshore Vancouver Island, assessed the amount of gas hydrate and underlying free gas, and determined the associated seismic velocities, which were used to estimate the gas hydrate concentration. Wood et al. (2008) studied the gas and gas hydrate distributions near seafloor seeps in Mississippi Canyon in the northern Gulf of Mexico using deep-towed high-resolution seismic imaging technology based on DTAGS. Hutapea et al. (2020) used high-resolution ACS data acquired in the Joetsu Basin in Niigata, Japan, and seismic attribute analysis technology to effectively identify natural gas hydrates, free gas and gas chimneys. Pei et al. (2023) utilized Kuiyang-ST2000 to conduct natural gas hydrate surveys in the Qiongdongnan and Shenhu areas of the South China Sea and finely imaged the sedimentary and structural features of geohazards related to natural gas hydrates.
Ultrahigh-resolution seismic detection technology has higher requirements for the source-receiver positioning accuracy. Therefore, accurate geometric inversion results of the receiving array are crucial for fine submarine sediment imaging and physical property parameter inversion based on deep-towed multichannel seismic data. In recent years, to address this issue, scholars have proposed a variety of array geometry inversion methods. Rowe and Gettrust (1993) used the real-time depth measurement values obtained by four engineering nodes configured at the source of the DTAGS and the 28th, 38th and 48th channels of the receiving cable and directly calculated the positions of the receivers with a linear interpolation model. Because the linear interpolation result is not sufficiently accurate, Walia and Hannay (1999) evaluated the depths of the source and receivers by introducing the traveltime of the sea-surface reflection to constrain the nonlinear array geometry. On the basis of previous studies, He et al. (2009) constrained the inversion according to engineering node depth measurements and the joint traveltime of the direct wave and sea-surface reflection and used a genetic algorithm and polynomial interpolation to determine the globally optimized source-receiver positioning information. Each digital hydrophone in the SYSIF receiving array is equipped with an attitude sensor; hence, Marsset et al. (2014); Marsset et al. (2018) reconstructed the array geometry according to the attitude sensor pitch angle measurement values. Considering the impact of pitch angle measurement errors and error accumulation on the accuracy of array geometry inversion, Colin et al. (2020a) improved the accuracy of array geometry reconstruction with the pitch angles acquired by the attitude sensors as the reference initial values and the traveltimes of the direct wave and seafloor reflection as constraints to optimize the inversion of the pitch angle parameters. Pei et al. (2023) directly calculated the position of the receivers using the traveltime of the direct wave and sea-surface reflection and corrected the array geometry results with a polynomial curve fitting method in accordance with the deep-water towed morphological characteristics of Kuiyang-ST2000 obtained by dynamic simulations (Zhu et al., 2020).
In summary, the existing technology mainly depends on the attitude sensors in the receiving array and the seismic traveltime; hence, the attitude measurement error and the traveltime accuracy are the main factors leading to inaccurate source-receiver positions in deep-towed seismic arrays. According to analyses of deep-towed seismic data, the traveltime accuracy of the seafloor reflection is better than that of the sea-surface reflection due to the stronger energy, higher SNR and better waveform consistency of the seafloor reflection. However, because of the high complexity of the seafloor, previous studies on seafloor reflection traveltime positioning methods are generally best suited for gentle seabed working environments with small slopes. Moreover, influencing factor analyses of array geometry inversion methods are lacking. To address this issue, we propose a robust array geometry inversion method for arbitrarily complex seafloors. By introducing the traveltimes of direct waves and seafloor reflections, we establish an objective function for array geometry inversion that is applicable to complicated seabeds and apply a nonlinear optimization algorithm to realize high-precision inversion of the geometric representation parameters and acquire highly accurate and reliable source-receiver positioning results. Furthermore, the accuracy and reliability of the proposed method are evaluated by means of Monte Carlo uncertainty analyses through numerical experiments, focusing on factors such as the seismic traveltime, seawater velocity and seabed morphology. Additionally, the applicability of field data processing with Kuiyang-ST2000 proves that this method can efficiently address the issue of precise source-receiver positioning with deep-towed multichannel seismic systems while ensuring that the SNR and resolution of this type of seismic data meet the requirements of deep-sea fine stratigraphic imaging and geoacoustic parameter inversion.
To enhance the stability of the objective function for array geometry inversion with deep-towed multichannel seismic systems while accounting for the constraints of the inherent properties of deep-towed seismic streamers, we characterize the relative position relationship between the source and receivers using the known channel spacing and the pitch angle parameters to be obtained. In the solution of the objective function, only the pitch angle parameters need to be optimized to reconstruct the geometric shape of the deep-towed seismic array.
Because the deep-sea current velocity is smaller than the towing speed of the deep-towed multichannel seismic system, no significant feather angles occur in the deep-towed seismic array during deep water operations. As shown in Figure 1, taking the Kuiyang-ST2000 engineering design scheme as an example, when only two dimensions are considered, the receiving cable can be divided into multiple segments according to the offset and channel spacing, and the pitch angle is considered the geometric shape representation parameter. Based on the length and pitch angle of each segment, the horizontal and vertical offsets of each receiver in the deep-towed multichannel seismic streamer relative to the source position can be characterized as follows:
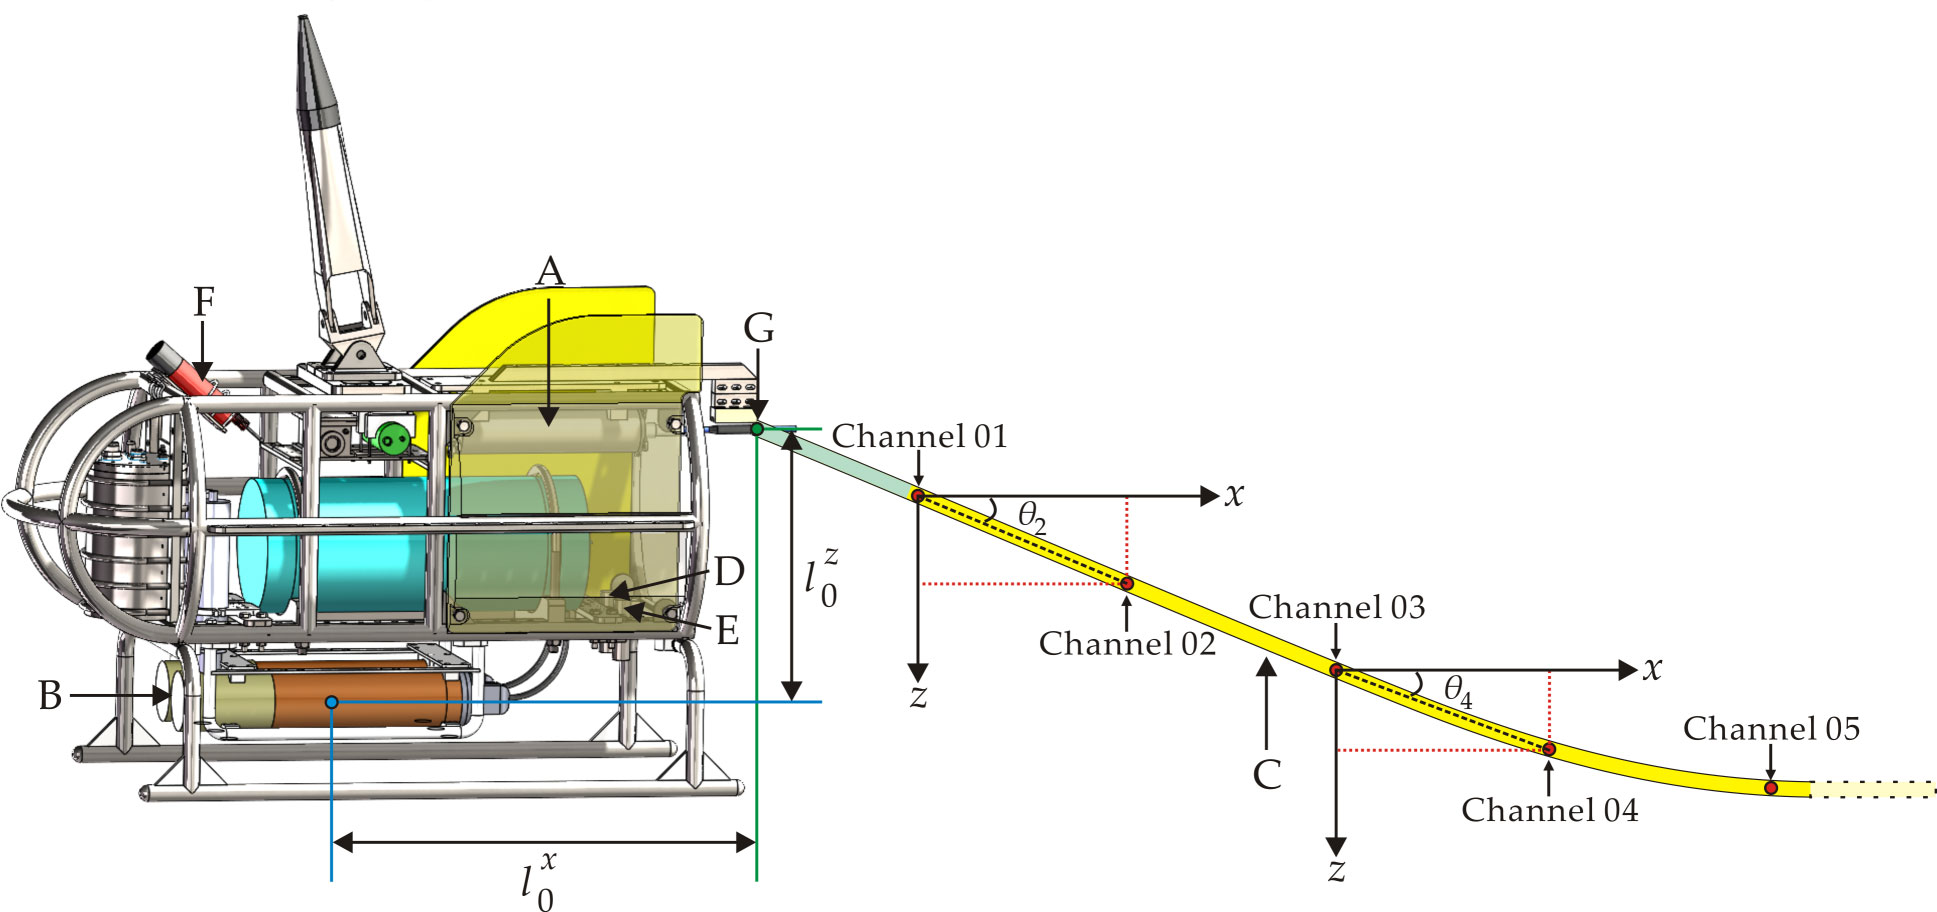
Figure 1 Schematic diagram of the geometric representation of a deep-towed seismic array. ((A) operating control center; (B) deep-towed sparker source; (C) deep-towed seismic streamer; (D) depth transducer; (E) altimeter; (F) ultrashort baseline beacon; (G) towing point of deep-towed seismic streamer; : pitch angle.).
where represents the distance between the towing point and the 1st receiver in the deep-towed seismic streamer, is the distance between adjacent receivers along the cable, namely, the channel spacing, and and are the pitch angles of the 1st and th segments in the deep-towed seismic streamer, respectively. A rectangular coordinate system is established with the deep-towed seismic source position as the origin, where and denote the horizontal and vertical offsets between the source and the towing point of the seismic streamer, respectively, and are the horizontal and vertical coordinates of the 1st receiver, and are the horizontal and vertical coordinates of the th receiver, where , and is the number of acquisition channels in the seismic streamer. Notably, the measured pitch angle is not needed for the initial model by the method proposed in this paper, and the global optimal solution for the geometric representation parameters, namely, the pitch angles, of the deep-towed seismic array can be obtained.
Source-receiver positioning methods based on seismic traveltime often require that the propagation path of the seismic waves is relatively clear; thus, the sea-surface reflection traveltime is usually selected for inversion processing. In addition, the seawater velocity is a key parameter that affects the seismic traveltime. The seawater layer is not a homogeneous medium, and it has obvious heterogeneity in the longitudinal direction, which could hinder the use of the sea-surface reflection traveltime to precisely locate the source-receiver positions for deep-towed seismic arrays. Moreover, the sea-surface reflection data acquired by the deep-towed multichannel seismic system might exhibit low SNR and even waveform distortion, deteriorating the accuracy of the determined traveltime. In contrast, the seafloor reflection has stronger energy, higher SNR, and better waveform consistency and is thus more convenient for obtaining an accurate traveltime. Therefore, developing a geometric shape inversion method for deep-towed seismic arrays based on the traveltimes of direct waves and seafloor reflections has good applicability and high application value. The key is to solve the problem of determining the propagation path of seafloor reflections for complex seabeds.
As shown in Figure 2, in the case of a flat seabed interface, the propagation path of the seafloor reflection can be easily determined through simple spatial geometric relationships based on Snell’s law. Thus, the expression for the traveltime of the seafloor reflection can be obtained as follows:
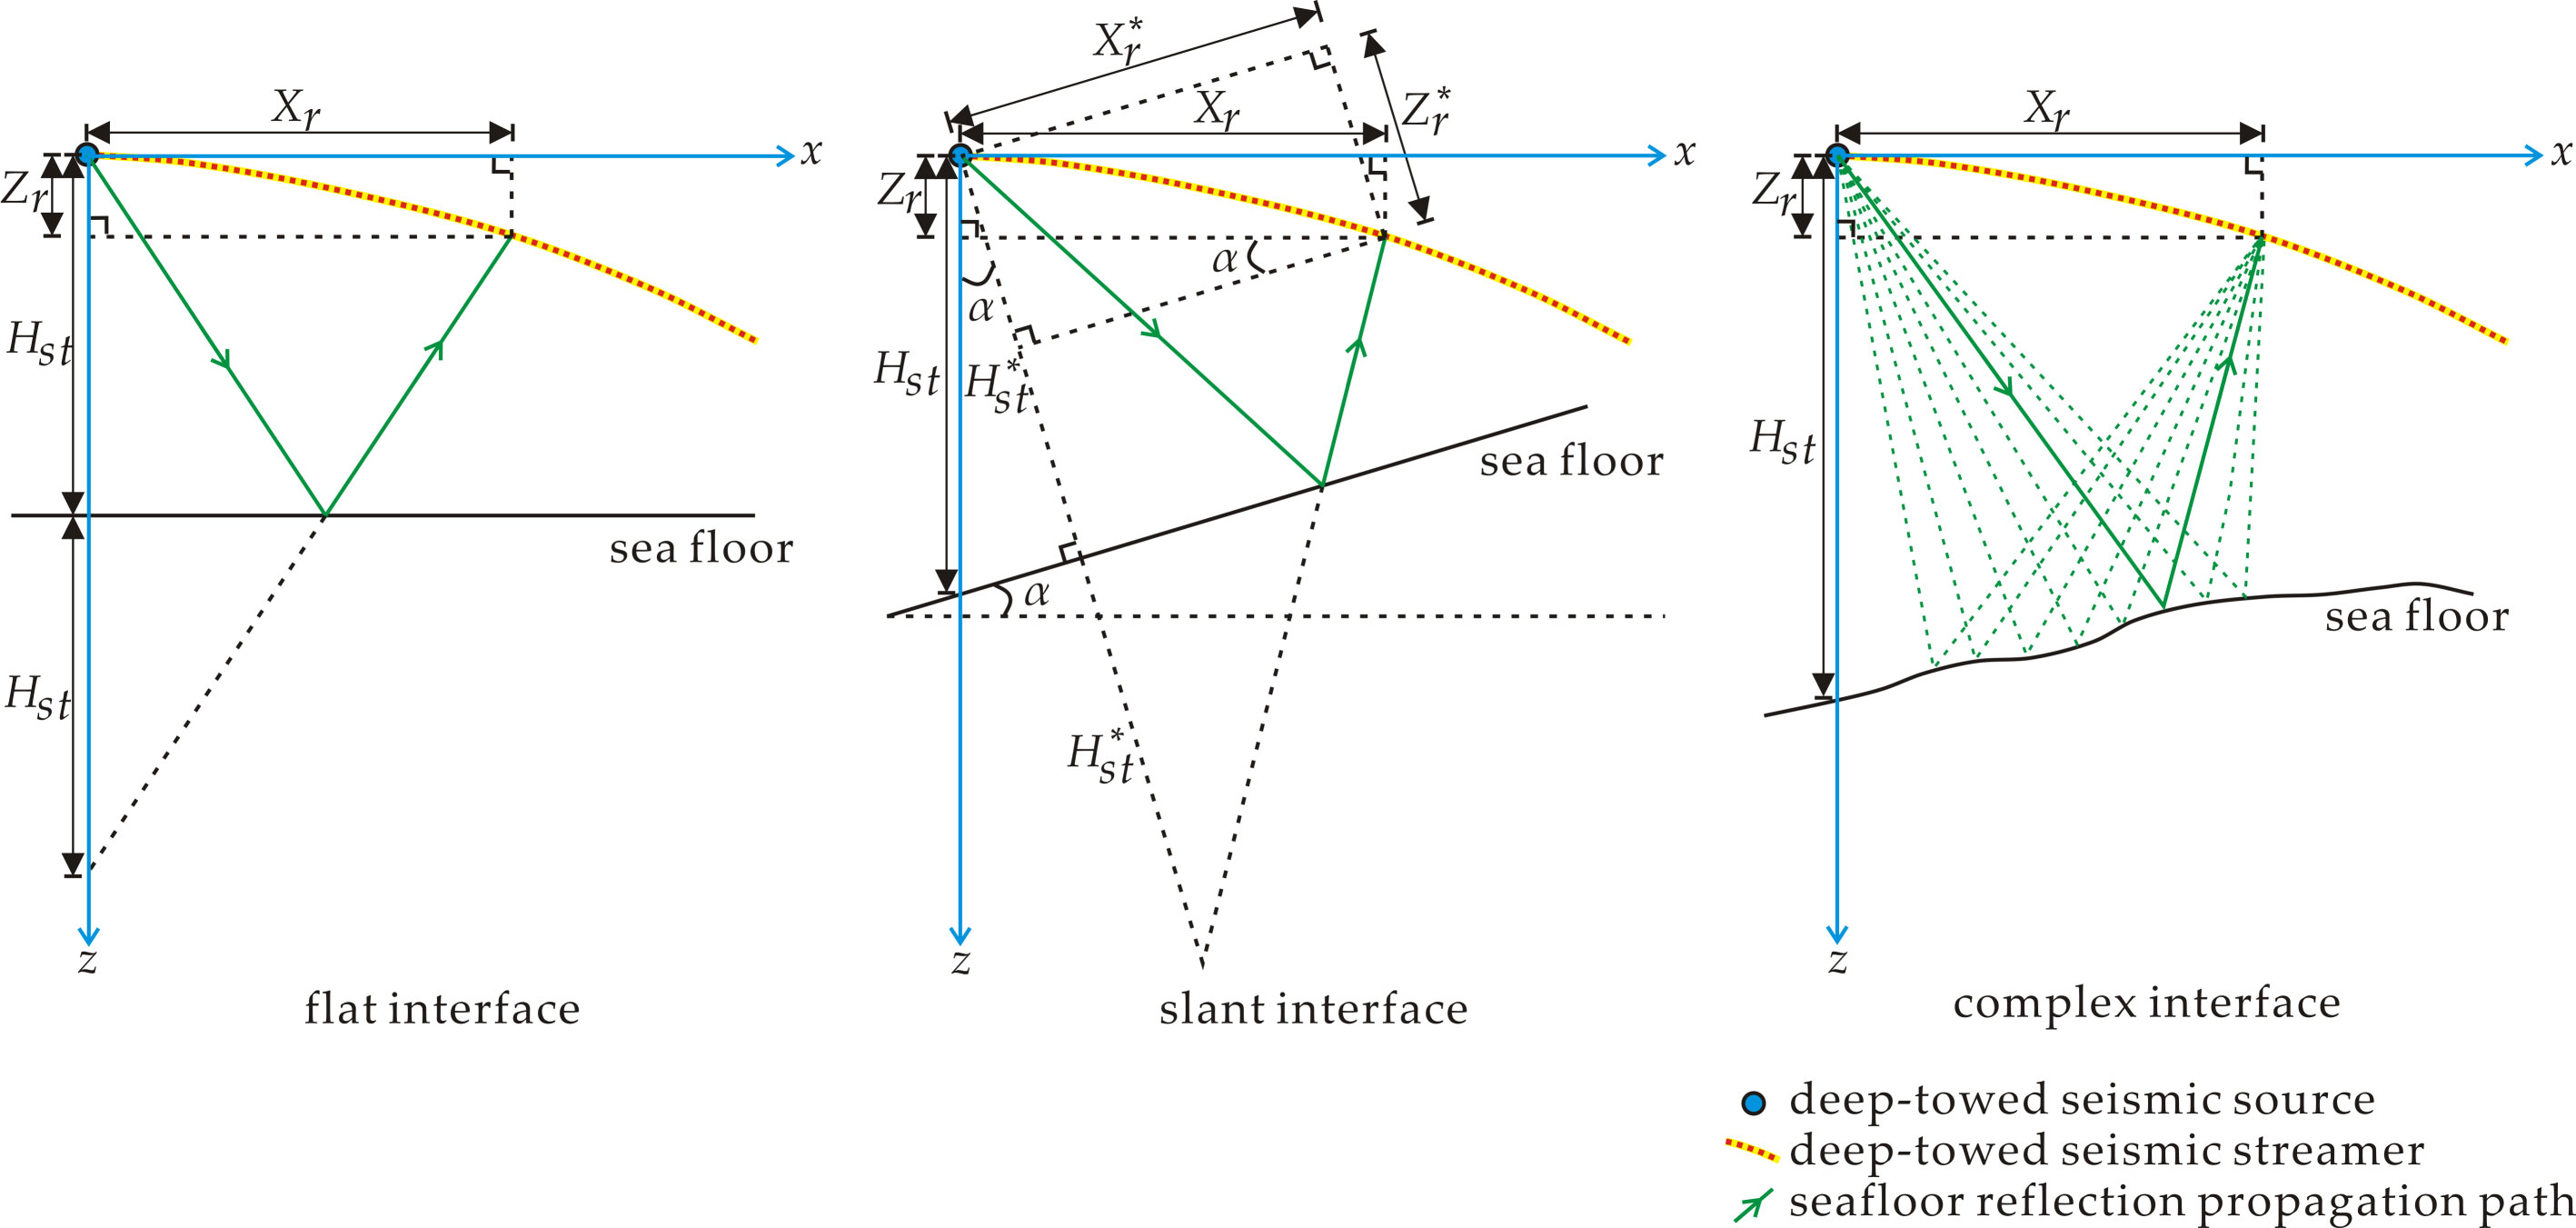
Figure 2 Schematic diagram of the seafloor reflection propagation path determination strategy for different seabed interfaces.
The expression for the traveltime of the direct wave is formulated as follows:
where and represent the traveltimes of the direct wave and seafloor reflection acquired by the th receiver in the case of a flat seabed interface, respectively, is the altitude of the source, and is the seawater velocity.
Furthermore, as shown in Figure 2, the determination of the propagation path of the seafloor reflection is related to the slope angle in the case of a slanted seabed interface. Similarly, on the basis of Snell’s law, by introducing coordinate rotation and intermediate quantities, the following expression for the traveltime of the seafloor reflection can be obtained:
where represents the traveltime of the seafloor reflection acquired by the th receiver in the case of a slanted seabed interface, denotes the slope angle of the inclined seabed interface, and , and are the intermediate variables during the calculation process.
However, the morphological changes in the seabed may be complicated in real situations, and it is difficult to determine the exact propagation path of the seafloor reflection with Snell’s law using simple spatial geometry. To address this issue, we employ the shortest path algorithm based on Fermat’s principle to identify the reflection point of the seafloor reflection. The shortest path algorithm can be used to determine the ray path and the corresponding traveltime of the seafloor reflection for complex velocity interfaces. This algorithm has the advantages of high calculation accuracy, fast operation speed and good robustness. In this paper, as demonstrated in Figure 2, we discretized the seabed interface at certain intervals and assumed that the area near the operating depth of the deep-towed multichannel seismic system on the seabed could be regarded as an isotropic medium. Then, we connected the source, the discrete points on the seabed interface and the receivers. With this approach, multiple seafloor reflection propagation paths were constructed, and the shortest ray path was found to be an accurate and reliable propagation path of the seafloor reflection. Therefore, for the complex seabed interface, the expression for the seafloor reflection traveltime is formulated as follows:
where represents the traveltime of the seafloor reflection acquired by the th receiver in the case of a complex seabed interface, and indicates the depth of the source. Taking the position of the source as the origin, the rectangular coordinate system shown in Figure 2 was established, where and are the abscissa and ordinate values of the th discrete point on the seabed interface, respectively, and denotes the depth of the th discrete point on the seabed interface. The depth variation curve of the seabed interface can be derived according to the measured values of the depth and the altitude of the deep-towed source along the direction of the survey line. When the th discrete point on the seabed interface is set as the reflection point, is the distance of the seafloor reflection propagation path to be determined acquired by the th receiver, where , and is the total number of discrete points on the seabed interface.
Based on the geometric representation of the deep-towed seismic array and the determination of the seafloor reflection propagation path, the objective function of the geometric representation parameter inversion is built as follows:
where are the parameters to be optimized; represent the pitch angles of each segment in the deep-towed seismic array, constituting the geometric shape representation parameters; and are the theoretical and observed values of the direct wave traveltime to the th receiver, respectively; and and are the theoretical and observed values of the seafloor reflection traveltime to the th receiver, respectively. Notably, should be replaced by in the method proposed in this paper. is the optimal solution of the objective function, ; in other words, are the optimal geometric shape representation parameters for the deep-towed seismic array.
Based on Equations (1), (3), (5) and (6), we adopt the particle swarm optimization (PSO) algorithm to solve the optimization problem of the objective function without relying on the initial model. The PSO algorithm, which applies a group information sharing mechanism, has the advantages of fast convergence and good robustness. Then, the high-precision inversion of the array geometry for a deep-towed multichannel seismic system suitable for an arbitrarily complex seabed is realized.
To verify the effectiveness of the proposed method, we employ the method to the array geometry inversion problem for a numerical model for a deep-towed multichannel seismic system. The model is established according to the engineering design scheme of Kuiyang-ST2000, in which there are 48 seismic traces with a trace interval of 3.125 m. The distance between the towing point of the deep-towed seismic streamer and the 1st receiver is 12.5 m. Because of its length, it is split into four 3.125 m segments, resulting in three additional node pitch angles and a total of 51 geometric representation parameters that need to be reversed. The deep-towed streamer’s towing point is offset from the sparker source emission array center by 2.0 m and -0.6 m in the horizontal and vertical directions, respectively. Figure 3A shows the numerical model of the array geometry and seabed interface established based on the above parameters. The immersion depth of the source is 1104.69 m, and the height above the seabed is 120.00 m. The seabed interface is set to be close to a real complex seabed. The seismic velocity of seawater is set to 1488 m/s. The theoretical traveltimes of the direct wave and the seafloor reflection, as illustrated in Figure 3B, can be derived using the seismic ray-tracing method. Based on the numerical model, the reliability and accuracy of the proposed method are assessed according to an influencing factor analysis of uncertainty sources such as the seismic traveltime, seawater velocity and seabed morphology. In addition, to quantitatively evaluate the quality of the array geometry inversion results, the root mean square error (RMSE) is introduced as the evaluation criterion:
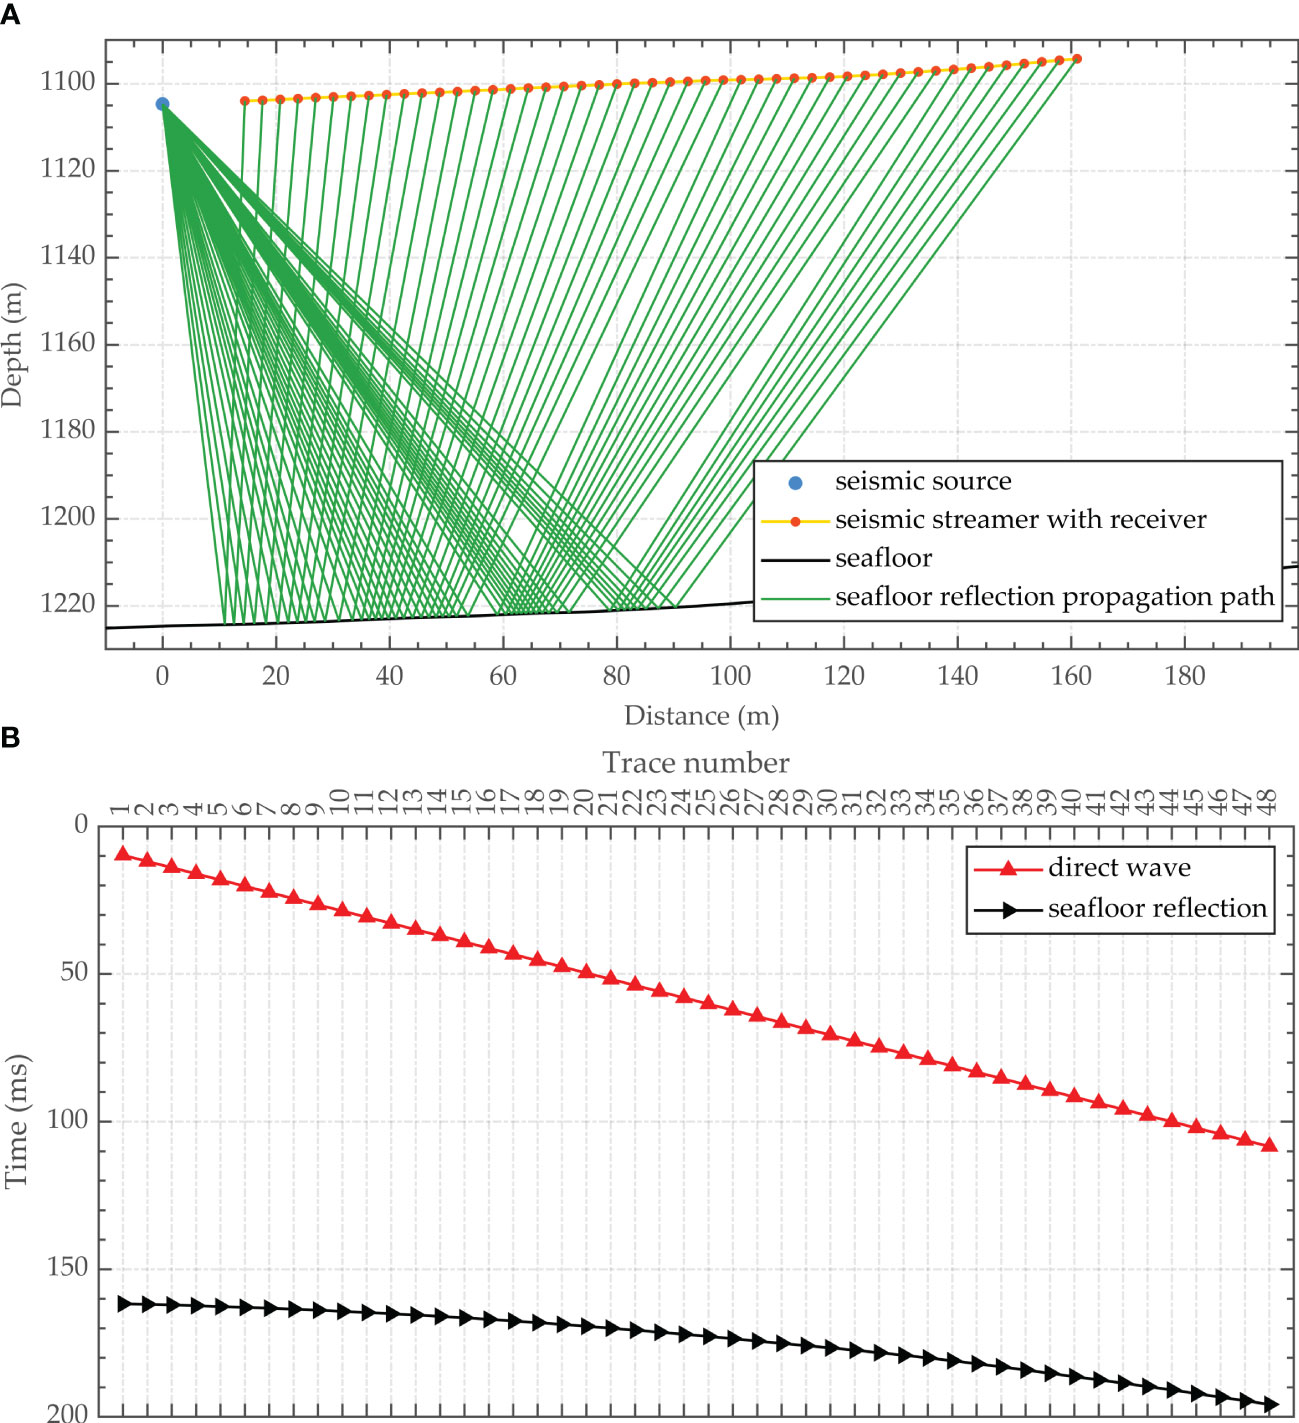
Figure 3 Numerical model of a deep-towed seismic array and its theoretical seismic traveltimes. ((A) Numerical model of the array geometry and seabed interface; (B) Theoretical traveltimes of the direct wave and seafloor reflection).
where and are the reference values of the th receiver position in the numerical model, and are the predicted values of the th receiver position obtained by the inversion method, represents the positioning error of the th receiver, and is the total number of receivers in the numerical model.
Three different strategies for determining the propagation path of the seafloor reflection described in Section 2.2 are utilized to invert the geometric shape of the array model, namely, replacing in Equation (6) with , and . The hypothesis of a flat seabed interface is that the seabed interface is approximated as a horizontal interface based on the height of the deep-towed source above the seafloor. The assumption of a slanted seabed interface is that the seabed interface within the lateral spacing of 80 m is approximated as an inclined interface by taking the horizontal position of the source as the origin. The proposed method does not need an approximate representation of the seabed interface and can accurately calculate the traveltime of the seafloor reflection with the shortest path algorithm. As shown in Figure 4, the source-receiver positioning result obtained by the suggested method is the most consistent to the model reference value among the considered models, followed by the slanted interface assumption model and finally the flat interface assumption model. The accuracy of the array geometry inversion method with the assumption of a slanted interface relies on the degree of fitting between the inclined interface and the seabed at the current position. Thus, the inversion accuracy improves when the seabed topography changes gradually. However, when the seabed interface is rugged and the topographical changes are more severe, the inversion precision is greatly reduced. Therefore, the inversion strategy proposed in this paper demonstrates excellent applicability in the case of complex seabeds. Figure 5 shows the relationship among the RMSE of the source-receiver positioning determined by the numerical model, the computational efficiency of the inversion and the discrete interval of the seabed interface. Accounting for both the accuracy and efficiency of the inversion, the discrete interval of the seabed interface was set to 1.0 m in the subsequent numerical model experiments and field data processing.
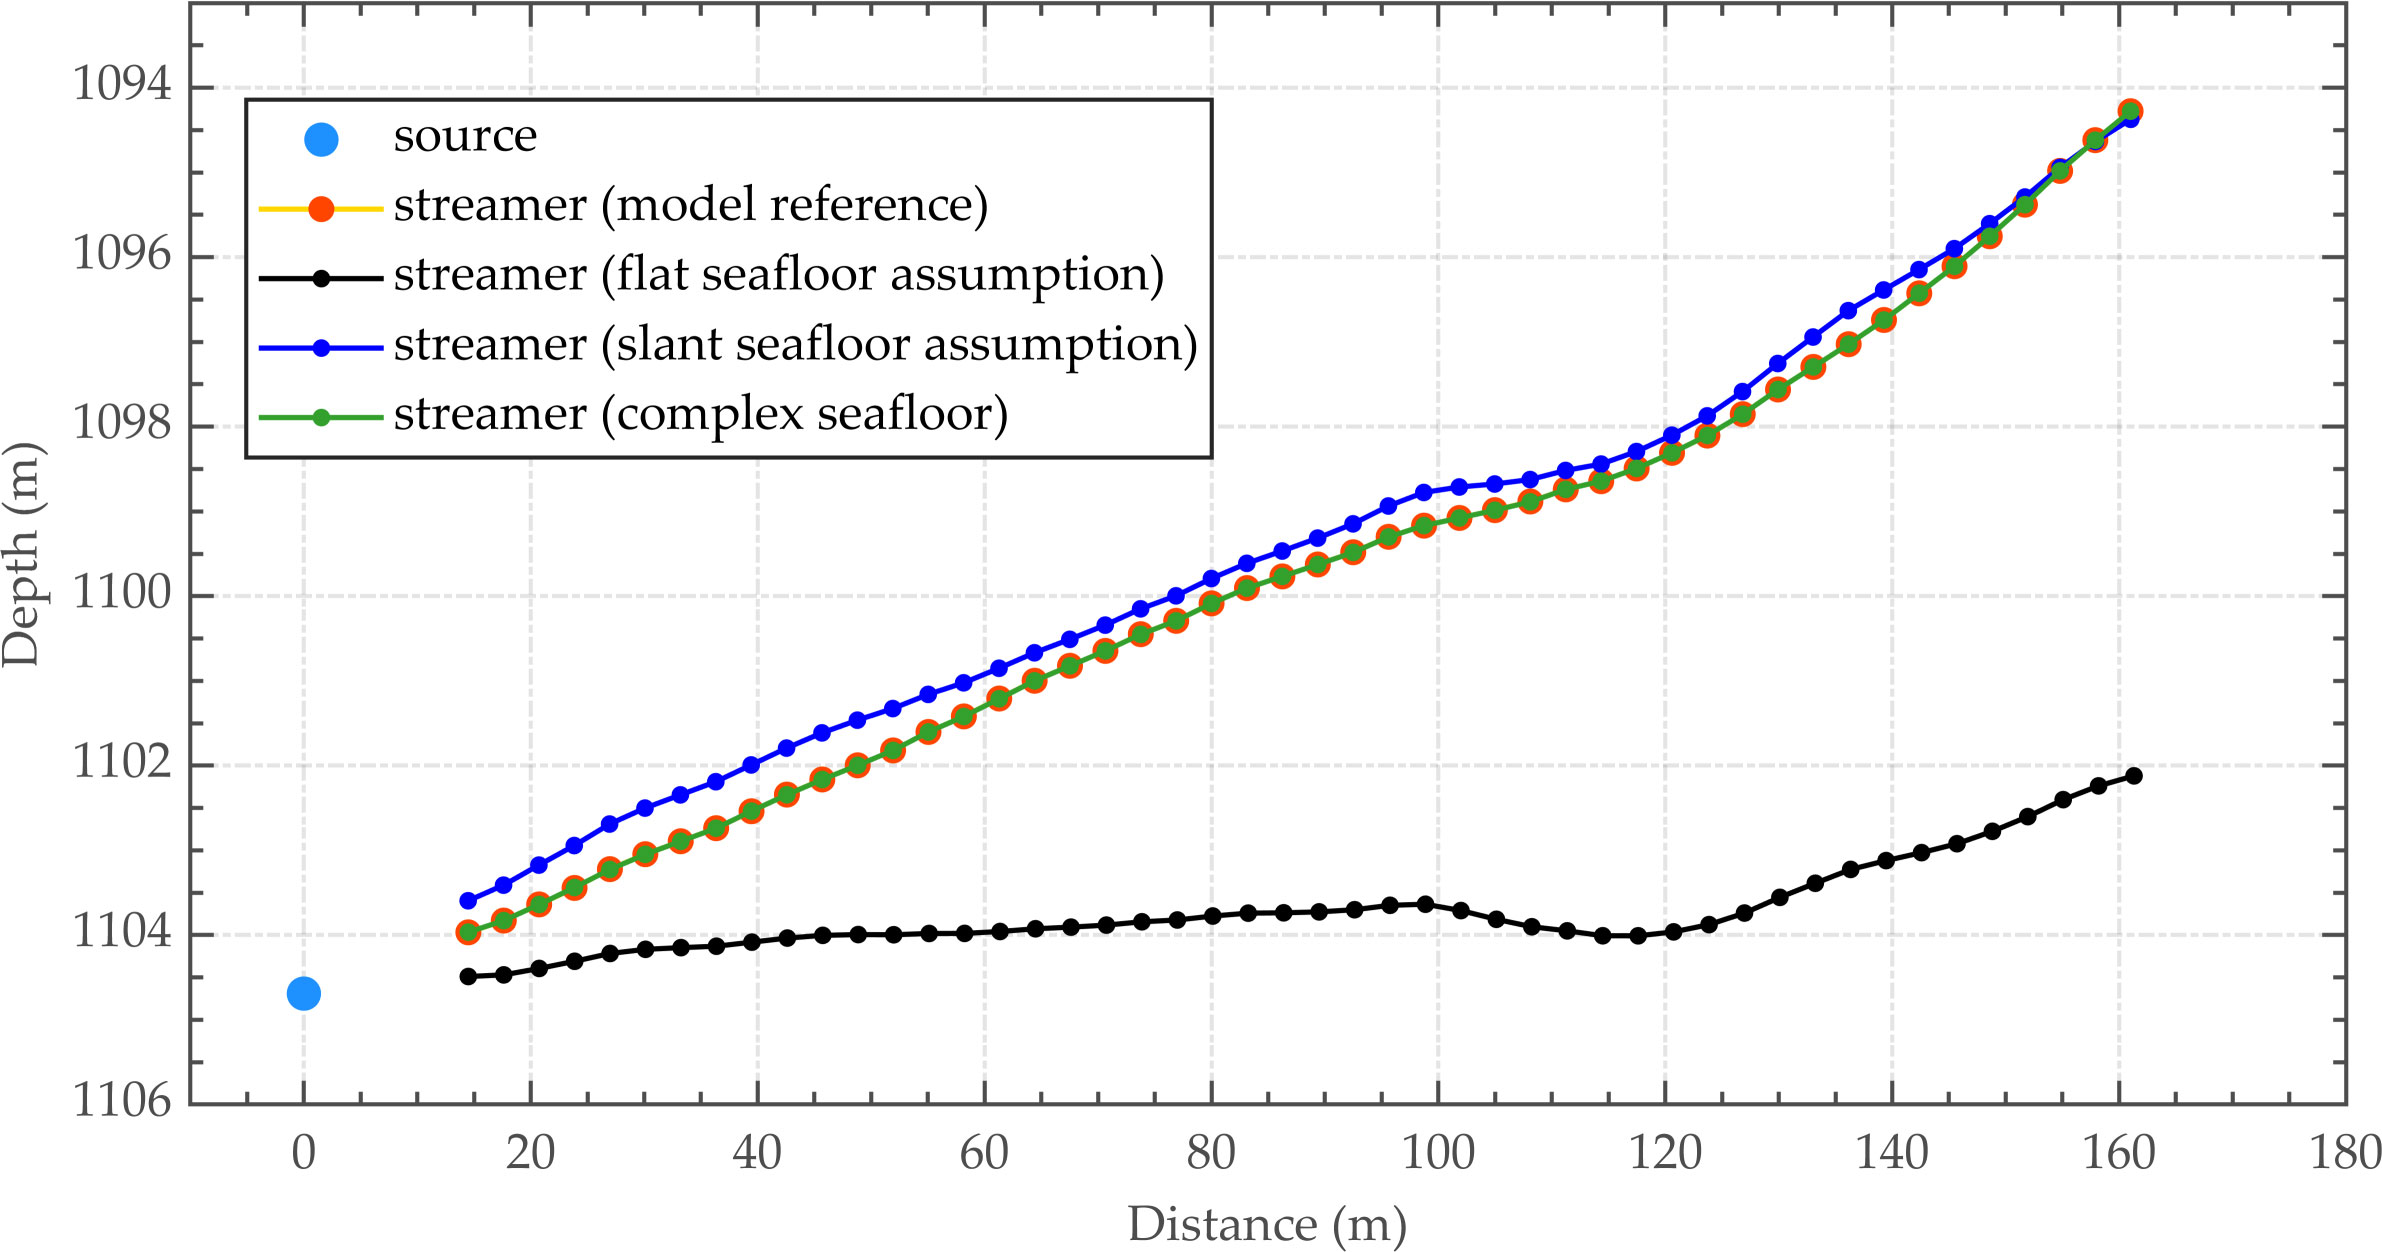
Figure 4 Results of the array geometry inversion of the numerical models based on different strategies for determining the seafloor reflection propagation path.
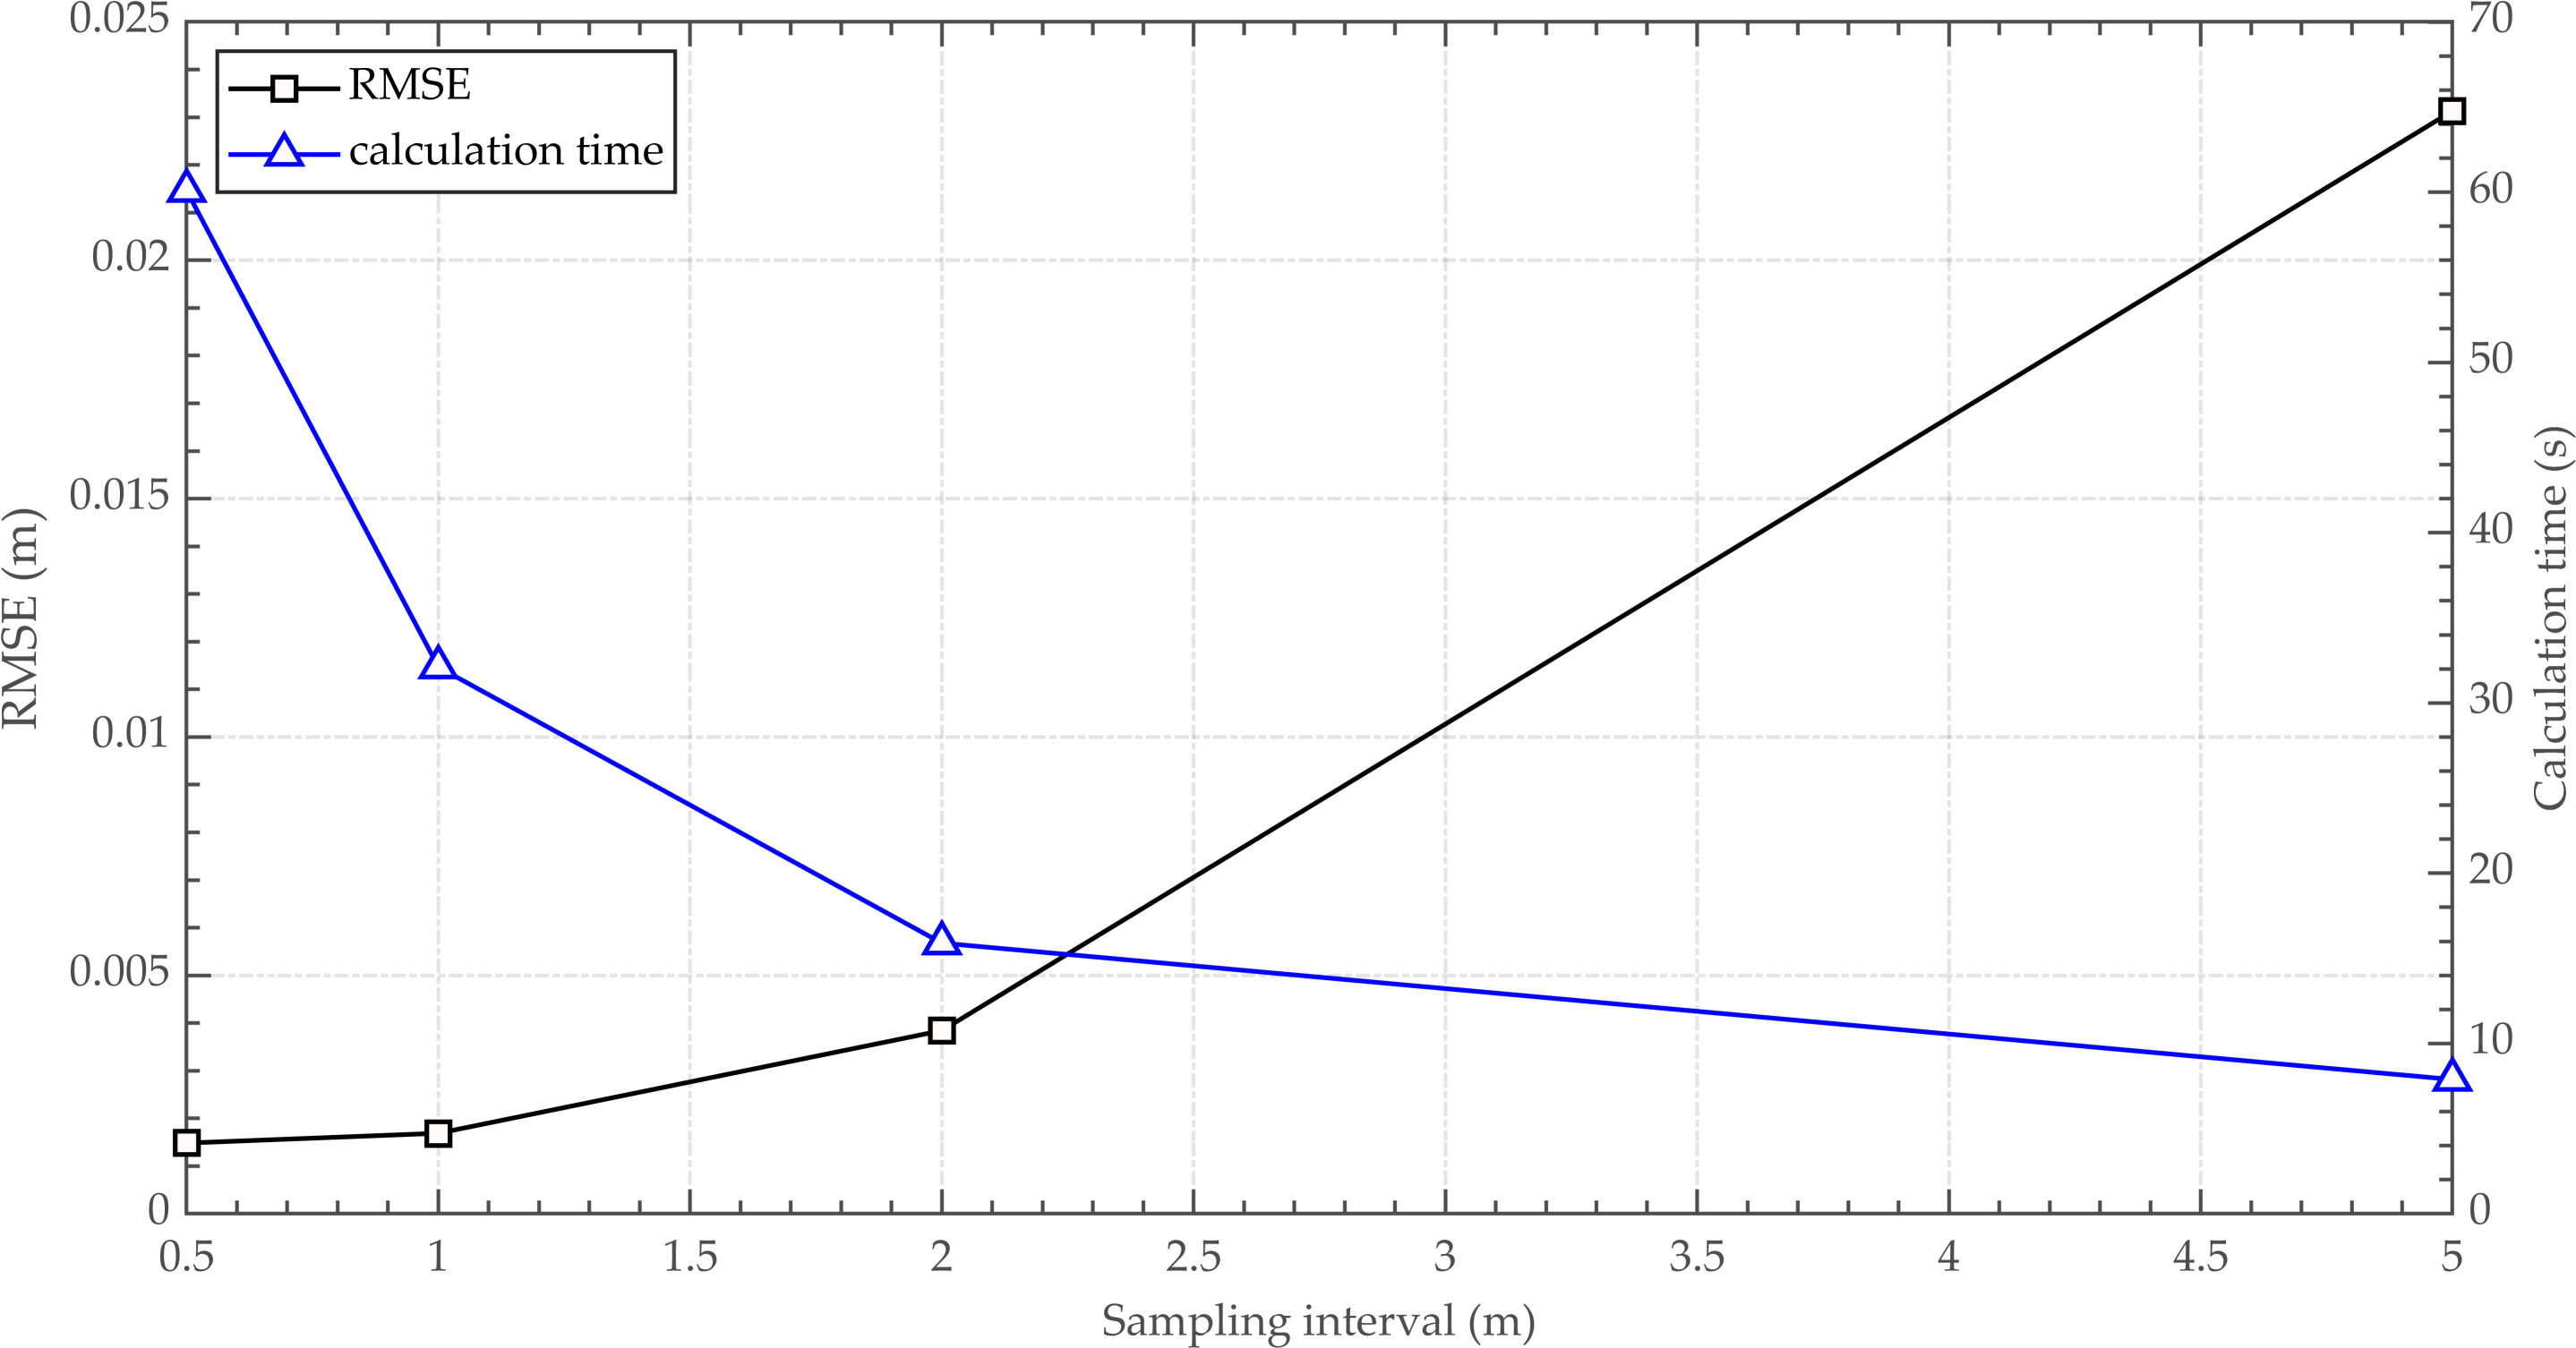
Figure 5 Relationship among the RMSE, inversion efficiency and seabed interface dispersion interval.
Due to the influence of the SNR of the data and the decision criterion of the waveform starting point, several errors impact seismic traveltime results (Liu et al., 2022). Referring to the suggestions of Zhang and Toksöz (1998) and Korenaga et al. (2000), the overall traveltime error should be divided into two types: common phase errors and individual errors. The common phase errors are related to the determination of the initial point of the same seismic phase (similar to systematic errors), and the individual errors are equivalent to adding Gaussian noise to the acquired data. This data randomization method is used due to the highly correlated nature of real seismic data to reliably model the uncertainty of the determined traveltime.
To evaluate the impact of the traveltime uncertainty on the accuracy of the geometric inversion of the deep-towed seismic array, four groups of traveltime data for direct waves and seafloor reflections with different errors are constructed, named Picking Error 01, Picking Error 02, Picking Error 03 and Picking Error 04. Considering the dominant frequency of the seismic source, the common phase errors are sequentially set to -0.25 ms, -0.125 ms, 0.125 ms and 0.25 ms in the four datasets. The individual errors for the Picking Error 01 and Picking Error 04 sets are set to ±0.25 ms, and the individual errors for the Picking Error 02 and Picking Error 03 sets are set to ±0.125 ms. In other words, the total traveltime error for the Picking Error 01 and Picking Error 04 sets is 0.50 ms, while that for the Picking Error 02 and Picking Error 03 sets is 0.25 ms. Figure 6 shows the influence of the traveltime uncertainty on the array geometry inversion results. Figure 6A displays the traveltime errors for direct waves and seafloor reflections in the four datasets mentioned above. Figure 6B shows the inversion results of the array geometry obtained by the proposed method for these test groups. Figure 6C presents the receiver positioning errors corresponding to the inversion results shown in Figure 6B. The RMSEs of the inversion results for the Picking Error 01, Picking Error 02, Picking Error 03 and Picking Error 04 sets are 0.45 m, 0.23 m, 0.20 m and 0.42 m, respectively.
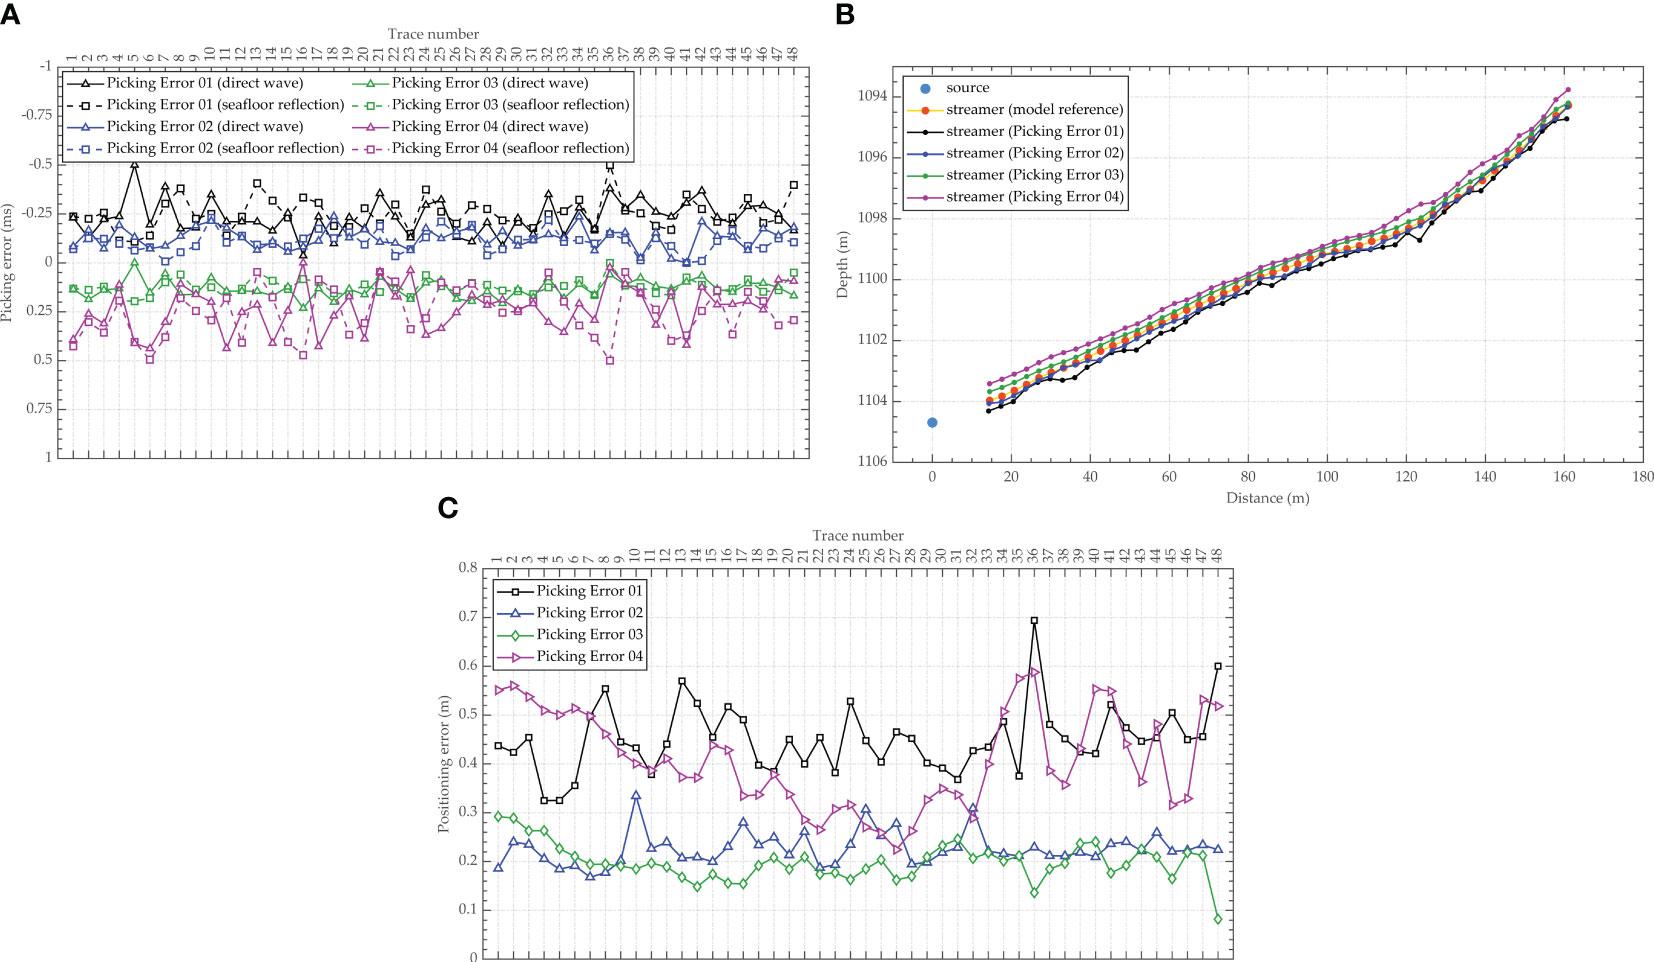
Figure 6 Influence of traveltime uncertainty on the array geometry inversion results. ((A) Traveltime errors; (B) Array geometry inversion results; (C) Receiver positioning errors).
As shown in Figure 6, the common phase errors lead to deviations in the overall position in the array geometry inversion results, with larger common phase errors causing larger positioning errors. Larger traveltime values cause the inversion position of the seismic array to move upward; in contrast, smaller traveltime values cause the inversion position to move downward, leading to slightly noticeable array geometry jitter. On the basis of the common phase error, adding Gaussian noise to the individual errors leads to jitter distortion in the array geometry inversion results. Moreover, as the individual error increases, the jitter and nonsmoothness of the array geometry inversion results become more severe.
The seawater velocity is related to the temperature, salinity and pressure of seawater. Due to the heterogeneity of seawater, the seawater velocity varies over time in different places, which introduces uncertainty to the seawater velocity value utilized in the geometric shape inversion of the deep-towed seismic array. In previous works, several expendable conductivity-temperature-depth (XCTD) profilers were usually employed to analyze the vertical and lateral changes in the seawater velocity in the study area as a reference for the value during near-bottom multichannel seismic surveys. The accurate seawater velocity value in the numerical model is known to be 1488.0 m/s. To analyze the influence of seawater velocity errors on the accuracy of the array geometry inversion, we set the seawater velocity to 1486.0 m/s, 1487.0 m/s, 1489.0 m/s and 1490.0 m/s, named Velocity Error 01, Velocity Error 02, Velocity Error 03 and Velocity Error 04, respectively. As shown in Figure 7, the array geometry of the numerical model is inverted by using accurate seismic traveltime and seabed morphology data with the proposed method, and the inversion results and positioning errors are obtained in scenarios with different seawater velocity values. The RMSEs of the receiver positions are 0.35 m, 0.18 m, 0.19 m and 0.38 m.
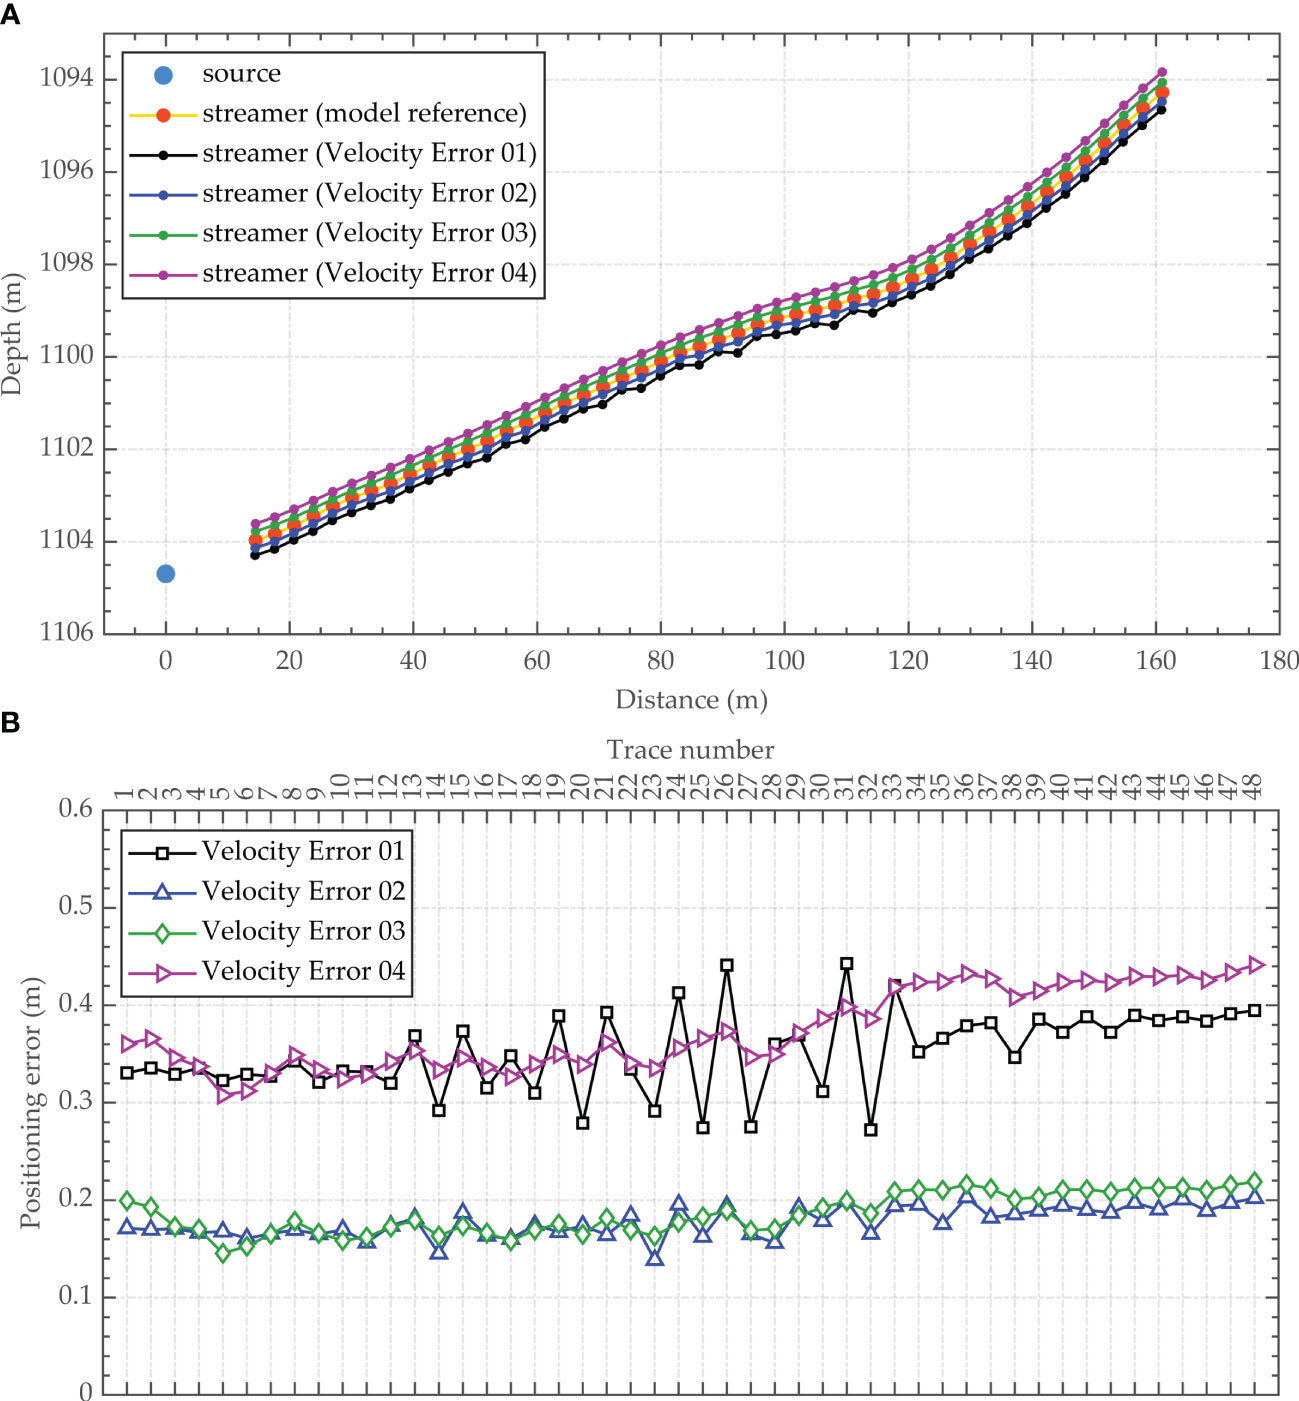
Figure 7 Influence of seawater velocity uncertainty on the array geometry inversion results (proposed method). ((A) Array geometry inversion results; (B) Receiver positioning errors).
As shown in Figure 7, as the absolute error of the seawater velocity increases, the positioning errors of the array geometry inversion results increase, and the positioning errors of the far-end receivers are slightly greater than those of the near-end receivers. The locations of the receivers determined by the proposed method move upward with larger seawater velocity values and downward with smaller seawater velocity values. Moreover, when the seawater velocity is smaller than the true value, jitter distortion occurs in the middle section of the array, with larger seawater velocity errors leading to more severe and wider range jitter. In addition, when the seawater velocity is larger than the true value, the array geometry obtained by inversion is relatively smooth.
As a comparison, we utilize the sea-surface reflection traveltime fitting term to replace the seafloor reflection traveltime fitting term in Equation (6), namely, the sea-surface reflection traveltime positioning method, and invert the array geometry based on the aforementioned seawater velocity error test groups to obtain the corresponding inversion results and positioning errors, as shown in Figure 8. The RMSEs of the receiver positions are 2.98 m, 1.49 m, 1.47 m and 2.93 m. The accuracy of the inversion results is sensitive to the uncertainty in the seawater velocity; that is, the same degree of seawater velocity error leads to greater receiver positioning errors than the proposed method. Therefore, the seawater velocity is a significant factor that seriously affects the precision of the array geometry inversion method utilizing the sea-surface reflection traveltime.
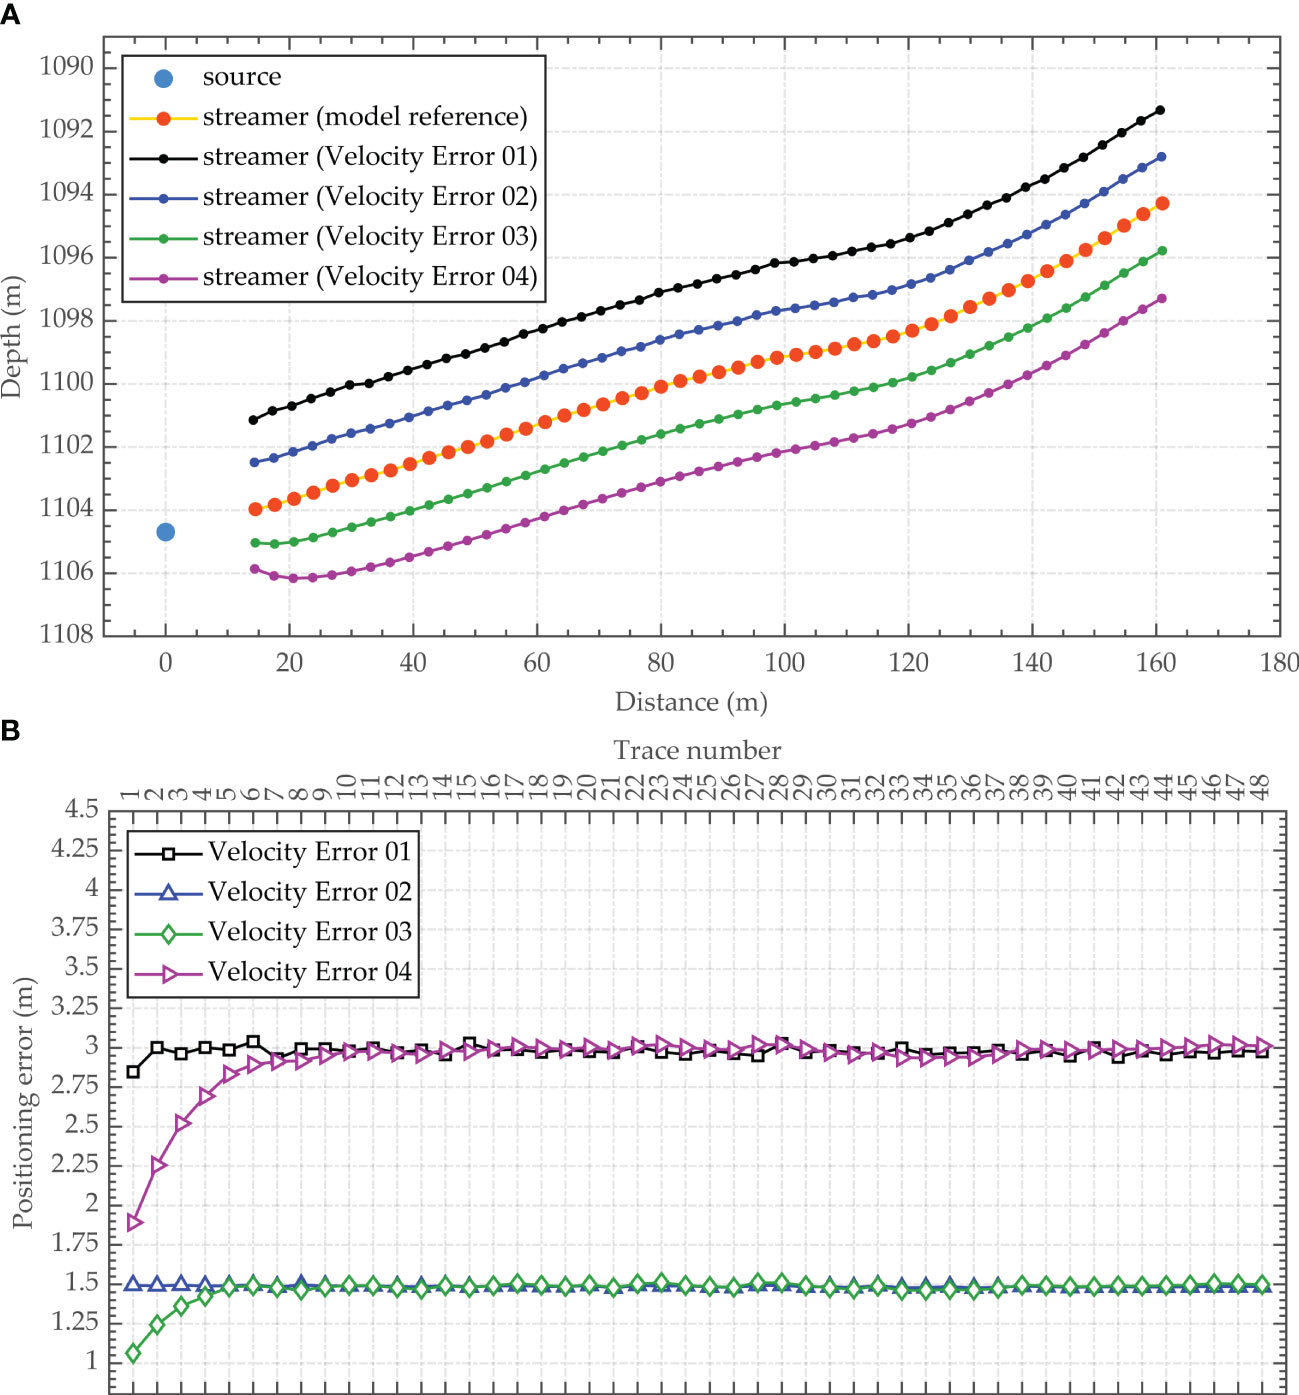
Figure 8 Influence of the uncertainty in the seawater velocity on the array geometry inversion results (sea-surface reflection traveltime positioning method). ((A) Array geometry inversion results; (B) Receiver positioning errors).
The measured values of the immersion depth and the height above the seabed for the deep-towed source are determined by the depth transducer and altimeter. These two measurements can be used to obtain the seabed topography at the survey line. The precision of measurement equipment affects the precision of the data; that is, uncertainties in the seabed morphology affect the accuracy of the array geometry inversion results. Given the characteristics of sensor measurement errors, we divide the seabed topography errors into systematic errors and random errors that distort the shape of the input seabed interface to varying degrees.
To evaluate the influence of seabed morphology uncertainties on the accuracy of the array geometry inversion results, four groups of seabed topography data with different error levels are constructed and denoted as Topography Error 01, Topography Error 02, Topography Error 03 and Topography Error 04. Considering the measurement precision of the depth transducer and the altimeter, the systematic errors of the seabed topography data are set to -0.2 m, -0.1 m, 0.1 m and 0.2 m. For random errors, ± 0.2 m Gaussian noise is added to the seabed topography data for Topography Error 01 and Topography Error 04, and ±0.1 m Gaussian noise is added to Topography Error 02 and Topography Error 03. In other words, the overall errors of the seabed morphology are 0.4 m for Topography Error 01 and Topography Error 04 and 0.2 m for Topography Error 02 and Topography Error 03. Since the seabed topography data must be smooth for use in the proposed method, the final seabed morphology used as the input to the proposed array geometry inversion method is shown in Figure 9A. Figures 9B, C show the inversion results and the positioning errors obtained when varying degrees of distortion were introduced in the seabed morphology. The RMSEs of the inversion results for Topography Error 01, Topography Error 02, Topography Error 03 and Topography Error 04 are 0.40 m, 0.20 m, 0.20 m and 0.42 m, respectively.
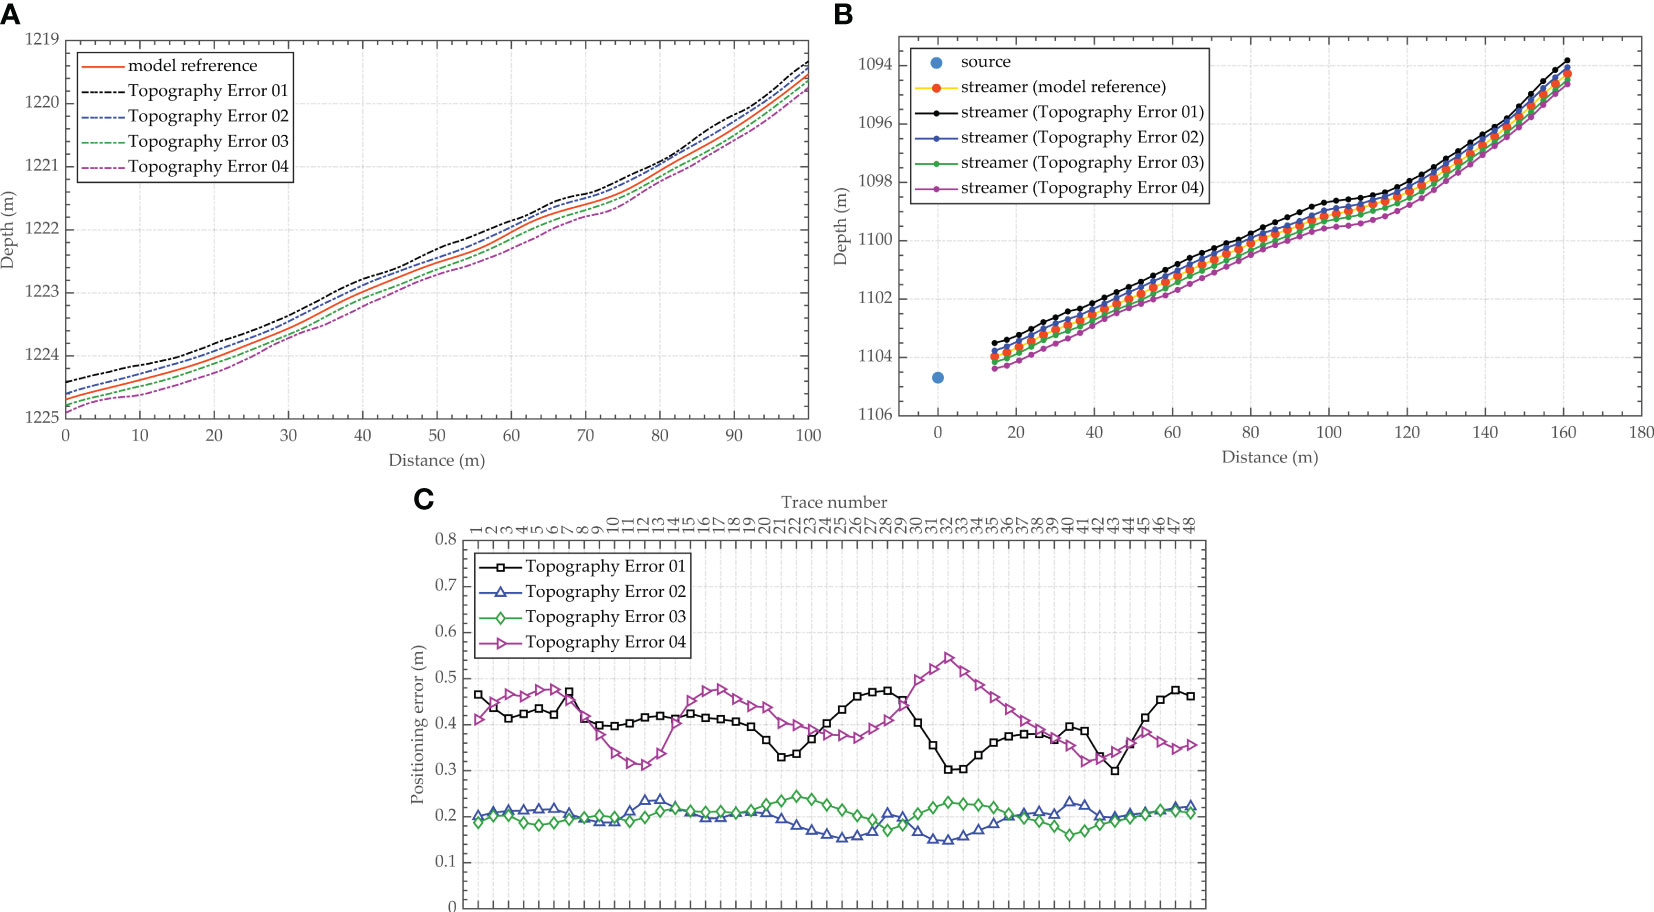
Figure 9 Influence of the seabed interface morphology uncertainty on the array geometry inversion results. ((A) Seabed interface morphology after smoothing; (B) Array geometry inversion results; (C) Receiver positioning errors).
As shown in Figure 9, the inversion accuracy of the geometric shape of the deep-towed seismic array decreases as the seabed topography data errors increase. When the overall bathymetric topography deviates toward the shallower side, the positions of the receivers shift upward. When the overall bathymetric topography deviates toward the deeper side, the positions of the inverted receivers move downward. Larger seabed morphology errors lead to greater RMSEs for the inversion results. Systematic errors in the seabed topography data are the main influencing factor on the results, which cause the receivers to deviate from their true positions, and the positioning errors of different receivers are similar. However, random errors in the seabed topography data could also distort the geometric shape of the deep-towed seismic streamer, and the distortion from the true shape is positively correlated with the magnitude of the random errors.
To comprehensively evaluate the influence of uncertainty sources on the inversion results of the deep-towed array geometry using the method proposed in this paper, we use Monte Carlo uncertainty analysis to quantify the reliability and accuracy of the inversion results. In this case, according to the operating mode of the deep-towed multichannel seismic system and the signal-to-noise characteristics of the collected seismic data, the input data to the inversion process, including the seismic traveltime, seawater velocity, and seabed morphology, are perturbed on the basis of the numerical model presented in Section 3.1. The overall error in the seismic traveltime is set to ±0.25 ms (common phase error of ±0.125 ms and individual error of ±0.125 ms), the error in the seawater velocity is set to ±1 m/s, and the overall error in the seabed morphology is set to ±0.4 m (systematic error of ±0.2 m and random error of ±0.2 m). Accordingly, the method proposed in this paper is utilized to invert the geometric shape of the deep-towed seismic array for a total of 100 input datasets constructed with different perturbations, which have random seismic traveltime errors, seawater velocity deviations and seabed morphology deviations. The Monte Carlo uncertainty analysis results are shown in Figure 10A. As a contrast, we also performed Monte Carlo uncertainty analysis using the same perturbation datasets with the array geometry inversion method based on the sea-surface reflection traveltime discussed in Section 3.2.2, and the results are shown in Figure 10B. Figure 11 shows the statistical results of the RMSE of the array geometry inversion results obtained by the above two methods.
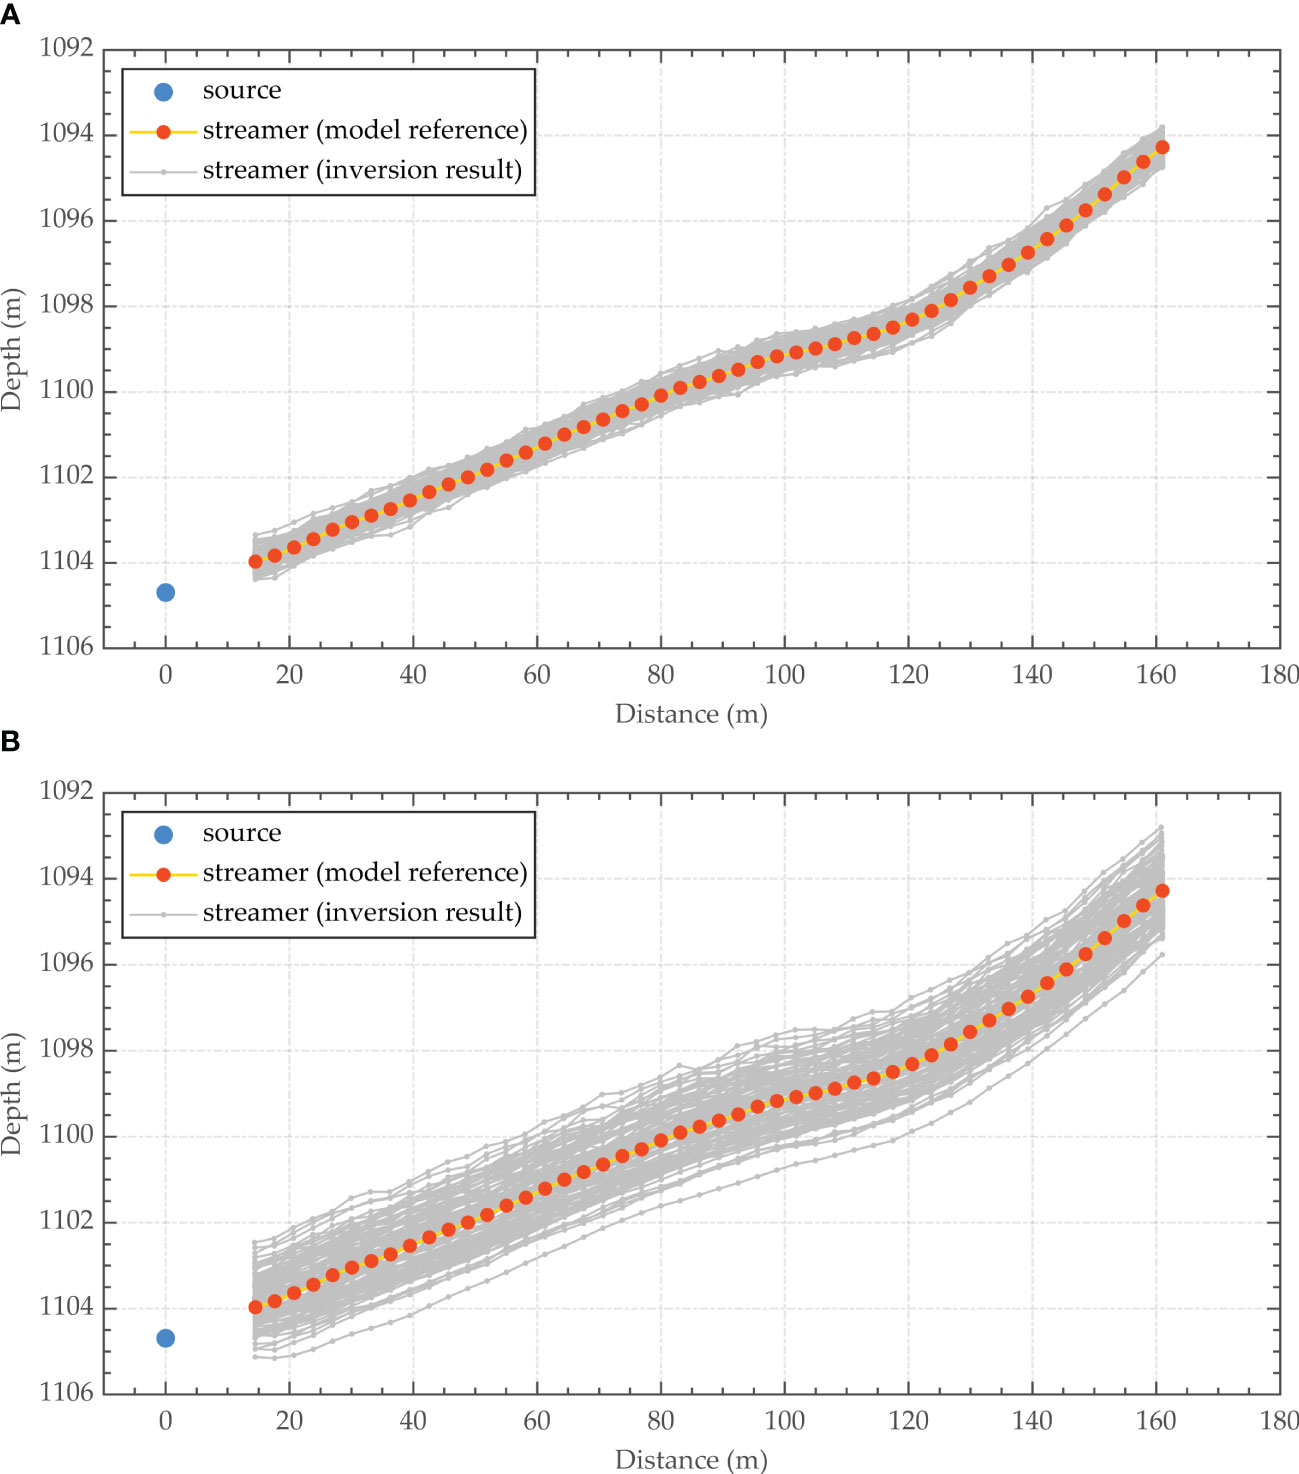
Figure 10 Monte Carlo uncertainty analysis results of the numerical model. ((A) Proposed method; (B) Sea-surface reflection traveltime positioning method).
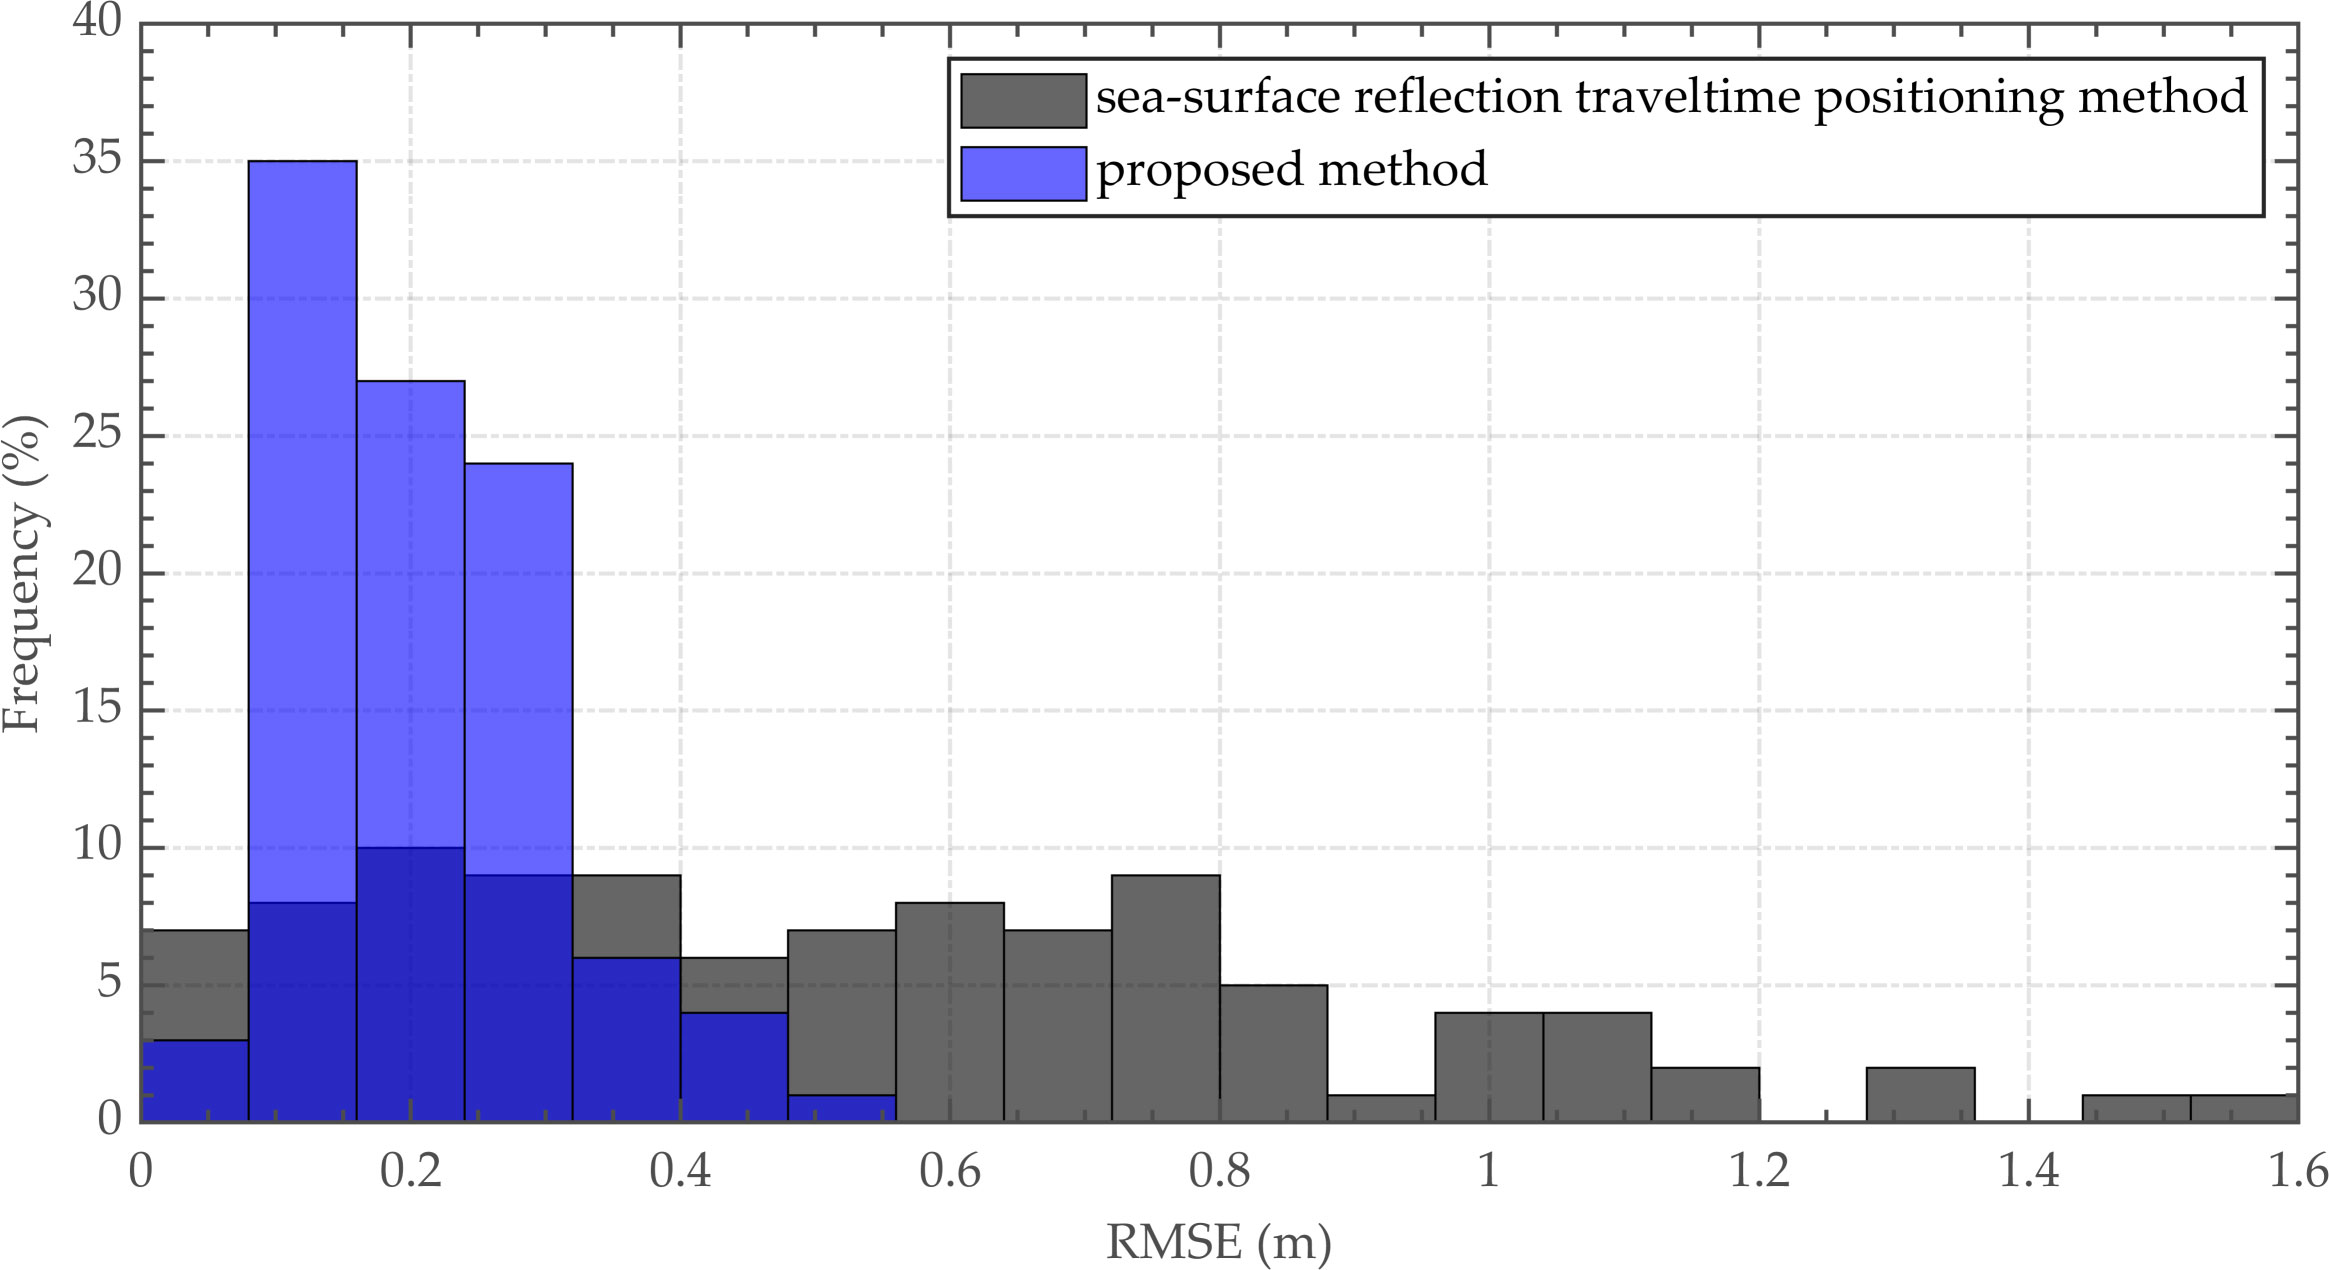
Figure 11 RMSE statistics of the Monte Carlo uncertainty analysis results.
As shown in Figures 10 and 11, the proposed method greatly reduces the uncertainty in the array geometry inversion results for the deep-towed multichannel seismic system, and the RMSE of the receiver location is approximately in the range of 0.1 to 0.3 m. The maximum positioning error of the receivers determined with the proposed method is 0.73 m, and the maximum RMSE is 0.49 m, while the maximum positioning error of the receivers determined with the sea-surface reflection traveltime positioning method is 1.64 m, and the maximum RMSE is 1.54 m. In addition, considering the low SNR of sea-surface reflections in real deep-towed seismic data, waveform distortion could seriously affect the accuracy of the identified waveform starting point, leading to increased common phase errors. The uncertainty analysis results in scenarios closer to the real situation are worse than those shown in Figure 10B.
In summary, the numerical results confirm that the proposed method can effectively solve the problem of high-precision array geometry inversion for deep-towed multichannel seismic systems in scenarios with complex seabeds. On this basis, influencing factor and uncertainty analyses are used to systemically study the effects of errors in the seismic traveltime, seawater velocity and seabed topography on the array geometry inversion results. Furthermore, the sensitivity of the inversion accuracy to seismic traveltime errors, seawater velocity deviations and seabed topography errors is evaluated. The results of the numerical experiments are of great significance for the improvement of deep-towed multichannel seismic data processing and field investigation methods, so as to obtain high-quality near-bottom acoustic detection data. For example, the determination of the initial seismic waveform point could be appropriately modified to improve the seismic traveltime data, and a self-contained sound velocity profiler could be introduced to obtain continuous and accurate measurements of the seawater velocity. Moreover, the accuracy of the seabed morphology could be verified and evaluated by comprehensively comparing the seabed topography synthesized according to depth transducer and altimeter data and the multibeam bathymetric data extracted by the ultrashort baseline positioning of the deep-towed vehicle.
Given the good performance of the proposed method in the numerical experiments, we apply the proposed approach to invert the array geometry of real data acquired during sea experiments with Kuiyang-ST2000 to verify the effectiveness of the proposed method. Furthermore, we evaluate the accuracy and stability of our method through velocity spectra analyses and seismic imaging quality assessments after floating datum correction (He et al., 2009).
The prestack shot gathers in the sea experiments with Kuiyang-ST2000 conducted in 2020 in the Shenhu area in the South China Sea are selected, and the change in the seabed topography at the selected survey line is relatively severe, as shown in Figure 12. The main acquisition parameters of the deep-towed multichannel seismic datasets are as follows: the source energy is 3000 J, shot spacing is 6.25 m, trace spacing is 3.125 m, minimum offset is 14.5 m, trace number is 48, recording duration is 3000 ms, and sampling rate is 8 kHz. We utilize the sea-surface reflection traveltime positioning method discussed in Section 3.2.2, the piecewise approximate slanted interface processing mentioned in Section 3.1, and the method proposed in this paper to invert the array geometry based on the above real data. Then, based on the inverted source-receiver positioning results, we carry out subsequent seismic image processing without residual time difference correction. Figure 13 shows the velocity spectra acquired at the common midpoint (CMP) based on the processed sea trial data. Figure 14 shows the seafloor sedimentary characteristics and structural details in the seismic imaging profile at the selected survey line.
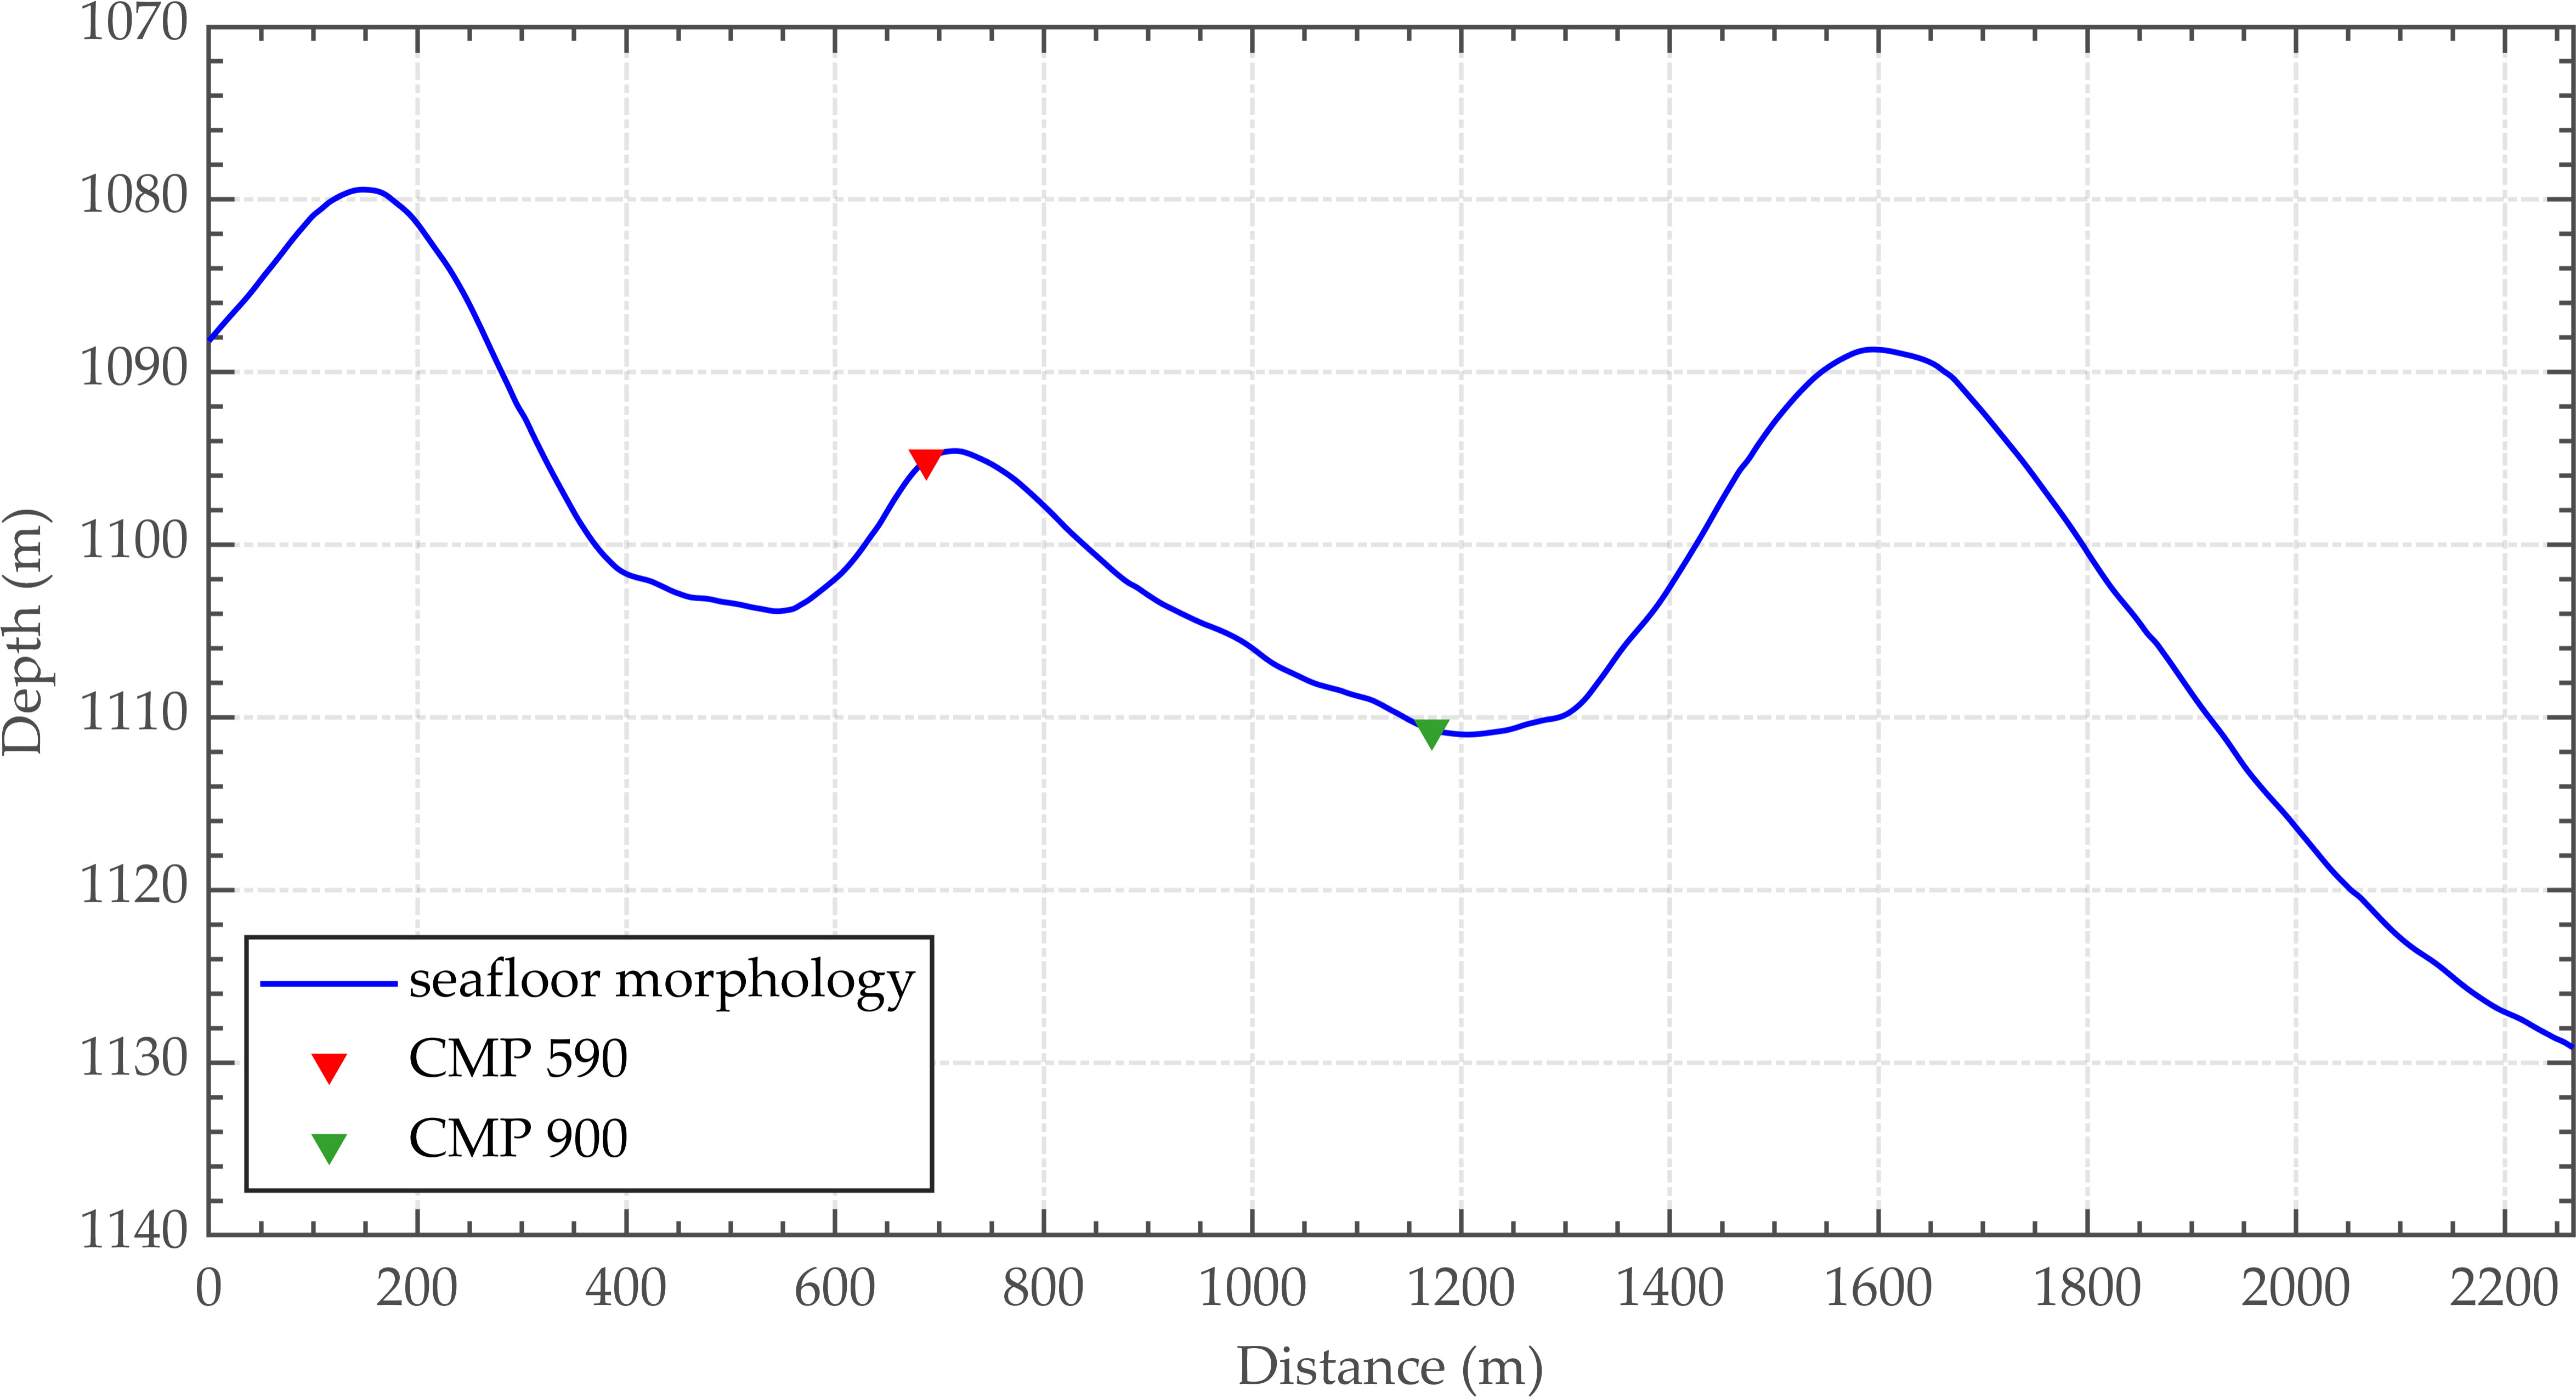
Figure 12 Seafloor morphology of sea trial datasets.
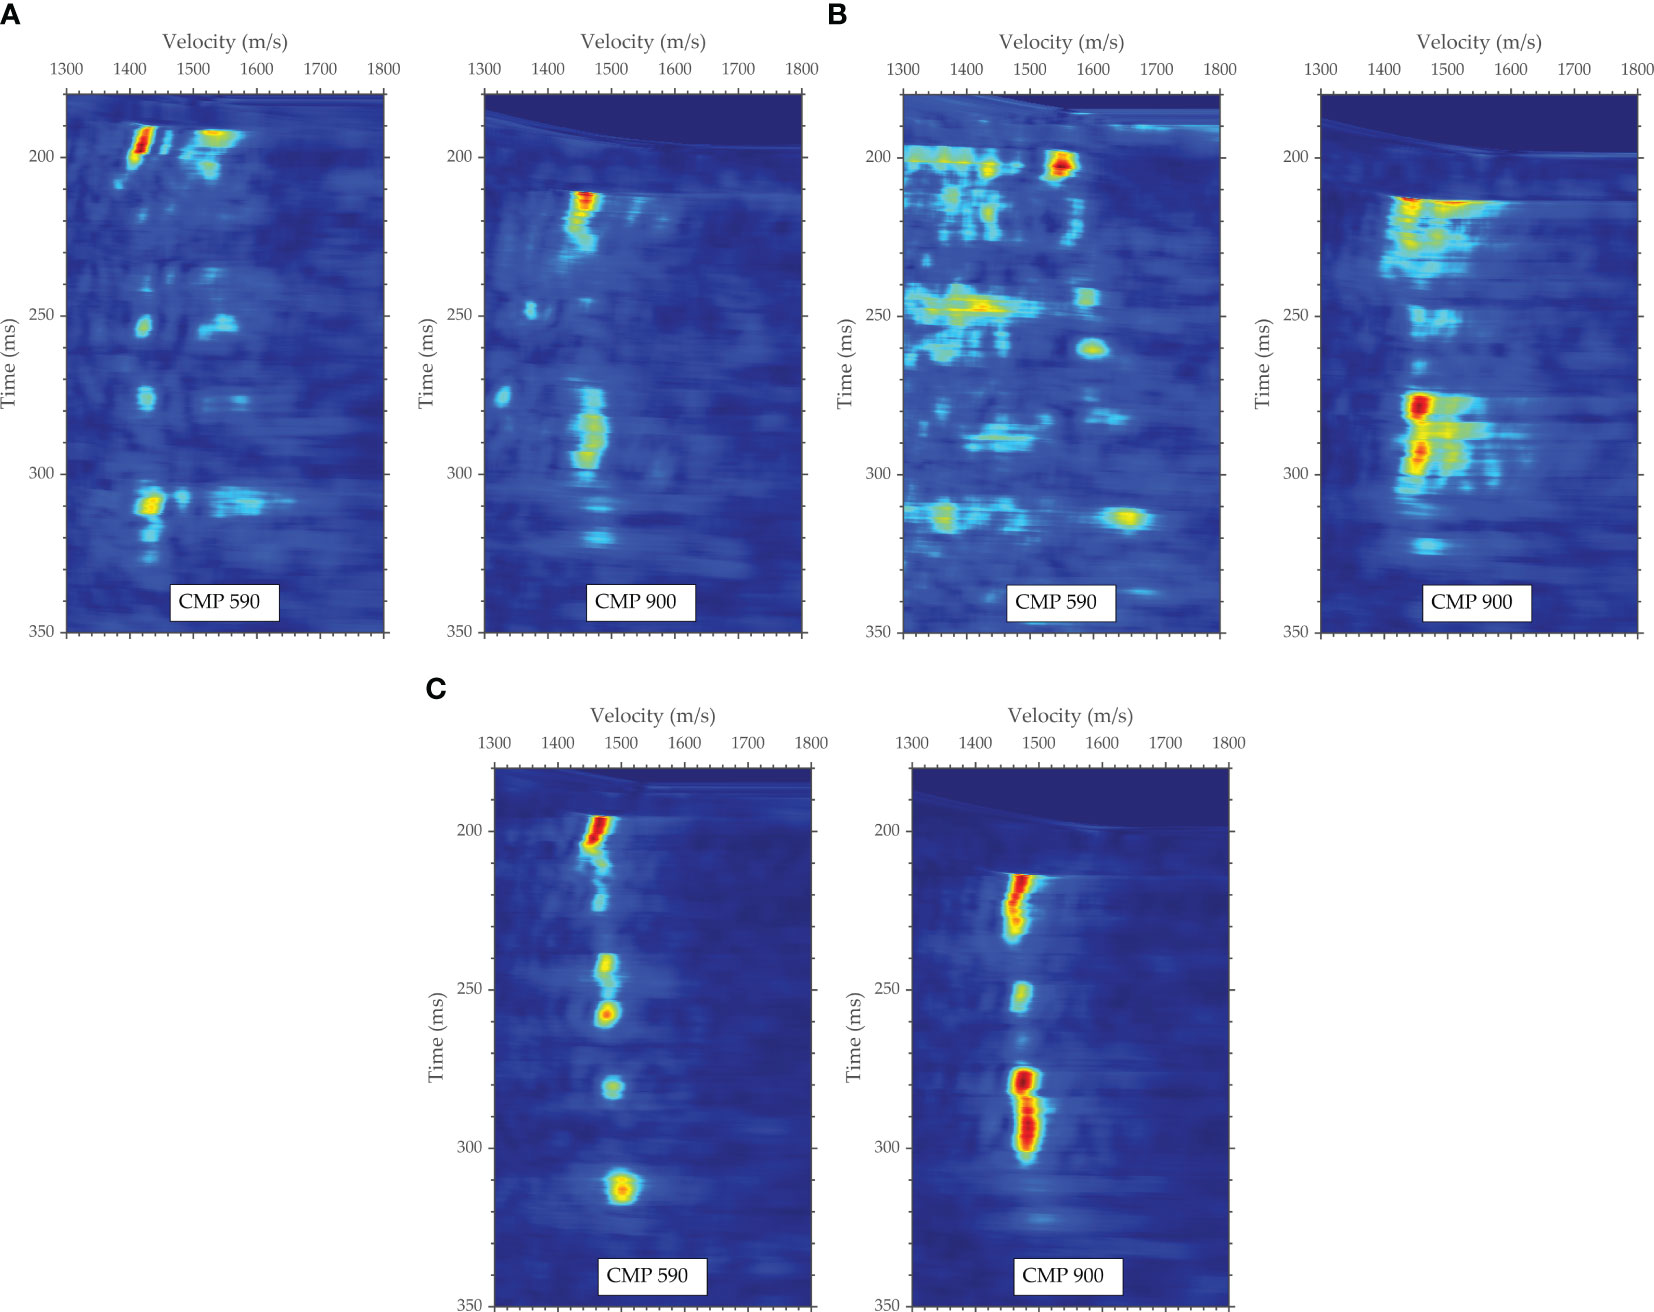
Figure 13 Velocity spectra comparison of sea trial datasets corresponding to different inversion methods. ((A) Sea-surface reflection traveltime positioning method; (B) Piecewise approximate slanted interface processing strategy; (C) Proposed method).
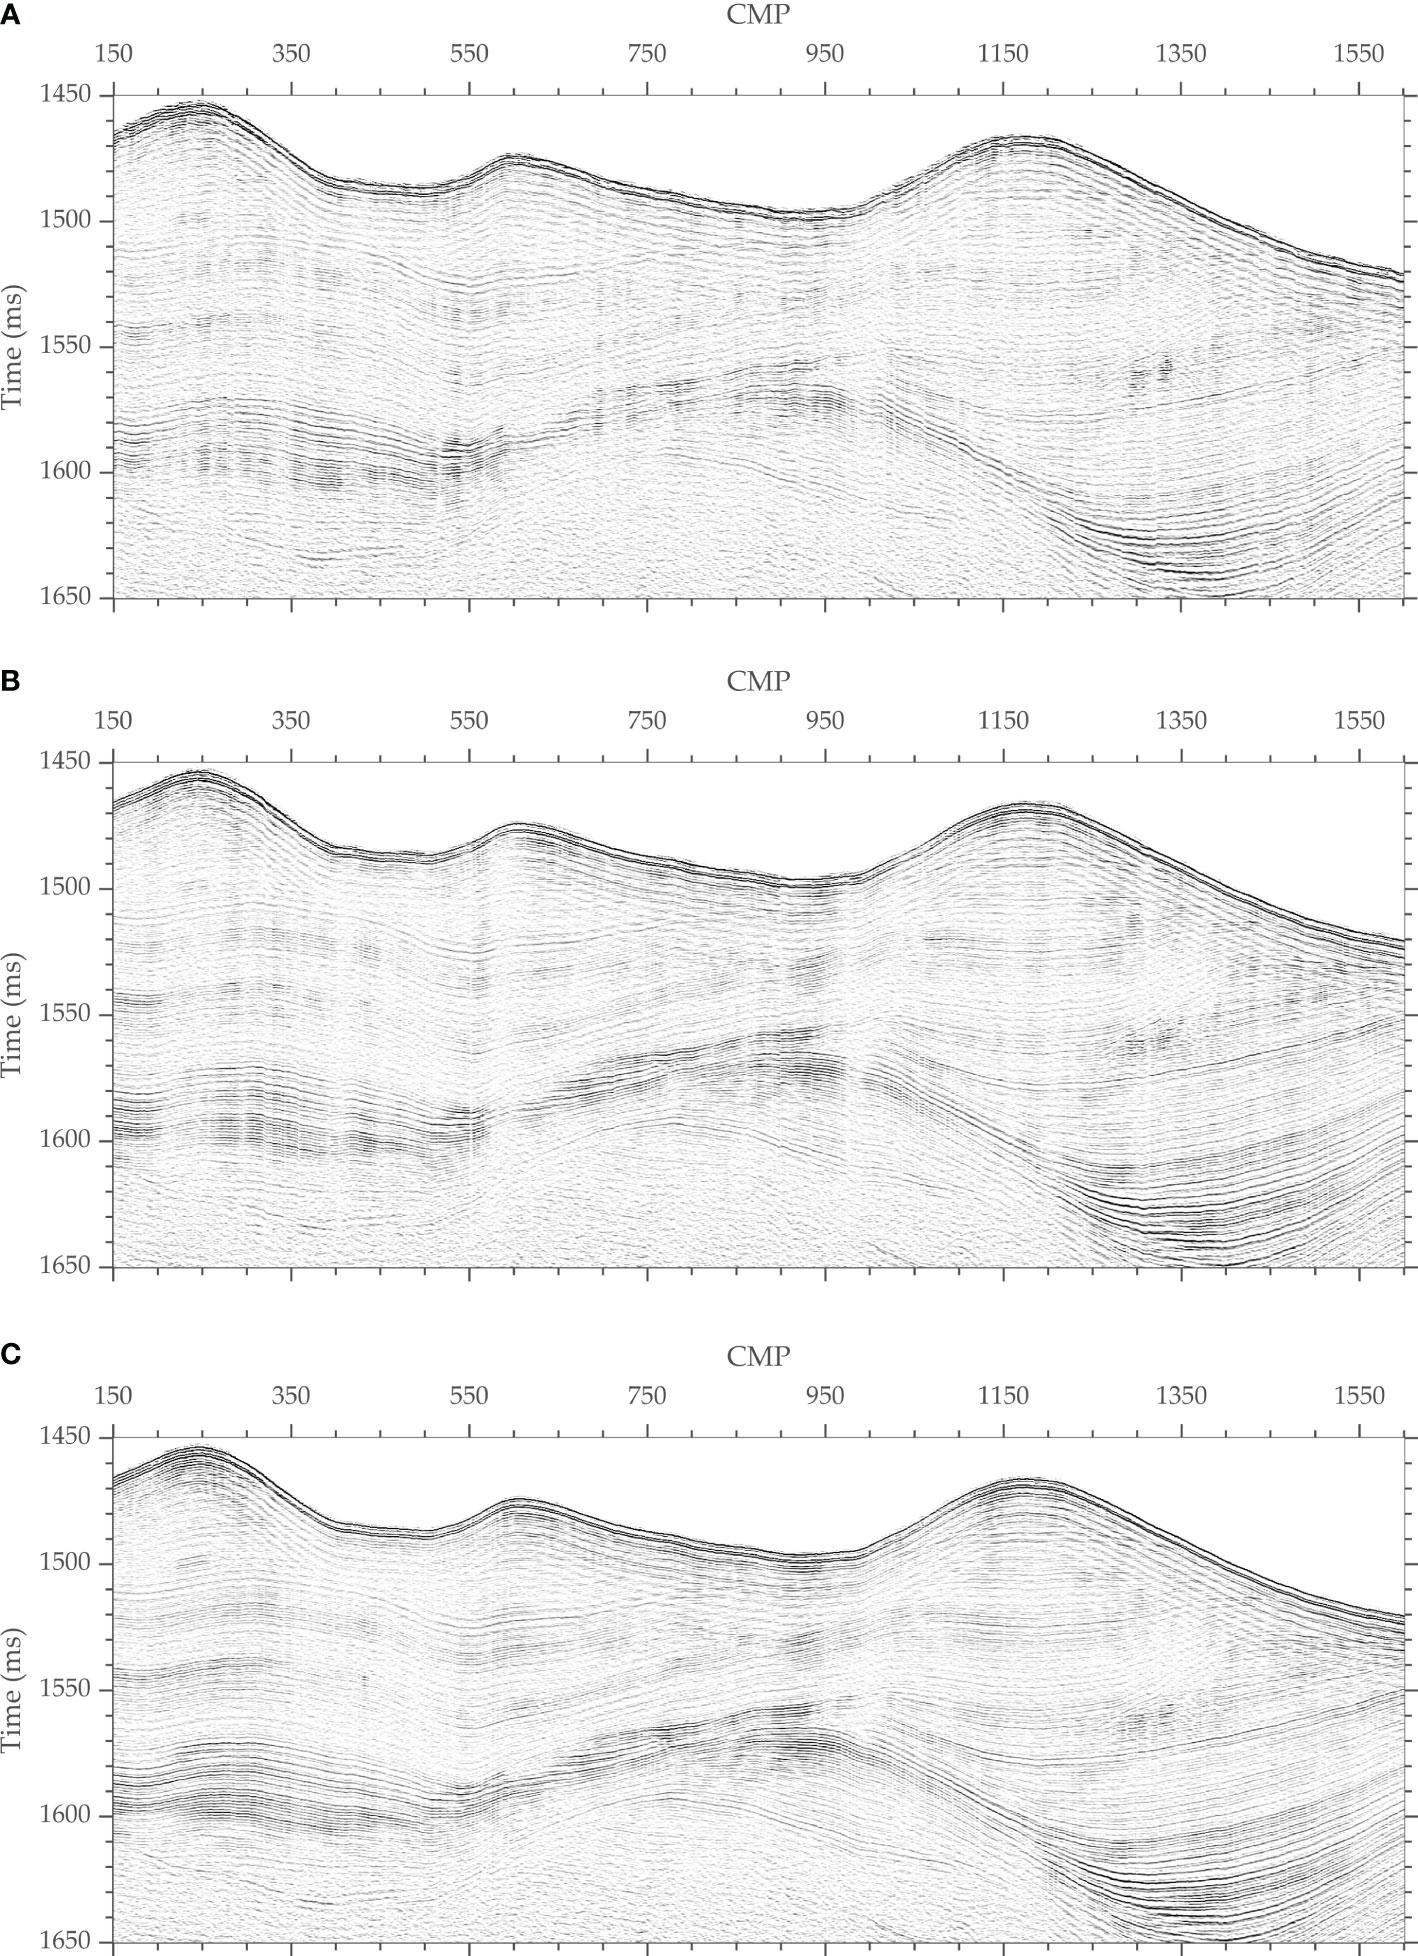
Figure 14 Comparison of deep-towed multichannel seismic imaging profiles of sea trial datasets corresponding to different inversion methods. ((A) Sea-surface reflection traveltime positioning method; (B) Piecewise approximate slanted interface processing strategy; (C) Proposed method).
The velocity spectra shown in Figure 13 were obtained in a region in which the seabed morphology undergoes drastic changes. Figures 13A, B show that the hyperbolic features in the seismic reflection records are not well recovered after floating datum correction with the array geometry inversion results obtained by the two methods, resulting in poor focusing of the velocity spectra. However, the velocity spectra obtained by the proposed method is more focused, as shown in Figure 13C, which is conducive to establishing fine velocity structures and improving the seismic imaging quality. The seismic imaging profile shown in Figure 14A was produced using the array geometry inversion technique based on the sea-surface reflection traveltime, while the seismic imaging profiles shown in Figures 14B, C were generated employing the technique based on the seafloor reflection traveltime. Moreover, the result shown in Figure 14B was obtained using the piecewise approximate slanted interface processing strategy, while the result shown in Figure 14C was obtained utilizing the method proposed in this paper. The comparison shows that the seismic imaging profile obtained by the proposed method has the best overall quality, the clearest wave group features, and the best event continuity, particularly in areas in which the seafloor topography varies significantly. As shown in Figure 14A, the array geometry inversion results based on the sea-surface reflection traveltime are more sensitive to input data errors, leading to the worst SNR and resolution in the seismic imaging profile. The seafloor strata shown in Figure 14C have a finer image quality than those shown in Figure 14B, and there is no imaging loss or distortion in the areas with dramatic seabed topography changes, which is compatible with the circumstances presented in Figure 13.
In conclusion, the array geometry inversion method described in this study has greatly improved accuracy, enabling effective detection and imaging of regions with large seabed topographic variations. The proposed method is shown to have incomparable applicability and effectiveness in obtaining exact source-receiver positions for deep-towed multichannel seismic systems. Regardless of the complexity of the seabed morphology, seismic image processing techniques using the source-receiver position data obtained by the suggested method produce fine seismic imaging profiles that clearly and accurately reflect the structural characteristics of sediments. Additionally, despite the limited accuracy of the array geometry inversion associated with the processing strategy based on the piecewise approximate slanted interface, this method could be used because of its high computational efficiency to quickly obtain field seismic processing results in the near-bottom acoustic investigations conducted in flat seabed areas, thereby realizing on-site monitoring of the performance of deep-towed multichannel seismic systems and the quality of the data.
We present an array geometry inversion method suitable for complex seafloors to address the challenge of precise source-receiver positioning with deep-towed multichannel seismic systems. Our method does not rely on an initial model, and the objective function of the deep-towed seismic array geometry inversion is built using the shortest path algorithm according to the traveltimes of direct waves and seafloor reflections. Moreover, the PSO algorithm is used to achieve high-precision inversion of the source-receiver position. The numerical analyses and field data application results verify the effectiveness of the method proposed in this paper, especially its applicability in scenarios with dramatic changes in seabed topography. Moreover, influencing factor and uncertainty analyses are used to evaluate the dependence of the accuracy of the proposed inversion method on seismic traveltime, seawater velocity and seabed morphology errors. The results provide insights for the accuracy and reliability of the proposed geometric shape inversion method for deep-towed seismic arrays in practical applications to meet the requirements of near-bottom acoustic detection for fine imaging of deep-sea seabed strata and precise inversion of geoacoustic parameters. As a future work, the proposed algorithm can be modified to estimate the optimal seawater velocity while recovering the array geometry of deep-towed multichannel seismic systems, and the computational efficiency needs to be improved due to the massive deep-towed seismic data.
The original contributions presented in the study are included in the article/supplementary material. Further inquiries can be directed to the corresponding author.
JL: Methodology, Visualization, Writing – original draft, Investigation. YP: Conceptualization, Methodology, Writing – review & editing. CL: Investigation, Supervision, Writing – review & editing. LZ: Investigation, Writing – review & editing. XL: Investigation, Writing – review & editing. KL: Conceptualization, Methodology, Supervision, Writing – review & editing. WL: Investigation, Writing – review & editing.
The authors declare financial support was received for the research, authorship, and/or publication of this article. This study was supported by the special funds of Laoshan Laboratory (No. LSKJ202203604), the National Key Research and Development Program of China (No. 2016YFC0303901), and the National Natural Science Foundation of China (No. 42206226).
The authors declare that the research was conducted in the absence of any commercial or financial relationships that could be construed as a potential conflict of interest.
All claims expressed in this article are solely those of the authors and do not necessarily represent those of their affiliated organizations, or those of the publisher, the editors and the reviewers. Any product that may be evaluated in this article, or claim that may be made by its manufacturer, is not guaranteed or endorsed by the publisher.
Breitzke M., Bialas J. (2003). A deep-towed multichannel seismic streamer for very high-resolution surveys in full ocean depth. First Break 21 (12), 59–65. doi: 10.3997/1365-2397.21.12.25738
Chapman N., Gettrust J., Walia R., Hannay D., Spence G., Wood W., et al. (2002). High-resolution, deep-towed, multichannel seismic survey of deep-sea gas hydrates off western Canada. Geophycics 67 (4), 1038–1047. doi: 10.1190/1.1500364
Colin F., Ker S., Marsset B. (2020a). Fine-scale velocity distribution revealed by datuming of very-high-resolution deep-towed seismic data: Example of a shallow-gas system from the western Black Sea. Geophycics 85 (5), B181–B192. doi: 10.1190/geo2019-0686.1
Colin F., Ker S., Riboulot V., Sultan N. (2020b). Irregular BSR: Evidence of an ongoing reequilibrium of a gas hydrate system. Geophys. Res. Lett. 47 (20), 1–10. doi: 10.1029/2020GL089906
Gettrust J., Grimm M., Madosik S., Rowe M. (1988). Results of a deep-tow multichannel survey on the Bermuda Rise. Geophys. Res. Lett. 15 (12), 1413–1416. doi: 10.1029/GL015i012p01413
Gettrust J., Wood W., Spychalski S. (2004). High-resolution MCS in deepwater. Leading Edge 23 (4), 374–377. doi: 10.1190/1.1729234
He T., Spence G., Wood W., Riedel M., Hyndman R. (2009). Imaging a hydrate-related cold vent offshore Vancouver Island from deep-towed multichannel seismic data. Geophycics 74 (2), B23–B36. doi: 10.1190/1.3072620
Hutapea F., Tsuji T., Katou M., Asakawa E. (2020). Data processing and interpretation schemes for a deep-towed high-frequency seismic system for gas and hydrate exploration. J. Nat. Gas Sci. Eng. 83, 103573. doi: 10.1016/j.jngse.2020.103573
Ker S., Le Gonidec Y., Marsset B., Westbrook G., Gibert D., Minshull T. (2014). Fine-scale gas distribution in marine sediments assessed from deep-towed seismic data. Geophys. J. Int. 196 (3), 1466–1470. doi: 10.1093/gji/ggt497
Korenaga J., Holbrook W. S., Kent G. M., Kelemen P. B., Detrick R. S., Larsen H.-C., et al. (2000). Crustal structure of the southeast Greenland margin from joint refraction and reflection seismic tomography. J. Geophys. Res. 105 (B9), 21591–21614. doi: 10.1029/2000JB900188
Liu H. W., Liu H. S., Xing L., Li Q. Q. (2022). A new method for OBS relocation using direct water wave arrival time and accurate bathymetric data. Mar. Geophys. Res. 43 (2), 1–17. doi: 10.1007/s11001-022-09482-0
Marsset B., Ker S., Thomas Y., Colin F. (2018). Deep-towed high resolution seismic imaging II: determination of P-wave velocity distribution. Deep-sea Res. Pt. I 132, 29–36. doi: 10.1016/j.dsr.2017.12.005
Marsset T., Marsset B., Ker S., Thomas Y., Le Gall Y. (2010). High and very high resolution deep-towed seismic system: performance and examples from deep water Geohazard studies. Deep-sea Res. Pt. I 57, 628–637. doi: 10.1016/j.dsr.2010.01.001
Marsset B., Menut E., Ker S., Thomas Y., Regnault J. P., Leon P., et al. (2014). Deep-towed high resolution multichannel seismic imaging. Deep-sea Res. Pt. I 93, 83–90. doi: 10.1016/j.dsr.2014.07.013
Pei Y. L., Wen M. M., Wei Z. R., Liu B. H., Liu K., Kan G. M. (2023). Data processing of the Kuiyang-ST2000 deep-towed high-resolution multichannel seismic system and application to South China Sea data. J. Oceanol. Limnol. 41 (2), 644–659. doi: 10.1007/s00343-022-2049-6
Pei Y. L., Wen M. M., Zhang L. C., Yu K. B., Kan G. M., Zong L., et al. (2022). Development of a high-resolution deep-towed multi-channel seismic exploration system: Kuiyang ST2000. J. Appl. Geophys. 198, 104575. doi: 10.1016/j.jappgeo.2022.104575
Riboulot V., Ker S., Sultan N., Thomas Y., Marsset B., Scalabrin C., et al. (2018). Freshwater lake to salt-water sea causing widespread hydrate dissociation in the Black Sea. Nat. Commun. 9, 117. doi: 10.1038/s41467-017-02271-z
Rowe M., Gettrust J. (1993). Fine structure of methane hydrate-bearing sediments on the Blake Outer Ridge as determined from deep-tow multichannel seismic data. J. Geophys. Res. 98 (B1), 463–473. doi: 10.1029/92JB01706
Sultan N., Bohrmann G., Ruffine L., Pape T., Riboulot V., Colliat J. L., et al. (2014). Pockmark formation and evolution in deep water Nigeria: rapid hydrate growth versus slow hydrate dissolution. J. Geophys. Res.-Sol. Ea. 119 (4), 2679–2694. doi: 10.1002/2013JB010546
Talukder A., Bialas J., Klaeschen D., Buerk D., Brueckmann W., Reston T., et al. (2007). High-resolution, deep tow, multichannel seismic and sidescan sonar survey of the submarine mounds and associated BSR off Nicaragua pacific margin. Mar. Geol. 241, 33–43. doi: 10.1016/j.margeo.2007.03.002
Walia R., Hannay D. (1999). Source and receiver geometry corrections for deep towed multichannel seismic data. Geophys. Res. Lett. 26 (13), 1993–1996. doi: 10.1029/1999GL900402
Wood W., Gettrust J. F., Spychalski S. (2003). A new deep-towed, multi-channel seismic system. Sea Technol. 44 (9), 44–49. doi: 10.1016/S0029-8018(02)00149-X
Wood W., Hart P., Hutchinson D., Dutta N., Snyder F., Coffin R., et al. (2008). Gas and gas hydrate distribution around seafloor seeps in Mississippi Canyon, Northern Gulf of Mexico, using multi-resolution seismic imagery. Mar. Petrol. Geol. 25 (9), 952–959. doi: 10.1016/j.marpetgeo.2008.01.015
Zhang J., Toksöz M. N. (1998). Nonlinear refraction traveltime tomography. Geophysics 63 (5), 1726–1737. doi: 10.1190/1.1444468
Keywords: near-bottom acoustic detection technology, deep-towed multichannel seismic system, array geometry inversion, complex seafloor, fine seismic imaging, accurate geoacoustic parameters inversion
Citation: Li J, Pei Y, Liu C, Zhang L, Luo X, Liu K and Li W (2023) A robust array geometry inversion method for a deep-towed multichannel seismic system with a complex seafloor. Front. Mar. Sci. 10:1283061. doi: 10.3389/fmars.2023.1283061
Received: 25 August 2023; Accepted: 11 September 2023;
Published: 27 September 2023.
Edited by:
Baohua Liu, National Deep Sea Center (NDSC), ChinaReviewed by:
Peng Guo, Commonwealth Scientific and Industrial Research Organisation (CSIRO), AustraliaCopyright © 2023 Li, Pei, Liu, Zhang, Luo, Liu and Li. This is an open-access article distributed under the terms of the Creative Commons Attribution License (CC BY). The use, distribution or reproduction in other forums is permitted, provided the original author(s) and the copyright owner(s) are credited and that the original publication in this journal is cited, in accordance with accepted academic practice. No use, distribution or reproduction is permitted which does not comply with these terms.
*Correspondence: Kai Liu, bGl1a0BmaW8ub3JnLmNu
Disclaimer: All claims expressed in this article are solely those of the authors and do not necessarily represent those of their affiliated organizations, or those of the publisher, the editors and the reviewers. Any product that may be evaluated in this article or claim that may be made by its manufacturer is not guaranteed or endorsed by the publisher.
Research integrity at Frontiers
Learn more about the work of our research integrity team to safeguard the quality of each article we publish.