 Elizabeth H. Shadwick1,2*
 Cathryn A. Wynn-Edwards1,2
 Richard J. Matear1
 Peter Jansen1
 Eric Schulz3
 Adrienne J. Sutton4
- 1Commonwealth Scientific and Industrial Research Organisation (CSIRO), Environment, Hobart, TAS, Australia
- 2Australian Antarctic Program Partnership (AAPP), University of Tasmania, Hobart, TAS, Australia
- 3Bureau of Meteorology, Melbourne, VIC, Australia
- 4Pacific Marine Environmental Laboratory, National Oceanic and Atmospheric Administration (NOAA), Seattle, WA, United States
The Subantarctic Zone, the circumpolar region of the Southern Ocean between the Subtropical and Subantarctic fronts, plays an important role in air-sea CO2 exchange, the storage of anthropogenic CO2, and the ventilation of the lower thermocline. Here we use a time series from moored platforms deployed between 2011 and 2021 as part of the Southern Ocean Time Series (SOTS) observatory to investigate the seasonality and interannual variability of upper ocean hydrography and seawater CO2 partial pressure (pCO2). The region is a net sink for atmospheric CO2 over the nearly 10-year record, with trends revealing that the ocean pCO2 may be increasing slightly faster than the atmosphere, suggesting that oceanic as well as anthropogenic atmospheric forcing contributes to the decadal change, which includes a decline in pH on the order of 0.003 yr−1. The observations also show an amplification of the seasonal cycle in pCO2, potentially linked to changes in mixed layer depth and biological productivity.
1 Introduction
The Southern Ocean dominates the control of global climate, now and over the past few 100,000 years (Sigman and Boyle, 2000). It redistributes heat and salinity among the major ocean basins, influencing temperature and rainfall patterns (Orsi et al., 1999; Rintoul and Sokolov, 2001), and playing a crucial role in the global carbon cycle (e.g., Gruber et al., 2019). Southern Ocean carbon fluxes reflect the ocean uptake of roughly 40% of anthropogenic emissions (Sabine et al., 2004; Khatiwala et al., 2013; Frölicher et al., 2015) as well as spatial variations in the uptake and outgassing of natural CO2 (Metzl et al., 2006; Takahashi et al., 2009; Lenton et al., 2013; Gruber et al., 2019).
Few fully resolved seasonal cycles of air-sea exchange exist for the Southern Ocean, and even the most sophisticated Earth System Models tend to be biased (Rickard et al., 2016; Law et al., 2017) and fail to simulate both the seasonal cycle and the amplitude of CO2 uptake (Lenton et al., 2013; Sasse et al., 2015; Hauck et al., 2023). Importantly this may reflect evolving understanding of seasonality in biological carbon cycling (Behrenfeld, 2010; Taylor and Ferrari, 2011; Behrenfeld and Boss, 2014; Weeding and Trull, 2014; Shadwick et al., 2015). Recent assessments of Southern Ocean air-sea CO2 flux from profiling floats have highlighted the importance of year-round observations and shown that accounting for winter outgassing significantly reduces the magnitude of Southern Ocean carbon uptake (Gray et al., 2018; Bushinsky et al., 2019). There are also indications that regional fluxes vary on decadal and shorter time scales (e.g., Landschützer et al., 2015; McKinley et al., 2016; Gruber et al., 2019), and a growing number of observational platforms have been employed to constrain uncertainty in the Southern Ocean air-sea CO2 exchange (e.g., Long et al., 2021; Sutton et al., 2021; Landschützer et al., 2023).
Long-time series are important for the validation of float based observations (e.g. Fay et al., 2018; Wynn-Edwards et al., 2023) and for understanding air-sea interactions on decadal timescales in the Southern Ocean and elsewhere (e.g., Sutton et al., 2017; Brandon et al., 2022; Leseurre et al., 2022), as well as to improve model representation of these processes for reliable forecasting of the evolving ocean and global carbon cycle. Distinguishing anthropogenic signals from natural interannual variability requires observations sustained over many years. A recent analysis of 40 ocean time series sites determined that the time of emergence for anthropogenic trends in pH (e.g. ocean acidification) in the open ocean is between 8 and 15 years (Sutton et al., 2019), consistent with model-based estimates (Schlunegger et al., 2019).
The Subantarctic zone (SAZ) lies between the Subtropical and Subantarctic Fronts (Figure 1) (Rintoul and Trull, 2001); this region is associated with a net CO2 sink in the Southern Ocean (e.g. Metzl et al., 1999; Brévière et al., 2006; McNeil et al., 2007; Borges et al., 2008; Sallée et al., 2012; Lenton et al., 2013; Gruber et al., 2019). Deep convective mixing to depths greater than 500 m in winter results in the formation of Subantarctic Mode Water (SAMW), which contributes to the uptake and storage of anthropogenic CO2 (McNeil et al., 2001; Sabine et al., 2004; Sallée et al., 2012; Pardo et al., 2017). Assessing trends in pCO2 seasonality in this region may be complicated by large scale climate modes (e.g. Borges et al., 2008; Prend et al., 2022), and has been hampered by a lack of observations outside of the summer season (e.g. Brévière et al., 2006; Xue et al., 2018). Here we present seasonally resolved observations from the Southern Ocean Time Series (SOTS) site in the Australian sector of the SAZ between from 2011 and 2021. We construct seasonal climatologies, compute air-sea CO2 fluxes, and compare the SOTS observations to both the Rödenbeck et al. (Rödenbeck et al., 2013; Rödenbeck et al., 2022) Carboscope-Lena and Landschützer et al. (2020) SOM-FFN gridded pCO2 data products. We then make an assessment of changes over the decade and examine the potential drivers of these trends.
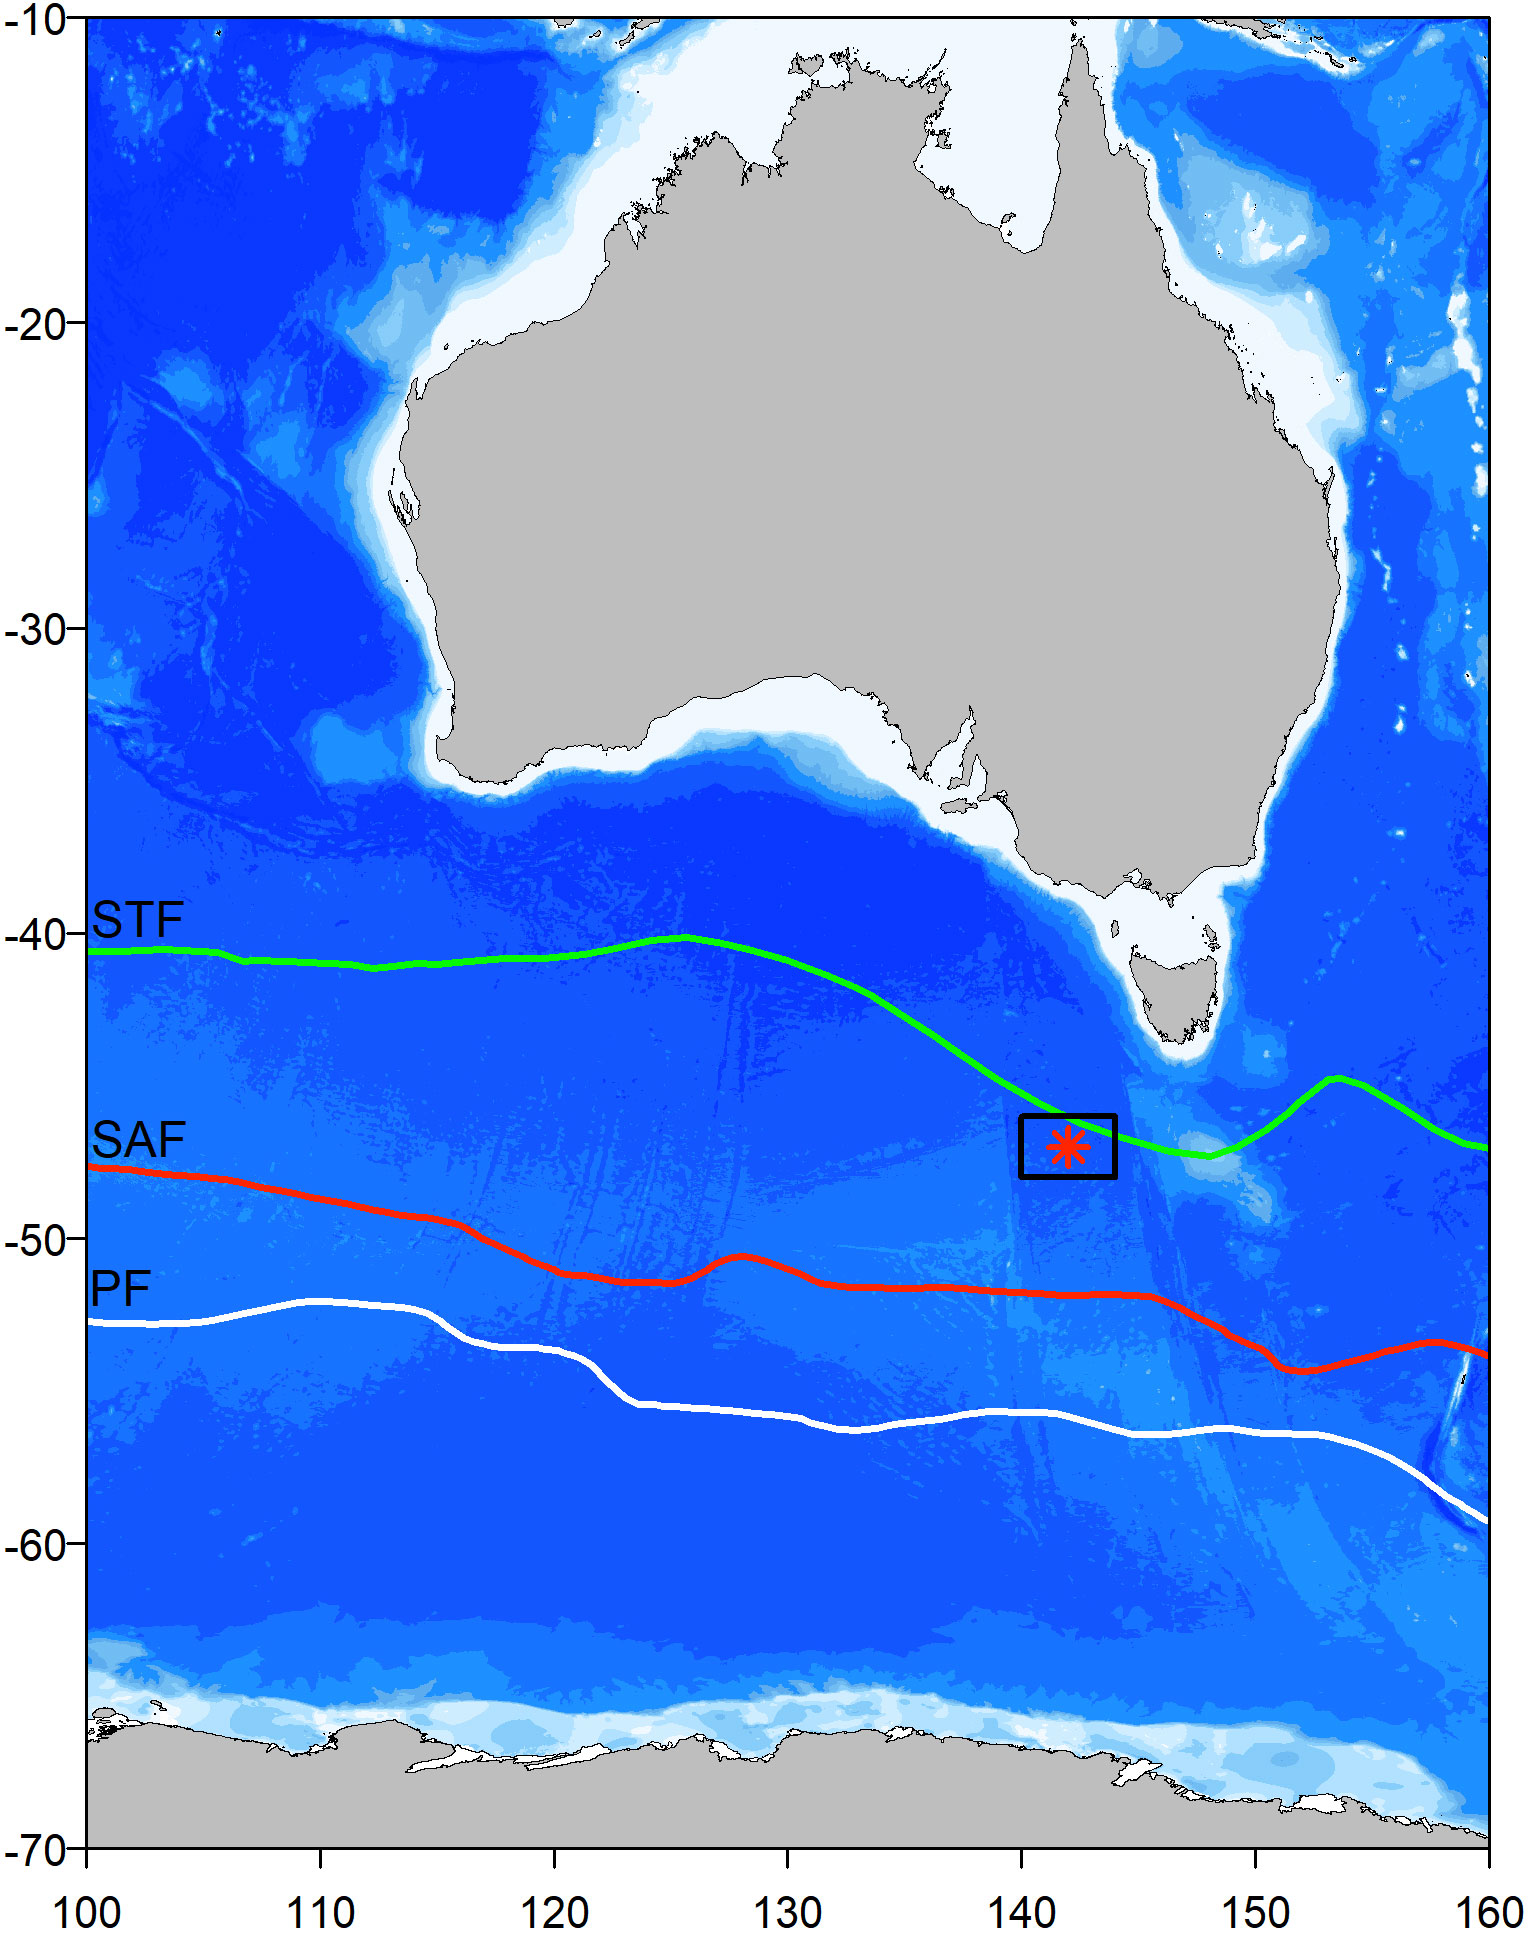
Figure 1 The Southern Ocean Time Series (SOTS) site (red star) in the Subantarctic Southern Ocean south west of Tasmania (47°S,142°E). The climatological positions of the Subtropical Front (STF), the Subantarctic Front (SAF) and Polar Front (PF) following Orsi et al. (1995) are shown along with the regional bathymetry (dark colours are deeper).
2 Methods
2.1 Observations at the Southern Ocean Time Series
The Southern Ocean Time Series (SOTS) is part of the Australian Integrated Marine Observing System, and consists of two deep ocean moorings (Schulz et al., 2012; Shadwick et al., 2015) in the SAZ located near 47°S and 142°E (Figure 1). The Southern Ocean Flux Station (SOFS) mooring is an air-sea flux and biogeochemistry platform, with data from the surface ocean and atmosphere transmitted in near-real time, while data from sensors at depth are collected when the moorings are retrieved annually. Data collected at SOTS are freely available via the Australian Ocean Data Network (AODN; https://portal.aodn.org.au/).
The SOFS mooring configuration is described in detail in Schulz et al. (2012) and Shadwick et al. (2015). Moorings deployments are numbered sequentially; we present observations from 2011 to 2021 acquired with moorings SOFS2 to SOFS9. Descriptions of sensors used to collect temperature data are given in Jansen et al. (2022a) and salinity in Jansen et al. (2022b). Temperature is measured between the surface and 500 m; data were gridded to UTC hour by averaging all values acquired within 30 minutes of the hour at each depth (Jansen et al., 2022c). The gridded temperature data was used to compute mixed layer depth (MLD), as described in Weeding and Trull (2014) and Shadwick et al. (2015).
A Moored Autonomous pCO2 (MAPCO2) system measures the mole fraction of CO2 in surface seawater (at approximately 0.5 m below the surface) and marine boundary air (at approximately 1.5 m above the sea surface) every 3 h as described in Sutton et al. (2014); the pCO2 data have an estimated uncertainty of less than 2 µatm.
Discrete seawater samples are collected via a McLane Remote Access Sampler (RAS) deployed in the SOFS surface float (Davies et al., 2020), with the intake approximately 4m below the surface; samples are analysed for total alkalinity (TA) via (open cell) potentiometric titration, following standard procedures (Dickson et al., 2007) at the CSIRO Laboratory in Hobart (see Shadwick et al. (2020) for additional detail). The precision and accuracy of the alkalinity measurements are on the order of 3 µmol kg−1. A relationship between TA and salinity at the SOTS site has been developed from samples collected over many years (Shadwick et al., 2015; Shadwick et al., 2020), and was used to compute a time series of TA from sensor salinity. The TA and pCO2 time series were then used to compute pH (total scale) and dissolved inorganic carbon (TCO2) using the CO2sys program in Matlab (Lewis and Wallace, 1998; van Heuven et al., 2011; Sharp et al., 2023), the using carbonate dissociation constants of Lueker et al. (2000), the fluoride dissociate constant of Perez and Fraga (1987), the sulphate dissociate constant of Dickson (1990), and the boron to salinity ratio of Lee et al. (2000). Silicate and phosphate were set to mean values of 2.0 µmol kg−1 and 1.0 µmol kg−1, consistent with observations at the SOTS site (Davies et al., 2020). The uncertainty associated with the computed pH is estimated to be 0.007 following Orr et al. (2018).
2.2 CO2 flux computations
The air-sea exchange of CO2 was computed with the following equation:
where F is the flux, k and α are the gas transfer velocity, and the coefficient of solubility (Weiss, 1974), respectively, and ΔpCO2 is the gradient in CO2 between the ocean and the atmosphere. The gas transfer velocity was computed from hourly wind measurements (see Schulz et al. (2012) for details), using the gas transfer parameterisation of Wanninkhof (2014). We note that there are a range of gas transfer velocity parameterisations, and that this choice may be associated with relatively high uncertainty in the magnitude of the air-sea fluxes at high wind speeds typical of the Southern Ocean (Roobaert et al., 2018). A negative flux indicates CO2 uptake by the ocean.
2.3 Analysis of trends
For the detection of trends in the pCO2 time series we followed Sutton et al. (2022) and used the associated Trends of Ocean Acidification Time Series (TOATS) open-source code. The SOTS observations have relatively uniform distribution in terms of the number of observations acquired in each month of the year, with a minimum of 800 observations in November, and a maximum 1400 observations in May (see Figure S1), this distribution of observations over the annual cycle was determined to be sufficient to constrain the climatological monthly means. This climatology was then used to remove the seasonal cycle from the time series before fitting a linear regression to the deseasoned monthly means to compute a trend between 2011 and 2021.
Because the SOTS time series has fewer gaps at the end of the record, the climatology is likely biased by most recent observations (Figure 2). To assess the impact of this on the detection of trends, in addition to computing trends using the Sutton et al. (2022) recommendations described above, trends were also computed on the basis of mean winter observations (defined as the months of June, July and August), where there are fewer gaps over the entire record, between 2012 and 2020 using a linear regression directly on the observations.
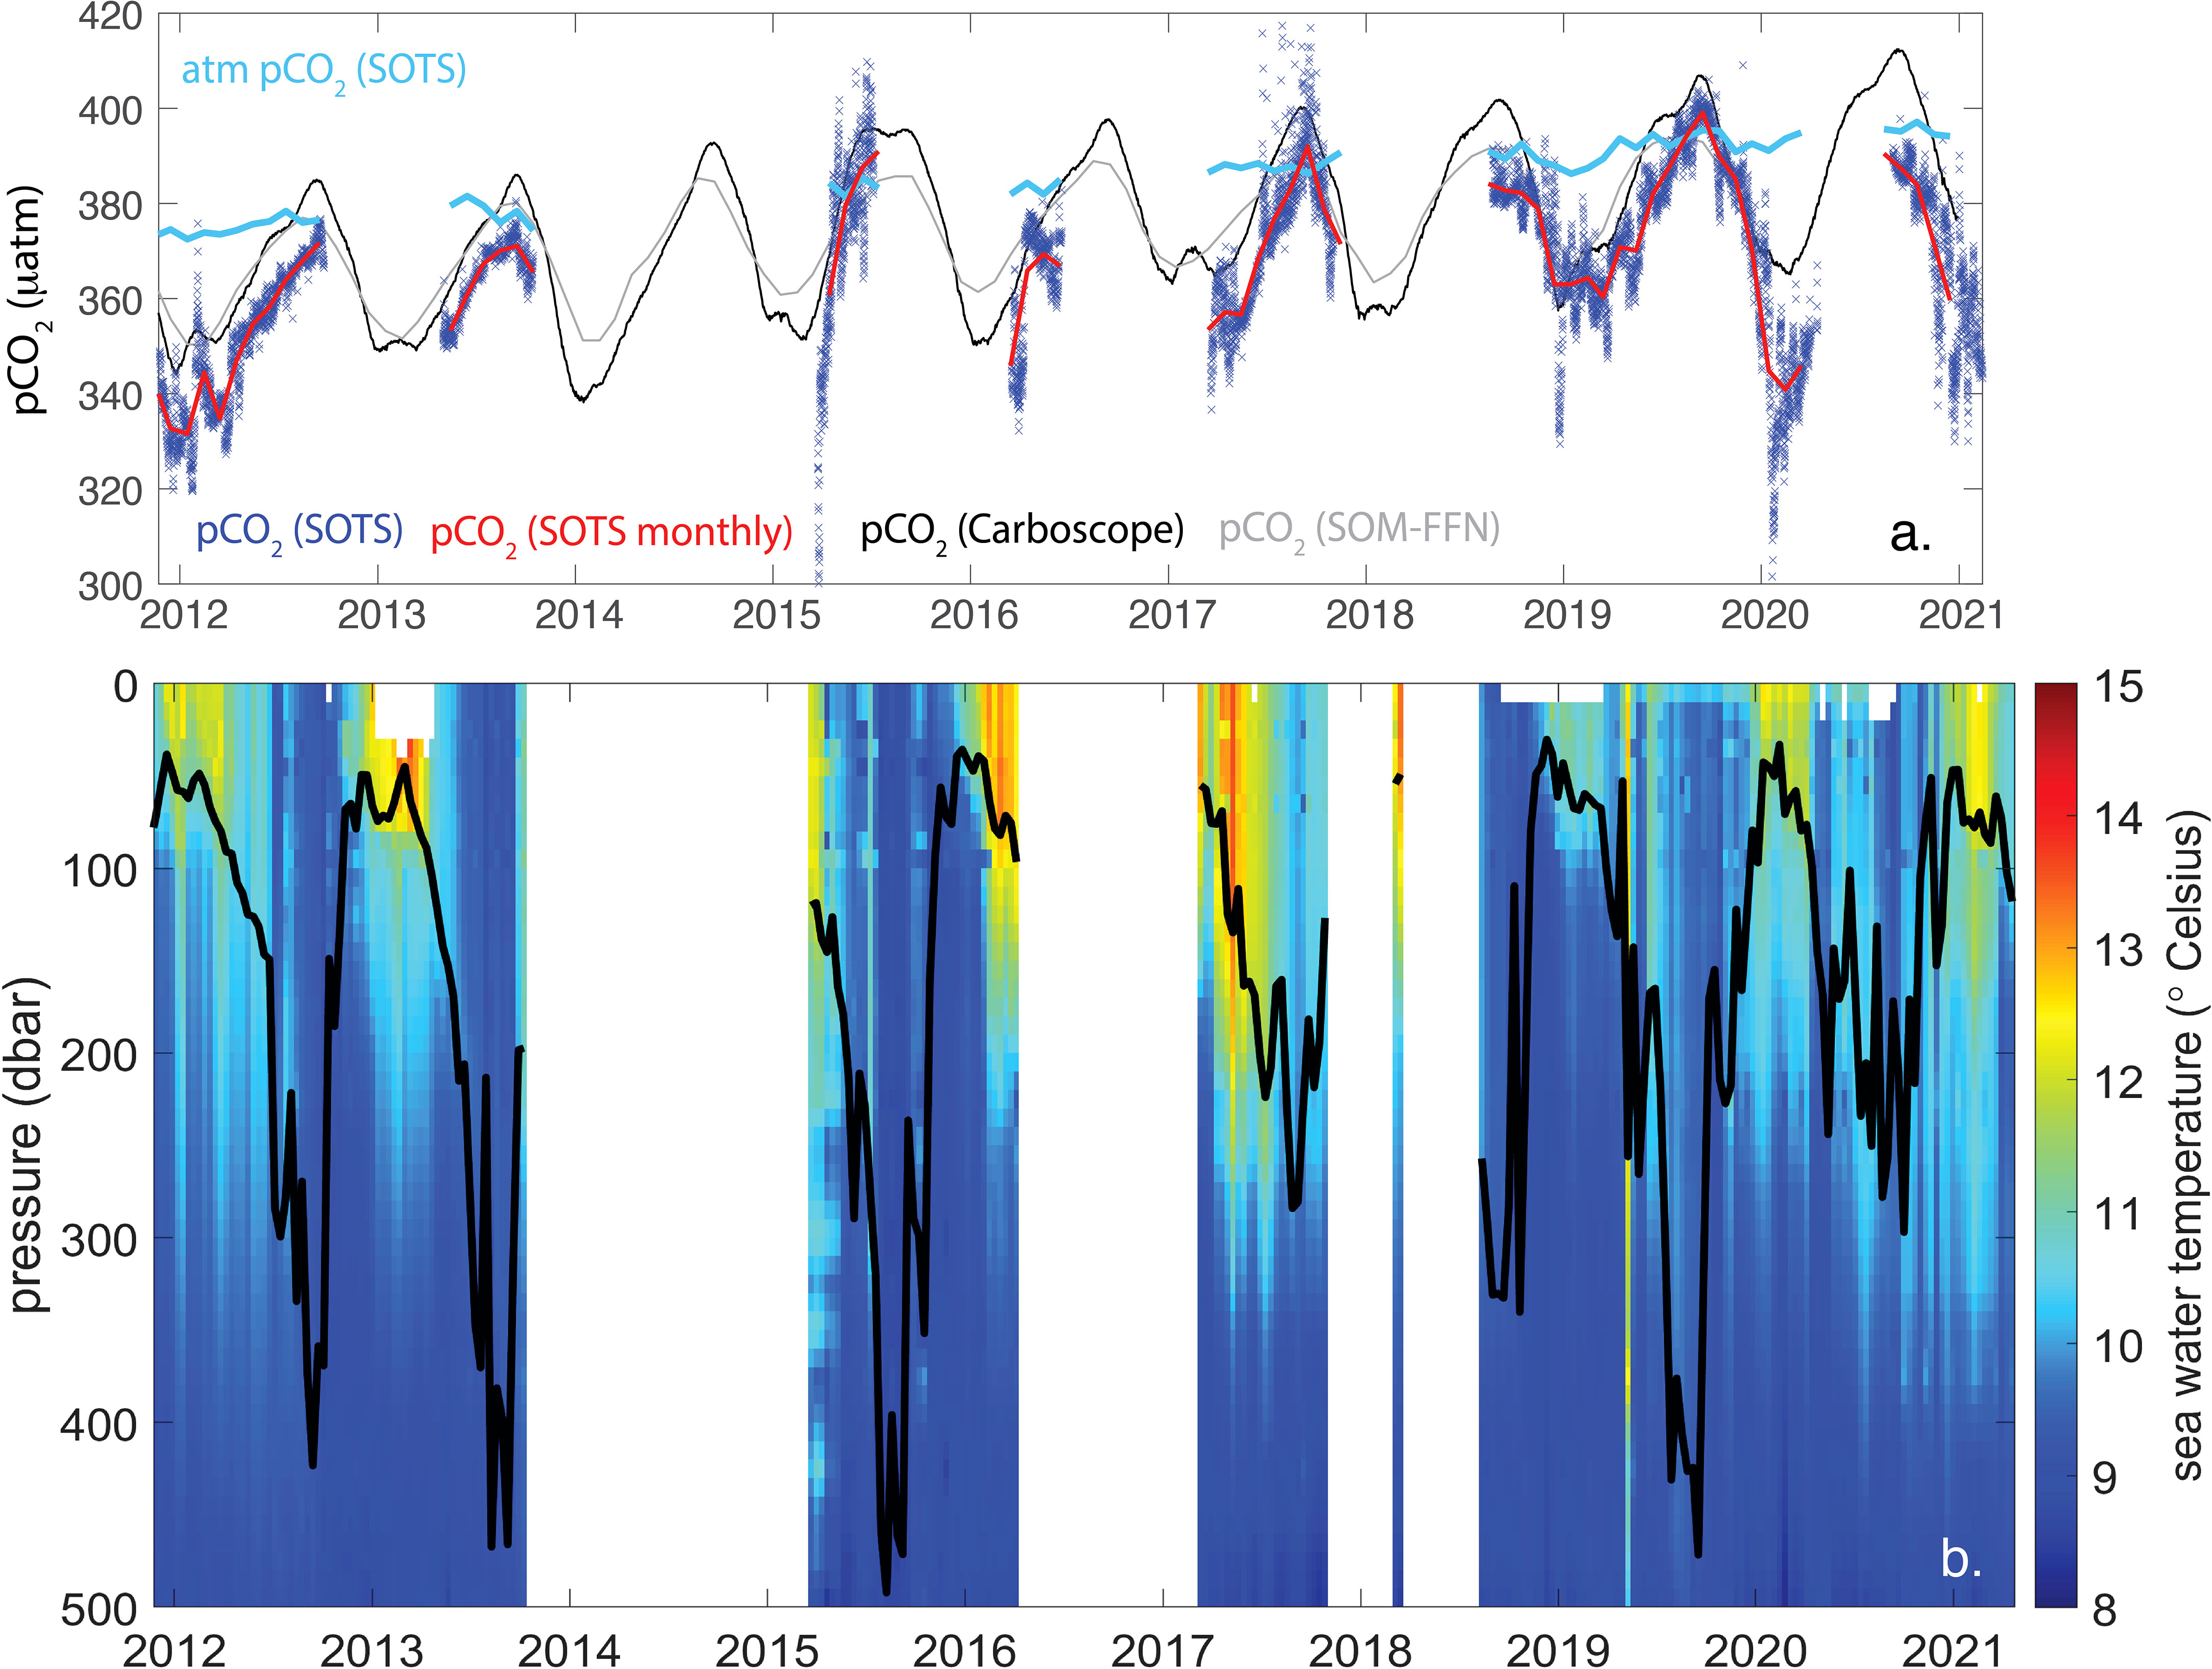
Figure 2 (A) Time series of surface water (dark blue x's) and atmospheric (blue line) pCO2 observations at the SOTS site between 2011 to 2021, with monthly mean surface water pCO2 given by the red line. Also shown are the Carboscope (black line) and SOM-FFN (gray line) pCO2 products. (B) temperature in the upper 500 m of the water column and associated mixed layer depth (MLD, black line) over the same period as in (A).
2.4 Ancillary data products
Observed pCO2 at the SOTS site were compared to two reconstructed pCO2 products: (1) the Jena CarboScope product, which is based on the Suface Ocean Carbon Atlas (SOCAT) data, and uses data driven ocean mixed layer scheme described in Rödenbeck et al. (Rödenbeck et al., 2013; Rödenbeck et al., 2022); and (2) the SOM-FFN pCO2 climatology of (Landschützer et al., 2020), which also uses the SOCAT data, and a neural network technique to produce a gridded product (Landschützer et al., 2013; Landschützer et al., 2020). The CarboScope data is version oc-v2022 and extends through the year 2021 (Rödenbeck et al., 2022); the SOM-FFN data is based on SOCAT observations up to 2015 and extends to the beginning of 2020 (Landschützer et al., 2020). Since both of these products use the SOCAT data, they will also include the SOTS data available in the SOCAT database (e.g. Bakker et al., 2016), and are not fully independent datasets. The air-sea CO2 fluxes at the SOTS site were compared to the Takahashi et al. (2009) climatology which we note was produced for the nominal year of 2000, so represents the decade prior to the SOTS observations presented here.
To evaluate the mechanisms driving long term trends in the region, we evaluated time series of MLD, net primary production, and chlorophyll-a (as a proxy for biomass) from the CAFE60 reanalysis product described in (O’Kane et al., 2021a; O’Kane et al., 2021b). For all of the products described above, data were subsampled in a region centred around the SOTS site (48 to 46°S; 140 to 144°E; Figure 1), following earlier studies (e.g. Yang et al., 2023).
3 Results and discussion
3.1 Time series observations
Surface ocean and atmospheric pCO2 at the SOTS site are shown between late 2011 and early 2021 in Figure 2 along with upper ocean temperature (between the surface and 500 m), and MLD. The gaps in the time series are related to various logistical issues, including mooring and/or sensor failure, and ship availability. Between 2011 and 2021, roughly seven seasonal cycles have been observed at the SOTS site. The winter (summer) oceanic pCO2 was 370 (330) µatm in 2011, and increased to 380 (340) µatm in 2020 (Figure 2A). The mean winter atmospheric pCO2 increased from 376 µatm in 2011 to 393 µatm in 2020. The surface ocean is undersaturated with respect to the atmosphere at the SOTS site for the majority of the observations, with particularly low pCO2 in 2015 and 2020. The record also indicates brief periods of supersaturation observed in the winter season in some years, particularly in 2015 and 2017.
The winter to summer difference in pCO2 for years with sufficient observations are listed in Table 1. The mean seasonal amplitude in pCO2 over the period of observations at the SOTS site is 34.1 µatm, with the minimum (17.8 µatm) observed in 2013, and the maximum (49.6 µatm) observed in 2020. The apparent amplification of the seasonal cycle will be discussed in more detail in section 3.5.
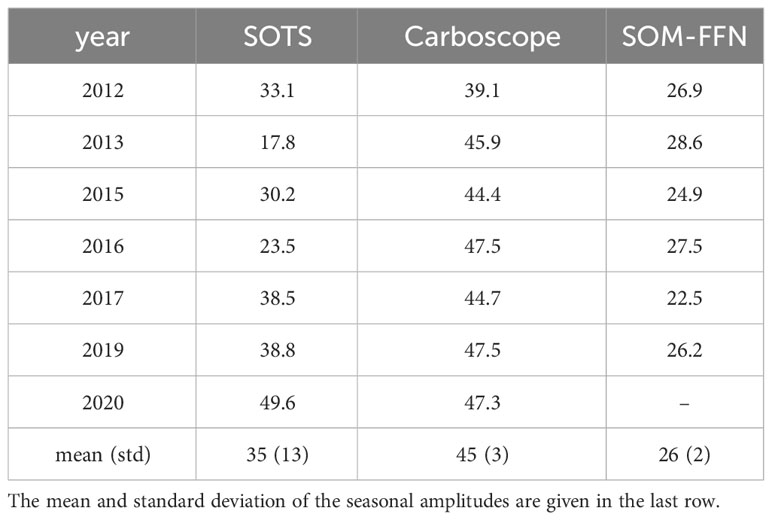
Table 1 The amplitude of the seasonal pCO2 (µatm) cycle based on the observations at SOTS and the two data products (see also Figure 6), defined here as the difference between the annual minima and maxima (from monthly mean values) for years with sufficient observations.
The time series of upper ocean temperature indicates surface values ranging from 12°C to 15°C, rapidly decreasing to <9°C in winter, and at depth, with greater warming in some years (2013, 2016, and 2017), and instances of relatively warm waters penetrating to depths of 200 to 300 m in most years (Figure 2B). The MLD is similarly consistent in terms of summer time minima; interannual variability is apparent in the winter time MLD maxima, with 2013, 2015 and 2019 depths exceeding 400m, while 2017 and 2020 had shallower winter MLDs, between 200 and 300m.
3.2 Seasonal variability
A decade of observations at the SOTS site have yielded a robust understanding of the seasonality of upper ocean processes (Figure 3). The sea surface temperature has a relatively weak seasonality (Figure 3A); mean (austral) winter (JJA) SST is between 9°C and 10°C, warming to a summer (DJF) maximum of about 12°C. Sea surface salinity (Figure 3B) is stable throughout the year; variability is likely driven by frontal movements and mesoscale features (Shadwick et al., 2015; Pardo et al., 2019; Yang et al., 2023). The seasonality of surface pCO2 (Figure 3C) at the SOTS site is controlled by both physical (e.g. warming, freshening, gas exchange) and biological (e.g., photosynthesis and respiration) processes (Shadwick et al., 2015; Yang et al., 2023). Biological production reduces pCO2 in late winter, or early spring, with surface waters remaining undersaturated with respect to the atmosphere through the summer season (Shadwick et al., 2015; Pardo et al., 2019; Yang et al., 2023). The return to near equilibrium with the atmosphere the following autumn and winter is facilitated by deep mixing (Figure 3D), which introduces CO2-rich subsurface waters to the mixed layer (note also the covariation of deep mixed layers and elevated oceanic pCO2 in Figure 2).
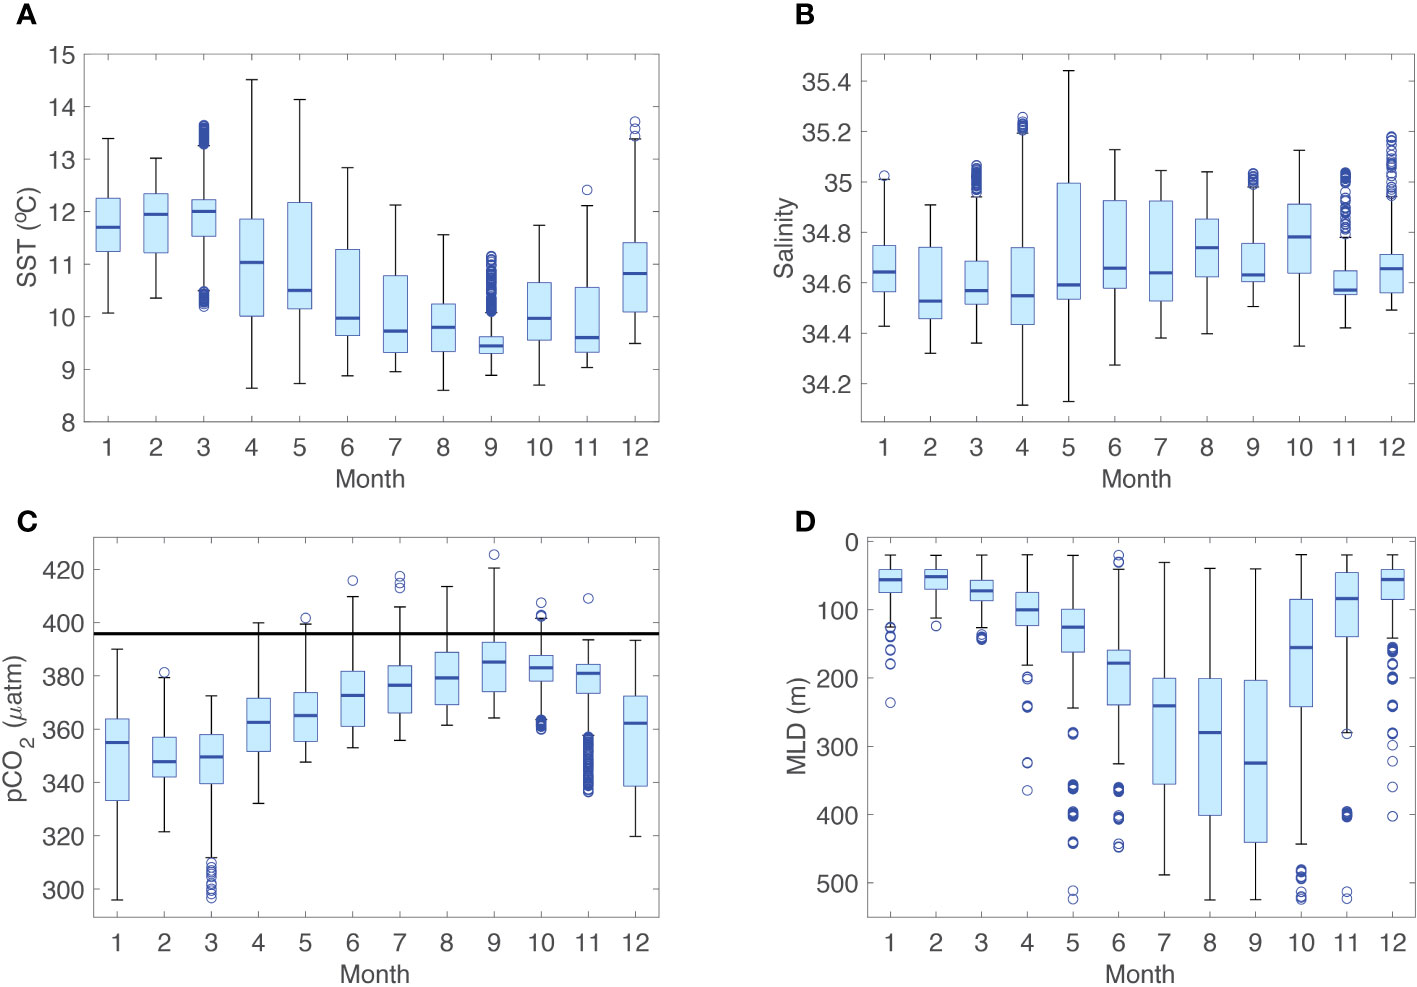
Figure 3 Seasonal variability of surface properties and mixed layer depth from mooring observations at SOTS. Box and whisker plots showing the median, upper, and lower quartiles in boxes, and the 1.5 interquartile range (IQR) of upper and lower quartiles (whiskers), and outliers (open circles) for (A) sea surface temperature (SST); (B) salinity; (C) pCO2, with the mean atmospheric value (395 µatm) shown by the black line; and (D) mixed layer depth (MLD). Note that the plotting toolbox used here truncates the whisker when the extreme values are less than 1.5*IQR from the ends of the box.
Net community production (NCP), which sets the upper limit for biological carbon export to the ocean interior, is significant at the SOTS site during winter and early spring, accounting for roughly 30% of the annual NCP (Weeding and Trull, 2014; Trull et al., 2019). This appears to result from reduction of grazing in winter due to dilution of the ratio of zooplankton to phytoplankton (Trull et al., 2019), suggesting future changes may be controlled as much by winter as by summer conditions. Accumulation of biomass at the SOTS site, and in the SAZ more generally, is moderate relative to the global ocean mean (e.g. Arteaga et al., 2020). Biological productivity influences the amplitude of the seasonal cycle in pCO2, which is characterised by a modest drawdown of 34 µatm (discussed in more detail in Section 3.3, see also Table 1). In the absence of a strong thermal component to the pCO2 seasonality (Shadwick et al., 2015; Yang et al., 2023), the water remains undersaturated with respect to the atmosphere for much of the year (Figure 3C).
Air-sea CO2 fluxes at the SOTS site are shown in Figure 4. In general, air-sea CO2 fluxes become negative (into the ocean) as early as September or October, with this oceanic sink persisting through March in most years, and outgassing only occurring in some autumn and winter seasons. Values range from in-gassing of greater than 10 mol C m−2 yr−1 to outgassing on the order of 5 mol C m−2 yr−1. Interannual variability in the magnitude of both summer in-gassing and autumn and/or winter outgassing is significant (Figure 4). The largest outgassing fluxes were observed from April to June in 2015, coincident with particularly deep mixing, and during winter (June to September) in 2018 and 2020 (Figure 2). This is consistent with the seasonality of Metzl et al. (1999), who showed uptake throughout the year, with outgassing occurring only in the month of September, and associated with deep mixing.
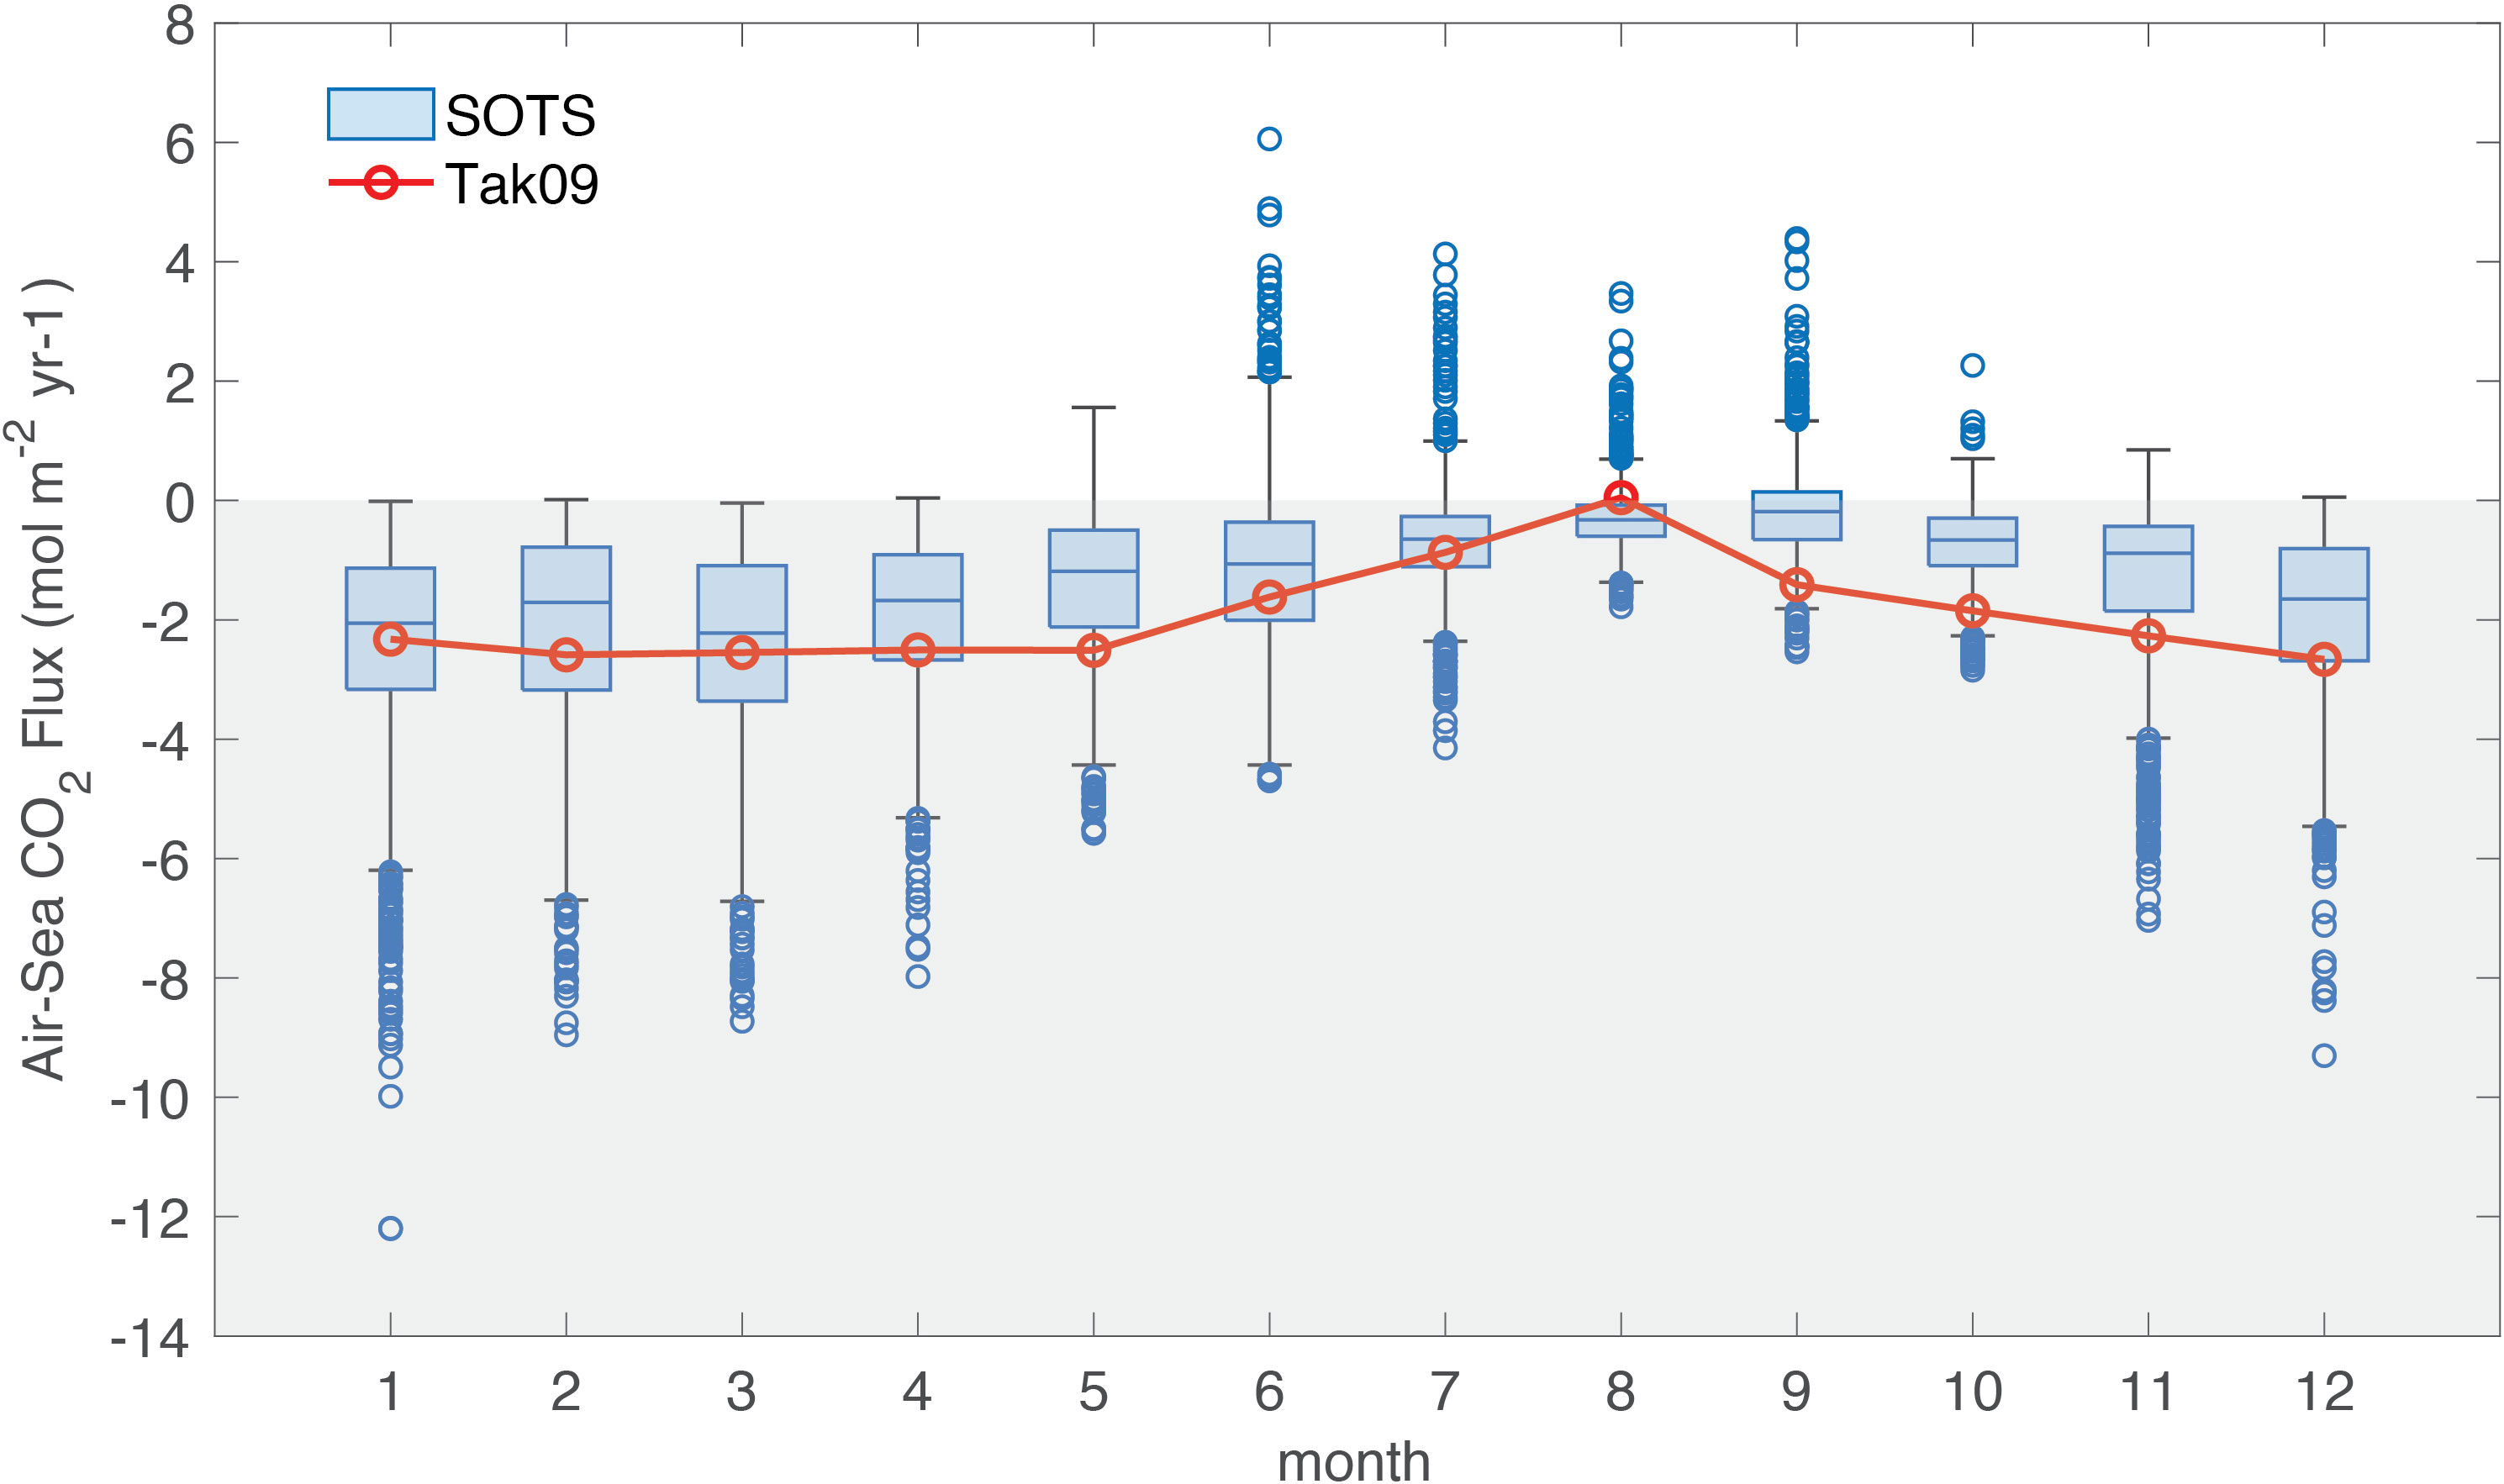
Figure 4 Seasonal variability of air-sea CO2 fluxes between 2011 and 2021 at SOTS (box and whisker plot as described for Figure 3). Negative values (gray shaded area) indicate uptake by the ocean. The climatological values of Takahashi et al. (2009), for the nominal year of 2000, are shown in red.
The mean air-sea CO2 fluxes, based on all observations between 2011 and 2021 are in broad agreement with the seasonality of the Takahashi et al. (2009) climatology, with CO2 uptake beginning between September or October and persisting to June or July in the following year, followed by modest outgassing occurring in July or August, if at all (Figure 4). The annual cycle of air-sea CO2 flux constructed from biogeochemical float data in the circumpolar SAZ zone by Gray et al. (2018) also indicates a similar pattern of oceanic uptake beginning in spring and persisting through summer and early autumn, but the float data are characterised by a transition to outgassing in June, that lasts several months (Gray et al., 2018, their Figure 2). This is in contrast to most of the winter seasons observed at the SOTS site between 2011 and 2021, with relatively shorter periods of outgassing occurring in only three of the annual records. The SOTS observations indicate a mean (standard deviation) net annual uptake of 1.39 (± 0.3) mol C m−2 yr−1, consistent with the Takahashi et al. (2009) value of 1.93 mol C m−2 yr−1 (Figure 4); the annual estimates of Gray et al. (2018), computed for a large circumpolar SAZ region, are comparatively low (-0.43 ± 0.62 mol C m−2 yr−1, their Table S2). We note that the SOTS annual flux computed for observations between 2011 and 2021 is somewhat smaller than an earlier estimate of Metzl et al. (1999) (-3.00 mol C m−2 yr−1) for the period of 1992 to 1995, potentially indicating a decrease in the CO2 sink in the SAZ over time; this will be discussed further in section 3.4.
3.3 Comparison with gridded pCO2 products
The observed pCO2 from the SOTS site is compared with the Carboscope and SOM-FFN data products in Figure 2A. Both products overestimate the observations at the beginning of the record with concentrations of 350 to 360 µatm, while the observations in late 2011 and early 2012 were roughly 340 µatm. The agreement between the Carboscope product and the (monthly mean) SOTS observations improves over the time series, particularly in winter of 2017 and 2019. The SOM-FFN product overestimates the winter pCO2 relative to the SOTS observations in all years, and both products fail to capture the summer minima seen in the observations. This difference can be up to 20 µatm seen, for example, in comparing the SOTS observations with the SOM-FFN product in early 2020 (summer) and late 2020 (winter; Figure 2A).
Because both the Carboscope and SOM-FFN data use SOCAT observations (Bakker et al., 2016), they will contain some data from the SOTS time series, and are therefore not completely independent. However, the fact that they fail to capture the seasonality of the observations does imply that air-sea CO2 fluxes, though not directly compared here, based on either of these gridded products are likely to underestimate the summer season CO2 uptake at the SOTS site, and overestimate the degree of winter outgassing. The SOTS observations reveal a seasonal amplitude that lies generally between the two data products throughout the time series, smaller than the Carboscope and larger than the SOM-FFN (Table 1, Figure S2). The use of these data, or other similar observation-based data products (e.g. Chau et al., 2022) which may include a bias in the pCO2 to extrapolate air-sea CO2 fluxes at a basin or biome scale should be undertaken with some caution.
3.4 Time series trends
Distinguishing anthropogenic signals from natural interannual variability requires observations sustained over many years. A recent analysis of 40 ocean time series sites determined that the time of emergence for anthropogenic trends in pH (e.g. ocean acidification) in the open ocean is between 8 and 15 years (Sutton et al., 2019). Notably, the SOTS data were excluded from this analysis because the observational record was too short.
Using the Sutton et al. (2022) method for the assessment of trends, we find that the ocean pCO2 at the SOTS site is increasing at a rate of 2.7 ± 0.6 µatm yr−1 (p< 0.01, r2 = 0.55) between 2011 and 2021 (Figure 5A). The detection time for pCO2 was found to be 21.6 ± 3.6 years (confidence interval of 18.3 to 25.5 years), which is roughly double the length of the current record, and adds uncertainty to the statistically significant trends presented here. Over the same period, the atmospheric pCO2 increased at a rate of 2.3 ± 0.1 µatm yr−1 (p< 0.01, r2 = 0.95), which is consistent with atmospheric observations at the Cape Grim station in Tasmania (Steele et al., 2021; Yang et al., 2023). Trends computed on the basis of the winter season observations only (see Methods) from SOTS indicate similar trends (3.1 ± 0.5 µatm yr−1 in the ocean and 2.3 ± 0.1 µatm yr−1 in the atmosphere), broadly consistent with winter trends in the data products (3.5 ± 0.5 µatm yr−1 in the SOM-FFN, and 2.7 ± 0.4 µatm yr−1 in the Carboscope product).
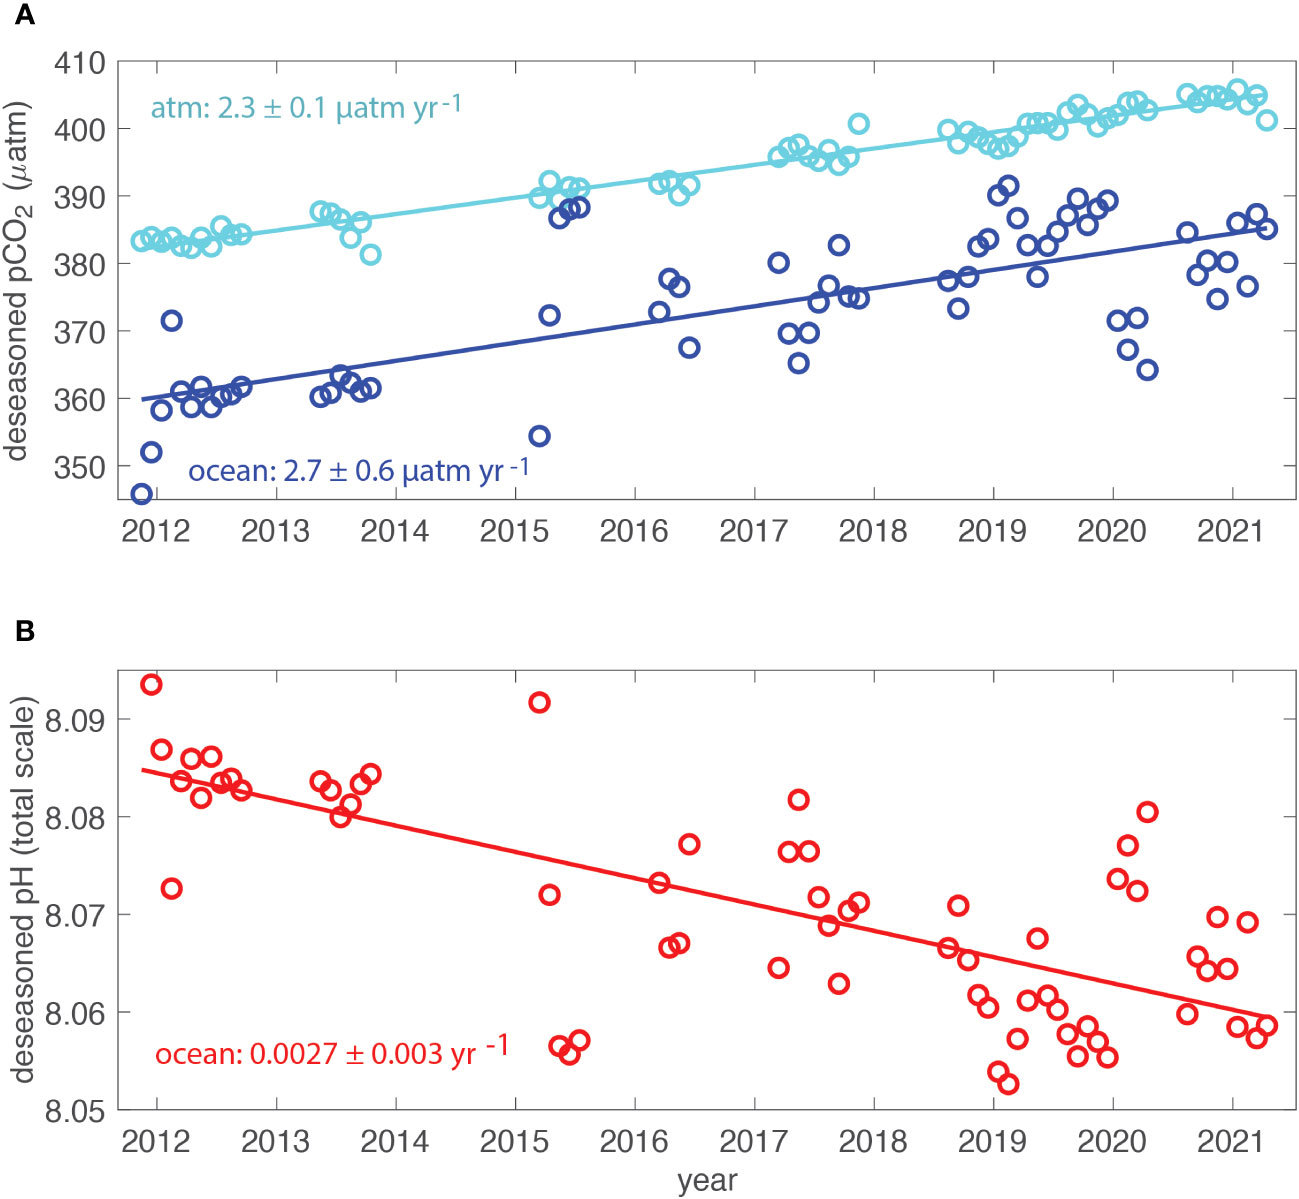
Figure 5 Deseasoned observations at SOTS: (A) surface ocean (dark blue) and atmospheric (light blue) pCO2; and (B) pH (red). Trend lines in both panels are computed following Sutton et al. (2022).
The slightly faster increase in the surface water pCO2 (relative to the atmosphere), suggests that oceanic forcing, in addition to the uptake of anthropogenic CO2 from the atmosphere, may contribute to the decadal change. The trend in pH reveals a decrease of 0.0027 ± 0.003 yr−1 over the same period (Figure 5B), which is within the range of pH changes at other open ocean time series stations (e.g., Bates et al., 2014). The Munida time series, east of New Zealand, indicated a slower trend (-0.013 ± 0.003 per decade between 1985 and 2012; Bates et al., 2014). The trends at SOTS are also similar to recent trends in pH estimated on the basis of summer season shipboard observations: Leseurre et al. (2022) reported a pH decrease of 0.0023 yr−1 in the northern region of the Polar Frontal Zone between 1998 and 2019; Xue et al. (2018) reported a pH decrease of 0.0024 yr−1 between the year 2000 and 2010; and Brandon et al. (2022) reported a pH decrease of 0.002 yr−1 between 2015 and 2019.
The SST observations at the SOTS site indicate no trend between 2011 and 2021 (Figure S2), which is consistent with the summer season results of Xue et al. (2018) who found modest increases in SST between 1990 and 2000, and even smaller decreases between 2000 and 2020, not statistically significant in either period. The SOTS observations do not show the same trends in SST reported by Morrow et al. (2008) and more recently by Auger et al. (2021) in this region, though the SOTS site is located in a zone where the trend in temperature is smaller than the interannual variability (Auger et al., 2021). The lack of trend in the SST indicates that the trends in pCO2 and pH do not have a thermal component, i.e., the increase in pCO2 and decrease in pH cannot be attributed to surface water warming over the same period. The SOTS surface salinity observations also indicate no trend over the period of observations, and because TA is computed from salinity (see Methods), there is correspondingly no trend in TA (Figure S3); the trend in (computed) dissolved inorganic carbon (TCO2: 1.6 ± 0.2 µmol kg−1, p< 0.01, r2 = 0.55; Figure S3) is therefore driven entirely by the changes in pCO2 and cannot be used to confirm the mechanism for the trend.
Because of the gaps in the observational record, we are not able to evaluate the trends in annual air-sea CO2 flux, which require integration of the monthly, or higher resolution, observations over a full year. Based on winter (June/July) observations alone, there is not a trend in the fluxes, but rather a dominant winter outgassing in 2015, which occurs in June and July, while 2017 and 2019 also exhibit outgassing, but with smaller signals and later in the season (August and September). The ΔpCO2 and wind speed may be used as proxies for changes in air-sea CO2 flux (see Eq. 1); the (negative) ΔpCO2 does reveal a weak, but not statistically significant, increase in time (0.27 ± 0.33 µatm yr−1, p> 0.4, see Figure S4), which would contribute to a weakening of the air-sea CO2 flux. The wind speed also appears to be weakly increasing in time (0.24 ± 0.05 m s−1 yr−1, p< 0.01, see Figure S4), consistent with recent studies (e.g. Young and Ribal, 2019; Bronselaer et al., 2020), which would act to enhance the flux, but may be counteracted by the weakening ΔpCO2 over the same period.
3.5 Changes in seasonal pCO2 amplitude
The SOTS observations reveal an amplification of the seasonal cycle in pCO2, seen in particular via comparison to two global pCO2 products (Figure 2A), and consistent with recent several model- and data product-based studies of global and Southern Ocean pCO2 seasonality (e.g. Gallego et al., 2018; Landschützer et al., 2018; Joos et al., 2023). The magnitude of the seasonal cycle (here defined as the difference between the mean, monthly winter season maximum and mean, monthly, summer season minimum), based on observations at SOTS and the two data products for the years with sufficient observations for comparison, are given in Table 1 and Figure 6. There is no statistically significant trend in the amplitude of the seasonal cycle for either of the global data products, however the SOTS observations indicate an increase in seasonal amplitude of 3.7 ± 1.0 µatm yr−1 (p< 0.05, r2 = 0.6). We note that the SOTS observations also exhibit a larger standard deviation (internanual variability) than either of the data products (Table 1), which have moderated extremes compared to single point data due to spatial averaging.
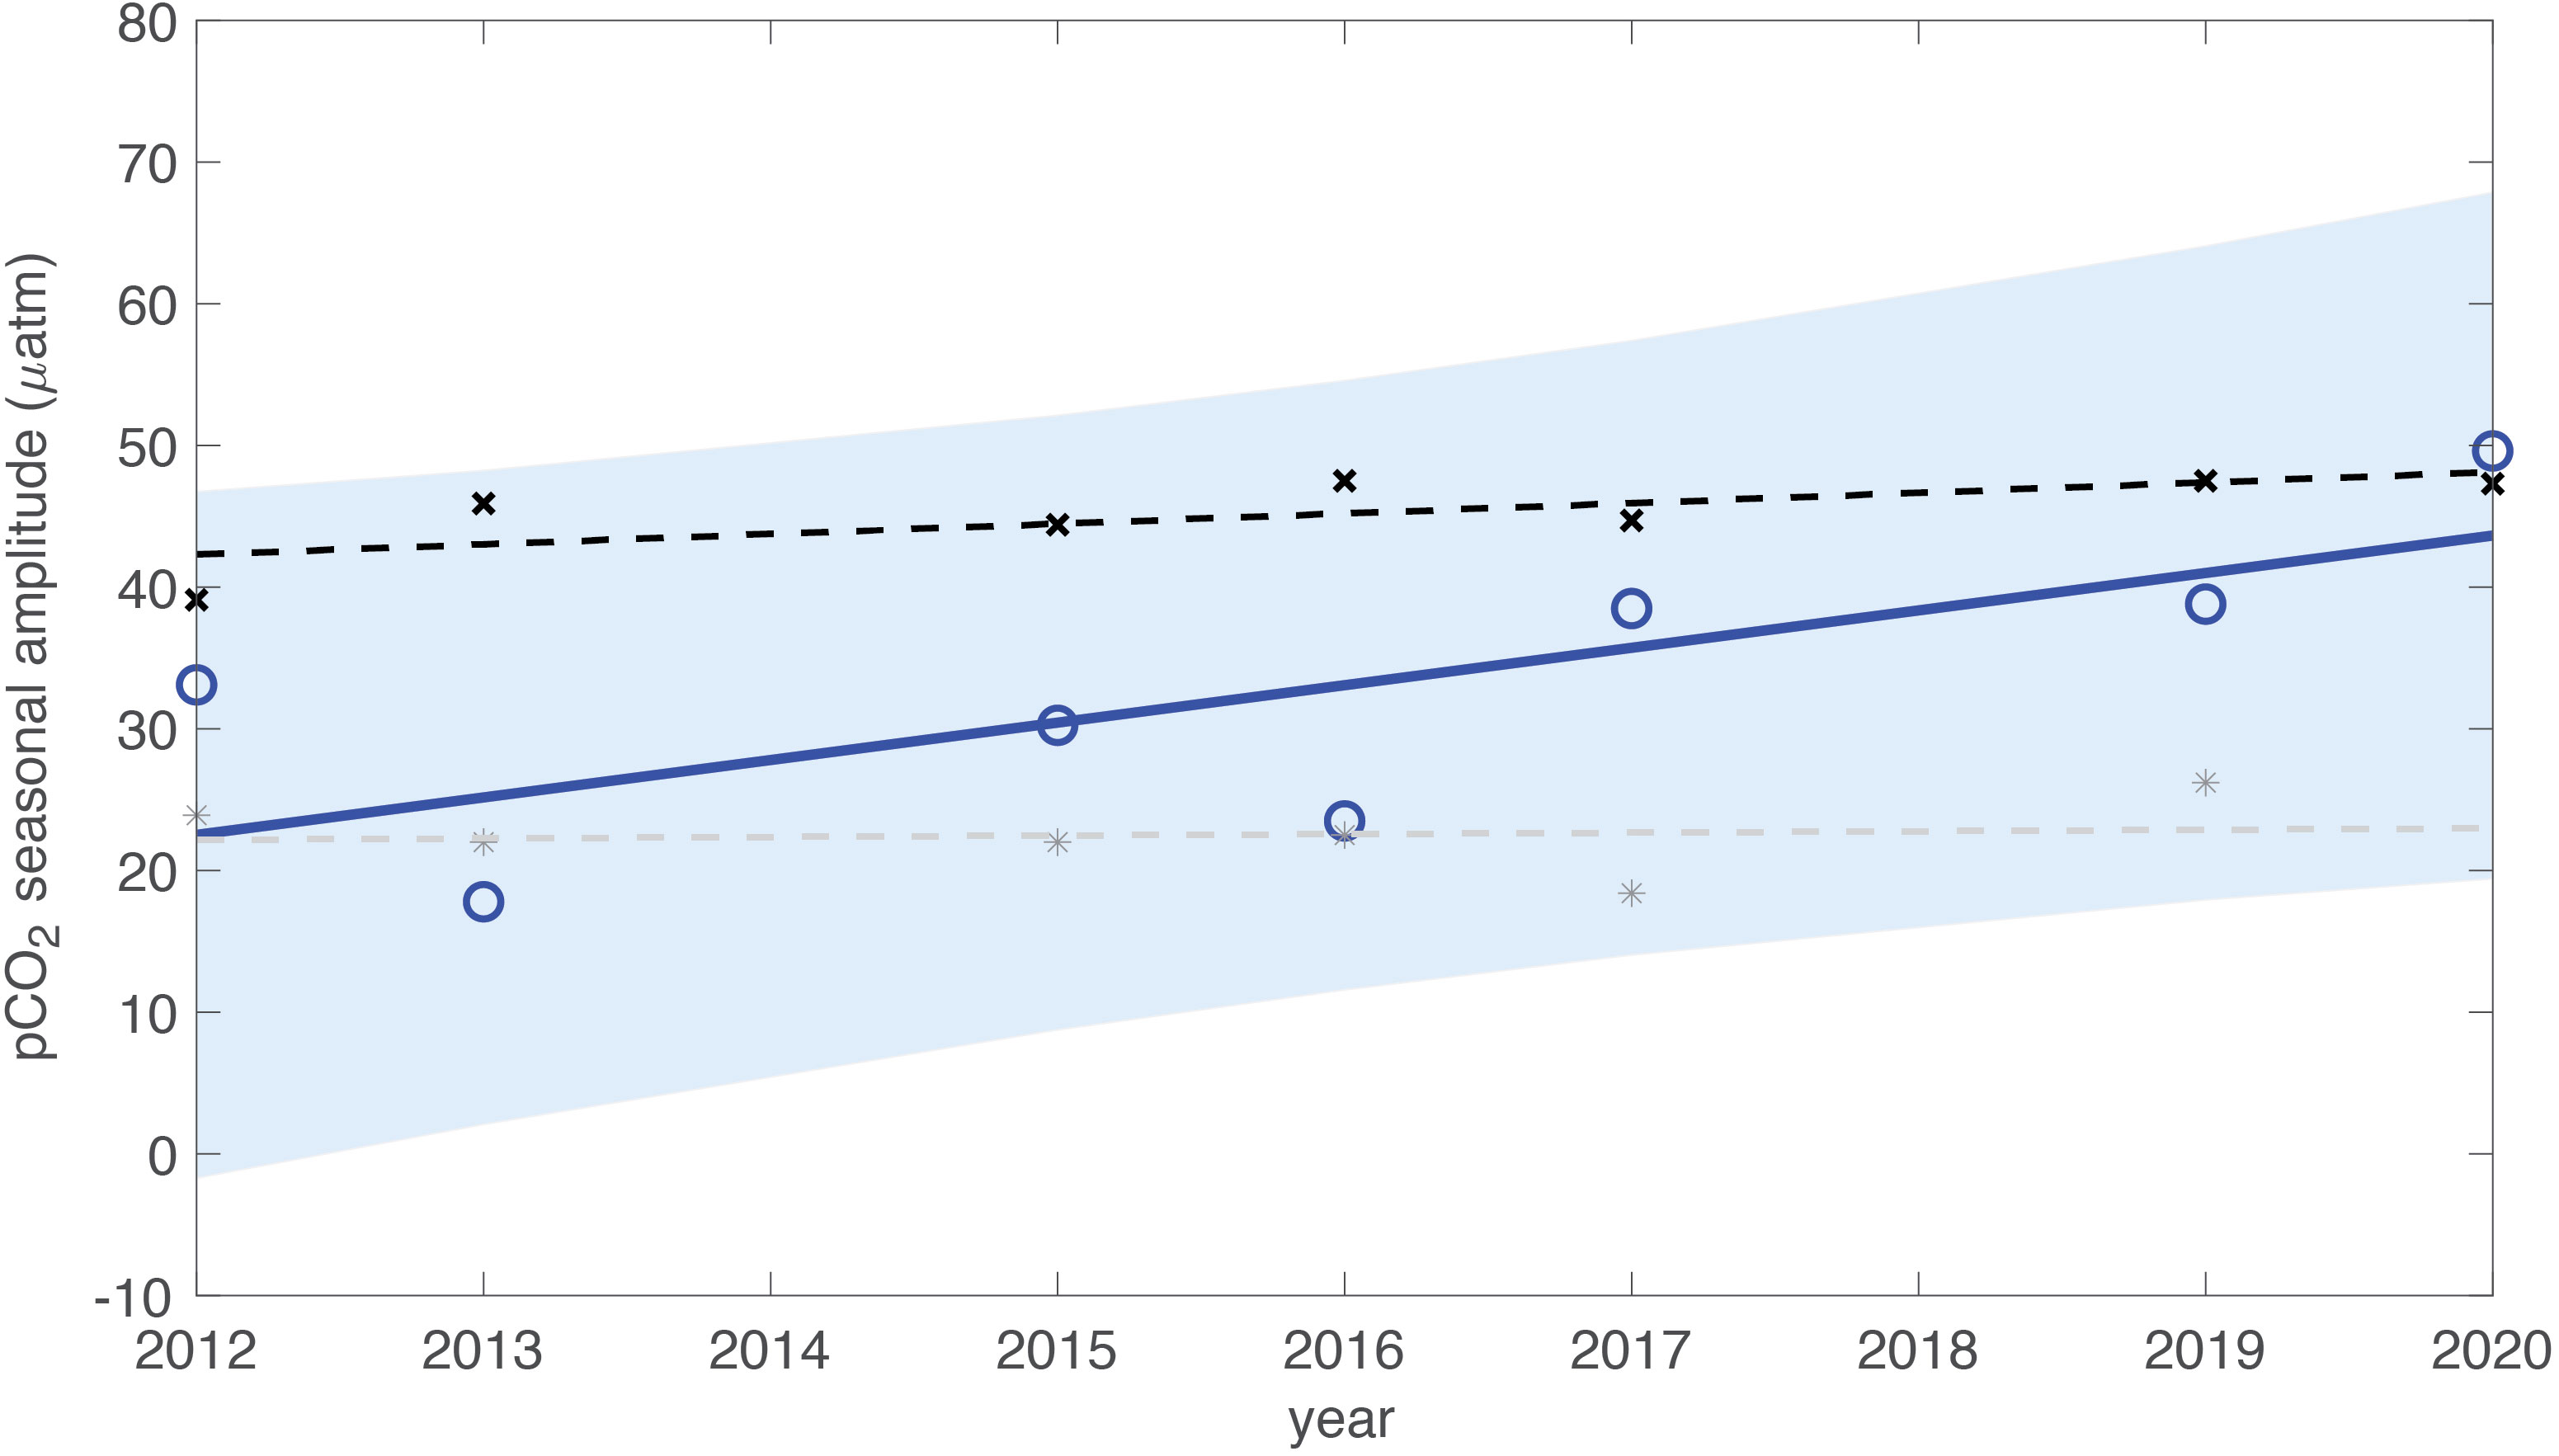
Figure 6 Amplitude of pCO2 seasonal cycle between 2012 and 2020 for the SOTS observations (blue) as well as the Carboscope (black, x), and SOM-FFN (gray, *) data products; the blue shading indicates the 95% confidence interval for the SOTS data. Only the SOTS observations indicate a statistically significant (increasing) trend in time.
Recent work has shown that seasonality in Southern Ocean pCO2 and air-sea CO2 flux is evolving in response to anthropogenic CO2 uptake by the ocean, or ocean acidification, (e.g. Landschützer et al., 2018; Gruber et al., 2019; Yun et al., 2022), though changes in the magnitude of the seasonal cycle can also be influenced by local oceanic changes. In particular, a combination of increased summer stratification and enhanced primary productivity, may result in decreased summer pCO2 minima. Conversely, deeper winter mixing, may result in an enhanced winter pCO2 maxima due to the introduction of carbon-rich water from below.
To investigate this further, CAFE60 reanalysis products, specifically time series of MLD, and net primary production (NPP, see Table S1) over the 2000 to 2020 period were evaluated. The CAFE60 product reveals a weak shoaling trend in the summer and more substantial deepening trend in the winter; this leads to increased supply of iron to the surface layer, which increases NPP in summer. While these changes in MLD are not statistically significant in the SOTS observations, or the CAFE60 data, and the observed mixed layer in winter 2020 was more shallow than the decadal mean (Figure 2B), this does hint at the mechanisms described above contributing to the amplification of the seasonal cycle in pCO2 at the SOTS site, consistent with studies that have identified a correlation between winter pCO2 variability and MLD (e.g. Gregor et al., 2018; Mayot et al., 2023).
4 Conclusions
The Subantarctic Zone (SAZ) is a globally significant region for the uptake and storage of anthropogenic CO2. Using sustained observations from a deep ocean mooring as part of the Southern Ocean Time Series observatory, we evaluate the seasonality and trends in surface ocean CO2 partial pressure. We find that the SAZ south of Australia has tracked, or slightly exceeded, the increase in atmospheric CO2 over the past decade. This trend is accompanied by an observed increase in the amplitude of the pCO2 seasonality. There are no significant trends in either surface ocean temperature or mixed layer depth, suggesting that both the trend and the enhanced seasonality are dominated by the (long-term) increase in atmospheric CO2 and subsequent uptake by the surface ocean, reinforced by the trend in decreasing pH (i.e., ocean acidification), though the enhanced seasonality may additionally be driven by short term, local, changes in mixing and productivity. Understanding the changes in pCO2 seasonality is important for understanding the evolution of the Southern Ocean carbon sink, which has been the focus of many modelling studies given the scarcity of seasonally-resolved observations.
Data availability statement
The datasets presented in this study can be found in online repositories. The names of the repository/repositories and accession number(s) can be found below: All SOTS data are available from Australian Ocean Data Network (AODN) https://portal.aodn.org.au/, and the National Centers for Environmental Information (NCEI) https://www.ncei.noaa.gov/access/ocean-carbon-acidification-data-system/oceans/Moorings/SOFS.html. The Jena CarboScope data were downloaded from http://www.bgc-jena.mpg.de/CarboScope/?ID=oc_v2021, and the SOM-FFN data from https://www.ncei.noaa.gov/access/ocean-carbon-acidification-data-system/oceans/MPI-ULB-SOM_FFN_clim.html.
Author contributions
EHS: Conceptualization, Data curation, Formal Analysis, Funding acquisition, Investigation, Methodology, Project administration, Writing – original draft, Writing – review & editing. CW-E: Formal Analysis, Visualization, Writing – review & editing. RM: Conceptualization, Formal Analysis, Writing – review & editing. PJ: Data curation, Writing – review & editing. ES: Project administration, Writing – review & editing. AS: Data curation, Resources, Writing – review & editing.
Funding
The authors declare financial support was received for the research, authorship, and/or publication of this article. This project received grant funding from the Australian Government as part of the Antarctic Science Collaboration Initiative program. The moored air-sea CO2 observations are supported by NOAA’s Pacific Marine Environmental Laboratory. This is PMEL contribution 5548.
Acknowledgments
The SOTS observatory is supported by Australia’s Integrated Marine Observing System (IMOS). IMOS is operated by a consortium of institutions as an unincorporated joint venture, with the University of Tasmania as Lead Agent. We acknowledge support from the Australian Antarctic Program Partnership (AAPP), the Bureau of Meteorology (BoM), and the Marine National Facility (MNF). The SOTS observatory is part of the OceanSITES global network of time series stations (www.OceanSITES.org). The authors are grateful for insightful and constructive reviews.
Conflict of interest
The authors declare that the research was conducted in the absence of any commercial or financial relationships that could be construed as a potential conflict of interest.
Publisher’s note
All claims expressed in this article are solely those of the authors and do not necessarily represent those of their affiliated organizations, or those of the publisher, the editors and the reviewers. Any product that may be evaluated in this article, or claim that may be made by its manufacturer, is not guaranteed or endorsed by the publisher.
Supplementary material
The Supplementary Material for this article can be found online at: https://www.frontiersin.org/articles/10.3389/fmars.2023.1281854/full#supplementary-material
References
Arteaga L. A., Boss E., Behrenfeld M. J., Westberry T. K., Sarmiento J. L. (2020). Seasonal modulation of phytoplankton biomass in the Southern Ocean. Nat. Comms. 11, 5364. doi: 10.1038/s41467-020-19157-2
Auger M., Morrow R., Kestenare E., Sallée J.-B., Cowley R. (2021). Southern Ocean in-site temperature trends over 25 years emerge from interannual variability. Nat. Comms. 12, 514. doi: 10.1038/s41467-020-20781-1
Bakker D. C. E., Pfeil B., Landa C. S., Metzl N., O’Brien K. M., Olsen A., et al. (2016). A multi-decade record of high-quality fCO2 data in version 3 of the Surface Ocean CO2 Atlas (SOCAT). Earth System Sci. Data 8, 383–413. doi: 10.5194/essd-8-383-2016
Bates N. R., Astor Y. M., Church M. J., Currie K., Dore J. E., González-Dávila M., et al. (2014). A time-series view of changing ocean chemistry due to ocean uptake of anthropogenic CO2 and ocean acidification. Oceanography 27, 126–141. doi: 10.5670/oceanog.2014.16
Behrenfeld M. J. (2010). Abandoning Sverdrup’s critical depth hypothesis on phytoplankton blooms. Ecology 91, 977–989. doi: 10.1890/09-1207.1
Behrenfeld M. J., Boss E. S. (2014). Resurrecting the ecological underpinnings of ocean plankton blooms. Annu. Rev. Mar. Sci. 6, 167–194. doi: 10.1146/annurev-marine-052913-021325
Borges A. V., Tilbrook B., Metzl N., Lenton A., Delille B. (2008). Inter-annual variability of the carbon dioxide oceanic sink south of Tasmania. Biogeosciences 5, 141–155. doi: 10.5194/bg-5-141-2008
Brandon M., Goyet C., Touratier F., Lefèvre N., Kestenare E., Morrow R. (2022). Spatial and temporal variability of the physical, carbonate and CO2 properties in the Southern Ocean surface waters during austral summer, (2005-2019). Deep Sea Res. Part I: Oceanogr. Res. Papers 187, 103836. doi: 10.1016/j.dsr.2022.103836
Brévière E., Metzl N., Poisson A., Tilbrook B. (2006). Changes of oceanic CO2 sink in the eastern Indian sector of the Southern Ocean. Tellus 58B, 438–446. doi: 10.1111/j.1600-0889.2006.00220.x
Bronselaer B., Russell J. L., Winton M., Williams N. L., Key R. M., Dunne J. P., et al. (2020). Importance of wind and meltwater for observed chemical and physical changes in the Southern Ocean. Nat. Geosci. 13, 35–42. doi: 10.1038/s41561-019-0502-8
Bushinsky S. M., Landschützer P., Rödenbeck C., Gray A. R., Baker D., Mazloff M. R., et al. (2019). Reassessing Southern Ocean air-sea CO2 flux estimates with the addition of biogeochemical float observations. Global Biogeochemical Cycles 33, 1370–1388. doi: 10.1029/2019GB006176
Chau T.-T.-T., Gehlen M., Chevallier F. (2022). A seamless ensemble-based reconstruction of surface ocean pCO2 and air-sea CO2 fluxes over the global coastal and open oceans. Biogeosciences 19, 1087–1109. doi: 10.5194/bg-19-1087-2022
Davies D. M., Jansen P., Trull T. W. (2020). Southern Ocean Time Series (SOTS) Quality Assessment and Control Report Remote Access Sampler Sample Analysis. Macronutrient analysis. Version 1.0. (Hobart, Australia: CSIRO). doi: 10.26198/5e156a63a8f75
Dickson A. G. (1990). Standard potential of the reaction: AgCl(s) + 1/2H2(g) = Ag(s) + HCl(aq), and the standard acidity constant of the ion HSO4– in synthetic sea water from 273.15 to 318.15 K. J. Chem. Thermodyn 22, 7113–7127. doi: 10.1016/0021-9614(90)90074-Z
Dickson A. G., Sabine C. L., Christian J. R. (2007). Guide to Best Practices for Ocean CO2 Measurement (North Pacific Marine Science Oganization, Sidney, BC, Canada, PICES Special Publication 3).
Fay A. R., Lovenduski N. S., McKinley G. A., Munro D. R., Sweeney C., Gray A. R., et al. (2018). Utilizing the Drake Passage time-series to understand variability and change in subpolar Southern Ocean pCO2. Biogeosci 15, 3841–3855. doi: 10.5194/bg-15-3841-2018
Frölicher T. L., Sarmiento J. L., Paynter D. J., Dunne J. P., Krasting J. P., Winton M. (2015). Dominance of the Southern Ocean in anthropogenic carbon and heat uptake in CMIP5 models. J. Climate 28, 862–886. doi: 10.1175/JCLI-D-14-00117.1
Gallego M. A., Timmermann A., Friedrich T., Zeebe R. E. (2018). Drivers of future seasonal cycle changes in oceanic pCO2. Biogeosciences 15, 5315–5327. doi: 10.5194/bg-15-5315-2018
Gray A., Johnson K. S., Bushinsky S. M., Riser S. C., Russell J. L., Talley L. D., et al. (2018). Autonomous biogeochemical floats detect significant carbon dioxide outgassing in the high-latitude Southern Ocean. Geophy. Res. Lett. 45, 9049–9057. doi: 10.1029/2018GL078013
Gregor L., Kok S., Monteiro P. M. S. (2018). Interannual drivers of the seasonal cycle of CO2 in the Southern Ocean. Biogeosciences 15, 2361–2378. doi: 10.5194/bg-15-2361-2018
Gruber N., Landschützer P., Lovenduski N. S. (2019). The variable Southern Ocean carbon sink. Annu. Rev. Mar. Sci. 11, 159–186. doi: 10.1146/annurev-marine-121916-063407
Hauck J., Gregor L., Nissen C., Patara L., Hague M., Mongwe P., et al. (2023). The Southern Ocean carbon cycle 1985-2018: Mean, seasonal cycle, trends and storage. ESS Open Archive. doi: 10.22541/essoar.168500260.02497238/v1
Jansen P., Shadwick E. H., Trull T. W. (2022a). Southern Ocean Time Series (SOTS): Multi-year Gridded Product Version 1.1. (Hobart, Australia: CSIRO). doi: 10.26198/ae20-8c83
Jansen P., Shadwick E. H., Trull T. W. (2022b). Southern Ocean Time Series (SOTS) Quality Assessment and Control Report Salinity Records Version 2.0. (Hobart, Australia: CSIRO). doi: 10.26198/rv8y-2q14
Jansen P., Shadwick E. H., Trull T. W. (2022c). Southern Ocean Time Series (SOTS) Quality Assessment and Control Report Temperature Records Version 2.0. (Hobart, Australia: CSIRO). doi: 10.26198/gfgr-fq47
Joos F., Hameau A., Frölicher T. L., Stephenson D. B. (2023). Anthropogenic attribution of the increasing seasonal amplitude in surface ocean pCO2. Geophys. Res. Lett. 50, e2023GL102857. doi: 10.1029/2023GL102857
Khatiwala S., Tanhua T., Fletcher S. M., Gerber M., Doney S. C., Graven H. D., et al. (2013). Global ocean storage of anthropogenic carbon. Biogeosciences 10, 2169–2191. doi: 10.5194/bg-10-2169-2013
Landschützer P., Gruber N., Bakker D. C. E., Schuster U., Nakaoka S., Payne M. R., et al. (2013). A neural network-based estimate of the seasonal to inter-annual variability of the Atlantic Ocean carbon sink. Biogeosciences 10, 7793–7815. doi: 10.5194/bg-10-7793-2013
Landschützer P., Gruber N., Bakker D. C. E., Stemmler I., Six K. D. (2018). Strengthening seasonal marine CO2 variations due to increasing atmospheric CO2. Nat. Clim. Change 8, 146–150. doi: 10.1038/s41558-017-0057-x
Landschützer P., Gruber N., Haumann F. A., Rödenbeck C., Bakker D. C. E., van Heuven S., et al. (2015). The reinvigoration of the Southern Ocean carbon sink. Science 349, 1221–1224. doi: 10.1126/science.aab2620
Landschützer P., Laruelle G. G., Roobaert A., Regnier P. (2020). A uniform pCO2 climatology combining open and coastal oceans. Earth Syst. Sci. Data 12, 2537–2553. doi: 10.5194/essd-12-2537-2020
Landschützer P., Tanhua T., Behncke J., Keppler L. (2023). Sailing through the southern seas of air–sea CO2 flux uncertainty. Phil. Trans. R. Soc A 381, 20220064. doi: 10.1098/rsta.2022.0064
Law C. S., Rickard G. J., Mikaloff-Fletcher S. E., Pinkerton M. H., Behrens E., Chiswell S. M., et al. (2017). Climate change projections for the surface ocean around New Zealand. New Z. J. Mar. Freshw. Res. 8330, 1–27. doi: 10.1080/00288330.2017.1390772
Lee K., Kim T.-W., Byrne R. H., Millero F. J., Feely R. A., Liu Y.-M. (2000). The universal ratio of boron to chlorinity for the North Pacific and North Alantic Oceans. Geochimica Cosmochimica Acta 74, 1801–1811. doi: 10.1016/j.gca.2009.12.027
Lenton A., Tilbrook B., Law R. M., Bakker D., Doney S. C., Gruber N., et al. (2013). Sea-air CO2 fluxes in the Southern Ocean for the period 1990 - 2009. Biogeosciences 10, 4037–4054. doi: 10.5194/bg-10-4037-2013
Leseurre C., Lo Monaco C., Reverdin G., Metzl N., Fin J., Mignon C., et al. (2022). Summer trends and drivers of sea surface fCO2 and pH changes observed in the southern Indian Ocean over the last two decades, (1998–2019). Biogeosciences 19, 2599–2625. doi: 10.5194/bg-19-2599-2022
Lewis E., Wallace D. W. R. (1998). Program Developed for CO2 Systems Calculations. (Oak Ridge, Tennessee: ORNL/CDIAC 105, Carbon Dioxide Information Analysis Center, Oak Ridge National Laboratory, US Department of Energy).
Long M. C., Stephens B. B., McKain K., Sweeney C., Keeling R. F., Kort E. A., et al. (2021). Strong Southern Ocean carbon uptake evident in airborne observations. Science 374, 1275–1280. doi: 10.1126/science.abi4355
Lueker T. J., Dickson A. G., Keeling C. D. (2000). Ocean pCO2 calculated from dissolved inorganic carbon, alkalinity, and equations for K1 and K2: validation based on laboratory measurements of CO2 in gas and seawater at equilibrium. Mar. Chem. 70, 105–119. doi: 10.1016/S0304-4203(00)00022-0
Mayot N., Quéré C. L., Rödenbeck C., Bernardello R., Bopp L., Djeutchouang L. M., et al. (2023). Climate-driven variability of the Southern Ocean CO2 sinksinkPhil. Trans. R. Soc. A Math Phys. Eng. Sc. 381, 2249. doi: 10.1098/rsta.2022.0055
McKinley G. A., Pilcher D. J., Fay A. R., Lindsay K., Long M. C., Lovenduski N. S. (2016). Timescales for detection of trends in the ocean carbon sink. Nature 530, 469–472. doi: 10.1038/nature16958
McNeil B. I., Metzl N., Matear R. J., Corbiere A. (2007). An empirical estimate of the Southern Ocean air-sea CO2 flux. Global Biogeochem. Cy. 21, GB3011. doi: 10.1029/2007GB002991
McNeil B. I., Tilbrook B., Matear R. J. (2001). Accumulation and uptake of anthropogenic CO2 in the Southern Ocean, south of Australia between 1968 and 1996. J. Geophys. Res. 106, 31,431–31,445. doi: 10.1029/2000JC000331
Metzl N., Brunet C., Jabaud-Jan A., Poisson A., Schauer B. (2006). Summer and winter air-sea CO2 fluxes in the Southern Ocean. Deep-Sea Res. I 53, 1548–1653. doi: 10.1016/j.dsr.2006.07.006
Metzl N., Tilbrook B., Poisson A. (1999). The annual fCO2 cycle and the air-sea CO2 flux in the Sub-Antarctic Ocean. Tellus B 51, 849–861. doi: 10.3402/tellusb.v51i4.16495
Morrow R., Valladeau G., Sallèe J.-B. (2008). Observed subsurface signature of Southern Ocean sea level rise. Prog. Oceanogr. 77, 351–366. doi: 10.1016/j.pocean.2007.03.002
O’Kane T. J., Sandery P. A., Kitsios V., Sakov P., Chamberlain M. A., Collier M. A., et al. (2021a). CAFE60V1: A 60-year large ensemble climate reanalysis. Part I: System design, model configuration and data assimilation. J. Climate 34 (13), 1–48. doi: 10.1175/JCLI-D-20-0974.1
O’Kane T. J., Sandery P. A., Kitsios V., Sakov P., Chamberlain M. A., Squire D. T., et al. (2021b). CAFE60V1: A 60-year large ensemble climate reanalysis. Part II: Evaluation. J. Climate 34 (13), 5171–5194. doi: 10.1175/JCLI-D-20-0518.1
Orr J. C., Epitalon J.-M., Dickson A. G., Gattuso J.-P. (2018). Routine uncertainty propagation for the marine carbon dioxide system. Mar. Chem. 207, 84–107. doi: 10.1016/j.marchem.2018.10.006
Orsi A. H., Whitworth T. III, Nowlin W. D. Jr. (1995). On the meridional extent and fronts of the Antarctic Circumpolar Current. Deep-Sea Res. 42 (5), 641–673. doi: 10.1016/0967-0637(95)00021-W
Orsi A. H., Johnson G. C., Bullister J. L. (1999). Circulation, mixing, and production of Antarctic Bottom Water. Prog. Oceanog. 43, 55–109. doi: 10.1016/S0079-6611(99)00004-X
Pardo P. C., Tilbrook B., Langlais C., Trull T. W., Rintoul S. R. (2017). Carbon uptake and biogeochemical change in the Southern Ocean, south of Tasmania. Biogeosciences 14, 5217–5237. doi: 10.5194/bg-14-5217-2017
Pardo P. C., Tilbrook B., van Ooijen E., Passmore A., Neill C., Jansen P., et al. (2019). Surface Ocean carbon dioxide variability in South Pacific boundary currents and Subantarctic waters. Nat. Sci. Rep. 9, 7592. doi: 10.1038/s41598-019-44109-2
Perez F. F., Fraga F. (1987). Association constant of fluoride and hydrogen ions in seawater. Mar. Chem. 21, 161–168. doi: 10.1016/0304-4203(87)90036-3
Prend C. J., Keerthi M. G., Lévy M., Aumont O., Gille S. T., Talley L. D. (2022). Sub-seasonal forcing drives year-to-year variations of Southern Ocean primary productivity. Global Biogeochemical Cycles 36, e2022GB007329. doi: 10.1029/2022GB007329
Rickard G. J., Behrens E., Chiswell S. M. (2016). CMIP5 Earth System Models with Biogeochemistry: An assessment for the southwest Pacific Ocean. J. Geophys. Res. 121, 7857–7879. doi: 10.1002/2016JC011736
Rintoul S. R., Sokolov S. (2001). Baroclinic transport variability of the Antarctic Circumpolar Current south of Australia (WOCE repeat section SR3). J. Geophys. Res. 106, 2795–2814. doi: 10.1029/2000JC900107
Rintoul S. R., Trull T. W. (2001). Seasonal evolution of the mixed layer in the Subantarctic Zone South of Australia. J. Geophys. Res. 106, 31,447–31,462. doi: 10.1029/2000JC000329
Rödenbeck C., DeVries T., Hauck J., Quéré C. L., Keeling R. (2022). Data-based estimates of interannual sea–air CO2 flux variations 1957–2020 and their relation to environmental drivers. Biogeosci. 19, 2627–2652. doi: 10.5194/bg-19-2627-2022
Rödenbeck C., Keeling R. F., Bakker D. C. E., Metzl N., Olsen A., Sabine C., et al. (2013). Global surface-ocean pCO2 and sea-air CO2 flux variability from an observation-driven ocean mixed-layer scheme. Ocean Sci. 9, 93–216. doi: 10.5194/os-9-193-2013
Roobaert A., Laruelle G. G., Landschützer P., Regnier P. (2018). Uncertainty in the global oceanic CO2 uptake induced by wind forcing: quantification and spatial analysis. Biogeosciences 15, 1701–1720. doi: 10.5194/bg-15-1701-2018
Sabine C. L., Feely R. A., Gruber N., Key R. M., Lee K., Bullister J. L., et al. (2004). The oceanic sink for anthropogenic CO2. Science 305, 367–371. doi: 10.1126/science.1097403
Sallée J.-B., Matear R. J., Rintoul S. R., Lenton A. (2012). Localized subduction of anthropogenic carbon dioxide in the southern hemisphere oceans. Nat. Geosci. 5, 579–584. doi: 10.1038/NGEO1523
Sasse T. P., McNeil B. I., Matear R. J., Lenton A. (2015). Quantifying the influence of CO2 seasonality on future ocean acidification. Biogeosci 12, 6017–6031. doi: 10.5194/bg-12-6017-2015
Schlunegger S., Rodgers K. B., Sarmiento J. L., Frölicher T. L., Dunner J. P., Ishii M., et al. (2019). Emergence of anthropogenic signals in the ocean carbon cycle. Nat. Clim. Change 9, 719–725. doi: 10.1038/s41558-019-0553-2
Schulz E., Josey S. A., Verein R. (2012). First air-sea flux mooring measurements in the Southern Ocean. Geophys. Res. Lett. 39, LI6606. doi: 10.1029/2012GL052290
Shadwick E. H., Davies D. M., Jansen P., Trull T. W. (2020). Southern Ocean Time Series (SOTS) Quality Assessment and Control Report Remote Access Sampler: Total Alkalinity and Total Dissolved Inorganic Carbon Analyses 2009-2018. Version 1.0. (Hobart, Australia: CSIRO). doi: 10.26198/5f3f23c8b51d6
Shadwick E. H., Trull T. W., Tilbrook B., Sutton A. J., Schulz E., Sabine C. L. (2015). Seasonality of biological and physical controls on surface ocean CO2 from hourly observations at the Southern Ocean Time Series site south of Australia. Global Biogeochem. Cy. 29, 1–16. doi: 10.1002/2014GB004906
Sharp J. D., Pierrot D., Humphreys M. P., Epitalon J.-M., Orr J. C., Lewis E. R., et al. (2023). CO2SYSv3 for MATLAB (Version 3.2.1) (Zenodo). doi: 10.5281/zenodo.7552554
Sigman D., Boyle E. (2000). Glacial/interglacial variations in atmospheric carbon dioxide. Nature 407, 859–869. doi: 10.1038/35038000
Steele L. P., Krummel P. B., van der Schoot M. V., Spencer D. A., Loh Z. M., Baly S. B., et al. (2021). “Baseline carbon dioxide monitoring,” in Baseline Atmospheric Program (Australia) 2011-2013 (Melbourne, Australia: Australian Bureau of Meteorology and CSIRO Oceans and Atmosphere). doi: 10.25919/Fmp7r-1v15
Sutton A. J., Battisti R., Carter B., Evans W., Newton J., Alin S., et al. (2022). Advancing best practices for assessing trends of ocean acidification time series. Front. Mar. Sci. 9. doi: 10.3389/fmars.2022.1045667
Sutton A. J., Feely R. A., Maenner-Jones S., Musielwicz S., Osborne J., Dietrich C., et al. (2019). Autonomous seawater pCO2 and pH time series from 40 surface buoys and the emergence of anthropogenic trends. Earth System Sci. Data 11, 421–439. doi: 10.5194/essd-11-421-2019
Sutton A. J., Sabine C., Maenner-Jones S., Lawrence-Slavas N., Meinig C., Feely R., et al. (2014). A high-frequency atmospheric and seawater pCO2 data set from 14 open ocean sites using a moored autonomous system. Earth Syst. Sci. Data 6, 353–366. doi: 10.5194/essd-6-353-2014,2014e
Sutton A. J., Wanninkhof R., Sabine C., Feely R., Cronin M. F., Weller R. A. (2017). Variability and trends in surface seawater pCO2 and CO2 flux in the Pacific Ocean. Geophys. Res. Lett. 44, 5627–5636. doi: 10.1002/2017GL073814
Sutton A. J., Williams N. L., Tilbrook B. (2021). Constraining Southern Ocean CO2 flux uncertainty using uncrewed surface vehicle observations. Geophys. Res. Lett. 48, e2020GL091748. doi: 10.1029/2020GL091748
Takahashi T., Sutherland S. C., Wanninkhof R., Sweeney C., Feely R. A., Chipman D. W., et al. (2009). Climatological mean and decadal changes in surface ocean pCO2, and net sea-air CO2 flux over the global oceans. Deep-Sea Res. II 56, 554–577. doi: 10.1016/j.dsr2.2008.12.009
Taylor J. R., Ferrari R. (2011). Shutdown of turbulent convection as a new criterion for the onset of spring phytoplankton blooms. Limnol. Oceanogr. 56, 2293–2307. doi: 10.4319/lo.2011.56.6.2293
Trull T. W., Jansen P., Schulz E., Weeding B., Davies D. M., Bray S. G. (2019). Autonomous multi-trophic observations of productivity and export at the Australian Southern Ocean Time Series (SOTS) reveal sequential mechanisms of physical-biological coupling. Font. Mar. Sci. 6. doi: 10.3389/fmars.2019.00525
van Heuven S., Pierrot D., Rae J., Lewis E., Wallace D. (2011). Co2sys v 1.1, Matlab program developed for CO2 system calculations (U.S. DoE, Oak Ridge, TN: ORNL/CDIAC-105b. Carbon Dioxide Information Analysis Center, Oak Ridge National Laboratory).
Wanninkhof R. (2014). Relationship between wind speed and gas exchange over the ocean revisited. Limnol. Oceanogr.: Methods 12, 351–362. doi: 10.4319/lom.2014.12.351
Weeding B., Trull T. W. (2014). Hourly oxygen and total gas tension measurements at the Southern Ocean Time Series site reveal winter ventilation and spring net community production. J. Geophys. Res. 119, 1–11. doi: 10.1002/2013JC009302
Weiss R. F. (1974). Carbon dioxide in water and seawater: The solubility of a non-ideal gas. Mar. Chem. 2, 203–215. doi: 10.1016/0304-4203(74)90015-2
Wynn-Edwards C. A., Shadwick E. H., Jansen P., Schallenberg C., Maurer T. L., Sutton A. J. (2023). Subantarctic pCO2 estimated from a biogeochemical float: comparison with moored observations reinforces the importance of spatial and temporal variability. Front. Mar. Sci. 10, 1231953. doi: 10.3389/fmars.2023.1231953
Xue P., Cai W.-J., Takahashi T., Gao L., Wanninkhof R., Wei M., et al. (2018). Climatic modulation of surface acidification rates through summertime wind forcing in the Southern Ocean. Nat. Comms. 9, 3240. doi: 10.1038/s41467-018-05443-7
Yang X., Wynn-Edwards C. A., Strutton P., Shadwick E. H. (2023). Drivers of air-sea CO2 flux in the Subantarctic Zone revealed by time series observations. ESS Open Arch. doi: 10.22541/essoar.169603583.31161857/v1
Young I. R., Ribal A. (2019). Multiplatform evaluation of global trends in wind speed and wave height. Science 364, 548–552. doi: 10.1126/science.aav9527
Keywords: CO2 partial pressure (pCO2), Southern Ocean Time Series (SOTS), pCO2 seasonality, air-sea CO2 flux, ocean acidification
Citation: Shadwick EH, Wynn-Edwards CA, Matear RJ, Jansen P, Schulz E and Sutton AJ (2023) Observed amplification of the seasonal CO2 cycle at the Southern Ocean Time Series. Front. Mar. Sci. 10:1281854. doi: 10.3389/fmars.2023.1281854
Received: 23 August 2023; Accepted: 25 September 2023;
Published: 13 October 2023.
Edited by:
Laurent Coppola, UMR7093 Laboratoire d’océanographie de Villefranche (LOV), FranceReviewed by:
Nicolas Metzl, Centre National de la Recherche Scientifique (CNRS), FranceThanos Gkritzalis, Flanders Marine Institute, Belgium
Copyright © 2023 Shadwick, Wynn-Edwards, Matear, Jansen, Schulz and Sutton. This is an open-access article distributed under the terms of the Creative Commons Attribution License (CC BY). The use, distribution or reproduction in other forums is permitted, provided the original author(s) and the copyright owner(s) are credited and that the original publication in this journal is cited, in accordance with accepted academic practice. No use, distribution or reproduction is permitted which does not comply with these terms.
*Correspondence: Elizabeth H. Shadwick, ZWxpemFiZXRoLnNoYWR3aWNrQGNzaXJvLmF1