- 1State Key Laboratory of Tropical Oceanography, South China Sea Institute of Oceanology, Chinese Academy of Sciences, Guangzhou, China
- 2Innovation Academy of South China Sea Ecology and Environmental Engineering, Chinese Academy of Sciences, Guangzhou, China
- 3University of Chinese Academy of Sciences, Beijing, China
- 4Daya Bay Marine Biology Research Station, Chinese Academy of Sciences, Shenzhen, China
Eutrophication is a global issue associated with increasing anthropogenic activities. Previous studies have mainly focused on nutrients and phytoplankton biomass in some typical estuaries and bays along the Guangdong coast, while integrated evaluations of eutrophication status based on ecological symptoms is still rare in this area. To better understand the health of the Guangdong coastal waters, two comprehensive methods including the Assessment of Estuarine Trophic Status (ASSETS) and the Northwest Pacific Action Plan Common Procedure (NOWPAP CP) were employed with slight modifications. The study area was divided into eight coastal zones (Z1~Z8) based on multiple criteria including salinity, catchment range, and administrative division. The results of the modified NOWPAP CP method demonstrated a generally increasing trend in the degree and effects of nutrient enrichment along the Guangdong coast in the past 30 years mainly due to the increasing nutrients and chlorophyll a (Chl-a). The results of the modified ASSETS method revealed that the water quality was between moderate and high for most coastal zones during 2015-2018, with the highest score (0.83) in the northern part of the Pearl River Estuary (PRE). However, the ecological symptoms showed inconsistent spatial patterns with the water quality, being high or moderate high in Z2 (including Zhanjiang Harbor and Leizhou Bay), Z4~Z5 (representing the northern and southern parts of the PRE, respectively), and Z6 (containing Mirs Bay and Daya Bay) for severe ecological symptoms, such as high levels of Chl-a, frequent harmful algal blooms (HABs). Moreover, eutrophication in Z4~Z6 may further deteriorate due to the increasing nutrient loads driven by growing economy and population. Synthetically, Z2, Z4~Z6 were graded between poor and bad for the overall eutrophication conditions (OEC), while Z1 (including the western and southern parts of the Leizhou Peninsula) and Z7 (consisting of Honghai Bay and Jieshi Bay) had a good OEC. The application of the modified ASSETS method effectively identified areas of severe eutrophication problems and the prospect of nutrient load along the Guangdong coast. The assessment results revealed the spatiotemporal variations and potential trends in the eutrophication status, providing scientific basis for the coastal management related to nutrient problems.
1 Introduction
Coastal eutrophication has been considered one of the greatest threats to coastal ecosystem health in recent decades, as various anthropogenic activities have substantially increased nutrient inputs to coastal areas and caused undesirable effects, such as algal blooms, depleted dissolved oxygen (DO), coastal acidification, and loss of submerged aquatic vegetation and benthic fauna, thereby exacerbating coastal ecosystem degradation (Diaz and Rosenberg, 2001; Breitburg et al., 2018; Wang et al., 2018; Malone and Newton, 2020). The evaluation of eutrophication status is an important tool for effective management concerned with nutrient enrichment issues. Early studies mainly paid attention to nutrient concentrations and compositions in water bodies. Methods based on the nutrients have been widely used in Chinese coastal waters, including the eutrophication index (EI) method (Zou et al., 1983; Niu et al., 2020), the nutrient quality index (NQI) method (Peng and Wang, 1991), the potential eutrophication assessment (PEA) method (Guo et al., 1998) and the fuzzy evaluation method (Xiong and Chen, 1993; He and Yuan, 2007). However, it has recently been agreed upon that nutrient concentrations may not accurately reflect the eutrophication conditions of water bodies. Because coastal ecosystems are also influenced by other factors, such as light limitation due to turbidity, hydrodynamic conditions, runoff input, and precipitation (Cloern, 2001; Bricker et al., 2003; Sinha et al., 2017; Xu et al., 2019). As a result, the magnitude of ecological impact on nutrient enrichment varies widely across different coastal ecosystems. A comprehensive approach based on multiple indicators is therefore essential to understand the extent and ecological effects of nutrient enrichment.
Several integrated assessment methodologies based on ecological symptoms have been developed and successfully applied worldwide in recent years, including the ASSETS (Bricker et al., 2003), the OSPAR comprehensive procedure (OSPAR COMP) (OSPAR Commission, 2003), the HELCOM eutrophication assessment tool (HEAT) (Andersen et al., 2011), and NOWPAP CP (NOWPAP CEARAC, 2011). These methods are different in definitions and application, but all use key indicators for evaluating eutrophication status, such as phytoplankton biomass, DO, frequency of HABs and fish kills incident, and changes in aquatic community structure (Devlin et al., 2011). The ASSETS method has been proven to be a scientific and practical method for eutrophication assessment and has been applied in 141 US water bodies and many other countries (Bricker et al., 2003; Borja et al., 2008; Devlin et al., 2011). In China, it has been applied in the Yangtze River estuary, the Bohai Sea, Jiaozhou Bay, and Xiamen Bay with some methodology modifications according to the regional coastal environments (Wu et al., 2013; Wu et al., 2019; Luo et al., 2022). The NOWPAP CP method has advantages in providing more details of ecological symptoms and showing long-term changes of the indicators, which has been used in the Jiaozhou Bay assessment (Wu et al., 2019).
The Guangdong coastal area is one of the most developed regions in China, which has received a lot of nutrients due to massive economic growth, urban development, and population aggregation in recent decades (Liu et al., 2009; Qu and Kroeze, 2010; Strokal et al., 2014; Wang et al., 2018). Eutrophication problems have been reported in many estuaries and bays along the Guangdong coast (Huang et al., 2003; Han et al., 2012; Wang et al., 2018). Algal blooms have occurred about 10 times per year along the Guangdong coast (DOF (Department of Ocean and Fisheries of Guangdong Province), 2015-2017). The increasing eutrophication and associated seasonal hypoxia problems in the PRE and adjacent areas have attracted widespread attention from academics and the public (Huang et al., 2003; Qi et al., 2004; Wang et al., 2007; Yin and Harrison, 2007; Wang et al., 2008; Wang et al., 2011; Han et al., 2012; Li et al., 2014). Nevertheless, previous studies have mainly focused on the characterization of nutrient and phytoplankton biomass, with a lack of comprehensive evaluations based on different ecological effects of nutrient enrichment. Knowledge about the overall eutrophication condition of the study area, containing the major pressure, state and future perspective, remains indeterminate.
To fill this gap, this study employed two comprehensive methods, including the ASSETS and NOWPAP CP methods, to assess the eutrophication status of the Guangdong coastal waters. The indicators and their thresholds used in the assessment were modified to accommodate the relative sensitivity of local systems to nutrient-related degradation. Trends of nutrient load, which was based on the major drivers in watersheds, were considered in the ASSETS assessment to provide a view on the future outlook of nutrient pressures and potential impacts. The present study aimed to: (1) explore an appropriate technique to comprehensively illustrate the impacts of nutrient enrichment on the Guangdong coastal waters; (2) investigate the variations in eutrophication status and causative factors between different coastal zones; (3) anticipate the future outlook of eutrophication and provide implications for targeted management.
2 Materials and methods
2.1 Study area
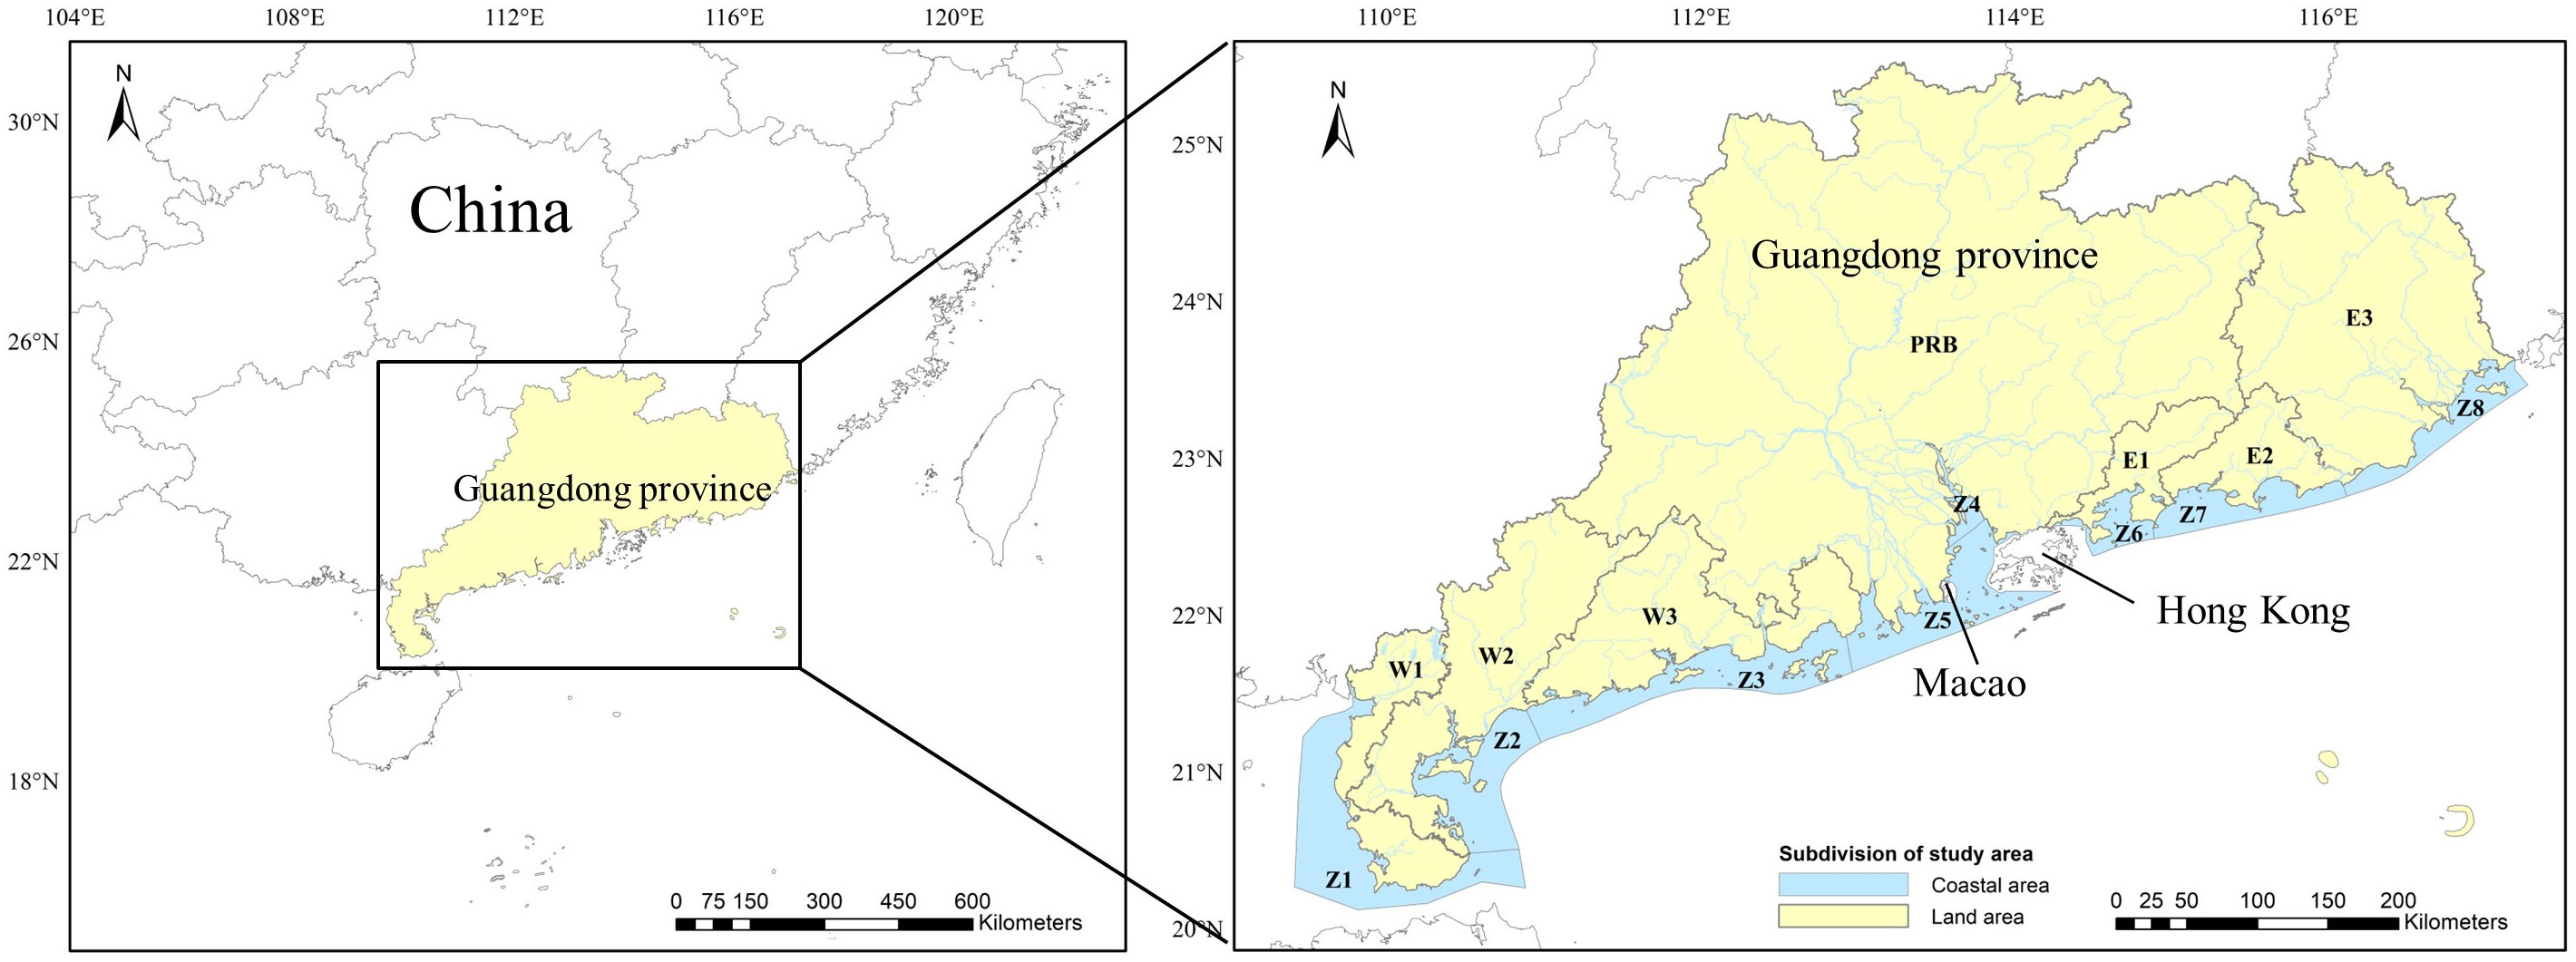
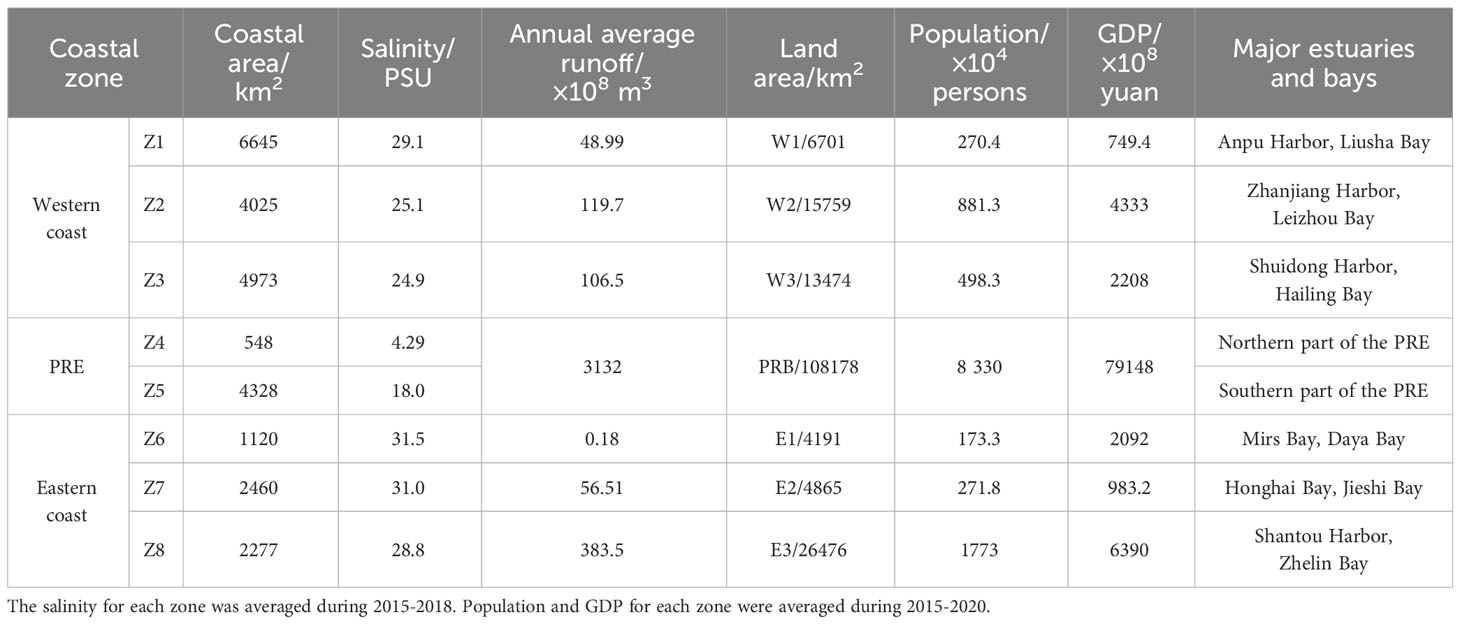
The Guangdong coast is located in the north of the South China Sea (Figure 1). The Pearl River, the largest river discharging into the northern part of the South China Sea, transports a large amount of freshwater (~3.1 × 10¹¹ m3/a) and sediment (~6.4 × 10⁷ t/a). Nearly 80% of the river discharge occurs during the wet season from April to September. Previous studies have shown that the diluted waters of the Pearl River play an important role in carrying nutrients to the Guangdong coast (Huang et al., 2003; Lu et al., 2009). The complicated hydrodynamic conditions also contribute to nutrient transportation, which are controlled by coastal currents, seasonally reversed winds, and upwelling (Niino and Emery, 1961; Bao et al., 2005; Gu et al., 2012; Shu et al., 2018; Lao et al., 2019). According to the differences in geography, environment, and socioeconomic conditions, the Guangdong coast is usually divided into three regions: the PRE, the western and eastern parts of Guangdong Province. In this study, it was divided into eight coastal zones (Z1~Z8) to better understand the spatial variations in water quality and their potential influencing factors (Figure 1). A coastal zone, which was mainly identified by the catchment range and administrative borders of relevant counties, usually consisted of several adjacent estuaries and bays. Moreover, the PRE was divided into two subdivisions (Z4~Z5) based on salinity and depth to distinguish the characteristics between the upper and lower reaches of the estuary. Accordingly, the land area of Guangdong Province was divided into seven subregions (W1~W3, PRB, and E1~E3). There are significant differences in salinity, runoff, population and economy between different zones (Table 1). The Pearl River Basin has a large land area and dense population, which encompass major population centers including Guangzhou City, Shenzhen City, Dongguan City, Foshan City and Zhuhai City. Besides, these areas are industrial, economic and cultural centers of Guangdong Province. The watersheds in the western and eastern coastal zones were characterized by intensified agricultural activities.
2.2 Data description
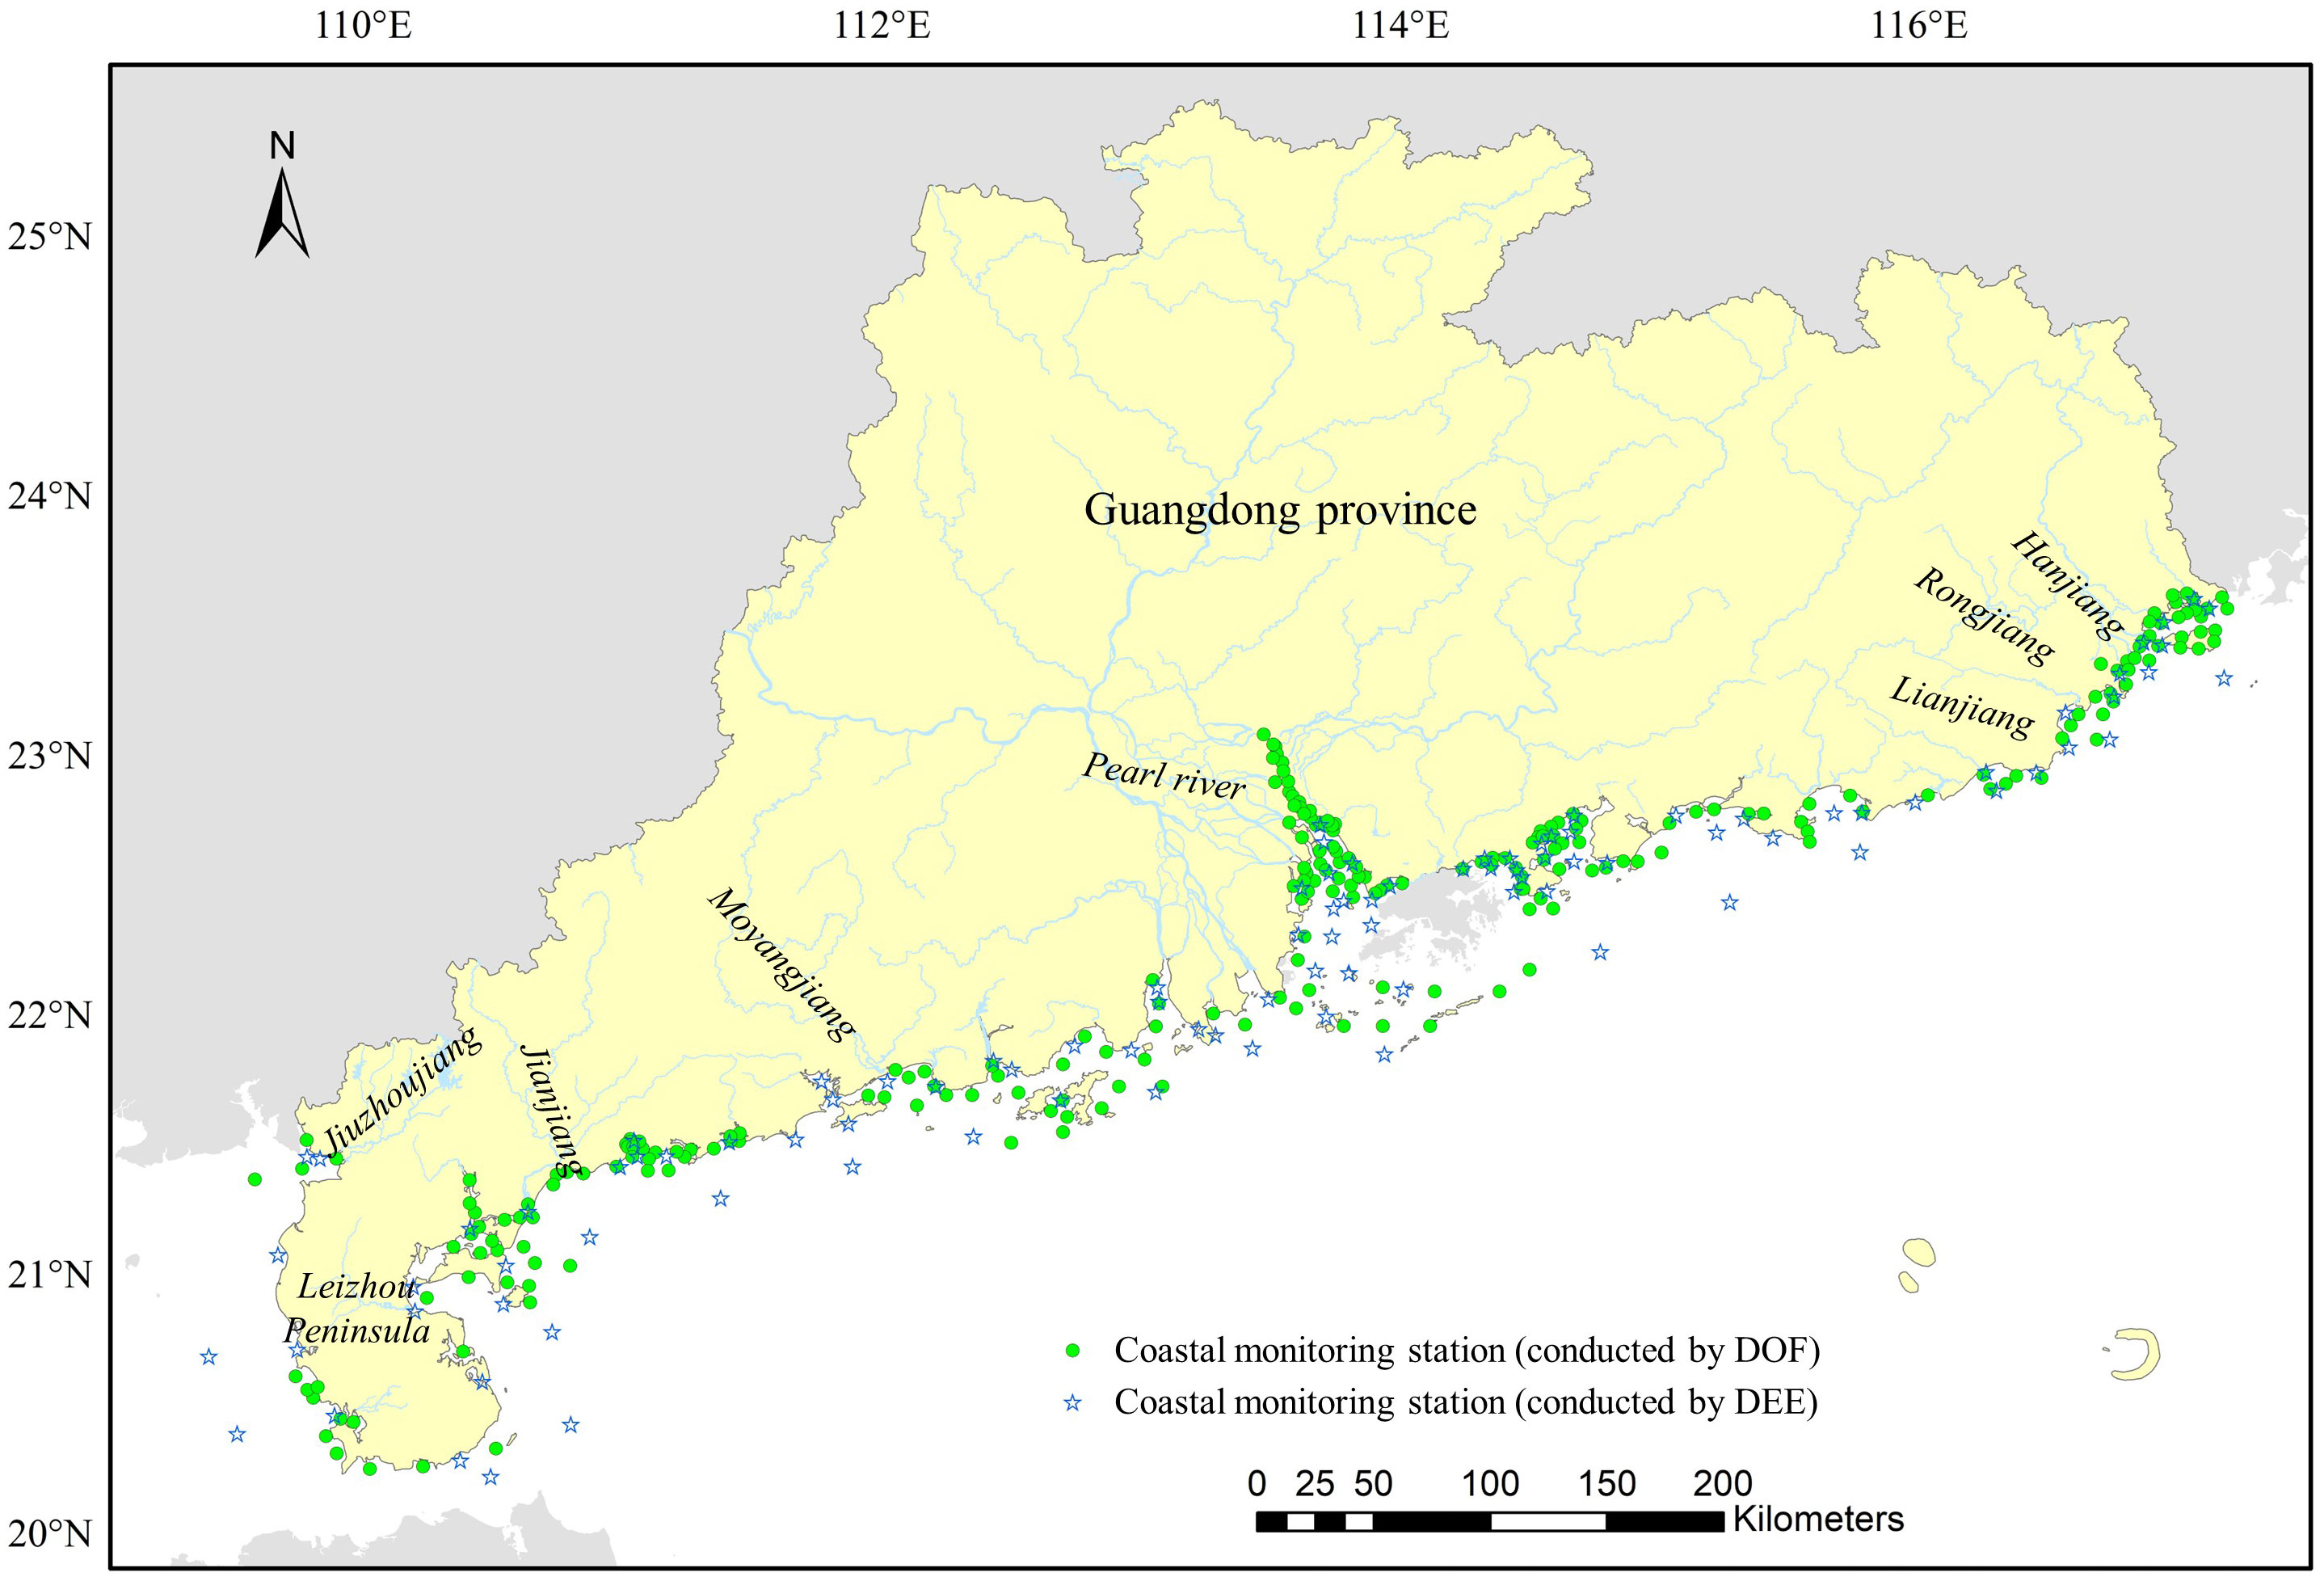
Water quality and ecological data was collected from the estuarine and marine environment monitoring network to assess the eutrophication status of the Guangdong coastal waters between 2015 and 2018 (Figure 2). The monitoring data was obtained from the routine monitoring program of water quality in Guangdong Province, which was conducted by the Department of Ocean and Fisheries of Guangdong Province (DOF) and the Department of Ecology and Environment of Guangdong Province (DEE). Water samples of dissolved inorganic nitrogen (DIN), dissolved inorganic phosphorus (DIP), chemical oxygen demand (COD), Chl-a, and dissolved oxygen (DO) were obtained from more than 300 sampling sites along the Guangdong coast. The majority of sampling stations had a depth less than 20 m, and sampling stations in estuaries and bays were more intensive than those in the open sea. The survey was usually taken during spring (March to May), summer (July to August), and autumn (September to November), with a survey frequency of three to four times annually. The collection, storage, and analysis of water samples had complied with China’s national standard specifications for marine monitoring (SAQSIQ (State Administration of Quality Supervision, Inspection and Quarantine, China), and SSA (State Standardization Administration, China), 2007a; SAQSIQ (State Administration of Quality Supervision, Inspection and Quarantine, China), and SSA (State Standardization Administration, China), 2007b; SAQSIQ (State Administration of Quality Supervision, Inspection and Quarantine, China), and SSA (State Standardization Administration, China), 2007c). Finally, between 2015 and 2018, over 4700 data points for nutrients, COD, and DO, and more than 3600 data points for Chl-a were collected. The spatial and temporal variations of the monitoring data are shown in Figures S1 , S2. The annual average and standard deviation of the main parameters are shown in Table S1.
Data of HABs was obtained from the Bulletin of Marine Environmental Quality of Guangdong Province (http://gdee.gd.gov.cn/hjzkgb/index.html), Bulletin of Guangdong Marine Disaster (http://nr.gd.gov.cn/zwgknew/sjfb/tjsj/), and China Ocean Yearbook (http://cnki.nbsti.net/csydmirror). The socioeconomic statistics data was collected from the Guangdong Statistical Yearbook (http://stats.gd.gov.cn/gdtjnj). The annual runoff and precipitation data was collected from the Guangdong Water Resources Bulletin (http://slt.gd.gov.cn/szygb). The main sources of the data used in this study are shown in Table S2.
2.3 Methods
2.3.1 Modified ASSETS method
The ASSETS method is derived from the National Estuarine Eutrophication Assessment (NEEA) conducted by the U.S. National Oceanic and Atmospheric Administration (NOAA) for evaluating both current eutrophic conditions and the effectiveness of management actions aimed at reducing eutrophic conditions (Bricker et al., 2003; Scavia and Bricker, 2006; Bricker et al., 2008). It has been developed and applied in coastal waters of the US, Europe, Australia, and China. This study adapted the pressure-state-response framework derived from the original ASSETS application (Bricker et al., 2003), and learned from the recent modifications described in the eutrophication assessment of the southwest Bohai Sea (Wu et al., 2013). The overall eutrophication condition (OEC) was determined by three component parts: water quality (WQ, pressure), ecological symptoms (ES, state), and future outlook of nutrient load (FO, response). The indicators and thresholds were modified to accommodate the relative sensitivity of local areas to nutrient-related degradation.
2.3.1.1 Indicators and thresholds of WQ and ES
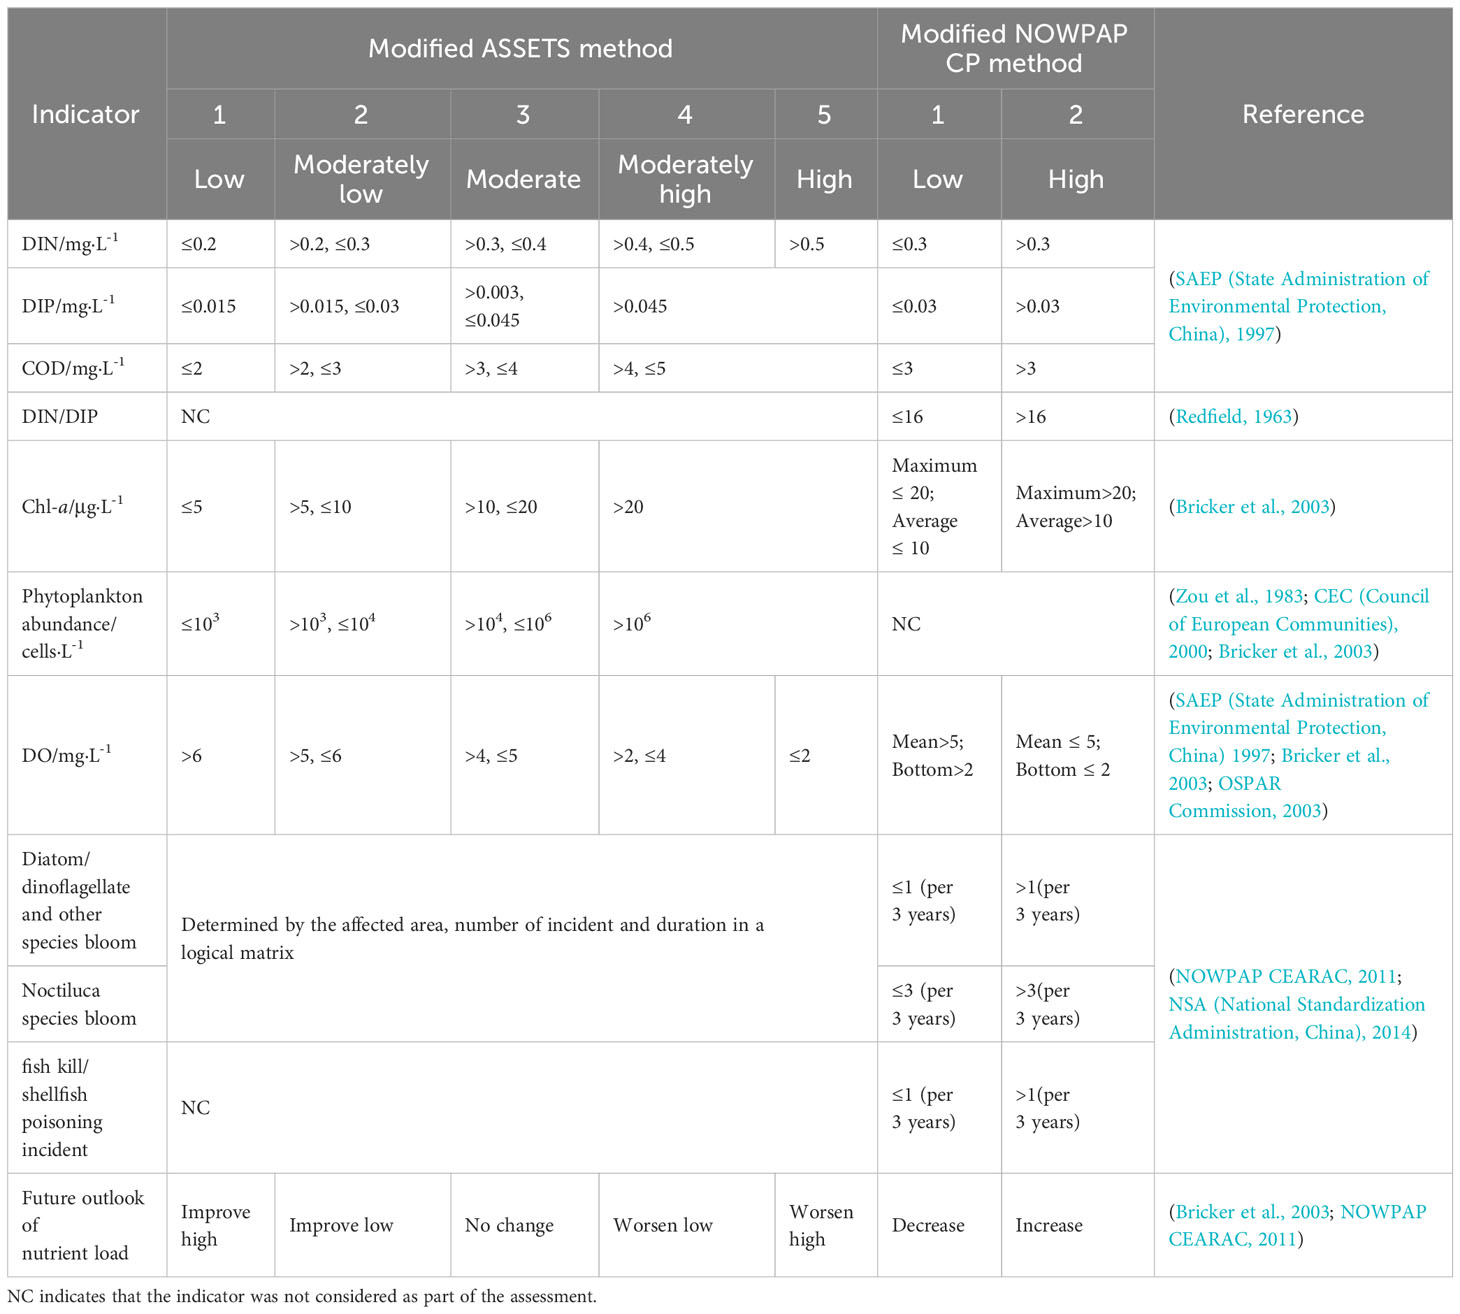
The WQ indicators included DIN, DIP, and COD, with thresholds designed according to China’s national seawater quality standard (SAEP (State Administration of Environmental Protection, China), 1997) and previous studies (Zou et al., 1983; Guo et al., 1998). High Chl-a concentration and phytoplankton abundance were considered the primary ecological symptoms, while low DO and occurrence of HABs were considered the secondary symptoms. Their thresholds were determined based on previous studies and relevant technological standards (Zou et al., 1983; SAEP (State Administration of Environmental Protection, China), 1997; CEC (Council of European Communities), 2000; Bricker et al., 2003; OSPAR Commission, 2003; Wu et al., 2013). Details of the classification and thresholds are shown in Table 2.
2.3.1.2 Evaluation of FO
Changes in the main drivers of coastal eutrophication were used to access FO. Previous studies revealed that riverine discharge and atmospheric deposition contributed significantly to coastal eutrophication (Howarth, 2008; Liu et al., 2009; Jickells et al., 2017). According to the Bulletin of the Second National Census on the Sources of Pollution of Guangdong (http://gdee.gd.gov.cn/wrygzdt/content/post_3100417.html), population and agriculture accounted for approximately 97.8% of total nitrogen (TN) discharge from water pollutants (Figure S3), while mobile (including automobile and non-road mobile sources) pollution and industrial pollution were the major sources of nitrogen oxides from air pollutants. Agricultural non-point source pollution of TN was mainly attributed to chemical fertilizers and livestock farming, while livestock farming and aquaculture were the main sources of TP pollution (Ge et al., 2022). To capture trends of the major drivers that might significantly impact nutrient inputs, five indicators were selected for evaluation, including population (PO), value-added of industry (IN), consumption of chemical fertilizer (CF), output of meat (OM), and aquatic products (AP). The Spearman correlation coefficient was used to analyze the trends of the main drivers during 2015-2020. The final assessment was based on the synthetic analysis of the historical presentation and prospects of the five indicators according to statistics and relevant development planning.
2.3.1.3 Evaluation procedure and calculation method
To provide a consistent spatial framework for information collection, a physical subdivision of the water body was made using salinity (Bricker et al., 2003). In this study, the Guangdong coast was divided into eight zones based on the multiple criteria, including salinity, depth, catchment range, administrative division, and sampling sites. No further subdivisions were made as most sampling sites in the PRE were in the mixing zone (salinity between 0.5-25 PSU) and the majority of other coastal zones were in the seawater zone (salinity above 25 PSU). The concentration for assessment was calculated through a percentile-based approach (10th percentile for DO and 90th percentile for the other indicators) to avoid extremely high or low values. The indicator scores were determined by combining concentration, spatial coverage, frequency of occurrence, affected area, and duration (for HABs) through a logical decision process. In order to fully reflect the severity of HABs, algal blooms had been sorted into nuisance blooms and toxic blooms due to their relative ecological effects (Shen, 2001; Bricker et al., 2003; NSA (National Standardization Administration, China), 2014). Problem conditions for toxic blooms resulted from the production of toxin by the organism, causing mortality or shellfish-vectored poisoning of humans. Problem conditions for nuisance blooms referred to other adverse impacts including physiological damage to marine organisms, and die-offs of farmed fish and cultivated shellfish which could lead to financial losses in aquaculture. Moreover, each category of algal blooms was divided into several classifications according to the scope of affected area (NSA (National Standardization Administration, China), 2014). The WQ ratings and primary ecological symptoms ratings were averaged, while the worst secondary symptoms rating was selected in a precautionary approach. The WQ expression was classified into five levels. The ES rating was determined by combining the primary and secondary symptoms in a matrix, giving more weight to the secondary symptoms. Detailed calculation procedures were shown in the application of the Bohai Sea (Wu et al., 2013). The modifications in the Chl-a and DO evaluation processes are shown in Tables S3, S4. The OEC rating was determined by combining WQ, ES, and FO through 125 possible combinations (Table 3) that fell into one of five grades: 1 (excellent), 2 (good), 3 (moderate), 4 (poor), and 5 (bad).
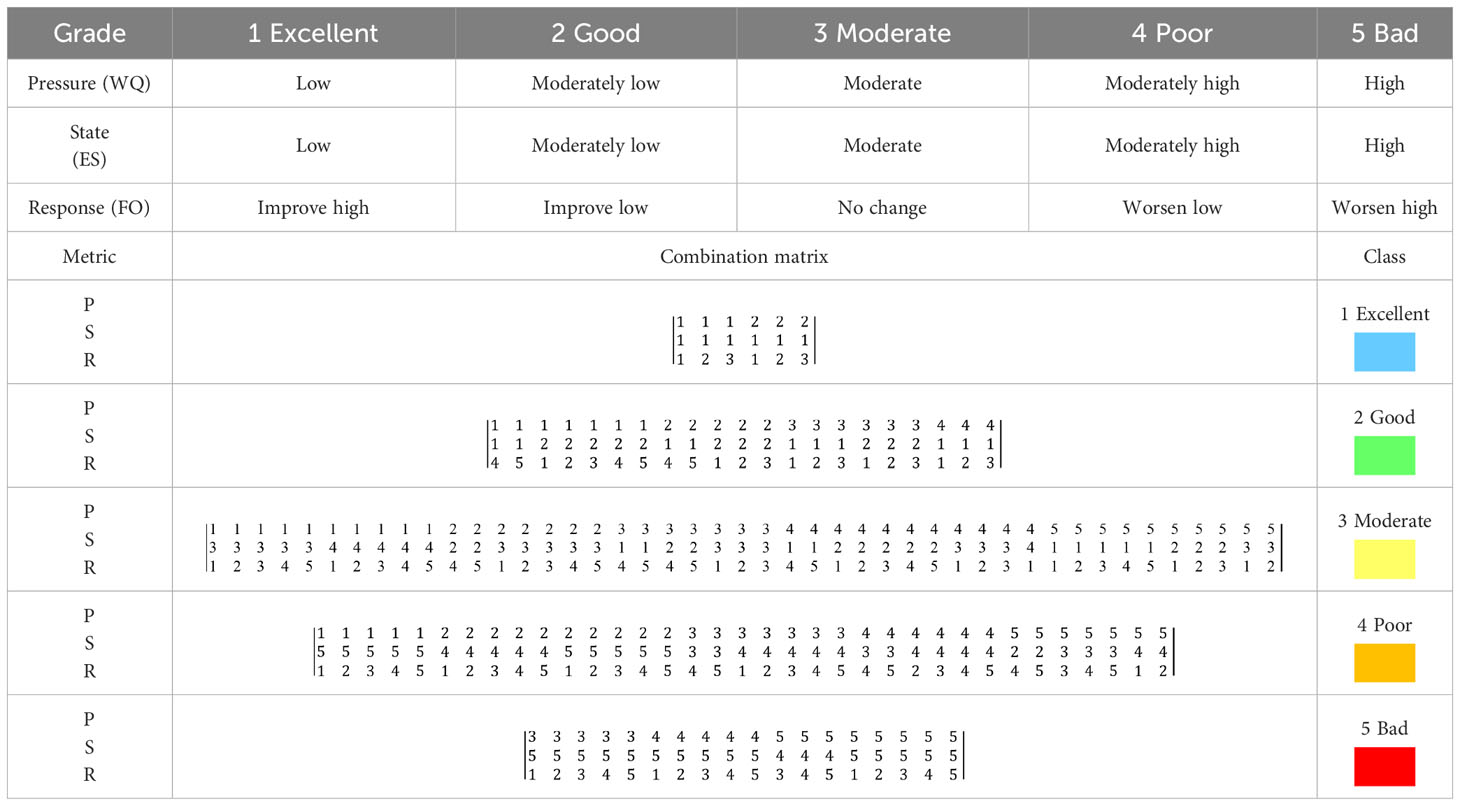
Table 3 Aggregation of pressure (WQ), state (ES) and response (FO) components into an overall eutrophication condition category.
2.3.2 Modified NOWPAP CP method
The NOWPAP CP method was developed to assess the eutrophication status in the NOWPAP region (NOWPAP CEARAC, 2011). It was separated into two steps, the same as OSPAR CP: the screening procedure was used to preliminarily assess eutrophication by detecting symptoms of eutrophication within minimum parameters (nutrients inputs, red tide event frequencies, and Chl-a), and the comprehensive procedure was used to assess the status and possible causes of eutrophication. The comprehensive procedure required the collection of information and data in line with the following four categories of parameters considering the degree and effects of nutrient enrichment: (I) degree, including DIN and DIP concentrations and their molar mass proportion; (II) direct effects, including Chl-a concentration and HABs, except for Noctiluca species blooms; (III) indirect effects, including DO and COD concentrations and fish kill events; and (IV) other possible effects, including Noctiluca species blooms and shellfish poisoning incidents. The indicators were assessed by classification (high or low) and trends (increasing, decreasing, or no change). The eutrophication status was classified into one of six categories: High-Increase (HI); High-No Trend (HN); High-Decrease (HD); Low-Increase (LI); Low-No Trend (LN); and Low-Decrease (LD). The eutrophication level of DO was determined in reverse to other parameters. For example, it was rated as “LD” when the DO values were above the reference value and showed an increasing trend and “HI” when they were below the reference value and had a decreasing trend.
In this study, most indicators and reference values conformed to those used in the Jiaozhou Bay assessment (Wu et al., 2019). In addition, slight modifications were made to accommodate local environmental characteristics and facilitate comparison with the ASSETS method as follows: (1) the riverine nutrient load based on the major drivers in the watershed was used instead of the riverine DIN concentration; (2) the surface DO concentration was replaced by the mean DO concentration; and (3) the threshold of the mean Chl-a concentration was increased from 5 μg/L to 10 μg/L. Details are shown in Table 2. The three-year moving average method was used to calculate algal bloom incidences. In addition, changes in typical estuaries and bays were used to represent the trends of coastal zones due to insufficient long-term monitoring data for all sampling sites. The long-term trends of HABs were identified using the nonparametric Mann–Kendall test (Salmi et al., 2002) with long-term observation from 2001 to 2020. Changes in the other indicators were analyzed by comparison with reference conditions in the 1990s obtained from related reports and previous studies (Editorial Board of China Bay Survey, 1998a; Editorial Board of China Bay Survey, 1998b; Editorial Board of China Bay Survey, 1999; Du et al., 2003; He and Yuan, 2007; Huang et al., 2010; EPD (Environmental Protection Department of the Hong Kong Special Administrative Region), 2020; Hu et al., 2021; Zhang et al., 2022). A deviation greater than 50% from the reference value was considered an upward or downward trend. The assessment rating for each category was determined by selecting the most representative status of indicators.
3 Results
3.1 Results of the modified ASSETS method
3.1.1 Expression of water quality and ecological symptoms
The relative proportions of WQ (Figure 3) classification as good, moderate, poor, and bad were as follows: 4%, 35%, 59%, and 2%, respectively. High or moderately high levels of WQ were widespread along the Guangdong coast due to high concentrations of DIN and DIP, showing the highest score (0.83) in Z4. A moderately low level (graded good) of WQ appeared in Z6 with the lowest score of 0.25. The annual variation in WQ showed an improvement in the study area from 2015 to 2018 (Figures 4, 5) because the relative proportions of water bodies as excellent and good increased from 4% to 39%.
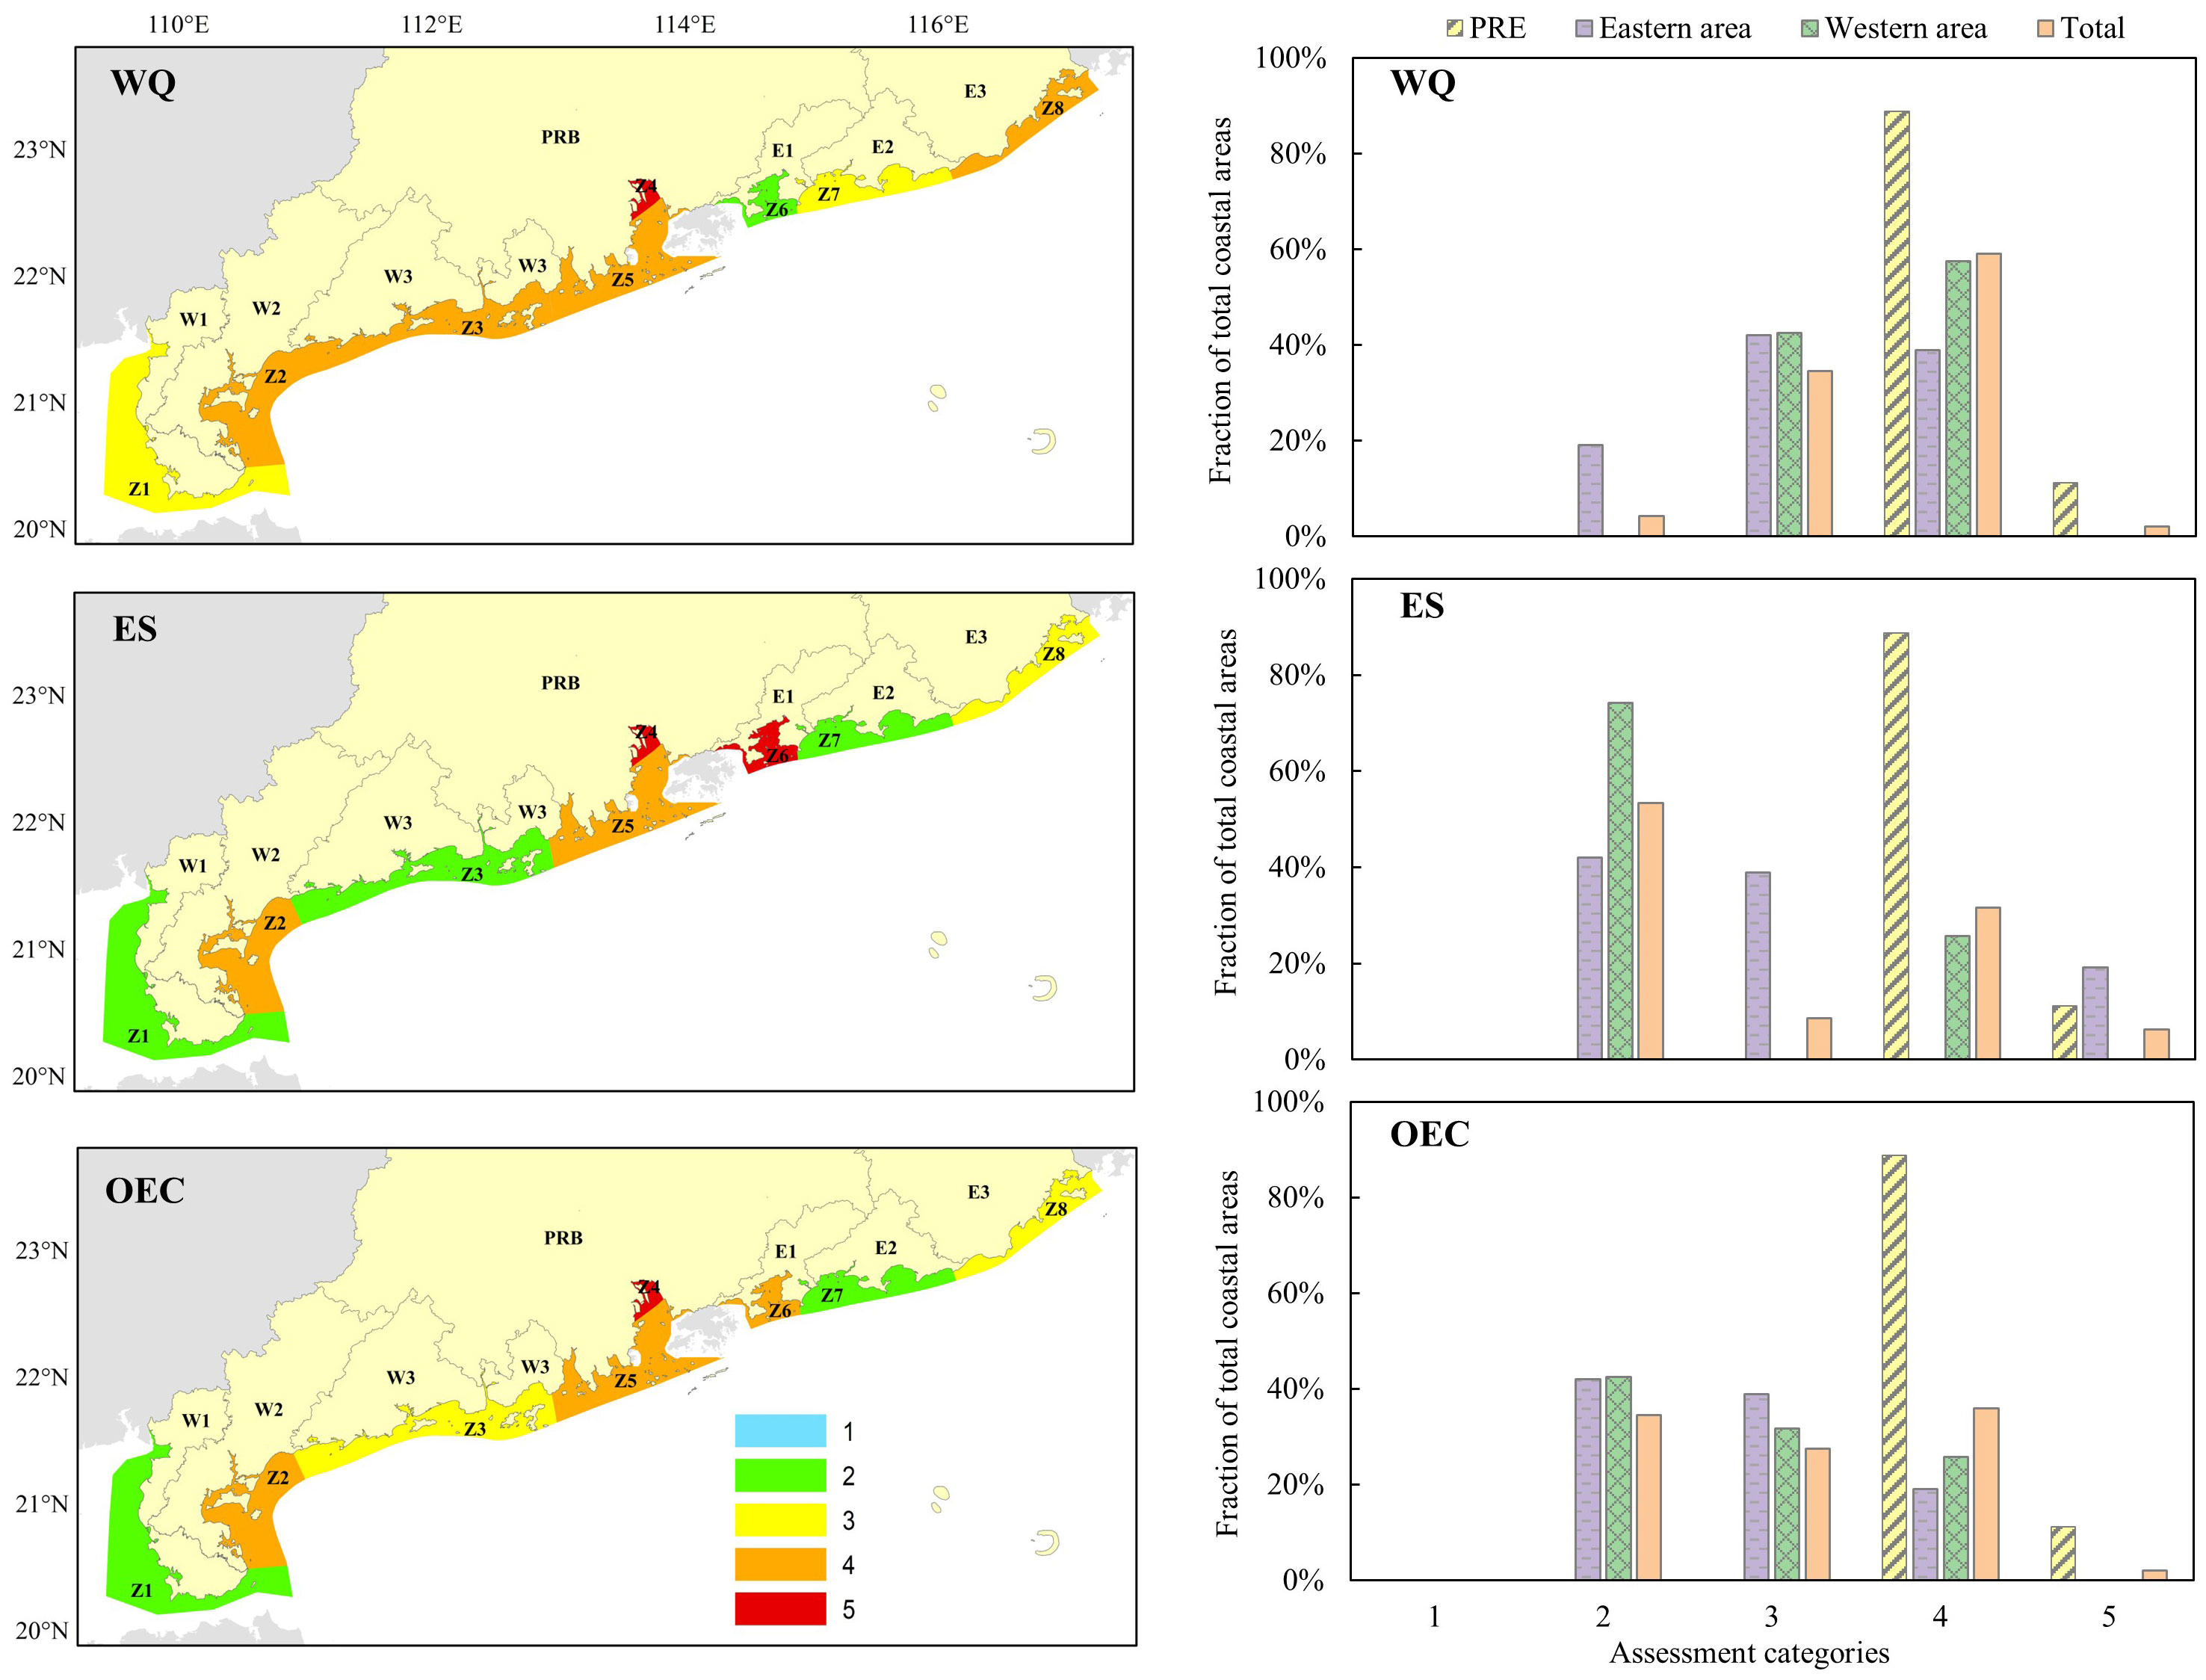
Figure 3 The WQ, ES, and OEC gradings for coastal zones on the Guangdong seaboard in the comprehensive assessment (2015-2018) by the modified ASSETS method. Grades 1 to 5 represent excellent, good, moderate, poor, and bad, respectively.
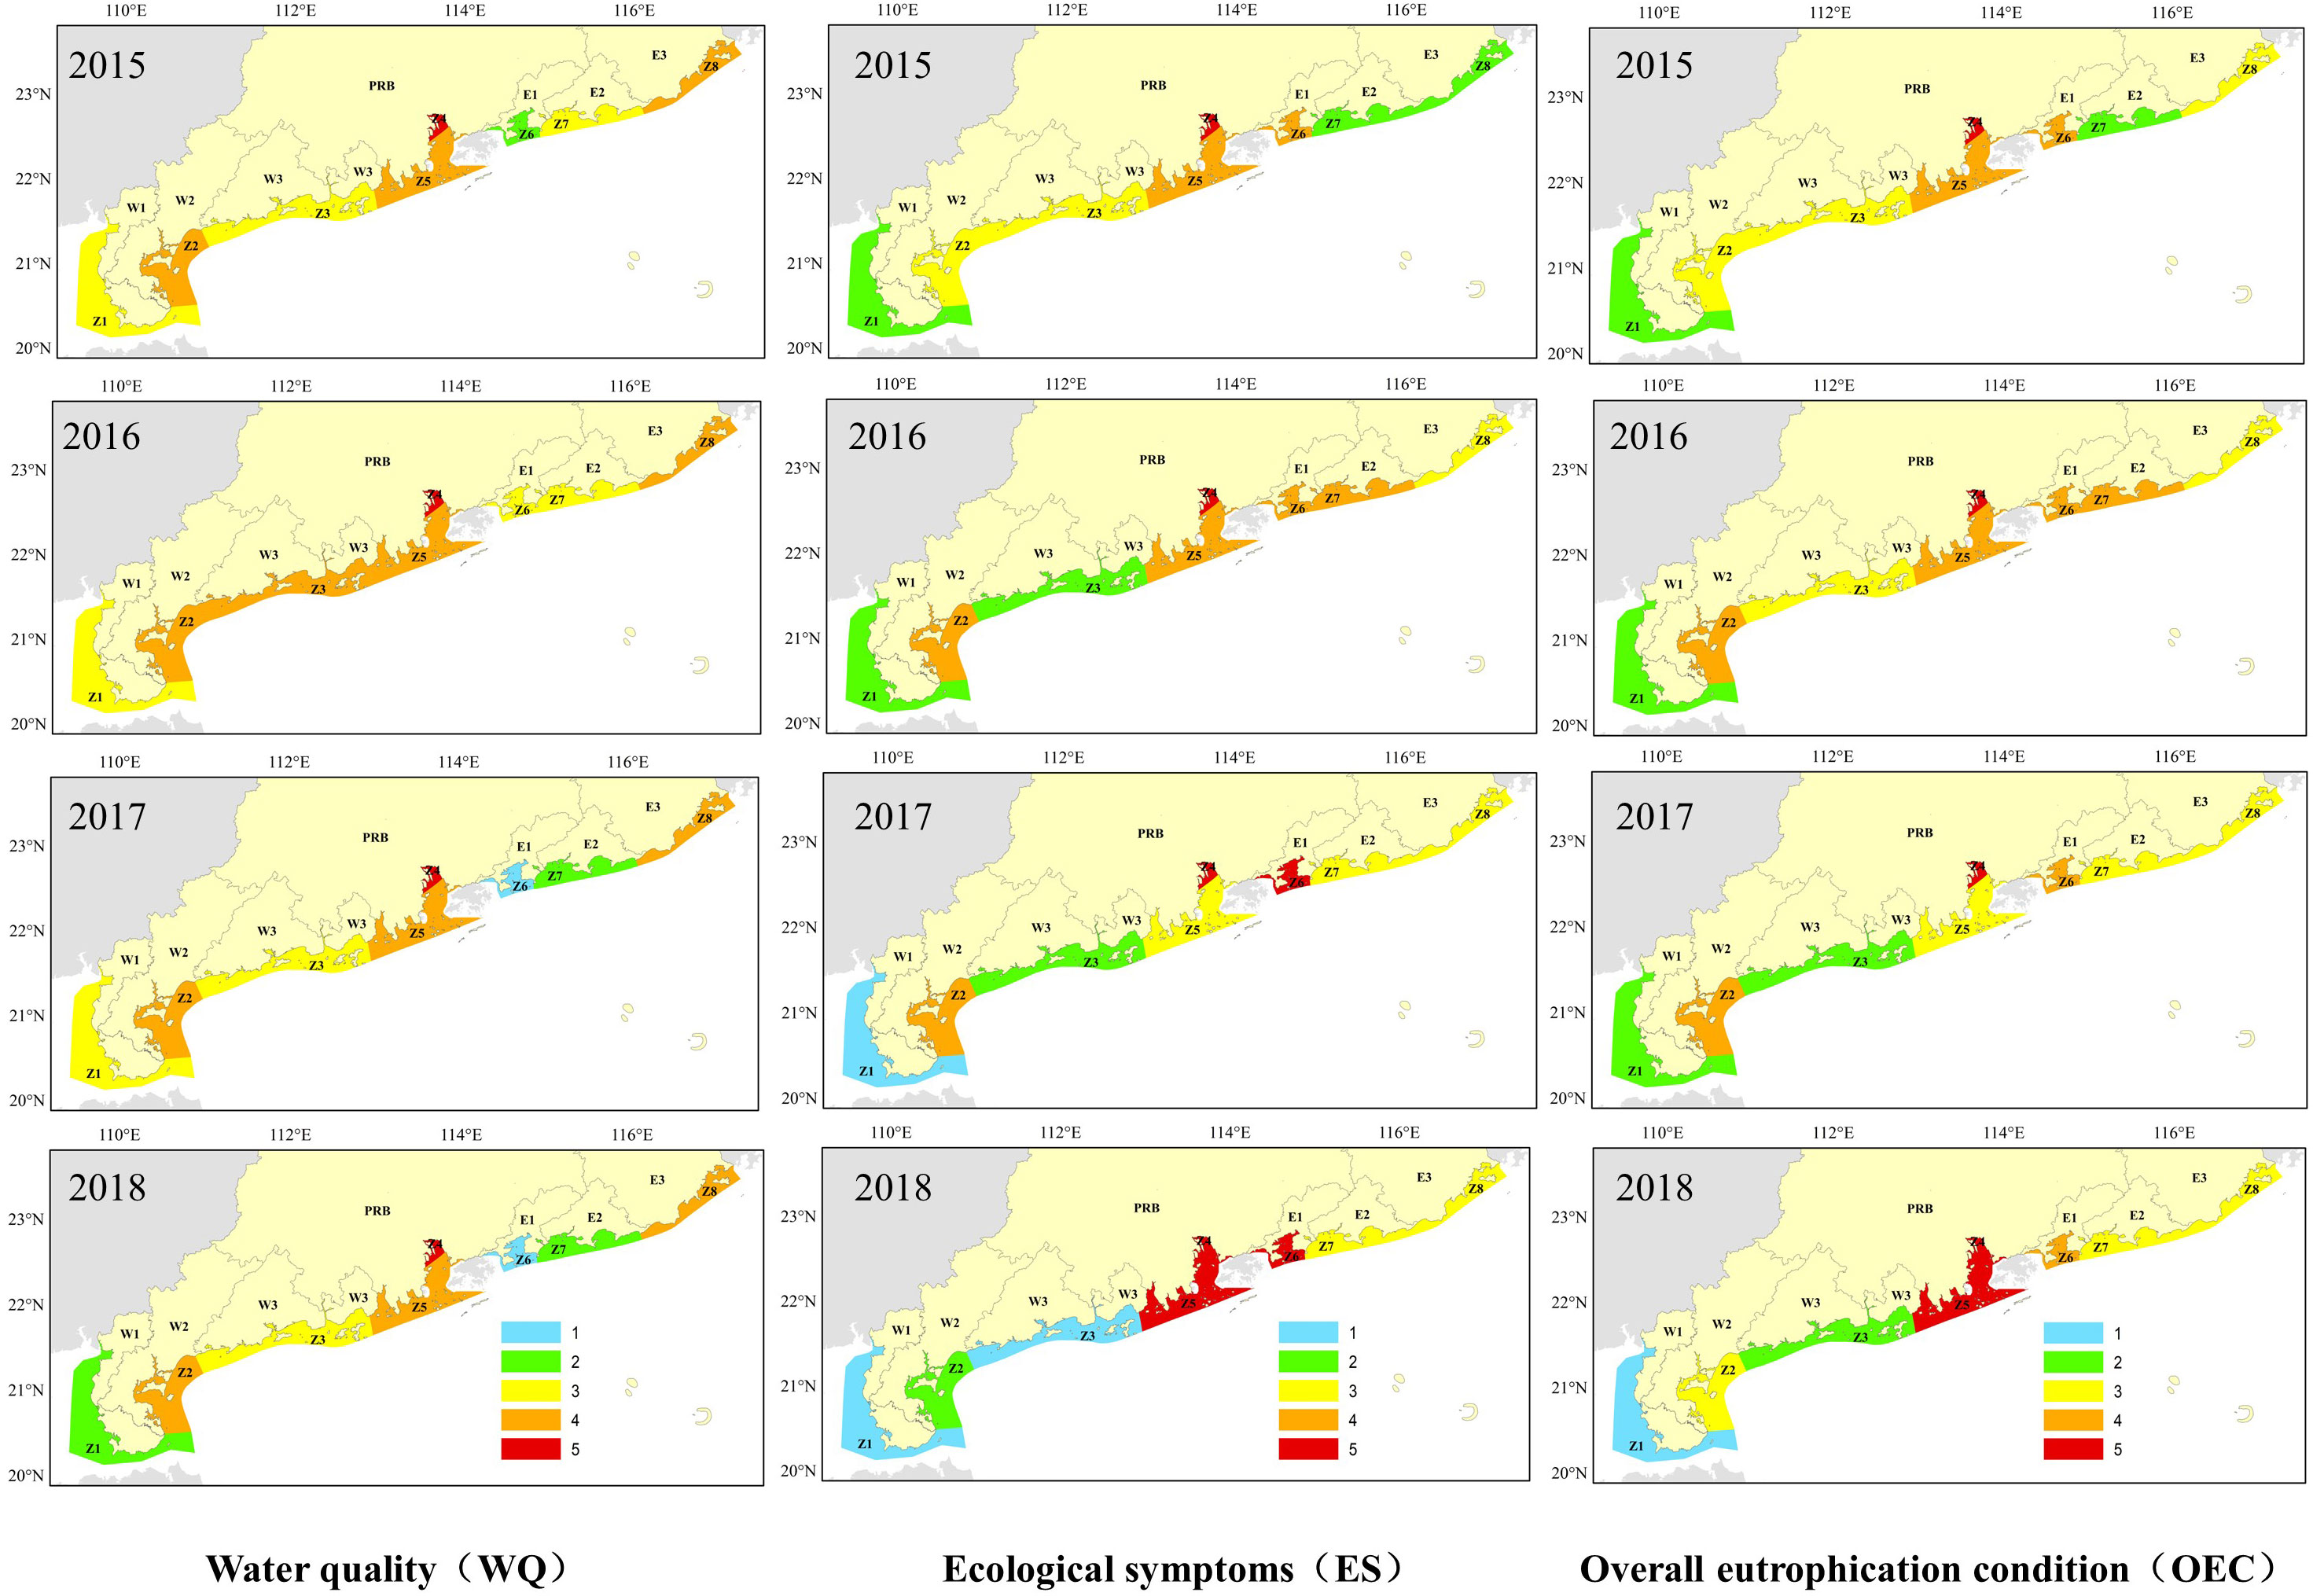
Figure 4 The WQ, ES and OEC gradings for coastal zones on the Guangdong seaboard in the annual assessment by the modified ASSETS method. Grades 1 to 5 represent excellent, good, moderate, poor, and bad, respectively.
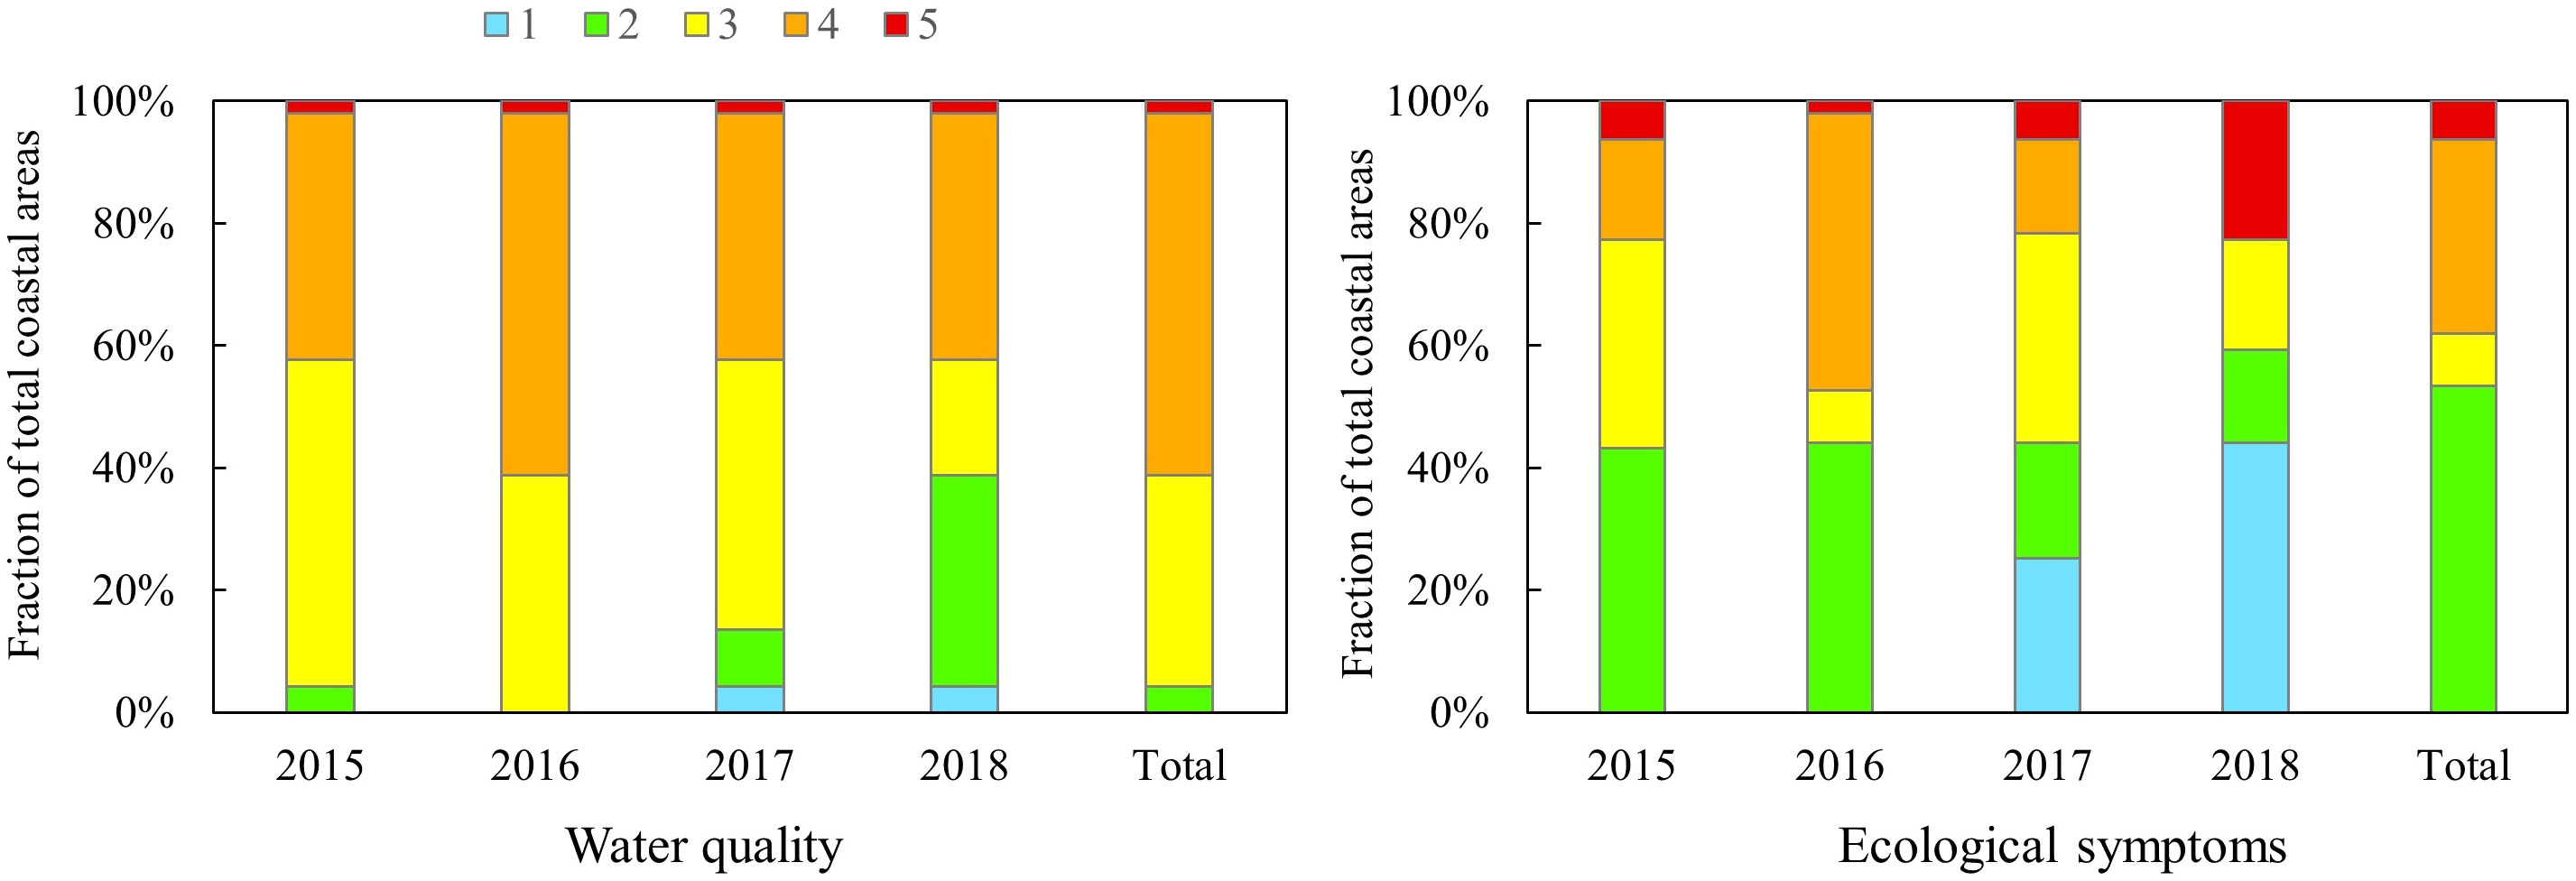
Figure 5 Comparison of the annual variation in the relative proportion of the WQ and ES classifications. Grades 1 to 5 represent excellent, good, moderate, poor, and bad, respectively.
The ES ratings for the Guangdong coast are shown in Figure 3, of which 53% had a moderately low ES, 9% were moderate, 32% were moderately high, and 6% had a high ES. The scores of the eight zones for the primary symptoms were between moderate and high, revealing high levels of Chl-a biomass. High levels of secondary symptoms were mostly confined to Z4 and Z6 due to the distinct low-oxygen conditions in the bottom waters. Z2 and Z5 had a moderate rating for secondary symptoms mainly because of the periodic occurrence of nuisance algal blooms. As a result, the final ES ratings were graded bad for Z4 and Z6, followed by Z2 and Z5, which had a poor grade. The annual variation in ES (Figures 4, 5) showed opposite trends in the study area during 2015-2018, as the relative proportions of excellent and good increased from 43% to 59%, while that of bad increased from 6% to 23%. Notable enhancements in ES were seen in the western part of Guangdong Province, such as Z1 and Z3, whereas degradation was seen in the eastern part.
The application of the percentile-based approach for ES assessment was illustrated for Chl-a and DO (Figure 6) using data from the PRE between 2015 and 2018. The 90th percentile Chl-a in the northern part of the PRE (Z4) was more than twice as high as that in the southern part of the PRE (Z5), both exceeding the threshold (10 μg/L). The 10th percentile DO was lower than 3 mg/L with a coverage rate of 100% for Z4, while it was periodically close to 4 mg/L with a coverage rate of 55% for Z5, indicating more severe hypoxic conditions for Z4. HABs occurred twice a year in the PRE, with an affected area of less than 100 km2 and durations between 4 and 13 days. These symptoms resulted in a poor ecological condition in the PRE, rating moderately high in the south and high in the north.
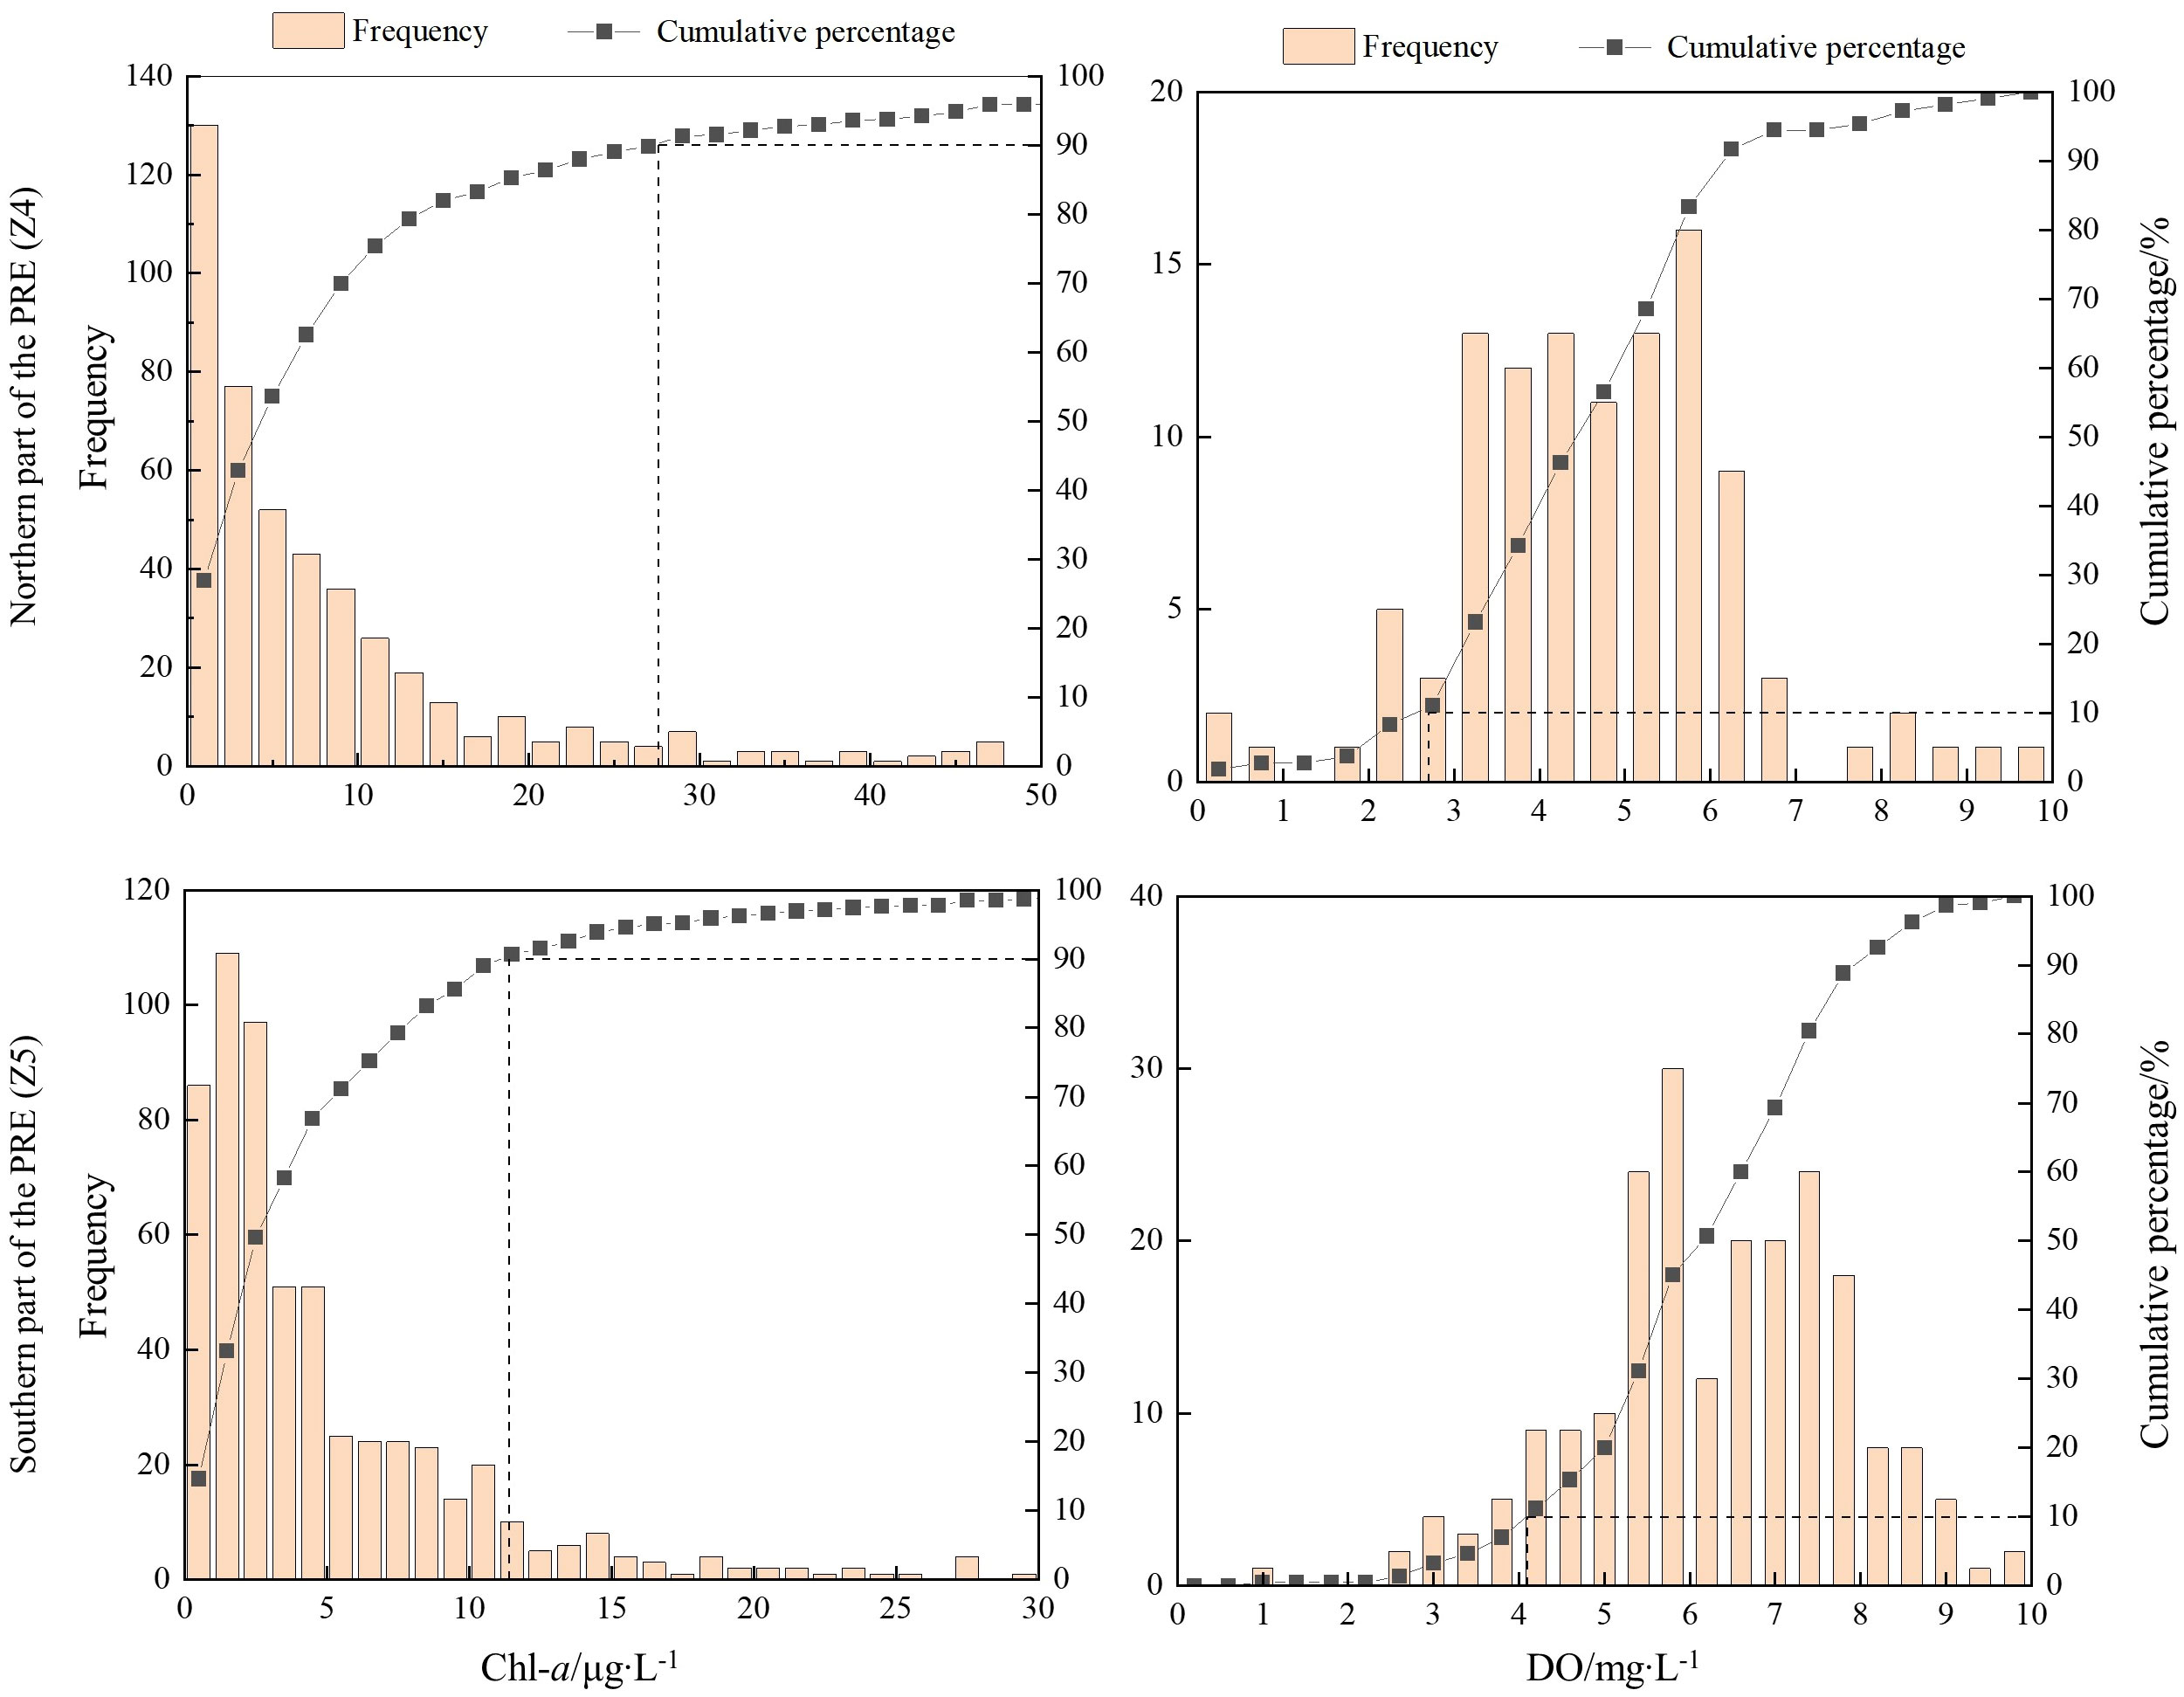
Figure 6 Example diagrams showing the 90th percentile for Chl-a and the 10th percentile for DO in the subdivisions of the PRE.
3.1.2 Trends of nutrient load
Spearman correlation coefficient analysis revealed that PO and IN increased significantly (p<0.01) in the study area, while CF showed a decreasing trend (p<0.01). Moreover, OM and AP showed no obvious change. Significant spatial variations in these indicators (Figure S4) existed among different coastal areas due to the regional imbalance of development. The final FO grade based on the trend analysis of the five major drivers for each zone is shown in Table S5. The results demonstrated that nutrient loads for Z4~Z6 might continue to increase due to the growing economy and population. The nutrient loads for Z8 might decrease due to the distinct declines in PO, CF and OM. The other coastal zones might have no obvious changes in nutrient discharge.
3.1.3 Synthesis of the overall eutrophication condition
The OEC ratings for the eight coastal zones were between good and bad (Figure 3), showing higher ratings in Z2, Z4, Z5 and Z6 (graded bad for Z4 and poor for the other zones). Lower ratings of OEC were shown in Z1 and Z7 (both graded good). The relative proportions of OEC classification as good, moderate, poor, and bad were as follows: 35%, 27%, 36%, and 2%, respectively. The results indicated the most severe eutrophication problems were in the PRE, showing high OEC in the north and moderately high OEC in the south. The eastern and western parts of Guangdong Province presented a similar proportion of OEC, placing most zones in the good and moderate categories.
3.2 Results of the modified NOWPAP method
3.2.1 Status ratings for each category
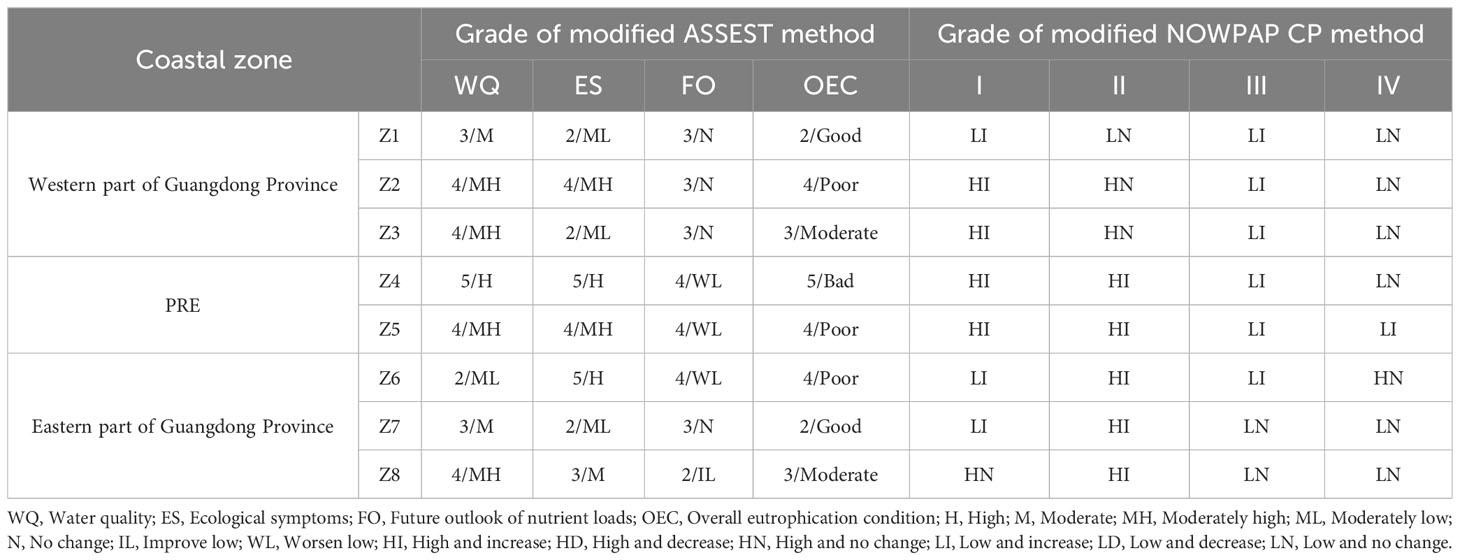
The degree of nutrient enrichment (Category I) between 2015 and 2018 was at a high level, as determined by high concentrations of DIN for most coastal zones except Z1, Z6, and Z7 (Table 4). Coastal zones with high ratings for Category I also presented a high level of direct effects (Category II), mainly because their annual maximum Chl-a concentrations exceeded the threshold. In addition, the direct effects were graded high for Z6 and Z7 due to the high level of dinoflagellate and other species blooms. The DO and COD concentrations were at low levels for the study area, while a high rating of Noctiluca species blooms was confined only in Z6. Fish kills and shellfish poisoning incidents have rarely been reported in the study area in recent years, thereby gaining a low rating in the assessment. As a result, the indirect effects (Category III) and other possible effects (Category IV) were graded low for all zones except Z6, which had a high Category IV rating. In summary, most coastal zones were considered eutrophication problem areas with a high rating for at least one category except Z1, which was the only zone graded low for all four categories.
3.2.2 Long-term trends analysis
Increasing DIN and DIP were observed in many estuaries and bays along the Guangdong coast since the 1990s Figures 7A, C and D. As a result, most zones were classified as increase in Category I except Z8, which had no apparent change in DIN concentration. Category II also demonstrated an increasing trend in the PRE and eastern areas (including Z6, Z7 and Z8) mainly due to the enhancement of Chl-a in these areas over the past 30 years. Low-oxygen problems in the PRE and Mirs Bay have become increasingly severe as identified through long-term observations, resulting in an increasing trend in Category III for Z4, Z5 and Z6. Nevertheless, changes in Chl-a and DO on the west coast of Guangdong Province remained unclear due to insufficient data. Only a few studies provided the evidence of increasing COD in some typical bays, contributing to a rise in Category III for the western zones (including Z1, Z2 and Z3).
The incidence and affected area of algal blooms had decreased significantly (p<0.05) during 2001-2020 based on the Mann–Kendall test (Table S6). The decline was mainly due to reductions in the occurrence of diatom and chromophyta species blooms. Significant increases were observed in Z7 (diatom species) and Z5 (Noctiluca species), while noticeable decreases were identified in Z5 (diatom species), Z6 (dinoflagellate and other species) and Z8 (dinoflagellate and other species). In addition, noticeable increases were observed in the affected area and duration of HABs for Z3, despite the incidence of HABs had no statistically significant change. Besides, incidences of fish kills and shellfish poisoning were uncommon during the last 20 years. Therefore, there was no obvious change in Category IV for most zones in the long-term analysis, with the exception of Z5.
The results for the four categories are shown in Table 4.
4 Discussion
4.1 Comparison of the overall eutrophication status between the two methods
Despite differences in methodologies, both the ASSETS and the NOWPAP CP methods showed a consistently low rating for Z1, indicating good status was achieved in this area. In addition, both approaches identified the poor situation for Z2, Z4, Z5 and Z6, indicating the emergence of strong management intervention in these areas. However, the assessment results for the other coastal zones were quite different between the two methods. Z7 was assessed as good by the ASSETS method, while it was identified as a problem area with a high level of dinoflagellate and other species bloom incidence using the NOWPAP CP method. Moreover, Z3 and Z8 were graded as moderate by the ASSETS method, whereas they were both high in categories I and II using the NOWPAP CP method. The findings of Z3, Z7 and Z8 revealed that despite high levels of nutrients and Chl-a were detected, there was no evidence of significant secondary ecological symptoms (indirect effects) in these areas. Nevertheless, suggestions were made to reduce land-based nutrient inputs and develop environmental monitoring plans in order to improve the eutrophication status of these areas. The comparisons of the two assessment results are shown in Table 4.
Detailed information from the application of the two methods is shown for Z5 (Table 5) to illustrate the differences in the assessment outputs. Both approaches indicated high levels of nutrient concentrations in this zone, however, significant differences mainly came from the evaluation of ecological effects. The 90th percentile Chl-a concentration with a spatial coverage greater than 50% and a periodic occurrence by the ASSETS method resulted in a high score (0.75) for the assessment of primary ecological symptoms. In comparison, the maximum and average concentrations of Chl-a were classified as high and low, respectively, by the NOWPAP CP method. Similar results were reported by previous studies (Huang et al., 2004; Qiu et al., 2010; Lu and Gan, 2015) in which Chl-a maxima occurred distinctly in particular places and changed seasonally instead of a persistent phytoplankton bloom occurring over the entire estuary. The 10th percentile DO concentration was lower than 5 mg/L periodically, with a coverage rate of 55% using the ASSETS method, indicating the presence of low-oxygen conditions. In contrast, the NOWPAP CP result showed a low DO level using the average value; however, this approach might underestimate the severity of hypoxia in this area (Yin et al., 2004; Zhang and Li, 2010; Qian et al., 2018; Hu et al., 2021). The periodic occurrence of small-scale nuisance algal blooms resulted in a moderate rating for HABs by the ASSETS method. The ratings of diatom species blooms, Noctiluca species blooms, and other species blooms for the NOWPAP CP method were classified as LD, LI, and HN, respectively, revealing the high risk of chromophyta species blooms and an early warning of increasing Noctiluca species blooms. In summary, the combination of high nutrients, high Chl-a biomass, periodic occurrence of HABs, and the presence of hypoxia contributed to a moderately high (poor) rating of OEC in Z5 based on the ASSETS approach. In contrast, the degree and direct effects of nutrient enrichment were classified as high, while the indirect and other effects were recognized as low, and all categories showed an increasing trend using the NOWPAP CP method.
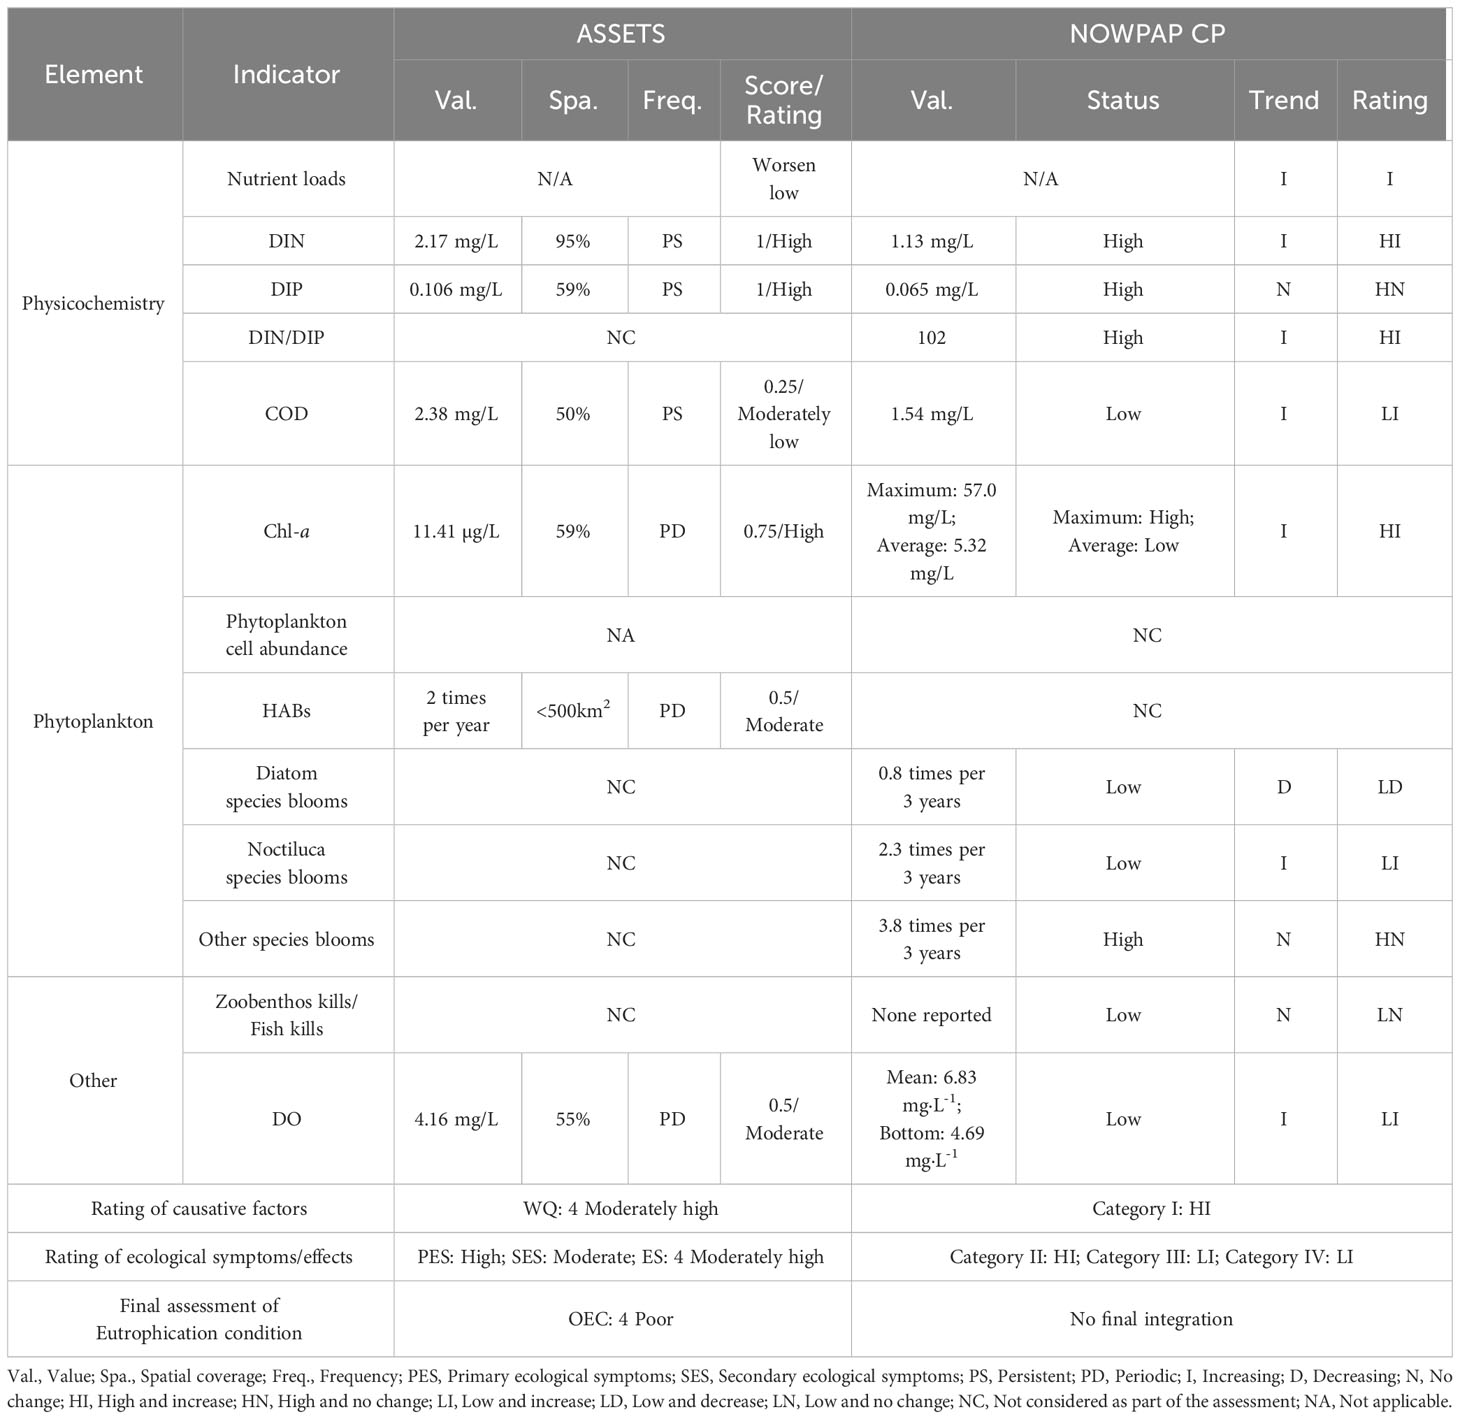
Table 5 Final outcomes for the southern part of the PRE (Z5) from application of two methods to data during 2015-2018.
By comparing the results between the two approaches, the modified ASSETS method is recommended as a scientific and practical approach to more accurately and comprehensively reveal the status and regional distribution of eutrophication in the Guangdong coastal waters. In addition, the long-term trend analysis by the NOWPAP CP method helps to better understand the changes in coastal zones and their main drivers.
4.2 Spatial variations and possible causes of eutrophication
4.2.1 Water quality and the main drivers
This study revealed high levels of water quality for most coastal areas (Figure 3), such as the PRE, Zhanjiang Harbor, Leizhou Bay, Shantou Harbor, which agreed with previous studies (Yin and Harrison, 2008; Lu et al., 2009; Zhang et al., 2016; Lao et al., 2019). The poor water quality of the PRE was due to the large amount of riverine nutrient inputs and sewage discharge from dense population and intensive industry (Huang et al., 2003; Yin and Harrison, 2008; Lu et al., 2009). Intensive agricultural in watersheds (Figure S4) was the major pressure on water quality for Z2 and Z3 (both classified as moderately high). In addition, the western coastal currents, which were greatly affected by the Pearl River plume, might also bring in abundant nutrients (Shu et al., 2018; Lao et al., 2019). Shantou Harbor and adjacent areas (Z8) was another hotspot with high nutrient loads, receiving lots of nutrients from large rivers including the Hanjiang, Rongjiang and Lianjiang. These rivers were all characterized by dense population and intensive agricultural activities in their catchments.
The annual comparison of water quality between 2015 and 2018 (Figure 4) revealed an improvement in Z1 and Z7. The declines in population (Table S5) and precipitation (Figure 7A), which had reduced nutrient inputs from sewage and agriculture non-point source pollution (Carpenter et al., 1998; Lao et al., 2019), might be the main causes. Particularly in Z7, despite not statistically significant, CF, OM and AP in this area had decreased during 2015-2018, contributing to the reduction of agricultural pollutants. In comparison, there were no apparent changes in areas with high or moderately high WQ ratings, indicating heavy nutrient stress from anthropogenic inputs in these areas, although in some areas (such as the PRE) a noticeable decreasing trend in CF was observed.
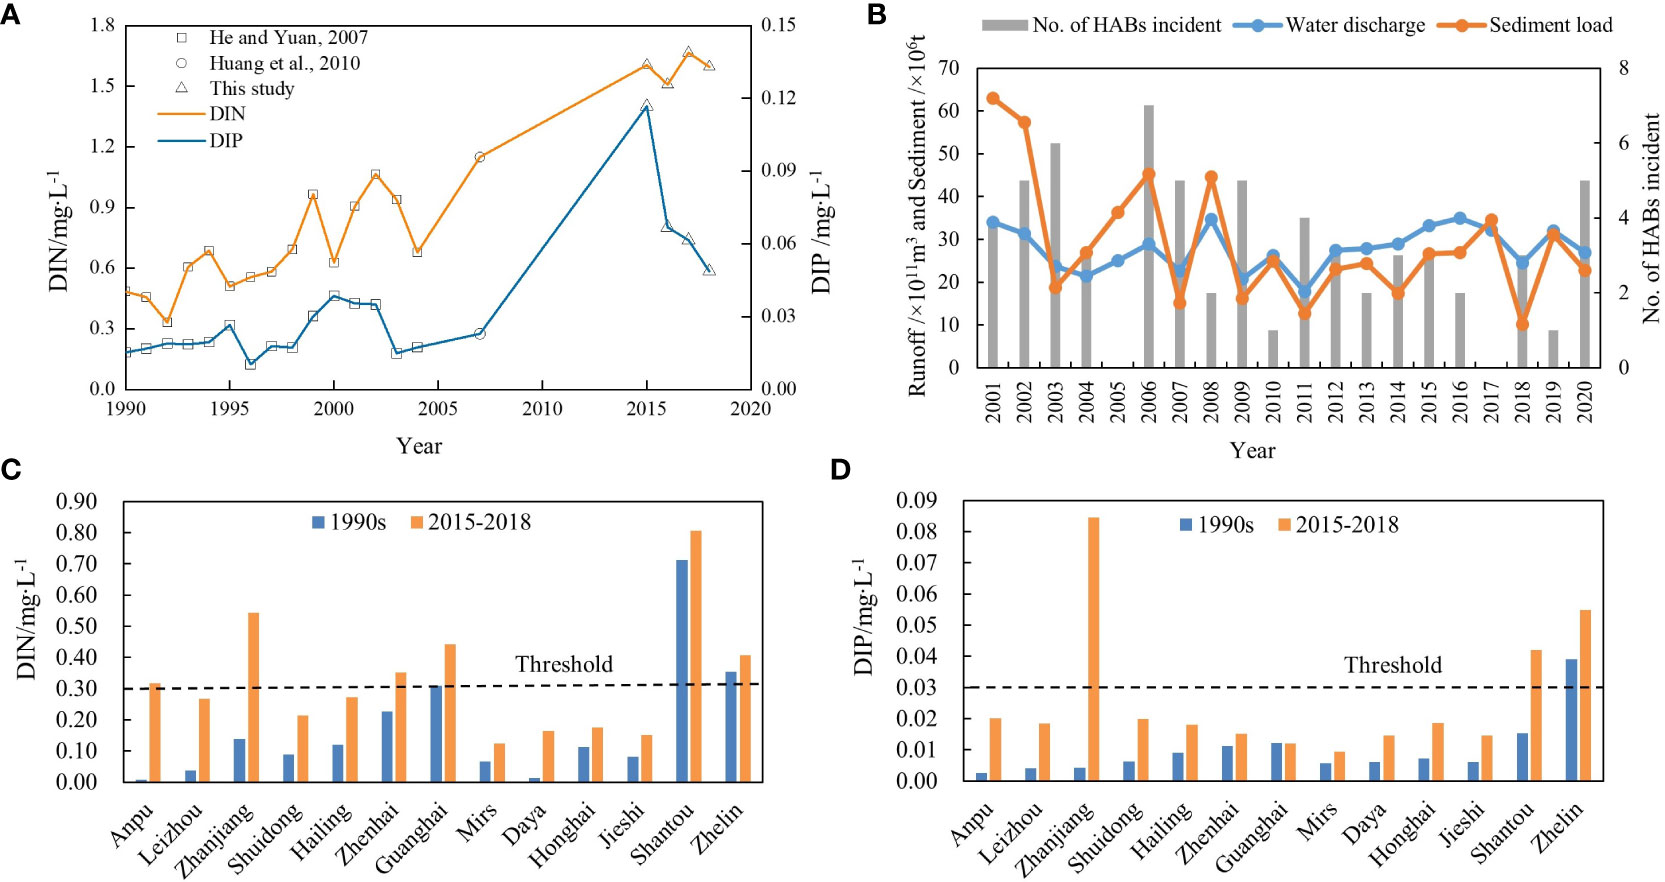
Figure 7 Long-term trends of the indicators. (A) Variations in nutrient concentrations in the PRE. (B) Comparison of the temporal variations in water and sediment discharge and the frequency of HABs in the PRE. (C, D) Comparisons of the nutrient concentrations of the major bays along the Guangdong coast between different periods.
4.2.2 Ecological symptoms and potential influencing factors
The results of the ASSETS assessment revealed significant temporal and spatial variations in the ecological response to nutrient enrichment for different zones (Figure 3, Table 4). For Z2, Z4 and Z5, the ES ratings were as high as the WQ ratings, indicating that excess nutrients were the key causative factors of eutrophication. Z1, Z3, Z7, and Z8 showed lower ES ratings compared to their WQ ratings, revealing their lower sensitivity to nutrient enrichment. A sharp contrast between the low rating of WQ and the high rating of ES was observed in Z6, indicating that the hydrological conditions and biochemical processes might play a more important role in determining the health of coastal ecosystems (Cloern, 2001; Ferreira et al., 2005). In the case of Z6, the combination of a high Chl-a concentration, low bottom DO concentration, and periodic occurrence of HABs led to a high ES rating. Previous studies have demonstrated that the high primary production and frequent algal blooms in this area were probably due to the suitable temperature conditions, highly efficient nutrient circulation, and nutrient supplementation from upwelling (Sun et al., 2011; Wu et al., 2016; Wu et al., 2017). In addition, seasonal hypoxia observed in Mirs Bay and its adjacent waters was driven by coupled physical and biochemical processes (Li et al., 2014; Zhang et al., 2018). Therefore, it is needed for further tests to gain insight into the magnitude of ecological sensitivity to nutrient enrichment for different coastal systems.
The results revealed that more severe ecological symptoms occurred in the northern part of the PRE than in the southern part. The high rating in the north was determined by the high Chl-a and severe hypoxic conditions (Figure 6), which were rarely noticed in previous studies (Zhang and Li, 2010; Lu and Gan, 2015). The research areas in previous studies were often confined to the middle and lower parts of the estuary with a salinity higher than 10 PSU; however, those areas were recognized as the southern part of the PRE in this study. Lu and Gan (2015) found that the high Chl-a in the upper reach was likely induced by the inactive phytoplankton from the river discharge rather than by cells generated locally, and this result was supported by the low DO concentration at the same location. In addition, the persistent low-oxygen waters in the north observed in this study confirmed that the hypoxic conditions in the upper part were mainly due to the large amounts of pollutants and low-oxygen waters from upstream reaches (Qian et al., 2018; Hu et al., 2021). Unlike the upper reach (northern part), the high biomass and the seasonal low-oxygen condition in the southern part resulted from the combination of physical and biochemical effects associated with variable riverine discharge and stratification during summer (Zhang and Li, 2010; Lu and Gan, 2015; Hu et al., 2021).
The annual analysis of the ecological response to nutrient enrichment revealed a remarkable shift in the southern part of the PRE, showing a moderate ES rating in 2017 and dropping to a low rating in 2018. The 10th percentile DO concentration decreased from 4.9 mg/L to 3.1 mg/L, and the number of algal bloom events increased from zero to three during 2017-2018. Various factors may have contributed to this abrupt change due to the complex physical and biochemical interactions in the PRE (Yin et al., 2000; Huang et al., 2003; Zhang and Li, 2010). Researchers have noticed that changes in the riverine sediment loads might be essential in controlling biological processes by regulating the turbidity distribution, which significantly influenced phytoplankton growth in estuaries (Cloern, 1987; Tian et al., 2009; Horemans et al., 2020). The reduction in sediment supply and subsequent decline in turbidity for large estuaries, such as the Yangtze River estuary and the PRE, could strengthen oxygen depletion and increase the risk of HABs, as the light-shading effect of suspended sediments on primary production was greatly weakened (Wang et al., 2016; Hu et al., 2021). In this study, a remarkable decline in sediment loads of the PRE (measured at the Gaoyao, Shijiao, and Boluo stations) was observed between 2017 and 2018 (Figure 8B), decreasing from 34.52 Mt/a to 10.11 Mt/a. This might be the critical factor leading to the dramatic deterioration of ecological conditions in the southern part of the PRE. It is required for future work to investigate the roles and contributions of the changes with long-term observations.
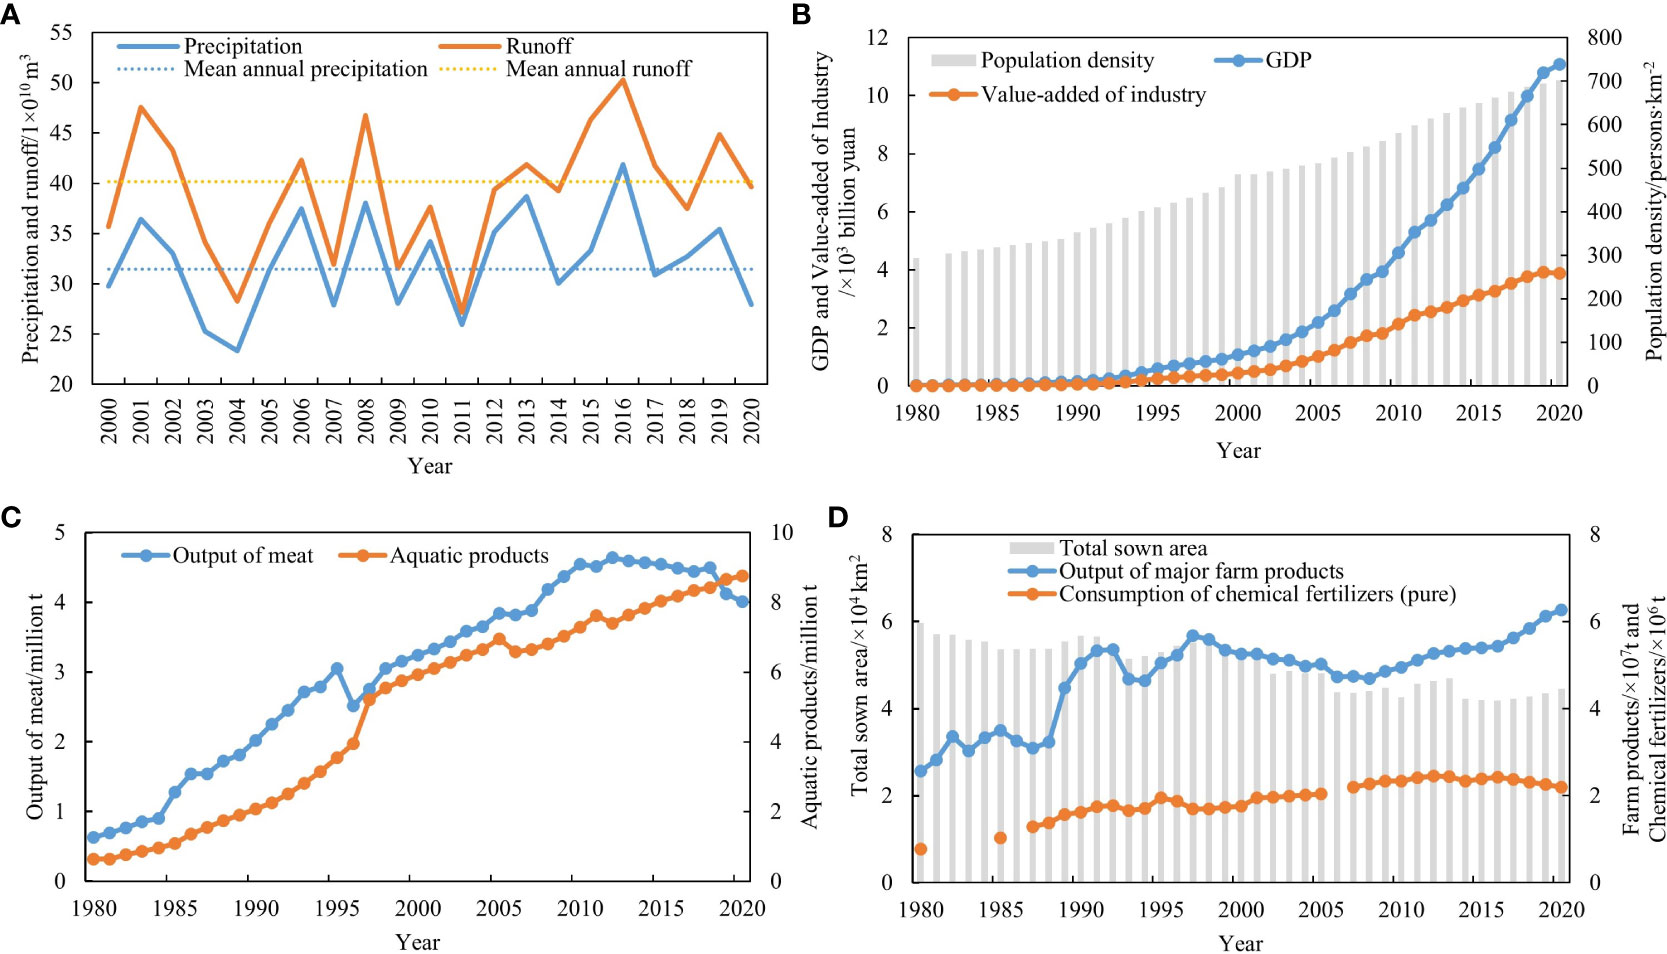
Figure 8 Long-term variations in the major drivers of Guangdong Province. (A) Precipitation and runoff. (B) Population density, GDP, and value-added of industry. (C) Aquatic products and output of meat. (D) Consumption of chemical fertilizers.
4.3 Advantages and limitations of the assessment methods
Compared with previous applications of the ASSETS method, there were still great differences in the selection and estimation of key indicators for the pressure and response components. The pressure was characterized by influencing factors including nitrogen load and the estuary’s susceptibility to nitrogen (dilution and flushing rates) in the US ASSETS applications (Bricker et al., 2008). Because the system’s susceptibility (largely determined by the residence time of water within a system), as well as land-based nutrient sources, had played an important role in the development of eutrophication. Previous studies have shown higher ratings of Chl-a and HABs problems in systems with slower flushing or longer residence time (Ferreira et al., 2005). Unlike the US, the pressure was estimated by water quality indicators (such as DIN, DIP, and COD) in the Chinese applications. The selection of water quality indicators, which conformed to the widely used EI method (Zou et al., 1983), had the advantage of reflecting the degree of nutrient enrichment in the coastal waters and helped to establish a link to the coastal management in China. However, it failed to identify the natural influencing factors that might have remarkable contributions in the development of eutrophication. Despite certain hydrographic characteristics and nutrient inputs were available from previous studies for some typical estuaries and bays along the Guangdong coast, information was very limited for some other coastal areas, especially in less developed areas. Therefore, there was still a lack of data to support the evaluation of susceptibility in the eight coastal zones.
The estimation of the response (future outlook of nutrient load) was one of the significant differences between these applications using the ASSETS method. In the US ASSETS applications, the response of eutrophication was based on demographic projections which were complemented by expert knowledge. In comparison, the response was ignored or replaced by simplified calculations in previous Chinese applications. For example, some researchers (Wang et al., 2012; Luo et al., 2022) selected the annual rate of change in future nutrient emissions as the response indicator, which could lead to a misunderstanding of the future outlook. Because in many systems, nutrient inputs were also influenced by the environmental changes such as runoff and precipitation. In the applications of the Bohai sea (Wu et al., 2013) and Jiaozhou Bay (Wu et al., 2019), the response variable was ignored, resulting in an incomplete assessment of eutrophication condition. To fill in this gap, this study employed a semi-quantitative approach to analyze the future outlook of nutrient load. It was determined by a synthetic analysis of the historical presentation and prospects of the main drivers in watersheds, including population, industry and agriculture. The integrated evaluation of the response in the present study provided a more scientific and reliable result than that based on expert experience or used an unsuitable variable. Nevertheless, quantitative methods are still required to obtain robust assessment results.
In addition, compared to the indicators used in the US and EU countries, information on aquatic communities and changes in food webs caused by nutrient enrichment were not considered in this study due to insufficient data. Because large-scale marine ecological surveys had been carried out at low frequency (perhaps every few years) and the data cannot usually be obtained from open access. The comparison of the key indicators of eutrophication assessment used in this study and the other applications is shown in Table S7. Further improvements should make efforts in using more hydrographic and biological indicators to identify the susceptibility of coastal ecosystems, and combining multisource data to investigate the cumulative effects of eutrophication.
4.4 Future outlook of eutrophication
The long-term statistics revealed significant increases in the growth of economy and population in Guangdong Province since 1980 (Figure 7B). The annual gross domestic product (GDP) in 2020 was approximately 440 times higher than that in 1980, and the population increased 1.4 times. IN, AP, OM, and CF also increased dramatically during this period (Figures 7B–D). There is an overall anticipation about the socioeconomic development of the study area in the future based on the 14th Five-Year Plans of Guangdong Province (http://www.gd.gov.cn/zwgk/jhgh/content/post_ 3268882.html): Increasing trends in economy and population are likely to continue even though the pace of growth may slow, and the gap in regional development may widen. Moreover, it is also needed for stable agricultural production outputs and improved agricultural pollution management. However, some researchers were less optimistic and anticipated increased riverine nutrient inputs due to more intensive agricultural practices and industrial activities in the coming decades (Rabalais et al., 2009; Statham, 2012; Strokal et al., 2014; Laurent et al., 2018).
Although anthropogenic nutrient inputs are responsible for coastal eutrophication, climate change also plays an important role by modifying temperature, wind patterns, precipitation, the hydrological cycle, and sea level rise (Statham, 2012; Strokal et al., 2014). Increasing temperatures have been anticipated to lead to major changes in the functioning and structure of ecosystems by changing biodiversity and interactions between trophic levels (Brierley and Kingsford, 2009). The changes in precipitation are especially likely to experience significant increases in nutrient flux, thereby exacerbating eutrophication in China (Sinha et al., 2017). The rising surface ocean temperatures, freshwater and nutrient inputs, and atmospheric CO2 will further exacerbate eutrophication-driven acidification and low-oxygen conditions in the PRE (Luo et al., 2014; Zhao et al., 2020; Liang et al., 2021).
Based on the trend analysis of the major drivers, it is suggested that the nutrient loads will increase due to growing economy and population in Z4~Z6. Z2 is another hot spot requiring attention because of the high nutrient loads and poor eutrophic conditions. The combination of climate change and continuing high nutrient loads through human activity is anticipated to lead to enhanced eutrophication in the future in these areas.
5 Conclusion
This study applied the ASSETS and NOWPAP CP methods to assess the Guangdong coastal waters using the same temporal-scale data (2015-2018). The results revealed the changes of water quality for most coastal zones, indicating that there was an overloading nutrient pressure mainly from the terrestrial input. The results of the ASSETS assessment revealed the temporal and spatial variations in the ecological response to nutrient enrichment for different zones. More severe eutrophication conditions were detected in Z2, Z4~Z6 mainly due to the HABs and low-oxygen problems. The eutrophication conditions in Z4~Z6 may further deteriorate due to the increasing nutrient loads driven by the growing economy and population. Targeted management interventions are required to reduce the effects of nutrient enrichment, considering the changes in nutrient loads and the major drivers in watersheds. The modified ASSETS method was suggested to more accurately and comprehensively reveal the eutrophication conditions in the Guangdong coastal waters, while the NOWPAP CP method helped to know about the long-term changes in ecological effects of nutrient enrichment. Further work for evaluation efforts should aim to investigate the susceptibility of coastal ecosystems and the cumulative effects of eutrophication.
Data availability statement
The original contributions presented in the study are included in the article/Supplementary Material. Further inquiries can be directed to the corresponding author.
Author contributions
YW: Conceptualization, Supervision, Writing – review & editing. JZ: Data curation, Investigation, Writing – original draft.
Funding
The author(s) declare financial support was received for the research, authorship, and/or publication of this article. This research was supported by the International Partnership Program of Chinese Academy of Sciences (No.133244KYSB20180012), the National Natural Science Foundation of China (No. U1901211 and No. 41876126), the Strategic Priority Research Program of the Chinese Academy of Sciences (No. XDA23050200 and XDA19060201), the National Key Research and Development Program of China (Science & Technology Basic Resources Investigation Program of China) (No. 2017FY100700), and the Innovation Team of Nansha District High-Level Talents: Innovation Team of Mangrove Wetland for Blue Carbon Enhancement Technology.
Conflict of interest
The authors declare that the research was conducted in the absence of any commercial or financial relationships that could be construed as a potential conflict of interest.
Publisher’s note
All claims expressed in this article are solely those of the authors and do not necessarily represent those of their affiliated organizations, or those of the publisher, the editors and the reviewers. Any product that may be evaluated in this article, or claim that may be made by its manufacturer, is not guaranteed or endorsed by the publisher.
Supplementary material
The Supplementary Material for this article can be found online at: https://www.frontiersin.org/articles/10.3389/fmars.2023.1280821/full#supplementary-material
References
Andersen J. H., Axe P., Backer H., Carstensen J., Claussen U., Fleming-Lehtinen V., et al. (2011). Getting the measure of eutrophication in the Baltic Sea: towards improved assessment principles and methods. Biogeochemistry 106 (2), 137–156. doi: 10.1007/s10533-010-9508-4
Bao X. W., Hou Y. J., Chen C. S., Chen F., Shi M. C. (2005). Analysis of characteristics and mechanism of current system on the west coast of Guangdong of China in summer. Acta Oceanologica Sin. 4), 1–9.
Borja A., Bricker S. B., Dauer D. M., Demetriades N. T., Ferreira J. G., Forbes A. T., et al. (2008). Overview of integrative tools and methods in assessing ecological integrity in estuarine and coastal systems worldwide. Mar. pollut. Bull. 56 (9), 1519–1537. doi: 10.1016/j.marpolbul.2008.07.005
Breitburg D., Levin L. A., Oschlies A., Gregoire M., Chavez F. P., Conley D. J., et al. (2018). Declining oxygen in the global ocean and coastal waters. Science 359 (6371), 46–4+. doi: 10.1126/science.aam7240
Bricker S. B., Ferreira J. G., Simas T. (2003). An integrated methodology for assessment of estuarine trophic status. Ecol. Model. 169 (1), 39–60. doi: 10.1016/S0304-3800(03)00199-6
Bricker S. B., Longstaff B., Dennison W., Jones A., Boicourt K., Wicks C., et al. (2008). Effects of nutrient enrichment in the nation's estuaries: A decade of change. Harmful Algae 8 (1), 21–32. doi: 10.1016/j.hal.2008.08.028
Brierley A. S., Kingsford M. J. (2009). Impacts of climate change on marine organisms and ecosystems. Curr. Biol. 19 (14), R602–R614. doi: 10.1016/j.cub.2009.05.046
Carpenter S. R., Caraco N. F., Correll D. L., Howarth R. W., Sharpley A. N., Smith V. H. (1998). Nonpoint pollution of surface waters with phosphorus and nitrogen. Ecol. Appl. 8 (3), 559–568. doi: 10.1890/1051-0761(1998)008[0559:Nposww]2.0.Co;2
CEC (Council of European Communities) (2000). Directive 2000/60/EC of the european parliament and of the council of 23 october 2000 establishing a framework for community action in the field of water policy. Off. J. Eur. Communities 327, 1–73.
Cloern J. E. (1987). Turbidity as a control on phytoplankton biomass and productivity in estuaries. Continental Shelf Res. 7 (11-12), 1367–1381. doi: 10.1016/0278-4343(87)90042-2
Cloern J. E. (2001). Our evolving conceptual model of the coastal eutrophication problem. Mar. Ecol. Prog. Ser. 210, 223–253. doi: 10.3354/meps210223
Devlin M., Bricker S., Painting S. (2011). Comparison of five methods for assessing impacts of nutrient enrichment using estuarine case studies. Biogeochemistry 106 (2), 177–205. doi: 10.1007/s10533-011-9588-9
Diaz R. J., Rosenberg R. (2001). Overview of anthropogenically-induced hypoxic effects on marine benthic fauna. Coast. Estuar. Sci. 58, 129–145. doi: 10.1029/CE058p0129
DOF (Department of Ocean and Fisheries of Guangdong Province) (2015-2017) Bulletin of Marine Environmental Quality of Guangdong Province. Available at: http://gdee.gd.gov.cn/hjzkgb/index.html.
Du H., Huang C., Chen S., He X., Zhu L. (2003). Assessment and analysis of eutrophication in Zhelin Bay. Ecologic Sci. (In Chinese) 22, 13–17.
Editorial Board of China Bay Survey (1998a). Survey of China Bays Volume 9: Eastern Bays of Guangdong Province (In Chinese) (Beijing: Ocean Press).
Editorial Board of China Bay Survey (1998b). Survey of China Bays Volume 14: Important Estuaries (In Chinese) (Beijing: Ocean Press).
Editorial Board of China Bay Survey (1999). Survey of China Bays Volume 10: Western Bays of Guangdong Province (In Chinese) (Beijing: Ocean Press).
EPD (Environmental Protection Department of the Hong Kong Special Administrative Region) (2020) Marine Water Quality in Hong Kong in 2020. Available at: https://www.epd.gov.hk/epd/english/environmentinhk/water/hkwqrc/waterquality/marine-2.html.
Ferreira J. G., Wolff W. J., Simas T. C., Bricker S. B. (2005). Does biodiversity of estuarine phytoplankton depend on hydrology? Ecol. Model. 187 (4), 513–523. doi: 10.1016/j.ecolmodel.2005.03.013
Ge X. J., Huang B., Yuan Z. J., Wang D. D., Wang Q. Q., Chen J. C., et al. (2022). Temporal and spatial variation characteristics and source analysis of agricultural non-point source pollution load in guangdong during the past 20 years. Environ. Sci. (In Chinese) 43 (6), 3118–3127. doi: 10.13227/j.hjkx.202108071
Gu Y., Pan J., Lin H. (2012). Remote sensing observation and numerical modeling of an upwelling jet in Guangdong coastal water. J. Geophysical Research-Oceans 117, C08019. doi: 10.1029/2012JC007922
Guo W., Zhang X., Yang Y., Hu M. (1998). Potential eutrophication assessment for Chinese coastal waters. J. Oceanography Taiwan Strait (In Chinese) 17 (1), 64–70.
Han Q., Huang X., Xing Q., Shi P. (2012). A review of environment problems in the coastal sea of South China. Aquat. Ecosystem Health Manage. 15 (2), 108–117. doi: 10.1080/14634988.2012.687611
He G., Yuan G. (2007). Assessment of the water quality by fuzzy mathematics for last 20 years in Zhujiang Estuary. Mar. Environ. Sci. (In Chinese) 26 (1), 53–57.
Horemans D. M. L., Meire P., Cox T. J. S. (2020). The impact of temporal variability in light-climate on time-averaged primary production and a phytoplankton bloom in a well-mixed estuary. Ecol. Model. 436, 109287. doi: 10.1016/j.ecolmodel.2020.109287
Howarth R. W. (2008). Coastal nitrogen pollution: A review of sources and trends globally and regionally. Harmful Algae 8 (1), 14–20. doi: 10.1016/j.hal.2008.08.015
Hu J. T., Zhang Z. R., Wang B., Huang J. (2021). Long-term spatiotemporal variations in and expansion of low-oxygen conditions in the Pearl River estuary: a study synthesizing observations during 1976-2017. Biogeosciences 18 (18), 5247–5264. doi: 10.5194/bg-18-5247-2021
Huang X. P., Huang L. M., Yue W. Z. (2003). The characteristics of nutrients and eutrophication in the Pearl River estuary, South China. Mar. pollut. Bull. 47, 30–36. doi: 10.1016/s0025-326x(02)00474-5
Huang L. M., Jian W. J., Song X. Y., Huang X. P., Liu S., Qian P. Y., et al. (2004). Species diversity and distribution for phytoplankton of the Pearl River estuary during rainy and dry seasons. Mar. pollut. Bull. 49, 588–596. doi: 10.1016/j.marpolbul.2004.03.015
Huang X. P., Tian L., Peng B., Zhang D. W. (2010). Environmental pollution in the Pearl River Estuary: a review. J. Trop. Oceanography (In Chinese) 29 (1), 1–7.
Jickells T. D., Buitenhuis E., Altieri K., Baker A. R., Capone D., Duce R. A., et al. (2017). A reevaluation of the magnitude and impacts of anthropogenic atmospheric nitrogen inputs on the ocean. Global Biogeochemical Cycles 31 (2), 289–305. doi: 10.1002/2016gb005586
Lao Q., Chen F., Liu G., Chen C., Jin G., Zhu Q., et al. (2019). Isotopic evidence for the shift of nitrate sources and active biological transformation on the western coast of Guangdong Province, South China. Mar. pollut. Bull. 142, 603–612. doi: 10.1016/j.marpolbul.2019.04.026
Laurent A., Fennel K., Ko D. S., Lehrter J. (2018). Climate change projected to exacerbate impacts of coastal eutrophication in the northern gulf of Mexico. J. Geophysical Research: Oceans 123 (5), 3408–3426. doi: 10.1002/2017jc013583
Li X. L., Shi H. M., Xia H. Y., Zhou Y. P., Qiu (2014). Seasonal hypoxia and its potential forming mechanisms in the Mirs Bay, the northern South China Sea. Continental Shelf Res. 80, 1–7. doi: 10.1016/j.csr.2014.03.003
Liang B., Xiu P., Hu J., Li S. (2021). Seasonal and spatial controls on the eutrophication-induced acidification in the Pearl River Estuary. J. Geophysical Research: Oceans 126 (5), 1–18. doi: 10.1029/2020jc017107
Liu S. M., Hong G. H., Zhang J., Ye X. W., Jiang X. L. (2009). Nutrient budgets for large Chinese estuaries. Biogeosciences 6 (10), 2245–2263. doi: 10.5194/bg-6-2245-2009
Lu Z. M., Gan J. P. (2015). Controls of seasonal variability of phytoplankton blooms in the Pearl River Estuary. Deep-Sea Res. II 117, 86–96. doi: 10.1016/j.dsr2.2013.12.011
Lu F. H., Ni H. G., Liu F., Zeng E. Y. (2009). Occurrence of nutrients in riverine runoff of the Pearl River Delta, South China. J. Hydrology 376, 107–115. doi: 10.1016/j.jhydrol.2009.07.018
Luo Y., Liu J. W., Wu J. W., Yuan Z., Zhang J. W., Gao C., et al. (2022). Comprehensive assessment of eutrophication in Xiamen Bay and its implications for management strategy in Southeast China. Int. J. Environ. Res. Public Health 19, 13055. doi: 10.3390/ijerph192013055
Luo X. S., Tang A. H., Shi K., Wu L. H., Li W. Q., Shi W. Q., et al. (2014). Chinese coastal seas are facing heavy atmospheric nitrogen deposition. Environ. Res. Lett. 9, 95007. doi: 10.1088/1748-9326/9/9/095007
Malone T. C., Newton A. (2020). The globalization of cultural eutrophication in the coastal ocean: causes and consequences. Front. Mar. Sci. 7. doi: 10.3389/fmars.2020.00670
Niino H., Emery K. O. (1961). Sediments of shallow portions of East China Sea and South China Sea. Geological Soc. America Bull. 72, 731–762. doi: 10.1130/0016-7606(1961)72[731:Sospoe]2.0.Co;2
Niu L. X., van Gelder P., Luo X. X., Cai H. Y., Zhang T., Yang Q. S., et al. (2020). Implications of nutrient enrichment and related environmental impacts in the Pearl River Estuary, China: characterizing the seasonal influence of riverine input. Water 12, 1–12. doi: 10.3390/w12113245
NOWPAP CEARAC. (2011). Integrated Report on Eutrophication Status Including Evaluation of Land-Based Sources of Nutrients for the NOWPAP Common Procedure (Toyama: NOWPAP CEARAC). Available at: http://www.cearac-project.org/cearac-project/integrated-report/eut_2011.pdf.
NSA (National Standardization Administration, China). (2014). Technical Guidelines for Treatment with Red Tide Disaster (GB/T 30743-2014) (Beijing: Standards Press of China).
OSPAR Commission. (2003). OSPAR Integrated Report 2003 on the Eutrophication Status of the OSPAR Maritime Area Based Upon the First Application of the Comprehensive Procedure (London: OSPAR Commission). Available at: https://www.ospar.org/about/publications?q=Eutrophication%20Status%20of%20the%20OSPAR%20Maritime%20Area.
Peng Y., Wang Z. (1991). Eutrophication level evaluation of the Pearl River Estuary. Mar. Environ. Sci. (In Chinese) 10 (3), 7–13.
Qi Y. Z., Chen J. F., Wang Z. H., Xu N., Wang Y., Shen P. P., et al. (2004). Some observations on harmful algal bloom (HAB) events along the coast of Guangdong, southern China in 1998. Hydrobiologia 512, 209–214. doi: 10.1023/B:HYDR.0000020329.06666.8c
Qian W., Gan J. P., Liu J. W., He B. Y., Lu Z. M., Guo X. H., et al. (2018). Current status of emerging hypoxia in a eutrophic estuary: The lower reach of the Pearl River Estuary, China. Estuar. Coast. Shelf Sci. 205, 58–67. doi: 10.1016/j.ecss.2018.03.004
Qiu D., Huang L., Zhang J., Lin S. (2010). Phytoplankton dynamics in and near the highly eutrophic Pearl River Estuary, South China Sea. Continental Shelf Res. 30 (2), 177–186. doi: 10.1016/j.csr.2009.10.015
Qu H. J., Kroeze C. (2010). Past and future trends in nutrients export by rivers to the coastal waters of China. Sci. Total Environ. 408, 2075–2086. doi: 10.1016/j.scitotenv.2009.12.015
Rabalais N. N., Turner R. E., Diaz R. J., Justic D. (2009). Global change and eutrophication of coastal waters. Ices J. Mar. Sci. 66 (7), 1528–1537. doi: 10.1093/icesjms/fsp047
SAEP (State Administration of Environmental Protection, China). (1997). Seawater Quality Standard (GB 3097-1997). Beijing: SAEP.
Salmi T., Mtt A., Anttila P., Ruoho-Airola T., Amnell T. (2002). Detecting Trends of Annual Values of Atmospheric Pollutants by the Mann-Kendall Test and Sen's Solpe Estimates the Excel Template Application MAKESENS. Helsinki (Finland: Finnish Meteorological Institute).
SAQSIQ (State Administration of Quality Supervision, Inspection and Quarantine, China), and SSA (State Standardization Administration, China). (2007a). The Specification for Marine Monitoring—Part 4: Seawater Analysis (GB 17378.4-2007) (Beijing: Standards Press of China).
SAQSIQ (State Administration of Quality Supervision, Inspection and Quarantine, China), and SSA (State Standardization Administration, China). (2007b). The Specification for Marine Monitoring—Part 7: Ecological Survey for Offshore Pollution and Biological Monitoring (GB 17378.7-2007) (Beijing: Standards Press of China).
SAQSIQ (State Administration of Quality Supervision, Inspection and Quarantine, China), and SSA (State Standardization Administration, China). (2007c). Specifications for Oceanographic Survey—Part 4: Survey of Chemical Parameters in Sea Water (GB/T 12763.4-2007) (Beijing: Standards Press of China).
Scavia D., Bricker S. B. (2006). Coastal eutrophication assessment in the United States. Biogeochemistry 79, 187–208. doi: 10.1007/s10533-006-9011-0
Shen Z. L. (2001). Historical changes in nutrient structure and its influences on phytoplantkon composition in Jiaozhou Bay. Estuar. Coast. Shelf Sci. 52 (2), 211–224. doi: 10.1006/ecss.2000.0736
Shu Y., Wang Q., Zu T. (2018). Progress on shelf and slope circulation in the northern South China Sea. Sci. China Earth Sci. 61 (5), 560–571. doi: 10.1007/s11430-017-9152-y
Sinha E., Michalak A. M., Balaji V. (2017). Eutrophication will increase during the 21st century as a result of precipitation changes. Science 357, 405–408. doi: 10.1126/science.aan2409
Statham P. J. (2012). Nutrients in estuaries - An overview and the potential impacts of climate change. Sci. Total Environ. 434, 213–227. doi: 10.1016/j.scitotenv.2011.09.088
Strokal M., Yang H., Zhang Y., Kroeze C., Li L., Luan S., et al. (2014). Increasing eutrophication in the coastal seas of China from 1970 to 2050. Mar. pollut. Bull. 85, 123–140. doi: 10.1016/j.marpolbul.2014.06.011
Sun C. C., Wang Y. S., Wu M. L., Dong J. D., Wang Y. T., Sun F. L., et al. (2011). Seasonal variation of water quality and phytoplankton response patterns in daya bay, China. Int. J. Environ. Res. Public Health 8, 2951–2966. doi: 10.3390/ijerph8072951
Tian T., Merico A., Su J., Staneva J., Wiltshire K., Wirtz K. (2009). Importance of resuspended sediment dynamics for the phytoplankton spring bloom in a coastal marine ecosystem. J. Sea Res. 62 (4), 214–228. doi: 10.1016/j.seares.2009.04.001
Wang Y. S., Lou Z. P., Sun C. C., Sun S. (2008). Ecological environment changes in Daya Bay, China, from 1982 to 2004. Mar. pollut. Bull. 56 (11), 1871–1879. doi: 10.1016/j.marpolbul.2008.07.017
Wang Y. S., Lou Z. P., Sun C. C., Wang H., Greg Mitchell B., Wu M. L., et al. (2011). Identification of water quality and zooplankton characteristics in Daya Bay, China, from 2001 to 2004. Environ. Earth Sci. 66 (2), 655–671. doi: 10.1007/s12665-011-1274-7
Wang B. D., Sun X., Wei Q. S., Xie L. P. (2012). A new method for assessment of eutrophication status in estuarine and coastal waters of China and its application. Acta Oceanologica Sin. (In Chinese) 34 (4), 61–66.
Wang S., Tang D., He F., Fukuyo Y., Azanza R. V. (2007). Occurrences of harmful algal blooms (HABs) associated with ocean environments in the South China Sea. Hydrobiologia 596 (1), 79–93. doi: 10.1007/s10750-007-9059-4
Wang B. D., Xin M., Sun X., Wei Q. S., Zhang X. L. (2016). Does reduced sediment load contribute to increased outbreaks of harmful algal blooms off the Changjiang Estuary? Acta Oceanologica Sin. 35 (8), 16–21. doi: 10.1007/s13131-016-0846-5
Wang B. D., Xin M., Wei Q. S., Xie L. P. (2018). A historical overview of coastal eutrophication in the China Seas. Mar. pollut. Bull. 136, 394–400. doi: 10.1016/j.marpolbul.2018.09.044
Wu M. L., Wang Y. S., Wang Y. T., Sun F. L., Sun C. C., Cheng H., et al. (2016). Seasonal and spatial variations of water quality and trophic status in Daya Bay, South China Sea. Mar. pollut. Bull. 112 (1-2), 341–348. doi: 10.1016/j.marpolbul.2016.07.042
Wu M. L., Wang Y. S., Wang Y. T., Yin J. P., Dong J. D., Jiang Z. Y., et al. (2017). Scenarios of nutrient alterations and responses of phytoplankton in a changing Daya Bay, South China Sea. J. Mar. Syst. 165, 1–12. doi: 10.1016/j.jmarsys.2016.09.004
Wu Z. X., Yu Z. M., Song X. X., Cao X. H., Yuan Y. Q. (2019). Application and comparison of two symptom-based eutrophication-assessment methods in Jiaozhou Bay, China. J. Oceanology Limnology 37 (5), 1582–1594. doi: 10.1007/s00343-019-8099-8
Wu Z. X., Yu Z. M., Song X. X., Yuan Y. Q., Cao X. H., Liang Y. B. (2013). Application of an integrated methodology for eutrophication assessment: a case study in the Bohai Sea. Chin. J. Oceanology Limnology 31 (5), 1064–1078. doi: 10.1007/s00343-013-2286-9
Xiong D. Q., Chen S. Y. (1993). Fuzzy evaluation theory model of seawater eutrophication. Mar. Environ. Sci. (In Chinese) 12 (3-4), 104–110.
Xu H. L., Zhang Y., Zhu X. Z., Zheng M. F. (2019). Effects of rainfall-runoff pollution on eutrophication in coastal zone: a case study in Shenzhen Bay, southern China. Hydrology Res. 50 (4), 1062–1075. doi: 10.2166/nh.2019.012
Yin K., Harrison P. J. (2007). Influence of the Pearl River estuary and vertical mixing in Victoria Harboron water quality in relation to eutrophication impacts in Hong Kong waters. Mar. pollut. Bull. 54 (6), 646–656. doi: 10.1016/j.marpolbul.2007.03.001
Yin K. D., Harrison P. J. (2008). Nitrogen over enrichment in subtropical Pearl River estuarine coastal waters: Possible causes and consequences. Continental Shelf Res. 28 (12), 1435–1442. doi: 10.1016/j.csr.2007.07.010
Yin K., Lin Z., Ke Z. (2004). Temporal and spatial distribution of dissolved oxygen in the Pearl River Estuary and adjacent coastal waters. Continental Shelf Res. 24 (16), 1935–1948. doi: 10.1016/j.csr.2004.06.017
Yin K. D., Qian P. Y., Chen J. C., Hsieh D. P. H., Harrison P. J. (2000). Dynamics of nutrients and phytoplankton biomass in the Pearl River estuary and adjacent waters of Hong Kong during summer: preliminary evidence for phosphorus and silicon limitation. Mar. Ecol. Prog. Ser. 194, 295–305. doi: 10.3354/meps194295
Zhang H., Cheng W., Chen Y., Yu L., Gong W. (2018). Controls on the interannual variability of hypoxia in a subtropical embayment and its adjacent waters in the Guangdong coastal upwelling system, northern South China Sea. Ocean Dynamics 68 (8), 923–938. doi: 10.1007/s10236-018-1168-2
Zhang H., Li S. (2010). Effects of physical and biochemical processes on the dissolved oxygen budget for the Pearl River Estuary during summer. J. Mar. Syst. 79 (1-2), 65–88. doi: 10.1016/j.jmarsys.2009.07.002
Zhang P., Peng C. H., Zhang J. B., Zhang J. X., Chen J. Y., Zhao H. (2022). Long-term harmful algal blooms and nutrients patterns affected by climate change and anthropogenic pressures in the zhanjiang bay, China. Front. Mar. Sci. 9. doi: 10.3389/fmars.2022.849819
Zhang L., Shi Z., Zhang J. P., Jiang Z. J., Huang L. M., Huang X. P. (2016). Characteristics of nutrients and phytoplankton productivity in Guangdong coastal regions, South China. Mar. pollut. Bull. 113 (1-2), 572–578. doi: 10.1016/j.marpolbul.2016.08.081
Zhao Y. Y., Liu J., Uthaipan K., Song X., Xu Y., He B. Y., et al. (2020). Dynamics of inorganic carbon and pH in a large subtropical continental shelf system: Interaction between eutrophication, hypoxia, and ocean acidification. Limnology Oceanography 65 (6), 1359–1379. doi: 10.1002/lno.11393
Keywords: eutrophication, coastal ecosystem, nutrient, assessment method, South China Sea
Citation: Zhou J and Wang Y-S (2024) A comprehensive approach to assessing eutrophication for the Guangdong coastal waters in China. Front. Mar. Sci. 10:1280821. doi: 10.3389/fmars.2023.1280821
Received: 21 August 2023; Accepted: 14 December 2023;
Published: 08 January 2024.
Edited by:
Ganesh Thiruchitrambalam, Pondicherry University, IndiaReviewed by:
Solomon Dan, Beibu Gulf University, ChinaPeng Zhang, Guangdong Ocean University, China
Padmakumar Kb, Cochin University of Science and Technology, India
Copyright © 2024 Zhou and Wang. This is an open-access article distributed under the terms of the Creative Commons Attribution License (CC BY). The use, distribution or reproduction in other forums is permitted, provided the original author(s) and the copyright owner(s) are credited and that the original publication in this journal is cited, in accordance with accepted academic practice. No use, distribution or reproduction is permitted which does not comply with these terms.
*Correspondence: You-Shao Wang, eXN3YW5nQHNjc2lvLmFjLmNu
 Jing Zhou
 You-Shao Wang