 Ying Chen
 Yan Sun
 Haiyi Shi
 Hui Zhao
 Hui Gao
 Gang Pan1,2,6,7
- 1College of Chemistry and Environmental Science, Guangdong Ocean University, Zhanjiang, China
- 2Cooperative Research Center for Nearshore Marine Environmental Change, Guangdong Ocean University, Zhanjiang, China
- 3Research Center for Coastal Environmental Protection and Ecological Resilience, Guangdong Ocean University, Zhanjiang, China
- 4College of Electronic and Information Engineering, Guangdong Ocean University, Zhanjiang, China
- 5Southern Marine Science and Engineering Guangdong Laboratory, Zhuhai, China
- 6School of Humanities, York St John University, York, United Kingdom
- 7Jiangsu Jiuguan Institute of Environment and Resources, Yixing, China
Although the water environment has certain self-purification capability, the natural balance is disrupted, leading to water quality deterioration when the discharge load of wastewater exceeds a certain threshold. This problem implies the urgency of evaluating marine environmental capacity as a necessary parameter for marine sustainable development of marine ecosystems. Through principal component analysis (PCA), clustering, and other methods, we analyzed the average concentration and fluxes of land-sourced pollutants and determined the pollution level around the Leizhou Peninsula. Combined with the Delft3D hydrodynamic numerical model, tidal hydrodynamic forces and pollutants migration and diffusion were calculated. Based on in-situ measured data, the model was validated. The sharing rate method was used to calculate the marine environmental capacity in Zhanjiang Bay and analyzed their impact on seawater eutrophication. The results showed that: (1) The average concentrations of chemical oxygen demand (COD), ammonia nitrogen (NH4+), total nitrogen (TN), and total phosphorus (TP) around Leizhou Peninsula were 22.56 mg/L, 0.69 mg/L, 6.69 mg/L, and 0.69 mg/L, respectively. (2) Six areas (Area A-F) can be divided into, based on the discharge of land-sourced pollutants into the sea area. According to the results of PCA, clustering, and other methods, the average concentration and fluxes of land-sourced pollutants in Area B (i.e. Zhanjiang Bay) were very high. (3) The environmental capacity of Zhanjiang Bay was calculated through Delft3D numerical simulation, and it was found that the COD and TN environmental capacity of 6 sewage outlets exceeded the standard, while the TP environmental capacity of 3 sewage outlets exceeded the standard. (4) According to the statistical research result, most of the Zhanjiang Bay waters has been restricted by nitrogen for over a decade. Therefore, we speculate that although TN environmental capacity exceeds the standard, its impact on eutrophication in Zhanjiang Bay is still limited to a certain extent.
1 Introduction
The nearshore is a hub for terrestrial and marine ecosystems as well as an ecosystem that is jointly influenced by biological, chemical, and physical processes. Marine biodiversity is significantly impacted by the nearshore environment. In recent years, the increase in pollutant load caused by industrialization and urbanization has become a major constraint on the development of many regions of the world, resulting in water pollution (Wang et al., 2014; Chen et al., 2019). Chemical oxygen demand (COD), nitrogen, and phosphorus are generally the key components in the monitored rivers with water quality parameters exceeding the standard in the “2018 China Marine Ecological Environment Status Bulletin”. There are many environmental pressures on estuaries and bays. The natural world has always existed as a system and is capable of self-regulation to a certain extent (Bui and Pham, 2023). However, when human-caused pollution loads rise, there will be a significant increase in the transfer of land-sourced pollutants to coastal waters, leading to water pollution, eutrophication, and so on. Its biodiversity, community makeup, and seawater quality are all significantly impacted (Huang et al., 2003; Kalnejais et al., 2010; Kang and Xu, 2012; Parette and Pearson, 2014; Dou et al., 2015; Zhou et al., 2017; Jia et al., 2018). This may have a negative impact on ecosystems, habitat quality, and human health (Zhou et al., 2017). Excessive nutrient input, such as nitrogen and phosphorus, may promote the growth of harmful algae, forming red tides, etc. This not only damages the marine ecological structure, but also leads to the death of phytoplankton and zooplankton, seriously damaging the coastal ecological environment (Wang et al., 2021). Recent researches have shown a new wave of environmental problems, including the resurgence of eutrophication (Kemp et al., 2009; Andersen et al., 2017; Le Moal et al., 2019; Wu et al., 2019). Therefore, it is vital to address this issue with suitable pollution management measures for sustainable development.
Limiting the concentration of pollutant discharges is the principal strategy used in traditional management of marine water environments. In recent years, the concentration of pollutant emissions has been managed, and the majority of coastal areas have accomplished both standard emissions and pollutant concentration management. However, there has been no improvement in the quality of the nearshore waters, and pollution discharge has generally increased (Yang et al., 2018; Yu et al., 2019). On the one hand, controlling the concentration of pollutant discharges alone is not enough. The total number of pollutant emissions is heavily influenced by the amount of sewage discharged from sewage outlets and river runoff into the sea. As the total amount of emissions rises, so will the impact on the marine ecosystem. On the other hand, the management method of controlling the concentration of pollutant discharges only considers a single emission, ignoring the superposition of pollutant discharges from multiple sewage outlets in the region (Sun, 2020).
The ocean has a strong self-cleaning ability and can accommodate a large number of pollutants. It can transfer, dilute, degrade, and purify pollutants through physical, chemical, and biological processes. But the amount of pollutants that the ocean can hold is not infinite. Environmental capacity, also known as environmental bearing capacity, environmental tolerance, is the maximum quantity of pollutants that the ocean is capable of tolerating while still maintaining a healthy marine ecosystem. Important coastal countries have conducted research on marine environmental capacity, including the Black Sea of Russia (Mironov et al., 1975), Kastela Bay of Yugoslavia (Margeta et al., 1989), Haifa Bay of Israel (Krom et al., 1990), Buk Bay of South Korea (Woo-Jeung et al., 1991), and the Seto Inland Sea of Japan (Song, 1999). Chinese scholars have also conducted research on marine environmental capacity in Laizhou Bay (Jiang et al., 1991), Bohai Sea (Guo, 2005), Dapeng Bay (Li et al., 2005), and other areas. Additionally, scientists are dedicated to creating and enhancing marine environmental capacity assessment models and techniques. Researchers were committed to developing and improving marine environmental capacity assessment models and methods to evaluate the environmental capacity of diverse coastal regions based on multiple dimensions such as ecosystem services, physical environmental factors, and biodiversity indicators (Van der Wulp et al., 2016; Xu and Chua, 2017; Yamamoto and Nadaoka, 2018). These models take into account all of the ecological processes, energy flow, and material cycle of marine ecosystems, providing a scientific foundation for management and decision-making of marine environments. If the total amount of pollutants entering the ocean does not exceed its pollutant carrying capacity, the self-purification function of the ocean can maintain a healthy state of the marine environment. However, both the marine environment and its functions will be harmed and may even be impossible to recover when the total amount of pollutants emitted reaches the upper limit of the ocean’s environmental capacity (Yang, 2001). Controlling the total amount of pollutants entering the sea can more effectively improve and protect the marine environment. Therefore, it has become a hot topic in current marine environmental research to determine the capacity value of the marine environment in a scientifically sound and reasonable manner.
Diverse coastal marine ecosystems, including coral reefs, mangroves, seagrass beds, etc., surround the sea area surrounding the Leizhou Peninsula and have abundant marine biological resources. However, its ecological system is more delicate and perilous (Zhang et al., 2008). In recent years, with the increase of human activities and the impact of climate change, oceans are facing serious environmental problems, such as marine pollution, overfishing, ocean acidification, etc., which pose a huge challenge to the sustainable development of marine ecosystems and human beings. Studying the marine environmental capacity is crucial because it can provide scientific basis and decision-making support for marine protection and sustainable utilization. The purpose of this research is to sample 81 significant sewage outlets into the sea along the Leizhou Peninsula and discuss the distribution of land-sourced pollutants and their affecting elements (Figure 1). Combining the Delft3D model, the sharing rate method is used to calculate the environmental capacity and explore the impact of land-sourced pollutants on the study areas.
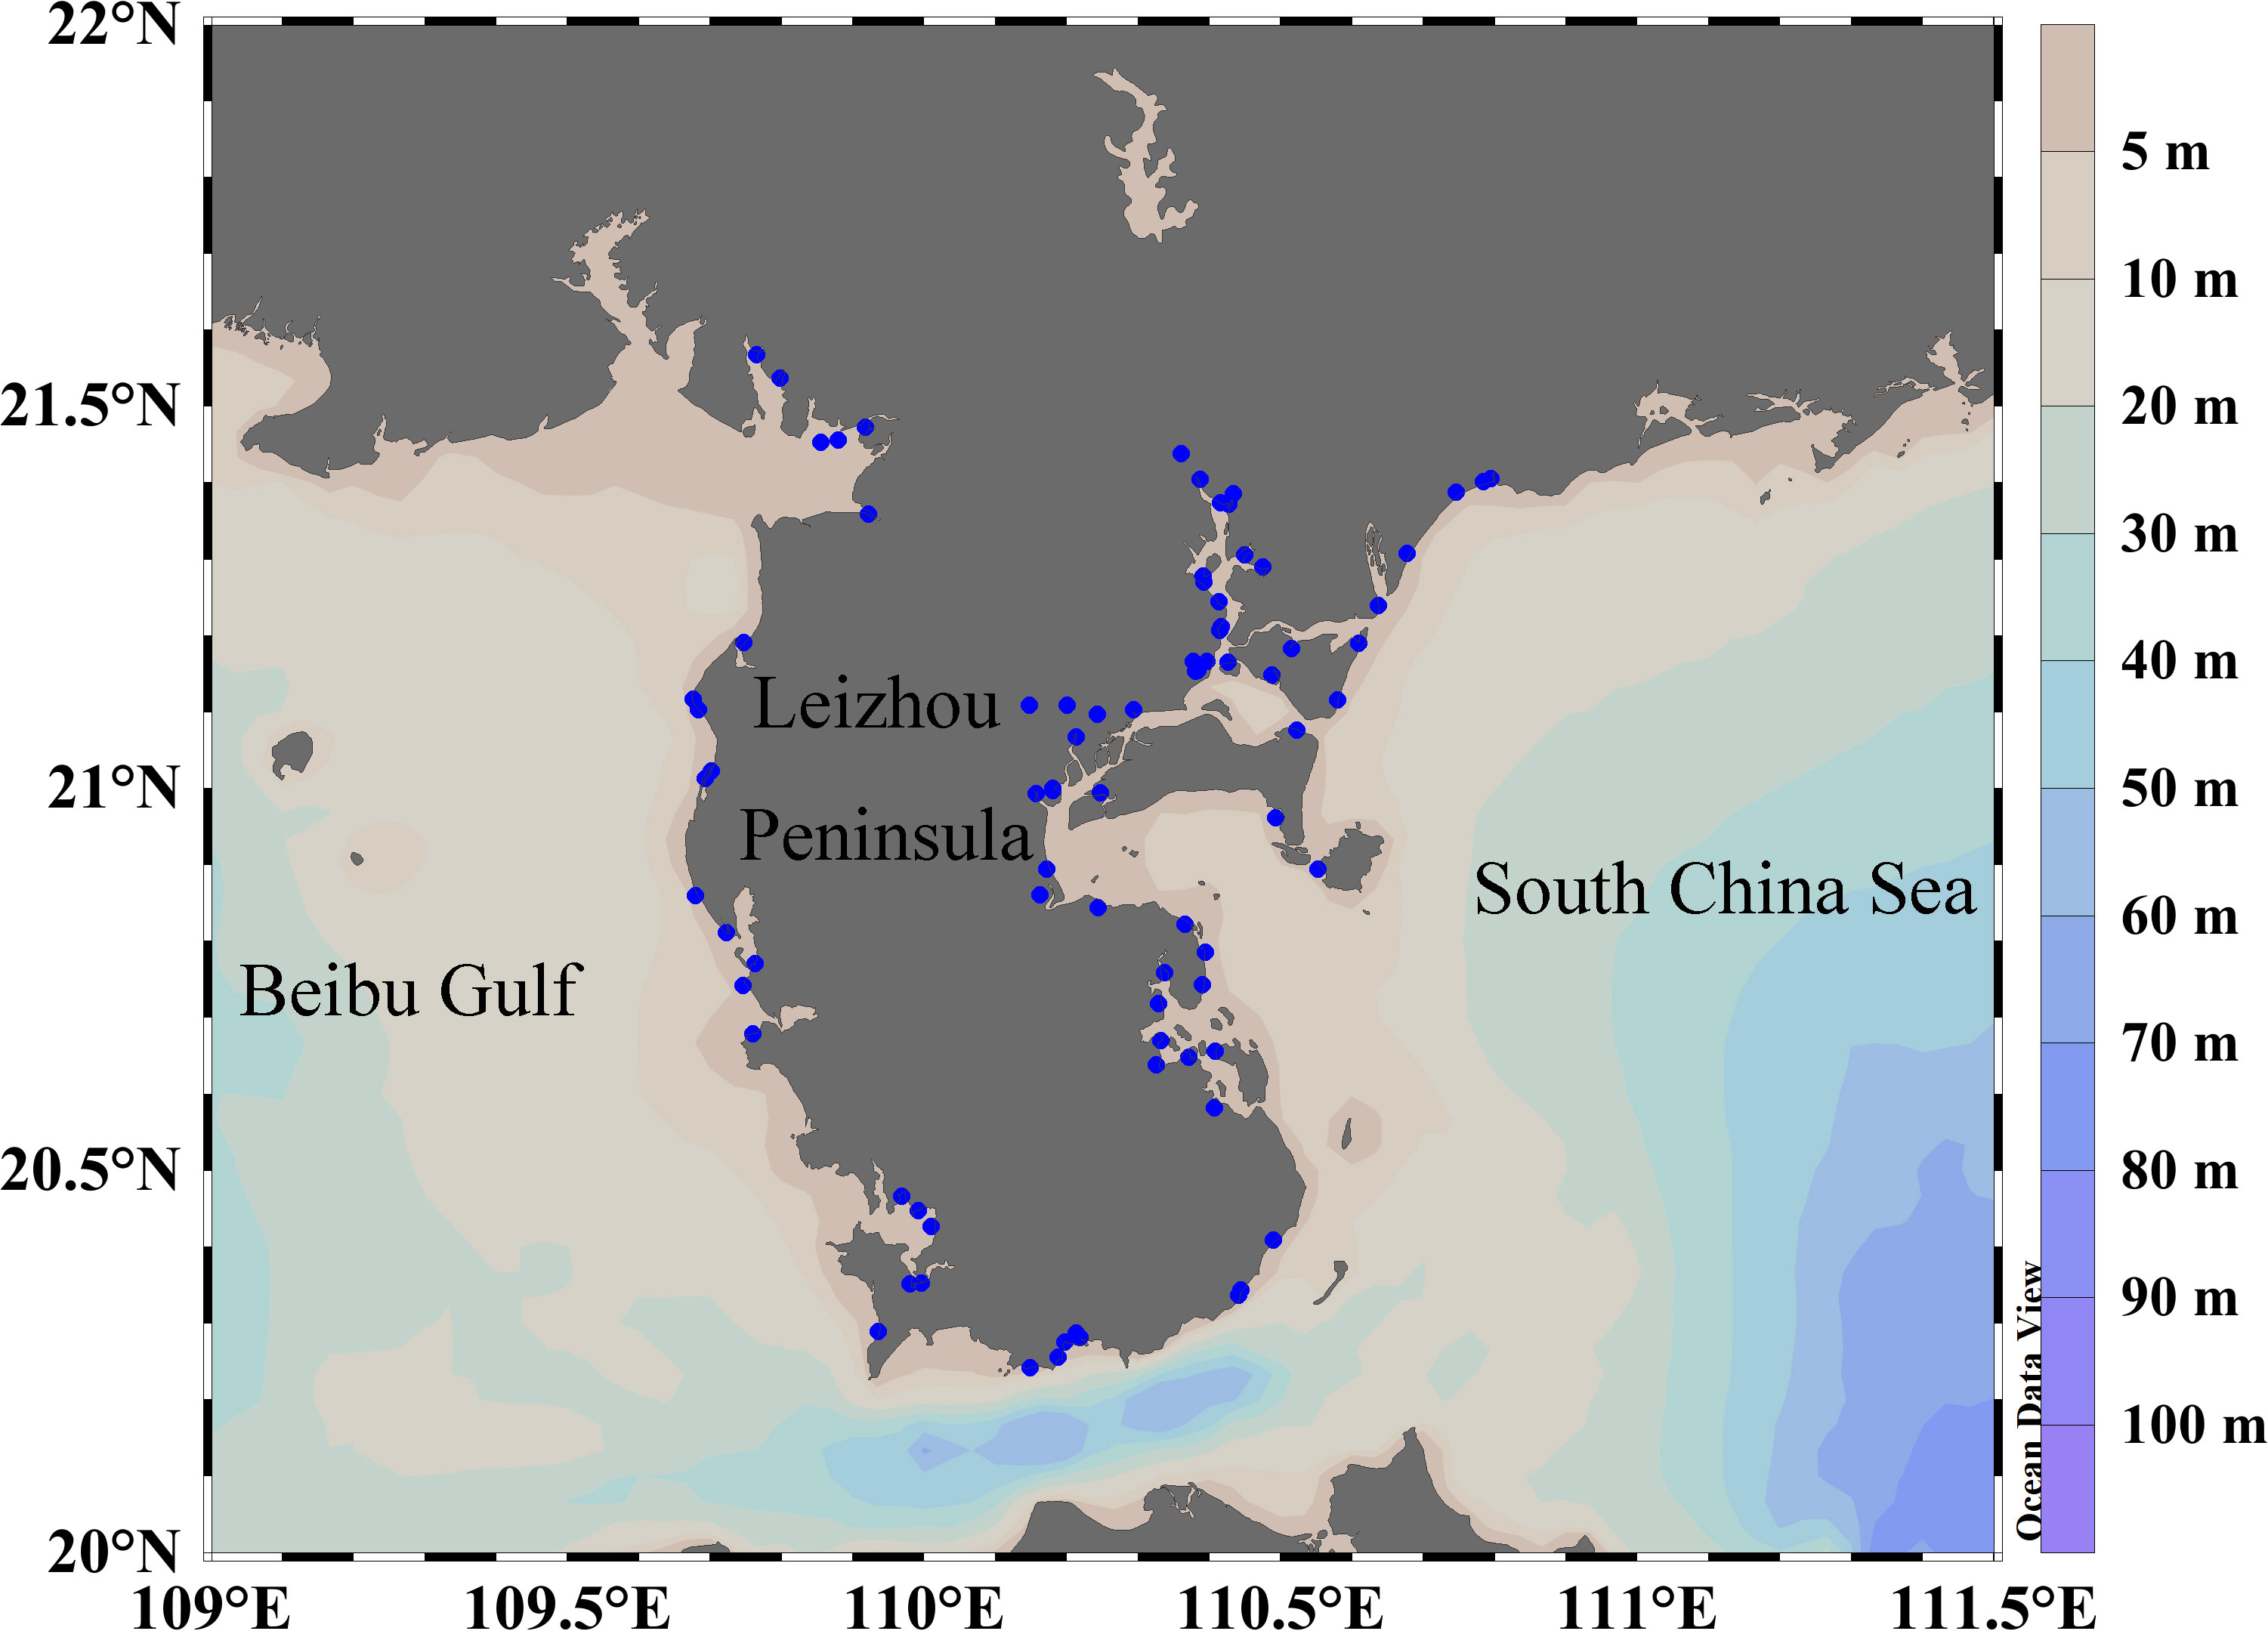
Figure 1 Study area and spatial distribution of sampling stations.
2 Material and methods
2.1 Study area and sampling
Leizhou Peninsula is located between 20–22°N and 109–111.5°E near the southernmost of the Chinese Mainland (Figure 1). It is bordered to the west by the northeastern Beibu Gulf, to the east by the northwest South China Sea, and to the south by Hainan Island. Its coastline is winding, with numerous harbors and islands, unique ecosystems such as mangroves and seagrass beds, as well as abundant marine biological resources (Gong et al., 2012). Due to the impact of human activities and external interference, the water quality in the coastal waters of Leizhou Peninsula has significantly decreased, and the environmental pressure has gradually increased over the past few years (Lei et al., 2016). In addition, due to the uneven distribution and development of industry and agriculture, as well as the impact of the sea areas, coastal runoff, the water quality, ecological environment, marine biological resources and ecological environment factors around the Leizhou Peninsula are complex and changeable (Zhang et al., 2021).
In the summer of 2020, we conducted an investigation around the Leizhou Peninsula and arranged 81 sampling stations, including river sewage outlets, industrial sewage outlets, domestic sewage outlets, and aquaculture sewage outlets (Figure 1). The sampling depth of each station is about 0.5 m. In addition, we also measured various indicators of these outfalls, including temperature, salinity, pH, dissolved oxygen (DO), COD, ammonia nitrogen (NH4+), total nitrogen (TN), and total phosphorus (TP). The temperature, salinity, pH, and DO are measured using a portable multi-parameter water quality analyzer. COD and NH4+ use dichromate titration (river water)/basic potassium permanganate method (seawater), and hypobromate oxidation method. TN and TP use potassium persulfate oxidation method (The specification for marine monitoring – Part 4: Seawater analysis) (National Marine Environmental Monitoring Center, 2007). The in-situ measured data used to validate the model is also from the sampling data of Zhanjiang Bay in the summer of 2020 (Figure 2H). Importantly, the nutrient data in Table 1 for Zhanjiang Bay over the past 10 years have been accumulated from our team’s voyages sampling.
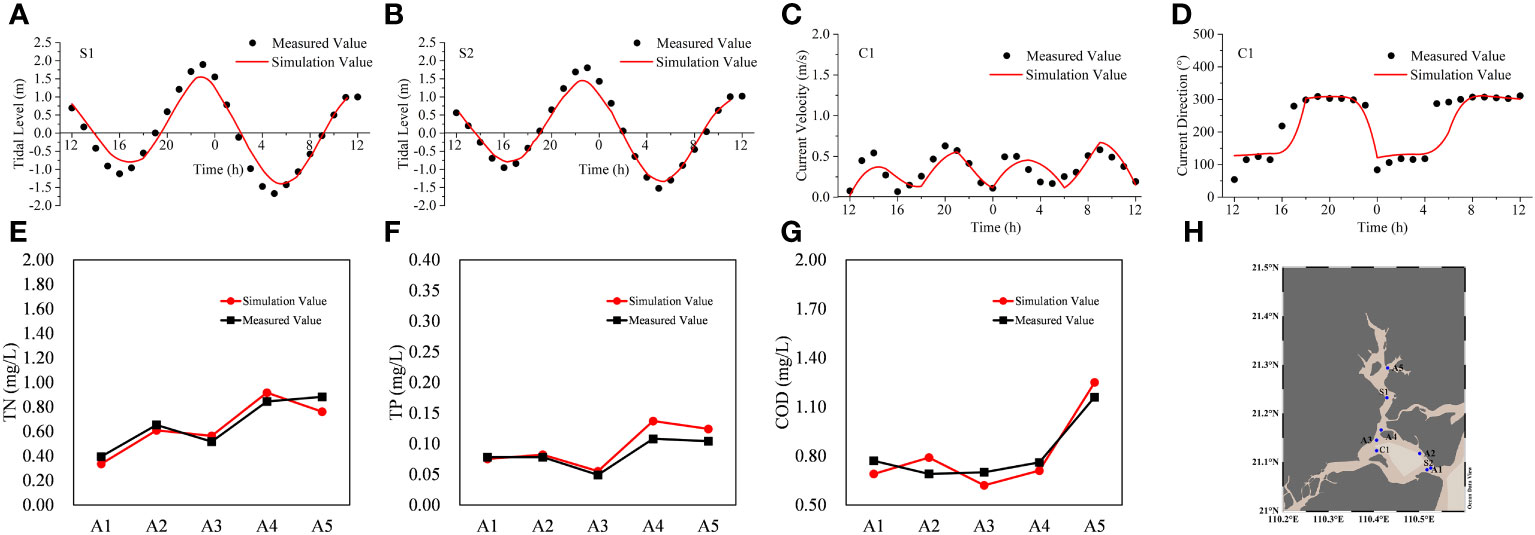
Figure 2 The results of simulation value and measured value in (A)&(B) Tidal level, (C) Current velocity, (D) Current direction, (E) COD, (F) TN, (G) TP, (H) The sampling stations of validation.
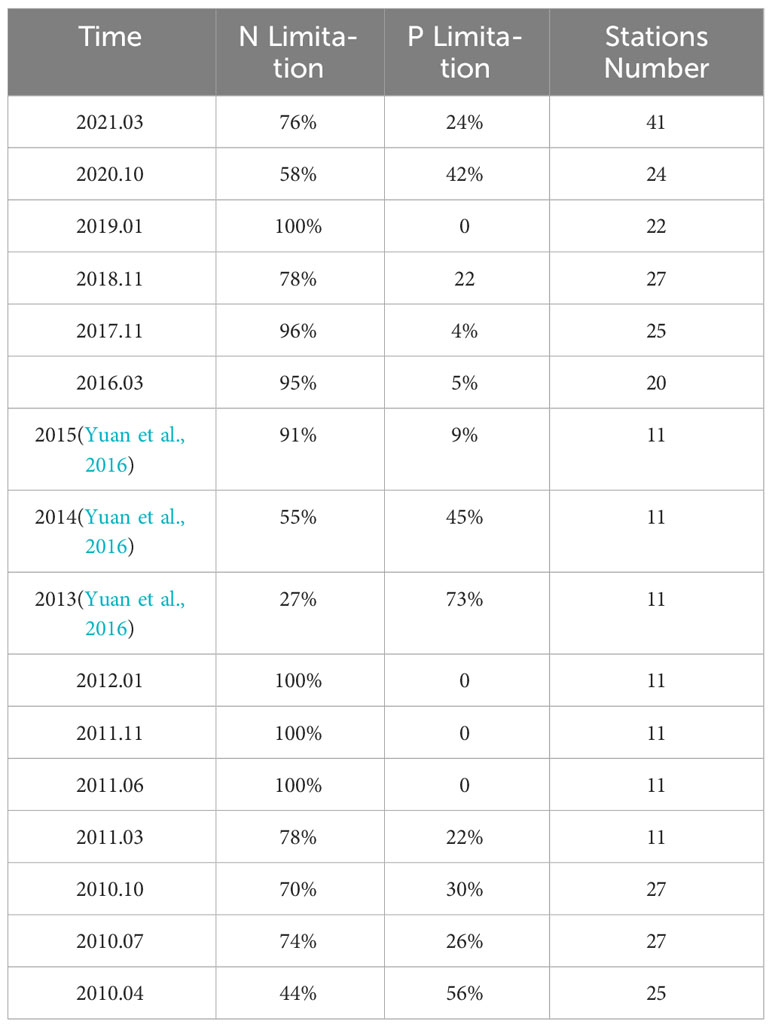
Table 1 Percentage of the stations of nitrogen and phosphorus limitation in Zhanjiang Bay from 2010 to 2021.
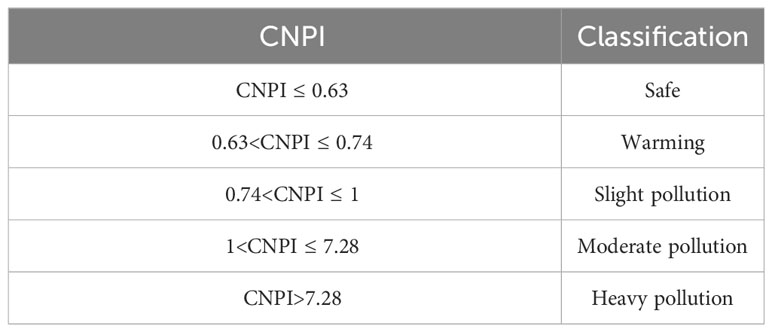
Table 2 The classifications of water quality based on the CNPI (Chen et al., 2020).
2.2 Calculation of the fluxes of land-sourced pollutants
Where F(i) is the fluxes of land-sourced pollutants (COD, NH4+, TN, and TP) (kg/day); C(i) is the concentration of land-sourced pollutants (COD, NH4+, TN, and TP) (mg/L); Q(i) is the flow rate at the sewage outlets (m3/day).
2.3 Water quality evaluation index
Nemerow Pollution Index (NPI) is a popular approach for assessing the quality of both surface water and groundwater (Nemerow, 1974). This approach can overcome the drawbacks of the single factor index method and effectively address the effects of outlier or a portion of high values on the overall assessment of water quality.
The traditional NPI:
Where NPI is the Nemerow Pollution Index; Fmax is the maximum pollution index; Fave is the average pollution index; Fi is the pollution index; Ci is the measured value of evaluation index i at the sampling stations; Sij is the standard value of evaluation index i in Class j water; n is the number of assessment indicators. The Class III water quality standard from “surface water quality standard (GB 3838-2002)” is chosen as the evaluation standard in this study (State environmental protection administration, 2002).
However, the traditional NPI is based on a single factor evaluation method that could overstate the importance of the largest pollution factor and undervalue the importance of each indicator. In recent years, domestic and foreign researchers have continuously improved and optimized this method (Swati, 2015; Ji et al., 2016). The improved NPI (CNPI) (Table 2) is as follows:
Where is a correction to traditional NPI (Fmax); Fw is the pollution factor Fi value with the highest weight value.
The calculation of weight value Wi:
In general, the lower the concentration of pollution indicators in the “surface water quality standard (GB 3838-2002)”, the greater the harm to water quality, and the link between the two is inversely proportional (Yang et al., 2012). Arrange the water standards j for various evaluation factors Wij in descending order. Compare their maximum value Smax with Si, and set Ri as the correlation ratio of the evaluation factor i to obtain:
Where Wi is the weight value of the pollution factor i; Smax is the maximum standard value Si; Ri is the correlation ratio of the evaluation indicator i.
2.4 Principal component analysis
Principal component analysis (PCA) is a statistical method for dimensionality reduction of data (Liu et al., 2003; Gimenez and Giussani, 2018). It can increase the interpretability of data while retaining the maximum amount of information in the data and can achieve visualization of multidimensional data. The steps are as follows:
(1) On the basis of the raw data, create a sample matrix X and carry out standardization processing.
Where n is the number of sampling stations with p indicators. is the mean of the indicator j, ; σj is the standard deviation of the indicator j, ; Zij is the standardized value of indicator j for station i; xij is the measured value of indicator j for station i.
(2) Checkout of Kaiser-Meyer-Olkin-Measure of Sampling Adequacy (KMO) and Bartlett Test of Sphercity. KMO is an indicator that compares partial and simple correlation coefficients between variables, with values ranging from 0 to 1. The KMO indicates the strength of the correlation between variables, and the original variables are better suited for factor analysis when it is closer to 1.The Bartlett Test of Sphercity is a method to determine whether the variables in the data matrix are independent of one another and whether the data matrix is an identity matrix. If p< 0.05, the data correlation matrix is not an identity matrix, allowing for the possibility of factor analysis; if p > 0.05, the data correlation matrix is an identity matrix, making factor analysis inappropriate. Finally, PCA can be used to determine the relationship between the variables in the data when the KMO > 0.5 and the p< 0.001.
(3) Create a correlation coefficient matrix based on normalized data matrix for the variables. Calculate the eigenvalues λi(i=1,2,…,p) of R, which is the variance of PCA, using the characteristic equation |R – λI|=0. The eigenvalues are ordered in descending order λ1 ≥ λ2 ≥ …λp. The variance contribution rate and cumulative variance contribution rate are and , respectively. Standardized data is converted into primary components using the eigenvector corresponding to various eigenvalues Ig = (Ig1,Ig2,…,Igp)T (g = 1,2, …, p).
(4) Based on the tenet that the characteristic value of the cumulative contribution rate of primary component variance is larger than 1, determine the total number of PCA.
2.5 Cluster analysis
In order to reveal the underlying characteristics and connections among samples, cluster analysis (including hierarchical clustering, K-Means, etc.) is used to divide samples of unknown categories into several class families, cluster similar samples into the same class cluster, and divide dissimilar samples into different class clusters (Wu et al., 2009). Each sample is treated as a cluster in this study’s bottom-up method for hierarchical clustering, which involves finding the two clusters with the shortest distance between them and merging them until all samples are in the same cluster. The steps are as follows:
(1) Use n data objects as initial clustering centers (i.e. cluster centroids).
(2) Calculate the distance between the centroids of each cluster (Euclidean distance).
(3) Find two clusters Ci and Cj with the smallest distance and merge them into a new cluster.
(4) Repeat step 2 until just one cluster is left or the predetermined criteria are met.
(5) Output the results of cluster analysis.
2.6 Numerical model
The Delft3D model, developed by the Dutch Delft Hydraulic Institute, is one of the most reliable numerical models in the world. It is widely used in coastal, estuarine, and riverine applications and also has good applicability in inter-tidal and beach topography. In this study, the Delft3D-Flow module is used to build a numerical model of the local two-dimensional tidal hydrodynamics and the transport and dispersion of pollutants to support the subsequent calculation of the environmental capacity of pollutants.
The computational domain of the model is Zhanjiang Bay and part of the outer bay, with an area of about 5.6 × 10³ km2 (Figure 3). In order to make the model computationally stable, the outer sea open boundary is set as a circular arc shape. The overall change in grid resolution is adapted to the hydrodynamic environment of Zhanjiang Bay, and the resolution of the grid is gradually reduced from inside the bay to outside the bay and locally encrypted in the key area, with a finest grid resolution of 30 m. The entire computational domain has 174 × 110 grid points.
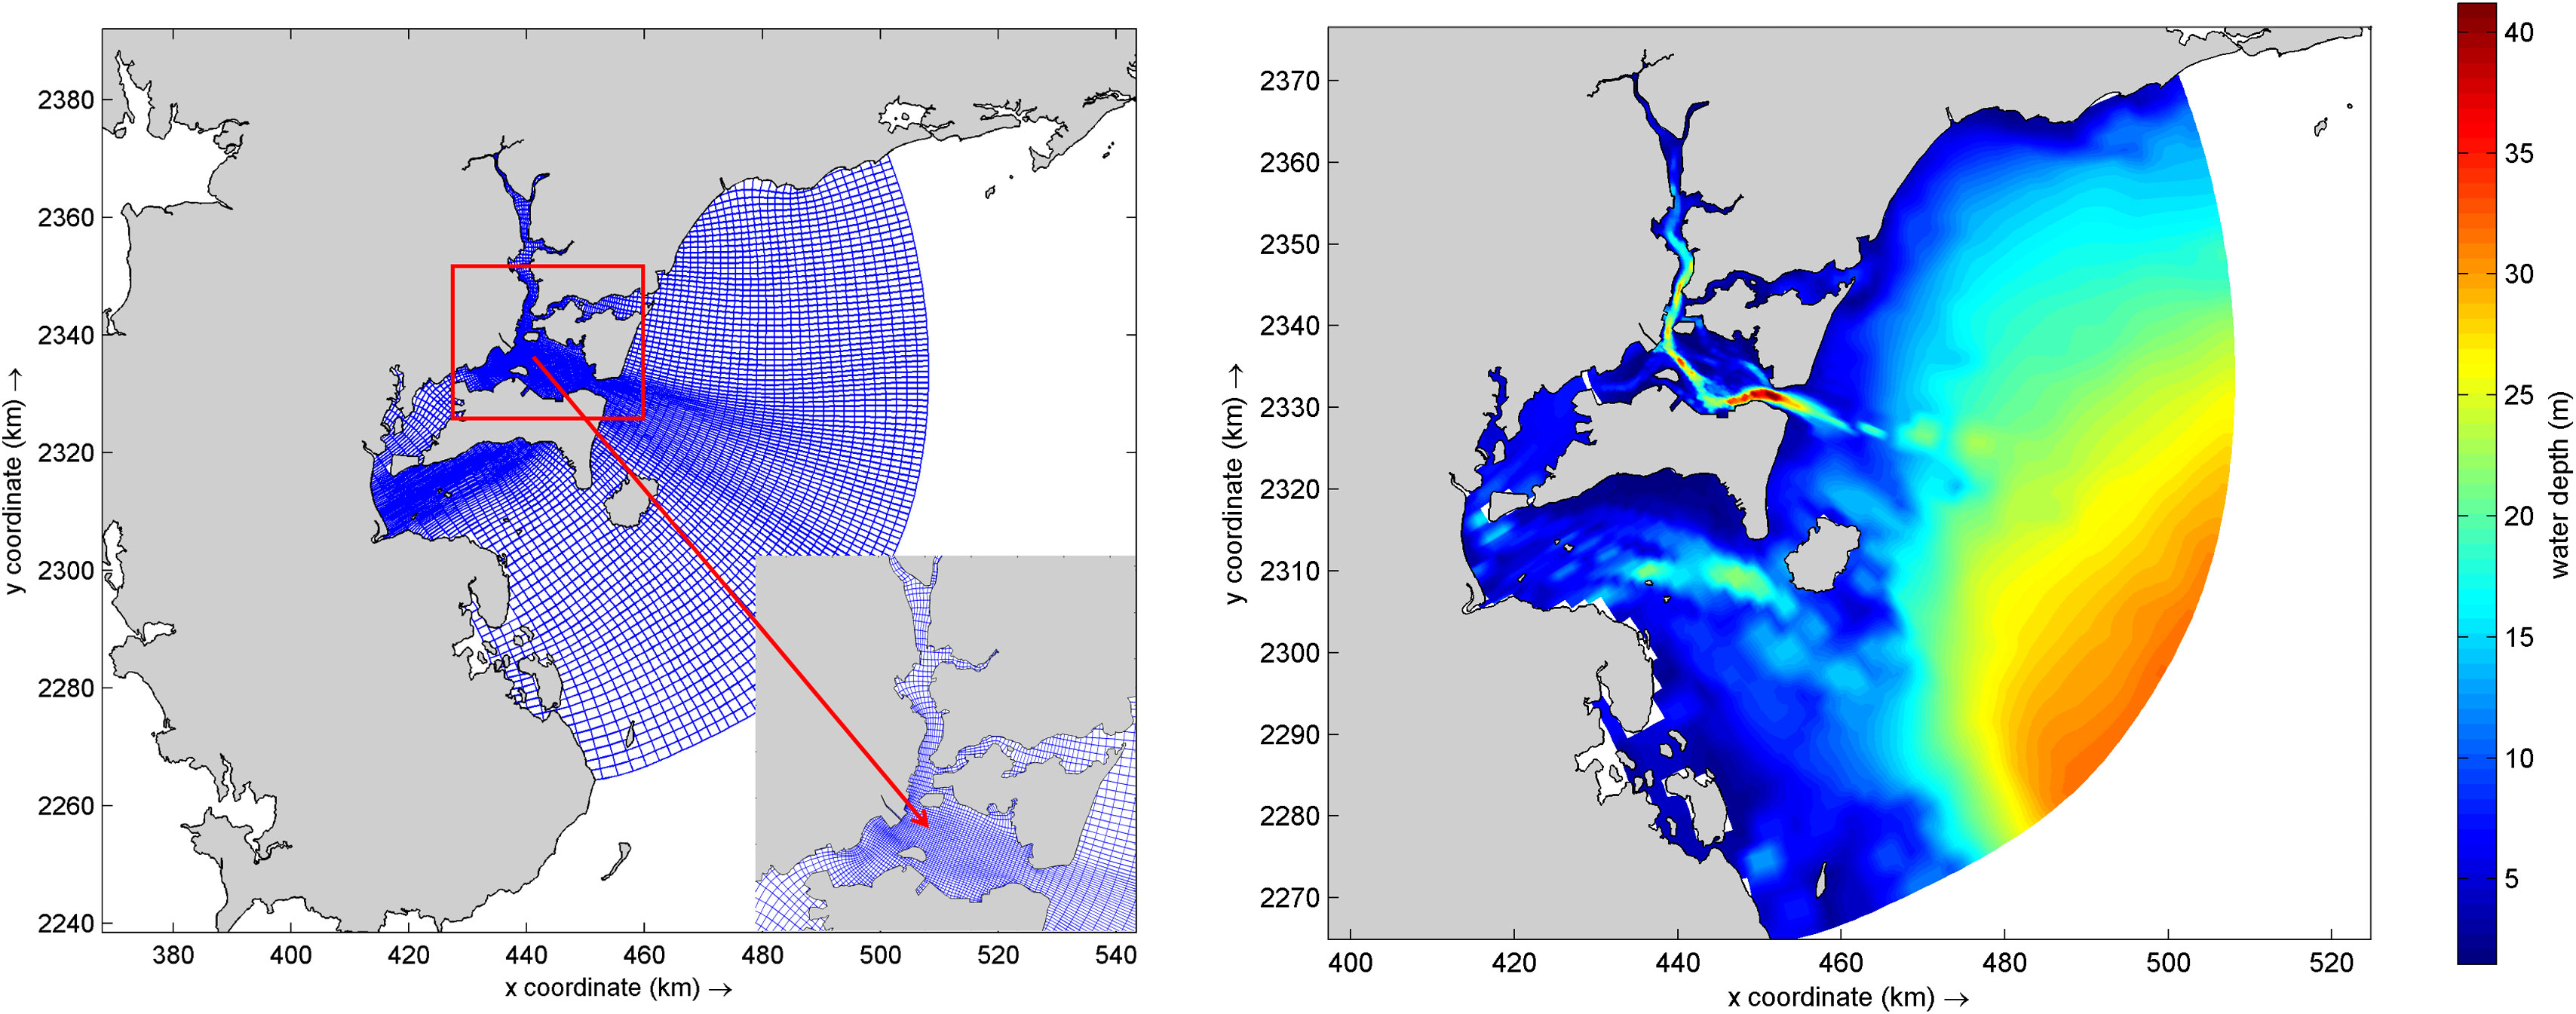
Figure 3 Modeling grid (left) and model water depth (right).
The underwater topographic data in the computational domain is taken from ETOPO1 and calibrated with high-precision electronic charts in the bay. Tidal harmonic constants for the eight major subtidal tides (M2, S2, N2, K2, K1, O1, P1, and Q1) provided by Oregon State University’s global tidal database were used to drive the boundary tidal levels at the open boundary in the outer sea (Egbert and Erofeeva, 2002). For the model parameter settings, we used the previously validated numerical model parameters of Zhanjiang Bay with necessary rate improvements (Wei et al., 2023). Among them, the roughness coefficient is expressed by the Manning coefficient. The bottom drag coefficient is set to 0.015–0.022 according to different underwater topographies, and the eddy viscosity coefficient is set to 10 m²/s. In addition, for the pollutant calculations in this study, the initial field of the pollutant with fluxes on the boundary is defined by interpolating the measured summer data. The sources of pollutants were determined from the outfall and river measured value. COD, TN, and TP are considered as conservative substances, and only hydrodynamic transport processes such as advection and diffusion are considered without considering biochemical processes.
2.7 Calculation of environmental capacity
The sharing rate method is also a commonly used method for calculating environmental capacity (Han et al., 2011). By creating a water quality model, the percentage of a single source of pollution in the total pollution may be computed, indicating how much that source contributed to the overall regional pollution. The sharing rate approach is easy to use and practical for administration and operation. This approach has been used successfully in numerous coastal regions (Zhang and Sun, 2007; Wang et al., 2012).
The response coefficient reflects the response relationship between pollutant input and sea water, which is the key to controlling sea water quality and total pollutant input. It is the concentration formed under the source intensity of the unit intensity of pollution source emissions (aij(x,y)), where i represents the pollution source and j represents the water quality control point, that is, the response coefficient of the water quality control point j under the input of the pollution source i.
The calculation of the sharing rate is as follows:
Where Cij(x,y) is the concentration formed by the pollution source i at the water quality control point j; Ci(x,y) is the concentration input for each pollution source.
Using the response coefficient and sharing rate, obtain the contribution concentration value C0i(x,y) of the pollution source i. Then calculate the allowable emission Q0i of the pollution source i based on C0i(x,y), which is:
3 Results and discussion
3.1 Spatial distribution of COD, NH4+, TN, and TP around Leizhou Peninsula
COD is a crucial metric for assessing the quality of water and serves as an indirect indicator of the amount of organic matter in water bodies. TP is an indicator that shows the overall quantity of phosphorus compounds in the water, whereas NH4+ and TN reflect the various kinds of nitrogen content in the water. The elements nitrate and phosphorus play a significant role in eutrophication and the degradation of water quality. The COD around the Leizhou Peninsula exhibits a general spatial tendency in the summer that is high in the east, low in the west, high in the north, and low in the south (Figure 4). The range of the COD concentration is 0.96 to 199 mg/L, with a mean value of 21.08 mg/L. Some stations with high COD values are primarily found in the east and south, flowing into Bomao Port, Leizhou Bay, and Qiongzhou Strait. The concentration of NH4+ is an important component of terrestrial TN and an important indicator for the country’s total pollutant control. The NH4+ concentration in the whole area around Leizhou Peninsula has individual high values, and the low-value area is mainly located in the eastern area (Figure 4). The average NH4+ concentration is 0.71 mg/L, with a range of 0.003 to 4.94 mg/L. The TN concentration shows an overall spatial trend of high in the east, low in the west, and high in the north and low in the south (Figure 4). The TN concentration value ranges from 0.089 to 348 mg/L, with a total average of 6.87 mg/L. Some high-value stations are mainly located in the eastern region and flow into Zhanjiang Bay. The TP concentration shows an overall spatial trend of high in the east and west, high in the north, and low in the south (Figure 4). The TP concentration value ranges from 0.058 to 4.62 mg/L, with a total average of 0.70 mg/L. Some high-value stations are mainly located in the eastern region and flow into Zhanjiang Bay, Leizhou Bay, and Anpu Bay.
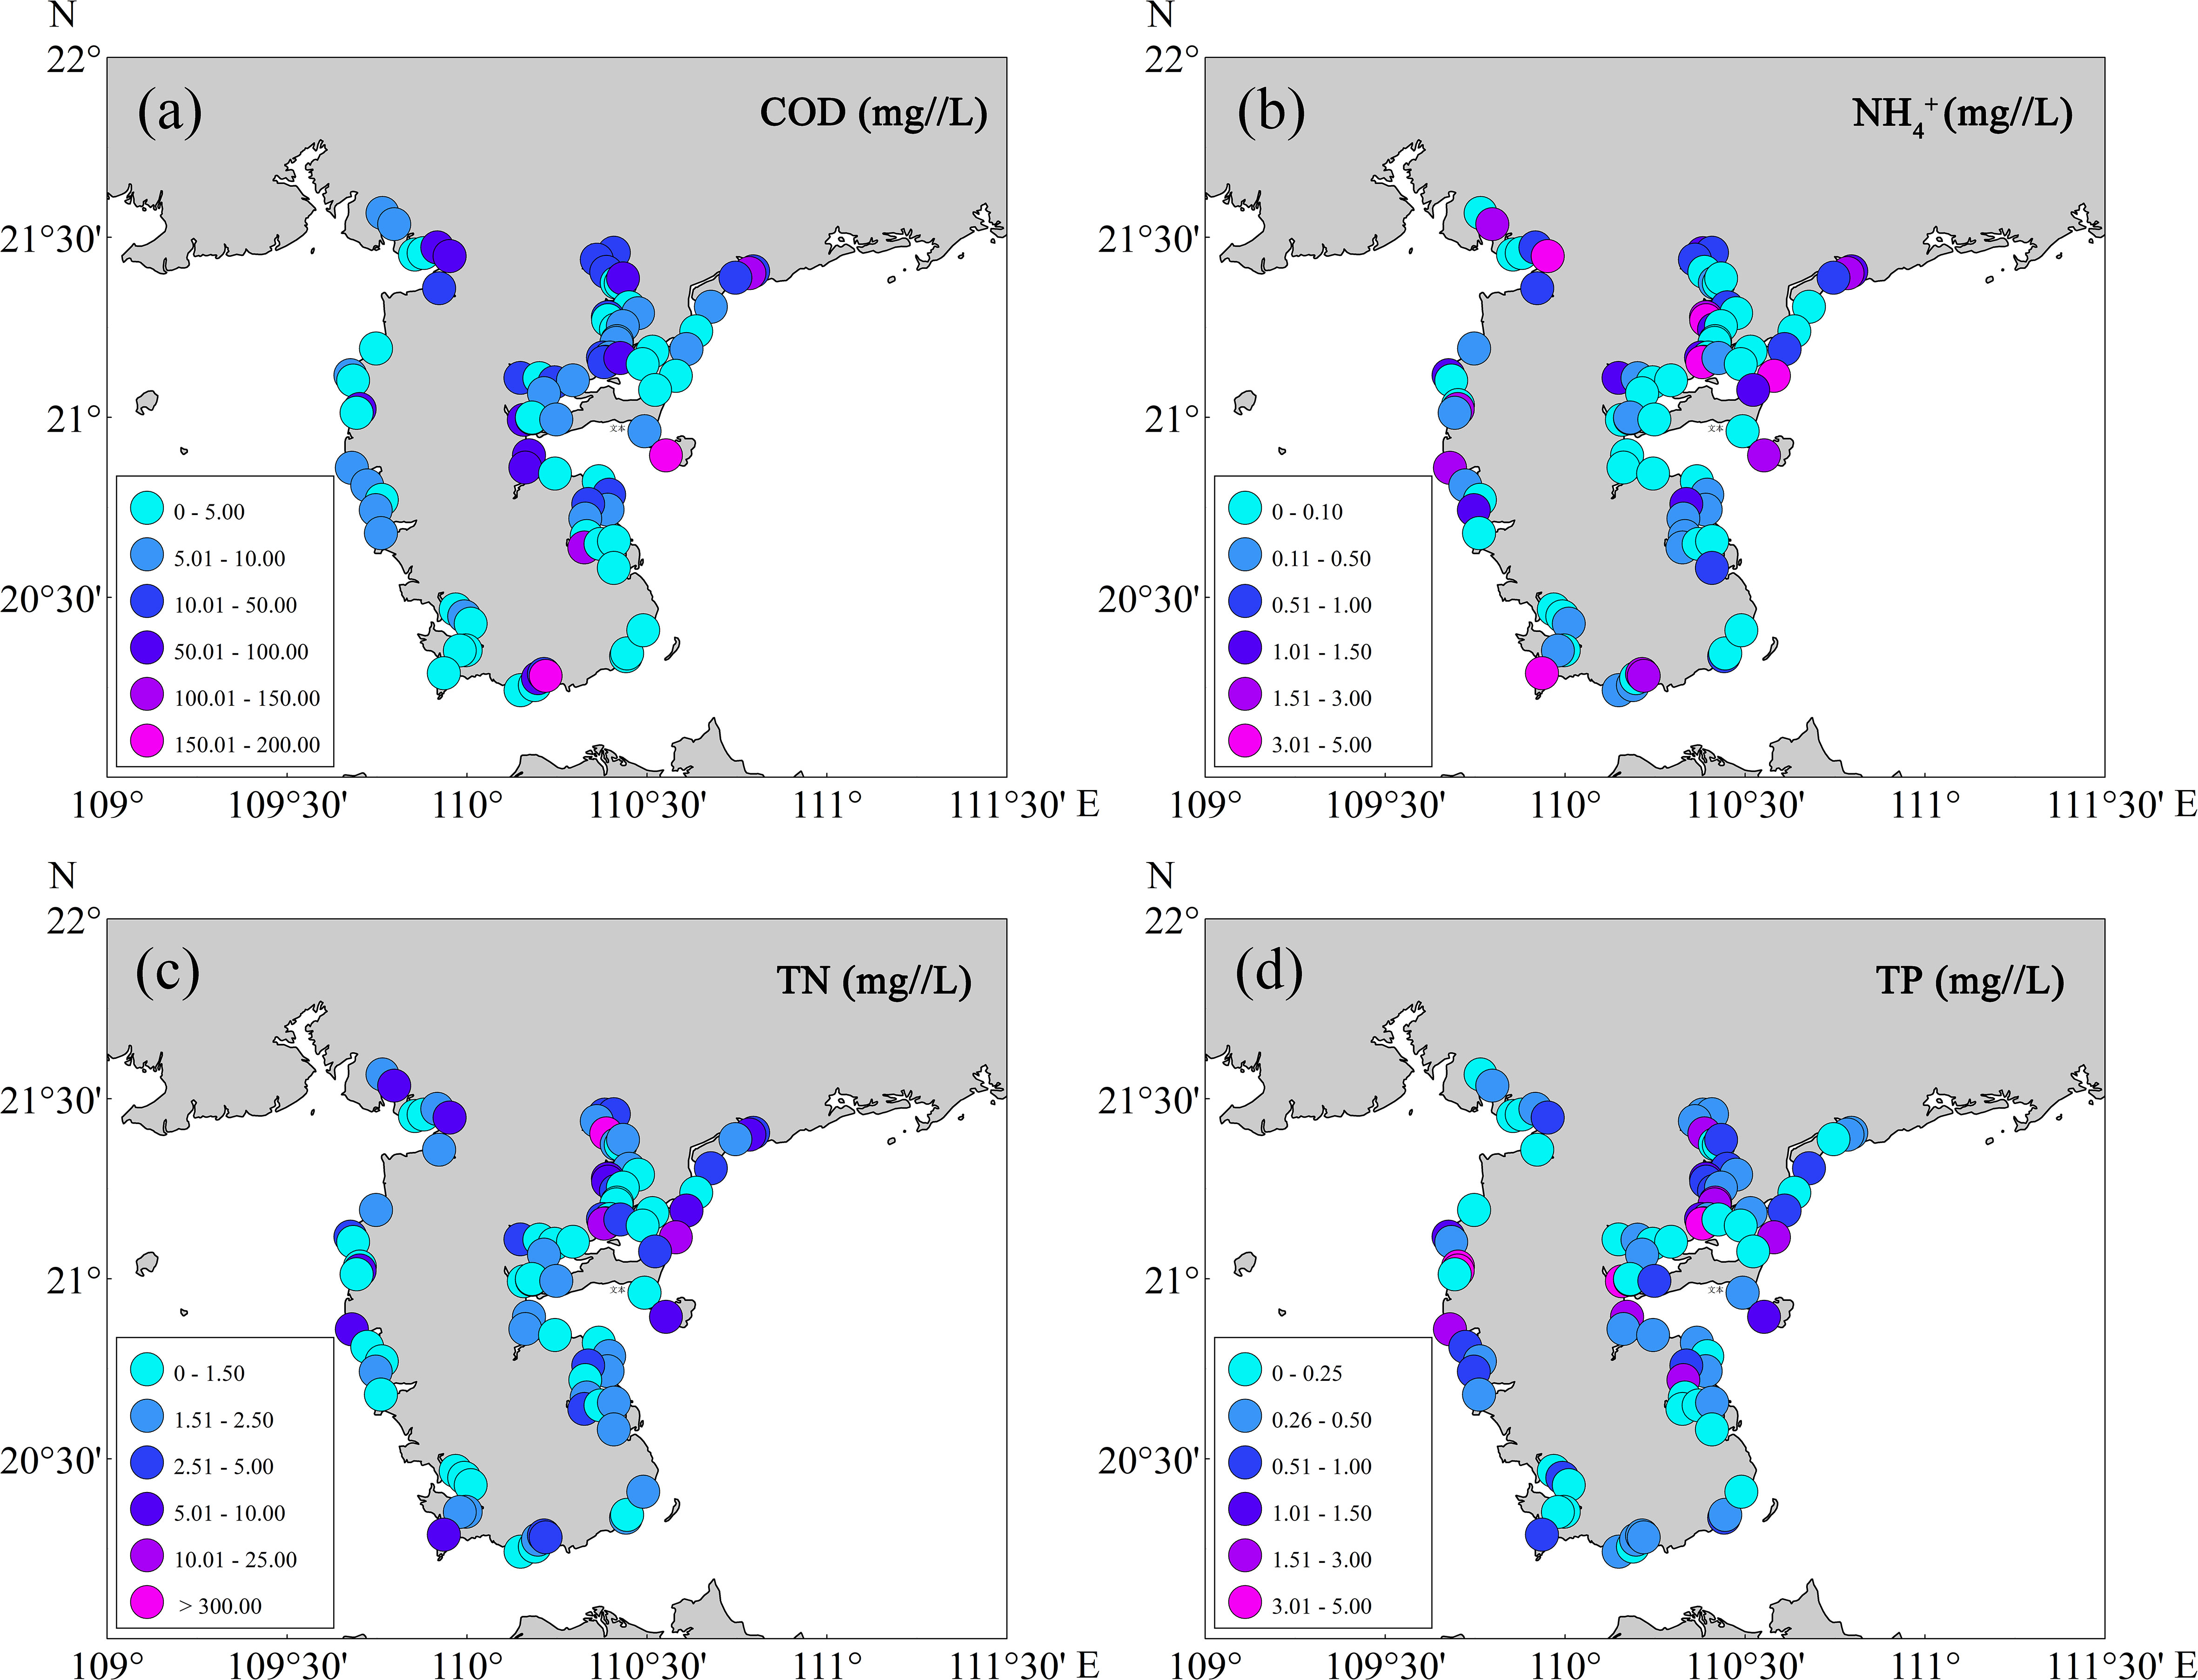
Figure 4 Concentration range of (A) COD (mg/L), (B) NH4+ (mg/L), (C) TN (mg/L), and (D) TP (mg/L) around Leizhou Peninsula in the summer of 2020.
3.2 The fluxes of COD, NH4+, TN, and TP and other environmental factors
We have designed a total of 81 sampling stations, including river sewage outlets, industrial sewage outlets, domestic sewage outlets, and aquaculture sewage outlets. Each sewage outlet ultimately flows into a different sea area. In order to better evaluate the pollution discharge and water pollution of the whole area around the Leizhou Peninsula, we choose to classify the 81 sewage outlets according to their final inflow into the sea areas, and the results are divided into 6 sea areas (Figure 5).
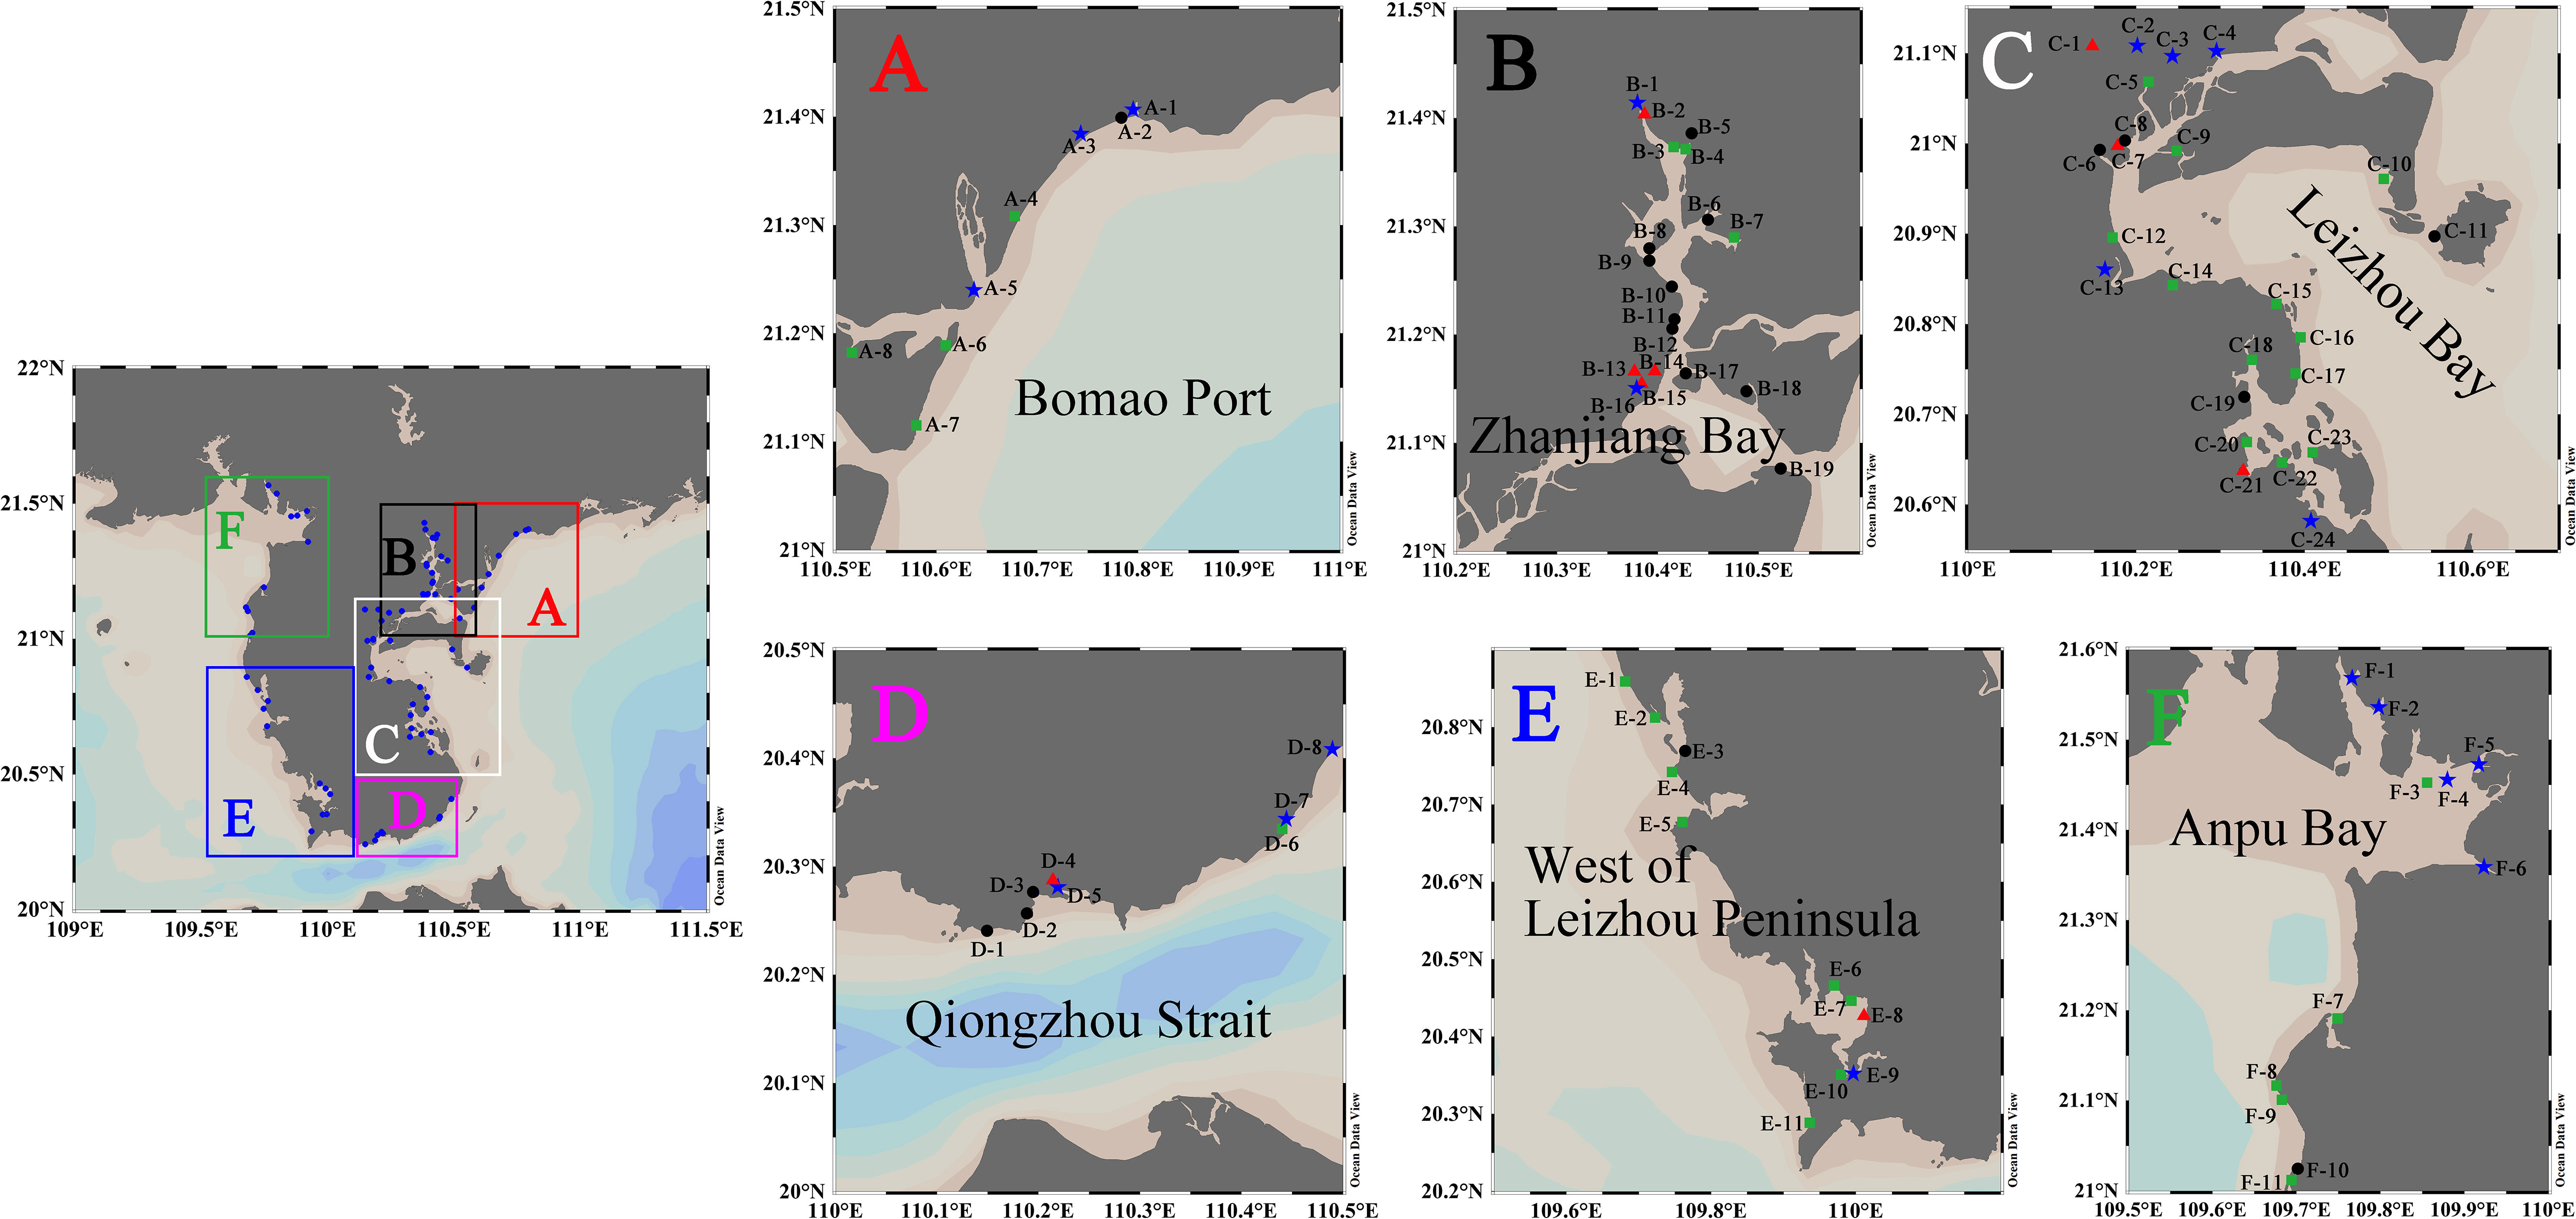
Figure 5 According to their final inflow into the sea areas, the study region is classified into 6 sea areas (A: Bomao Port B: Zhanjiang Bay C: Leizhou Bay D: Qiongzhou Strait E: West of Leizhou Peninsula F: Anpu Bay). Blue pentagram: river sewage outlets. Black dots: domestic sewage outlets. Green box: aquaculture sewage outlets. Red triangle: industrial sewage outlets.
Early studies have shown that nearshore waters are affected by land-sourced pollutants, leading to increased nutrient concentrations and eutrophication in seawater (Huang et al., 2003; Kalnejais et al., 2010; Parette and Pearson, 2014). In order to evaluate the impact of land-sourced pollutants on the regional water quality around Leizhou Peninsula, this study calculated the fluxes and average concentration of COD, NH4+, TN, and TP pollutants in 6 sea areas (Figure 6).
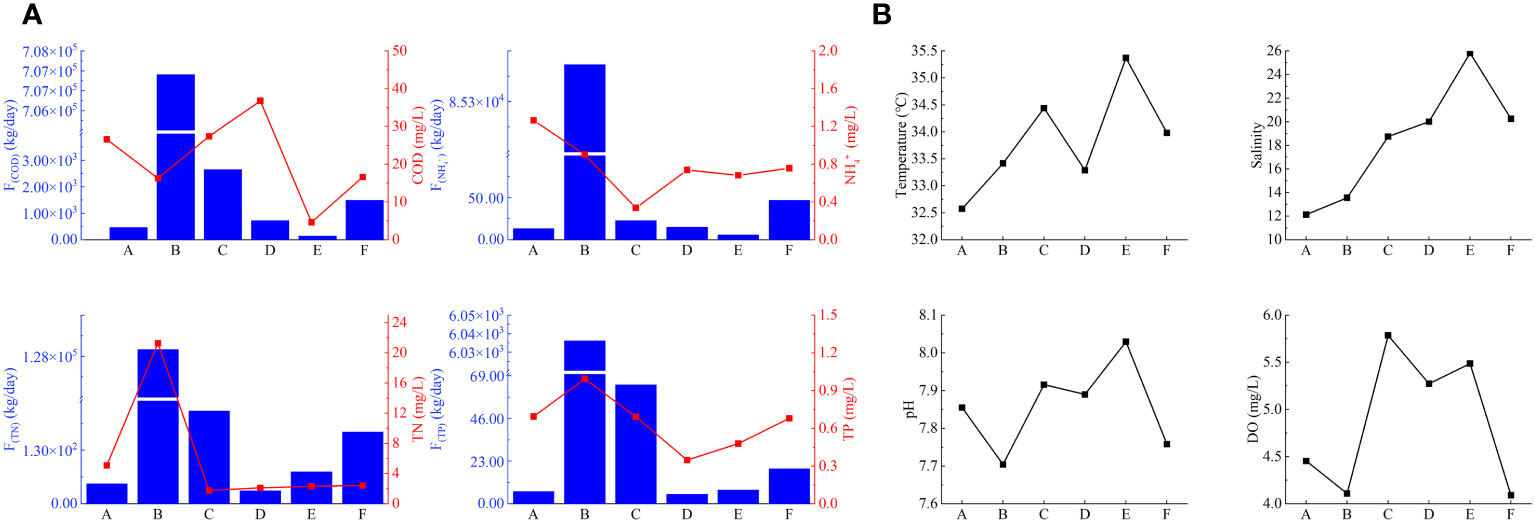
Figure 6 (A) Average concentration and fluxes of COD, NH4+, TN and TP in the sewage outlets in Area A, Area B, Area C, Area D, Area E, and Area F around Leizhou Peninsula in summer. (B) Average temperature, salinity, PH and DO in the sewage outlets in Area A, Area B, Area C, Area D, Area E, and Area F around Leizhou Peninsula in summer.
It is obvious that the fluxes of COD, NH4+, TN, and TP [F(COD), F(NH4+), F(TN), and F(TP)] in Area B (Zhanjiang Bay) are the highest. F(COD) is at least 200 times larger than other regions; F(NH4+) is at least 1500 times larger than other regions; F(TN) is at least 500 times larger than other regions; F(TP) is at least 100 times larger than other regions. However, the average concentration of COD and NH4+ is not the highest in Area B, indicating that the discharge outlet in Area B has a very large flux. Since the 1980s, with the economic and social development of Zhanjiang City, a large amount of industrial and domestic wastewater has been discharged into the bay through rivers, leading to increased pollution of seawater quality and the frequent occurrence of red tide disasters. According to the “Guangdong Provincial Marine Environmental Quality Bulletin”, the coastal areas of Zhanjiang City have become one of the most severe areas for red tide outbreaks, except for the Pearl River Delta region. The significant input of land-sourced pollutants is one of the important reasons for the deterioration of water quality near the Zhanjiang Bay.
Among the 6 sea areas, except for Area D, the temperature and salinity of other sea areas maintained a good trend, that is, areas with higher temperatures also have higher salinities (Figure 6). The temperature in Area D is low (33.29°C) compared to other areas, but the salinity is high (20.01), which is related to its location. It is located in Qiongzhou Strait, and the current velocity is very fast. Area A has the lowest temperature (32.58°C) and the lowest salinity (12.14), which is speculated to be related to the high input of rivers at this location. The temperature (35.37°C) and salinity (25.83) in the Area E are both the highest, which is speculated to be related to the low input of runoff at this location. The distribution of pH and DO shows a good trend, that is, areas with higher pH also have higher DO. It is obvious that the economically developed Area B and Area F have the lowest DO (4.11 mg/L and 4.09 mg/L) and PH (7.70 and 7.56), which may be related to anthropogenic pollutant emissions.
3.3 CNPI index
According to the Class III water quality standard in the “Surface Water Quality Standard (GB 3838-2002) (State environmental protection administration, 2002)”, CNPI is used to express the pollution index of land-sourced pollutants in the sea area around Leizhou Peninsula. The CNPI considers the weight of the impact of various water quality indicators on water quality, which can reasonably reflect the water quality pollution status. The correction of the maximum index value takes into account the harmfulness of the important pollution factor, and the evaluation results are relatively close to reality.
According to the weight values (Table 3), it can be concluded that TP accounts for the largest proportion among various pollution indicators, followed by TN and NH4+, meaning that nitrogen and phosphorus indicators are the greatest impact on water quality.
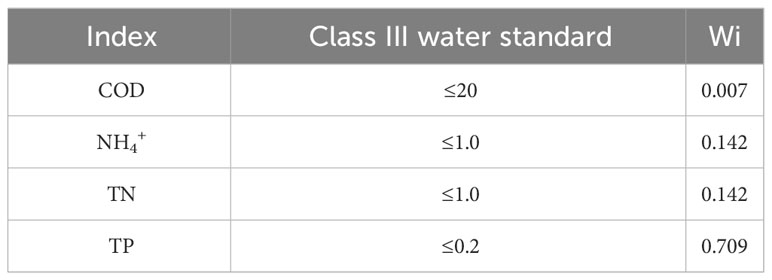
Table 3 Weight values of COD, NH4+, TN, and TP.
Overall, the water quality in Area B is generally worse than other areas, with CNPI: B>A>F>C>D>E (Table 4). In summer, the CNPI range in Area A is 0.35–6.50, including three water quality levels: 1 “Safe” sewage outlet, 1 “Warming” sewage outlet, and 6 “Moderate Pollution” sewage outlets, and the average value of CNPI is 2.03 (Table 4, Figure 7). The CNPI range in Area B is 0.41–123.13, including five water quality levels: 4 “Safe” sewage outlets, 1 “Warming” sewage outlet, 1 “Slight Pollution” sewage outlets, 12 “Moderate Pollution” sewage outlets, and 1 “Heavy Pollution” sewage outlet. The average value of CNPI is 7.13 in Area B, and the high TN value of B-2 in Area B is 348 mg/L, resulting in a larger CNPI (Table 4, Figure 7). The CNPI range in Area C is 0.31–3.93, including four water quality levels: 4 “Safe” sewage outlets, 3 “Warming” sewage outlets, 9 “Slight Pollution” sewage outlets, and 8 “Moderate Pollution” sewage outlets, and the average value of CNPI is 1.22 (Table 5, Figure 7). The CNPI range in Area D is 0.53–2.53, including three water quality levels: 2 “Safe” sewage outlets, 2 “Slight Pollution” sewage outlets, and 4 “Moderate Pollution” sewage outlets, and the average value of CNPI is 1.15 (Table 4, Figure 7). The CNPI range in Area E is 0.55–2.57, including three water quality levels: 4 “Safe” sewage outlets, 4 “Slight Pollution” sewage outlets, and 3 “Moderate Pollution” sewage outlets, and the average value of CNPI is 1.10 (Table 5, Figure 7). The range of CNPI in Area F is 0.52–4.85, including four water quality levels: 2 “Safe” sewage outlets, 3 “Warming” sewage outlets, 2 “Slight Pollution” sewage outlets, and 4 “Moderate Pollution” sewage outlets, and the average value of CNPI is 1.31 (Table 4, Figure 7).
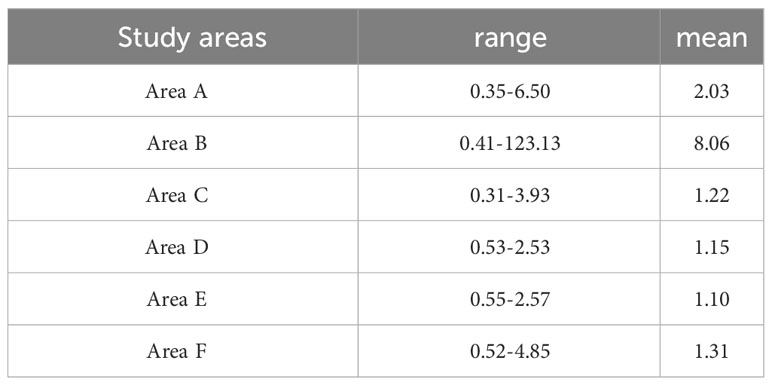
Table 4 The range of CNPI and the average CNPI in Area A–F.

Figure 7 The number of stations of CNPI in Area A–Area F.
3.4 PCA and cluster analysis
The PCA was used to analyze the land-sourced pollutants and environmental factors from six sea areas around the Leizhou Peninsula. There was a correlation between the variables, as shown by the Kaiser Meyer Olkin (KMO) test value of 0.643 and the Bartlett test result of p<0.001. Through PCA, we explored the relationship between land-sourced pollutants (COD, NH4+, TN, and TP) and environmental factors (temperature, salinity, DO, and pH) at 81 sewage outlets around Leizhou Peninsula (Figure 8). PC1 and PC2 explained 56.1% of the total variance (Figure 8). The main contribution of PC1 (34.1%) comes from the fluxes of land-sourced pollutants, including F(COD) (0.48), F(NH4+) (0.48), F(TN) (0.48), and F(TP) (0.48). The contribution of PC2 (22.2%) comes from environmental factors such as temperature (0.39), DO (0.39), salinity (0.35), and pH (0.42). In PCA, B-1 and B16 showed anomalies, which may be due to the large flux in these two stations.
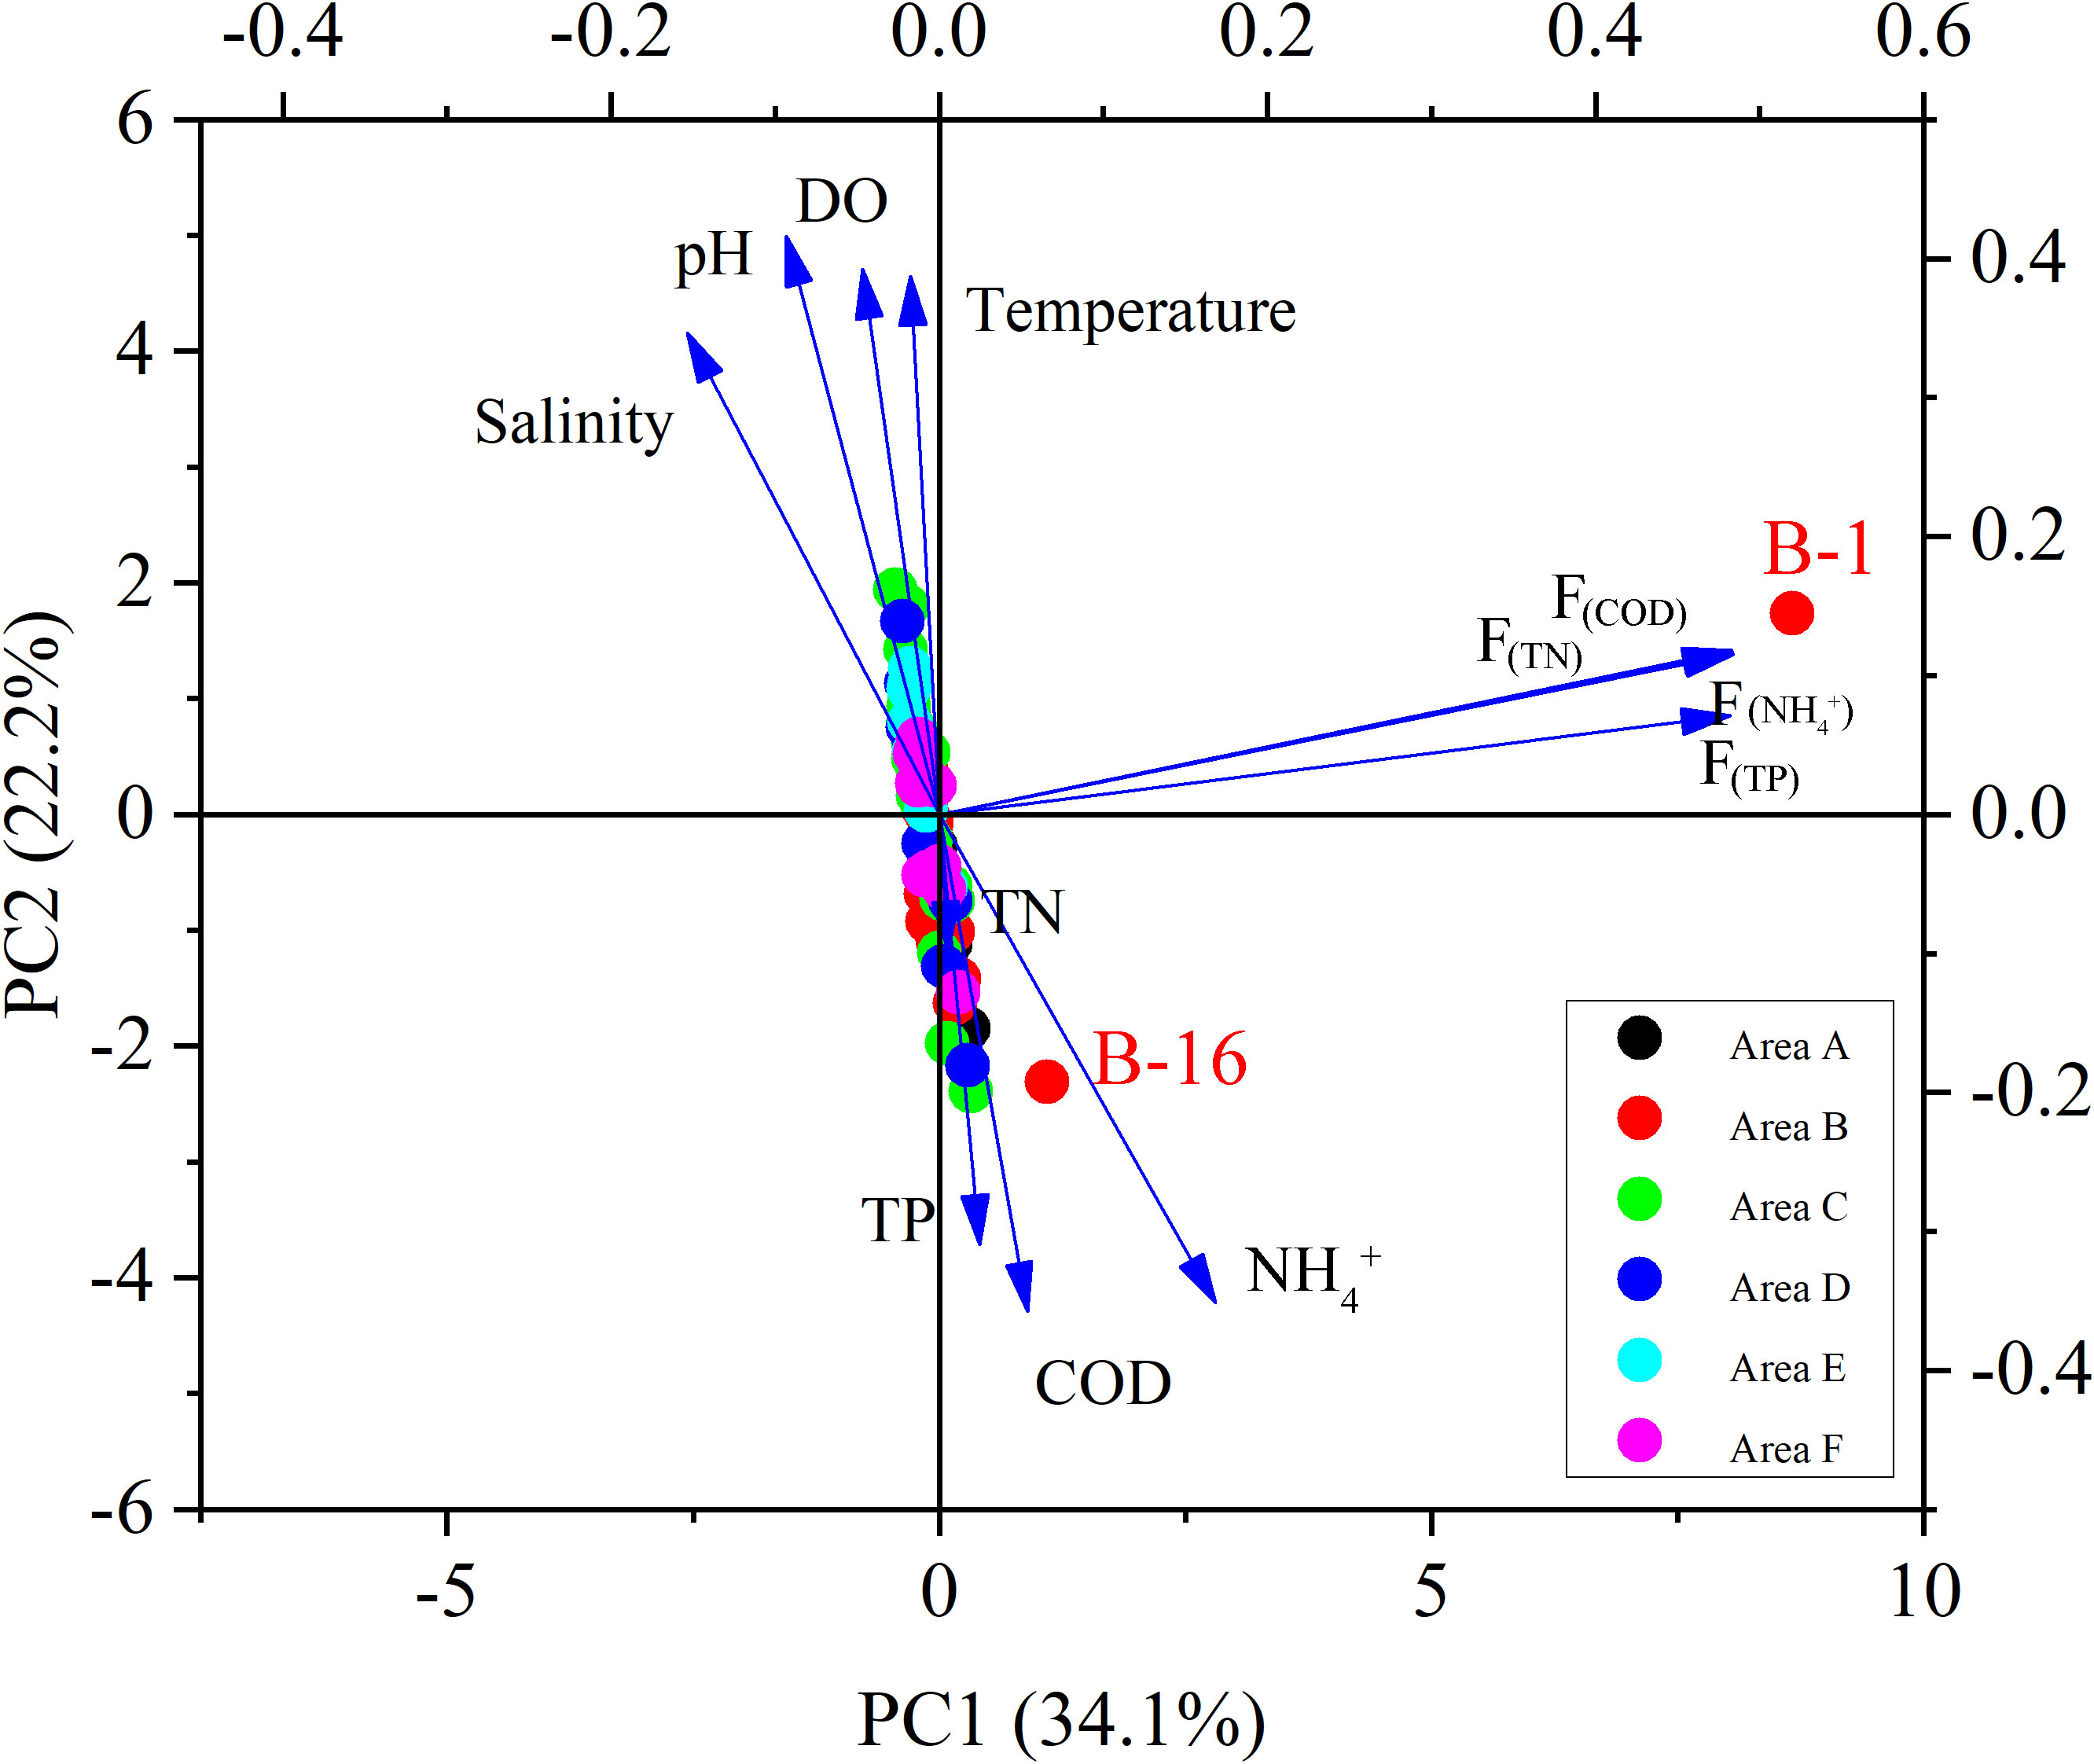
Figure 8 The PCA shows the relationship between the land-sourced pollutants and environmental factors around the Leizhou Peninsula. (The vector shows the direction and intensity of environmental variables relative to the overall distribution; the color dots correspond at 81 stations).
Cluster analysis was conducted on the land-sourced pollutants and environmental factors in 81 sewage outlets, and the clustering results were presented in the form of heat maps (Figure 9). It can be seen that the station cluster tree can be divided into six categories, with B-2 having a particularly small correlation with other stations. Even when it is classified into six categories, B-2 is still separated separately, which is related to the high TN concentration (348 mg/L) in B-2. The first type is mainly composed of river sewage outlets with high F(COD). The second type mainly consists of aquaculture sewage outlets with high temperatures, high salinities, high F(TN), and F(COD). The third type includes all types of sewage outlets with high temperatures and salinities. The fourth type is industrial sewage outlets with high temperatures and COD concentrations. The fifth type is mainly domestic sewage outlets with high temperatures and COD concentrations. The sixth type only has B-2 with a high TN concentration.
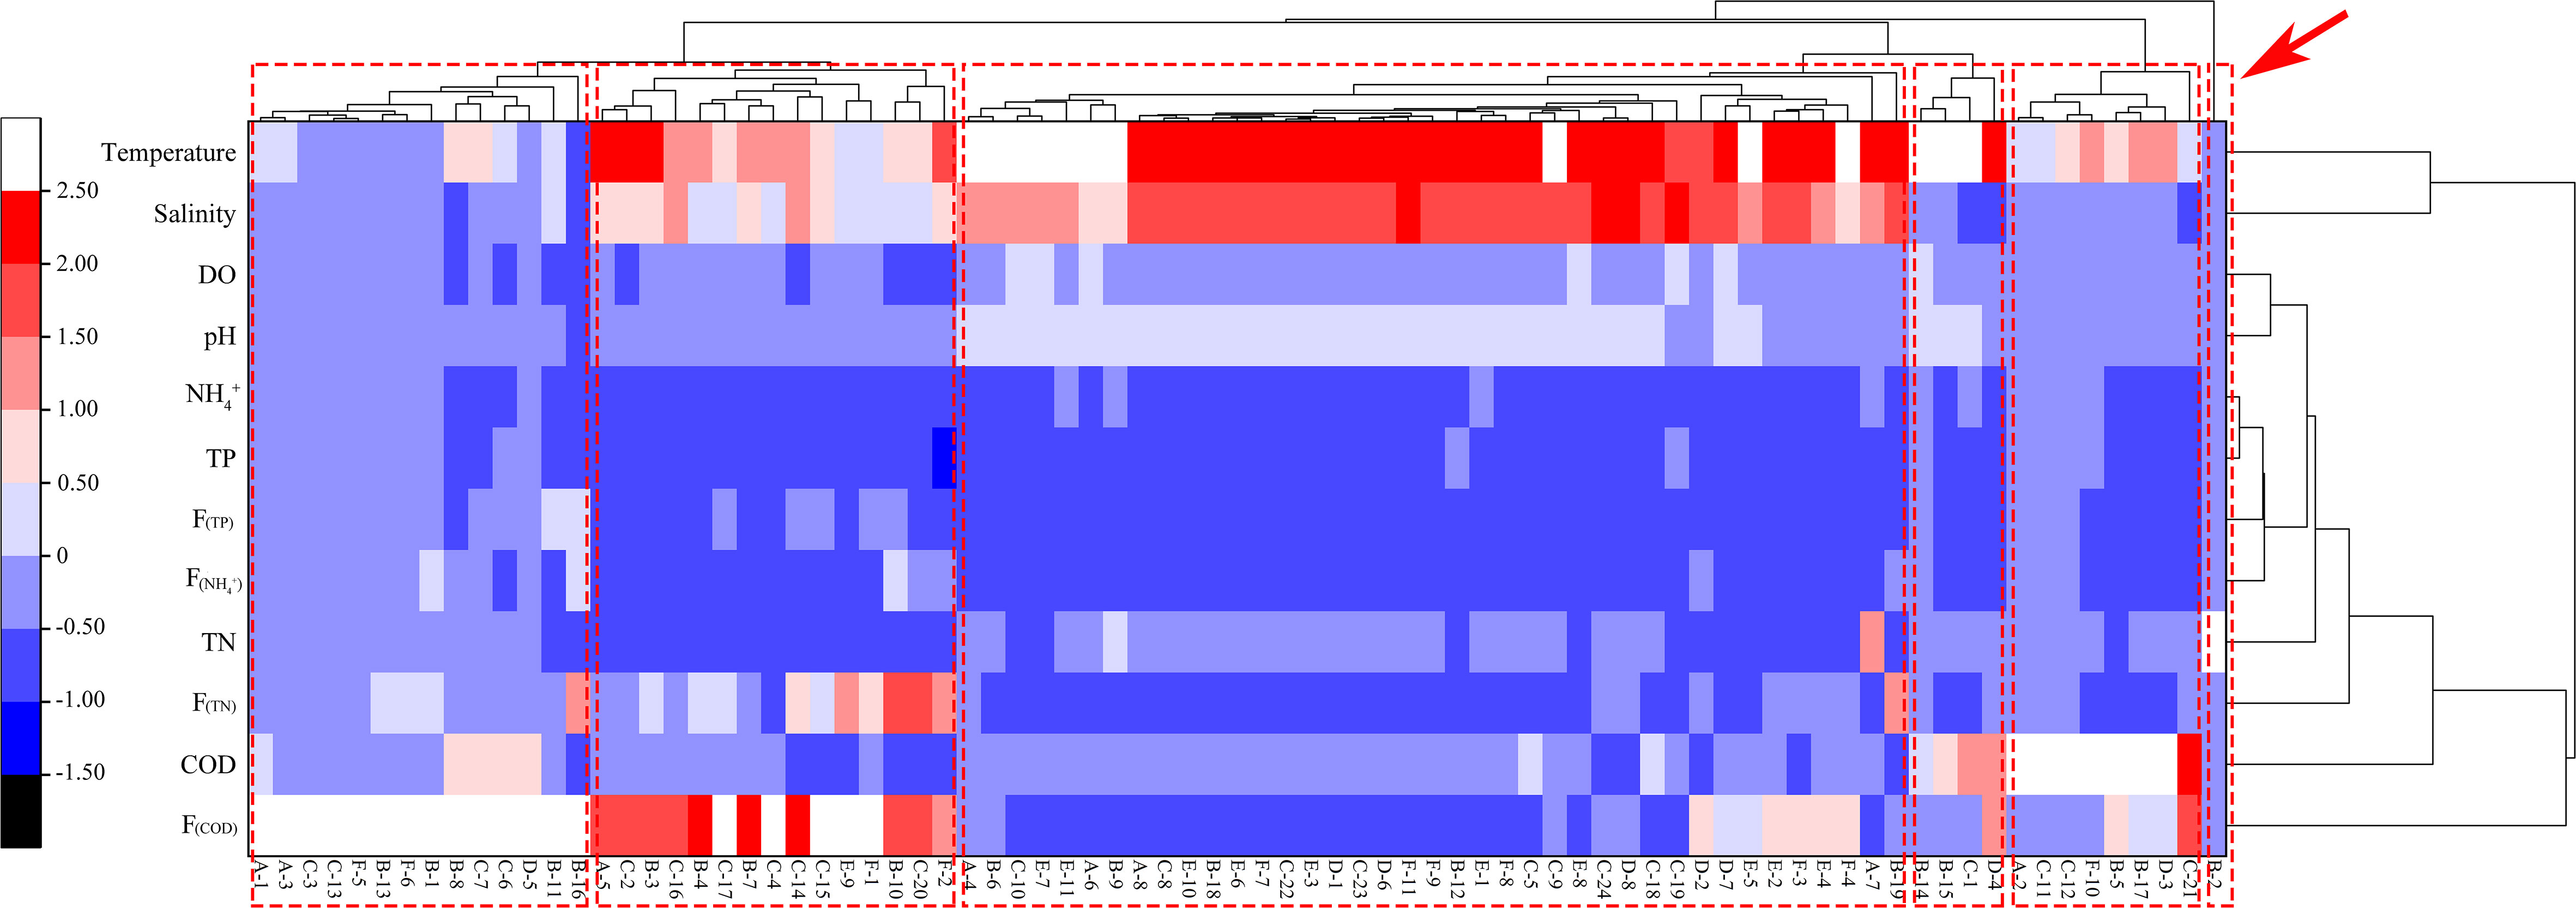
Figure 9 The Mondrian plot (inverse heat map) shows the land-sourced pollutants and environmental factors in 81 stations around Leizhou Peninsula.
3.5 Model validation and results
In the previous analysis, we found that the F(COD), F(TN) and F(TP) in Area B of the six receiving sea areas around the Leizhou Peninsula are much larger than those in other areas (Figure 6). The CNPI index and cluster analysis also show that there is a serious pollution station (B-2) in Area B (Figures 7, 9). Moreover, the PCA also indicates that B-1 and B-16 have a significant impact on Area B (Figure 8). Based on the above analysis, Area A, Area C, Area D, Area E, and Area F belong to open sea areas with fast flow velocity and fast metabolism, while Area B belongs to a semi-enclosed bay with fast economic development and severe pollution. Therefore, it is necessary to analyze the environmental capacity in Area B through a model.
It can be seen that the measured values and simulated values have a good fit in tidal level verification (S1: RMSE=0.26, r=0.98; S2: RMSE=0.19, r=0.99; C1: RMSE=0.07, r=0.68; TN: RMSE=0.07, r=0.93; TP: RMSE=0.016, r=0.97;COD: RMSE=0.08, r=0.95) (Figure 2). Overall, the errors in phase and amplitude are basically within a reasonable range, and the changes in simulated values and measured values tend to be consistent (Figures 2A, B). The measured and simulated values have a good fit in the verification of flow velocity and direction, and the changes between the simulated and measured values tend to be consistent (Figures 2C, D). It can be considered that they can reasonably reflect the characteristics of the tidal current field in Zhanjiang Bay. In this study, the concentration accuracy of the model in Zhanjiang Bay was verified by combining the COD, TN, and TP from the sampled data (Figures 2E-G). The variability of simulated values of COD, TN, and TP concentrations is generally consistent with the measured values.
3.6 Environmental capacity and remaining environmental capacity
Through calculation, a total of 6 sewage outlets have exceeded the environmental capacity of COD and TN, and 3 sewage outlets have exceeded the environmental capacity of TP. In the study, the response coefficients of B-1 and B-16 reach over 90%, so we only provide the figures of response coefficients and sharing rates in B-1 and B-16 (Figure 10).
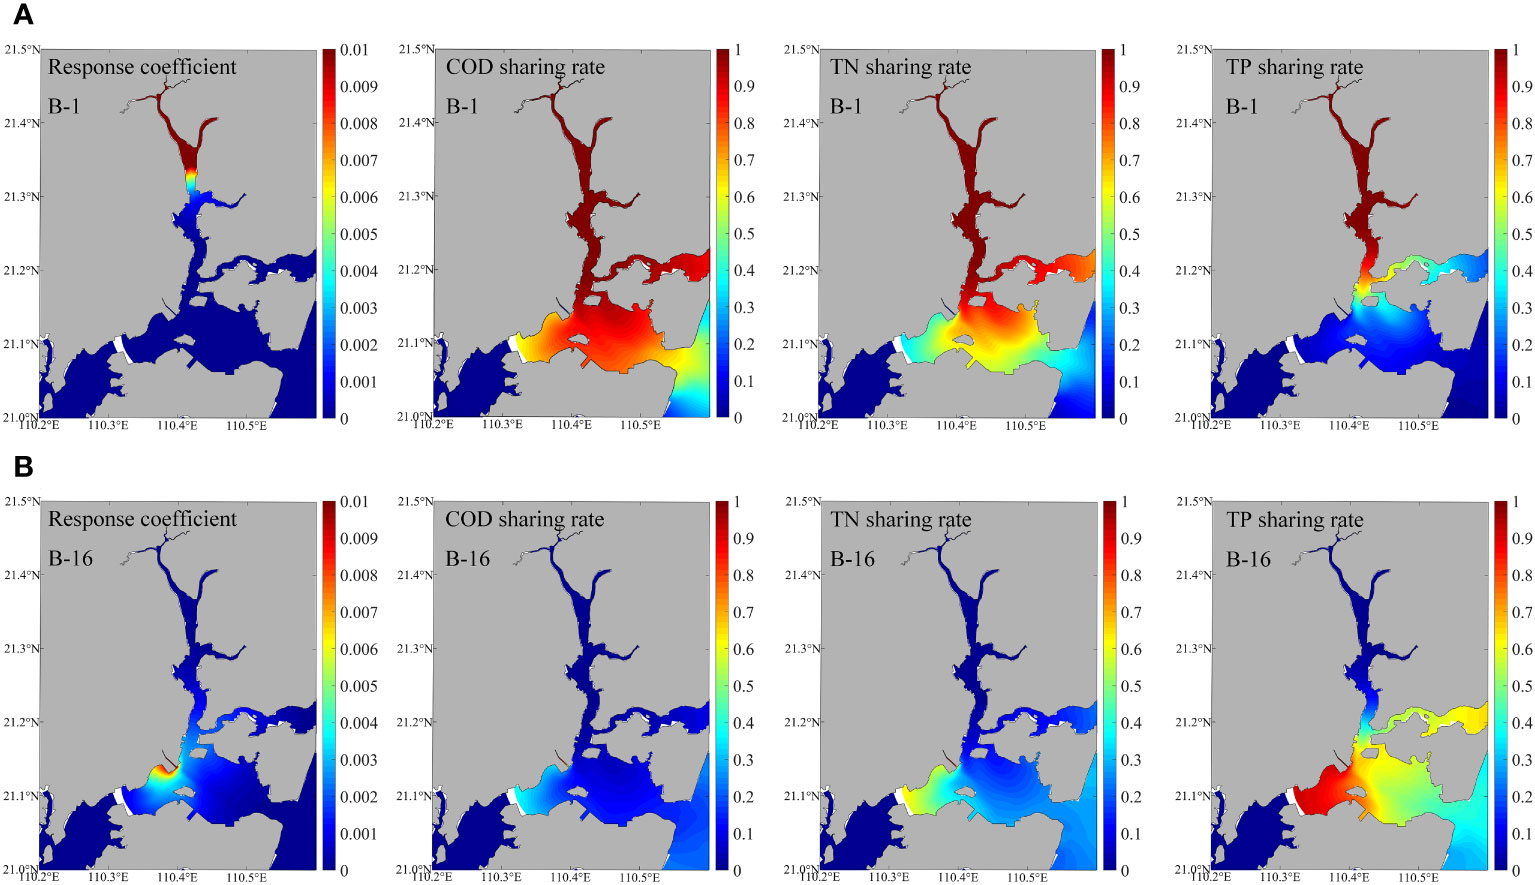
Figure 10 Response coefficient and land-sourced pollutants sharing rate in B-1 and B-16.
The response coefficient can reflect the quantitative relationship between the pollution source and the receiving water. The different dynamic environments in different sea areas cause the response coefficient to change with location, thus forming a response coefficient field. The response coefficient field is defined based on the equilibrium concentration field of land-sourced pollutants by each sewage outlets when discharged separately in a unit volume. The response coefficient field undergoes periodic changes under the influence of tides. In this study, COD, TN, and TP are regarded as conservative substances; that is, only the physical processes of hydrodynamic transport such as advection diffusion are considered, and biological chemical processes are not considered. Therefore, when the three pollutants are discharged with unit source intensity, the pollutant response coefficient fields formed are the same. From the sharing rate field of each sewage outlet, it can be seen that each sewage outlet has the greatest impact on the nearby sea area, and the impact gradually weakens as the distance from the pollution source increases. This also proves that the response coefficient field is related to the geographical location of sewage outlets because different geographical locations have different hydrodynamic environments. In areas with strong water mixing, the response coefficient of land-sourced pollutants has a wider impact, while the distribution area of high-value areas is smaller. On the contrary, in areas with weak water mixing, the range of land-sourced pollutants transport and diffusion is relatively small, which will generate a certain amount of land-sourced pollutants accumulation in the sea area near the sewage outlets.
The sharing rate refers to the percentage of the impact of each pollution source on the overall pollution of the sea area, which represents the contribution of each pollution source to the pollution of each spatial point in the sea area when it is actually discharged. Based on the statistics of 19 major sewage outfalls in Zhanjiang Bay, This study calculates the ratio of the concentration distribution field emitted by each pollution source alone to the concentration distribution field emitted by all pollution sources simultaneously. Overall, the sharing rate of the three pollutants generally decreases from the discharge point to the distance, with the highest sharing rate occurring in the waters near the sewage outfalls. In addition, due to the fact that the sharing rate is calculated using measured values, the pollutant fluxes in B-1 and B-16 are much greater than those at other sewage outfalls, making B-1 and B-16 with high and most widely distributed sharing rates in the Zhanjiang Bay. Near the sewage outlets with smaller pollutant discharge flux, the sharing rates of B-1 and B-16 can also be higher than 90%, indicating that the COD, TN, and TP of these two sewage outlets have an important impact on the entire sea area.
The environmental capacity of the sea area near a total of 6 sewage outlets has exceeded the standard, with B-1 and B-16 estuaries being the most severely exceeded (Table 5). The COD exceeded 2.5 × 10⁵ t/a at B-1 and 1.7 × 10³ t/a at B-16, respectively. The TN exceeded 4.5 × 10⁴ t/a at B-1 and 1.0 × 10³ t/a at B-16, respectively. The TP exceeded 1.7 × 10³ t/a at B-1 and 455 t/a at B-16, respectively. It was found that the areas with excessive environmental capacity in Zhanjiang Bay are mainly located at the top of the bay. The large flow rate and high concentration of pollutants at the B-1 and B-16 sewage outlets contribute to the majority of TN and TP in the Zhanjiang Bay, thereby also affecting the environmental capacity of other sewage outlets in the sea area. Therefore, it is necessary to focus on renovating these two sewage outlets in order to protect the seawater quality and environmentally sensitive areas in Zhanjiang Bay.
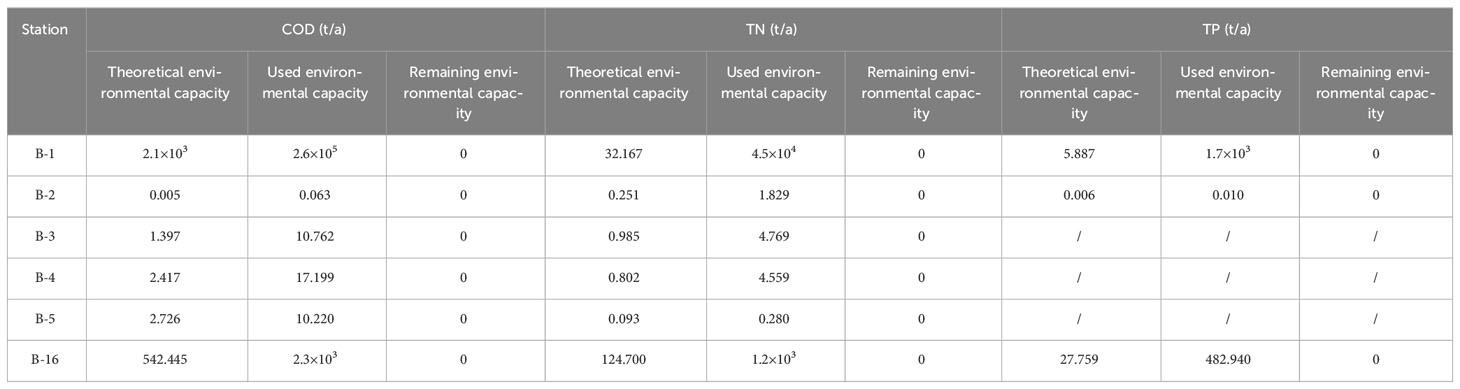
Table 5 The theoretical environmental capacity, remaining environmental capacity, and theoretical environmental capacity of sewage outlets with excessive environmental capacity.
3.7 The impact of land-sourced pollutants flux into the sea and environmental capacity of Zhanjiang Bay on seawater eutrophication
Eutrophication usually occurs in the transitional zone between terrestrial and aquatic ecosystems, such as coastal zones, bays, lakes, especially in areas that are strongly affected by human activities and have poor water exchange capacity, such as river estuaries. In nearshore waters, human activities can cause a sharp increase in eutrophic substances in seawater through various channels, such as the discharge of industrial wastewater, domestic sewage, and the inflow of agricultural fertilizers. Under certain conditions, nearshore eutrophication will also trigger marine disasters such as red tides, thereby endangering the marine ecological environment and coastal production and human health. In recent decades throughout the world, the increasing occurrence of phytoplankton blooms suggests an unsettling trend that has become a serious ecological issue (Liu et al., 2013; Mohamed, 2018). Eutrophication as a result of human-induced nutrient enrichment has become a concern in the Zhanjiang Bay.
The optimal ratio for phytoplankton to absorb nutrients is N: P=16:1 (Redfield et al., 1963). If the ratio of a certain nutrient in the water deviates from this ratio, it will potentially limit its growth. This ratio can reflect the nutritional status of the water environment, thereby better identifying the eutrophication status of the water environment and better controlling and managing the water environment. After analyzing our existing data, it was found that Zhanjiang Bay has generally been restricted by nitrogen in the past decade (Table 1). Although our calculations show that the pollutants in the upstream discharge outlets of the bay exceed the standard, including TN, TP, and COD, the actual impact of nitrogen emissions on eutrophication in Zhanjiang Bay may be negligible. At present, for eutrophication in Zhanjiang Bay, although the nitrogen and phosphorus environmental capacity exceeds the standard, it is still within the controllable range due to nitrogen limitations. Therefore, we found that simply controlling the nitrogen concentration in the area can effectively change the eutrophication situation in Zhanjiang Bay.
The self purification ability of water bodies varies in different water environments. Some sewage outlets with high discharge flux have limited impact on the environment due to their strong exchange capacity in the water or their distance from environmentally sensitive areas. In other cases, some sewage outlets with low discharge flux may have a significant impact on the local sea area due to their location in areas with weak water exchange capacity or high water quality requirements. Therefore, the discharge flux and location of sewage outlets play an important role. In future sewage outlets planning, it is necessary to comprehensively consider the local natural water environment, distribution of ecological functional areas, and policy planning requirements.
4 Conclusion
In this study, based on the water quality factors in the coastal waters of the Leizhou Peninsula, the spatial distribution and fluxes of land-sourced pollutants were analyzed and the pollution level of these sea areas was determined. In addition, using a modelling approach combined with measured values, environmental capacity was calculated in the Zhanjiang Bay. The following results were obtained:
(1) Although the average concentration of COD and NH4+ is not the highest in Area B, the F(COD), F(NH4+), F(TN), and F(TP) in Area B are the highest. F(COD) is at least 200 times larger than other areas; F(NH4+) is at least 1500 times larger than other areas; F(TN) is at least 500 times larger than other areas; F(TP) is at least 100 times larger than other areas.
(2) The CNPI index and cluster analysis showed that there was a serious pollution at B-2 in Area B. Moreover, the PCA also indicates that the station of B-1 and B-16 have a significant impact on Area B.
(3) There are 6 sewage outlets exceeding the environmental capacity of COD and TN and 3 sewage outlets exceeding the environmental capacity of TP. The stations of the environmental capacity exceeding the standard in Zhanjiang Bay are mainly located at the top of the bay.
(4) Although the pollutants in the upstream discharge outlets of the bay exceed the standard, including TN, TP, and COD, the actual impact of nitrogen emissions on eutrophication in Zhanjiang Bay may be negligible because Zhanjiang Bay has generally been restricted by nitrogen in the past decade.
Data availability statement
The original contributions presented in the study are included in the article/supplementary material. Further inquiries can be directed to the corresponding authors.
Author contributions
YC: Conceptualization, Formal Analysis, Methodology, Visualization, Writing – original draft, Writing – review & editing. YS: Conceptualization, Formal Analysis, Methodology, Visualization, Writing – original draft, Writing – review & editing. HS: Data curation, Methodology, Writing – review & editing. HG: Conceptualization, Funding acquisition, Supervision, Writing – review & editing. HZ: Conceptualization, Funding acquisition, Supervision, Writing – review & editing. KT: Supervision, Writing – review & editing. GP: Supervision, Writing – review & editing.
Funding
The author(s) declare financial support was received for the research, authorship, and/or publication of this article. The present research is supported by the National Natural Science Foundation of China (No. 42076162) and the project was supported by the Innovation Group Project of Southern Marine Science and Engineering Guangdong Laboratory (Zhuhai) (No. 311020004).
Conflict of interest
The authors declare that the research was conducted in the absence of any commercial or financial relationships that could be construed as a potential conflict of interest.
Publisher’s note
All claims expressed in this article are solely those of the authors and do not necessarily represent those of their affiliated organizations, or those of the publisher, the editors and the reviewers. Any product that may be evaluated in this article, or claim that may be made by its manufacturer, is not guaranteed or endorsed by the publisher.
References
Andersen J. H., Carstensen J., Conley D. J., Dromph K., Lehtinen V. F., Gustafsson B. G., et al. (2017). Long-term temporal and spatial trends in eutrophication status of the Baltic Sea. Biol. Rev. 92, 135–149. doi: 10.1111/brv.12221
Bui L. T., Pham H. T. H. (2023). Linking hydrological, hydraulic and water quality models for river water environmental capacity assessment. Sci. Total Environment 857, 159490. doi: 10.1016/j.scitotenv.2022.159490
Chen X., Wang Y., Cai Z., Zhang M., Ye C. (2020). Response of the nitrogen load and its driving forces in estuarine water to dam construction in Taihu Lake, China. Environ. Sci. pollut. Res. 27, 31458–31467. doi: 10.1007/s11356-020-09454-0
Chen Y., Cheng W., Zhang H., Qiao J., Liu J., Shi Z., et al. (2019). Evaluation of the total maximum allocated load of dissolved inorganic nitrogen using a watershed–coastal ocean coupled model. Sci. Total Environment 673, 734–749. doi: 10.1016/j.scitotenv.2019.04.036
Dou M., Ma J. X., Li G. Q., Zuo Q. (2015). Measurement and assessment of water resources carrying capacity in Henan Province, China. Water Sci. Eng. 8 (2), 12. doi: 10.1016/j.wse.2015.04.007
Egbert G. D., Erofeeva S. Y. (2002). Efficient inverse modeling of barotropic ocean tides. J. Atmospheric Oceanic Technol. 19, 183–204. doi: 10.1175/1520-0426(2002)019<0183:EIMOBO>2.0.CO;2
Gimenez Y., Giussani G. (2018). Searching for the core variables in principal components analysis. Braz. J. Probability Statistics 32 (4), 730–754. doi: 10.48550/arXiv.1308.6626
Gong Y., Zhang C., Sun X., Zhang Y., Shi Y., Xie Q., et al. (2012). Community characteristics of phytoplankton in the coastal area of Leizhou Peninsula and their relationships with primary environmental factors in the summer of 2010. Acta Ecol. Sinica 32, 5972–5985. doi: 10.0.22.214/stxb201109011280
Guo L. (2005). A Study on the Bohai Sea in Environmental Capacity of Petroleum Hydrocarbon (China: Ocean University of China).
Han H., Li K., Wang X., Shi X., Qiao X., Liu J. (2011). Environmental capacity of nitrogen and phosphorus pollutions in Jiaozhou Bay, China: Modeling and assessing. Mar. pollut. Bull. 63, 262–266. doi: 10.1016/j.marpolbul.2010.12.017
Huang X. P., Huang L. M., Yue W. Z. (2003). The characteristics of nutrients and eutrophication in the Pearl River estuary, South China. Mar. pollut. Bull. 47, 30–36. doi: 10.1016/S0025-326X(02)00474-5
Ji X., Dahlgren R. A., Zhang M. (2016). Comparison of seven water quality assessment methods for the characterization and management of highly impaired river systems. Environ. Monit. Assessment 188, 15. doi: 10.1007/s10661-015-5016-2
Jia Z., Cai Y., Chen Y., Zeng W. (2018). Regionalization of water environmental carrying capacity for supporting the sustainable water resources management and development in China. Resources Conserv. Recycling 134, 282–293. doi: 10.1016/j.resconrec.2018.03.030
Jiang T., Song W., Fang X. (1991). Physical self-cleaning capacity in the southwest of Laizhou Bay. Mar. Sci. Bull., 53–79.
Kalnejais L. H., Martin W. R., Bothner M. H. (2010). The release of dissolved nutrients and metals from coastal sediments due to resuspension. Mar. Chem. 121, 224–235. doi: 10.1016/j.marchem.2010.05.002
Kang P., Xu L. (2012). Water environmental carrying capacity assessment of an industrial park. Proc. Environ. Sci. 13, 879–890. doi: 10.1016/j.proenv.2012.01.082
Kemp W. M., Testa J. M., Conley D. J., Gilbert J. D., Hagy J. D. (2009). Temporal responses of coastal hypoxia to nutrient loading and physical controls. Biogeosciences; 6, 2985–3008. doi: 10.5194/bg-6-2985-2009
Krom M., Hornung H., Cohen Y. (1990). Determination of the environmental capacity of Haifa Bay with respect to the input of mercury. Mar. pollut. Bull. 21, 349–354. doi: 10.1016/0025-326X(90)90798-D
Lei G., Zhang Y., Pan D., Fu D. Y. (2016). Parameter selection and model research on remote sensing evaluation for nearshore water quality. Acta Oceanol. Sin. 35, 114–117. doi: 10.1007/s13131-016-0802-4
Le Moal M., Gascuel-Odoux C., Ménesguen A., Souchon Y., Etrillard C., Levain A., et al. (2019). Eutrophication: A new wine in an old bottle? Sci. Total Environment 651, 1–11. doi: 10.1016/j.scitotenv.2018.09.139
Li S., Li H., Xia J. (2005). Dapeng bay water environment capacity analysis on the base of delft 3D model. Res. Environ. Sci. 18 (5) 91–95. doi: 10.13198/j.res.2005.05.93.lisw.023
Liu R. X., Kuang J., Gong Q., Hou X. L. (2003). Principal component regression analysis with SPSS. Comput. Methods Programs Biomed. 71, 141–147. doi: 10.1016/S0169-2607(02)00058-5
Liu L., Zhou J., Zheng B., Cai W., Lin K., Tang J. (2013). Temporal and spatial distribution of red tide outbreaks in the Yangtze River Estuary and adjacent waters, China. Mar. pollut. Bull. 72, 213–221. doi: 10.1016/j.marpolbul.2013.04.002
Mironov O., Kiryukhina L., Kucherenko M. (1975). Self-purification in the coastal area of the Black Sea. Naukova Dumka Kiev (USSR) 143, 1975.
Mohamed Z. A. (2018). Potentially harmful microalgae and algal blooms in the Red Sea: Current knowledge and research needs. Mar. Environ. Res. 140, 234–242. doi: 10.1016/j.marenvres.2018.06.019
National Marine Environmental Monitoring Center (2007). The specification for marine monitoring - Part 4: Seawater analysis (GB17378.4–2007) (China: Standards Press of China).
Redfield A. C., Ketchum B. H., Richards F. A. (1963). The influence of organisms on the composition of sea-water. Sea.
Song D. (1999). Pollution control in the seto inland sea of Japan from the 1970s to the 1980s. J. Japan Stud. Forum, 23–29.
State environmental protection administration (2002). Surface water quality standard: GB 3838-2002 (Beijing: China Environmental Science Press).
Sun L. (2020). Research on the changes and mechanisms of marine environmental capacity in haizhou bay from 2006 to 2016. Nanjing Normal University. doi: 10.27245/d.cnki.gnjsu.2020.000001
Van der Wulp S. A., Damar A., Ladwig N., Hesse K. J. (2016). Numerical simulations of river discharges, nutrient flux and nutrient dispersal in Jakarta Bay, Indonesia. Mar. pollut. Bull. 110, 675–685. doi: 10.1016/j.marpolbul.2016.05.015
Wang Y., Liu D., Xiao W., Zhou P., Tian C., Zhang C., et al. (2021). Coastal eutrophication in China: Trend, sources, and ecological effects. Harmful Algae 107, 102058. doi: 10.1016/j.hal.2021.102058
Wang S., Xu L., Yang F., Wang H. (2014). Assessment of water ecological carrying capacity under the two policies in Tieling City on the basis of the integrated system dynamics model. Sci. Total Environment 472, 1070–1081. doi: 10.1016/j.scitotenv.2013.11.115
Wang X., Zhao Q., Zhao S. (2012). Research progress on marine environmental capacity and total amount control of marine pollutant. Mar. Environ. Sci. 31, 765–769. doi: 10.1007/s11783-011-0280-z
Wei S., Fu D., Wang D., Yu G., Luo Y., Xu H. (2023). Tracer study of CDOM for nitrogen and phosphorus pollution in the offshore Leizhou Peninsula, China. Ecol. Indicators 148, 110019. doi: 10.1016/j.ecolind.2023.110019
Woo-Jeung C., Na G. H., Young-Yell C., Chung-Kill P. (1991). Self-purification capacity of eutrophic buk bay by DO mass balance. Korea J. Herbol. 24 (1).
Wu G., Cao W., Wang F., Su X., Yan Y., Guan Q. (2019). Riverine nutrient fluxes and environmental effects on China's estuaries. Sci. Total Environment 661, 130–137. doi: 10.1016/j.scitotenv.2019.01.120
Wu J., Hui X., Jian C. (2009). Towards understanding hierarchical clustering: A data distribution perspective. Neurocomputing 72, 2319–2330. doi: 10.1016/j.neucom.2008.12.011
Xu M., Chua V. P. (2017). A numerical study on land-based pollutant transport in Singapore coastal waters with a coupled hydrologic-hydrodynamic model. J. Hydro-environment Res. 14, 119–142. doi: 10.1016/J.JHER.2016.09.002
Yamamoto T., Nadaoka K. (2018). Analyzing coastal turbidity under complex terrestrial loads characterized by a 'stress connectivity matrix' with an atmosphere-watershed-coastal ocean coupled model. Estuarine Coast. Shelf Sci. 203, 44–58. doi: 10.1016/j.ecss.2018.01.025
Yang J. (2001). The theory and practice of implementing total pollutant emission control in coastal waters. Mar. Inf., 24–26.
Yang L., Lu W., Huang H., Chu H. (2012). Application of improved nemerow pollution exponential method and fuzzy comprehensive evaluation method used in water quality assessment. Water Resour. Power 30, 41–44.
Yang F., Wei Q., Chen H., Yao Q. (2018). Long-term variations and influence factors of nutrients in the western North Yellow Sea, China. Mar. pollut. Bull. 135, 1026–1034. doi: 10.1016/j.marpolbul.2018.08.034
Yu C., Huang X., Chen H., Godfray H. C. J., Wright J. S., Hall J. W., et al. (2019). Managing nitrogen to restore water quality in China. Nature; 567, 516–520. doi: 10.1038/s41586-019-1001-1
Yuan Q., Xu Z. Y., Peng H. Q., Lu J. M., Huang L. C., Liang X. J., et al. (2016). Research on nitrogen and phosphorus variation trend in Zhanjiang harbor and its near waters in recent five years. J. Green Sci. Technol. 24, 41–45. doi: 10.16663/j.cnki.lskj.2016.24.016
Zhang P., Dai P. D., Zhang J. B., Li J. X., Zhao H., Song Z. G. (2021). Spatiotemporal variation, speciation, and transport flux of TDP in Leizhou Peninsula coastal waters, South China Sea. Mar. pollut. Bull. 167, 112284. doi: 10.1016/j.marpolbul.2021.112284
Zhang X., Sun Y. (2007). Study on the environmental capacity in Jiaozhou Bay. Mar. Environ. Sci. 26 (4), 347–350+359. doi: 10.1002/cem.1038
Zhang Z., Sun W., Zhou Y. (2008). Quantitatively assessment of eco-environmental vulnerability in tropic coastal arid area: A case study of Leizhou Peninsula. J. Desert Res. 28 (01), 125–130.
Keywords: Leizhou Peninsula, Zhanjiang Bay, land-sourced pollutants, Delft 3D, environmental capacity
Citation: Chen Y, Sun Y, Shi H, Zhao H, Gao H, Pan G and Tian K (2023) Environmental capacity and fluxes of land-sourced pollutants around the Leizhou Peninsula in the summer. Front. Mar. Sci. 10:1280753. doi: 10.3389/fmars.2023.1280753
Received: 21 August 2023; Accepted: 09 October 2023;
Published: 25 October 2023.
Edited by:
Dilip Kumar Jha, National Institute of Ocean Technology, IndiaReviewed by:
Shrikant D. Khandare, National Institute of Ocean Technology, IndiaNithyanandam Marimuthu, Zoological Survey of India, India
Vikas Pandey, Council of Scientific and Industrial Research (CSIR), India
Copyright © 2023 Chen, Sun, Shi, Zhao, Gao, Pan and Tian. This is an open-access article distributed under the terms of the Creative Commons Attribution License (CC BY). The use, distribution or reproduction in other forums is permitted, provided the original author(s) and the copyright owner(s) are credited and that the original publication in this journal is cited, in accordance with accepted academic practice. No use, distribution or reproduction is permitted which does not comply with these terms.
*Correspondence: Hui Zhao, aHVpemhhbzE5NzhAMTYzLmNvbQ==; Hui Gao, aHVpZ2FvMTA5QDE2My5jb20=
†These authors share first authorship