- 1Institute of Marine Sciences, Middle East Technical University, Erdemli-Mersin, Türkiye
- 2Department of Physical Oceanography and Instrumentation, Leibniz Institute for Baltic Sea Research Warnemünde, Rostock, Germany
The Sea of Marmara, located in Northwestern Türkiye, is under multiple stressors, including climate change and industrial, agricultural, and domestic pollution, that cause deoxygenation in coastal waters, with multiregional consequences affecting the surface and deep-water masses transported to the Mediterranean and Black Seas, respectively, via its straits. With climate-change driven changes in the intensity of extreme precipitation events, the marine environment becomes more vulnerable to increasing terrestrial pollutants. Evaluating the spatial and temporal variation of river runoff is crucial to understanding the interaction between the geophysical and hydrogeochemical processes that affects the nutrient balance of the sea. This study aims to (i) explore the historical (for the period 1960-2021) and spatial changes of monthly-averaged coastal discharges along the coastline of the Sea of Marmara for the first time, based on observations from the national hydrological service; (ii) analyze the change in long-term and seasonal trends of runoff and net-precipitation rate and derive a regional relation between the two parameters. Single Spectrum Analysis (SSA) is used to obtain the trends. Gaps in the time series are filled in using a non-parametric spectral estimation method. Discharges from the northern, eastern, and southern basins are, respectively, 3%, 17%, and 80% of the total discharge, which has varied between 1.5 and 15 km3 per year in the last decade, with short-lived extremes occurring in early spring. Total runoff rate shows a declining long-term trend that is accelerating with increasing evaporation. The intensity of the terrestrial precipitation extremes shows a temporal increase; there is a quadratic relation between the long-term trends of net precipitation and total runoff. Quantification of nutrient load distribution along the coastline associated with the spatial-temporal changes in coastal fluxes is urgent because the cumulative stressors (warming, nutrient overenrichment, pollutants) pose a threat of triggering extreme events and eutrophication in the Sea of Marmara with multiregional impact.
1 Introduction
The Sea of Marmara is an intercontinental inland sea that connects the Black Sea to the Aegean Sea through the long and narrow Turkish Strait System (TSS). The TSS consists of the Bosphorus and Dardanelles straits, located at the northeast and southwest of the Sea of Marmara, respectively. The TSS carries the brackish surface waters of the Black Sea (form due to precipitation and runoff exceeding evaporation) to the Aegean Sea and the deep saltier waters of the Mediterranean Sea (form due to excessive evaporation over freshwater input) that flow as an undercurrent to the Black Sea, exchanging waters with significant density differences and maintaining a sharp halocline over the Sea of Marmara (Unluata et al., 1990; Besiktepe et al., 1994) where two-layer estuarine dynamics prevail. The well-oxygenated Mediterranean waters entering from the Dardanelles, partially compensate for the oxygen consumed in the lower layer of the Sea of Marmara, due to the organic matter degrading and sinking from the upper layer; yet the lower layer of the basin remains deficient in oxygen (Besiktepe et al., 1994).
Urban and industrial wastes due to dense population along the coastline, agricultural activities (Ediger et al., 2016), and maritime traffic (Birpinar et al., 2006) adversely affect the Sea of Marmara. Excessive organic matter and nutrient loads carried by the wastes are discharged directly into the sea or indirectly via rivers without adequate treatment, causing a decrease in seawater oxygen concentrations. In addition to these loads originating from its coastal watersheds, the Sea of Marmara has been subject to the adverse effects of the high nutrient loads coming from the Black Sea, particularly the pollutants of the Danube River. Despite the decreasing nutrient loads of the Danube River in recent years (Cozzi et al., 2018; Grizzetti et al., 2021), the decreasing oxygen levels in the Sea of Marmara (depleting below the halocline in its eastern basin) are alarming (CSIDB, ODTU-DBE, 2021). This points to the changes in the nutrient export ratios due to increases in terrestrial loads during the floods, resulting in ecological changes in the system. The sea-snot formation observed in recent years in the Sea of Marmara is an ecological response to multiple stresses on the system. Such sea-snot formations have been observed worldwide: continental coastal waters of the North Sea (Lancelot, 1995), Mediterranean Sea (e.g., Adriatic and Tyrrhenian Seas; Alldredge and Crocker, 1995; Danovaro et al., 2009), Ariake Sound Estuary, Japan (Fukao et al., 2009); these outbreaks are linked to nutrient concentration changes in seawater due to anthropogenic pressures from human activities and warming climate (Jackson, 2008). Climate change exacerbates stresses on the marine environment, transforming clear and productive coastal waters into anoxic dead zones, and microbially dominated ecosystems, with rates of change becoming increasingly fast and nonlinear with sudden phase shifts (Jackson, 2008).
Climate change also poses a threat to the Sea of Marmara and its coastal watersheds, with observations showing a significant increase in sea surface temperature and salinity trends (Latif et al., 2022). A change in hydrological conditions in the coastal watersheds due to climate change (Uniyal et al., 2015) is also expected, including the terrestrial evaporation rate, soil moisture, water temperature, and streamflow volume, timing, intensity, and frequency (Arnell et al., 2016; Otto, 2019).
These multiple stresses change the hydrochemical and biological characteristics not only in the Sea of Marmara but also in the TSS by modifying the transport rates from the Black Sea to the Aegean and Mediterranean Seas, and vice versa. Previous studies approximated the volume fluxes entering the Sea of Marmara via the Dardanelles and Bosphorus Straits as 550 km3 yr-1 and 650 km3 yr-1, respectively (Unluata et al., 1990; Besiktepe et al., 1994), which increase in spring and early summer and weaken in autumn (Tugrul et al., 2002). Recent observations show reduced inflow rates from the Black and Mediterranean seas, e.g., 444 km3 yr-1and 456 km3 yr-1, respectively (Özsoy and Altıok, 2016), suggesting a change in the water balance of the system.
For these reasons, determining the total amount of coastal discharges to the Sea of Marmara, its seasonal change, and its spatial variation along the coastline are of great importance. Analyzing the change in long-term and seasonal trends of coastal discharges is crucial to understanding the effects of climate change and pollutants on system dynamics. This way, the amount of nutrient load and toxic material discharged to the sea by these rivers can also be identified. However, studies on the Sea of Marmara rivers are few and mostly focus on the major rivers. Algan (2006) emphasized the importance of the major rivers (e.g., Kocasu/Cross, Biga, and Gonen located in the southern watersheds) in transporting suspended sediment loads. By using multidimensional scaling for all the Turkish stream flows, Yildiz et al. (2018) recently showed that there has been a seasonal shift in flowrates over the last four decades due to climate change. This necessitates detailed regional studies on coastal discharges in relation to climate change. Moreover, such studies should consider all the coastal discharges regardless of the magnitude of the flowrates because even small creek flows may have a significant effect on the coastal zone (Basdurak et al., 2020).
Based on the aforementioned knowledge gap, the aim of this study is twofold: (1) to determine the river runoff to the Sea of Marmara and to explore its spatial variation along the coastline; (2) to explore the changes in long-term and seasonal trends of monthly river runoff with respect to climate change. This is achieved by using the observational dataset of stream flows for the period 1960-2021. Because the number of gaging stations and their operational periods vary in time, coastal discharge rates are calculated using the datasets from different operational stations (i.e., single station near the coast or multiple stations located on the tributaries merging to the mainstem); this entailed using a dynamic algorithm. In addressing the second aim, relations between the net terrestrial precipitation rate and streamflow rates are found. The gaps in time series are filled by using a non-parametric spectral estimation method, to predict the variability of the missing data. To split the seasonal and long-term contributions of flowrates, precipitation and evaporation rates, SSA algorithms are used.
2 Materials and methods
2.1 Study area
The surface area of the Sea of Marmara is approximately 11,500 km2 (Unluata et al., 1990). The continental shelf narrows towards the north, and the bathymetry drastically deepens with three topographical depressions (~1250 m, Figure 1). The southern bathymetry is relatively shallow, with depths varying between 50-100 m. The average elevation of the drainage basins is 500 m. Topographic highs of the Anatolian drainage basins increase south-eastward, reaching the peak altitude of 2,540 m (Uludag Mountain). The average elevation of the drainage basins in Thrace is 120 m with topographic highs mostly less than 600 m except for the Isiklar Mountain (Figure 1).
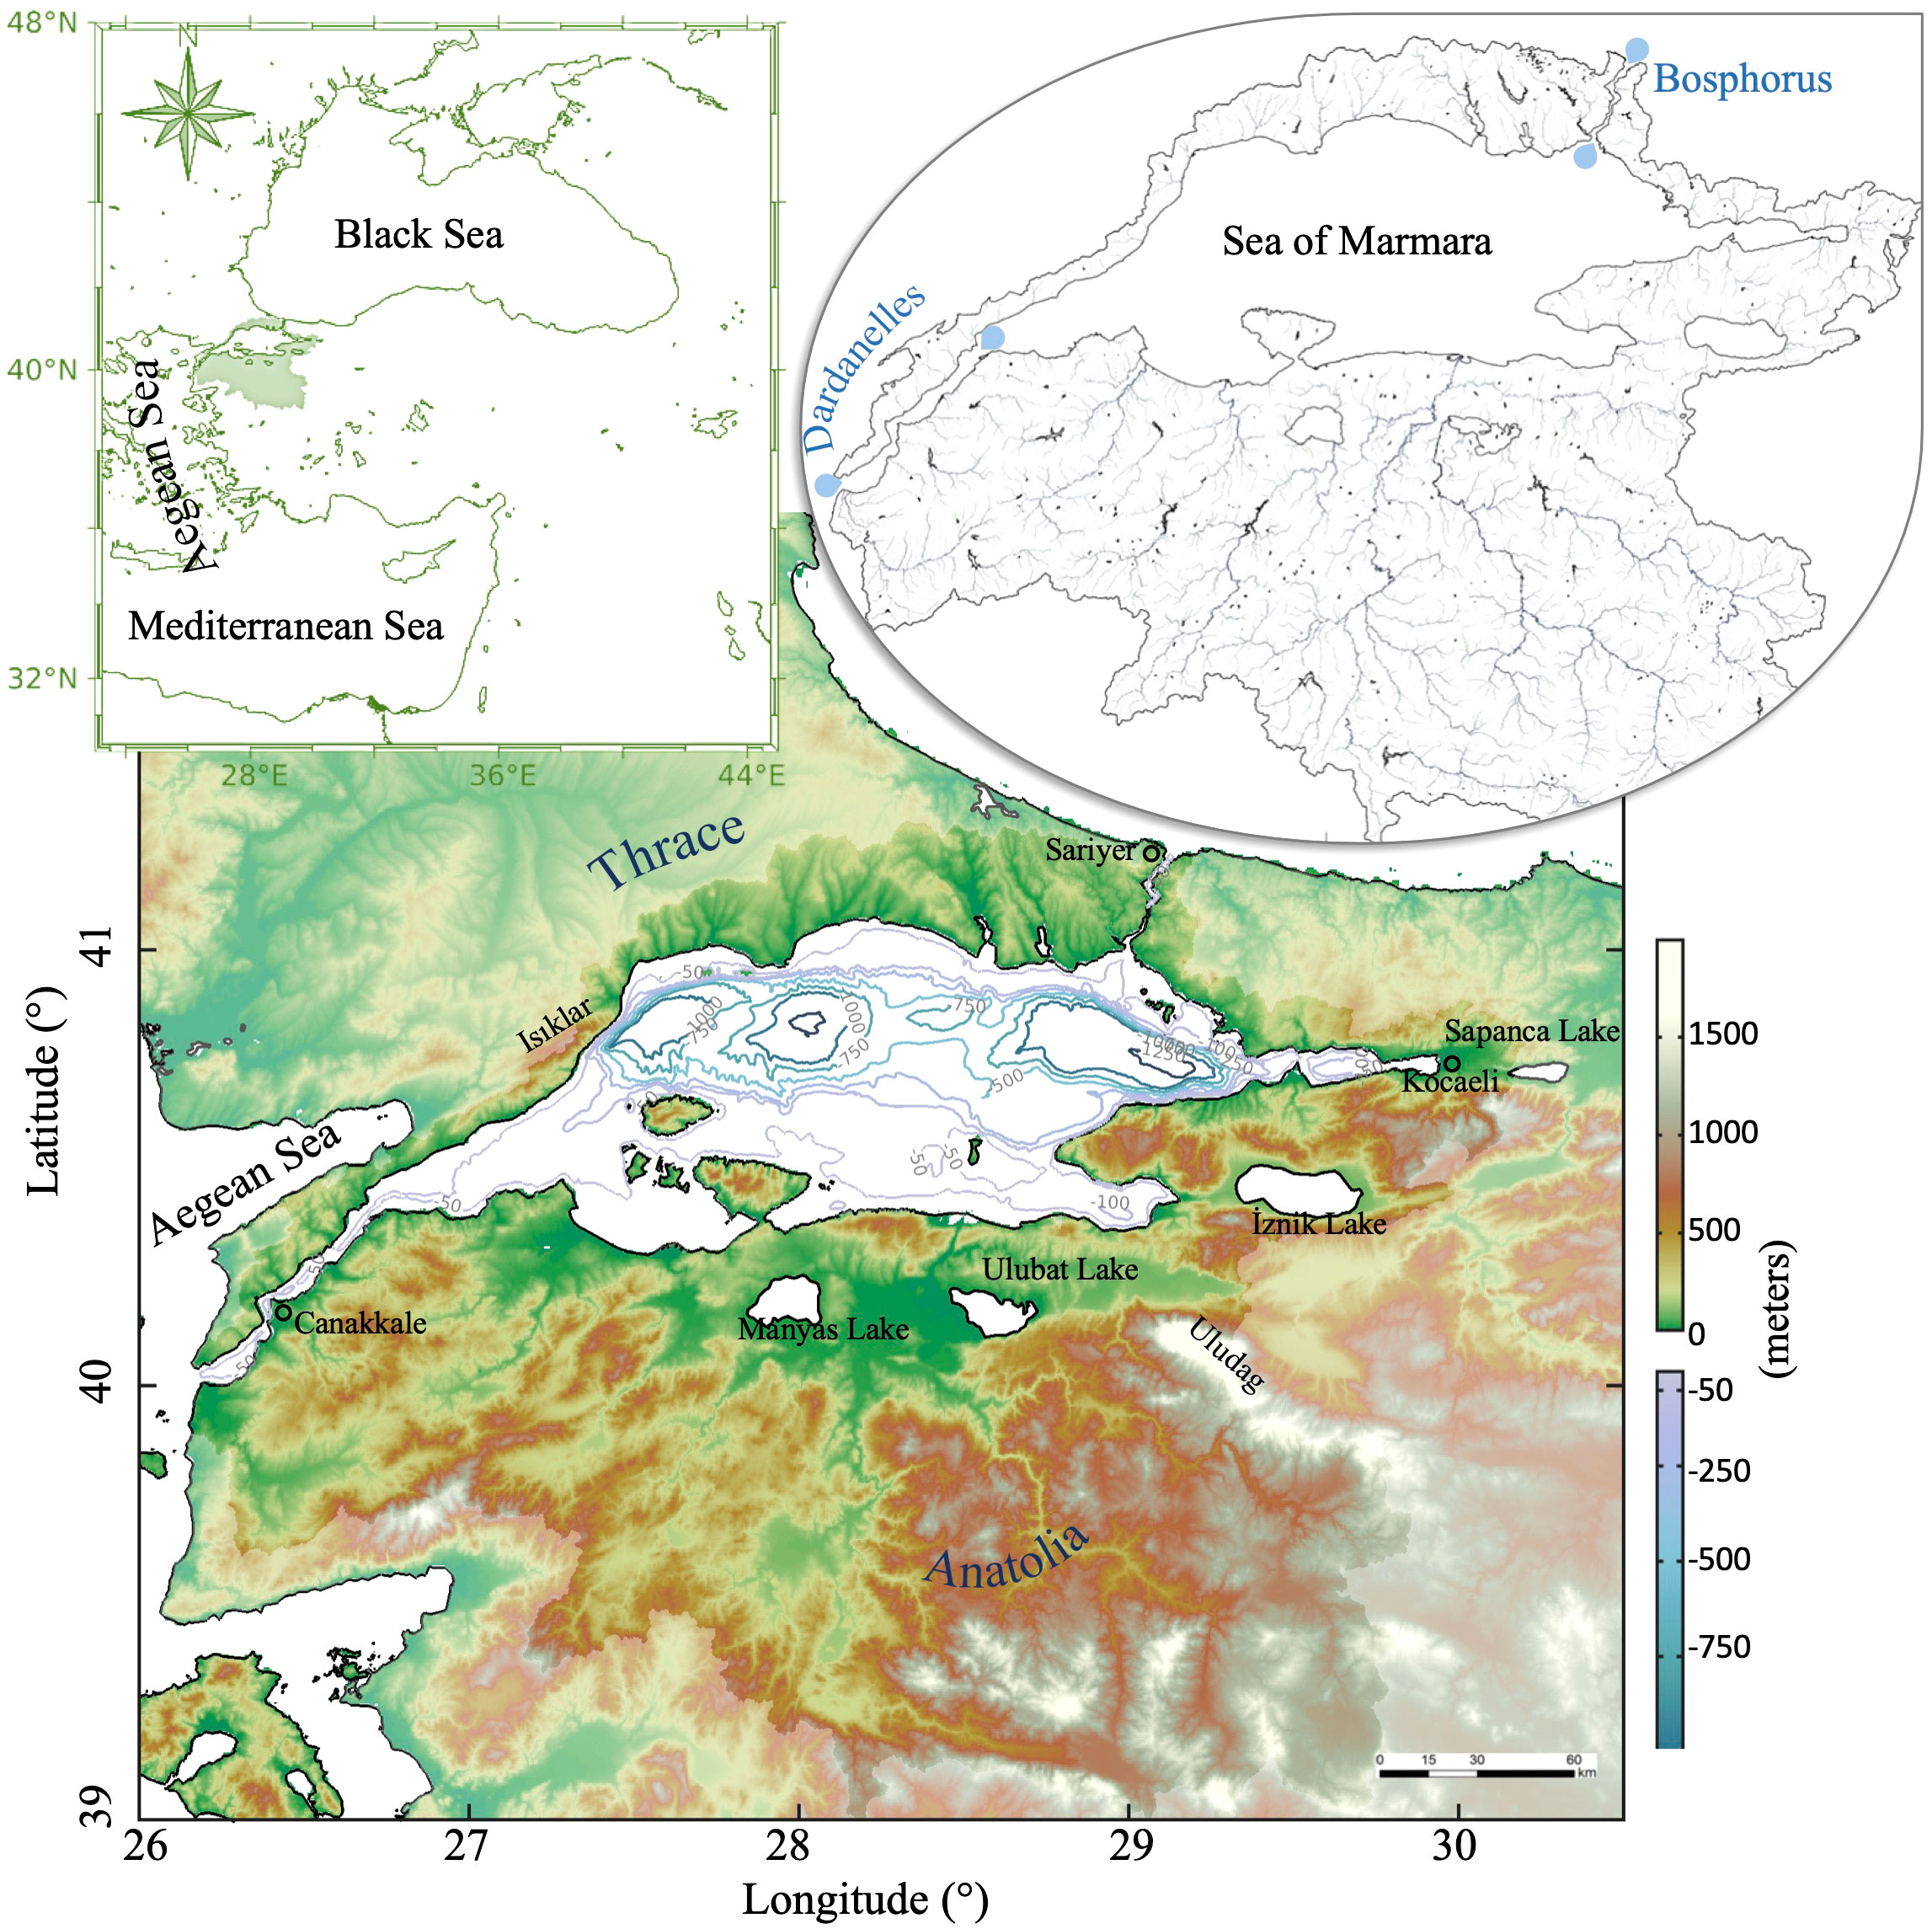
Figure 1 Topographic map of the Marmara Region with bathymetry of the Sea of Marmara drawn as line contours. The watershed of the Marmara Sea is shown in a darker shade, denoting its boundary. Top-left inset: Map of the study area; top-right inset: Terrestrial water bodies of the watershed (25 m resolution, EU-HYDRO). The circles denote the chosen meteorological stations.
Terrestrial freshwater discharges into the Sea of Marmara through stream networks and surface runoff following topographic slopes. Terrestrial freshwater input seasonally varies with precipitation and melting snow on topographic highs, affecting the transport of nutrient loads to the coast. Intense and irregular rainfall patterns cause floods in riverbeds with continuous flow and carry some of the terrestrial precipitation to the sea through the creeks, some of which are seasonally dry (Kömüşcü and Çelik, 2013). During periods of heavy rainfall, in addition to the terrestrial freshwater input, the Danube River pouring into the Black Sea mixes and propagates along the Bosphorus Strait, affecting the surface layers of the Sea of Marmara (Besiktepe et al., 1994).
The biggest lakes in the area (namely, Manyas, Ulubat, and Iznik) are located in the southern and southeastern parts of the coast. Streams leaving the Manyas and Ulubat lakes, along with the Simav and Nilufer rivers merge and form the biggest river and the largest delta in the region, the Kocasu/Cross River and Kocasu Delta (Figure 2). Kocasu Delta consists of seasonal lagoons and marshes that are prone to landward flows of seawater due to sea level changes (Irtem and Sacın, 2012). When the sea level drops, the Kocasu River transports and deposits sediments on the southern shelf (Sorlien et al., 2012).
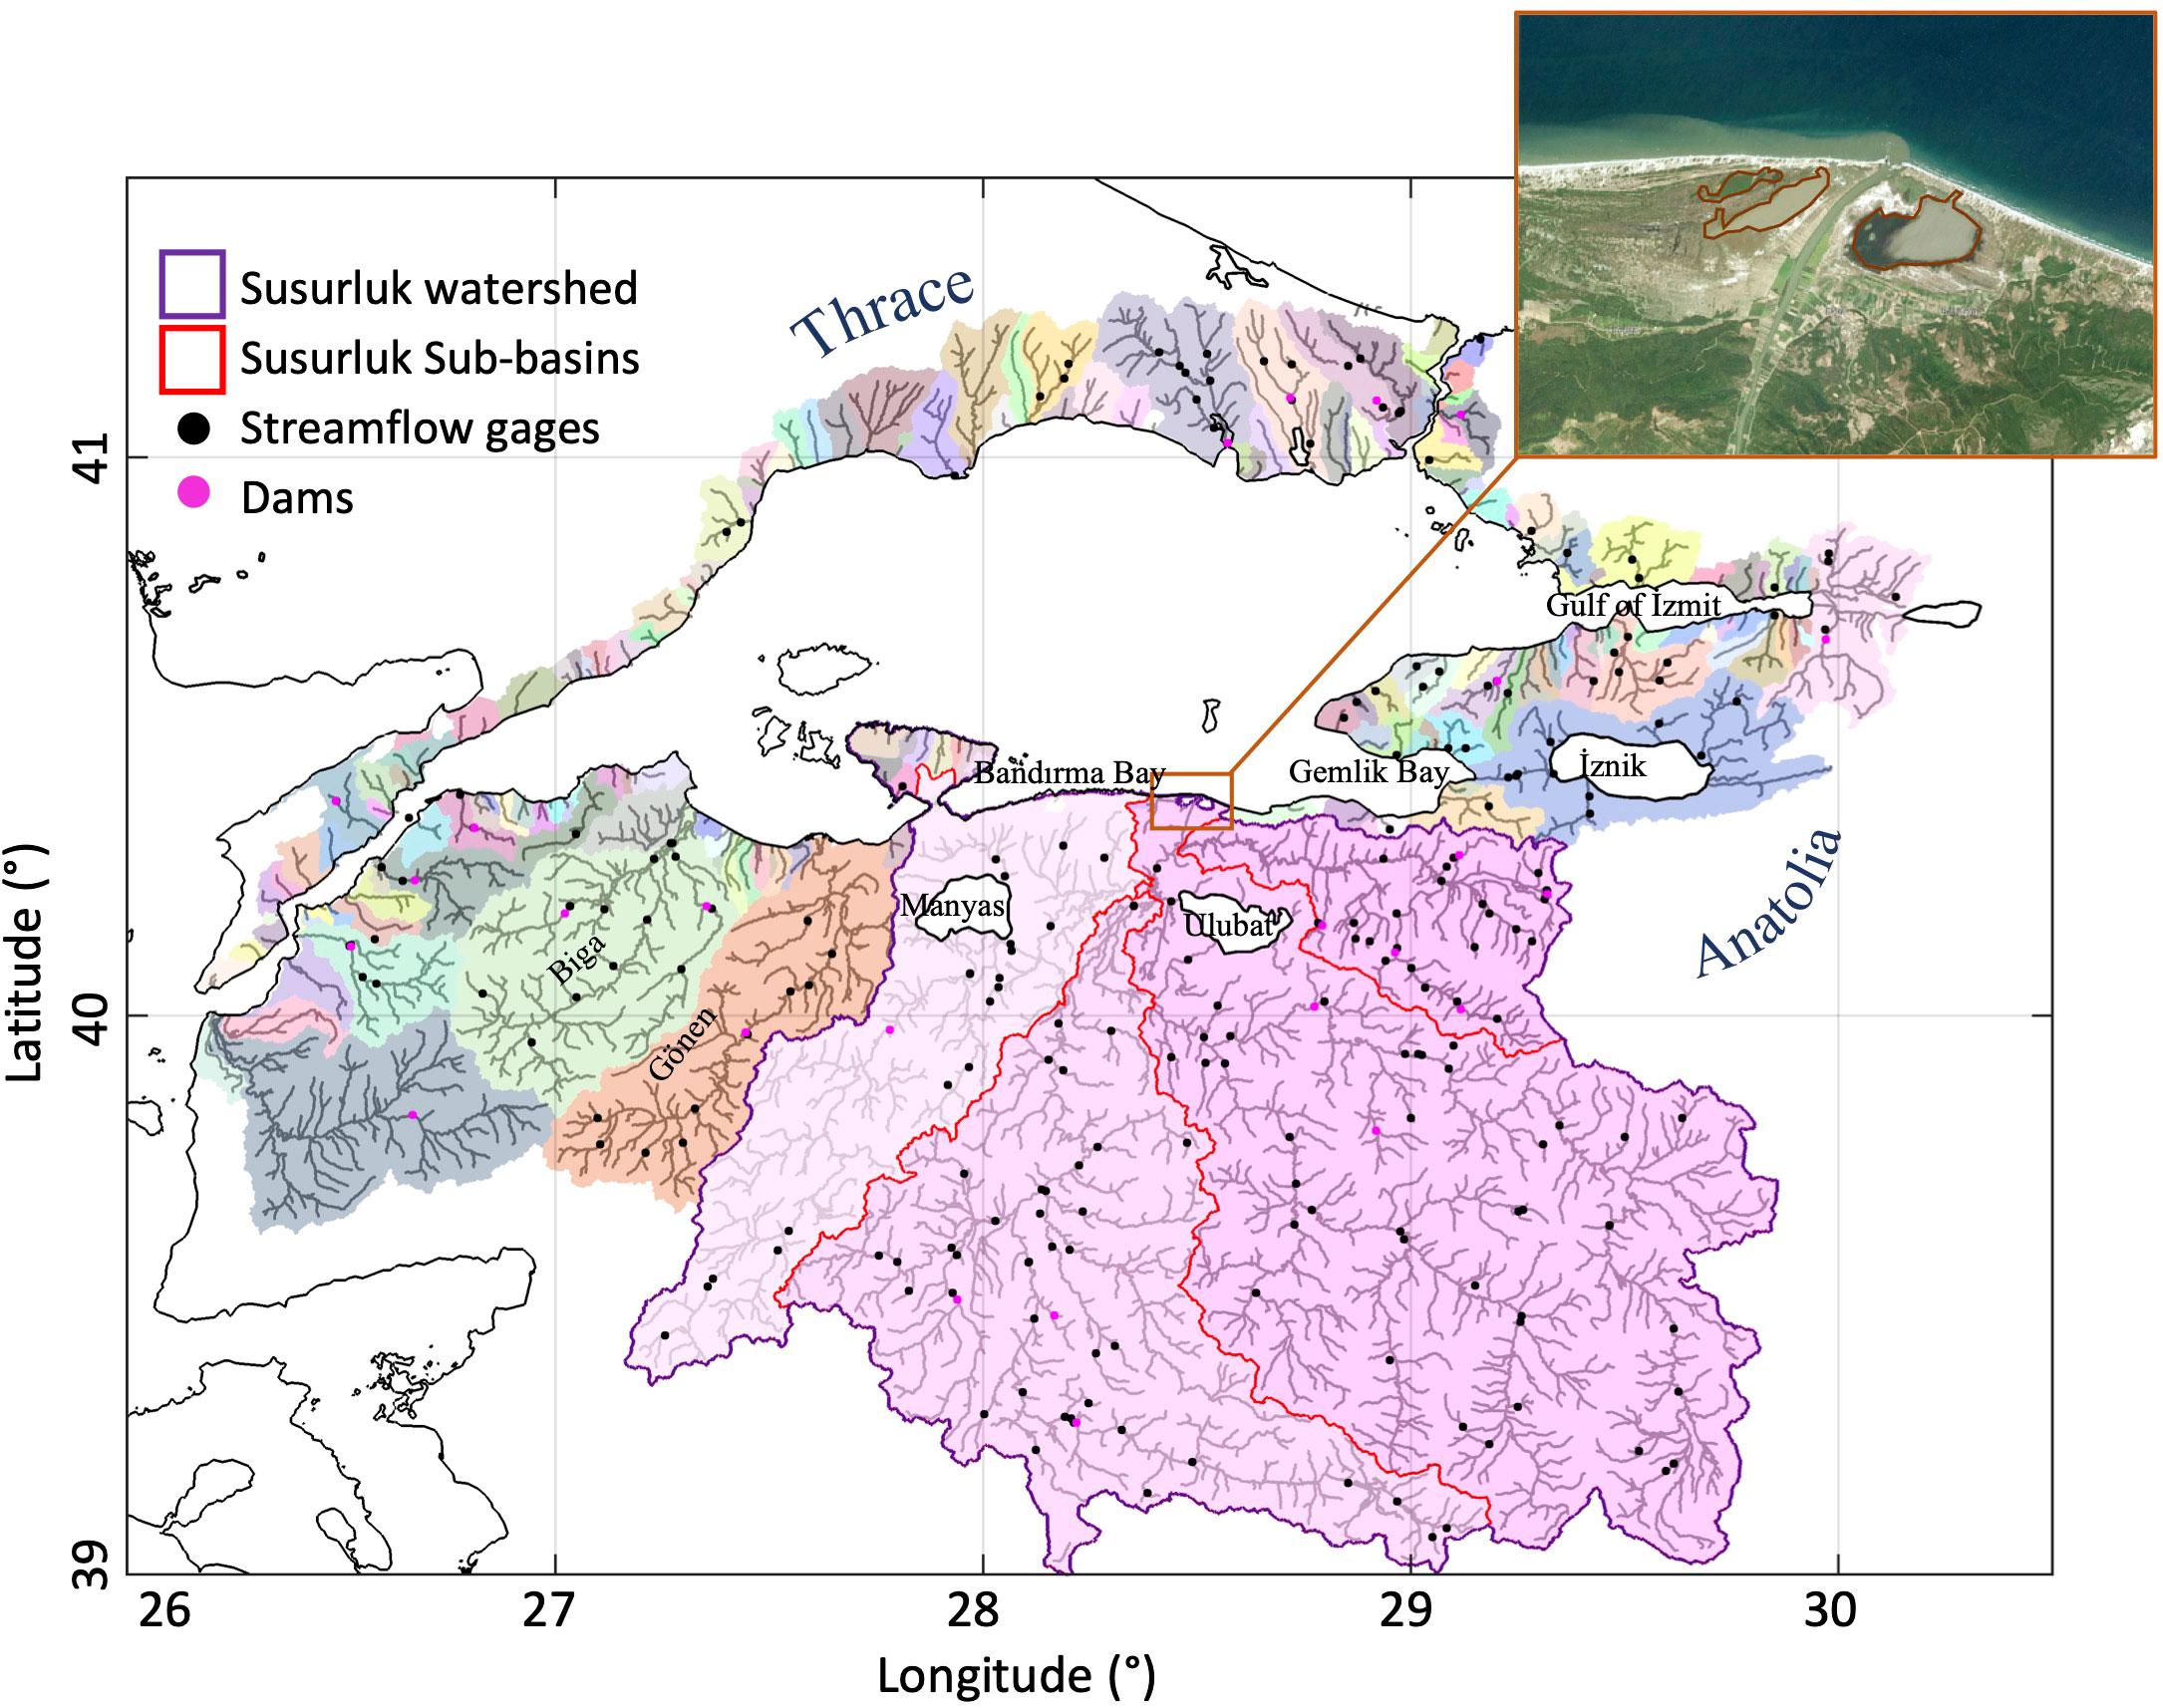
Figure 2 Watersheds of the Sea of Marmara. Each watershed is shown in different color. Rivers of the watersheds are shown as black, thin lines. Boundary of the Susurluk basin and its sub-basins are shown in purple, and the boundaries of the sub-basins are shown in red. Black and pink icons indicate streamgages nearby the river network and dam locations, respectively. Top right: satellite image of the Kocasu delta (European Image Mosaics 2012, ESA) with the seasonal boundaries of its three lagoons contoured.
Geological diversity of a watershed is important in terms of hydraulic conductivity and surface runoff coefficients (e.g., highly permeable alluvial and clastic sedimentary rocks in contrast to metamorphic rocks), particularly during heavy rainfall, which affects the intensity of flood events. The geological structure of the water basins of the Sea of Marmara is very diverse along the coast; it mostly consists of terrestrial clastic in Thrace, carbonate and clastic (sedimentary rocks) and volcanic rocks on the eastern side of the coast in Anatolia from the Bosphorus Strait to Iznik, and metamorphic rocks in the south from Iznik to the Canakkale Strait. (MTA, 2002). The Southern Marmara region is mostly covered with fine Quaternary, alluvial and fluvial deposits (Kazanci et al., 1999) with alluvial areas between the lakes and the coastline. From Manyas and Ulubat lakes towards the coast, the Susurluk basin (Figure 2) is characterized by alluvial areas, sedimentary rocks, metamorphic rocks (schist, phyllite, and marble) and alluvial wetlands (Kocasu Delta), respectively.
2.2 Data and methods
Structure of a basin is an important factor in determining the intensity of the in-basin freshwater circulation and the amount of water discharged to the coast. The river and valley networks of the Marmara region and its neighboring basins were determined using the 25 m scaled basin database, the European Digital Elevation Model (EUDEM v.1.1) and the European River Network (EU-HYDRO v.1.3). Basins with rivers flowing to the Sea of Marmara were chosen, and the river network within each of these basins was grouped (Figure 2). River mouths along the coastline were shown in Figure 3A (red marker). The high-resolution basin and river network database was used to calculate the contribution to coastal discharges from both gaged streams and ungaged, relatively small basins.
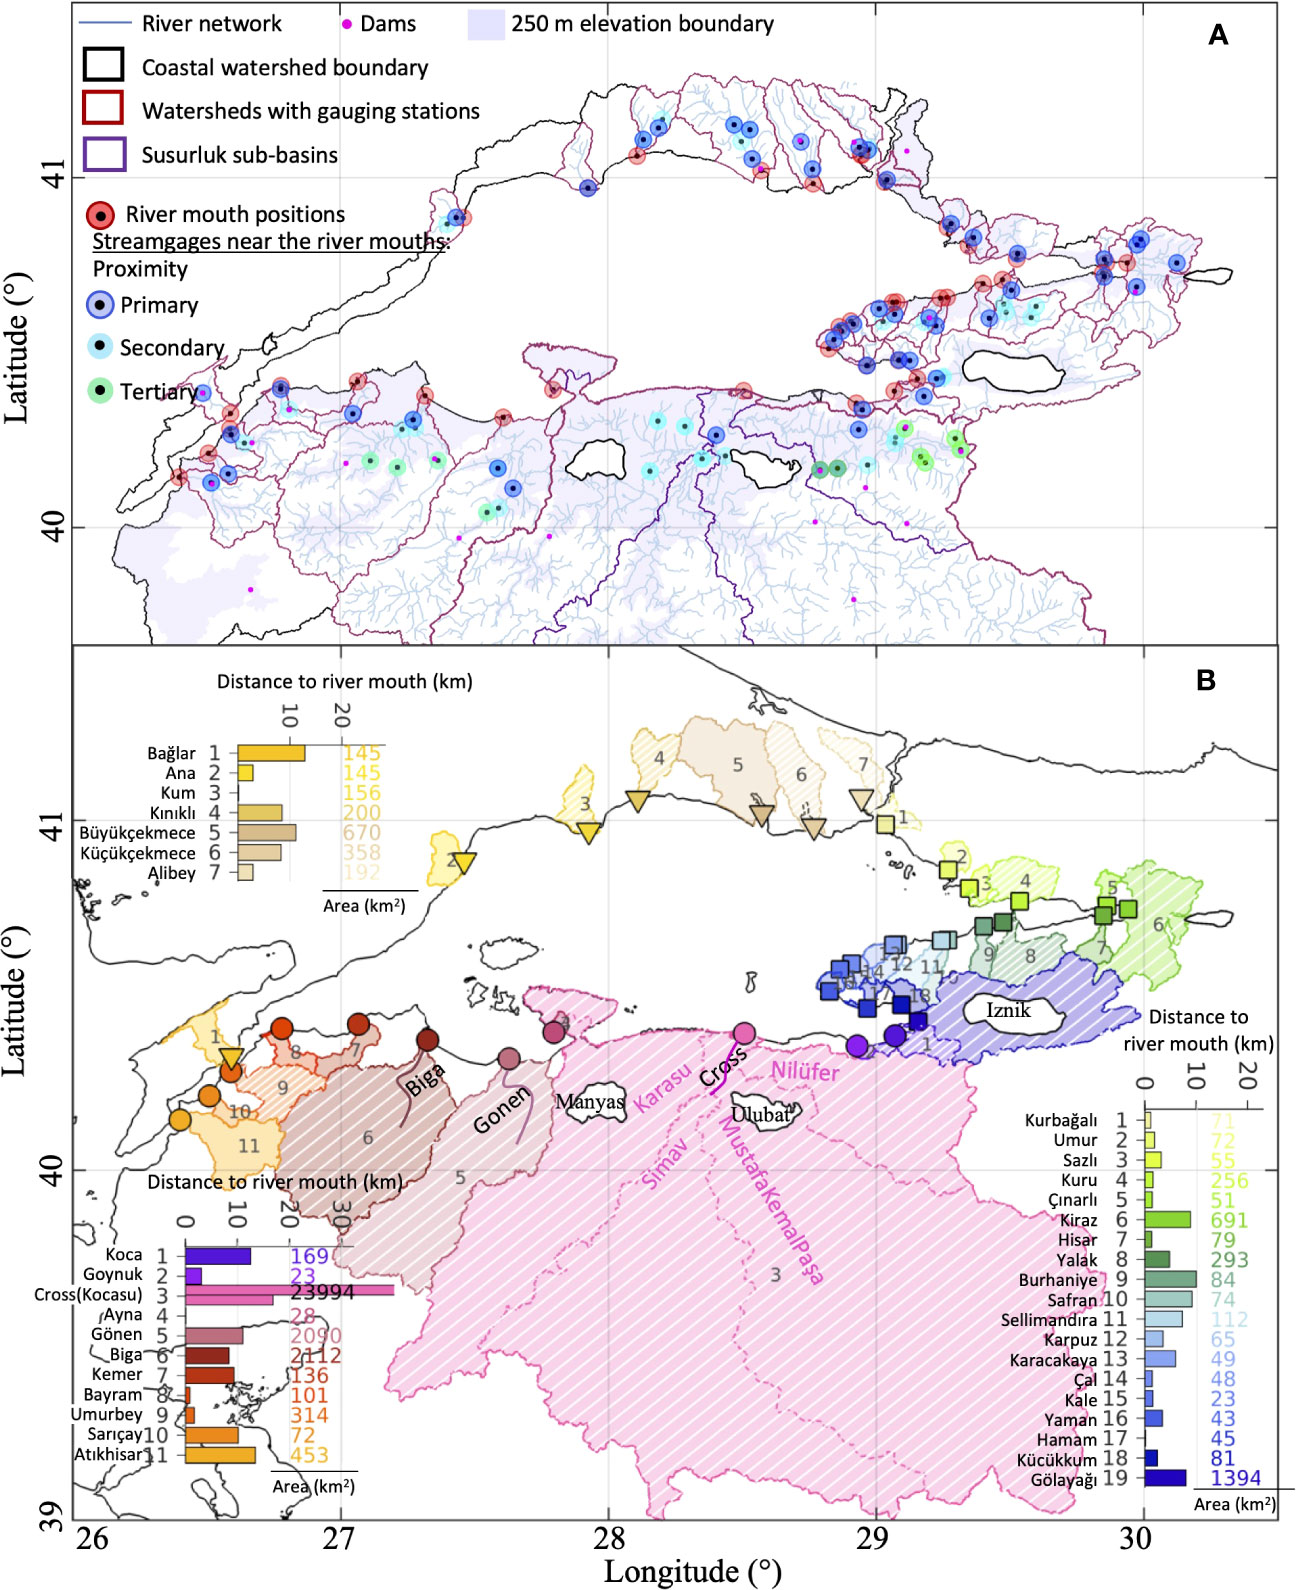
Figure 3 (A) Locations of the river mouths and the stream gages. For each watershed, alternative gage combinations on or near the river tributaries are grouped (shown with blue, light blue and green markers) based on their proximity to river mouth. These combinations are used to reduce the gap in streamflow timeseries, due to the yearly difference in operation periods at each station (station names and their operating dates are shown in Appendix A). (B) Gaged watersheds in the northern, eastern, and southern regions are grouped (and numbered clockwise within each group) and the related river mouth positions are marked by triangles, squares, and round circles, respectively. Hatched watersheds denote the sensitive zones. River names, average gage-to-river-mouth distances, and watershed areas are listed; parameters for the Susurluk basin (pink area) are shown twice, i.e., including and excluding the Nilufer sub-basin.
Based on the aforementioned topographical and geological similarities near the coast, the watersheds of the Sea of Marmara were separated regionally into three groups, and the individual contributions from each group were investigated. These groups are: northern watersheds in Thrace, including the sub-basins of the straits in Europe; southern (e.g., Biga, Gonen, and Susurluk) and eastern (e.g., around the Gulfs of Gemlik and Izmit) watersheds with Anatolian sub-basins of the Dardanelles and Bosphorus straits, respectively (Figure 2).
2.2.1 Stream flows: gaged and ungaged rivers
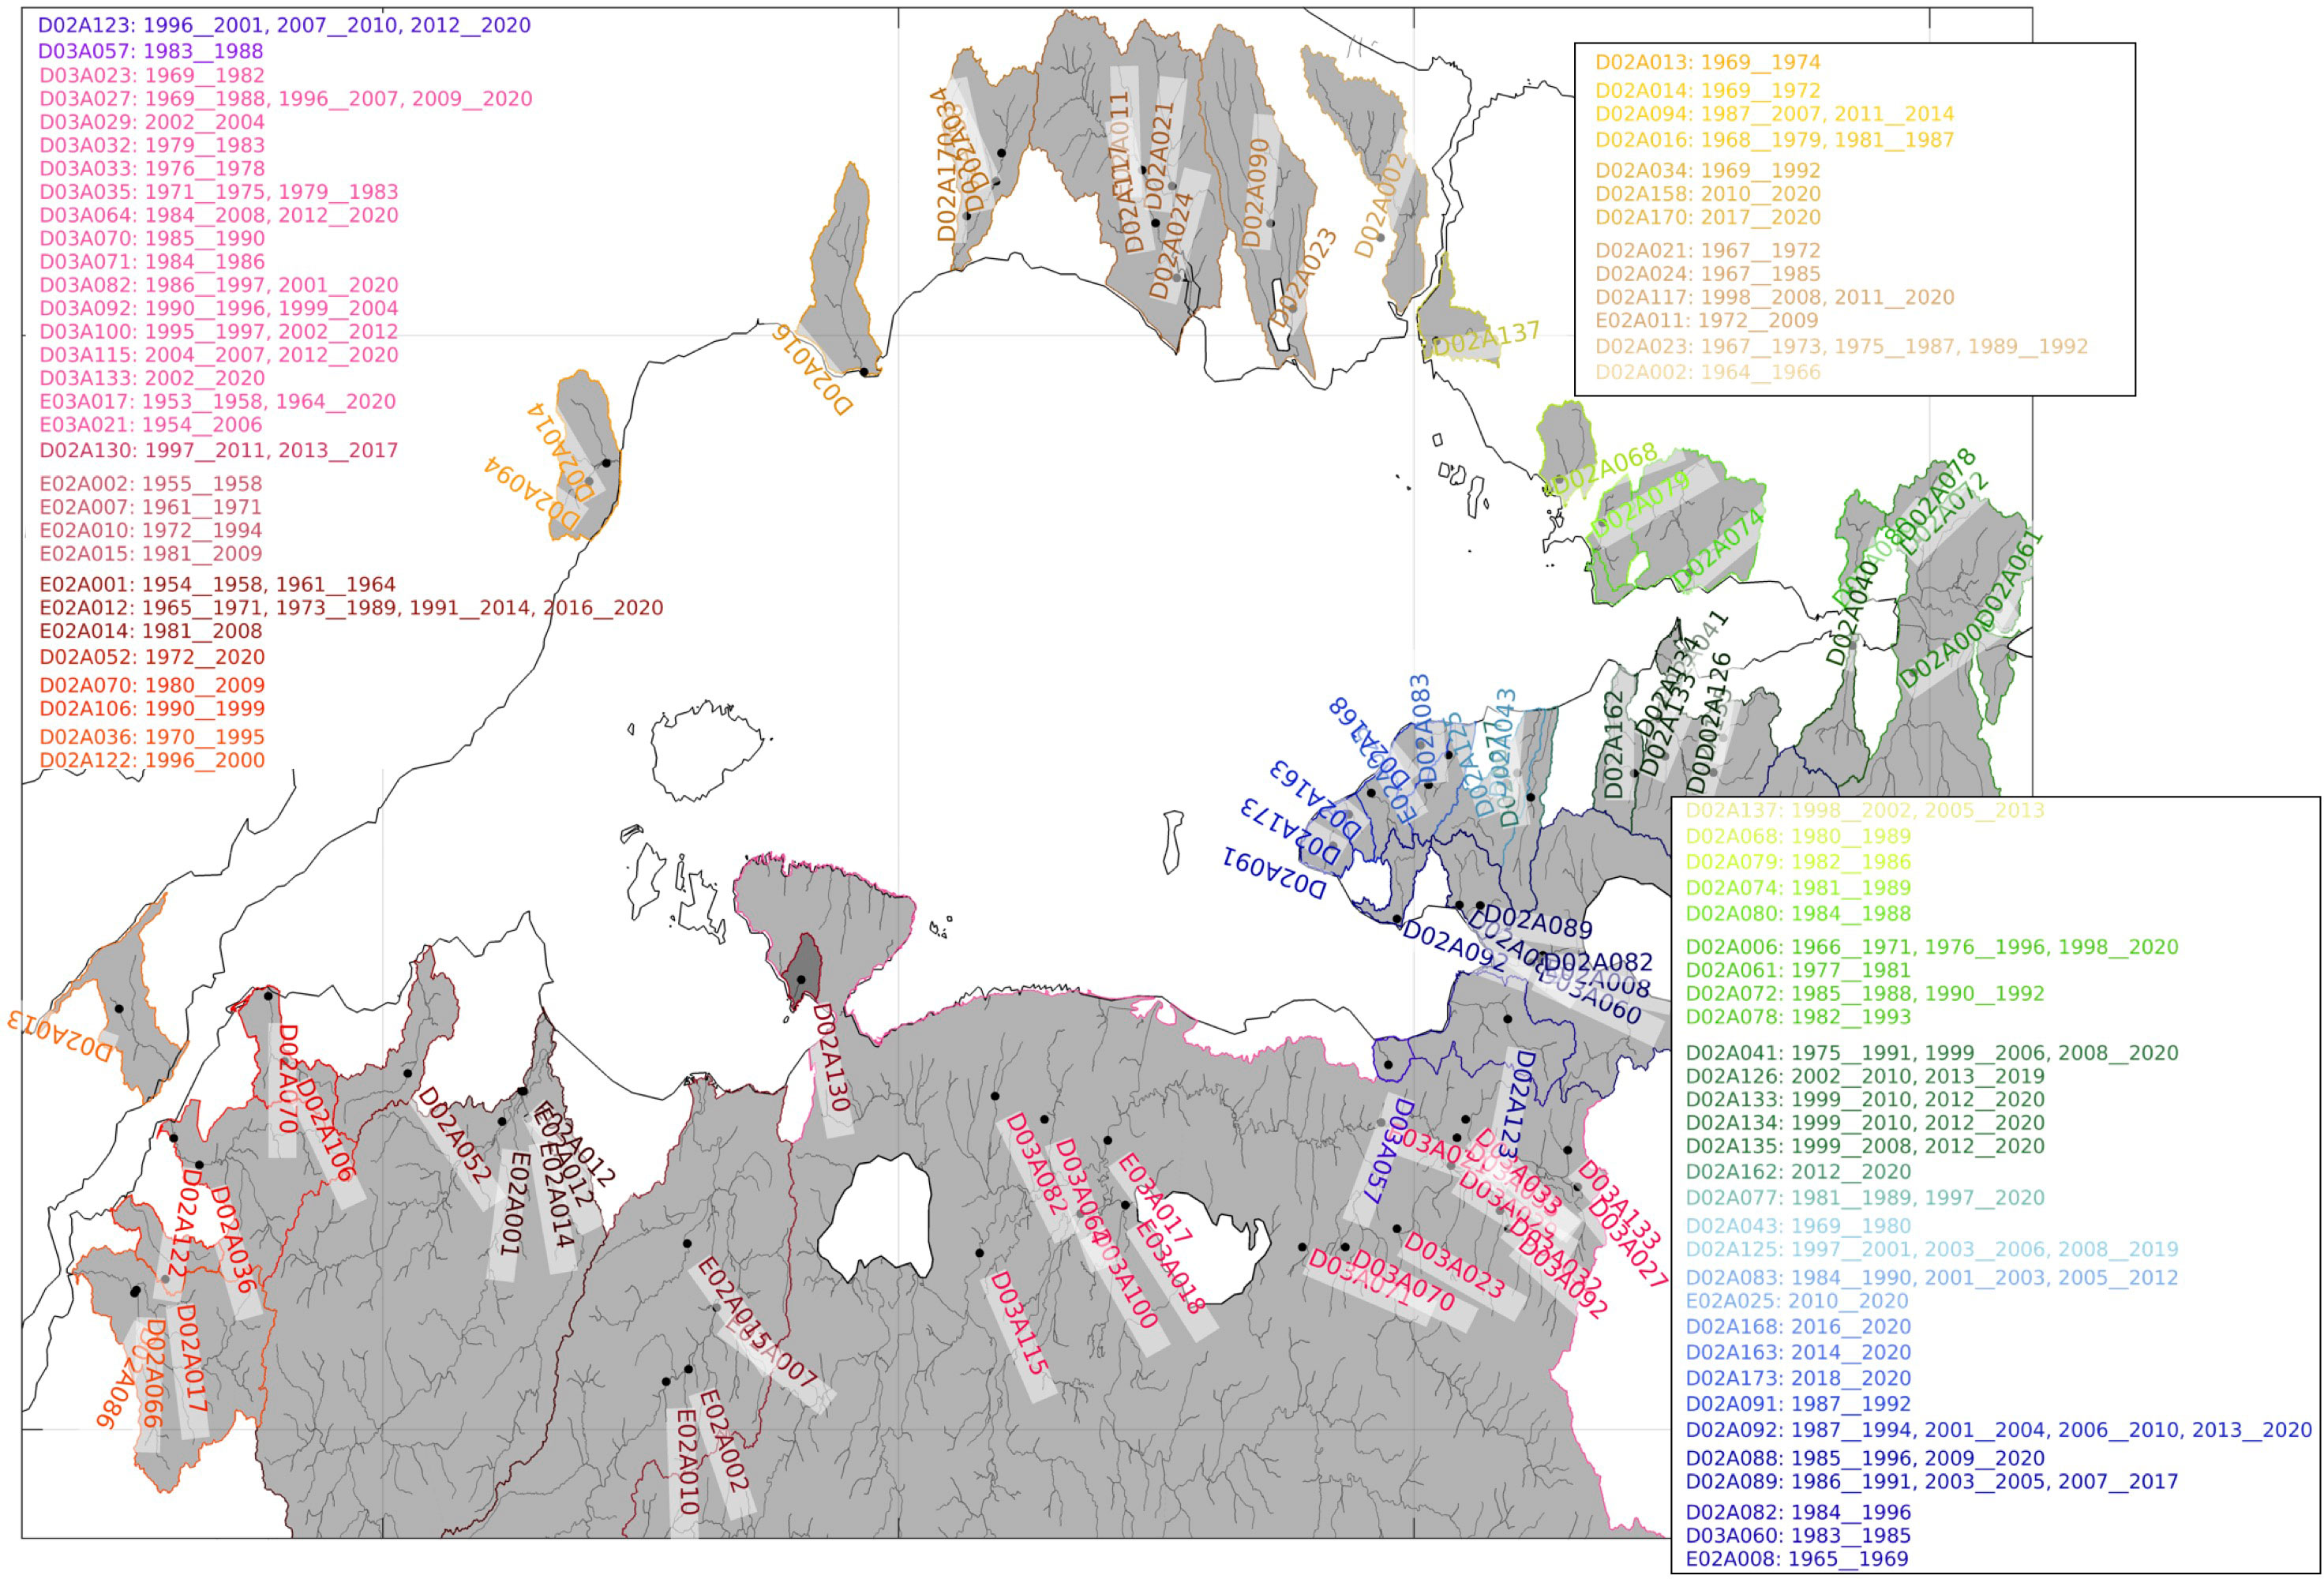
Annual streamflow observation tables of the General Directorate of State Hydraulic Works (DSI) for the years 1960-2021 (DSI, 2021) were digitized to obtain the gage locations (black markers, Figure 2) and associated discharge rates. Among the river tributaries near the stream gages, the ones closest to the river mouths were chosen to determine the historical change in coastal discharge rates. The closest stations located at the downstream of the dams were used to reduce the uncertainties (e.g., the water usage at the upstream of the basin, the tailwater discharge). The coastal river discharge was then approximated by summing up the flowrates nearby these branches, i.e., all branches (if nearby gages exist; if not, the primary tributaries were used) merging to the river mouth. Since the historical continuity of the annual flow observation tables differs at each station (e.g., the year the operation started, ended, or temporarily stopped), there are gaps in the datasets. To reduce the gaps, alternative station groups were used. In each coastal watershed, the stations were grouped based on their proximity to the river mouth (e.g., primary, secondary, and tertiary proximity are marked respectively by dark blue, light blue and green circles, Figure 3A). The first group that is closest to the river mouth (dark blue markers) was used if each station in this group was in operation; otherwise, the station groups nearby the upstream tributaries were used (light blue and green markers). This method is analogous to the multiple traveling salesman model, where the routes are the river tributaries and the shortest distance to the river mouth from each coastal gage (which differs temporally in location based on its operation period) is pursued. The time series of coastal discharges were approximated by using the same method for each year and concatenating the datasets (the date range of operation and names of all the stations used are given on a map in Appendix A). With this method, the gaps in the time series of the coastal discharges from gaged watersheds were reduced while maintaining the observational basis.
The ungaged basins are small in size, with short valleys and creeks. Stream flows in these watersheds were estimated by using information from neighbouring watersheds that share similar topographical and geological characteristics. To achieve this, the total flow rate in each watershed group was divided by the surface area of the associated gaged watersheds. Streamflow time series of the ungaged watersheds were obtained by multiplying this spatially averaged velocity by the surface area of each individual ungaged watershed. This method provides an estimate reflecting regional characteristics that affect infiltration rates and, thus, the outflow rates, in contrast to using a generic runoff coefficient.
2.2.2 Temporal variation of flow rates and climate
Monthly averages of the coastal discharges and their variation along the coast were explored. Long-term and seasonal trends of approximate coastal discharges were decomposed using Single Spectrum Analysis (Cleveland et al., 1990; Golyandina and Zhigljavsky, 2013). Temporal gaps in the streamflow datasets were filled by using a non-parametric spectral estimation method (Yi and Sneeuw, 2021), which consists of Single Spectrum Analysis, gap-filling technique, cross-validation, and spectral testing. The same method was used to find the monthly averages of the stations that have been non-operational in recent years. This method offers a data-adaptive and easy-to-implement approach to produce reasonable gap-filling results in the form of spherical harmonic coefficients; it is adept at inferring missing data from long-term and oscillatory changes extracted from available observations.
Time series of monthly-averaged and gridded terrestrial precipitation and evaporation rates were obtained from the ERA5-Land database (9 km horizontal resolution) to compared with the changes in river flow rates. The gridded datasets were spatially averaged by using a weighted average method and considering the watershed area as the weight. Yearly precipitation rates observed at the local meteorological stations were added for comparison.
2.2.3 Water usage
Yearly water abstraction for the municipal water supply network was obtained via the online database of the Turkish Statistical Institute (TUIK) for the 2001–2020 period (TUIK, 2020). The dataset was extracted for each city in the Marmara region. The municipal boundaries differ from the coastal watershed boundaries. Thus, the dataset was scaled based on the surface area of the coastal watershed, and grouped based on the subregions.
3 Results
3.1 Basin characteristics and stream network
The coastal watersheds and the associated river network vary in shape and structure along the coastline of the Sea of Marmara (Figure 3). The southern watersheds mostly consist of a long and developed network of streams and rivers, whereas short and few-armed basins characterize the eastern and northern regions. The bigger watersheds of the southern region extend laterally (perpendicular to the main river channel) in the upstream direction. The shapes of the northern and eastern watersheds are elongated. Therefore, the southern basins are more sensitive to floods with a larger sediment transport capacity (Elbası and Ozdemir, 2018).
The gaged watersheds are numbered in clockwise direction for each regional group (i.e., the northern, eastern and southern basins with their river mouths marked by triangles, rectangles, and circles, respectively; Figure 3B). The surface area of the watersheds mostly ranges from about 1 to 10³ km2 (Figure 3B). Susurluk, the largest basin in the region, covers the sub-basins of Manyas Lake, Simav Stream, Ulubat Lake, and Nilufer Stream, from west to east (shown in different shades of pink in Figure 2; Figure 3B), with a precipitation area of ~2x10⁴ km2. Some of the marine and terrestrial regions are reported to be more sensitive to urban changes and nitrate loading (CSIDB-CEDIDGM, TUBITAK-MAM, 2020). The watersheds associated with these regions are shown as hatched polygons in Figure 3B. In the following section, the coastal discharge rates of these watersheds will be marked to distinguish their temporal variation.
Locations of the streamflow gages that are closest to the river mouths are shown in Figure 3A; of these stations, the ones that are on the downstream side of dams (pink dots) are used in the analysis. Average distances from the marked gages to the river mouths (i.e., distance between the red and blue/green markers shown in Figure 3A) range from 1 to 15 km (Figure 3B). The gages in the eastern group are closer to the river mouths (~5 km) compared to the stations in the northern and southern groups. The gages in the Susurluk basin are the farthest from the river mouth, i.e., ~15 km when the Nilufer sub-basin is excluded, and around 40 km when included.
3.2 River discharges
Monthly averages of the flowrates between 1960 and 2021, and their long-term trends are shown for each group of the watersheds separately in Figure 4. Hereafter, the notation Hi-Sj is used to label the river mouths with gages on their tributaries; i = {1, 2, 3} denotes the watershed group (the northern, eastern, and southern watersheds, respectively), and j = {1, …, n} denotes the n number of gaged river mouths (ordered in clockwise direction) within each watershed. The coastal river discharges of the vulnerable watersheds (hatched in Figure 3B) are distinguished by labeling their long-term trends (Figures 4A1, B1, C1).
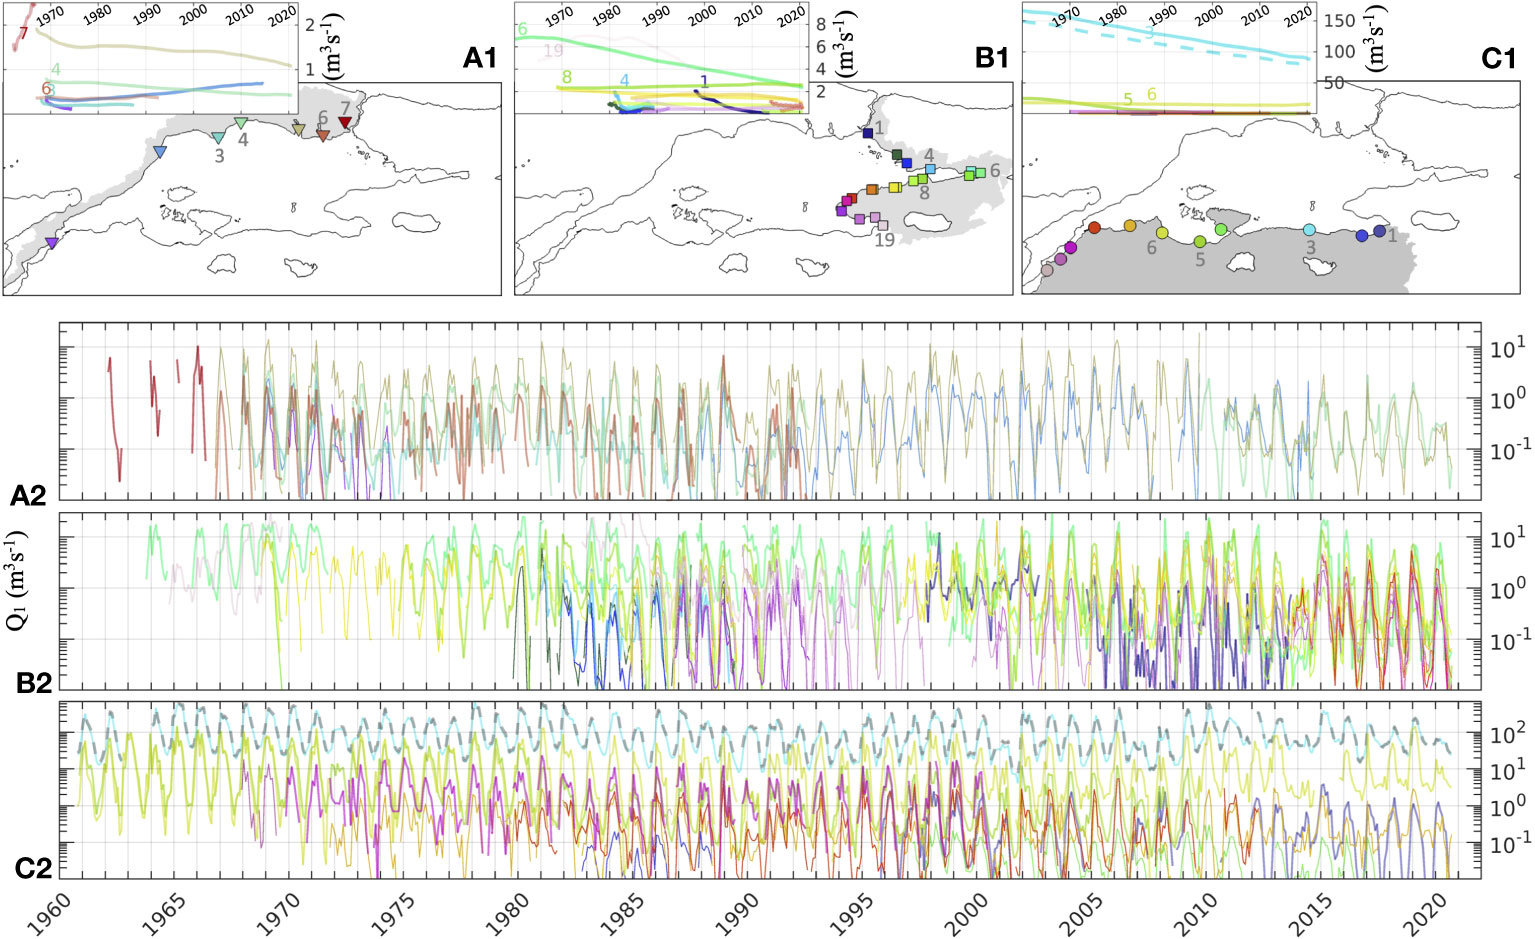
Figure 4 Monthly averages of river discharge Q1 (A2, B2, C2) and the long-term trends (A1, B1, C1) for (A) the northern, (B) eastern and (C) southern regions. Locations of the river mouths are referenced in (A1, B1, C1). Flowrates of the sensitive areas (hatched watersheds in Figure 3B) are numbered in (A1, B1, C1) and shown with bold lines in (A2, B2, C2). Logarithmic scale was used for monthly averages, and normal scale was used for long-term trends.
In the Thrace watershed (Figures 4A1, A2) maximum discharge is around 20 m3 s-1 via Buyukcekmece (H1-S5) followed by the coastal discharges of the western streams (Kınıklı and Kum, H1-S4,2 with 10 m3 s-1). The flowrates temporally vary by two to three orders of magnitude. Since 2015, only the gages on the Kınıklı stream and Buyukcekmece (H1-S4,5) have been in operation. Except for H1-S2 the coastal discharges show a decreasing trend with time (Figure 4A1, left-upper inset).
In the eastern watersheds, the monthly flowrates reach up to 10-20 m3 s-1 (Figures 4B1, B2) with the discharges of the Kiraz, Golayagı and Yalak streams (H2-S6,19,18). The former two streams are connected to the lakes of Sapanca and İznik. The eastern watershed group has the highest concentration of observation stations near the shore. The coastal discharges through all the vulnerable watersheds except for the Yalak stream (H2-S1,4,6,8,19) show a decreasing trend; the Kiraz and Golayagı streams show a 5 m3 s-1 decrease (Figure 4B1, upper-left inset).
Among all the watersheds, the southern ones have the highest flow rates. Monthly flowrate of the Cross (Kocasu) River, which feeds the Susurluk basin, reaches up to 500-600 m3 s-1 (Figures 4C1, C2; H3-S3) near the coast. The flowrate of the Cross (Kocasu) river is obtained by summing up the flowrates at its major tributaries (Nilufer, Mustafa Kemal Pasa, Simav, and Karasu). The long-term trend of this river (Figure 4C1, upper-left inset) indicates a 50 m3 s-1 decrease since 1960. As discussed in Section 4.2, the flowrates are calculated with and without the Nilufer stream (Figure 4C, dashed and straight lines, respectively). Including the Nilufer stream results in only 10 m3 s-1 of a difference in the long-term trends. The Biga and Gonen rivers (H3-S5,6) follow the Cross river with monthly discharge peaks of 70 - 90 m3 s-1. There has been no significant change in the long-term trends of these rivers since 1960. The riverine input to the Sea of Marmara from the rest of the watersheds is relatively small when compared to these three major rivers.
The high flowrates of the Cross River are associated with the heavy rainfalls; they result in flood events around the gaging stations, particularly around the ones near the Ulubat lake. However, satellite images of the coastal waters during and right after these flood events (not shown) suggest that coastal discharge of the Cross River amounts to a fraction of the flowrates observed at gages 15 km upstream of the river mouth. This is due to the fact that the closest gages are still far from the coast, and the geomorphological and vegetative structures between these gages and the river mouth differ significantly along the stream. Thus, the flowrates from the gages need to be adjusted when calculating the coastal discharge of the Cross River during these high flow events. This will be detailed in the following section.
3.2.1 The Cross River
The geological features around the Cross River change significantly along the stream from alluvial and clastic (highly permeable; around Ulubat and Manyas lakes) to metamorphic rocks (low permeability) towards the river mouth (MTA, 2002). During periods of heavy rainfall and floods, it is possible that excess water is retained around the lakes and infiltrated into the depths, thus reducing the water flow rates.
There are agriculture fields on both of the river banks upstream of the Kocasu Delta (Figure 2, inset) along the stream. The width of these fields is approximately twice the width of the Cross River; these fields are surrounded by topographic highs (Figure 1). In addition, Kocasu delta, a wetland with lagoons, is located between the metamorphic rocks and the river mouth, reducing the intensity of the floods by holding the excess water. During flood times, the water level of the wetlands around the lagoon rises, thus increasing the volume of the lagoons. Additionally, the satellite images following the flood events indicate sediment load patches transported by the Cross River (H3-S3) to be two to three times bigger than the ones transported by the Biga River (H3-S6).
Due to the lack of gages on the Kocasu delta, there is no observational evidence on how much of the river flow enters the Sea of Marmara during heavy rainfall periods. Therefore, the extreme coastal river discharge values during these periods are approximated to be one-third of the values obtained from the upstream gages. This estimate is consistent with the width of the river banks relative to the channel width (i.e., agricultural lands hold two-thirds of the flooding discharges; overflowing waters are retained in the wetland).
3.3 Seasonal changes
The differences between the long-term trends and the monthly averages of the flow rates (Figure 4) reveal the significance of the seasonal variation. Some of the smaller streams dry up during dry periods. During periods of heavy precipitation and snowmelt, the seasonal extrema exceed five times the yearly average values at some of the rivers. To analyze the seasonal variation in coastal discharges, the rivers with relatively high flowrates are chosen from each of the watershed groups (H1-S4 Kinikli, H2-S1,6,8,19 Kurbagalı, Kiraz, Yalak, Golayagı, and H3-S3,5,6 Cross, Gonen, Biga; Figure 5). All of these rivers are associated with the vulnerable watersheds (hatched in Figure 3B).
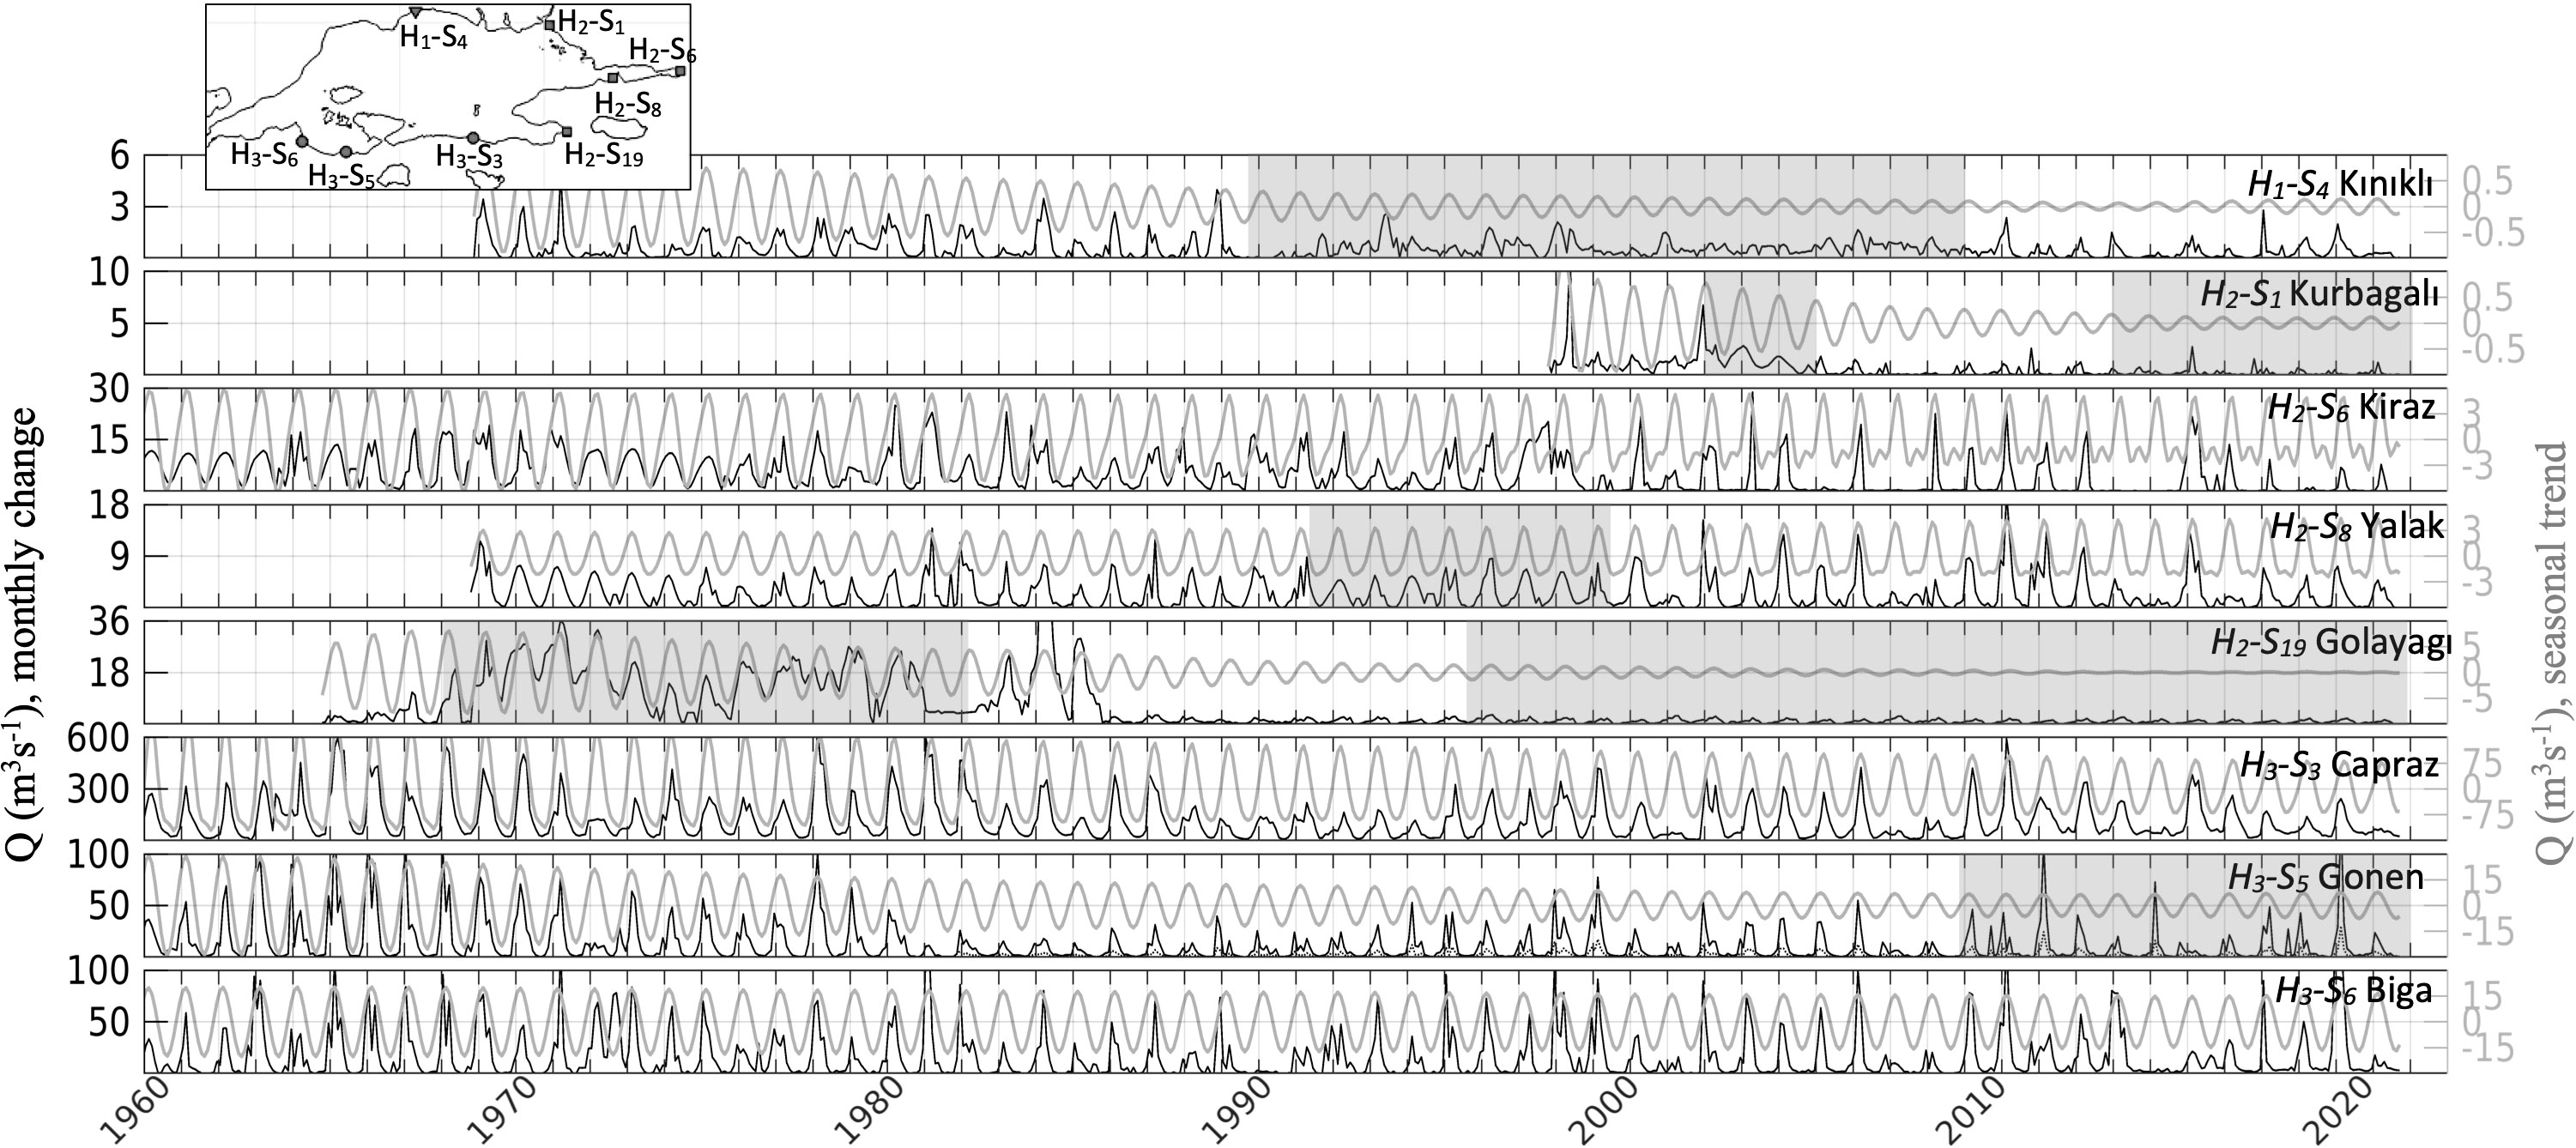
Figure 5 Flowrates (black; left y-axis) and their seasonal trends (grey; right y-axis) between 1960-2022. River names and locations are referenced in the inset. Missing data (shaded panels) is filled using single-spectrum analysis.
In general, river discharges increase with precipitation rates from December to March, and decrease during the summer months, i.e., primary seasonal trend (Figure 5). Accordingly, the seasonal change in the coastal discharges of the Kınıklı and Kurbagalı (H1-S4 and H2-S1) rivers is ±0.5 m3 s-1. The discharges of the eastern rivers (Kiraz, Yalak and Golayagı) seasonally vary between ±3 m3 s-1 and ±6 m3 s-1. After the year 2000, the Kiraz and Yalak streams showed a secondary seasonal trend. These secondary changes might be associated with the sensitivity of these watersheds to spring precipitation. The flowrate of the Golayagı stream has decreased by 90% since 1988. In the south, the seasonal ranges of the Cross, Biga, and Gonen rivers are 75 m3 s-1, 15 m3 s-1 and 15 m3 s-1, respectively. An abrupt decrease in the flowrates of the Gonen River results from the lack of observational data in its major tributaries since 1982 (i.e., non-operational upstream gages; see Appendix A). The Gonen and Biga watersheds are similar in shape with equivalent surface area; they have similar geological and topographical features. Thus, the long-term change of the Biga river (the slope of the trend) is used to extrapolate the flowrates of Gonen after the year 1982. During the rainy seasons, the upper limit of the Gonen Stream coastal discharge is approximately 60 m3 s-1. The range of seasonal trends has been decreasing since 1980 in all rivers except the Biga river. In addition to the temporal changes, the seasonal trends also differ spatially along the coastline (Figure 5). Climate change is an important factor in modifying these trends (Allan and Soden, 2008); an increase in evaporation rates yields heavy rainfalls (i.e., an increase in extreme precipitation and the risk of flooding). The relationship between the warming and the changing atmospheric forcing for the study area will be discussed in the following section.
3.4 Climate change
Temperature anomalies over the coastal watersheds of the Sea of Marmara indicate a 2 °C increase on average in recent years due to global warming (MGM, 2021). These anomalies reach up to 3 °C in places, e.g., the irrigated lands between the Manyas and Ulubat lakes down to the Kocasu Delta, around the Gulf of Izmit, and Kum Creek in Thrace (H1-S3, Figure 3B). In response to the warming, the evaporation rates increase, resulting in heavy rainfall and increasing the risk of flood.
Monthly averages of terrestrial precipitation and evaporation rates (P and E) in the coastal watersheds of the Sea of Marmara and their long-term and seasonal variation are shown in Figure 6 for the period of 1960-2021. The precipitation and evaporation rates reach up to 6 mm day-1 and 4 mm day-1, respectively; the last decade shows an increase in extreme precipitation and evaporation rates (Figure 6A). The precipitation rates increase in winter and spring, and the evaporation rates increase from April to July. The range of seasonal change in both of the parameters is approximately 2 mm day-1 (Figure 6C). Starting in 2010, long-term trends of both of these parameters shift, i.e., steady precipitation rates and increasing evaporation rates (Figure 6B). Compared with the long-term seasonal trends, the last decade shows a seasonal shift, particularly in the precipitation trends (Figure 6D) increasing in May and June, and decreasing in November and December.
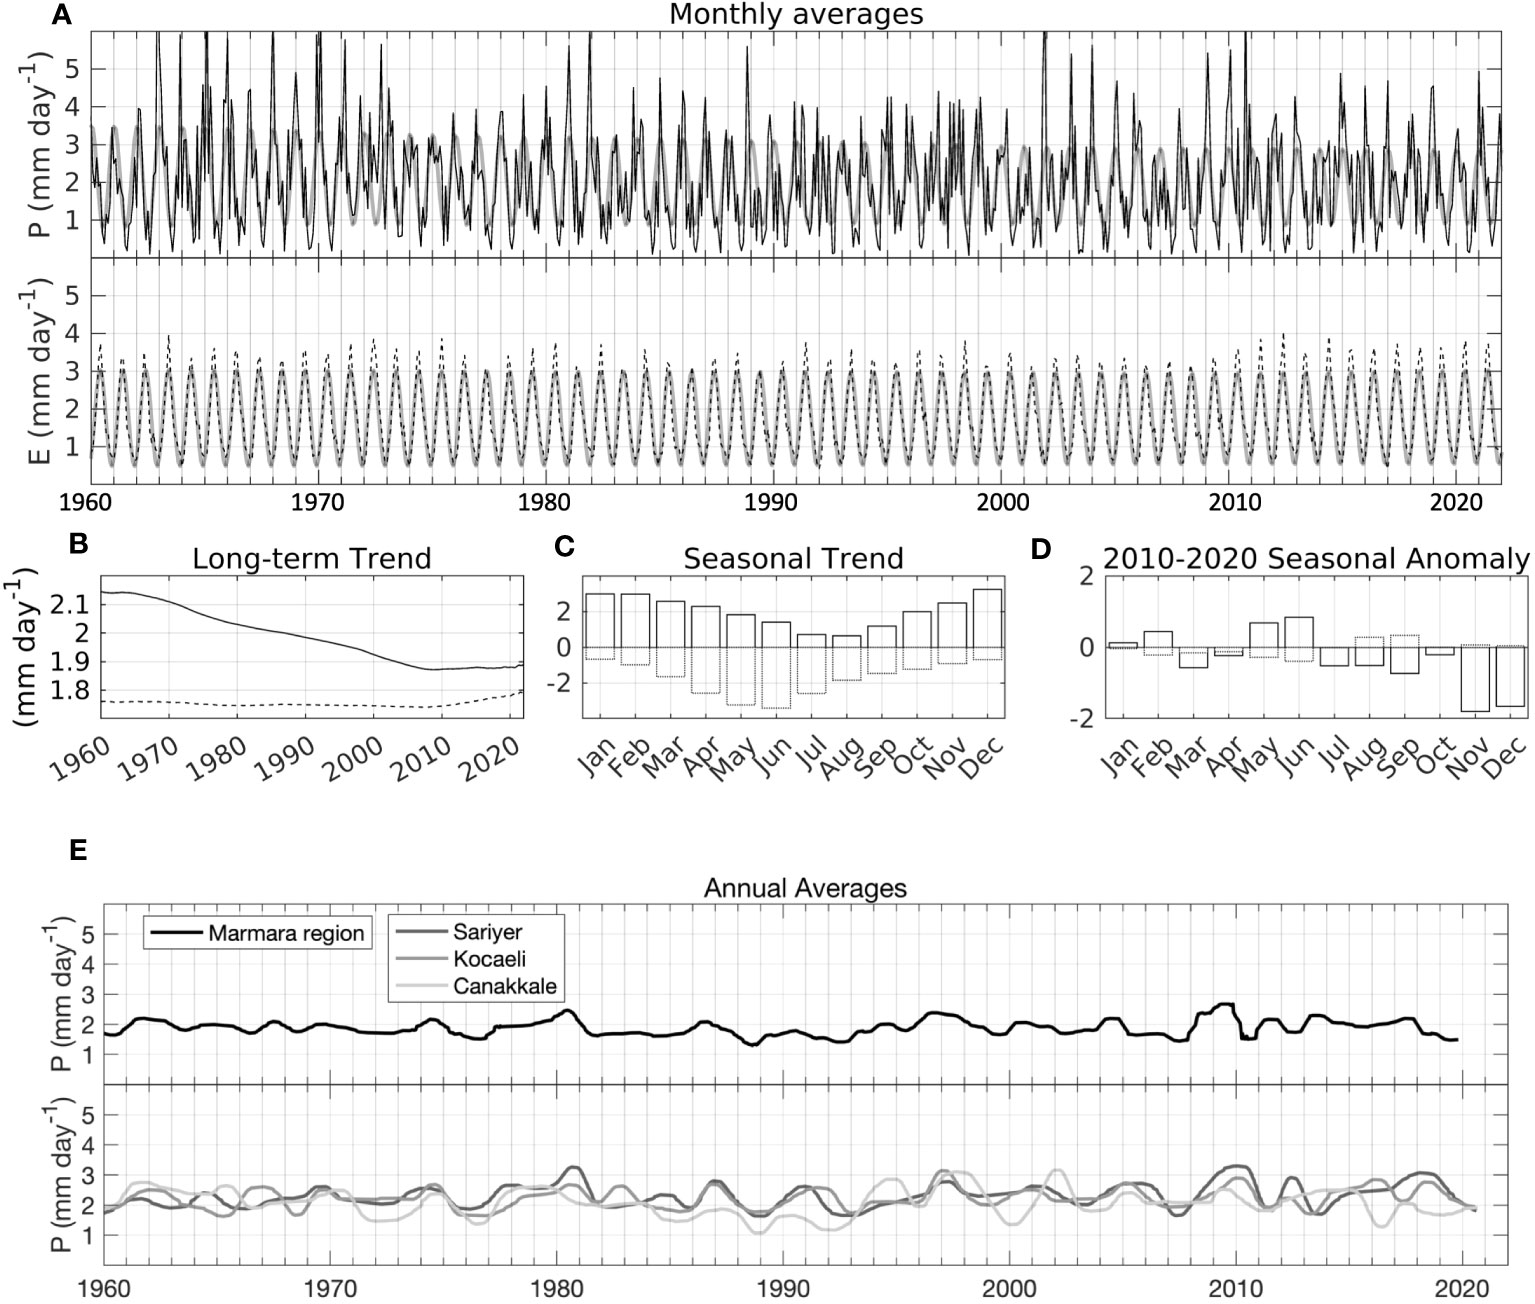
Figure 6 Precipitation P (solid line) and evaporation rates E (dashed line) in the watersheds between 1960 and 2022: (A) monthly averages with seasonal trends (grey), (B) long-term trend, (C) seasonal mean (averaged between 1960 and 2020), and (D) seasonal anomaly, i.e., the difference between the 2010-2020 averages and the 1960-2020 averages shown in (C). (E) Annual averages of precipitation obtained from weather stations for the whole region (upper panel) and for the stations located at the northern, eastern and southern part of the watershed (lower panel) shown in Figure 1 as black circles.
The annual averages of the observed precipitation are shown in Figure 6E. The annual precipitation averages are mostly consistent with the monthly ERA5 dataset (Figure 6A, top panel). The observations show local variations in annual trends; the precipitation rate is higher in Sariyer (the northern station) and smallest in Canakkale (the southwestern station, Figure 1).
3.5 Total discharge to the Sea of Marmara
The ungaged watersheds are shown for the northern, the eastern and southern groups. The coastal discharge from these watersheds Q0, varies between 5 m3 s-1 and 45 m3 s-1 with the northern watersheds contributing the least (Figure 7A). The sum of coastal discharges QT from gaged (Q1, Figures 4, 5) and ungaged (Q0, Figure 7A) watersheds, is shown in Figure 7B. In the analysis, one-third of the flow-extremes of the Cross River are used (solid line); the dotted line denotes the QT obtained by using the upstream extremes of the Cross River.
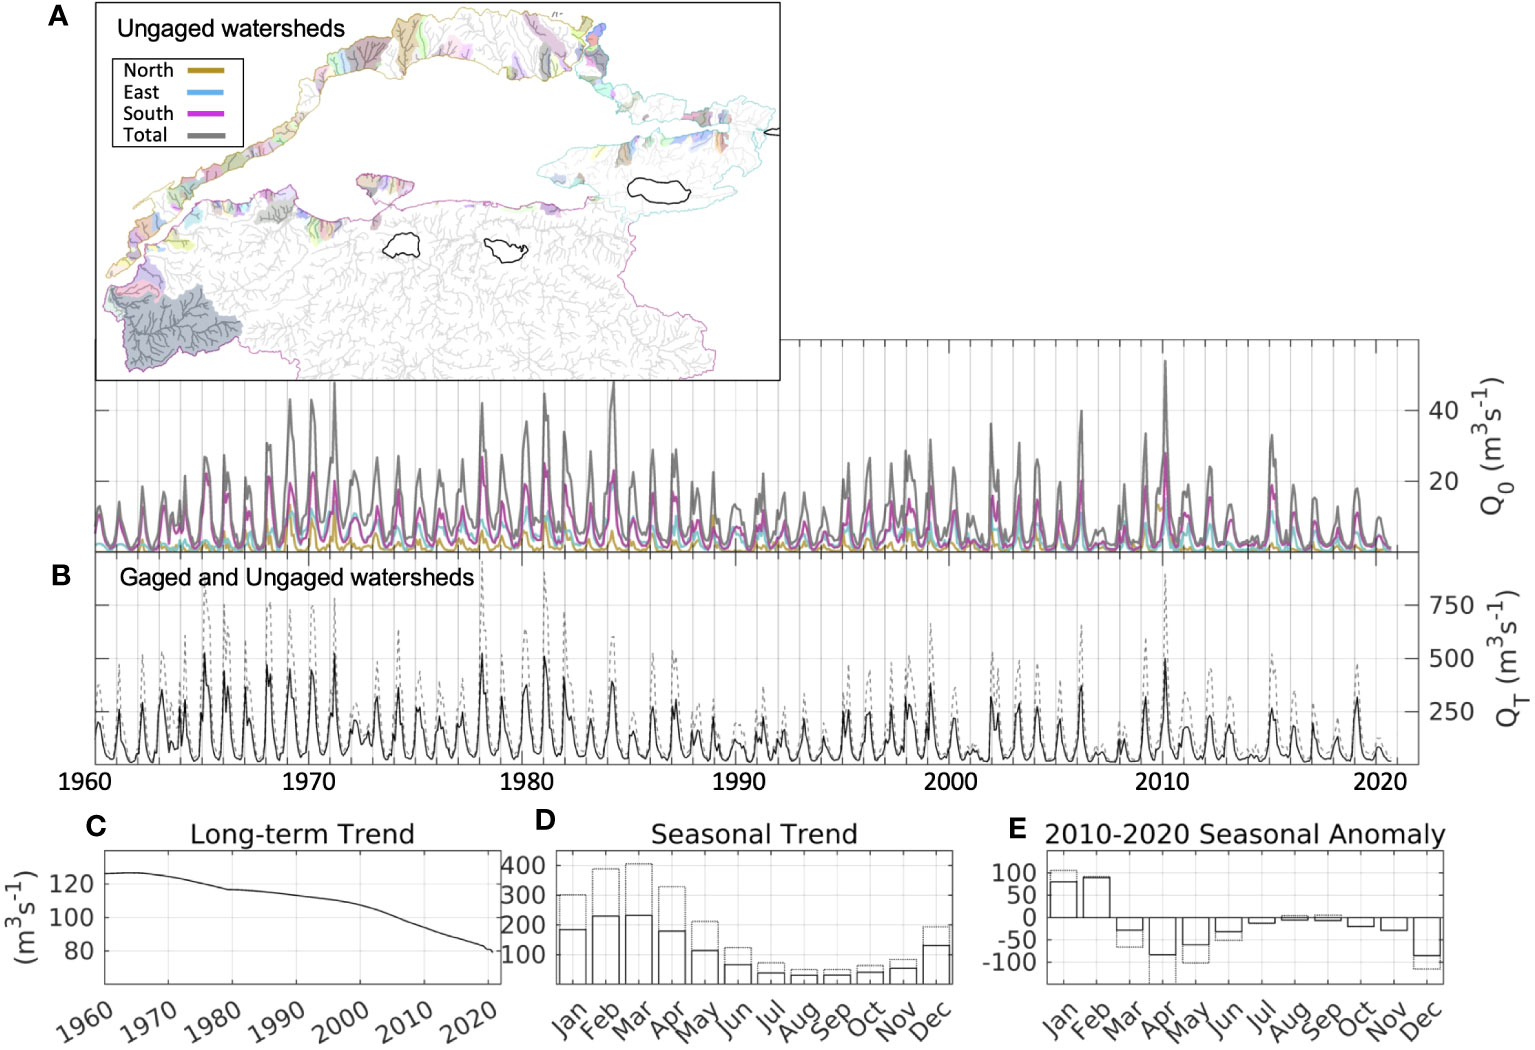
Figure 7 Coastal river discharge between 1960 and 2021 from (A) ungauged watersheds Q0 (color denotes the sum from each region (Figures 4A–C) as referenced in the inset; gray line denotes the total flow rate), (B) gauged and ungauged watersheds QT, and (C) the long-term trend of QT. (D) seasonal trend (averaged between 1960 and 2020), and (E) anomaly of the seasonal trend i.e., the difference between the 2010-2020 averages and the 1960-2020 averages shown in (D). When calculating QT, discharge from the Susurluk watershed is reduced by a factor of three (solid line); the flow rate without this reduction (dotted line) is shown as a reference.
Between 1960 and 2021, the total riverine discharge QT to the Sea of Marmara shows a range of 50 - 500 m3 s-1, with a yearly average rate of ~97 m3 s-1 in the last decade (corresponding to a range of 1.5 – 15 km3 per year). The long-term trend of QT shows a decrease of 40 m3 s-1 within the observation period (Figure 7C); seasonally, QT peaks at 200 m3 s-1 in winter and drops to 30 m3 s-1 in late summer to autumn (Figure 7D). The seasonal anomaly between the last decade and the whole observation period shows an increase in QT in January and February, and a decrease in the rest of the year, particularly in spring (Figure 7E).
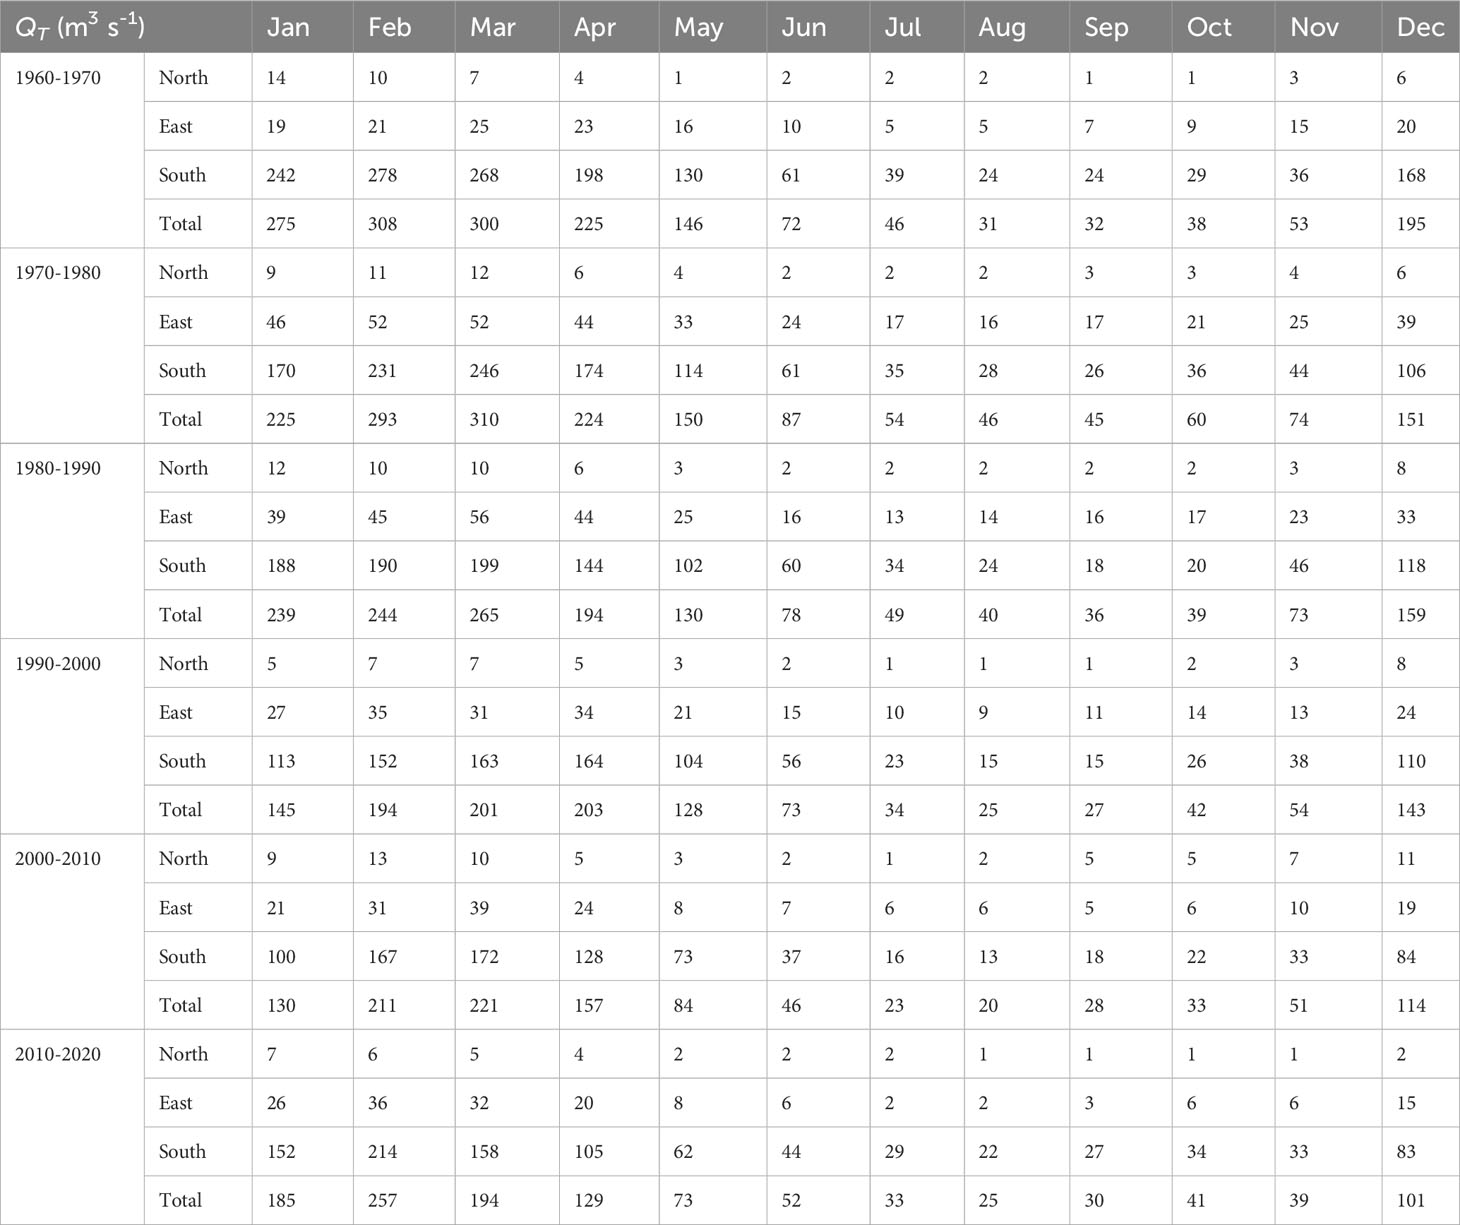
The decadal averages of the coastal discharges are given in Table B1 (Appendix B) for each watershed group. Coastal discharges from the northern, eastern and southern watersheds are approximately ~3%, ~17% and ~80% of the total discharge. The total discharge of the last decade equals ~3 km3 per year on average with higher rates occurring in early spring; the coastal discharge from the southern watersheds (mostly via Susurluk basin) is ~2.5 km3 per year.
3.6 Total discharge vs. the net precipitation
The relationship between the long-term and seasonal trends of the net precipitation P-E, and QT is shown in Figure 8. The long-term trends suggest a quadratic relation for the southern watersheds and for the sum of all the watersheds (pink and gray markers). The correlation reverses for the northern and eastern watersheds in the last few decades (relatively small markers), i.e., QT decreases with increasing P-E.
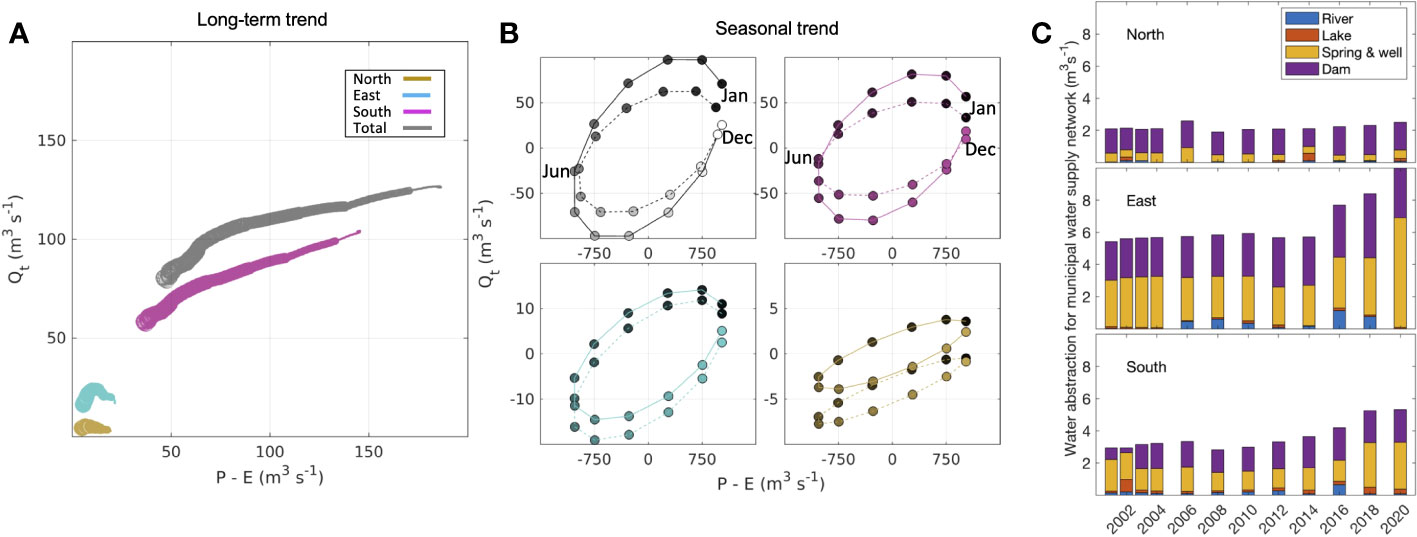
Figure 8 Total river discharge vs. net precipitation on land between 1960 and 2021 (A) Long-term trend for each region (colors) and for all of the watersheds (black); the dataset is grouped by decade, and the recent decades are shown with smaller markers. (B) Seasonal trend (solid line) and its anomaly between years 2010-2021 (dashed lines; markers denote the months, i.e., ordered in counter-clockwise direction from January (black) to December (colored). (C) Water abstraction for municipal water supply network; the dataset is shown for each subregion as in (A).
The seasonal changes in recent years are shown by comparing the relationship between the two parameters (P-E and QT) for the last decade and for the entire study period (dotted and solid lines in Figure 8B). In response to the varying net precipitation rates, the change in flowrates has been relatively small in the last decade (Figure 8B, top-left panel). This anomaly is more pronounced between January and April and between August and September. The seasonal anomalies of the southern watersheds control the general change in seasonal trends (Figure 8B, top panel). The seasonal anomaly pattern of the eastern watersheds is similar to the pattern of the southern watersheds during winter and spring; however, during the rest of the year, the flowrates decrease regardless of the net precipitation (Figure 8B, bottom-left panel). The northern watersheds show a similar trend for all four seasons (Figure 8B, bottom-right panel).
The net precipitation-flowrate relationship also depends on water usage, which increases with population density. Dams, springs, and wells are the primary sources to meet the increasing demand (Figure 8C). Water usage has shown increasing trends in the last two decades in the eastern and southern subregions of the coastal watershed. A sharp decline in flow rates with increasing net precipitation during recent decades is associated with increasing water abstraction (Figure 8A, eastern subregion).
3.7 Coastal discharges and nutrient loads
The coastal discharges are important in carrying the nutrient loads and pollutants from the inland to the coastal zone. The nutrient load of the Danube River is another factor affecting the ecosystem of the Sea of Marmara, with the surface waters of the Black Sea entering through the Bosphorus Strait (i.e., the characteristic cyclonic rim current of the Black Sea carries the Danube nutrients to the coastal shelf near the Bosphorus Strait). The nutrient over enrichment observed in the Danube River Between the 1970s and the early 1980s (due to the enhanced agricultural fertilizer use and wastewater discharges), has since subsided (Oguz, 2017). In recent decades, the total nitrogen (dissolved inorganic and reactive organic, DIN+DON+PON) input from the Black Sea has been found to be around 1.5-2.0 µM (Polat and Tugrul, 1995; Oguz, 2017); with a surface inflow rate of 530 km3 yr-1, the influx yields a DIN load of 11.3-15.0 kt yr-1. Despite the decreasing nutrient input from the Black Sea (by about 30%), eutrophication has threatened the Sea of Marmara due to the consistently increasing nutrient loads of its coastal watersheds since the 1980s.
Recent limited observations in the riverine waters that feeds the coastal waters of the Sea of Marmara point to high concentrations of DIN along the coastline: 350-600 (~450) µM in the Kocasu Delta, i.e., the Cross River observations from Tavsanoglu and Akbulut (2019) are averaged over the sampling period, leading to higher nutrient concentrations and enhanced algal production in the coastal waters and enclosed bays (Izmit, Bandırma, Gemlik; Figure 2) (Ozbayram et al., 2022).
By assuming an annual average DIN concentration of 450 µM for the polluted major rivers (with a volume flux of 3.5 km3 yr-1; the Cross River in Figure 4C1) of the Susurluk Basin, the annual DIN load discharging into the southeastern coastal zone is about 21.8 kt, exceeding the total nitrogen input of the Black Sea. This rough estimate shows the importance of terrestrial nutrient loads in the nutrient budget of the upper layer in comparison to the Black Sea input and partially-treated direct wastewater discharges to the upper and lower layers of the water column along the coastal zone.
4 Discussion
4.1 Multiscale trends of coastal discharges
The streamflow observations for the period 1960-2021 show that the terrestrial waters flowing to the Sea of Marmara decrease with time; the rate of this declining trend has accelerated in recent decades. The seasonal trends of flowrates have also been changing. Comparing Figures 6D, 7E reveals that despite the increase in precipitation rates in May and June during the last decade, the associated flow rates decreased due to the increase in temperature, evaporation rates, and increase in water consumption.
The high range of monthly-averaged flowrates (i.e., difference between the local minima and the local maxima) in recent decades is associated with the daily extrema (not shown). This suggests that the temporal change in coastal discharges is instantaneous during the wet season. The single-event flood type that occurred in the region in the autumn of 2009 as a series of flash floods due to persistently intense rainfall episodes over a 3-day period that produced more than 250 mm of rainfall over portions of the region (Komuscu and Celik, 2013) is an example of the impact of extreme precipitation over shorter time scales. The flood occurrences show fluctuations rather than a steadily increasing trend, but they have been on the rise since the mid-1990s (Komuscu and Celik, 2013).
Intense flowrates at shorter time scales can have severe consequences for the ecosystem of the Sea of Marmara by introducing excess sediment, nutrients, and pollutants particularly in the eastern and southern watersheds (i.e., industrial and agricultural pollutants, respectively). Particularly in the bay areas (Izmit, Gemlik and Bandırma, Figure 2) where the coastal currents are relatively weak, there is the potential for extreme events to develop during floods carrying the urban load to the coastal zone.
4.2 Coastal discharges and marine environment
The oxygen content of the open ocean and coastal waters has been declining for at least the past half-century (Breitburg et al., 2018). Nutrient runoff is greatest, and eutrophication, hypoxia, and toxic blooms are most intense, in estuaries and coastal seas (e.g., the Adriatic and Baltic seas and Chesapeake and San Francisco bays), and in continental shelves with major river systems (Jackson, 2008). With increased pollution and warmer climates, excessive terrestrial nutrients trigger ecological changes that decrease the biological diversity, favouring algal blooms that thrive in hypoxic zones. The mucilage (sea-snot) event in 2021 is a recent biological response of the Sea of Marmara to these stressors (Yucel et al., 2021). Observational evidence (CSIDB, ODTU-DBE, 2021) suggests an alarming possible regime shift (from suboxic to anoxic) for the Sea of Marmara. Despite the decreasing nutrient loads of the Danube River (Oguz, 2017) entering the sea, eutrophication threatens the Sea of Marmara due to the increasing nutrient input from its coastal watersheds. Because the intensity of coastal discharge and frequency of its anomalies affect rates of nutrient runoff, calculation of nutrient load distribution along the coastline associated with these coastal fluxes is crucial and urgent.
4.3 Climate change impact
Climate change adversely affects marine environments by warming the sea-surface, increasing stratification thus inhibiting the cooler and denser nutrient rich waters to upwell from the lower layers (Jackson, 2008), eventually leading to hypoxia or anoxia below the thermocline (e.g., the Black Sea). A relatively small surface area, a two-layered circulation with a sharp halocline, and a narrow strait to the oxygen-saturated waters of the Aegean Sea (Tugrul et al., 2002) (limited water exchange yielding longer turnover times compared to other inland sea e.g., the Baltic Sea), makes the Sea of Marmara more vulnerable to warming.
In addition to its direct effect on the sea surface, the warming affects the precipitation trends (by increasing the atmospheric moisture storage capacity) and hydrologic cycle. A combination of large increases in river temperature and decreases in low flows are projected for regions including Europe (van Vliet et al., 2013). In the watersheds of the Sea of Marmara the precipitation changes are stronger than the temperature changes (Aalijahan et al., 2023). Therefore, the extreme precipitation events pose a threat to the region with risk of flood events. Moreover, the ability of river basins to adsorb disturbances is impacted (Palmer et al., 2008); to enhance the resilience of riverine ecosystems, restoration, rehabilitation, and management actions are much needed, particularly for basins with dams and extensive development.
4.4 Uncertainties
The study is based on a historical observational dataset of the gaged watersheds. To reduce the gaps in the dataset, alternative sets of gages that are nearby the upstream branches of the stream network were used when the coastal gages were non-operational. This method offers a simple solution for finding the temporal change in flow rates while relying less on interpolation techniques. However, caution should be taken while deciding which set of stations to use. Because using the upstream stations introduces uncertainties (i.e., amount of water diverted for agricultural or urban consumption between the gage location and the river mouth, dams).
In the presence of delta formations at the river mouth (with wetlands and lagoons), gages are usually placed further upstream of the river mouth for the safety of monitoring. In this study, the coastal discharge of the Cross River was modified by reducing its peaks because of the geomorphology and land use between the station and the river delta. Due to the lack of observational data (both oceanic and terrestrial) at the river mouth during an extreme event, the upstream flow peaks were reduced using a threshold value. This value was based on the delta area, the cross-sectional area of the channel, and the satellite images showing the relative size of the plumes along the southern coast following an extreme precipitation (not shown).
Because the gaging data were not available near its primary tributaries in the last decade, the long-term trend was used to extrapolate the time series, and the seasonal trend from the operational stations was used for the Gonen River. Although these approaches offer reasonable estimates, they introduce uncertainties. Thus, setting up gages near the river mouths along the southern coast, particularly for the Cross and Gonen rivers, is crucial for monitoring extreme events.
Spatial and temporal variability of evaporation and precipitation was obtained by using a reanalysis of a numerical model (ERA-5), and sub-regional watershed averages were used due to the coarse horizontal resolution of the products. The accuracy of the results can be improved by using daily or monthly data from meteorological stations along the coast.
The relationship between coastal pollution and the daily extremes in streamflow rates can be explored by using catchment models, particularly for the southern watersheds that are relatively large with gages far away from the river mouth. Geological features vary across the watersheds significantly; thus, they should be accounted for in such modeling studies. Watershed areas with high permeability can cause more water seepage from rivers during storm events, increase characteristic flood times, and weaken the flow (LeMesnil et al., 2021). Therefore, intra-basin changes in geological features play an important role in accurately calculating the coastal discharges and the amount of retained water. Moreover, the seasonal variation of nutrient concentrations from the bigger watershed along the coastline is crucial.
4.5 Multiregional effects of the changes
Changing terrestrial freshwater flow rates along the coast, together with the increasing sea surface temperature and salinity, affect the water balance of the Sea of Marmara, resulting in higher evaporation rates and lower runoff rates, changing the water and nutrient balances and modifying the exchange flows at the straits. With the increasing loads of pollutants, the well-oxygenated Mediterranean water, which is crucial for the renewal of the deep waters of the Sea of Marmara, becomes suboxic due to the oxygen consumed by the degradation of excessive organic matter sinking from the upper layer into the lower layer. The deoxygenated deep waters of the Sea of Marmara intrude into the Black Sea. The pollutants and the biogeochemical by-products at the surface layer disperse to the Aegean and Mediterranean Seas. Thus, the environmental threats are multi-regional.
5 Conclusions
The temporal variation of river runoff along the coastline of the Sea of Marmara is evaluated for the first time by using an algorithm akin to the multiple traveling salesman algorithm (choosing the alternative gage combinations that contribute to the coastal discharge for each year due to varying operation dates) and a non-parametric spectral estimation (to fill the gaps in the time series).
The total river runoff shows a declining long-term trend with a seasonal shift. The river runoff differs along the coastline in order of magnitudes (increasing from north to southern watersheds, in clockwise direction). Coastal discharges from the northern, eastern, and southern watersheds are approximately ~3%, ~17%, and ~80% of the total discharge which has varied between 50 and 500 m3 s-1, in the last decade. The highest flow rates occur in winter and early spring months from the agricultural and industrial zones with significant nutrient loads; these instant and extreme coastal discharges pose a threat to the ecosystem of the region and the neighboring seas (e.g., increasing pollutants in the Sea of Marmara propagate to the Aegean Sea, seasonally affecting the biochemistry of both seas). Particularly, the nutrient input from the Susurluk watershed to the upper layer of the sea can foster development of eutrophication and extreme events (e.g., sea snot) for the already vulnerable ecosystem of the Sea of Marmara.
Systematic monitoring and quantification of nutrient inputs to the upper layer of the Sea of Marmara by surface runoff, including major rivers and urban areas, is urgent. It is crucial to take into account the spatially and temporally varying discharge rates when taking measures to remediate the elevated terrestrial loads in the coastal watersheds of the Sea of Marmara. The daily extremes in coastal discharges and their spatial and temporal variations still need to be explored, in connection to the local variations in temperature and precipitation observations.
This study provides an observational dataset that can be used in (i) regional ocean models to study circulation and transport patterns across the region, including the TSS; and (ii) catchment models to investigate nutrient load changes. Such studies are essential and urgent for implementing policies aimed at reducing nutrient loads in the Sea of Marmara.
Data availability statement
The raw data supporting the conclusions of this article will be made available by the authors, without undue reservation. The source datasets used in this study are freely available; the links to these datasets are listed in the article/Supplementary Material.
Author contributions
BB: Conceptualization, Data curation, Formal Analysis, Investigation, Methodology, Resources, Software, Supervision, Validation, Visualization, Writing – original draft, Writing – review & editing.
Funding
The author(s) declare that no financial support was received for the research, authorship, and/or publication of this article.
Acknowledgments
I gratefully thank Prof. Dr. Suleyman Tugrul for his valuable comments. I thank the Ministry of Environment, Climate Change and Urbanization of Turkiye and the General Directorate of State Hydraulic Works for their help in providing the historical streamflow dataset in a standardized format in conjunction with “The Marmara Integrated Modelling System Project (MARMOD) - Phase II (2021.09.00.2.00.002)" and METU-IMS-DEKOSIM (2012-K-120880). I thank Dr. Korhan Ozkan for his help in obtaining the streamflow dataset in a standardized MS Word document format. Valuable comments of Dr. Nones and Dr. Pinho are appreciated.
Conflict of interest
The author declares that the research was conducted in the absence of any commercial or financial relationships that could be construed as a potential conflict of interest.
Publisher’s note
All claims expressed in this article are solely those of the authors and do not necessarily represent those of their affiliated organizations, or those of the publisher, the editors and the reviewers. Any product that may be evaluated in this article, or claim that may be made by its manufacturer, is not guaranteed or endorsed by the publisher.
Supplementary material
The Supplementary Material for this article can be found online at: https://www.frontiersin.org/articles/10.3389/fmars.2023.1278136/full#supplementary-material
References
Aalijahan M., Karataş A., Lupo A. R., Efe B., Khosravichenar A. (2023). Analyzing and modeling the spatial-temporal changes and the impact of GLOTI index on precipitation in the Marmara region of Türkiye. Atmosphere 14 (3), 489. doi: 10.3390/atmos14030489
Algan O. (2006). “Riverine fluxes into the Black and Sea of Marmara,” in Fluxes of Small and Medium-size Mediterranean Rivers: Impact on Coastal Areas, vol. 30. (CIESM Workshop Monographs), 47–53.
Allan R. P., Soden B. J. (2008). Atmospheric warming and the amplification of precipitation extremes. Science 321 (5895), 1481–1484. doi: 10.1126/science.1160787
Alldredge A. L., Crocker K. M. (1995). Why do sinking mucilage aggregates accumulate in the water column? Sci. Total Environ. 165 (1-3), 15–22. doi: 10.1016/0048-9697(95)04539-D
Arnell N. W., Brown S., Gosling S. N., Gottschalk P., Hinkel J., Huntingford C., et al. (2016). The impacts of climate change across the globe: a multi-sectoral assessment. Climatic Change 134, 457–474. doi: 10.1007/s10584-014-1281-2
Basdurak N. B., Largier J. L., Nidzieko N. J. (2020). Modeling the dynamics of small‐scale river and creek plumes in tidal waters. J. Geophysical Research: Oceans, 125(7), e2019JC015737.
Besiktepe S. T., Sur H. I., Ozsoy E., Latif M. A., Oğuz T., Unluata U. (1994). The circulation and hydrography of the Sea of Marmara. Prog. Oceanogr. 34 (4), 285–334. doi: 10.1016/0079-6611(94)90018-3
Birpinar M. E., Talu G. F., Su G., Gulbey M. (2006). “The effect of dense maritime traffic on the Bosphorus Strait and Marmara Sea Pollution,” in Conference on Water observation and Information System for Decision Support, BALWOIS. 1–11.
Breitburg D., Levin L. A., Oschlies A., Grégoire M., Chavez F. P., Conley D. J., et al. (2018). Declining oxygen in the global ocean and coastal waters. Science 359 (6371), eaam7240. doi: 10.1126/science.aam7240
Cleveland R. B., Cleveland W. S., McRae J. E., Terpenning I. (1990). STL: A seasonal-trend decomposition. J. Off. Stat. 6 (1), 3–73.
Cozzi S., Ibáñez C., Lazar L., Raimbault P., Giani M. (2018). Flow regime and nutrient-loading trends from the largest South European watersheds: Implications for the productivity of mediterranean and Black Sea’s Coastal Areas. Water 11 (1), 1. doi: 10.3390/w11010001
CSIDB-CEDIDGM, TUBITAK-MAM (2020). Denizlerde Butunlesik Kirlilik Izleme Isi 2017-2019, Marmara Denizi Ozet Raporu (TUBITAK-MAM Matbaası Gebze/KocaeliAnkara, Turkiye).
CSIDB, ODTU-DBE (2021). Marmara Denizi Bütünleşik Modelleme Sistemi FAZ II Projesi (MARMOD - FAZ II) 2021 Yılı Ara Raporu (Ankara, Turkiye).
Danovaro R., Fonda Umani S., Pusceddu A. (2009). Climate change and the potential spreading of marine mucilage and microbial pathogens in the Mediterranean Sea. PLoS One 4 (9), e7006. doi: 10.1371/journal.pone.0007006
DSI. (2021). Akım gozlem yıllıkları. Available at: https://www.dsi.gov.tr/.
Ediger D., Beken C., Yuksek A., Tugrul S. (2016). Marine Biodiversity, Fisheries, Conservation and Governance. Istanbul: Turkish Marine Research Foundation (TUDAV). Publication No. 42. Page range: 723–736.
Elbaşı E., Özdemir H. (2018). Marmara denizi akarsu havzalarının morfometrik analizi. Cografya Dergisi, 36, 63–84. doi: 10.26650/JGEOG418790
Fukao T., Kimoto K., Yamatogi T., Yamamoto K. I., Yoshida Y., Kotani Y. (2009). Marine mucilage in Ariake Sound, Japan, is composed of transparent exopolymer particles produced by the diatom Coscinodiscus granii. Fisheries Sci. 75 (4), 1007–1014. doi: 10.1007/s12562-009-0122-0
Golyandina N., Zhigljavsky A. (2013). “Singular spectrum analysis for time series,” in SpringerBriefs in Statistics (Berlin, Heidelberg: Springer Berlin Heidelberg).
Grizzetti B., Vigiak O., Udias A., Aloe A., Zanni M., Bouraoui F., et al. (2021). How EU policies could reduce nutrient pollution in European inland and coastal waters. Global Environ. Change 69, 102281. doi: 10.1016/j.gloenvcha.2021.102281
Irtem E., Sacın Y. (2012). Investigation of Lagoon lakes in Kocacay delta by using remote sensing method. Journal of Environmental Biology 33 (2 Suppl), 48792.
Jackson J. B. (2008). Ecological extinction and evolution in the brave new ocean. Proc. Natl. Acad. Sci. 105 (supplement_1), 11458–11465. doi: 10.1073/pnas.0802812105
Kazanci N., Emre O., Erkal T., Ilieri O., Ergin M., Gorur N. (1999). .Morphology and sedimentary facies of actual Kocasu and Gonen River deltas, Sea of Marmara, Northwestern Anatolia. Mineral Res. Explor. Bull. 121, 1–18.
Kömüşcü A.Ü., Çelik S. (2013). Analysis of the Marmara flood in Turkey, 7–10 September 2009: an assessment from hydrometeorological perspective. Natural hazards 66 (2), 781–808. doi: 10.1007/s11069-012-0521-x
Lancelot C. (1995). The mucilage phenomenon in the continental coastal waters of the North Sea. Sci. total Environ. 165 (1-3), 83–102. doi: 10.1016/0048-9697(95)04545-C
Latif M. A., Tezcan D., Yucel M., Orek H., Tugrul S., Fach B., et al. (2022). “Marmara Denizi 2015-2021 yılları arası yuzey sıcaklık ve tuzluluk degisimleri,” in Marmara Denizi 2022 Sempozyumu Bildiriler Kitabı. Turk Deniz Arastırmaları Vakfı (TUDAV), Yayın no: 63, İstanbul, Turkiye.
LeMesnil M., Moussa R., Charlier J. B., Caballero Y. (2021). Impact of karst areas on runoff generation, lateral flow and interbasin groundwater flow at the storm-event timescale. Hydrol. Earth System Sci. 25 (3), 1259–1282. doi: 10.5194/hess-25-1259-2021
MGM. (2021). “State of the Turkey's climate in 2020,” in Climate and Agricultural Meteorology & Research Department, Ministry of Agriculture and Forestry, Turkish State Meteorological Service, Ankara, Turkey. Available at: http://www.emcc.mgm.gov.tr/files/State_of_the_Climate_in_Turkey_in_2020.pdf.
MTA. (2002). “Geological map of Turkey, 1:500,000 scale Istanbul quadrangle,” in Geological Research Department, General Directorate of Mineral Research and Exploration, Ankara, Turkey. Available at: https://www.mta.gov.tr/v3.0/sayfalar/hizmetler/doc/ISTANBUL.pdf.
Oguz T. (2017). Controls of multiple stressors on the Black Sea fishery. Front. Mar. Sci. 4, 110. doi: 10.3389/fmars.2017.00110
Otto D. R. (2019). The impact of climate change on stream flow and watershed hydrology determined using the SWAT model in the Eastern Sierra Nevada Watershed (California).
Ozbayram E. G., Akcaalan R., Isinibilir M., Albay M. (2022). Insights into the bacterial community structure of marine mucilage by metabarcoding. Environ. Sci. pollut. Res. 29 (35), 53249–53258. doi: 10.1007/s11356-022-19626-9
Özsoy E., Altiok H. (2016). A review of water fluxes across the Turkish Straits System. Sea Marmara 42. Available at: https://tudav.org/wp-content/uploads/2018/04/THE_SEA_OF_MARMARA_2016.pdf.
Palmer M. A., Reidy Liermann C. A., Nilsson C., Flörke M., Alcamo J., Lake P. S., et al. (2008). Climate change and the world's river basins: anticipating management options. Front. Ecol. Environ. 6 (2), 81–89. doi: 10.1890/060148
Polat S.Ç., Tugrul S. (1995). Nutrient and organic carbon exchanges between the Black and Marmara Seas through the Bosphorus Strait. Continental Shelf Res. 15 (9), 1115–1132. doi: 10.1016/0278-4343(94)00064-T
Sorlien C. C., Akhun S. D., Seeber L., Steckler M. S., Shillington D. J., Kurt H., et al. (2012). Uniform basin growth over the last 500 ka, North Anatolian Fault, Sea of Marmara, Turkey. Tectonophysics 518, 1–16. doi: 10.1016/j.tecto.2011.10.006
Tavsanoglu U. N., Akbulut N. E. (2019). Seasonal dynamics of riverine zooplankton functional groups in Turkey: Kocaçay Delta as a case study. Turkish J. Fisheries Aquat. Sci. 20 (1), 69–77. doi: 10.4194/1303-2712-v20_1_07
Tugrul S., Besiktepe T., Salihoglu I. (2002). Nutrient exchange fluxes between the Aegean and Black Seas through the Sea of Marmara. Mediterr. Mar. Sci. 3 (1), 33–42. doi: 10.12681/mms.256
TUIK. (2020). Municipal Water Statistics (Ankara, Turkey: Turkish Statistical Institute). Available at: https://biruni.tuik.gov.tr/medas/?kn=121&locale=en (Accessed 1 October 2023).
Uniyal B., Jha M. K., Verma A. K. (2015). Assessing climate change impact on water balance components of a river basin using SWAT model. Water Resour. Manage. 29, 4767–4785. doi: 10.1007/s11269-015-1089-5
Unluata U., Oguz T., Latif M. A., Ozsoy E. (1990). On the physical oceanography of the Turkish Straits. Phys. oceanogr. sea straits 318, 25–60. doi: 10.1007/978-94-009-0677-8_2
van Vliet M. T., Franssen W. H., Yearsley J. R., Ludwig F., Haddeland I., Lettenmaier D. P., et al. (2013). Global river discharge and water temperature under climate change. Global Environ. Change 23 (2), 450–464. doi: 10.1016/j.gloenvcha.2012.11.002
Yi S., Sneeuw N. (2021). Filling the data gaps within GRACE missions using singular spectrum analysis. J. Geophysical Research: Solid Earth 126 (5), e2020JB021227. doi: 10.1029/2020JB021227
Yildiz D., Gunes M. S., Gokalp Yavuz F., Yildiz D. (2018). Detecting seasonal cycle shift on streamflow over Turkey by using multivariate statistical methods. Theor. Appl. Climatol. 133, 1143–1161. doi: 10.1007/s00704-017-2242-2
Yucel M., Ozkan K., Fach B., Tugrul S. (2021). Marmara Denizi’nin Ekolojisi: Deniz Salyası Oluşumu, Etkilesimleri ve Cozum Onerileri (Ankara: Turkish Academy of Sciences).
Appendix A: Operation periods of the streamgages
The names of the streamflow gages that are used (Figure 3A) in this study are shown with their respective operation periods on a map (Figure A1). The information for each watershed is shown with a unique color (analogous to Figure 3B).
Appendix B: Decadal and regional averages of total coastal discharge
The coastal discharges are averaged over six decades (Table B1). The seasonal variation for total flow shows an order of magnitude change from wet to dry seasons (~310 m3 s-1 to 20 m3 s-1). The decadal averages of the total coastal discharge decrease with time. Coastal discharges from the northern, eastern and southern watersheds are approximately ~3%, ~17% and ~80% of the total discharge; in the last decade this respectively amounts to 0.1, 0.4 and 2.5 km3 per year.
Keywords: Sea of Marmara, coastal river discharge, runoff extremes, climate change, spatial-temporal change, seasonal (long-term) trends
Citation: Basdurak BN (2023) Climate change impacts on river discharge to the Sea of Marmara. Front. Mar. Sci. 10:1278136. doi: 10.3389/fmars.2023.1278136
Received: 15 August 2023; Accepted: 17 October 2023;
Published: 10 November 2023.
Edited by:
Achilleas G. Samaras, Democritus University of Thrace, GreeceReviewed by:
Michael Nones, Polish Academy of Sciences, PolandJosé Pinho, University of Minho, Portugal
Copyright © 2023 Basdurak. This is an open-access article distributed under the terms of the Creative Commons Attribution License (CC BY). The use, distribution or reproduction in other forums is permitted, provided the original author(s) and the copyright owner(s) are credited and that the original publication in this journal is cited, in accordance with accepted academic practice. No use, distribution or reproduction is permitted which does not comply with these terms.
*Correspondence: Berkay Nüvit Basdurak, YmVya2F5QGltcy5tZXR1LmVkdS50cg==; YmVya2F5LmJhc2R1cmFrQGlvLXdhcm5lbXVlbmRlLmRl
 Berkay Nüvit Basdurak