 Chengpu Jiang
 Daniel Pauly
 Wenqing Wang1
 Jianguo Du
 Jianhua Cheng
 Mao Wang
- 1Key Laboratory of the Coastal and Wetland Ecosystems (Xiamen University), Ministry of Education, College of the Environment and Ecology, Xiamen University, Xiamen, China
- 2Sea Around Us, Institute for the Oceans and Fisheries, University of British Columbia, Vancouver, BC, Canada
- 3Third Institute of Oceanography, Ministry of Natural Resources, Xiamen, China
Introduction: Marine and coastal ecosystems are complex, especially because of the connection between their many functional groups and the various habitats provided by subsystems.
Method: To describe the trophic interactions, energy flows, and spatial distribution of species in the ecosystem of Dongzhaigang Bay, in Hainan, China, 28 functional groups were identified, incorporated in Ecopath and Ecospace models, and used to derive the particle size and spatial distribution of the functional groups.
Result: The results show that the trophic levels of top predators are lower than in similar ecosystems, but that the ecosystem of Dongzhaigang Bay exhibits a high ecotrophic efficiency, leading to a high fraction of its primary and secondary production being transferred to the higher trophic levels. The particle size distribution (PSD; i.e., log(biomass) vs log(particle weight)) in Dongzhaigang Bay, the first estimated for any mangrove ecosystem, has a slope (-0.80) similar to that of other ecosystems along China’s coast , but does not include the largest size groups. Ecospace allowed a visualization of the functional groups in Dongzhaigang Bay, which can serve as a basis, e.g., for identifying areas requiring special protection.
Discussion: Though the status of the bay, overall, appears to be better than many of the Chinese coastal ecosystems, further monitoring and data collection are required to deepen the understanding of the interactions within the ecosystems, and the impacts of human activities on Dongzhaigang Bay. The models presented here should help in this undertaking.
1 Introduction
Mangroves are coastal biotopes occurring in the tropics and subtropics along the bays, estuaries and inlets (Valiela et al., 2001), which provide biological, ecological, educational, environmental and socio-economic services to humanity (Costanza et al., 1997). Mangrove ecosystems act as nurseries for numerous species of larger marine fish, while providing productive habitats for smaller fish and for mollusks, crabs, shrimp, etc., beside nesting grounds for birds (Nagelkerken et al., 2008).
The typically small-scale, i.e., subsistence and/or artisanal fisheries in mangrove ecosystems have not received much scientific attention, although they provide food and income to many coastal communities in the Global South. Thus, the anthropogenic and environmental impacts on these ecosystems are understudied, as is their functioning. Some of the few mangrove ecosystems for which trophic models have been constructed are the Futian mangrove wetland ecosystem in China (Chou et al., 2014), the mangrove surrounding a coastal lagoon in the Yucatan Peninsula, Mexico (Vega-Cendejas and Arreguin-Sánchez, 2001) and the Caete Mangrove Estuary, North Brazil (Wolff et al., 2000).
Rehren et al. (2022), who evaluated the ecosystem impacts of gear regulations in a data-limited fishery using the Ecopath with Ecosim (EwE) software, point out that ecosystem simulation models, which can consider various anthropogenic and environmental effects on the energy flows within ecosystems, can be used to identify pathways to the sustainable exploitation of mangroves; see also Vega-Cendejas and Arreguin-Sánchez (2001). However, the lack of statistics on fishery fishing data, feeding composition of functional groups, etc., may lead to low biomass or incorrect feeding proportions of functional groups, thus affecting the results after model balancing.
Among current ecosystem models, the EwE software is the most widely for marine ecosystems; currently, it consists of 3 elements: (i) Ecopath, for the static representation of the food webs of ecosystems (Polovina, 1984; Christensen and Pauly, 1992), (ii) Ecosim, for simulating time-dynamic changes in ecosystems, e.g., as a result of increasing fishing pressure (Walters et al., 1997), and (iii) Ecospace, which allows the food webs constructed with Ecopath to be projected onto maps and studied spatially (Walters et al., 1999). Colléter et al. (2015) documented the existence of 600 published EwE models of which there will be more currently (see http://sirs.agrocampus-ouest.fr/EcoBase/).
One of the major purposes of this study is to explore the food web, construct particle size distribution (PSD) spectra, and map the distribution of functional groups in the Dongzhaigang Bay by means of the Ecopath and Ecospace modules of EwE model, as a step toward adding to the understanding of this specific ecosystem, and of mangrove ecosystems in general. More specifically, the objectives of this study are (1) to construct a mass-balance model of the trophic interactions of functional groups within Dongzhaigang Bay using Ecopath; (2) to derive a particle size distribution (PSD) from that model, and to compare its slope with that of other ecosystems to infer the impact of fisheries; (3) to represent the observed distribution and biomass of functional groups as predicted by Ecospace using their affinities to the 3 subsystems (or ‘habitats’) previously identified in Dongzhaigang Bay, i.e., the mangrove proper (17.7 km2), the mudflats, and the deeper areas (Figure 1). Therefore, using an appropriate ecological model is an essential tool to analyze and solve ecosystem-based management, especially in the situations with scarce data (Pauly, 2002).
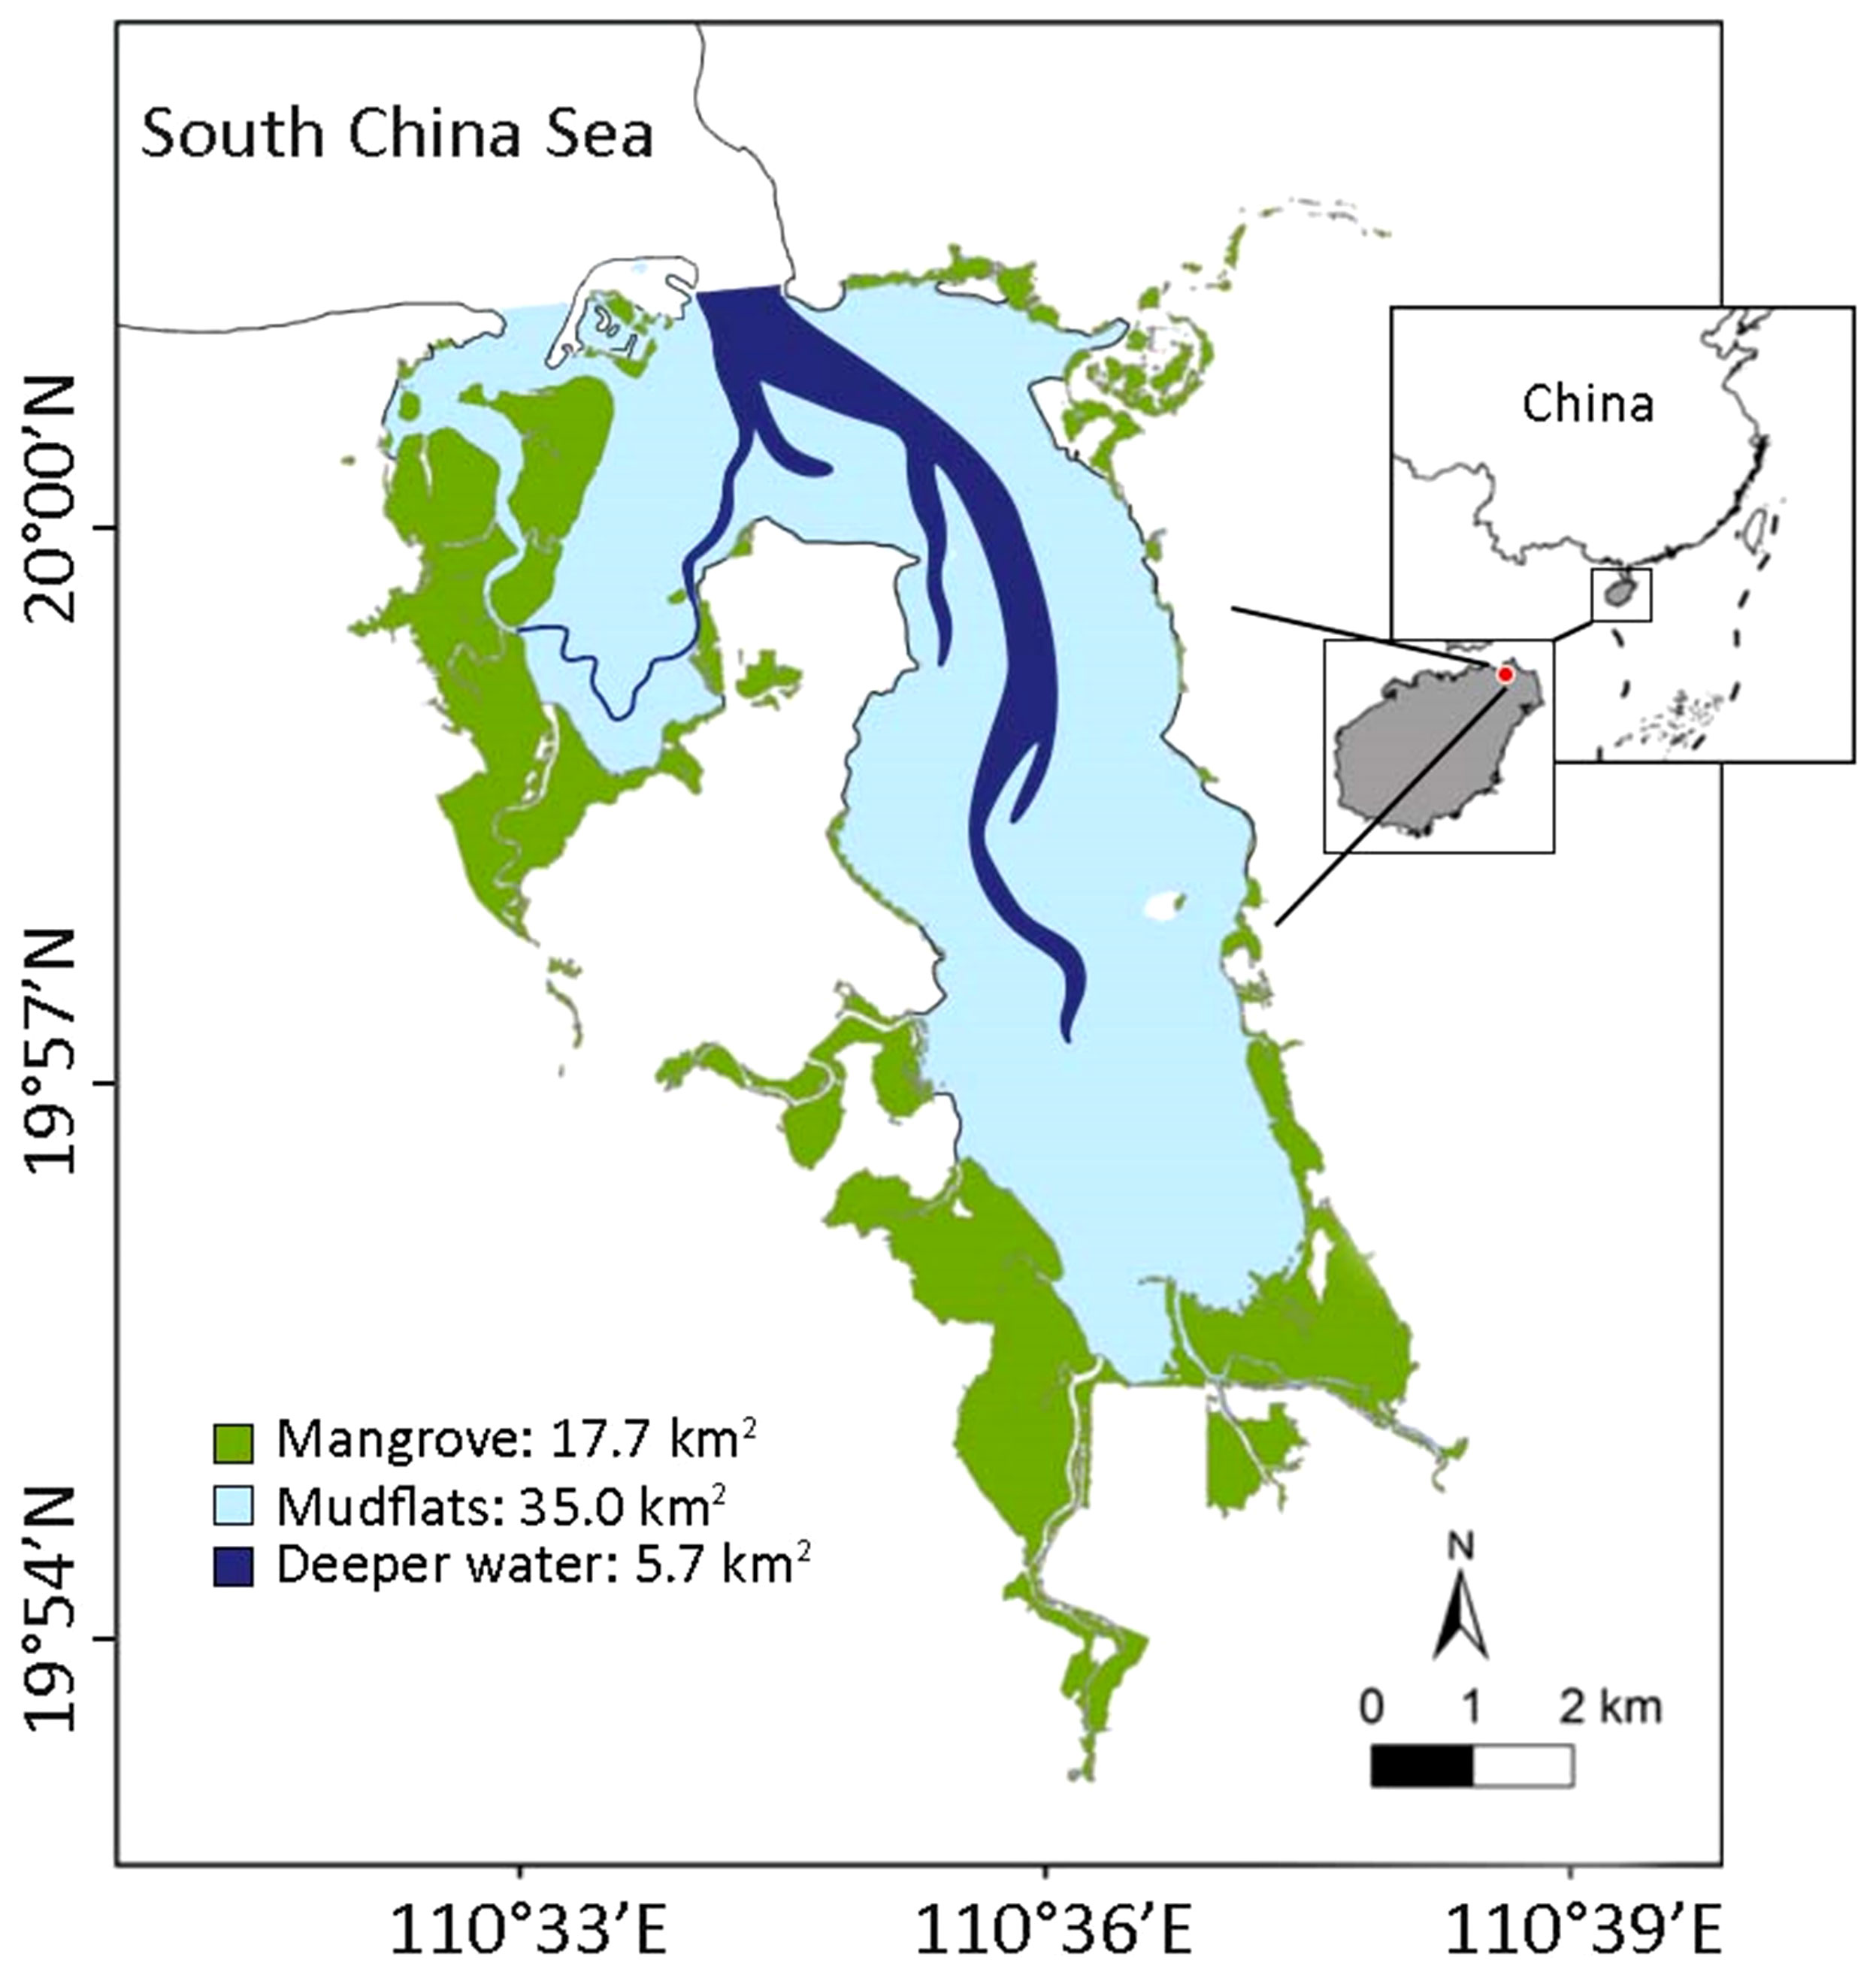
Figure 1 Map showing the distribution of mangrove, mudflat and deeper water around Dongzhaigang Bay, Hainan Province, China.
2 Materials and methods
2.1 Study area
The area of Dongzhaigang Bay is 58.4 km2 and is located in southern China, Hainan province. It consists of three subsystems, i.e., a mangrove area of 17.7 km2, a mudflat area of 37.0 km2 and a deeper water area of 5.7 km2 (Figure 1), with an average depth of about 2 m after the ebb. The species of flora and fauna are highly diverse. A total of 35 species from 25 genera and 18 families of mangrove plants have been recorded, including 24 species from 14 genera and 10 families of true mangroves and 11 species from 11 genera and 8 families of minor mangroves. There are 55 species from 34 genera and 6 phyla of phytoplankton, with diatoms being the dominant group (27 species from 14 genera). Zooplankton species are the most abundant in spring and summer (up to 60 species), with crustacean larvae and other zooplankton larvae being the dominant groups. There are 112 species from 48 families of mollusks and 70 species from 12 families of crabs, with the Sesarmidae and Ocypodidae being the dominant groups. Fish species are 174, belonging to 1 class, 16 orders, and 62 families, with the Perciformes and Gobiidae being the most abundant. Finally, there are 181 species from 44 families of birds across 16 orders.
2.2 Trophic modeling with Ecopath
We identified 28 functional groups covering as many ecological niches as possible to represent the entire ecosystem. Here, our main criterion was that species with overlapping traits and/or ecological niches (such as individual size, diet composition, or habitat preference) were to be combined to avoid creating a overcomplicated food web, while economically important species (which usually were also most abundant) were allowed to form their own functional group.
Omnivorous fish, carnivorous fish, polychaete worms, zooplankton, primary producer and detritus are each represented by subsystem-specific functional groups (e.g., zooplankton I, II and III), assigned to the mangrove proper (I), the mudflat (II) and the deeper bay (III); see Figure 1). The basic inputs and growth parameters are derived from field studies conducted in 2009-2020 (notably Jiang et al., 2022a; Jiang et al., 2022b), and various other documents. Major traits of species in functional groups (such as their size), which do not vary much between localities, were taken from major biodiversity databases, i.e., FishBase (Froese and Pauly, 2022) and SeaLifeBase (Palomares and Pauly, 2019). These studies and data are not detailed enough to not allow a consideration of seasonality which is not usually accounted for explicitly in Ecopath models, although seasonal changes are implicitly accounted for.
Ecopath helps toward the construction of a ‘box’ model of ecosystem wherein, given the diet composition of the species in each box (representing a functional group) via the equation:
where Bi and Bj are the biomass of prey i and predator j, respectively; P/Bi is the production/biomass ratio of predator i; Q/Bj is the consumption/biomass ratio of predator j; DCji is the composition of prey i to the diet of predator j; EEi is the ecotrophic efficiency of prey i and EXi is the exportation of prey i.
Equation (1) forms the basis of all Ecopath models, which in effect consists of a matrix of equations, one each for the i groups in the ecosystem. Ecopath then inverts the matrix in one go, and given that it is the biomass Bi that were left as unknown, they are estimated by the software. When the other variables are assigned values that are mutually incompatible, Ecopath biomasses either cannot invert the matrix or outputs impossible estimates of EE (e.g., EE > 1). In this case, it is usually the diet composition of one of several consumers that needs to be adjusted until mass balance is achieved.
Generally, P/Bi and Q/Bj are entered based on previous studies, external to the ecosystem under investigation, and the DCji values are partly based on studies of local functional groups and on the diet of the taxa in question in FishBase and SeaLifeBase. Finally, the biomass can be either entered, or estimated by Ecopath, depending on whether EEi is entered or is left unknown, while the fractional trophic level (TL) of each functional group is estimated internally by Ecopath from:
where TLi and TLj are the tropic level of prey i and predator j, respectively.
2.3 Particle size distribution
The particle size distribution (PSD) of aquatic ecosystems is one of their important features, which allows for assessing the impacts of anthropogenic and environmental factors on ecosystems (Zhai and Pauly, 2020; Kanzler et al., 2022). Here, we use the PSD routine of EwE, to plot the logarithm of the summed functional groups’ biomasses estimated by Ecopath against the logarithm of the individual weights of the different groups represented. However, some groups, given their size range, occur in several weight classes (or ‘bins’), and given their growth parameters, grow out of weight bins at different rates.
Accounting for these two effects can be done, following Pauly and Christensen (2002) by representing the growth of typical individuals (e.g., of the dominant species in each ‘box’ of the Ecopath model) by the von Bertalanffy Growth Function (VBGF) for growth in length, which has the form:
where L∞ is the asymptotic length (i.e., the mean length the organisms would reach if they grew indefinitely), K is the rate at which the asymptotic size is approached, and t0 is the age at with the organism in question had a size of zero (note that t0 is of no interest here, as it doesn’t appear in the equation used in computing a PDS). The equation thus can be used to determine a length Lt at age t, but also can be modified to determine the time (Δt) required through a weight bin (see below).
Based on the length-weight relationship, or LWR of the form W = a·Lb, the VBGF for growth in weight is
where W∞ is the weight corresponding to L∞. To estimate the relative time (t') required to reach a given weight (‘relative’ because t0 is not used), Ecopath uses
which is computed for the weight corresponding to the weight limits of each weight bin, then subtracted from each other to estimate the value of Δt for each weight bin.
In Ecopath, the survival individuals are described by
where Δt is the time a species or group need to grow through a bin or weight class and Z is the instantaneous rate of total mortality ratio, which is the same as the production/biomass (P/B) ratio when the VBGF is used to model growth (Allen, 1971), as is the case here. P/B ratios are an input independent of PDS (see above) and are thus do not require to be additionally provided to Ecopath, and Nt is the number at time t, Nt-Δt is the number at time t-Δt.
Given the average number of individuals in each bin, as computed from Equation (7), and their average weight, as computed from Equation (5), the biomass contribution of each group that transits through a bin i computed from
where Ni, Wi and Δti are defined previously and Bi is the biomass contribution to bin i of a given group, with the process repeated for all groups or boxes.
Note that the computation involved here are performed internally by Ecopath, and that no input is required for PSD to be computed – once a food web model is balanced – beyond entering growth parameters (L∞ and K) and the parameters (a and b) of a length-weight relationship for each of the species representative of a box. Note also that arbitrary values can be entered with a box containing organisms whose size range is accommodated within one size bin of the PSD.
2.4 Ecospace
Ecospace is an effective tool to make food web models spatially explicit (Walters et al., 1999); it a dynamic version of Ecopath, incorporating key elements of Ecosim (Pauly et al., 2000), which replicates the biomass over a grid map (here, 25 x 25 cells were chosen for convenience; fewer or more cells could have been used). Ecospace was used to divide the study area into 3 habitats based on depth and ecological relevance, i.e., a mangrove area, a mudflat area, and a deeper water area (see Figure 1).
The 28 functional groups of the Ecopath model were assigned to either of these three preferred habitats or to 2 or 3 of them in the case of groups assumed to have relatively wide distributions. The default movement rates (m) provided by Ecospace for the various groups were used; these values, which are roughly proportional to their trophic level, and are based on the fact that larger, high-trophic levels animals usually have larger ranges than small animals (Walters et al., 1999) are tentative, but similar results (i.e., distribution maps) were obtained using different values. Based on our field observations, the fishery was assumed to be distributed uniformly with regard to the habitat types. For example, it is only the distribution of the organisms (mainly gobies) which determined where the fishers operate, and not fishing costs, e.g., associated with distance from the coast (which, however, could have been accommodated by Ecospace).
3 Results
3.1 Modelling outputs and the food web
Table 1 presents the 28 functional groups (or ‘boxes’) used to describe the ecosystem of Dongzhaigang Bay. The basic input included mainly the biomasses (B), production/biomass ratios (P/B) and consumption/biomass ratios (Q/B), while the trophic levels (TL) and ecotrophic efficiencies (EE) were calculated by Ecopath based on input above, and diet composition data in Table 2. In the bay, marine mammals and sharks rarely occur, and thus seabirds and carnivorous bony fish are top predators, though their trophic level (TL ≈ 3.5) is relatively low. In addition, except for seabirds and detritus, 79% of functional groups have high EE values (over 0.8), suggesting that most of their production was efficiently transferred to their predators.
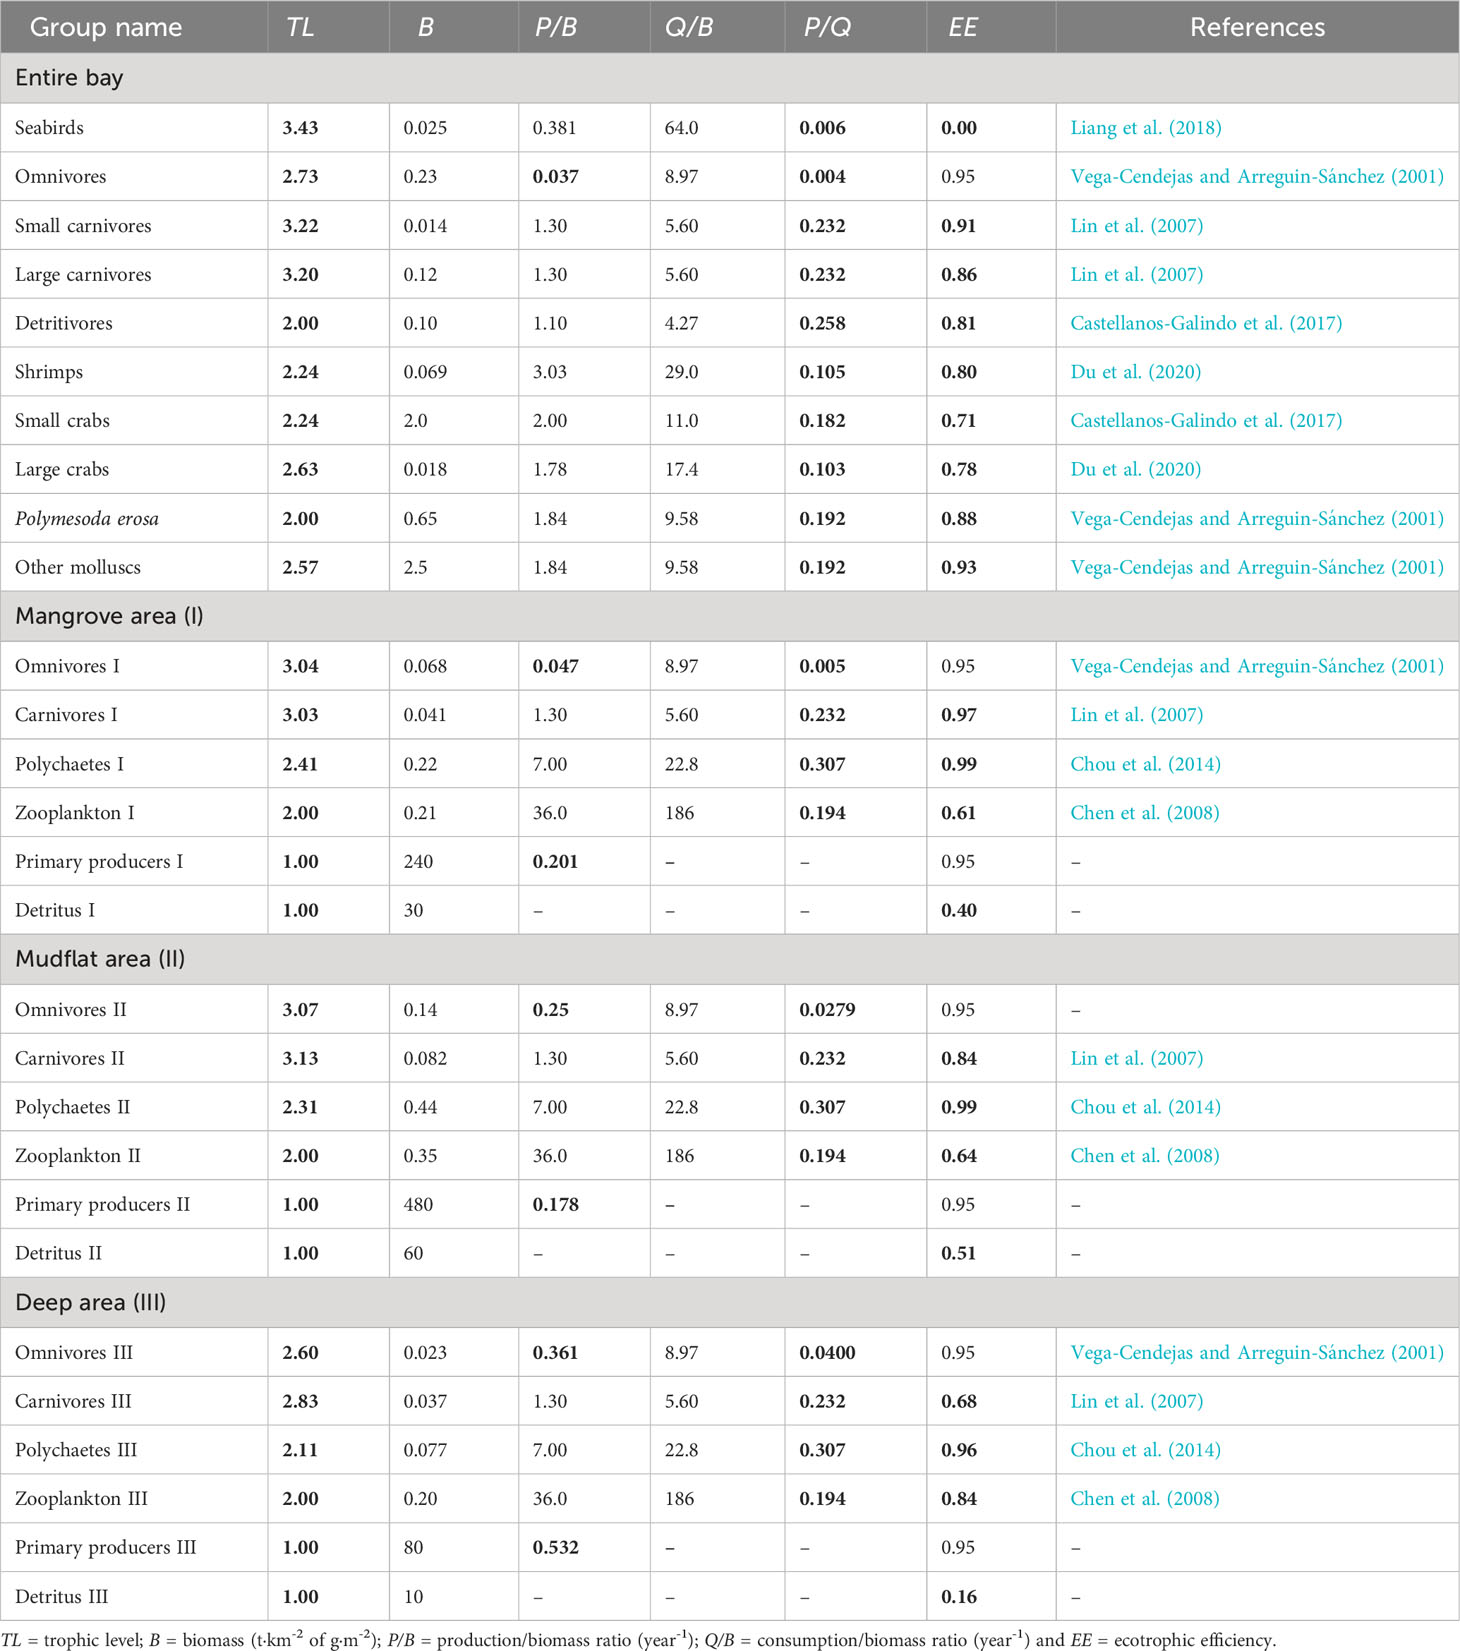
Table 1 Basic input and estimate (bold) calculated by the Ecopath in the Dongzhaigang Bay, Southern China.
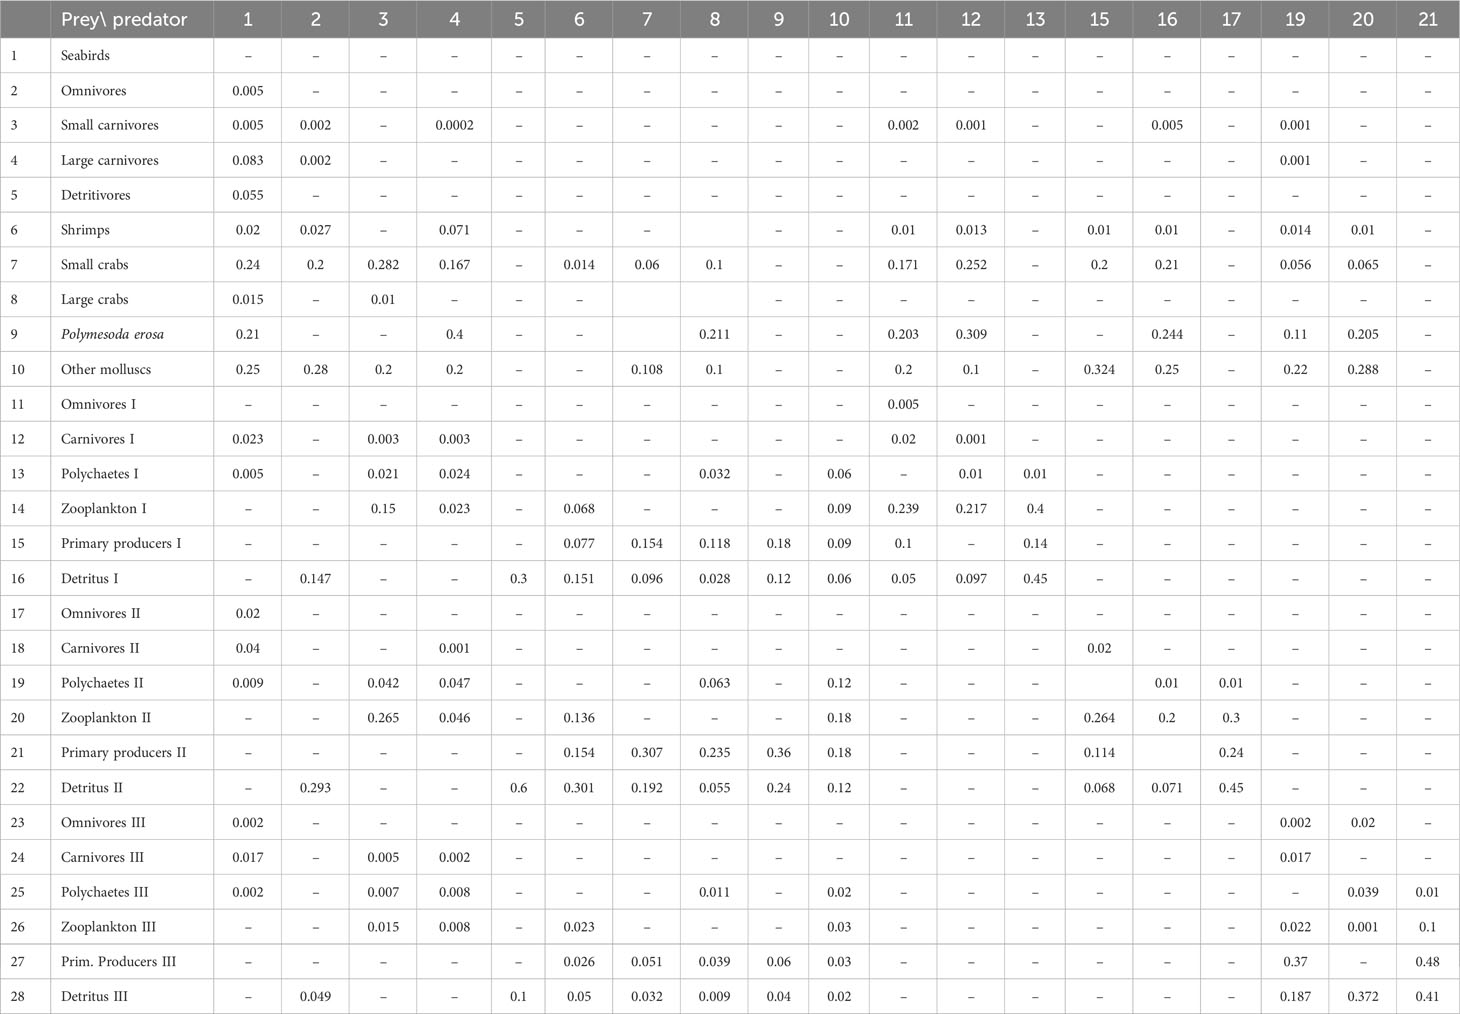
Table 2 Diet composition used to balance the Ecopath model of Dongzhaigang Bay, Southern China. The data are mainly from FishBase and SeaLifeBase, as modified to achieve balance. As primary producers I, II and III have no prey, the columns # 14, 18 and 22 are omitted.
Table 2 presents the diet composition used to balance the Ecopath model, based on the field data and FishBase (www.fishbase.org). Note that the model could have been balanced with different values. Thus, the present parametrization should be viewed as tentative and likely to be improved as a result of focused research. The corresponding network flow of trophic interactions is presented in Figure 2.

Figure 2 The food flow diagram in the Dongzhaigang Bay, southern China. The size of circle is related to the biomass of each functional group.
3.2 PSD
Table 3 shows the parameters used to represent ontogenic growth in each functional group, as represented by the species with the highest biomass in each group. These estimates were adapted mainly from the study of Zhai and Pauly (2020), FishBase (www.fishbase.org), and SeaLifeBase (www.sealifebase.org).
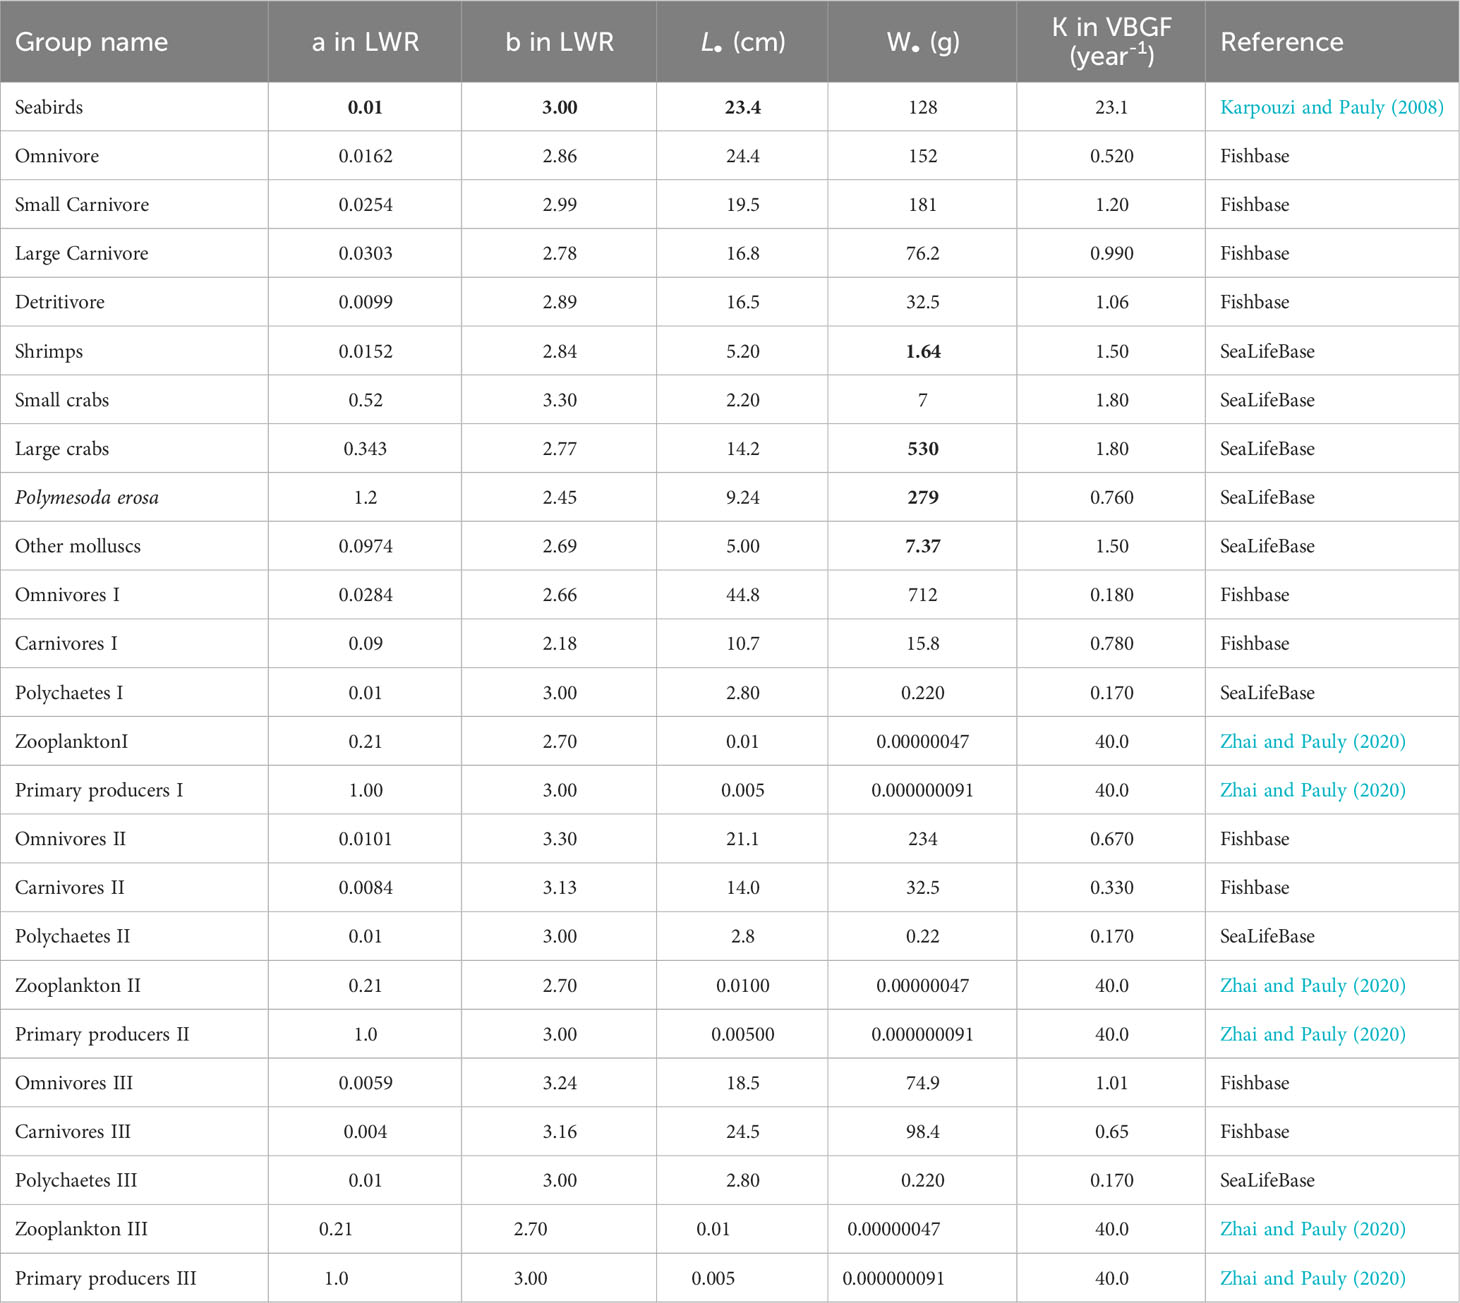
Table 3 Growth input and estimate (bold) calculated by the Ecopath in the Dongzhaigang Bay, southern China.
The PSD spectrum for Dongzhaigang Bay (Figure 3B) has a slope of -0.80 with a standard error of 0.24. The mean slope in 19 Chinese coastal ecosystems is -0.89, which is steeper than the present study (Figure 3A); also, most of these PSD extend further into larger size groups (Figure 3B).
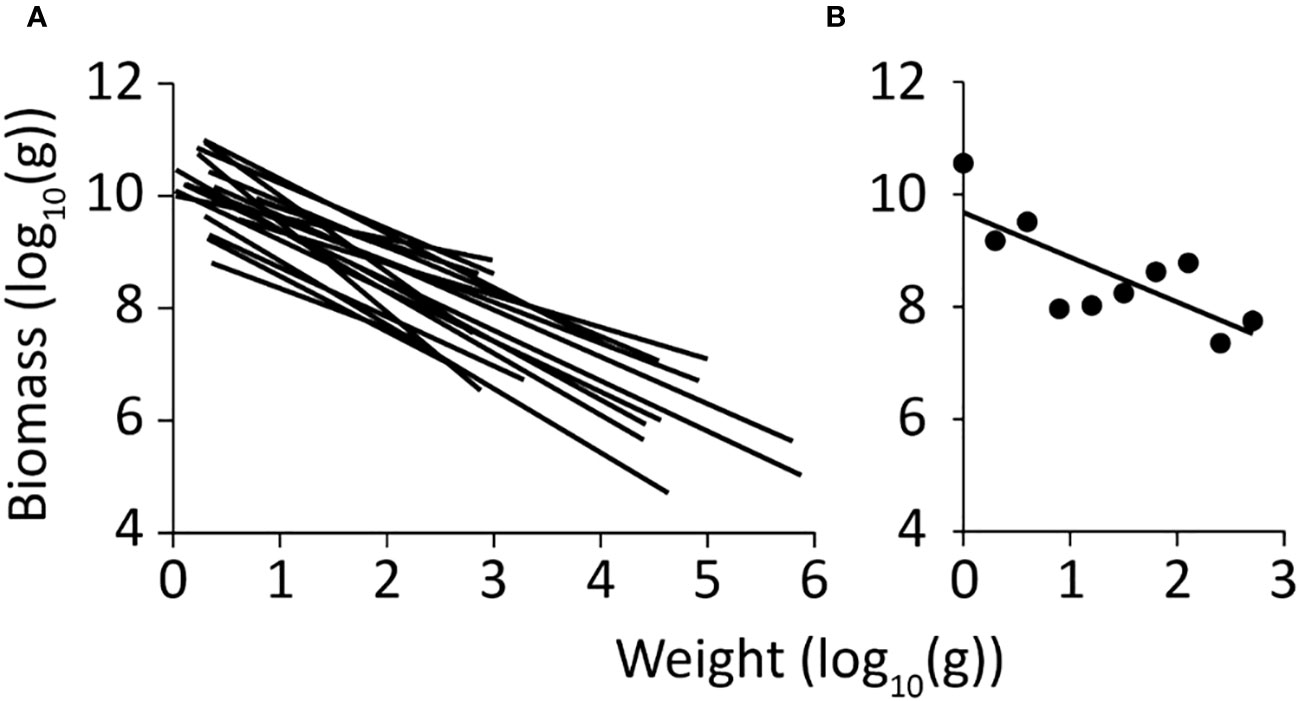
Figure 3 Particle size distribution (PSD) spectra of China’s coastal ecosystems. (A) PSD of 19 Ecopath food web models, with a mean slope of -0.89, and a standard error of 0.069 (Zhai and Pauly, 2020); (B) PSD of the Ecopath model of Dongzhaigang Bay. Note that while is slope is similar (-0.80; st. error = 0.24), the PDS of the Dongzhaigang Bay ecosystem is truncated and does not include animals whose weight exceeds 1000 g.
3.3 Ecospace
Each of the panels of Figure 4 presents the density distribution of a group, as impacted in the case of heterotrophs by the availability of their prey, the prey of their prey, and the predator(s) of all. Conservative rates of movement between spatial cells within and the ‘spillover’ outside the ecosystem types are also considered. Thus, Ecospace validates the Ecopath model and its 3 subsystems in the sense that they are possible, i.e., they do not lead to components lacking food in it subsystem, or encountering so many predators that they would go locally extinct.
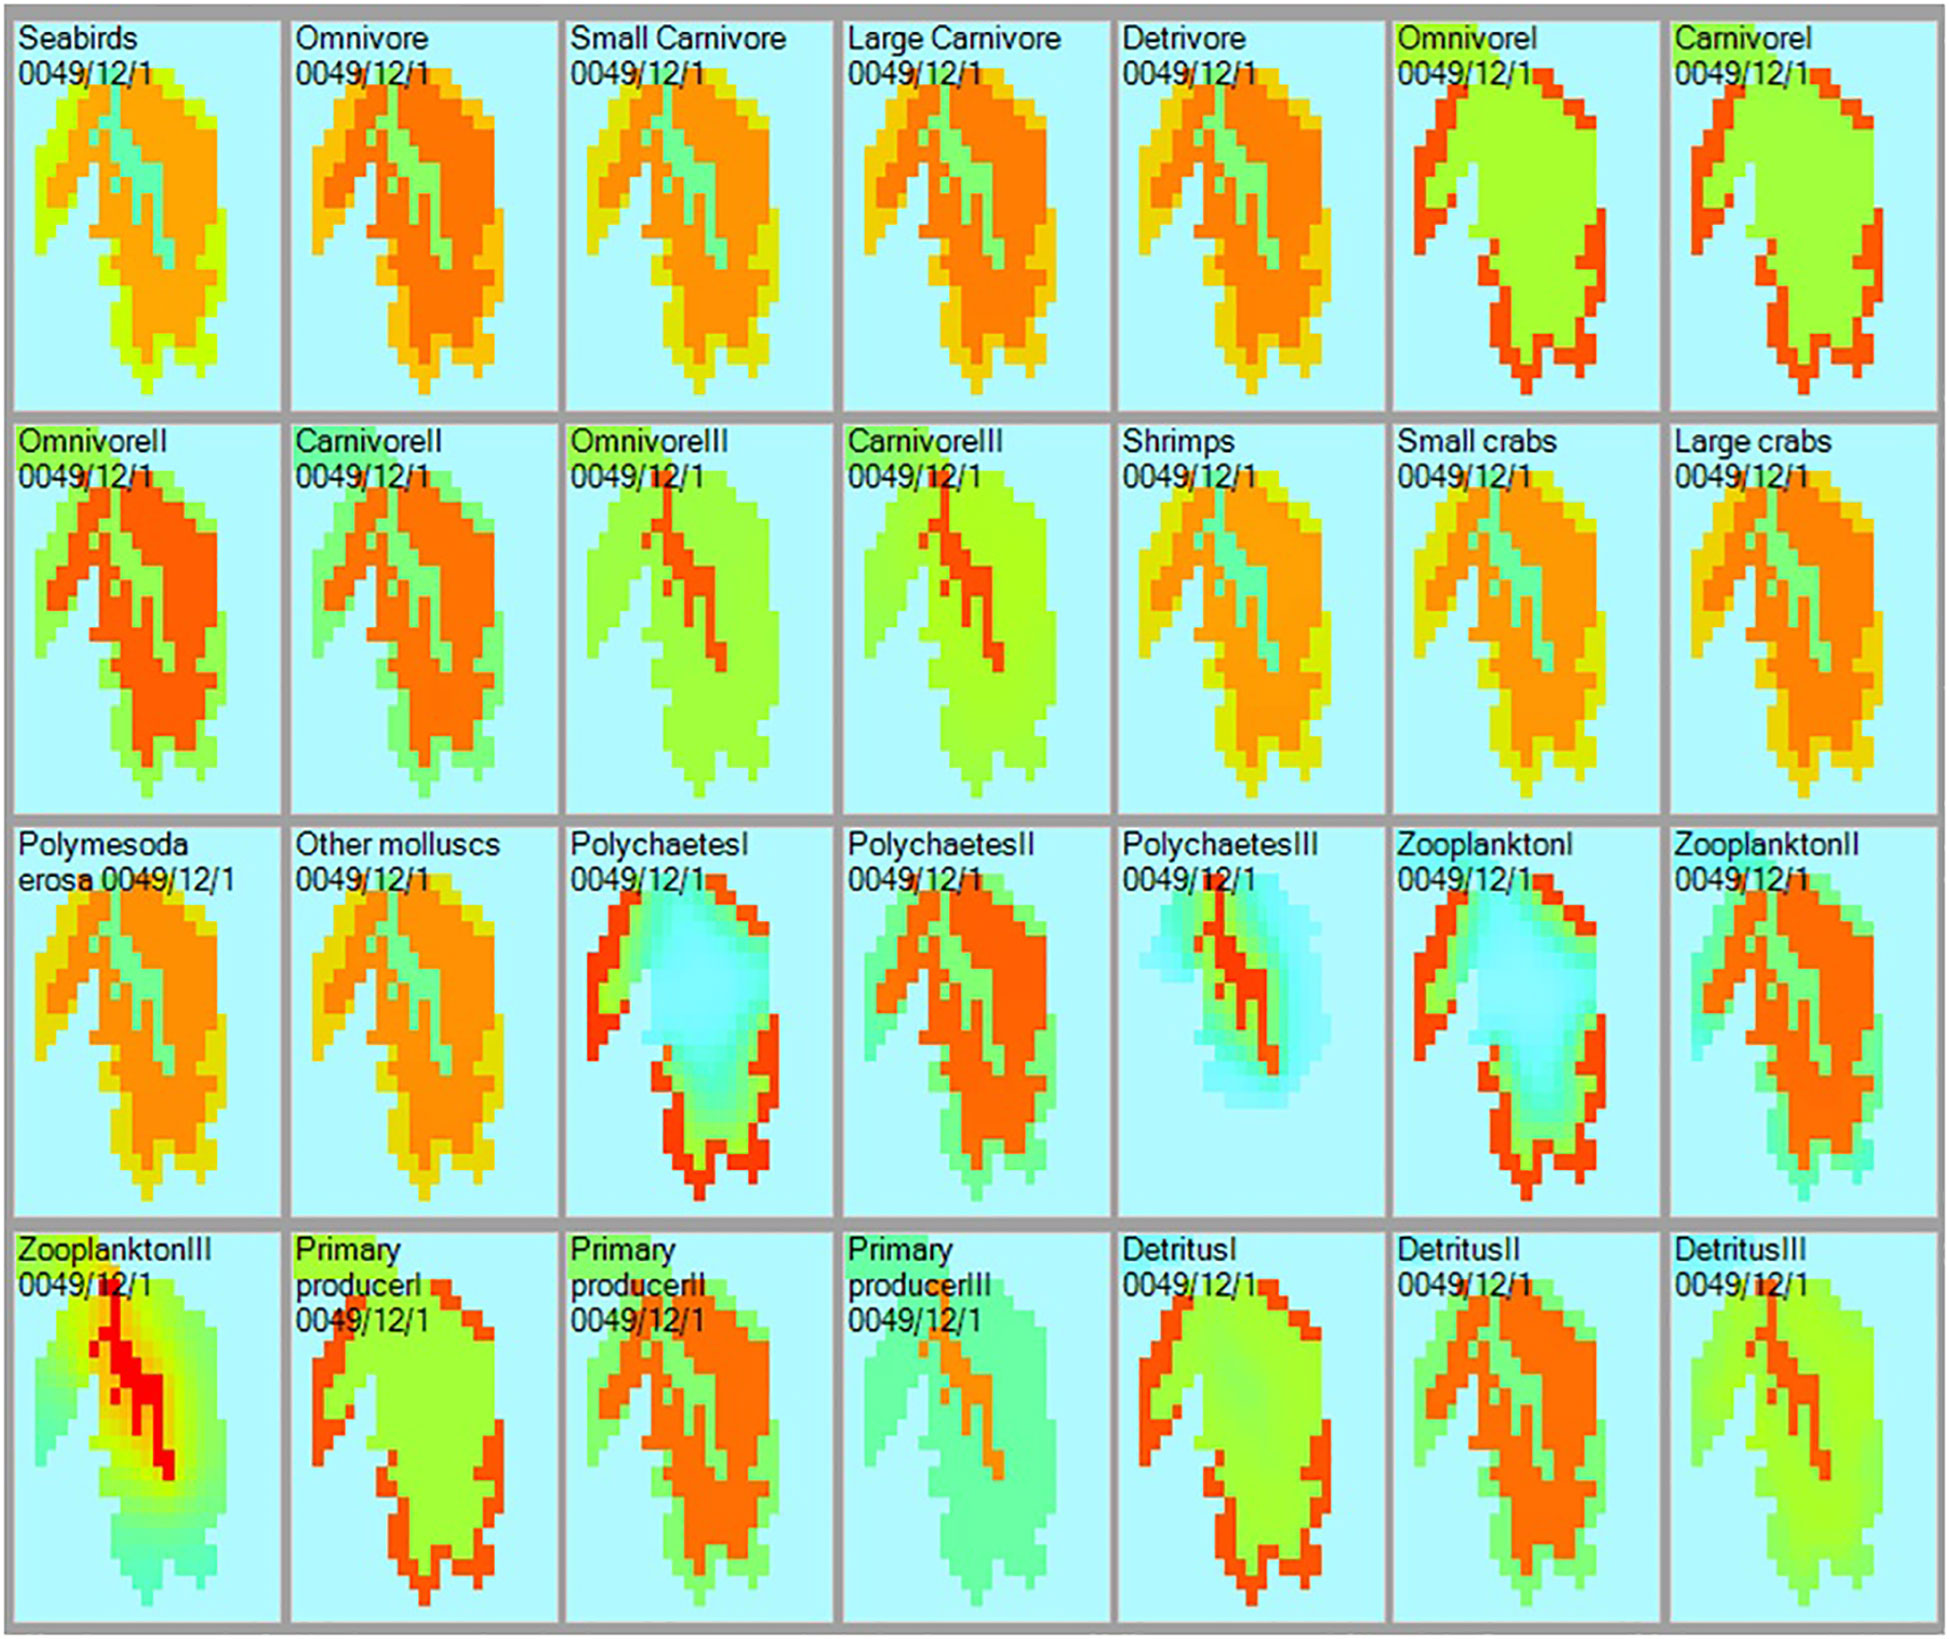
Figure 4 Distribution and relative biomass (green = low; red = high) of the 28 functional group included in the Ecopath models of the Dongzhaigang Bay ecosystem, as computed by Ecospace. Note that the abundances of the predators (or prey) are ‘possible’ because their prey’s productivity (or predators’ food consumption), and their joint local abundances are appropriate, as ensured by Ecospace (see text).
4 Discussion
Describing food web structure and energy flow in mangrove ecosystems is difficult because of frequent data limitations on the sources of organic matter that sustain various animal communities. Many studies (e.g., Manickchand-Heileman et al., 1998; Ray et al., 2000; Wolff et al., 2000; Vega-Cendejas and Arreguin-Sánchez, 2001) have used network analysis methods, usually the Ecopath software (Christensen and Pauly, 1992) to construct comprehensive accounts of energy flows in mangrove ecosystems. While this approach has its own merits and is now the most commonly used tool for assessing the potential impact of ecosystem changes on overall energy flows, the input data to Ecopath models require a solid understanding of the dietary habits of key ecosystem components. Additionally, while recent studies have highlighted the importance of microfauna and allochthonous carbon sources to intertidal food webs, current models omit microfauna from their analyses. The assumption that mangrove litter or mangrove-derived detritus is the primary food source for certain functional groups (e.g., fiddler crabs, Wolff et al., 2000) may bias model outputs, as tracer method studies have shown that mangrove carbon sources contribute little to the diet of these functional groups (France, 1998; Meziane et al., 2002; Bouillon et al., 2004), and this bias will be transferred to higher trophic levels. Therefore, when constructing an ecosystem model, it is often still necessary to combine specific tracer studies, experimental studies of trophic interactions, etc., so that the modeling work can produce more realistic output.
The primary producers in the Dongzhaigang Bay ecosystem are mangroves, seaweed, and phytoplankton, but energy flows not only from them, but also from the detritus (Table 4). The transfer efficiency calculated as the geometric mean for TL II to IV, from primary producer and from the detritus is 12 and 11%, respectively, close to the mean of 10% for marine ecosystems (Pauly and Christensen, 1995), which is different from the results of the Futian mangrove ecosystem (Chou et al., 2014).
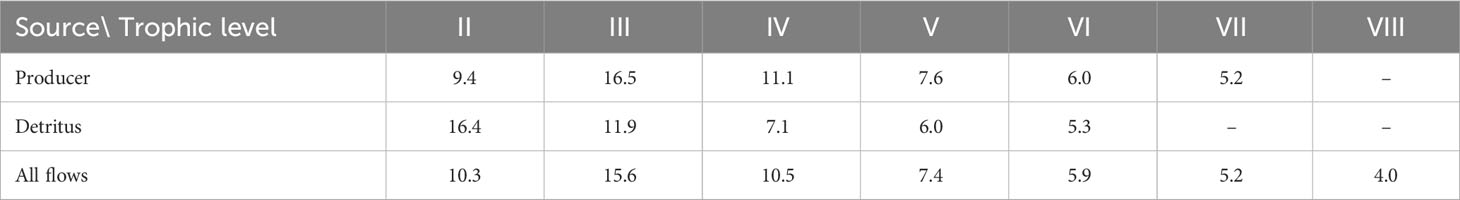
Table 4 Transfer efficiencies of trophic level in the Dongzhaigang Bay, calculated as geometric mean for TL II-IV, from primary producer 12.0%, from detritus 11.1%, total 11.9%.
However, overall system throughput in the Dongzhaigang Bay ecosystem is only 458 t·km-2·year-1 (Tables 5, S1), which is much lower than 10560 t t·km-2·year-1 in the Caete mangrove estuary (Wolff et al., 2000), 8520 t·km-2·year-1 in Beibu Gulf (Chen et al., 2008), 4581 t·km-2·year-1 in the Celestun lagoon (Vega-Cendejas and Arreguin-Sánchez, 2001), 4158 t·km-2·year-1 in the Futian mangrove wetland ecosystem (Chou et al., 2014) and even 2047 t·km-2·year-1 on Campeche Bank, Gulf of Mexico (Vega-Cendejas et al., 1993). This suggests either that (i) the Dongzhaigang Bay ecosystem is severely overfished, with a very low biomass of fish and invertebrates (Jiang et al., 2022b), (ii) that it’s their catch (and thus their biomass and the biomass of their prey) was severely underestimated, or that (iii) both apply.
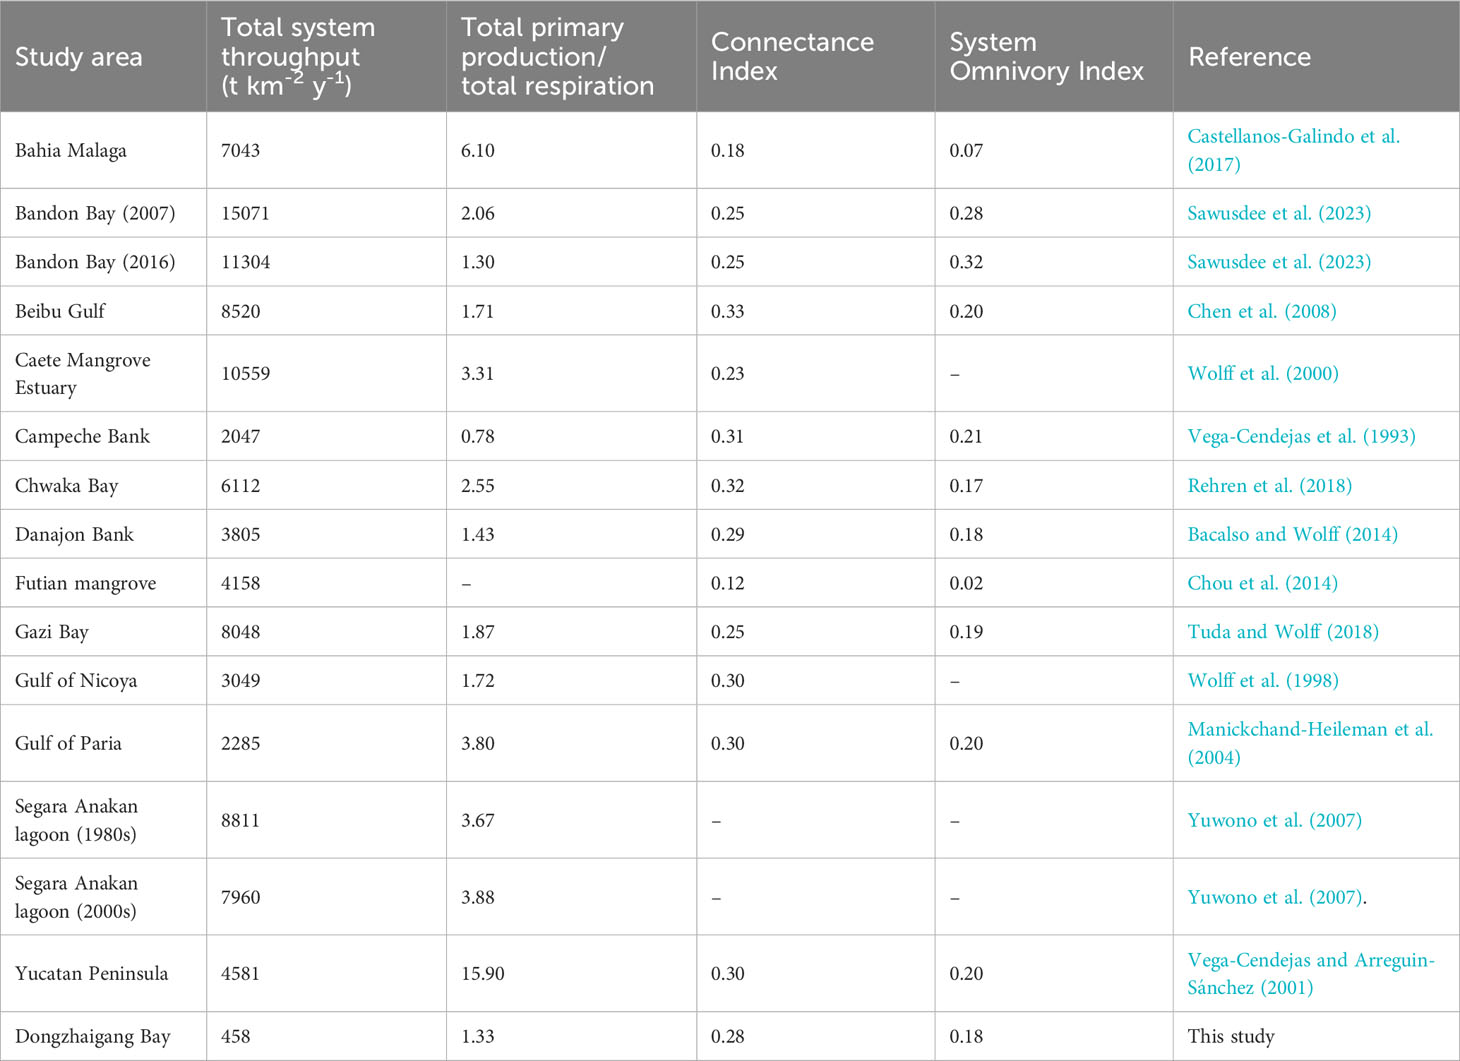
Table 5 Some important parameters for the Dongzhaigang Bay model in comparison to other tropical coastal systems.
The PSD research method has not been widely used; some of the exceptions include Palomares et al. (2009) and Zhai and Pauly (2020). They show that PSD can be obtained directly from Ecopath models, and reflect fishing pressure. Therefore, this study applied this method the mangrove ecosystem of Dongzhaigang Bay and compared its slope with those of other ecosystems in China to evaluate their current and/or past levels of fishing pressure (Figure 3). This showed that the slope of the PSD becomes steeper over time in areas such as the Bohai Sea, Jiaozhou Bay and the northern South China Sea (Zhai and Pauly, 2020). This indicates an increasing fishing pressure over time. Furthermore, Liang and Pauly (2017) demonstrated a “fishing down” effect (Pauly et al., 1998) in the coastal waters of the East China Sea. This implies that most coastal and nearshore ecosystems exhibit similar trends, including Dongzhaigang Bay, which aligns with the results of fisheries resource assessments in the region (Jiang et al., 2022b). The fact that the PSD of the Dongzhaigang Bay ecosystem is truncated and consists exclusively of species with maximum weights below 1 kg, moreover, supports hypothesis (i) above, as does the fact that the top predators in the bay are seabirds and medium-sized body fish, both with trophic levels below 3.5. This is also supported by the miniaturization of several fish species, notably green goby (Acentrogobius viridipunctatus) which now mature at an even smaller size than in 2009 (Jiang et al., 2022b).
Also, Pauly et al. (1998) and Pauly and Watson (2005) suggested that the mean trophic level of fisheries catches can be used as a metric of their ecosystem impact. The mean trophic level of the fisheries catch in Dongzhaigang Bay was 2.7, which is markedly higher than, e.g., the estimate 2.1 from the Caete mangrove estuary, where the fishery relies overwhelmingly on mangrove crab Ucides cordatus, which feeds exclusively on mangrove leaves (Wolff et al., 2000). In Dongzhaigang Bay, the most important fishery resource occurs on the mud flat, in form of a large omnivorous crab (e.g., Scylla serrata).
The ecotrophic efficiency (EE) of various groups is a key indicator of their role in an ecosystem. As is seen in Table 1, the EE of each functional group ranged from 0.16 to 0.99, which is consistent with the recommended range (Christensen et al., 2008) and other models (Ullah et al., 2012; Du et al., 2020; Otogo et al., 2022). EE values are expected to be close to 1 for organisms that are heavily exploited and/or preyed upon, and very low for groups not consumed with the ecosystem; thus EE is usually expected to be low for the top predator (Christensen et al., 2000), such as seabirds in the case of Dongzhaigang Bay. On the other hand, higher EE (> 0.80) of the groups that included fish, shrimp and mollusks are consistent with their full utilization. In addition, when comparing different microhabitats, it was found that the EE values for detritus were generally low, especially in deeper water areas. This suggests that primary consumers tend to prefer feeding on primary producers, or it may be due to their relatively larger biomass. However, in deeper water areas, the EE of carnivorous fish was markedly lower.
The relatively low connectance index (0.28) and system omnivory index (0.18) of the Dongzhaigang Bay model suggest that it represents an ecosystem that is far from being ‘mature’ (Christensen and Pauly, 1993). Overexploitation reduces the complexity of ecosystems, and render them ‘immature,’ and thus these indices also support the notion that the ecosystem of Dongzhaigang Bay is largely degraded.
However, our study still has shortcomings that need to be overcome in subsequent studies. For example, we still cannot explain the main factors affecting the distribution of functional groups (Hernvann et al., 2020) and neither can we describe the suitability selection of habitats for different functional groups due to the lack of environmental data (Christensen et al., 2014). Ecospace was developed to analyze the trophic and spatial distributions in the various specified habitats and develop policy options for the management of aquatic biodiversity (Walters et al., 1999). The Ecospace model we developed can now be used to explore the effect, e.g., of a marine protected area in of Dongzhaigang Bay, which would seem to be required for rebuilding its fish and invertebrate populations. However, this will require that the parametrization of the underlying Ecopath model be verified, especially with regard to fisheries catches.
We recommend collaborating with local authorities to collect data on the mean annual number of fishermen, fishing frequency, and catch in and around the study area. Additionally, it is crucial to study the food and feeding habits of consumers at various trophic levels in the region. This will enhance the reliability of input data for the model and further our understanding of the functional and structural characteristics of the mangrove ecosystem. Furthermore, it is essential to consider the socioeconomic aspects in conjunction to better understand how the fisheries relates to the local economy.
Data availability statement
The original contributions presented in the study are included in the article/Supplementary Materials, further inquiries can be directed to the corresponding authors.
Ethics statement
Ethical approval was not required for the study involving animals in accordance with the local legislation and institutional requirements because our sample collecting mainly depended on normal local fishing activities, and then we only measured the body standard length and weight of fish samples collected at certain sites and times.
Author contributions
CJ: Data curation, Formal Analysis, Methodology, Writing – original draft. DP: Formal Analysis, Methodology, Writing – review and editing. WW: Data curation, Formal Analysis, Methodology, Writing – original draft. JD: Methodology, Writing – original draft. JC: Data curation, Writing – original draft. MW: Formal Analysis, Funding acquisition, Methodology, Writing – original draft.
Funding
The author(s) declare financial support was received for the research, authorship, and/or publication of this article. This research was funded by National Natural Science Foundation of China (NSFC) (Grant No. 42076161).
Acknowledgments
We thank Elaine Chu for formatting for drawing Figures 1-3, Yu Li, Yufeng Lin, Xuan Gu, Suzhen Yan, Yipeng Ding, Xuefang Mi and other colleagues for assistance of collecting and organizing data, and the staff of Hainan’s Dongzhaigang National Nature Reserve and the local community for their understanding and support, and China Scholarship Council (CSC No. 202106310086) for supporting for international learning.
Conflict of interest
The authors declare that the research was conducted in the absence of any commercial or financial relationships that could be construed as a potential conflict of interest.
Publisher’s note
All claims expressed in this article are solely those of the authors and do not necessarily represent those of their affiliated organizations, or those of the publisher, the editors and the reviewers. Any product that may be evaluated in this article, or claim that may be made by its manufacturer, is not guaranteed or endorsed by the publisher.
Supplementary material
The Supplementary Material for this article can be found online at: https://www.frontiersin.org/articles/10.3389/fmars.2023.1277226/full#supplementary-material
Supplementary Figure 1 | Trophic flow of the Dongzhaigang Bay model. P is primary product, D is detritus.
Supplementary Table 1 | Summary statistics and network indices in the Dongzhaigang Bay.
References
Allen K. R. (1971). Relation between production and biomass. J. Fisheries. Res. Board. Canada. 28, 1573–1581. doi: 10.1139/f71-236
Bacalso R. T. M., Wolff M. (2014). Trophic flow structure of the Danajon ecosystem (Central Philippines) and impacts of illegal and destructive fishing practices. J. Mar. Syst. 139, 103–118. doi: 10.1016/j.jmarsys.2014.05.014
Bouillon S., Moens T., Overmeer I., Koedam N., Dehairs F. (2004). Resource utilization patterns of epifauna from mangrove forests with contrasting inputs of local versus imported organic matter. Mar. Ecol. Prog. Ser. 278, 77–88. doi: 10.3354/meps278077
Castellanos-Galindo G. A., Cantera J., Valencia N., Giraldo S., Peña E., Kluger L. C., et al. (2017). Modeling trophic flows in the wettest mangroves of the world: the case of Bahía Málaga in the Colombian Pacific coast. Hydrobiologia 803, 13–27. doi: 10.1007/s10750-017-3300-6
Chen Z., Qiu Y., Jia X., Xu S. (2008). Using an ecosystem modeling approach to explore possible ecosystem impacts of fishing in the Beibu Gulf, northern South China Sea. Ecosystems 11, 1318–1334. doi: 10.1007/s10021-008-9200-x
Chou Q., Xu H., Liu J., Shi X. (2014). Construction of the EwE model of Futian mangrove wetland ecosystem. Chin. J. Ecol. 33 (5), 1413–1419. doi: 10.13292/j.1000-4890.20140327.045
Christensen V., Coll M., Steenbeek J., Buszowski J., Chagaris D., Walters C. J. (2014). Representing variable habitat quality in a spatial food web model. Ecosystems 17, 1397–1412. doi: 10.1007/s10021-014-9803-3
Christensen V., Pauly D. (1992). ECOPATH II-a software for balancing steady-state ecosystem models and calculating network characteristics. Ecol. Model. 61 (3-4), 169–185. doi: 10.1016/0304-3800(92)90016-8
Christensen V., Pauly D. (1993). Flow characteristics of aquatic ecosystems. Trophic. Models Aquat. Ecosyst. 26, 338–352.
Christensen V., Walters C. J., Ahrens R. N. M., Alder J., Buszowski J., Christensen L. B., et al. (2008). Models of the world's large marine ecosystems. Intergovernmental. Oceanographic. Commission. Tech. Ser. 80, 53.
Christensen V., Walters C. J., Pauly D. (2000). Ecopath with Ecosim: a user’s guide, October 2000 Edition (Vancouver: Fisheries Centre, University of British Columbia, Vancouver, Canada and ICLARM), 130.
Colléter M., Walters C. J., Gatti P., Gascuel D. (2015). Including foraging arena and top-down controls improves the modeling of trophic flows and fishing impacts in aquatic food webs. Mar. Ecol. Prog. Ser. 534, 17–37. doi: 10.3354/meps11357
Costanza R., d'Arge R., De Groot R., Farber S., Grasso M., Hannon B., et al. (1997). The value of the world's ecosystem services and natural capital. Nature 387 (6630), 253–260. doi: 10.1038/387253a0
Du J., Makatipu P. C., Tao L. S., Pauly D., Cheung W. W., Peristiwady T., et al. (2020). Comparing trophic levels estimated from a tropical marine food web using an ecosystem model and stable isotopes. Estuarine. Coast. Shelf. Sci. 233, 106518. doi: 10.1016/j.ecss.2019.106518
France R. (1998). Estimating the assimilation of mangrove detritus by fiddler crabs in Laguna Joyuda, Puerto Rico, using dual stable isotopes. J. Trop. Ecol. 14 (4), 413–425. doi: 10.1017/S0266467498000315
Froese R., Pauly D. (2022) FishBase (World Wide Web electronic publication). Available at: www.fishbase.org (Accessed 2 May 2023).
Hernvann P. Y., Gascuel D., Grüss A., Druon J. N., Kopp D., Perez I., et al. (2020). The Celtic Sea through time and space: Ecosystem modeling to unravel fishing and climate change impacts on food-web structure and dynamics. Front. Mar. Sci. 7, 578717. doi: 10.3389/fmars.2020.578717
Jiang C., Wang W., Wang M., Pauly D. (2022a). Length-weight relationships and other morphological traits of fishes in the mangrove of Hainan, China. Fishes 7 (5), 238. doi: 10.3390/fishes7050238
Jiang C., Wang W., Yan S., Ding Y., Mi X., Wang M., et al. (2022b). Assessment of tropical fish stocks using the LBB method in dongzhaigang bay, Hainan Island, China. Sustainability 14 (16), 9933. doi: 10.3390/su14169933
Kanzler L., Perthame B., Sarels B. (2022). Structured model conserving biomass for the size-spectrum evolution in aquatic ecosystems. arXiv. preprint. arXiv. 2212.06465. doi: 10.48550/arXiv.2212.06465
Karpouzi V., Pauly D. (2008). “A framework for evaluating national seabird conservation efforts,” in A comparative assessment of biodiversity, fisheries and aquaculture in 53 countries’ Exclusive Economic Zones, vol. 16 . Eds. Alder J., Pauly D. (Vancouver: Fisheries Centre Research Report), 62–70.
Liang C., Pauly D. (2017). Fisheries impacts on China's coastal ecosystems: Unmasking a pervasive ‘fishing down’effect. PLoS One 12 (3), e0173296. doi: 10.1371/journal.pone.0173296
Liang Z., Feng E., Li L., Zuo P. (2018). Bird survey in of mangrove swamp Dongzhaigharbor of Hainan Island in 2015. Trop. Forestry. 46 (02), 43–46.
Lin H. J., Shao K. T., Jan R. Q., Hsieh H. L., Chen C. P., Hsieh L. Y., et al. (2007). A trophic model for the Danshuei River Estuary, a hypoxic estuary in northern Taiwan. Mar. pollut. Bull. 54 (11), 1789–1800. doi: 10.1016/j.marpolbul.2007.07.008
Manickchand-Heileman S., Arreguín-Sánchez F., Lara-Domínguez A., Soto L. A. (1998). Energy flow and network analysis of Terminos Lagoon, SW Gulf of Mexico. J. Fish. Biol. 53, 179–197. doi: 10.1111/j.1095-8649.1998.tb01026.x
Manickchand-Heileman S., Mendoza-Hill J., Kong A. L., Arocha F. (2004). A trophic model for exploring possible ecosystem impacts of fishing in the Gulf of Paria, between Venezuela and Trinidad. Ecol. Model. 172 (2-4), 307–322. doi: 10.1016/j.ecolmodel.2003.09.013
Meziane T., Sanabe M. C., Tsuchiya M. (2002). Role of fiddler crabs of a subtropical intertidal flat on the fate of sedimentary fatty acids. J. Exp. Mar. Biol. Ecol. 270 (2), 191–201. doi: 10.1016/S0022-0981(02)00019-9
Nagelkerken I., Blaber S. J. M., Bouillon S., Green P., Haywood M., Kirton L. G., et al. (2008). The habitat function of mangroves for terrestrial and marine fauna: a review. Aquat. Bot. 89 (2), 155–185. doi: 10.1016/j.aquabot.2007.12.007
Otogo A. G., Enin I. U., Ndome B. C. (2022). Trophic modelling of the cross river estuary ecosystem, Nigeria. J. Mar. Sci. Res. Oceanogr. 5 (4), 272–288.
Palomares M. L. D., Bailly N., Pauly D. (2009). Fishbase, Sealifebase and database-driven ecosystem modeling. Fisheries. Centre. Res. Rep. 17 (3), 156–158.
Palomares M. L. D., Pauly D. (2019) SeaLifeBase (World Wide Web electronic publication). Available at: www.sealifebase.org (Accessed 2 May 2023).
Pauly D. (2002). “Spatial modelling of trophic interactions and fisheries impacts in coastal ecosystems: a case study of Sakumo Lagoon, Ghana,” in The Gulf of Guinea Large Marine Ecosystem: environmental forcing and sustainable development of marine resources. Eds. McGlade J. M., Cury P., Koranteng K. A., Hardman-Mountford N. J. (Amsterdam: Elsevier Science), 289–296.
Pauly D., Christensen V. (1995). Primary production required to sustain global fisheries. Nature 374 (6519), 255–257. doi: 10.1038/374255a0
Pauly D., Christensen V. (2002). “Ecosystem models,” in Handbook of fish biology and fisheries (Chapter 10), vol. 2 . Eds. Hart P. J., Reynolds J. D. (Hoboken: Blackwell Publishing), 211–227.
Pauly D., Christensen V., Walters C. (2000). Ecopath, Ecosim, and Ecospace as tools for evaluating ecosystem impact of fisheries. ICES. J. Mar. Sci. 57 (3), 697–706. doi: 10.1006/jmsc.2000.0726
Pauly D., Trites A. W., Capuli E., Christensen V. (1998). Diet composition and trophic levels of marine mammals. ICES. J. Mar. Sci. 55 (3), 467–481. doi: 10.1006/jmsc.1997.0280
Pauly D., Watson R. (2005). Background and interpretation of the ‘Marine Trophic Index’ as a measure of biodiversity. Philos. Trans. R. Soc.: Biol. Sci. 360, 415–423. doi: 10.1098/rstb.2004.1597
Ray S., Ulanowicz R. E., Majee N. C., Roy A. B. (2000). Network analysis of a benthic food web model of a partly reclaimed island in the Sundarban mangrove ecosystem, India. J. Biol. Syst. 8 (03), 263–278. doi: 10.1142/S0218339000000171
Rehren J., Coll M., Jiddawi N., Kluger L. C., Omar O., Christensen V., et al. (2022). Evaluating ecosystem impacts of gear regulations in a data-limited fishery—comparing approaches to estimate predator–prey interactions in Ecopath with Ecosim. ICES. J. Mar. Sci. 79 (5), 1624–1636. doi: 10.1093/icesjms/fsac077
Rehren J., Wolff M., Jiddawi N. (2018). Holistic assessment of Chwaka Bay's multi-gear fishery–Using a trophic modeling approach. J. Mar. Syst. 180, 265–278. doi: 10.1016/j.jmarsys.2018.01.002
Sawusdee A., Koolkalya S., Thapanand T., Jutagate T. (2023). Evolution of the food web in bandon bay, the gulf of Thailand: ten years of the blue swimming crab stocking programme. Trop. Life Sci. Res. 34 (2), 109–130. 10.21315/tlsr2023.34.2.6
Tuda P. M., Wolff M. (2018). Comparing an ecosystem approach to single-species stock assessment: The case of Gazi Bay, Kenya. J. Mar. Syst. 184, 1–14. doi: 10.1016/j.jmarsys.2018.04.004
Ullah M. H., Rashed-Un-Nabi M., Al-Mamun M. A. (2012). Trophic model of the coastal ecosystem of the Bay of Bengal using mass balance Ecopath model. Ecol. Model. 225, 82–94. doi: 10.1016/j.ecolmodel.2011.11.013
Valiela I., Bowen J. L., York J. K. (2001). Mangrove Forests: One of the World's Threatened Major Tropical Environments: At least 35% of the area of mangrove forests has been lost in the past two decades, losses that exceed those for tropical rain forests and coral reefs, two other well-known threatened environments. Bioscience 51 (10), 807–815. doi: 10.1641/0006-3568(2001)051[0807:MFOOTW]2.0.CO;2
Vega-Cendejas M. E., Arreguin-Sánchez F. (2001). Energy fluxes in a mangrove ecosystem from a coastal lagoon in Yucatan Peninsula, Mexico. Ecol. Model. 137 (2-3), 119–133. doi: 10.1016/S0304-3800(00)00421-X
Vega-Cendejas M. E., Arreguin-Sánchez F., Hernandez M. (1993). “Trophic fluxes on the Campeche Bank, Mexico,” in Trophic models of aquatic ecosystems. ICLARM Conference Proceedings, vol. 26 . Eds. Christensen V., Pauly D., 206–213.
Walters C., Christensen V., Pauly D. (1997). Structuring dynamic models of exploited ecosystems from trophic mass-balance assessments. Rev. Fish. Biol. Fisheries. (Manila: International Center For Aquatic Resources Management) 7 (2), 139. doi: 10.1023/A:1018479526149
Walters C., Pauly D., Christensen V. (1999). Ecospace: prediction of mesoscale spatial patterns in trophic relationships of exploited ecosystems, with emphasis on the impacts of marine protected areas. Ecosystems 2, 539–554. doi: 10.1007/s100219900101
Wolff M., Koch V., Chavarría J. B., Vargas J. A. (1998). A trophic flow model of the Golfo de Nicoya, Costa Rica. Rev. Biol. Trop. 46 (S6), 63–79. doi: 10.1023/A:1008847106984
Wolff M., Koch V., Isaac V. (2000). A trophic flow model of the Caeté mangrove estuary (North Brazil) with considerations for the sustainable use of its resources. Estuarine. Coast. Shelf. Sci. 50 (6), 789–803. doi: 10.1006/ecss.2000.0611
Yuwono E., Jennerjahn T. C., Nordhaus I., Riyanto E. A., Sastranegara M. H., Pribadi R. (2007). Ecological status of Segara Anakan, Indonesia: a mangrove-fringed lagoon affected by human activities. Asian J. Water. Environ. pollut. 4 (1), 61–70.
Keywords: diet composition, trophic interactions, predation, particle size distributions, fishing pressure
Citation: Jiang C, Pauly D, Wang W, Du J, Cheng J and Wang M (2023) A preliminary model of the mangrove ecosystem of Dongzhaigang Bay, Hainan, (China) based on Ecopath and Ecospace. Front. Mar. Sci. 10:1277226. doi: 10.3389/fmars.2023.1277226
Received: 14 August 2023; Accepted: 31 October 2023;
Published: 17 November 2023.
Edited by:
Tomaso Fortibuoni, Istituto Superiore per la Protezione e la Ricerca Ambientale (ISPRA), ItalyReviewed by:
Hadayet Ullah, WorldFish, MalaysiaPeriyadan K. Krishnakumar, King Fahd University of Petroleum and Minerals, Saudi Arabia
Copyright © 2023 Jiang, Pauly, Wang, Du, Cheng and Wang. This is an open-access article distributed under the terms of the Creative Commons Attribution License (CC BY). The use, distribution or reproduction in other forums is permitted, provided the original author(s) and the copyright owner(s) are credited and that the original publication in this journal is cited, in accordance with accepted academic practice. No use, distribution or reproduction is permitted which does not comply with these terms.
*Correspondence: Mao Wang, d2FuZ21hb0B4bXUuZWR1LmNu; Chengpu Jiang, cHVyZS5qY3BAZ21haWwuY29t