 Nicolas Lubitz1,2*
 Kátya Abrantes1,2
 Kevin Crook3
 Leanne M. Currey-Randall4,5
 Andrew Chin6
 Marcus Sheaves1
 Richard Fitzpatrick2Ana Barbosa Martins7
 Stacy Bierwagen4
 Ingo B. Miller8Adam Barnett1,2
- 1Marine Data Technology Hub, James Cook University, Townsville, QLD, Australia
- 2Biopixel Oceans Foundation, Cairns, QLD, Australia
- 3Marine Science Program, Biodiversity and Conservation Science, Department of Biodiversity, Conservation and Attractions, Kensington, WA, Australia
- 4Australian Institute of Marine Science, Townsville, QLD, Australia
- 5AIMS@JCU, Division of Research and Innovation, James Cook University, Townsville, QLD, Australia
- 6Centre for Sustainable Tropical Fisheries and Aquaculture, James Cook University, Townsville, QLD, Australia
- 7Department of Biology, Dalhousie University, Halifax, NS, Canada
- 8AIMS@JCU, College of Science and Engineering, James Cook University, Cairns, QLD, Australia
Information on how the trophic ecology of predators shapes their movement patterns and space-use is fundamental to understanding ecological processes across organisational levels. Despite this, studies combining spatial and trophic ecology to determine how prey preference and/or resource availability shape space use are lacking in marine predators as these can occur at low density and are often difficult to track over extended periods. Furthermore, many exhibit behavioural variability within species and among closely related, sympatric species adding further complexity. We applied a context-focused, multi-method approach to the understudied great hammerhead shark (Sphyrna mokarran) to test if movement and home ranges relate to prey preference and availability. Movement data from satellite and acoustic telemetry in Queensland, Australia, were combined with stable-isotope analysis, drone surveys, and videos of hunting behaviour. Limited dispersal, and small home ranges in S. mokarran were linked to trophic specialisation on stingray prey. Drone surveys and videos showed predation events on stingrays and demonstrated high, year-round availability of this prey in shallow, inshore habitats, which may allow the majority of S. mokarran to remain resident. This affinity for inshore habitats suggests that critical life-history requirements are performed over local or regional scales, although some larger movements were evident. These results were interpreted in comparison to the well-studied bull shark (Carcharhinus leucas), which showed reliance on pelagic food webs. Carcharhinus leucas had high individual variability in movement, with both large-scale migrations and residency. This could indicate that only some individuals are locally sustained on dynamic, pelagic food webs, while others undergo large-scale excursions over distant habitats. The specialised foraging of S. mokarran indicates they play an apex predator role in shallow, inshore habitats, potentially shaping space-use, and foraging behaviour of batoids. As inshore habitats are disproportionately affected by anthropogenic stressors, S. mokarran’s trophic specialisation and limited demographic connectivity may make the species particularly vulnerable to anthropogenic threats.
1 Introduction
Animal movement across different spatio-temporal scales enables individuals to fulfill life history requirements by responding to seasonal changes in ambient environmental conditions and resource availability, reproduce and avoid predation (Shaw, 2016). Mobile species often use distinct habitats for different life history requirements, highlighting the importance of disparate, essential habitats (Webster et al., 2002; Bauer and Hoye, 2014; Barnett et al., 2019). Linkages between these habitats have implications for connectivity, population dynamics, nutrient and energy transfer, and predator-driven effects on prey (Bauer and Hoye, 2014).
The drivers of movement shape ecological processes from individuals, to populations, and communities (Chapman et al., 2012; Shaw, 2016; Teitelbaum and Mueller, 2019). For example, movements driven by foraging behaviour and resource availability can reverberate through all trophic levels (Coughenour, 1991; Lima, 2002). Seasonal grazing by herbivores such as marine turtles, dugongs and ungulates can impact the cycling of nutrients, plant biomass and community structure as well as primary production (Zieman et al., 1984; Holdo et al., 2009; Lal et al., 2010; Bauer and Hoye, 2014). In turn, mobile predators can seasonally affect herbivore and mesopredator communities through direct predation pressure and indirect risk-effects (Heithaus et al., 2012; Barnett et al., 2017). For instance, wolves (Canis lupis) and tiger sharks (Galeocerdo cuvier) elicit similar anti-predator behaviours in their respective prey, elk (Cervus canadensis) and dugong (Dugong dugon), with wider ecosystem effects on primary producers (Wirsing and Ripple, 2011). Thus, information on how the trophic ecology of predators shapes their movement patterns and space-use is fundamental to understanding ecological processes across organisational levels.
Despite this importance, studies combining spatial and trophic ecology to determine how prey preference and/or resource availability shape predator space use and home ranges are lacking in marine predators (Barnett and Semmens, 2012; Heithaus et al., 2012). This is in part due to the inherent difficulty in observing predator-prey relationships in aquatic systems meaning they are often inferred solely from spatial overlap, without establishing direct trophic links (Suraci et al., 2022). Furthermore, many species such as elasmobranchs (sharks and rays), seabirds and cetaceans commonly exhibit behavioural variability in movement and resource use within species, as well as among closely related, sympatric species (Barnett et al., 2011; Geijer et al., 2016; Watts et al., 2018; Renshaw et al., 2023). However, this variability is frequently overlooked to infer general population or functional group patterns although growing evidence suggests that individual movement behaviour can indeed be context-dependent based on a variety of biotic and abiotic factors, questioning the usefulness of generalised patterns (Shaw, 2020; Catford et al., 2022; Lubitz et al., 2022).
Recently, a context-focused approach has been outlined to address this complexity and help close knowledge gaps regarding the drivers of animal movement (Lubitz et al., 2022). The framework suggests the application of multi-method approaches to investigate drivers of individual movement patterns while incorporating intra- or interspecific variability. This is achieved by comparing study systems that differ in their movement behaviour (e.g., males and females of the same species, conspecifics across geographical locations or individuals from sympatric species) by linking those differences to variation in the biotic/abiotic factors each study system is subjected to (Lubitz et al., 2022).
Here we apply a context-focused, multi-method approach to the great hammerhead shark (Sphyrna mokarran), a Critically Endangered, mobile marine predator, that primarily occupies coastal areas in tropical and subtropical regions (Gallagher and Klimley, 2018; Rigby et al., 2019). The overall ecology of this species continues to have critical knowledge gaps. For example, spatial ecology studies are limited to the southern United States and the Bahamas which suggest more localised movements compared to other large-bodied elasmobranchs, but with notable large-scale excursions (Graham et al., 2016; Guttridge et al., 2017). Trophic knowledge to date indicates that S. mokarran are benthic feeders, that can hunt in shallow waters, primarily targeting other elasmobranchs, in particular batoids (Cliff, 1995; Roemer et al., 2016; Raoult et al., 2019).
To link trophic and movement ecology (aspects of the ecological context, following Lubitz et al., 2022) in S. mokarran we explored spatio-temporal patterns of movement across northern Australia using acoustic and satellite telemetry. Furthermore, we tested whether space-use in S. mokarran is linked to potentially high, year-round abundance of benthic, batoid prey using drone surveys/video observations. Additionally, we used stable isotope analysis to explore the trophic link between S. mokarran and batoids. Lastly, we interpret the results on S. mokarran in the context of the movement and trophic ecology of the sympatric bull shark (Carcharhinus leucas), following the comparative approach outlined in Lubitz et al. (2022). This species is relatively well studied across the globe and can exhibit significant behavioural variability as residents and large-scale migrants co-occur across the distribution of this generalist predator (Heupel et al., 2015; Espinoza et al., 2016; Lubitz et al., 2023). Movement behaviour of C. leucas is in part driven by complex interactions of seasonal environmental change across latitudes, natal philopatry to pupping grounds and availability of their main prey, pelagic teleosts (Cliff and Dudley, 1991; Heupel et al., 2015; Niella et al., 2022; Lubitz et al., 2023).
2 Methods
2.1 Study area
The study area was the tropical and subtropical east coast of Australia, along the coast of Queensland (QLD) (from 10°S – 28°S). Tagging effort was concentrated at various locations within the Great Barrier Reef Marine Park (GBRMP) (10°S – 24°S) (Figure 1). This Management zone covers 345.500 km2, including ca. 3000 coral reefs, such as inshore fringing and offshore reefs, covering 9% of the total park area (Hutchings et al., 2019). Between the main reef matrix and the coast lies an extensive shallow lagoon (3-70 m deep). Inshore, waters are mud-dominated and turbid with occasional fringing reefs, seagrass beds and mangrove-lined estuaries and embayments as well as inshore island groups such as the Palm and Whitsunday Islands. Further offshore, substrates tend to be comprised more of sand and gravel resulting in decreased turbidity (Hutchings et al., 2019). One S. mokarran was caught and tagged in Western Australia (WA), in the Exmouth Gulf, a tidally dominated shallow embayment of ca. 2600 km2. Common habitat types in this hypersaline, turbid environment include coral and sponge reefs, mangrove lined estuaries and seagrass beds (Preen et al., 1997).
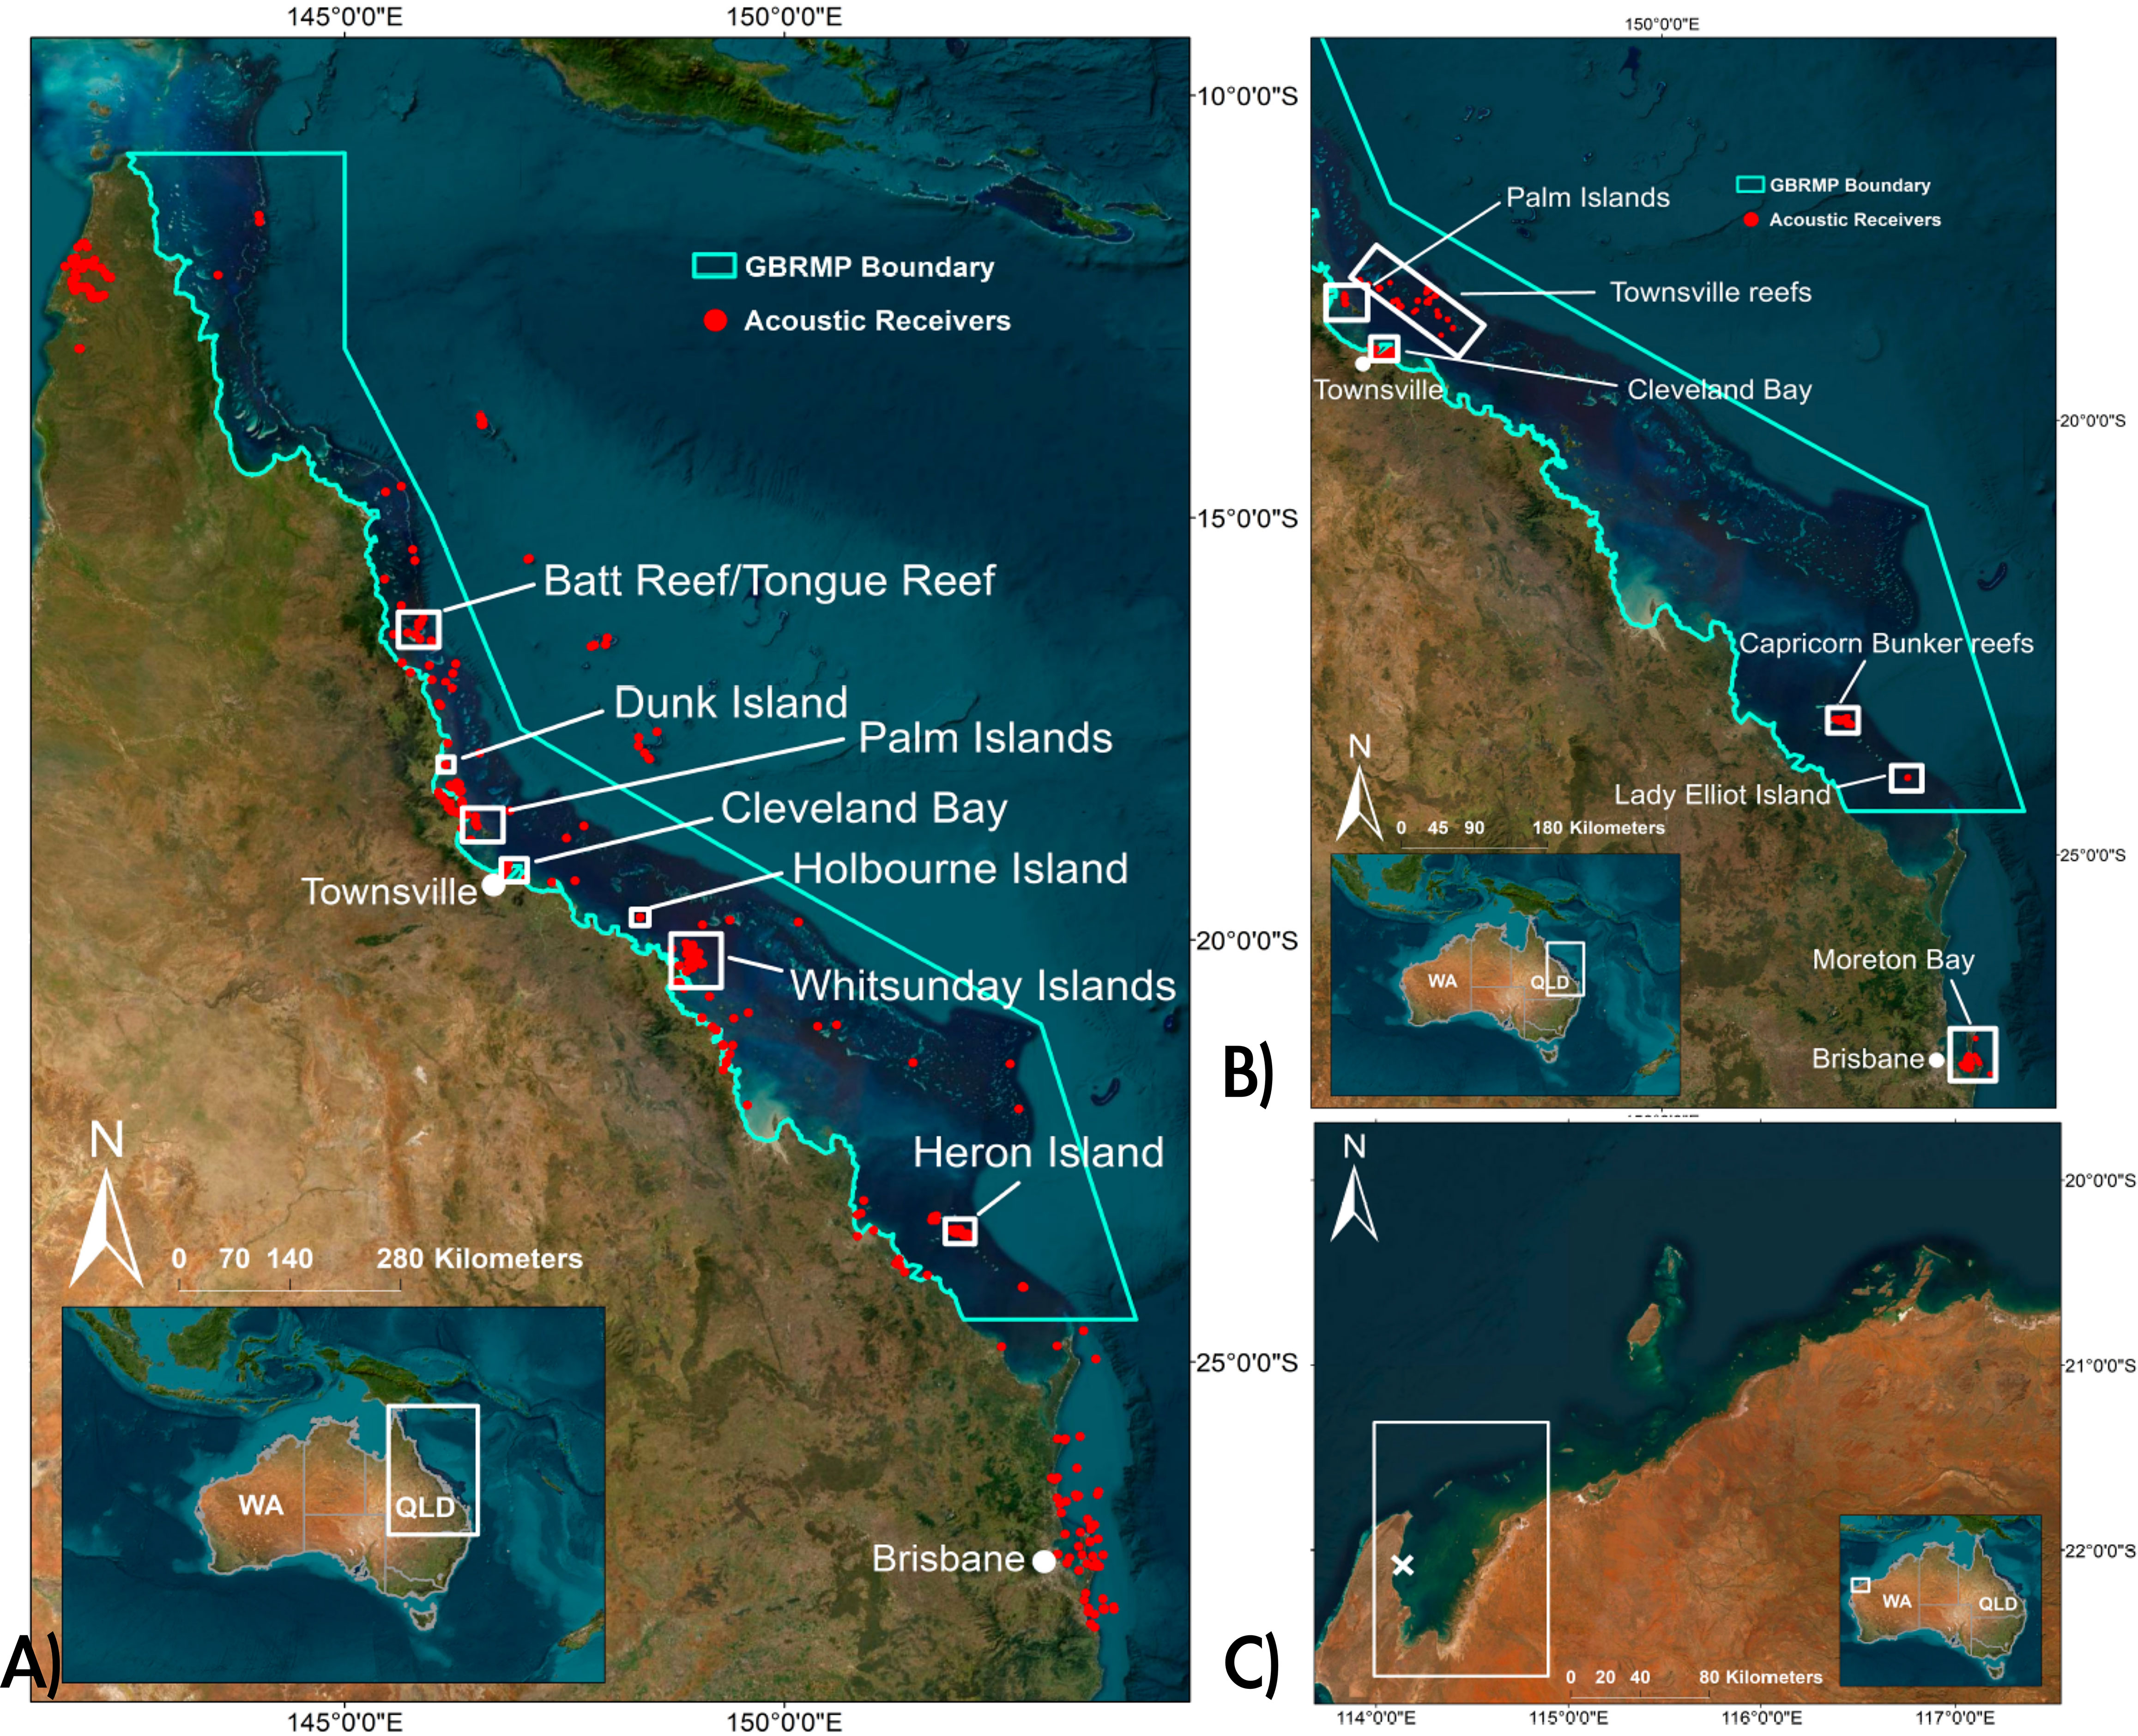
Figure 1 Map of the study area; (A) Queensland coast with acoustic receivers of the array from 2018 onwards including capture locations of S. mokarran and C. leucas in white boxes. Indicated is the Great Barrier Reef Marine Park (GBRMP); (B) Queensland coast with acoustic receivers of the 2010-2015 array in different installations. Again, with outline of the GBRMP; (C) The northern coast of Western Australia, indicating the Gulf of Exmouth, where one S. mokarran was tagged (white X), no acoustic receivers were deployed here.
2.2 Animal tagging and tracking
Between June 2010 and February 2023, 31 S. mokarran and 36 C. leucas were electronically tagged in QLD and WA. Sphyrna mokarran were tagged at Cleveland Bay (n=4), Townsville Reefs (n=1), Batt Reef/Tongue Reef (n=10), Heron Island/North-West Island (n=2), the Whitsunday Islands (n=4), Holbourne Island (n=1), Dunk Island (n=1), the Palm Islands (n=7) and Exmouth Gulf (WA) (n=1). Carcharhinus leucas were tagged in the Whitsunday Islands (n=14), off Townsville (n=8) and the Palm Islands (n=14) (Figure 1).
Sharks were captured using drum lines/long lines and were secured next to the vessel, sexed and total length measured to the nearest cm. Sphyrna mokarran were externally tagged with miniPAT archival tags (Wildlife Computers™) (PSAT-Tags) (n=5), Wildlife Computers™ SPOT fin mounted tags (SPOT-Tags) (n=3) or V16-coded (InnovaSea™), high powered, acoustic transmitters (3-year battery life) (n=2). Twenty-one S. mokarran were internally tagged with V13/16-coded, high powered, acoustic transmitters (InnovaSea™). All C. leucas were internally tagged with V16-coded high powered acoustic transmitters (InnovaSea™) (n=36). Transmitters broadcast a unique tag ID code at random intervals every 45-120 seconds at 69 kHz with an expected battery life of (2 years (n=6), 3 years (n=2) and 10 years (n=62).
PSAT-Tags were anchored using titanium anchors and tether and programmed to release after 180 days and transmit archived data on light level, depth, and water temperature to the ARGOS satellite system upon reaching the surface. SPOT-Tags were fixed to the first dorsal fin by four threaded nylon rods passed through the fin and secured by washers and nuts. The position of the transmitter was such that the antenna extended out of the water when the fin broke the surface (Barnett et al., 2022a). Acoustic transmitters were either externally anchored into the first dorsal fin (n =2) or surgically implanted using standard established procedures (Barnett, 2022b). Briefly, the transmitter is inserted into the peritoneal cavity through a small incision, which is then closed with surgical sutures. Animal capture and tagging was conducted under Great Barrier Reef Marine Park Permit G22/46908.1, general Queensland Fisheries Permit 266351 and ethics permit A2846, approved by the James Cook University ethics committee.
The number of acoustic receivers (InnovaSea™) in the array varied over time. Initially, from 2010, this consisted of separate installations at the Palm Islands (n=33), the Townsville reefs (n=56), Cleveland Bay in Townsville (n=63), the Capricorn Bunker Group (Heron, Sykes, One Tree Reefs, n=50), Lady Elliot Island (n=6) and Moreton Bay (n=29) (Figure 1). From the end of 2018 additional receivers were deployed, resulting in a network of 353 receivers spanning the Queensland coast (11.39°S - 28.15°S). Most sharks (n=66) were tagged from 2018, with only five S. mokarran and no C. leucas monitored in the array from 2010-2015.
2.3 Analysis of shark movements
2.3.1 Data processing
Acoustic detections of sharks were filtered for false detections using maximum swimming speeds of 0.9 m/s (Payne et al., 2016). A shark was considered present near a receiver if a single detection was registered and if this was deemed realistic based on the location and time of previous detections given above swimming speeds.
Data from SPOT-tags were retrieved from the ARGOS platform and the Kalman filter algorithm used to generate location estimates. Accuracy was categorised into error classes with the following margins: Class 3, < 100 m; Class 2, < 250 m; Class 1, 500 m to 1500 m; Class 0, >1500 m, and additional classes A and B which indicate no possible estimation of accuracy (Wildlife Computers™). The R package AniMotum was used to filter location estimates from SPOT-Tags based on maximum swimming speeds of 0.9 m/s to remove outliers (Jonsen et al., 2023). A state-space model was fitted to improve locations further and interpolate the tracks. Finally, tracks were rerouted around land-barriers to achieve more realistic tracks for further analysis.
Archived temperature, depth, and light level data were processed with the Wildlife Computers™ GPE3 State-Space model to generate location estimates using swimming speeds of 0.9 m/s. This model is a discretized Hidden-Markov Model using a movement model (0.9 m.s-1) and a observation model based on collected SST, depth and light data. Tracks were further improved with the state space models implemented in AniMotum. Again, tracks were rerouted around land-barriers. From here on acoustic detections/SPOT-Tag location pings/PSAT-Tag location estimates will be referred to as detections.
2.3.2 Movement estimation
To estimate the maximum displacement distance for acoustically-, PSAT- and SPOT- tagged animals, straight-line distances between the two furthest detections (or between the furthest detection and tagging location, whichever one was greater) were estimated in Google Earth.
2.3.3 Network analysis
Network analysis was used to compare inter-regional movements of S. mokarran and C. leucas acoustically tagged from 2018 onwards. This was performed using the R package igraph (Csardi and Nepusz, 2006). To facilitate visualisation of inter-regional movements we aggregated receivers into 21 regions based on receiver distribution and receiver groupings within the array (Supplemental Material). This resulted in 15 regions in Queensland, and six in the state of New South Wales (NSW), to the south of Queensland where an additional receiver array was deployed. Coastal regions were treated as nodes while movements between regions constituted edges. Acoustic detections were used to produce an adjacency matrix counting presence in and relative movements between coastal regions for both species from which directed and weighted networks were created. Presence was defined as two subsequent receiver detections that remained within the same region. Relative movements were defined as the number of times a species moved between two regions, divided by total number of movements undertaken by the species.
Acoustic detections were filtered to include detections in the same region that were >5 mins apart (Lédée et al., 2021). Several metrics were calculated to describe the species networks. Firstly, we determined the number of regions each species was detected in. Edge density was calculated as the sum of unique movements undertaken by each species divided by the total number of movements theoretically possible within the network. We also calculated how many components each network had, i.e., the number of isolated regions not connected via movement and the clustering coefficient. This metric measures regional network density, i.e., the tendency of well-connected regions to be interconnected with other well-connected regions.
To confirm that networks exhibit non-random patterns, and to test for potential spatial bias in the acoustic receiver array we performed link permutations based on a bootstrap approach (n=10.000) to generate random networks (Croft et al., 2011). The clustering coefficient of random networks was then compared with the two observed networks using Wilcoxon-signed-rank tests.
2.3.4 Home range estimation
Dynamic Brownian bridge movement models (dBBMM) were used to estimate home ranges. These models are commonly used to calculate utilisation densities (UDs) from animal tracking data (Horne et al., 2007; Kranstauber et al., 2012). DBBMM have distinct advantages over traditional models, such as kernel-based methods. Specifically, they account for temporal autocorrelation by modelling UDs based on the animal’s consecutive movement path from a conditional random walk (Horne et al., 2007; Kranstauber et al., 2012). Furthermore, they can deal with irregular time stamps and incorporate location error, both critical considerations when tracking aquatic animals with irregular location estimates associated with larger errors (Horne et al., 2007; Kranstauber et al., 2012). Lastly, dBBMM do not assume a constant variance term σ2 which is unrealistic in animal movement, as behavioural changes from foraging to migrating and resting would introduce variability in the variance (Kranstauber et al., 2012).
For acoustic tracking data, dBBMM were calculated using the R package RSP (Niella et al., 2020). The RSP package was developed to generate UDs from dBBMM from acoustic tracking data of aquatic species and automatically excludes land-barriers from the final 25%, 50% and 95% contour lines (Niella et al., 2020). The wide distribution of the array in space and time had receivers deployed in different habitats with detection ranges ranging from 150 m in coral reefs to 500 m in pelagic environments (Espinoza et al., 2015; Huveneers et al., 2016). Therefore, a conservative median 300 m range estimate was used as a standard for analysis. To compare between S. mokarran and C. leucas, home ranges were only calculated for individuals which had detection gaps <90 days, data for >90 days and did not exhibit large-scale (>500 km) movements. Mann-Whitney U Tests were used to compare selected and non-selected individuals to ensure no body size bias was introduced, as this impacts shark home ranges (Speed et al., 2010). We used generalised linear mixed models (GLMMs) to test if size of selected individuals influenced home range size, where individual shark ID was used as a random factor. For SPOT- and PSAT-Tag data we used the tracks generated by the state-space models and associated standard errors to calculate dBBMM in the R package move (Kranstauber et al., 2023).
Due to the nature of tracking aquatic species with long gaps between detections and large, varying, location error margins, the UDs generated should only be considered as approximate home ranges. However, because the aim of this study was to compare the extent of movement and core space use between S. mokarran and C. leucas, and relate that to their trophic ecology, these metrics are useful to compare the scales of habitat use.
2.4 Prey video surveys
2.4.1 Drone transects
Between December 2016 and June 2019 drone surveys (n= 24) were conducted at the Lucinda sand flat, inshore of the Palm Islands (Crook unpublished data). This flat, particularly the shallow, northern end, constitutes a nursery for juvenile stingrays (Crook, 2020). Drone surveys covered periods during dry and wet seasons. In northern Australia, the monsoonal wet season usually lasts from late November to April. Surveys were grouped into wet season 1 (December 2016 – February 2017, including one survey in December 2017), dry season 1 (August – September 2017), wet season 2 (April 2019) and dry season 2 (May – June 2019). Flights occurred along four back and forth transects at heights between 10 and 12 m. Batoids were identified to species level and total numbers were recorded to calculate ray density by dividing the number of rays by area sampled in ha. Sampling occurred during a variety of tidal phases. To investigate if ray density remained stable throughout the seasons and over the sampling period, we calculated mean batoid density for each season.
Further drone flights were conducted along the southern edge of the Lucinda flat between September and October 2022 (n=35), to investigate potential overlap between batoids and S. mokarran along the more exposed, predator-accessible southern edge. Flights were exploratory and occurred at varying heights and tidal phases, covering different areas. For these flights, only presence/absence of rays and other elasmobranchs was recorded.
2.4.2 Additional video analysis
To document foraging and predation events by S. mokarran on batoids, we compiled videos taken opportunistically by the authors and footage gathered by social media searches (videos in Supplemental Material). Only videos in which S. mokarran were observed foraging or actively pursuing/consuming batoids in QLD and WA were included. Permission to use videos was sought from all content owners who were not authors of this study.
2.5 Stable isotope analysis
To analyse stable isotope composition of S. mokarran and C. leucas muscle, red blood cells and plasma, muscle samples were collected with a 8 mm Ø biopsy punch from the caudal keel of 14 S. mokarran and 23 C. leucas. Blood samples were collected from the caudal vein (four S. mokarran and 20 C. leucas) using syringes with 14-gauge needles. Both syringes and needles were heparinised to avoid blood clotting and allow for separation of red blood cells and plasma. Sodium heparin was used as anticoagulant to minimise changes in blood stable isotope values (Lemons et al., 2012). Samples were placed on ice upon collection. Blood was separated into red blood cells and plasma via centrifugation. Blood fractions were then pipetted into 2 ml microcentrifuge tubes and stored at -20°C. Seven S. mokarran were sampled from coral reef environments at Batt/Tongue Reef, and seven from coastal islands of the Palm/Whitsunday Islands, where vast sand flats are available around the islands and in the adjacent mainland. All C. leucas were sampled near the Palm/Whitsunday Islands. Muscle tissue was also collected from 13 cowtail rays (Pastinachus ater) from the reef flat at Orpheus Island (Palm Islands), and 49 P. ater from the Lucinda sand flat (Crook, 2020; Martins et al., 2022).
Tissue samples were dried in an oven at 60°C for 48 h. Samples were analysed at the UC Davis Stable Isotope Facility (University of California), using an Elementar vario EL cube elemental analyzer interfaced to an Elementar VisION IRMS (Elementar Analysensysteme GmbH, Langenselbold, Germany). Results had a precision of ≤0.07 ‰ for both carbon and nitrogen stable isotopes (δ13C and δ15N, respectively), calculated based on replicates of laboratory reference materials that were interspersed with the study samples during analysis. Fifty samples of seven reference materials were used for δ13C, and 54 samples of eight reference materials for δ15N. Results are expressed in the delta (δ) notation as per mil (‰), so that: δX = (Rsample/Rstandard - 1) × 103, where δX is the stable isotope composition of the sample, Rsample is our sample’s molar ratio of the heavy to light element, and Rstandard that ratio in the international standard material.
Lipids and urea were not extracted from shark samples prior to analysis, because lipid/urea treatments can influence δ13C and δ15N, and magnitude and direction of this effect is variable among studies, taxa, and tissues (e.g., Carlisle et al., 2017; Crook et al., 2019; Bennett-Williams et al., 2022). Also, it has recently been shown that lipid/urea extraction does not significantly affect elasmobranch muscle δ13C (Bennett-Williams et al., 2022).
Measured shark muscle δ13C and δ15N were plotted, and Bayesian Standard Ellipse Areas corrected for small sample sizes (SEAC) used to estimate isotopic niche sizes and overlap between the two species, using the SIBER R package (Jackson et al., 2019). δ13C and δ15N values were also corrected for trophic discrimination using the trophic discrimination factors (TDFs) +0.5 ‰ for δ13C and +2.0 ‰ for δ15N, as appropriate for non-lipid extracted muscle of sharks in comparison to lipid-extracted prey samples (Hussey et al., 2010). Corrected stable isotope values were graphically compared to those of P. ater, the most abundant batoid in northern Australia (Crook, 2020; Martins et al., 2022), and to pelagic fish (potential prey for C. leucas) (from Frisch et al., 2014; Espinoza et al., 2019).
Differences in δ13C and δ15N between uncorrected muscle, plasma and red blood cells were used to estimate temporal variability in diet within individuals, as these three tissues have different turnover rates, integrating diet/habitat information over different temporal scales (Thomas and Crowther, 2015; Vander Zanden et al., 2015; Carter et al., 2019). In elasmobranchs, muscle turnover rates are reflective of months to years, whereas red blood cells can reflect a change in diet within months to weeks, and blood plasma within days (e.g. Kim et al., 2012; Malpica-Cruz et al., 2012), depending on growth rates, size, and life stage. Therefore, similarities in δ13C among the tissues would indicate stable diets over time, whereas large variability among tissues would suggest recent changes in diet/habitat.
3 Results
3.1 Shark movements
3.1.1 Movement estimation
Overall, 31 S. mokarran (125 cm – 455 cm) and 36 C. leucas (170 cm – 347 cm) were tagged between 2010 to 2023 (Table 1). Five S. mokarran and 10 C. leucas were considered immature (Last, 2009). Across all tagging methods S. mokarran exhibited a mean maximum displacement of 105.8 km (range: 3-776 km) (Table 1). In contrast, C. leucas made longer movements, sometimes into NSW, with a mean maximum displacement of 662.45 km (range: 0-2230 km) (Table 1). Only one S. mokarran (SPOT-tag) had a maximum displacement >500 km, moving 776 km from its tagging site at North-West Island to the Palm Islands, after which it returned to North-West Island after six weeks. In S. mokarran space-use was mostly limited to the tagging location, in some instances to the tagging reef or island (Supplemental Material), while C. leucas exhibited a variety of movement strategies with seven highly resident individuals and 13 large-scale migrants.

Table 1 Summary of movement analysis for S. mokarran and C. leucas.
3.1.2 Network analysis
Based on acoustic detections of 18 S. mokarran and 36 C. leucas in the expanded array in QLD and additional detections in NSW, species networks were constructed to highlight inter-regional movements. The networks demonstrated that movement behaviour was vastly different between the two species (Figure 2). Despite being tagged at the same locations as C. leucas, S. mokarran showed limited inter-regional connectivity being only detected in six regions all within northern QLD, while C. leucas were detected in 18 regions stretching from the northern tip of QLD to southern NSW (Table 1; Figure 2).
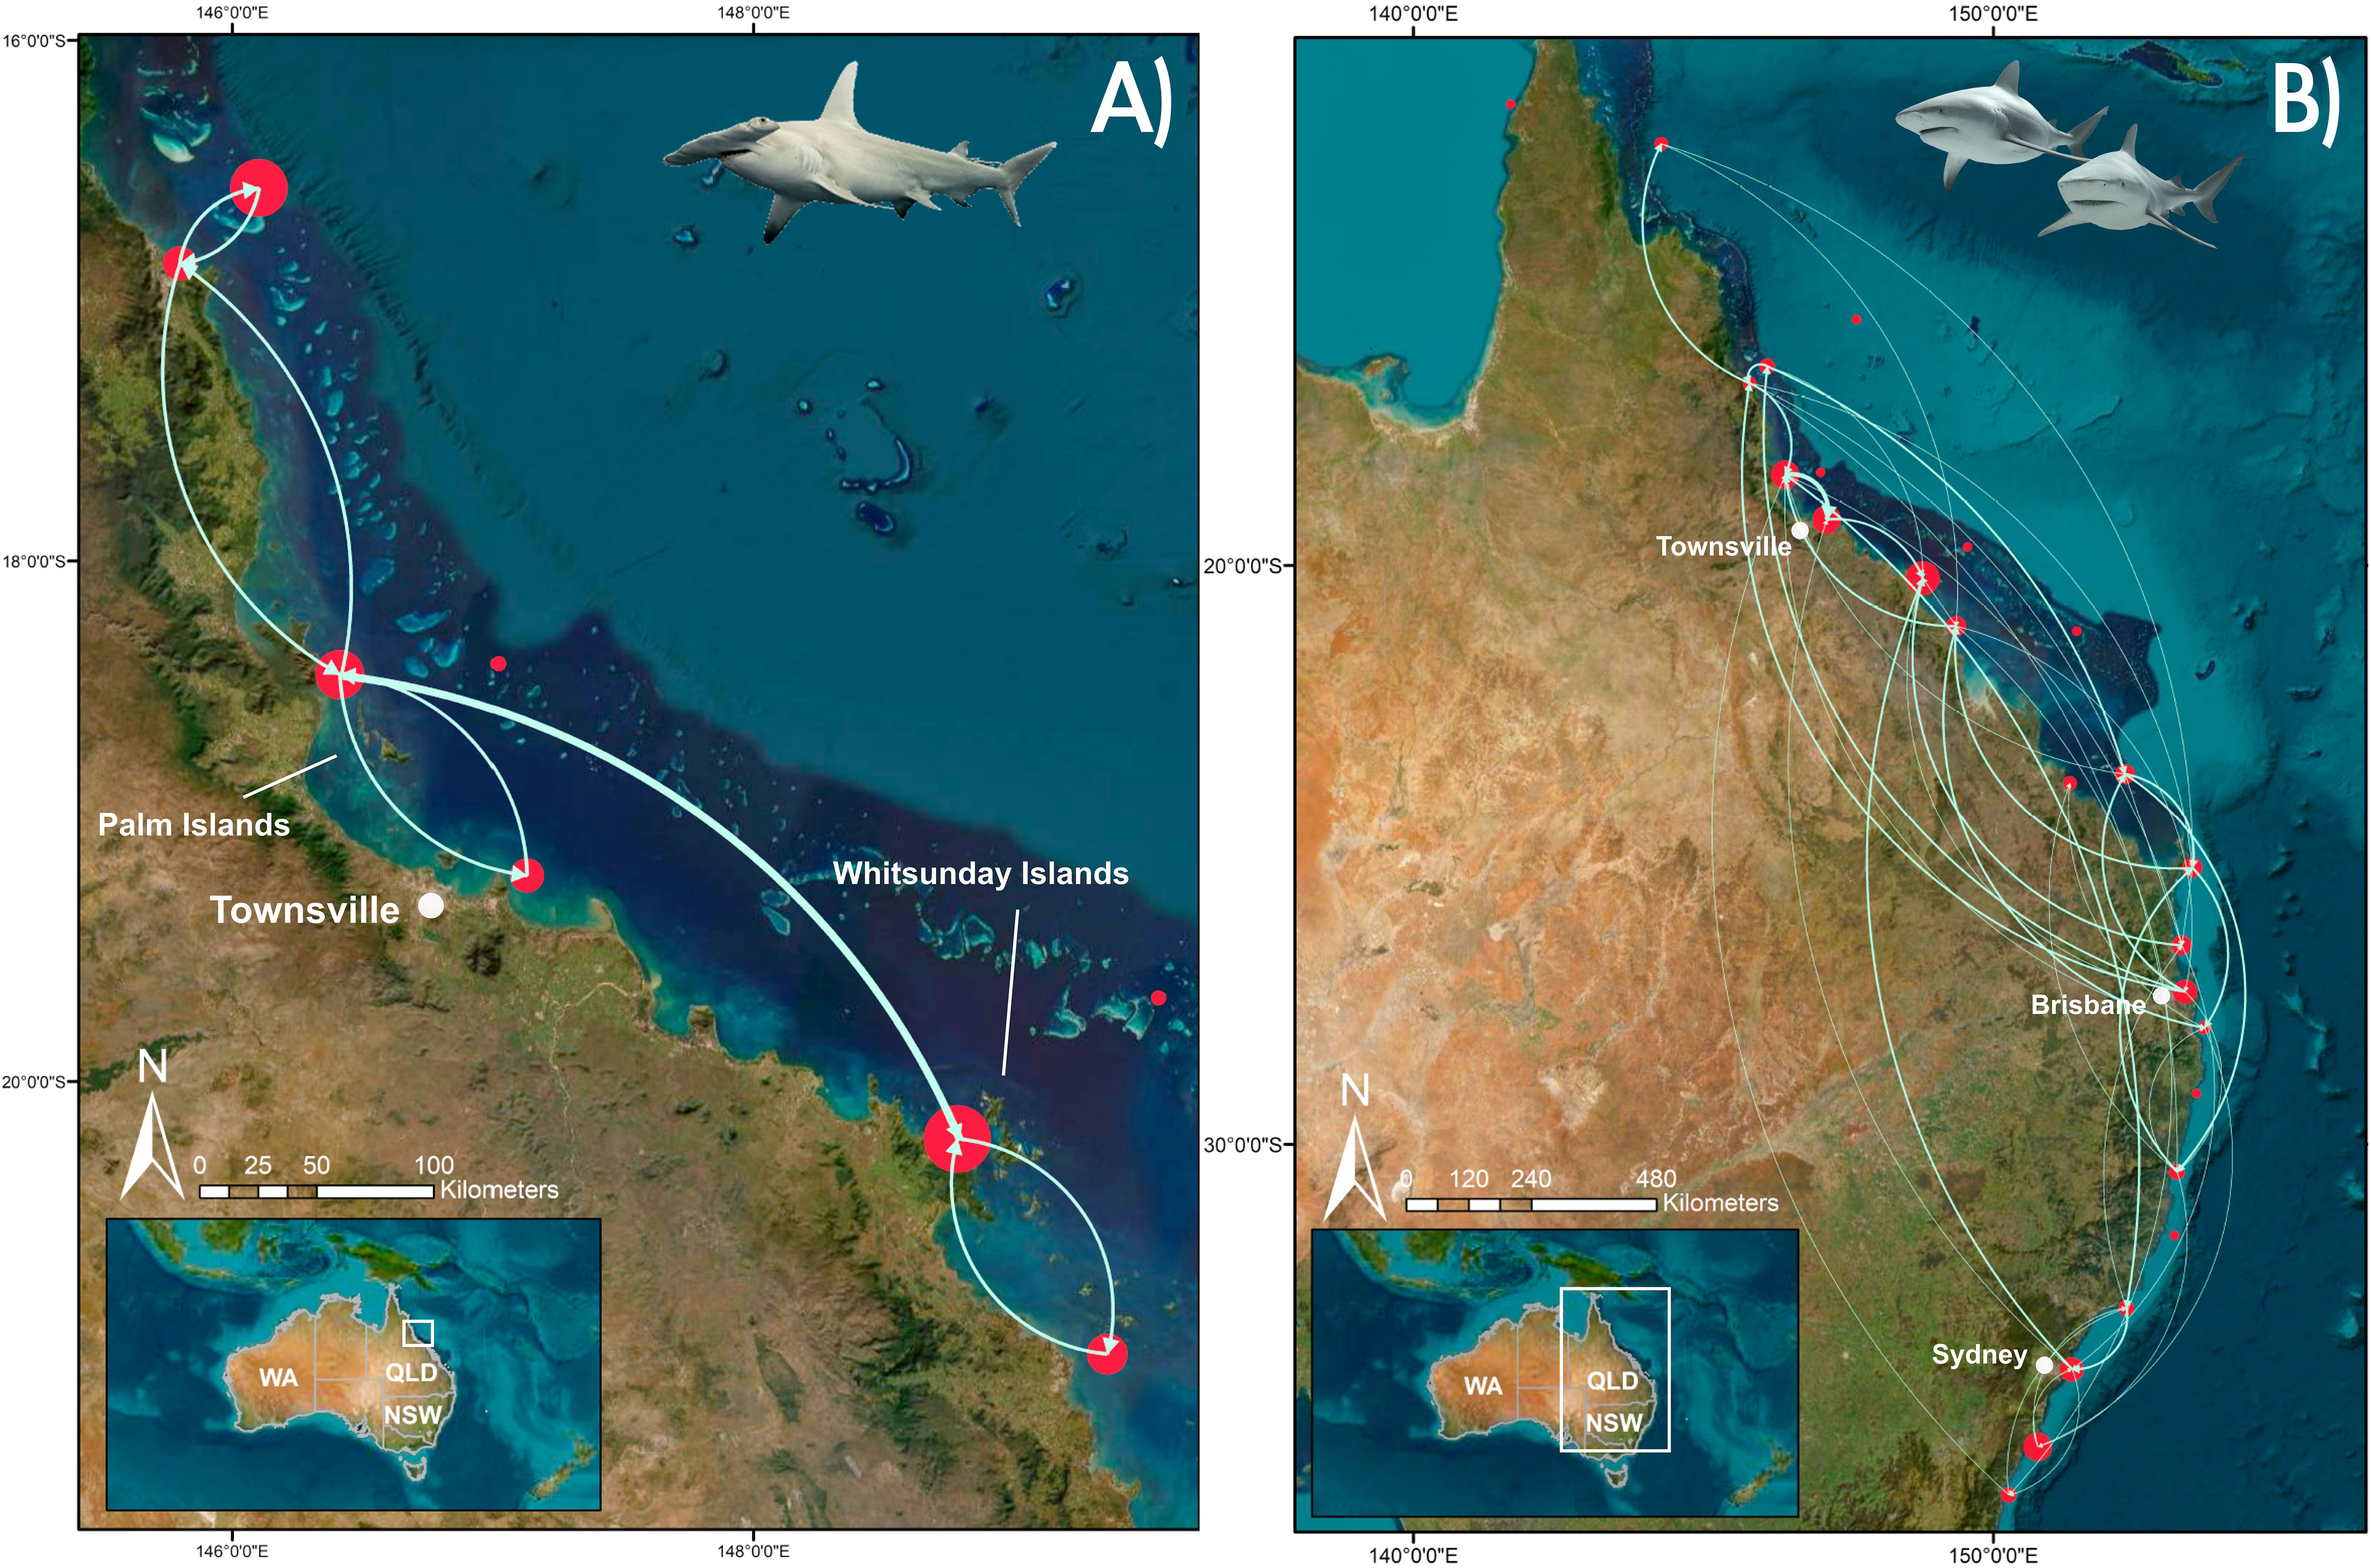
Figure 2 Visualisation of the two species networks; (A) S. mokarran network; (B) C. leucas network. Red circles represent regions along the Australian east coast (see Supplemental Material for map). These were determined based on receiver groupings in the array: Western Cape York, Eastern Cape York, Cairns inshore, Cairns reefs, Coral Sea, Palm Islands, Townsville reefs, Townsville inshore, Whitsunday Islands, Whitsunday reefs, Mackay inshore, Swains/Pompey reefs, Gladstone inshore, Capricorn Bunker reefs, Fraser Island, Sunshine Coast, Moreton Bay, Gold Coast, Northern Rivers, Coffs Harbour, Port Macquarie, Port Stephens, Sydney, Jervis Bay, and Narooma with circle size denoting the sum of movements from within regions and incoming/outgoing movements. Larger circles had more within and among regional movements. The smallest circles without edges had no movements. Lines represent edges, i.e., movements between regions with line thickness representing frequency of movements.
The C. leucas network only had 12 not-connected components, compared to 20 in the S. mokarran network. This means that the S. mokarran network had more individually, isolated regions not connected via movement (Figure 2). Accordingly, the S. mokarran network had lower edge density (0.025) compared to the C. leucas network (0.108). Also, the clustering coefficient of the S. mokarran network was 0, meaning that the tendency of regions to be connected to other well-connected regions was very low. In contrast, the C. leucas network had a clustering coefficient of 0.37. Finally, based on bootstrap permutations the two species networks were significantly different from random (p < 2.2e-16).
3.1.3 Home range estimation
Following the exclusion criteria of no longer detection gaps than 90 days, at least 3 months of detection data and no larger maximum displacement than 500 km, 16 S. mokarran (51.84%) (10 females, six males) qualified for home range estimation compared to only seven highly resident C. leucas (19.4%) (Figures 3, 4; Table 1). For both S. mokarran and C. leucas, Mann-Whitney U Tests did not indicate a significant body size difference between selected and non-selected individuals (p = 0.2269 and 0.6125, respectively). Furthermore, GLMMs showed that for selected individuals body size had a significant impact on home range size in S. mokarran (p = 0.0471) but not C. leucas (p= 0.834).
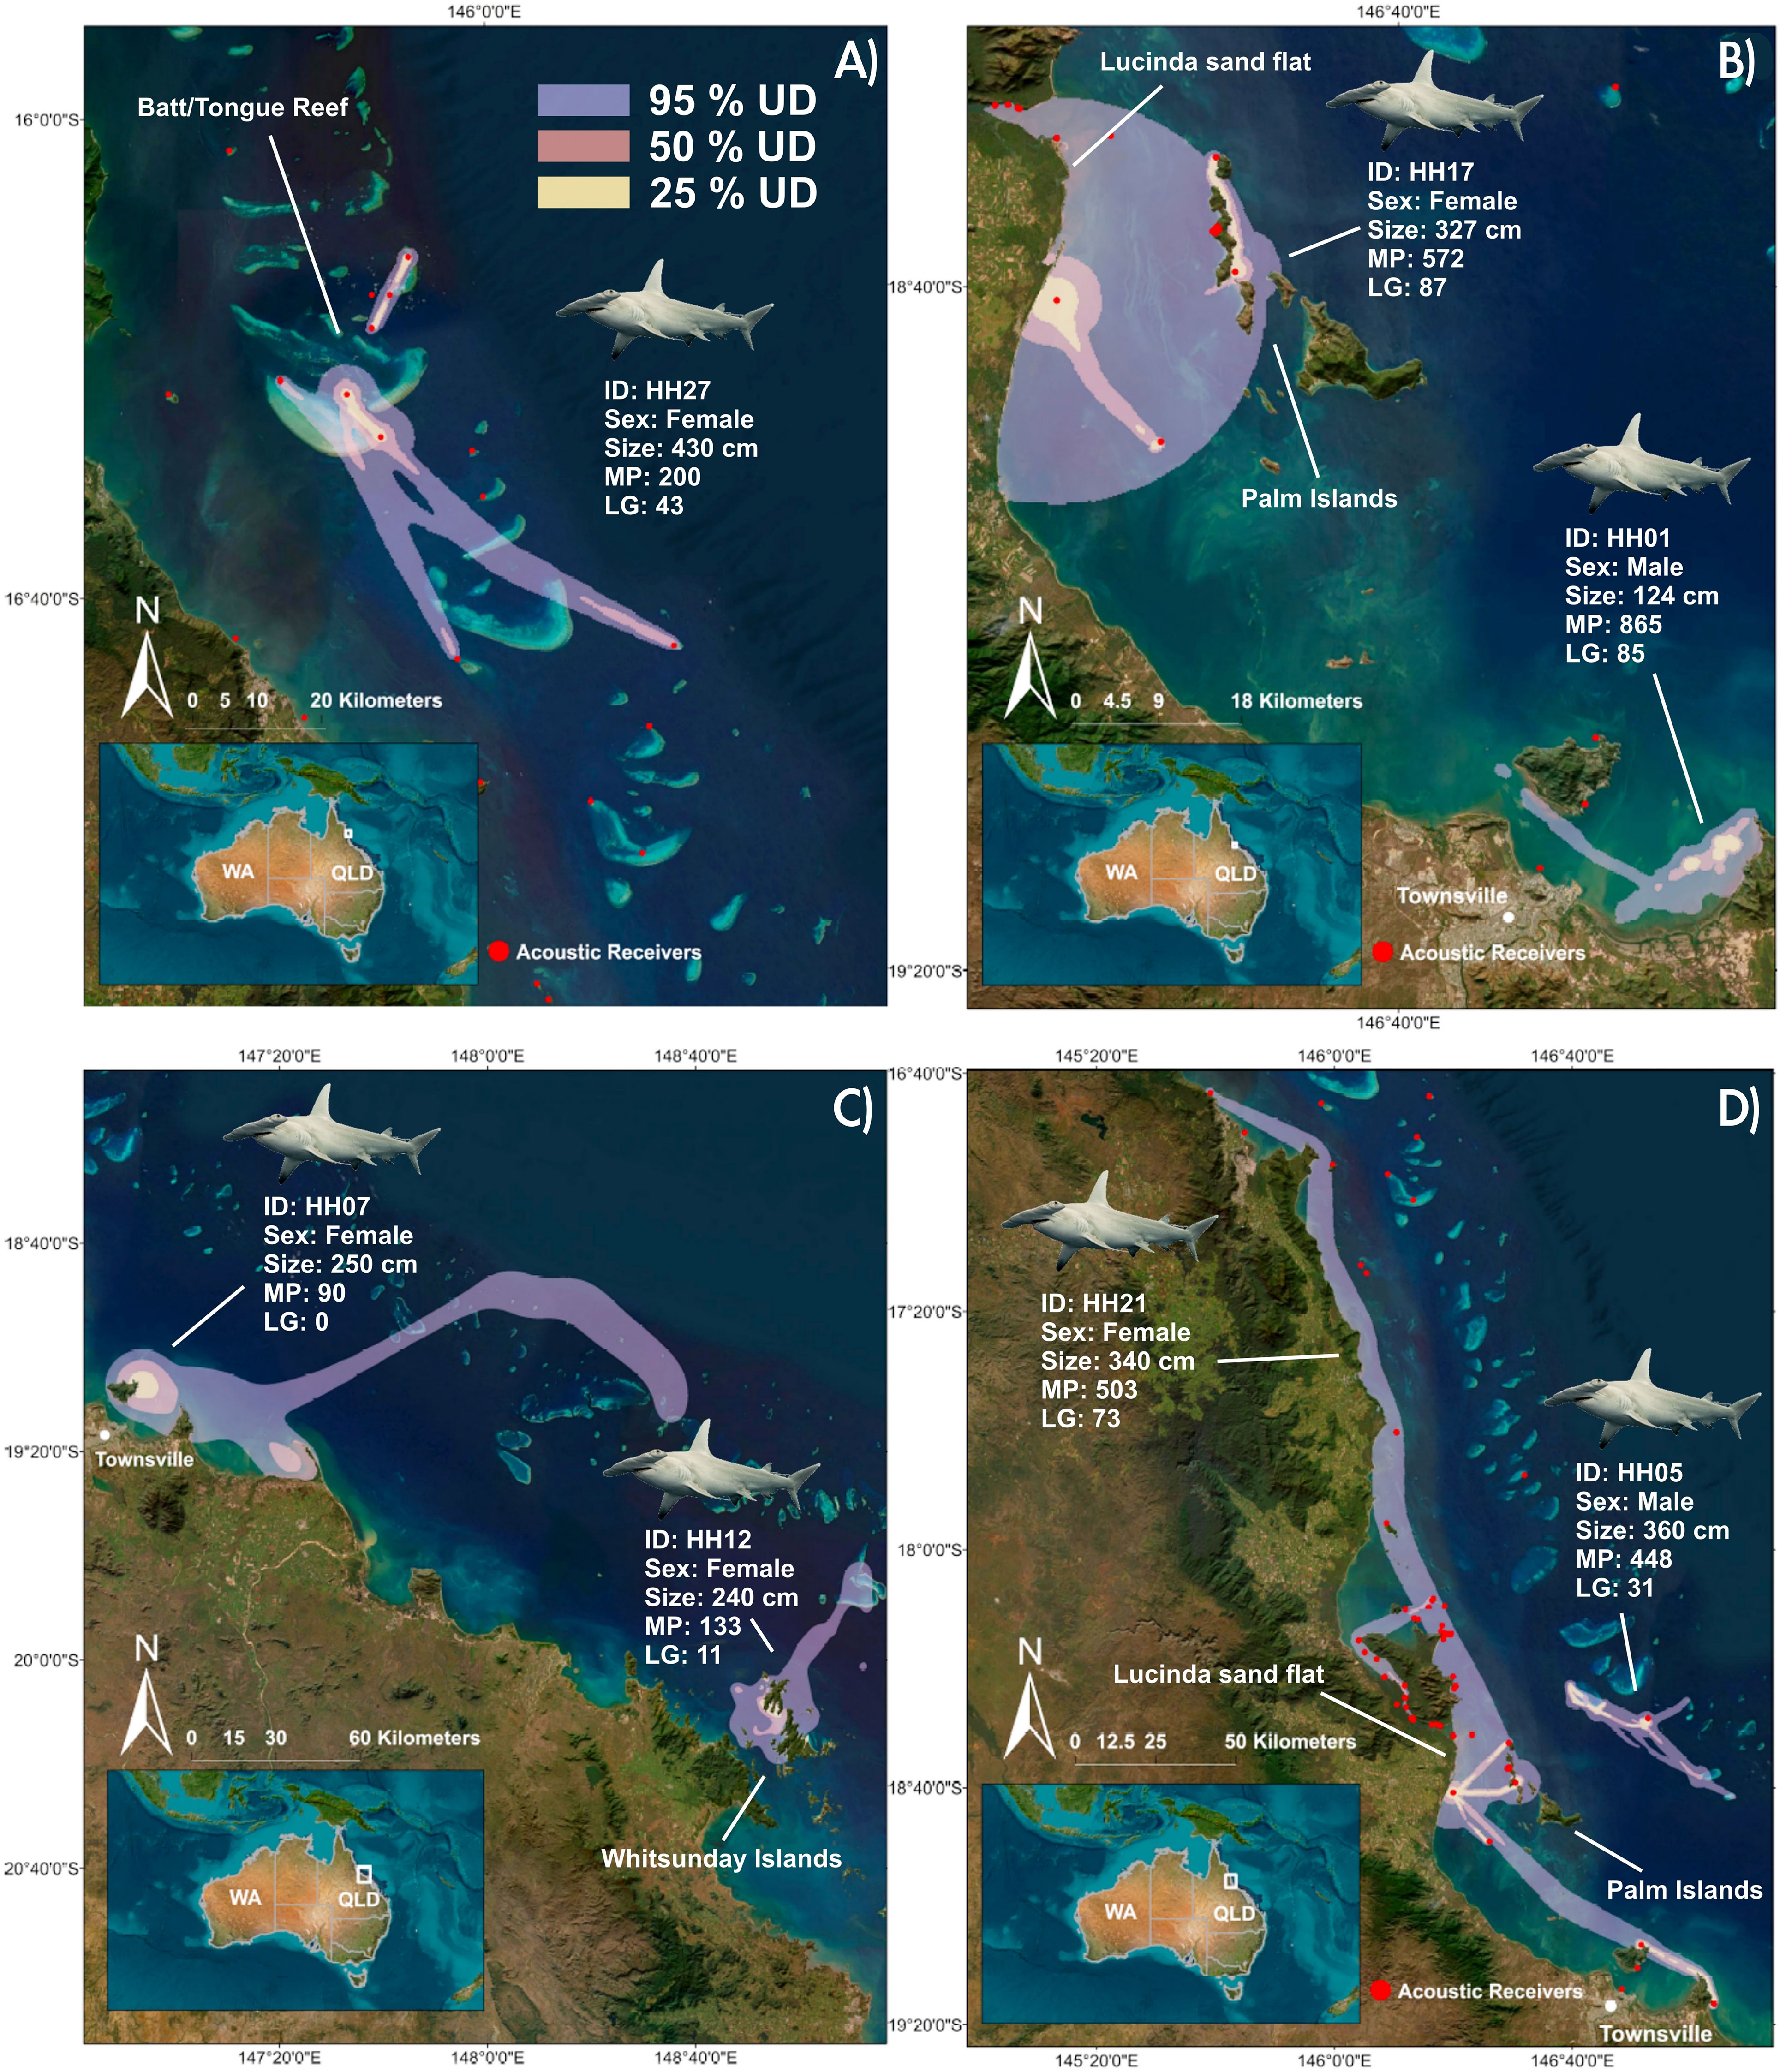
Figure 3 Extent of the 95%, 50%, 25% UDs based on dBBMMs; (A) Home range for S. mokarran HH27, acoustically tagged at Batt Reef; (B) Home ranges for S. mokarran HH17 and HH01, acoustically tagged at the Palm Islands and Townsville; (C) Home ranges for S. mokarran HH07, tagged at Holbourne Island with a PSAT-tag and HH12 tagged in the Whitsunday Islands with a SPOT-tag; (D) Home ranges for S. mokarran HH21 and HH05, acoustically tagged at the Palm Islands and the Townsville Reefs. Note in all cases only receivers from the new array are shown. For maps of the remaining 9 S. mokarran see Supplemental Material. [(MP, Monitoring period (days); LG, Longest detection gap (day)].
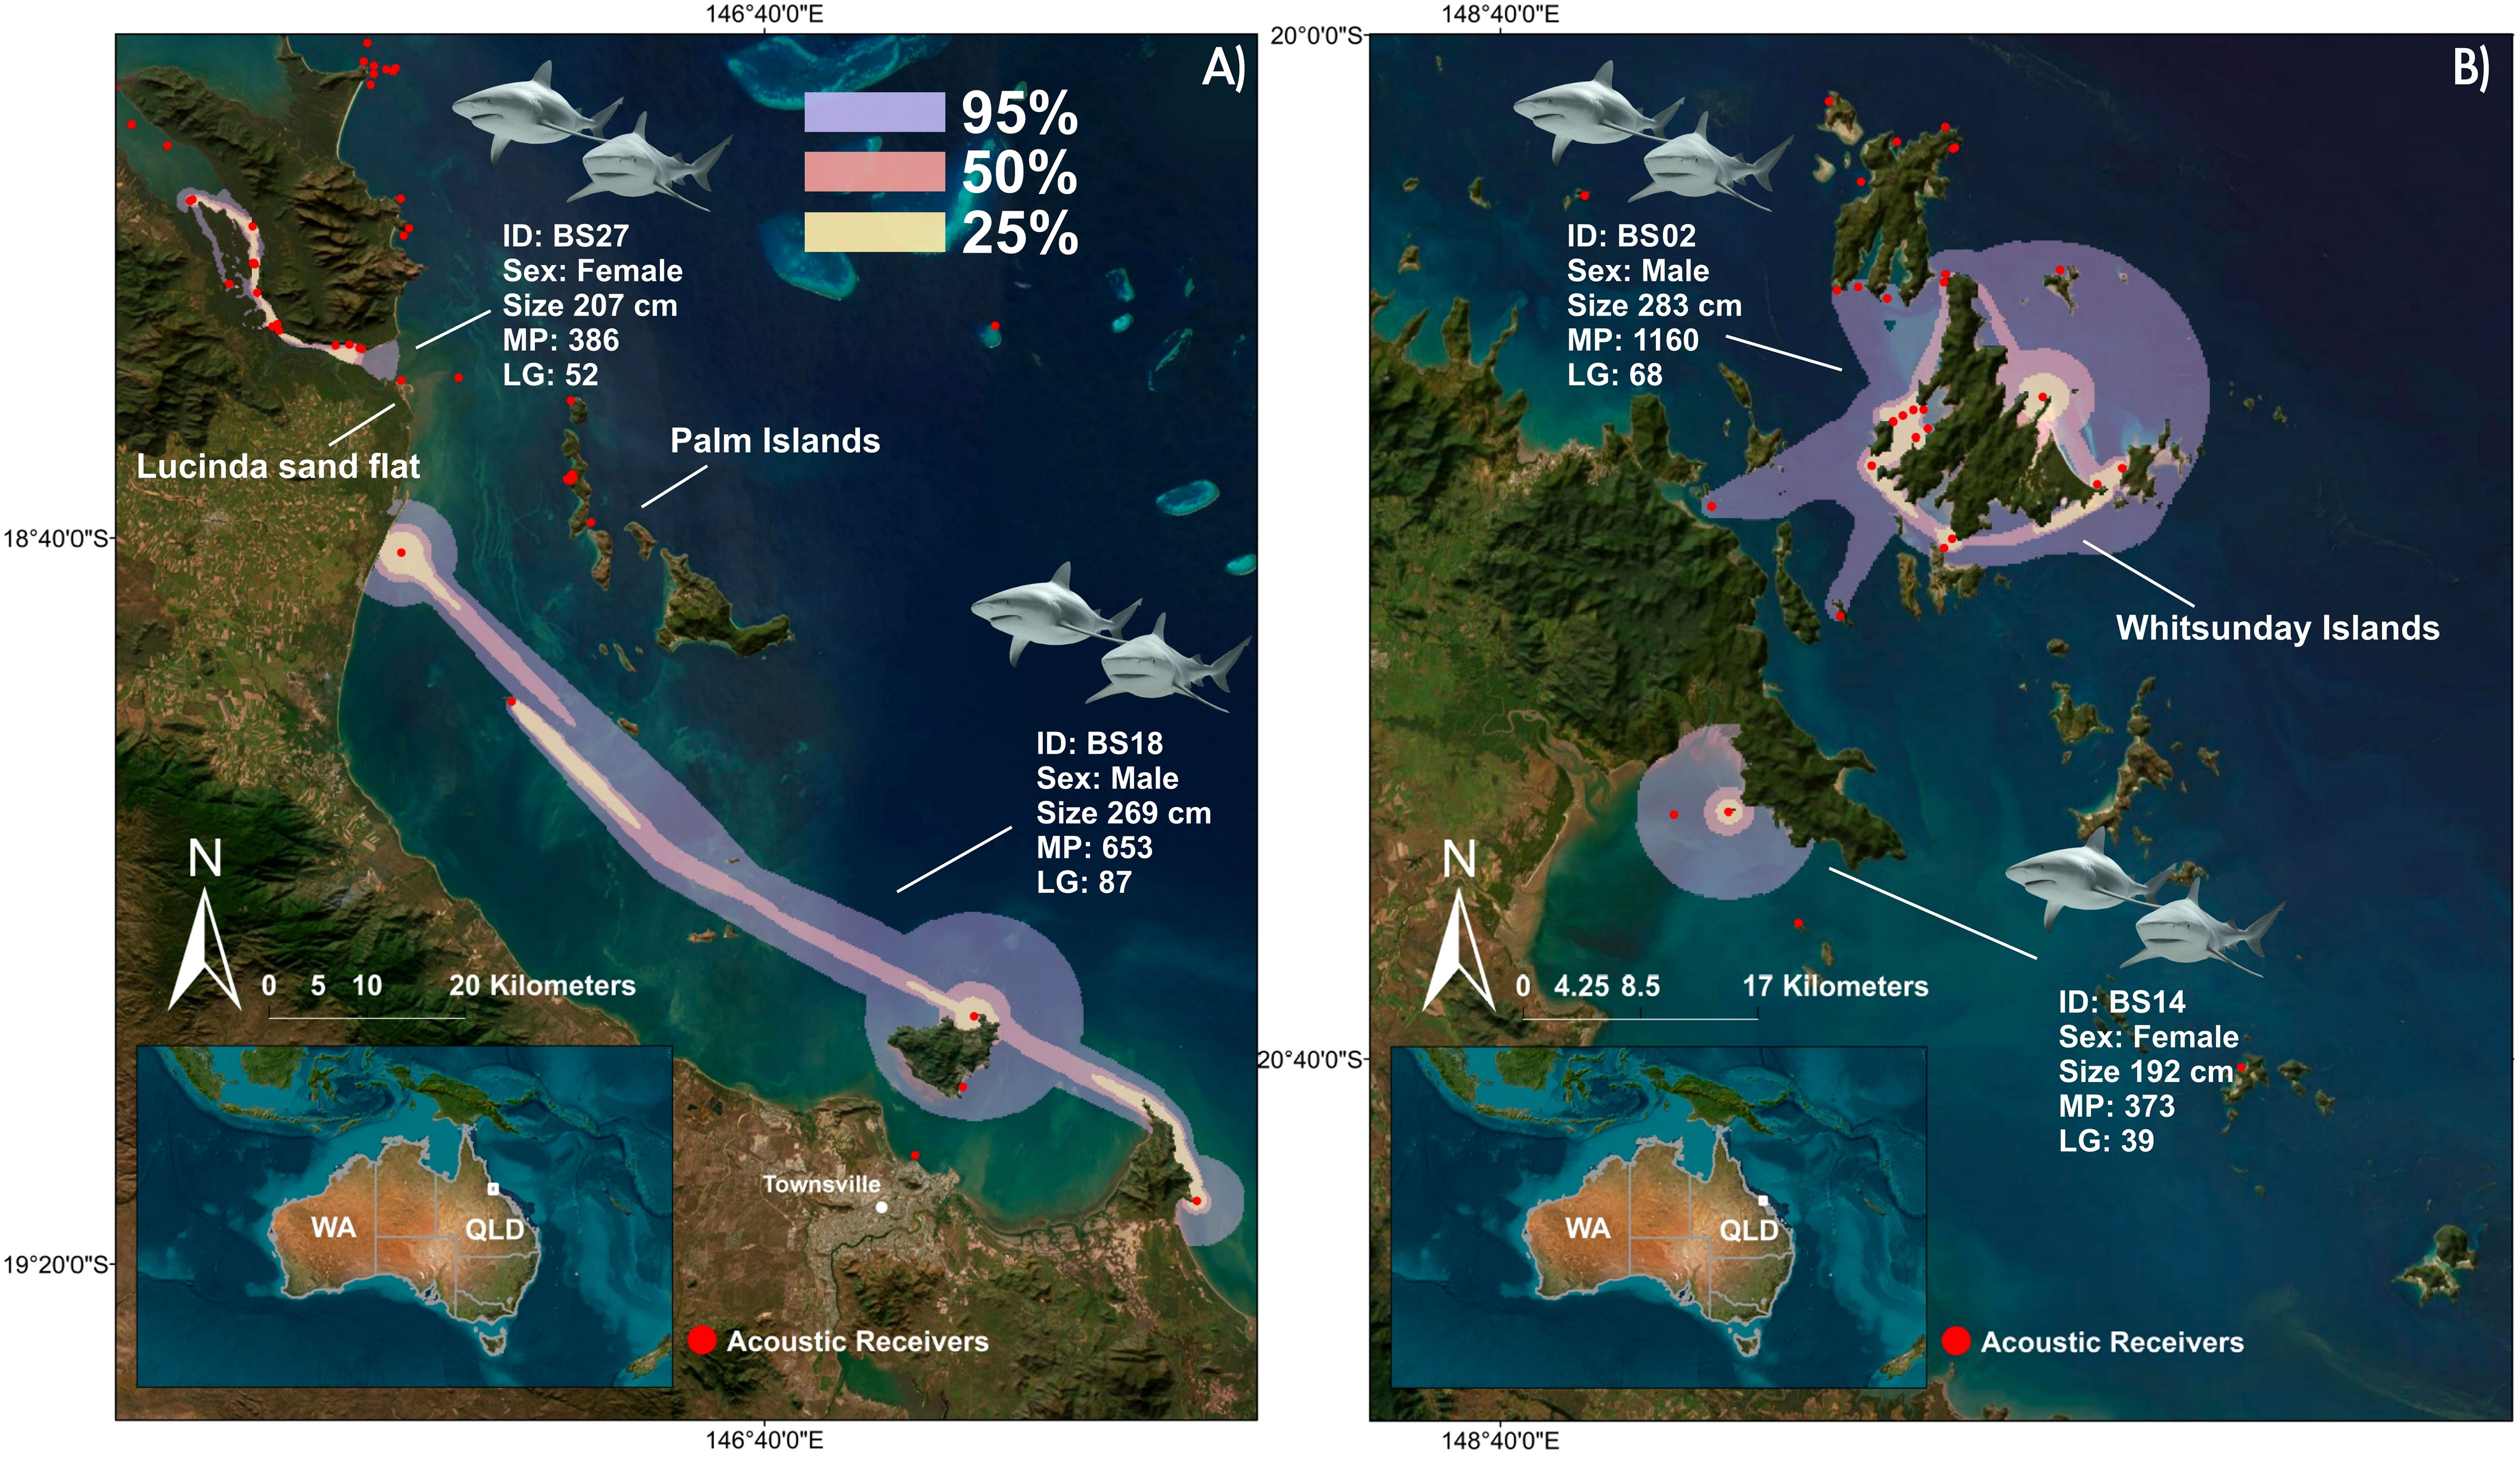
Figure 4 Extent of the 95%, 50%, 25% UDs based on dBBMM; (A) Home ranges for C. leucas BS18 and BS27, acoustically tagged off Townsville and offshore from the Lucinda sand flat; (B) Home ranges for C. leucas BS02 and BS14 acoustically tagged around the Whitsunday Islands. For maps of the remaining three C. leucas see Supplemental Material. [(MP, Monitoring period (days); LG, Longest detection gap (days)].
For the 16 S. mokarran that met the criteria, dBBMM resulted in a mean value of 1089.35 km2 (range: 26-4890 km2) for the 95% UD (Table 1). The mean values for the 50% and 25% were 108.47 km2 (range: 3-456 km2) and 33.65 km2 (range: 1-163 km2), respectively (Table 1; Figure 3). Females had a mean 95% UD of 1768.2 km2 compared to males with 132.16 km2. Generally, UDs did not differ across tagging methods for S. mokarran, and core use areas were close to the tagging area (Table 1; Figure 3). Although some individuals had larger detection gaps than 3 months and thus did not meet our criteria for home range estimation, subsequent detections were not recorded more than 500 km away from the tagging site, except for one female S. mokarran tagged at North-West Island. The dBBMM for the seven highly resident C. leucas (three females, four males) that met our criteria resulted in mean values for 95%, 50% and 25% UDs of 660.14 km2 (range: 60-2521 km2), 100.57 km2 (range: 10-267 km2) and 34.14 km2 (range: 3-87 km2), respectively (Figure 4; Supplemental Material). Resident females had a mean 95% UD of 731.76 km2 compared to 483.25 km2 in males.
Inshore, coastal habitats such as sand flats and inshore islands as well as coral reefs made up the core areas of habitat use for S. mokarran (Figure 3; Supplemental Material). For example, some individuals tagged in reef environments such as the reefs off Townsville, Heron Island or Batt Reef exclusively utilised reef habitats around their tagging area with limited displacements but some inter-reef connectivity (Figures 3A, C; Supplemental Material). Repeated connectivity between offshore reefs and inshore habitats was evident in four individuals, tagged at Batt Reef, Holbourne Island and Whitsunday Islands (Figure 3). Similarly, S. mokarran tagged at the Palm Islands made limited movements with extended use of the islands and shallow inshore habitats, such as near the Lucinda sand flat and Magnetic Island (Figures 3B–D). Nonetheless, three S. mokarran tagged at the Palm Islands made excursions (<500 km) to coastal habitats inshore of Batt Reef or to the Whitsunday Islands and inshore habitats off Mackay (Figure 3D; Supplemental Material).
For the seven resident C. leucas (movements <500 km and detection gaps <90 days), habitat use was similar to S. mokarran. Core use areas consisted of shallow inshore habitats around islands or coastal bays (Figure 4). This is in stark contrast to the large-scale migrant C. leucas, which used disparate habitats across tropical, subtropical, and warm-temperate zones (Figure 2).
3.2 Video surveys
3.2.1 Drone transects
To investigate presence/abundance of batoid prey, a total of 24 drone flights were conducted along the Lucinda flat from 2016 to 2019. Sixteen flights (December 2016 – December 2017) occurred in transects 1 and 2 (Figure 5). The remaining 8 flights (April 2019 – June 2019) occurred in transects 3 and 4. A total of seven batoid species were identified, with cowtail stingrays (Pastinachus ater) making up ~90% of sightings. For transects 1 and 2, mean batoid density was 19.95 individuals per ha in wet season 1 (range: 4.22 - 60.10) and 21.82 individuals per ha in dry season 1 (range: 11.08 - 44.99). Within the physically protected northern end of the flat (shallower, surrounded by mangroves) (transects 3 and 4), mean batoid density was 31.73 individuals per ha in wet season 2 (range: 31.19 - 32.27) and 30.10 for dry season 2 (range: 8.60 – 47.32). During an opportunistic drone flight on the 16th of December 2017, ca. 112 juvenile P. ater and 36 juvenile giant shovelnose rays (Glaucostegus typus) were observed aggregating against 40 m of shoreline at high tide (video in Supplemental Material).
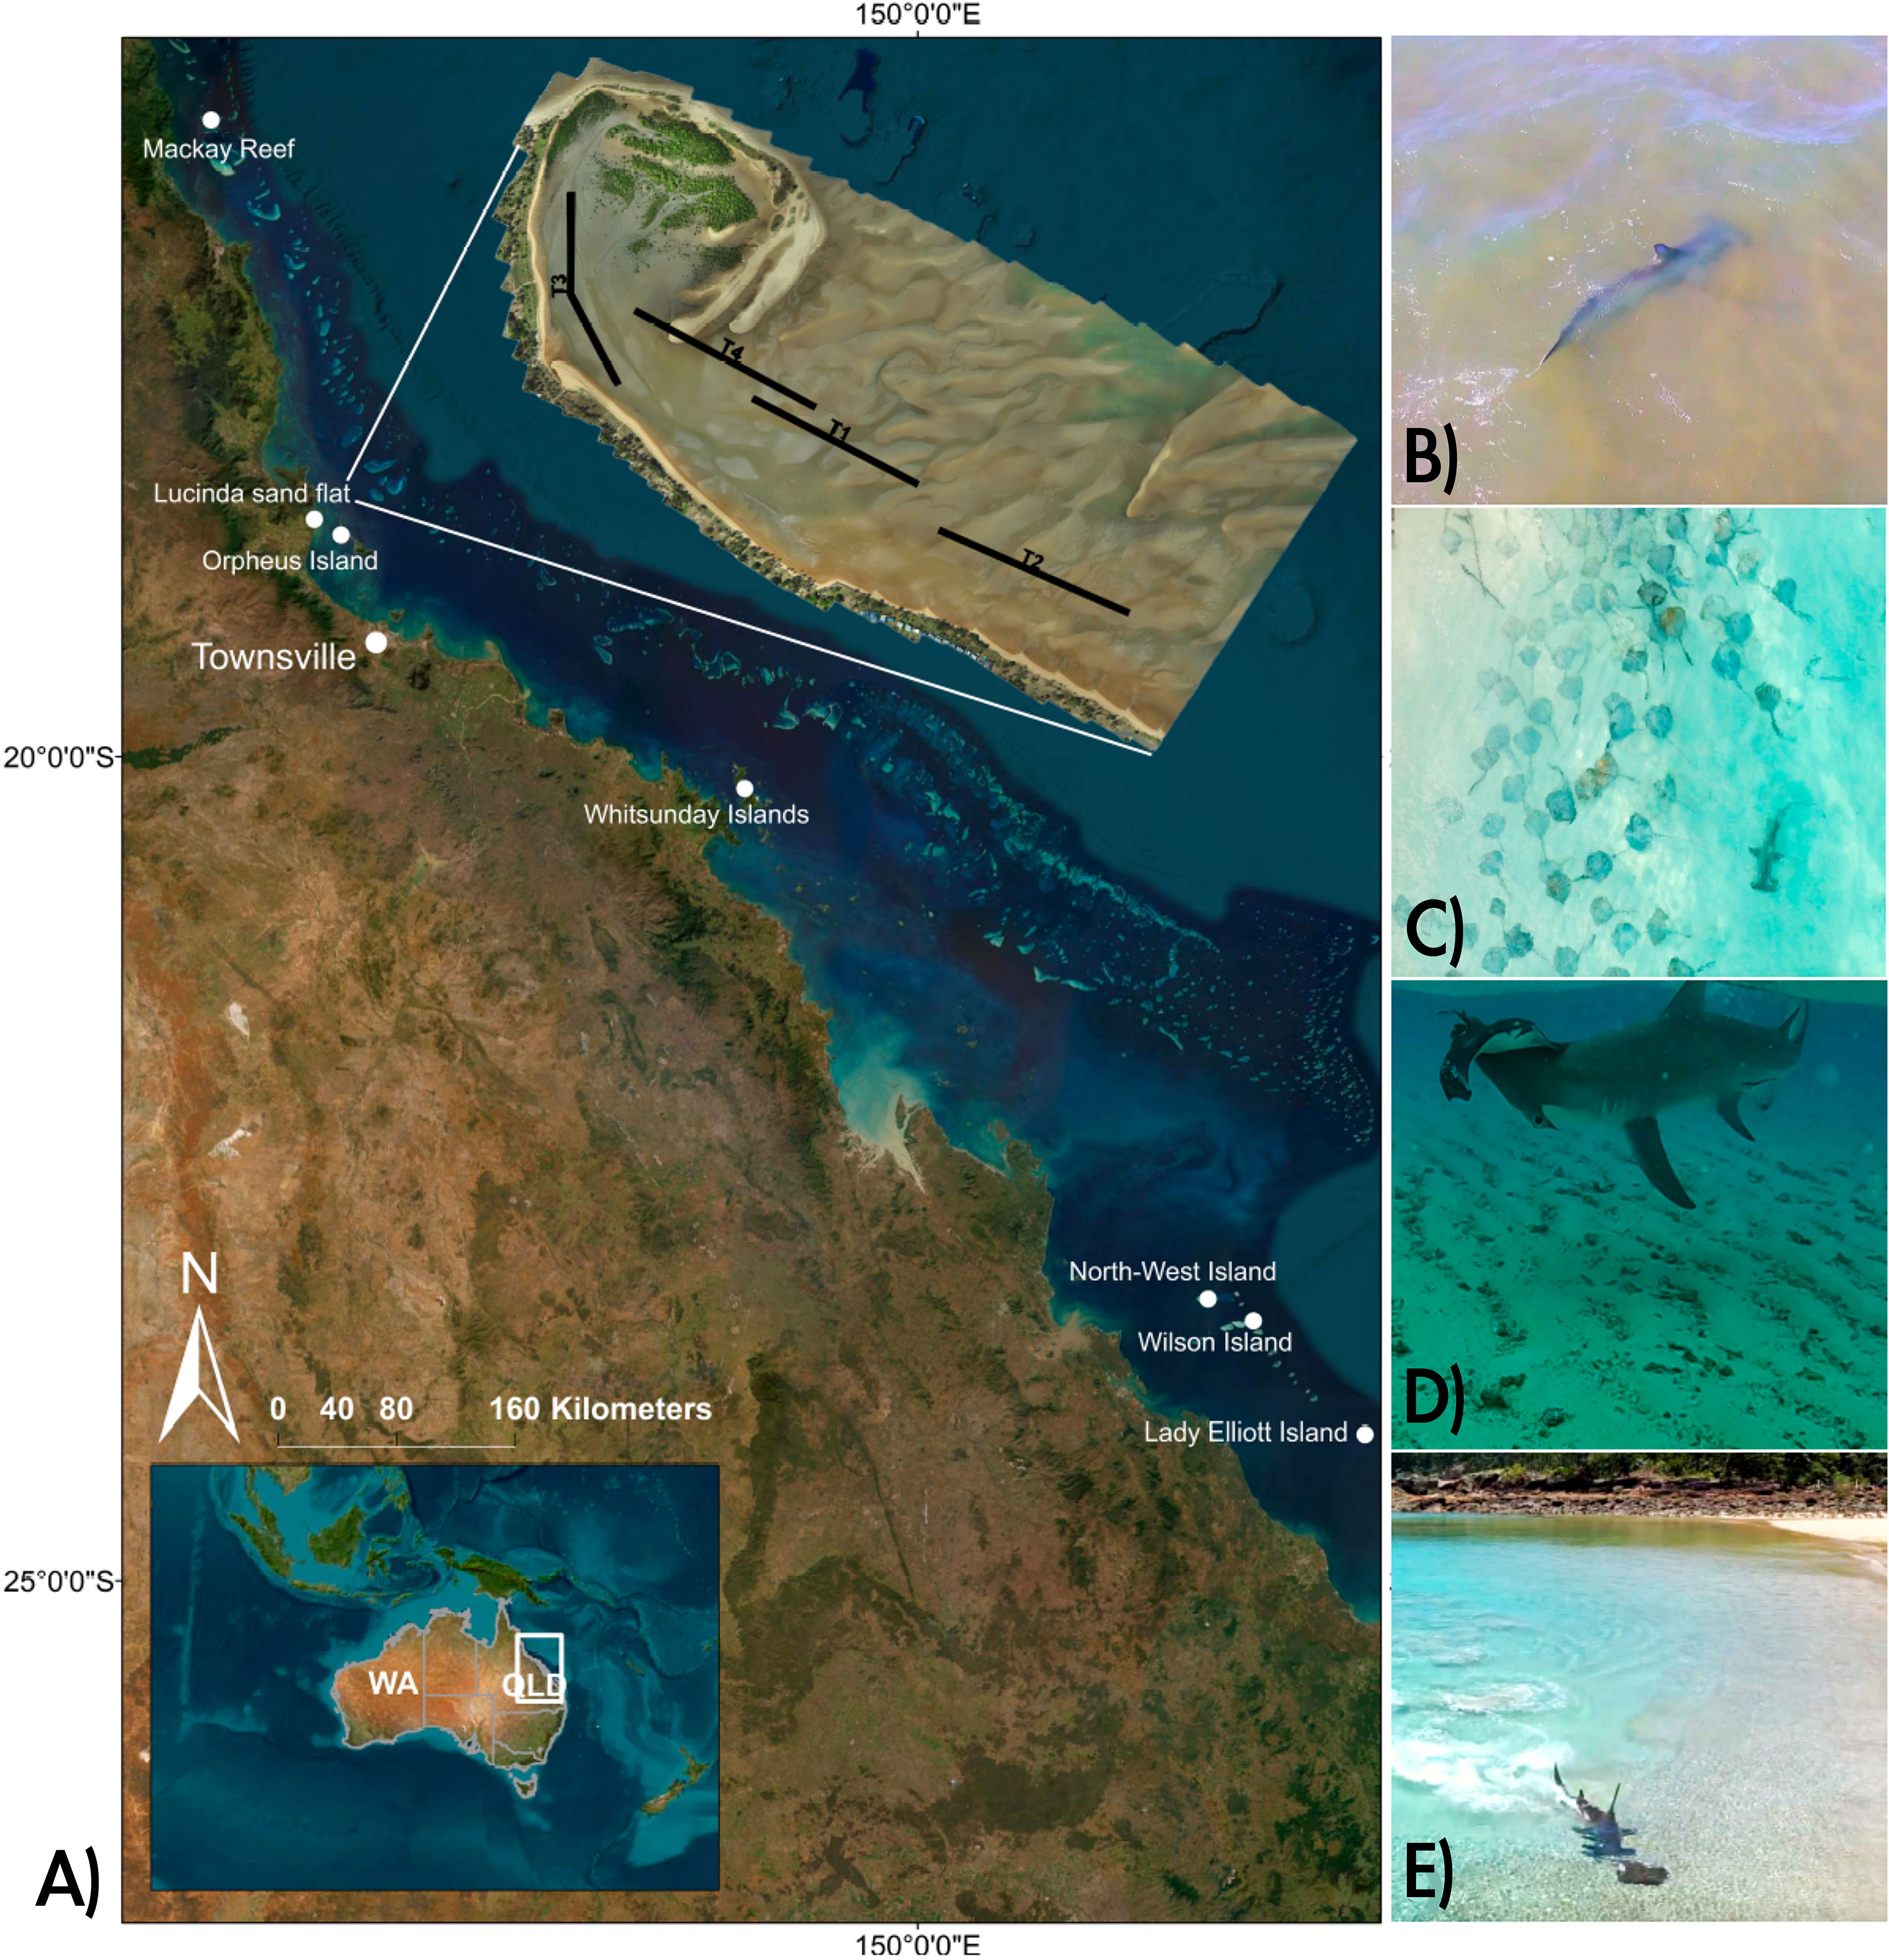
Figure 5 (A) Locations of video documented predation events by S. mokarran on batoids. An orthomosaic of the Lucinda sand flat is also shown, indicating Transects T1-T4, exploratory flights were conducted just south of T2; (B) S. mokarran foraging in shallow water on the Lucinda sand flat south of T2 (video/photo credit: Nicolas Lubitz; (C) S. mokarran swimming past a large group of P. ater at North-West Island (video/photo credit: Richard Fitzpatrick; (D) S. mokarran consuming a juvenile A. ocellatus at Mackay Reef (video/photo credit: Ocean Safari Tours); (E) S. mokarran attempting to capture a P. ater in shallow water in the Whitsunday Islands (video/photo credit: AboveDeck).
During drone flights (September-October 2022) south of transect 2 of the Lucinda flat (Figure 5), P. ater were observed during every flight (n=35). Other batoids observed were spotted eagle rays (Aetobatus ocellatus) (n=24 flights), G. typus (n=2 flights) and white-spotted wedgefish (Rhynchobatus australiae) (n=1 flight). Sharks during these flights included smaller (<2m), unidentified carcharhinids (n=4 flights) and hammerheads (n=2 flights), of which one was positively identified as an adult great hammerhead (Sphyrna mokarran), of ca. 3 m total length. The other hammerhead, due to its small size (<1.3m) could not be identified to species level (Supplemental Material). No sharks which could be positively identified as C. leucas were observed.
3.2.2 Additional video analysis
The social media search found 11 videos where S. mokarran were observed foraging or actively pursuing/consuming batoid prey in shallow sand/reef flats within our study area (Figure 5). Overall, the recorded incidents occurred at Orpheus Island (Palm Islands) (n=1), the Whitsunday Islands (n=3), Lady Elliott Island (n=2), Mackay Reef (n=3), Wilson Island (n=1) and North-West Island (n=1) (Figure 5). Sphyrna mokarran individuals were estimated between 200 – 400 cm total length and prey species pursued or consumed were P. ater (n= 3), spotted eagle rays (Aetobatus ocellatus) (n=6) and white-spotted wedgefish (Rhynchobatus australiae) (n=1) (see detailed descriptions of incidents in Supplemental Material.
3.3 Stable isotope analysis
To investigate the importance of batoids for S. mokarran diets, stable isotope values of 14 S. mokarran collected from the inshore platform reefs of Batt/Tongue Reef (n = 7) and from the sand flat-dominated areas inshore of the Palm Islands (n = 6) and Whitsundays Islands (n = 1) were compared to those of 62 P. ater from similar environments (n = 13 from reef habitat (reef flat at Orpheus Island); n = 49 from sand flats(Lucinda sand flat). C. leucas were also analysed for contextual comparison, and stable isotope composition compared with that of batoids and pelagic fish from the Townsville region and North-West Island (Frisch et al., 2014; Espinoza et al., 2019). Two S. mokarran (<2.3 m) and 10 C. leucas (<2.2 m) were considered immature (Last, 2009). Blood samples were collected from two mature and from two immature S. mokarran, as well as from 11 mature and nine immature C. leucas. Mature S. mokarran had higher δ13C than the immature animals, while C. leucas showed no differences among sizes (Table 2). Thus, immature, and mature C. leucas were grouped for further analyses, while the two life stages of S. mokarran were analysed separately.
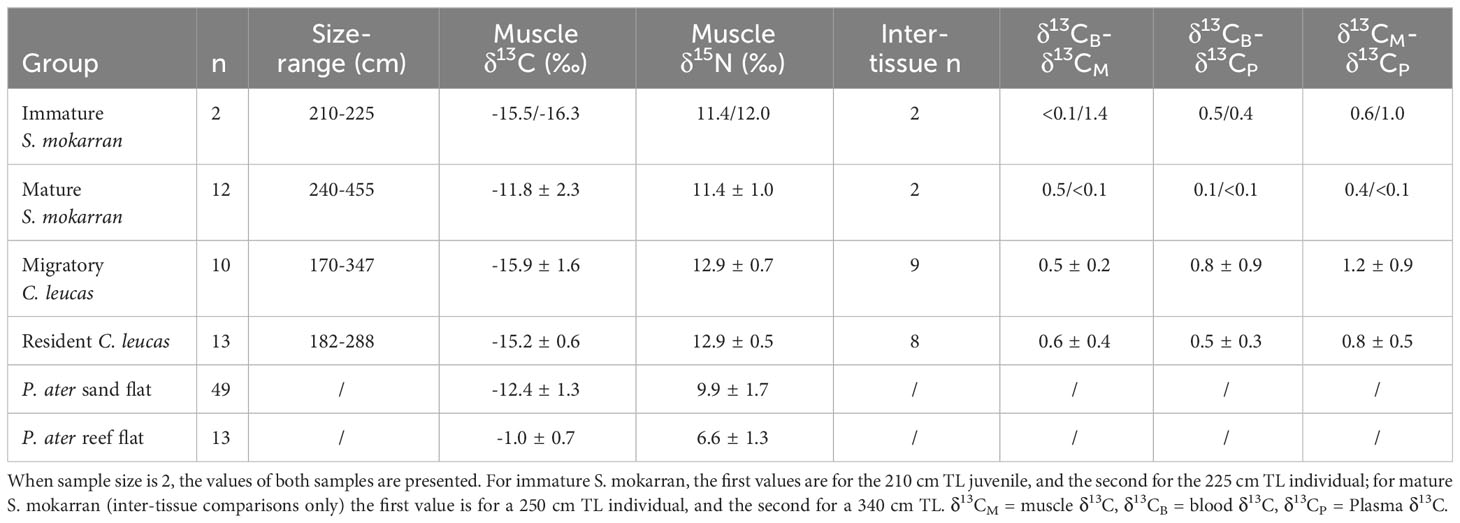
Table 2 Summary table of muscle stable isotope values (mean ± SD) and mean inter-tissue differences in δ13C (absolute values).
There were no differences in muscle δ13C or δ15N between sexes for either species (t-test, p < 0.05 in all cases). Mature S. mokarran had mean muscle δ13C of -11.8‰ (Table 2), but individuals sampled on reefs had higher δ13C (-10.2‰ ± 1.3‰) than those sampled from coastal islands adjacent to sand flats (-14.0‰ ± 0.7‰). As with mature S. mokarran, P. ater from reef flats had slightly higher δ13C than those sampled in proximity to sand flats (-10.0‰ ± 1.5‰ vs. -12.4‰ ± 1.8‰). Immature S. mokarran and C. leucas had similar δ13C values (-15.9‰ ± 0.5‰ and -15.5‰ ± 1.2‰, respectively), which were lower than those of mature S. mokarran (Table 2).
There was no overlap in SEAc between C. leucas and mature S. mokarran (Figure 6). Immature S. mokarran were closer in δ13C to C. leucas, but sample size was too small to calculate a SEAc. Overall, the SEAc for C. leucas was in the lower part of the δ13C spectrum, with corrected stable isotope values suggesting significant foraging on pelagic resources (Figure 6). In contrast, mature S. mokarran had higher δ13C, suggesting that the species is part of benthic food webs (e.g., coral reefs, seagrass and/or microphytobenthos-based food webs) (Figure 6). A significant reliance on batoid prey such as P. ater is supported by the fact that corrected stable isotope values of S. mokarran sampled from areas dominated by reef flats fell close to P. ater sampled from reef habitats, while S. mokarran sampled from areas dominated by sand flats, where only sparse small areas of fringing reefs are present, fell closer to P. ater sampled from sand flat habitats (Figure 6).
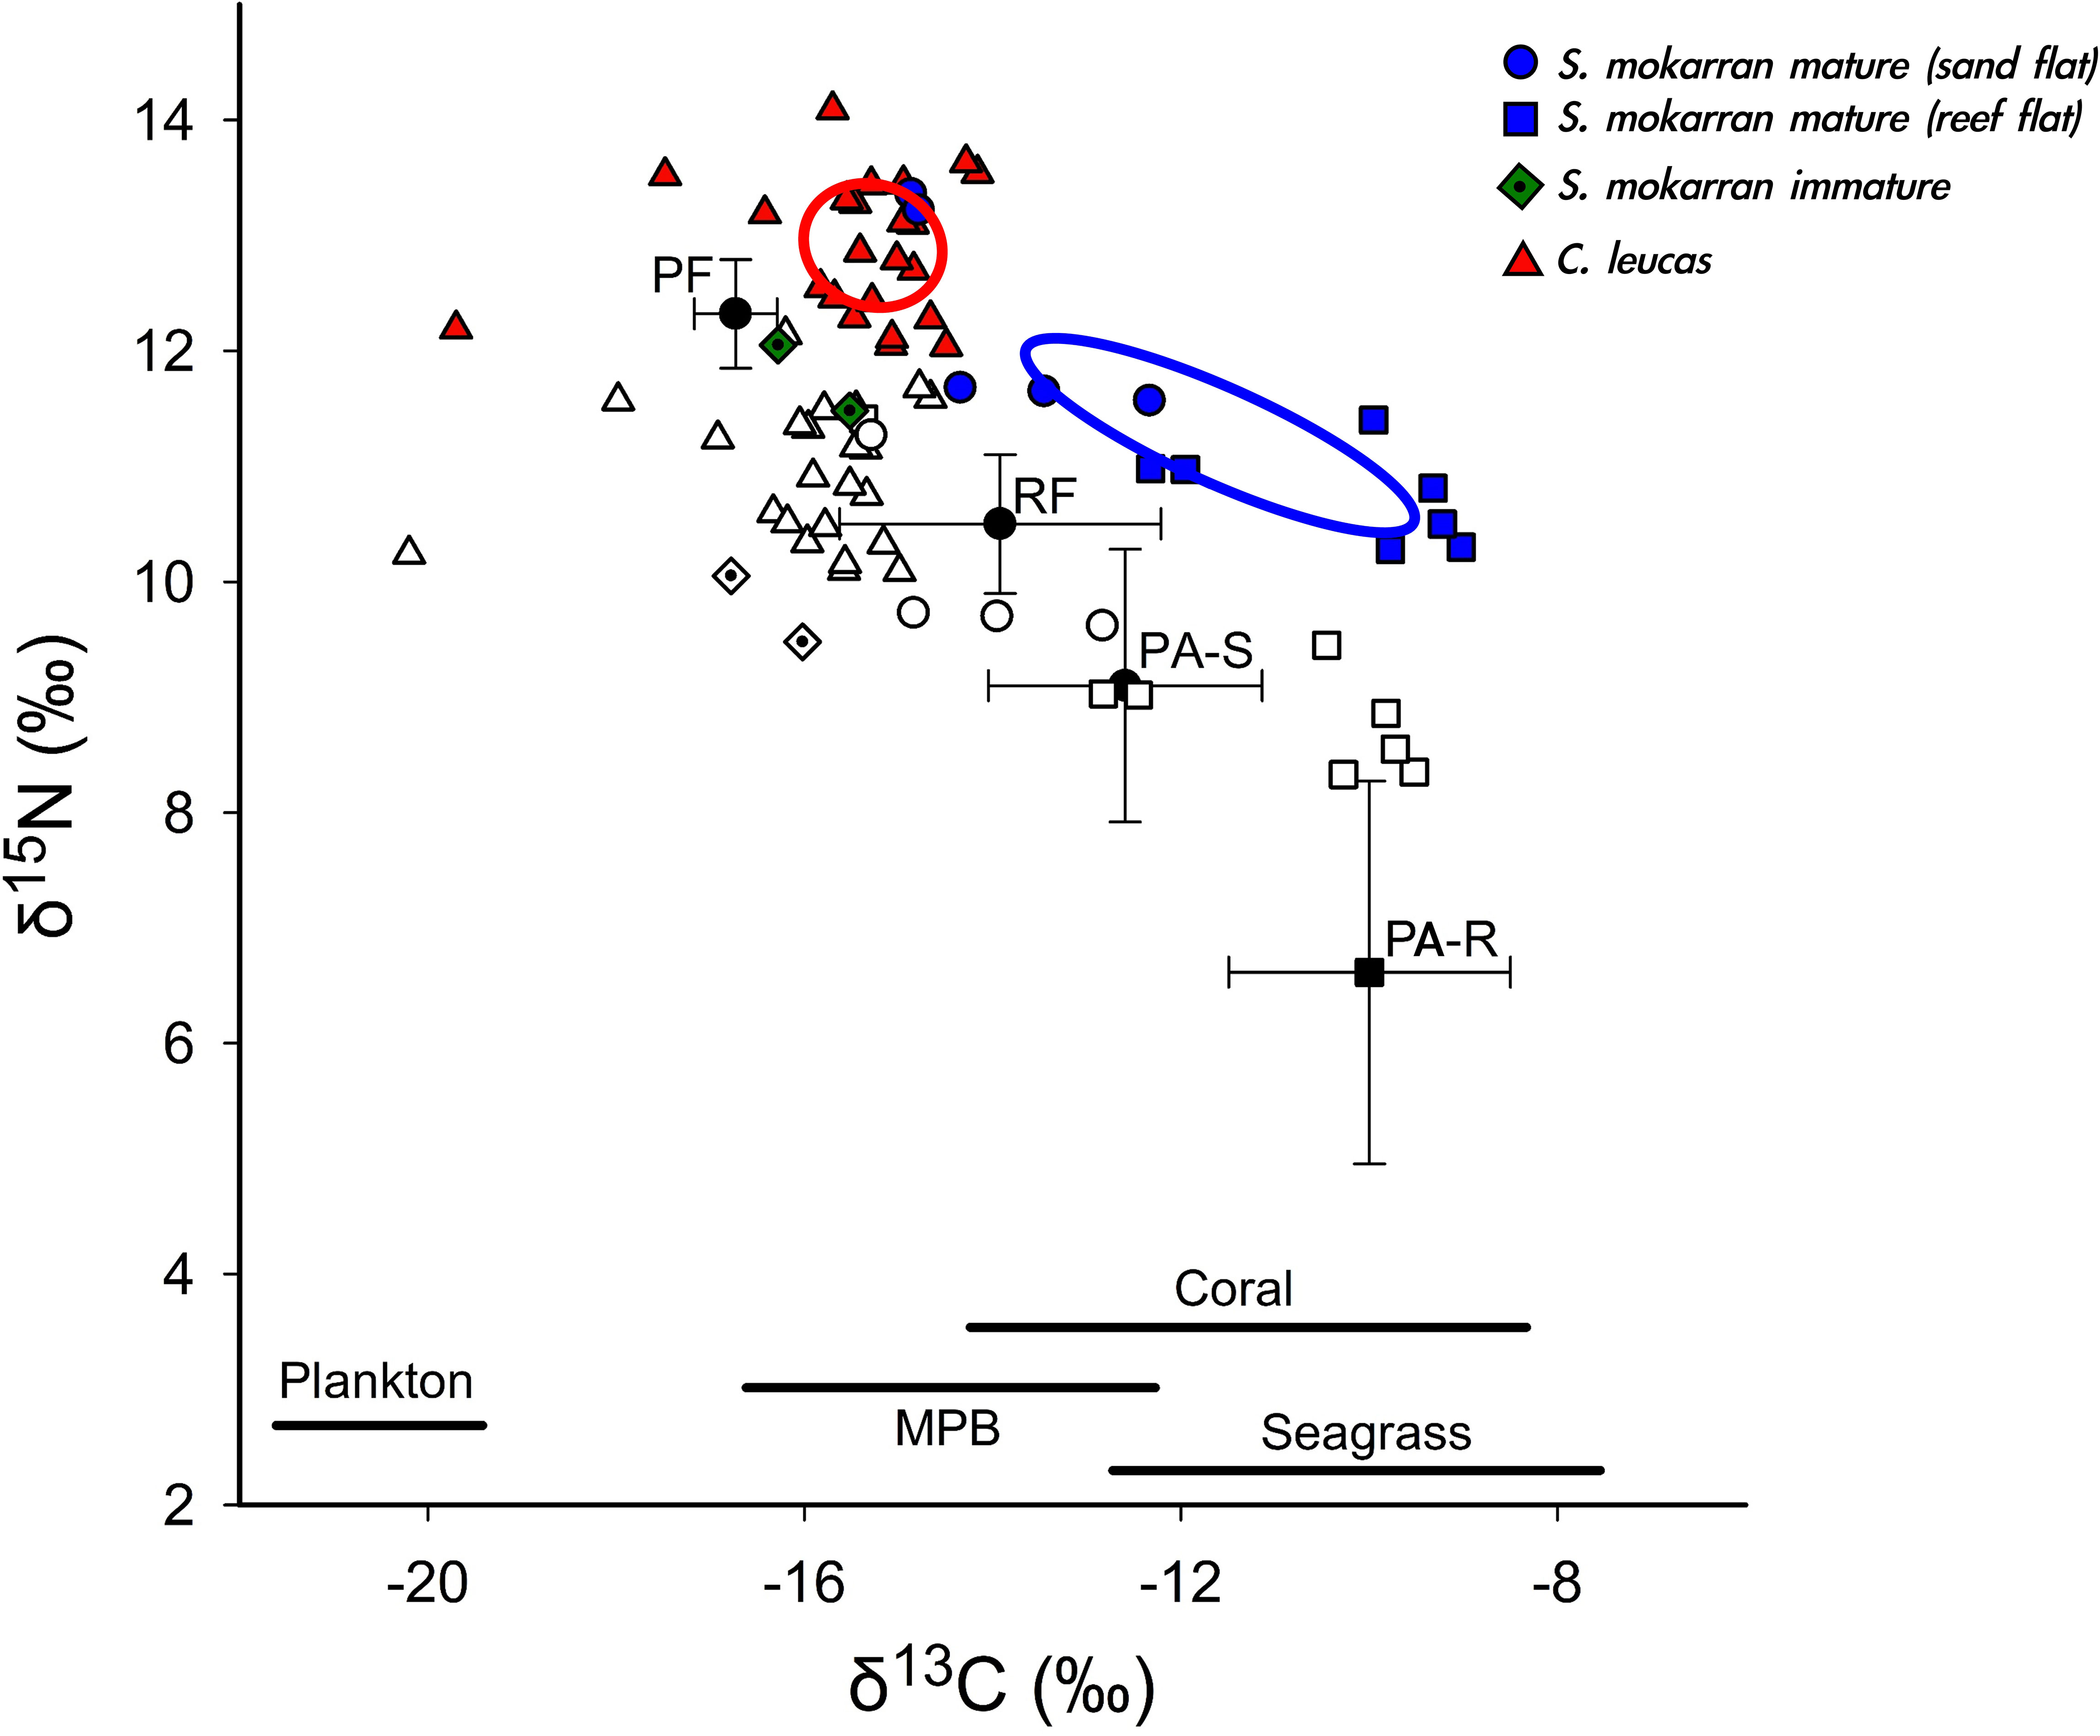
Figure 6 Measured (including SEAc) and corrected (white symbols) δ13C/δ15N values of S. mokarran, C. leucas and potential prey (P. ater from sand flats (PA-S) and reef flats (PA-R), pelagic predatory fish (PF; Espinoza et al. (2019)) and reef fish (RF; from Espinoza et al. (2019)). δ13C (± SD) of relevant primary producers is also indicated. Plankton δ13C (Espinoza et al. (2019), and Abrantes unpubl. data (2004-2009), seagrass δ13C (Hemminga and Mateo, 1996), coastal microphytobenthos (MPB) δ13C (Abrantes, unpubl. data (2004-2009); coral δ13C [Risk et al., 1994, Wild et al., 2008, Frisch et al., 2014 (combined mean ± SD)]. P.ater samples were collected between 2015-2019, C. leucas between 2019-2022 and S.mokarran between 2021-2023.
Blood could only be collected from four S. mokarran (two mature and two immature individuals). The 225 TL individual had the largest inter-tissue differences, particularly between blood (-14.9‰) and muscle (-16.3‰; a difference of 1.4‰), and plasma (-15.3‰) and muscle (a difference of 1.0‰). For the largest individual sampled, a 340 cm TL female, the three tissues had similar δ13C (difference <0.1‰ for all comparisons) (Table 2). Both resident and highly migrant C. leucas had higher mean differences in δ13C values between all tissue pairs than mature S. mokarran, but lower differences between whole blood and muscle than in immature S. mokarran (Table 2). Overall, resident C. leucas had lower differences between blood and plasma and muscle and plasma, but similar values between blood and muscle than migratory C. leucas (Table 2).
4 Discussion
The influence of dietary breadth and the spatio-temporal dynamics of preferred prey on predator movements is a fundamental component to understanding the functioning of marine and terrestrial systems (Madsen and Shine, 1996; Williams et al., 2004; Hayward and Kerley, 2008; Wirsing and Ripple, 2011). Yet, due to difficulties in observing predator-prey interactions in aquatic environments, how trophic ecology shapes space-use in marine predators is often inferred from spatial overlap of predator and suspected prey (e.g. Fitzpatrick et al., 2012; Hammerschlag et al., 2012; Griffin et al., 2022; Suraci et al., 2022). By utilising a context-focused, multi-method approach, combining telemetry, drone and video surveys and stable isotope analysis, we show a link between great hammerhead shark (Sphyrna mokarran) movements and a possible specialisation on year-round abundant batoid prey. This contrasts with the high intra-specific variability in movement and trophic ecology of bull sharks (Carcharhinus leucas).
Sphyrna mokarran exhibited comparatively small core use areas which consisted mainly of shallow inshore areas, and limited intra-specific variability. The use of shallow inshore shelf habitats by S. mokarran has been reported from our study region and other localities (Harry et al., 2011; Gallagher and Klimley, 2018). This limited dispersal is unusual, as large-bodied marine predators generally move over long-distances, often tracking seasonally changing resource availabilities (Block et al., 2011; Abrahms et al., 2019). Meanwhile, S. mokarran in other areas have shown large-scale movements that contrast with the patterns seen here (Hammerschlag et al., 2011; Guttridge et al., 2017). This discrepancy could be explained by different trophic dynamics and prey availability, as northern Australia is characterised by a large, productive coastal shelf with abundant estuaries and shallow habitats supporting batoid abundance and diversity, compared to the potentially less productive North-West Atlantic coastal habitats (Nagelkerken et al., 2015; Sheaves et al., 2015). Nonetheless, as demonstrated by the individual tagged at North-West Island, some S. mokarran may also occasionally move over larger spatial scales in northern Australia, although such movements away from core use areas appear short in duration (e.g., 6 weeks) in comparison to seasonal migrations in C. leucas. Terrestrial predators such as lions and wolves adjust home range size with prey availability, while theoretical models demonstrate a strong link between the distribution of resources and predator space-use (Walton et al., 2001; Mitchell and Powell, 2004; Tumenta et al., 2013). Although our results arise from just one batoid nursery, studies from other parts of northern Australia indicate similar patterns of high, year-round abundance of batoids in shallow nurseries (Cerutti-Pereyra et al., 2014; Martins et al., 2020). Thus, year-round availability of batoid prey across northern Australia may allow for smaller home ranges in S. mokarran.
Many species of batoids use inshore reef and sand flat habitats as nurseries (Cerutti-Pereyra et al., 2014; Crook, 2020; Martins et al., 2020) and indeed, our drone surveys confirm high, year-round occurrence of batoids in these habitats. Across inshore nurseries in northern Australia, batoid abundance is high and stable throughout the year, providing a consistent, year-round, food source to S. mokarran (Cerutti-Pereyra et al., 2014; Crook, 2020; Martins et al., 2020). In the present study, stable isotope results suggests that S. mokarran utilise the same relatively small areas through time (in agreement with tracking), consistently feeding on benthic organisms that are part of a localised food web. Indeed, S. mokarran δ13C differed between individuals sampled from coastal sand flat- vs. reef-dominated areas, and corrected S. mokarran δ13C fell close to rays sampled from equivalent habitats, with both prey and predator δ13C values agreeing well with the predominant benthic sources of nutrition at each habitat (microphytobenthos in coastal sand flat habitats and coral in coral reef habitats). The presence of these two groups led to the larger variability in overall S. mokarran δ13C when compared to C. leucas, despite the migratory behaviour of some C. leucas. In the seagrass-dominated Shark Bay, WA, S. mokarran also had stable isotope values that indicate feeding on rays (Heithaus et al., 2013). Although blood and plasma samples were only available for two mature S. mokarran, these two individuals had low inter-tissue differences in δ13C, suggesting a consistent diet over time. This was particularly the case for the largest individual sampled, which had similar δ13C for all three tissues. Combined, these results suggest that, across northern Australia, S. mokarran specialise on batoid prey, which appears to be in high abundance year-round, allowing for the majority of S. mokarran to move over smaller spatial scales.
The two immature S. mokarran had muscle δ13C values closer to C. leucas, suggestive of feeding on teleosts, which have been recorded as prey for smaller S. mokarran (Stevens and Lyle, 1989; Cliff, 1995; Hsu et al., 2022). The larger of these juveniles (a 225 cm TL female) also had largest differences in δ13C between tissue types, particularly between muscle (a tissue a turnover rate of months to years) and blood/plasma (tissues with much faster turnover rates), suggesting a recent ontogenetic shift in diet from a teleost-based juvenile diet to a benthic adult diet. Note also that the δ13C values of muscle were the lowest and similar to those of C. leucas, whereas plasma had higher δ13C, close to muscle samples from adults from the same (sand flat) habitat (and also close to plasma of the two mature S. mokarran sampled). S. mokarran females mature at 210–220 cm TL (Last and Stevens, 2009), so this individual was likely transitioning to maturity when it was sampled, and this study suggest that this transition is accompanied by a shift in diet. In contrast to S. mokarran, both migratory and resident C. leucas derived carbon mostly from plankton-based, pelagic, food webs, and had limited isotopic niche overlap with S. mokarran. Pelagic food webs are often dynamic and dominated by pulse-prey events (Rooney et al., 2006; MacKenzie et al., 2019), which may drive seasonal large-scale migrations in some C. leucas (Espinoza et al., 2016; Lubitz et al., 2023). Similar to this study, some bull sharks remain resident in subtropical areas in southern Africa, even after seasonally aggregating teleost prey disperse, despite other sharks migrating away (Lubitz et al., 2023). As previously suggested for southern Africa, this could be due to the dynamic nature of pelagic food webs, where both residents and migrants are seasonally attracted to a high abundance of localised resources, but migrants leave after resources decrease, while some residents sustain themselves on remaining resources or switch to other prey (Lubitz et al., 2023). However, seasonal temperature change and reproductive philopatry, where females will return to estuaries to pup, also play a role in driving bull shark movements, indicating a potentially complex interaction between environmental factors, prey, and reproduction in driving variable movement strategies in C. leucas (Tillett et al., 2012; Heupel et al., 2015).
In this study, both migrant and resident C. leucas had relatively high inter-tissue variability in δ13C, suggesting a broader trophic niche. Migrants had higher differences compared to residents, in line with large-scale foraging excursions across distant habitats, such as tropical coral reefs and temperate estuaries. In contrast to this high intra-specific variability in C. leucas, high year-round resource availability in benthic food webs may cause increased residency in predators specialising in resident, benthic prey, such as in S. mokarran. These differences in trophic and spatial ecology of S. mokarran and C. leucas are similar to sympatric predators in other systems. Differences in stable isotope composition was driven by migration distance and foraging habitat in pinniped species (Burton and Koch, 1999), while dietary/niche specialists have smaller home ranges than sympatric dietary/niche generalists in some terrestrial carnivores and birds (Walker et al., 2007; Gómez et al., 2016; Huaranca et al., 2019; Lagos et al., 2021).
Despite their relatively small-scale movements within the tropical study sites, where water temperatures likely remain favourable year-round, S. mokarran repeatedly moved between inshore habitats and mid-shelf coral reefs such as Batt Reef and reefs off the Palm Islands/Whitsunday Islands/Magnetic Island. Such habitat connectivity may constitute important trophic linkages, as both inshore habitats and reef flats are rich in batoids (Crook, 2020; Martins et al., 2020; Barnett et al., 2022a). This may also explain the almost tenfold difference between the 50% UD and 95% in S. mokarran where small core use areas (hunting grounds) seem connected via movement. Hunting in water, often as shallow as half a body height, has been observed numerous times in hammerhead sharks in the north-west Atlantic (Roemer et al., 2016). This is also evident in our collected videos of successful and unsuccessful predation events on batoids in shallow inter-tidal sand/reef habitats (Supplemental Material). The reduced three-dimensionality in these habitats combined with morphological and physiological adaptions likely offer a distinct advantage to S. mokarran. For instance, increased electro-reception in the cephalofoil and higher maneuverability compared to other carcharhiniforms appears ideal for locating buried batoids and pursuing them rapidly in shallow water (Kajiura, 2001; Kajiura et al., 2003). The use of the cephalofoil to pin batoids to the substrate, pivoting sideways to avoid the barb, and immobilising rays by tearing a wing off are also specialised behaviours for hunting batoids, providing further evidence for a trophic specialisation in S. mokarran (Strong et al., 1990; Chapman and Gruber, 2002). This active, shallow water hunting mechanism contrasts with the ambush tactics of the less maneuverable tiger shark (Galeocerdo cuvier) when hunting air-breathing prey in shallow two-dimensional seagrass habitats (Heithaus et al., 2002).
Direct predation pressure and non-consumptive (risk) effects induced by S. mokarran could have consequences for batoids. Indeed, juvenile batoids select micro-habitats on sand and reef flats with often suboptimal temperatures in favour of predator avoidance (Vaudo and Heithaus, 2013; Crook, 2020; Martins et al., 2020). Drone surveys observed P. ater and G. typus sheltering against the shoreline at high tide, with the smallest individuals situated closest to shore (Supplemental Material). Stingrays are often described as keystone species, influencing invertebrate communities, and physical processes through bioturbation (O'Shea et al., 2011; Flowers et al., 2021; Crook et al., 2022). Therefore, S. mokarran predation may influence the spatio-temporal distribution of batoids and their feeding and bioturbation rates, shaping ecosystem processes in inshore habitats (Rupp and Bornatowski, 2021).
Drivers of movement and habitat use can also be linked to reproduction (Shaw, 2016). For example, some sea birds and tuna migrate between breeding and feeding habitats, suggesting that both life history requirements need to be fulfilled across distant habitats (Frederiksen et al., 2004; Richardson et al., 2016). As mentioned above, movement patterns in C. leucas appear highly context-dependent, with large-scale migrations and residency, likely driven by reproductive philopatry, seasonal environmental change and resource availability across disparate habitats (Heupel et al., 2015; Niella et al., 2022; Lubitz et al., 2023). In contrast, limited dispersal, and affinity for shallow, inshore habitats of S. mokarran suggests that critical life-history requirements are performed over smaller spatial scales. Indeed, growing evidence from the Atlantic suggests S. mokarran utilise inshore pupping grounds (Barker et al., 2017; Macdonald et al., 2021). Although pups are rarely reported for Australia (Harry et al., 2011), young-of-the-year (YOY) have been caught in Cleveland Bay (Simpfendorfer et al., 2014) and observed in the Whitsunday Islands (Lubitz, personal observations), suggesting habitat overlap with mature individuals.
The smaller and less connected home ranges in S. mokarran imply reduced connectivity among regions. Yet, genetic connectivity occurs across the Australian distribution (Chin et al., 2017). However, only a few migrants per generation are needed to maintain genetic connectivity, while demographic connectivity may remain limited (Mills and Allendorf, 1996). This could make S. mokarran more vulnerable to local extinctions (Hueter et al., 2005). If genetic connectivity equates demographic connectivity needs further investigation (Lowe and Allendorf, 2010). Across taxa, narrow niche breadth is positively correlated to extinction risk (Kotiaho et al., 2005; Slatyer et al., 2013) and coastal, inshore habitats are most affected by pollution, habitat degradation and climate change, while small-scale movements may increase risk of targeted harvest and bycatch (Chin et al., 2010; Hughes et al., 2017; Scanes et al., 2020). Thus, limited demographic connectivity, a reliance on shallow inshore habitats and small home ranges may render S. mokarran particularly vulnerable to localized depletions particularly through targeted fishing, and climate change, raising concerns regarding recovery potential of this Critically Endangered species (Chin et al., 2010; Rigby et al., 2019). Reef and sand flats likely exhibit faster warming, while hammerhead physiology and specialisation could make them less adaptable to climate change (Wosnick et al., 2019). In contrast, the behavioural flexibility of C. leucas, including use of multiple migration strategies, a generalized diet, and high connectivity may facilitate adaptability to anthropogenic stressors and increased resilience (Chin et al., 2010).
Studies investigating connectivity and essential habitats for S. mokarran life history requirements, and the anthropogenic stressors they are subjected to in coastal habitats are required to evaluate the impacts of climate change and assess extinction risks (Chin et al., 2010). Further trophic studies using high resolution dietary markers through fatty acid analysis of both predator and prey may help to further solidify the predator-prey relationship between S. mokarran and batoids. This may facilitate a better understanding of how predation pressure and risk effects impact behaviour and distribution of batoids (Heithaus et al., 2012).
In conclusion, while it would have been difficult using tracking or trophic information alone, the multi-method approach allowed us to establish a link between limited dispersal and smaller home ranges in S. mokarran with a potential feeding specialisation on batoids in benthic food webs. In contrast, C. leucas showed restricted and large-scale movements which could be partially influenced by higher trophic flexibility and reliance on dynamic, pelagic food webs (Tillett et al., 2014; Niella et al., 2022; Lubitz et al., 2023). Therefore, as with their terrestrial counterparts (Tumenta et al., 2013), trophic ecology can play a role in shaping marine predator space-use.
Data availability statement
The tracking data used in this study are publicly available and can be accessed from the Australian Animal Acoustic Telemetry Database facilitated by the Integrated Marine Observing System (IMOS) at https://animaltracking.aodn.org.au/. Drone survey data and stingray stable isotope values are available in Crook, 2020 and Martins et al., 2022. Uncorrected shark stable isotope data are currently being used for additional studies in preparation but can be requested from the corresponding author. Video files are available in the Supplementary Material.
Ethics statement
Animal capture and tagging was conducted under Great Barrier Reef Marine Park Permit G22/46908.1, general Queensland Fisheries Permit 266351 and ethics permit A2846, approved by the James Cook University ethics committee.
Author contributions
NL: Conceptualization, Data curation, Formal Analysis, Funding acquisition, Investigation, Methodology, Writing – original draft. KA: Data curation, Formal Analysis, Writing – review & editing. KC: Conceptualization, Data curation, Writing – review & editing. LC: Funding acquisition, Project administration, Writing – review & editing. AC: Data curation, Funding acquisition, Writing – review & editing. MS: Conceptualization, Supervision, Writing – review & editing. RF: Data curation, Writing – review & editing. AM: Data curation, Writing – review & editing. SB: Data curation, Writing – review & editing. IM: Data curation, Writing –review & editing. AB: Conceptualization, Data curation, Funding acquisition, Supervision, Writing – review & editing.
Funding
The author(s) declare financial support was received for the research, authorship, and/or publication of this article. Funding for this study was partially provided by the Department of Environment and Science, Queensland, The Department of Agriculture and Fisheries, Queensland, the Save Our Seas Foundation, the Holsworth Wildlife Research Endowment Student Grant, and the Orpheus Island Research Station Morris Family Trust Student Research Grant Scheme.
Acknowledgments
Data were sourced from Australia’s Integrated Marine Observing System (IMOS) – IMOS is enabled by the National Collaborative Research Infrastructure Strategy (NCRIS). The Queensland IMOS acoustic telemetry array project is operated by the Australian Institute of Marine Science and funded by the Department of Environment and Science, Queensland. We thank Michelle Heupel and Colin Simpfendorfer for providing infrastructure, tracking data for great hammerhead sharks acoustically tagged before 2019 and input for this manuscript. We thank the Orpheus Island Research Station staff and all field volunteers for their support. We express our gratitude and give credit to Chris Garraway for providing video footage of incident one, Jacinta Shackleton for incident two, Aleksandr Jeldosev for incident three, Taleatha Pell for incident four, @OceanSafari for incident six, AboveDeck for incident seven, Alexandra Dowse for incident nine and @OceanSafari tour guides Eve Wright and Brooke Nikora for incident 10/11 (All videos in Supplemental Material). We would also like to acknowledge the traditional owners and highlight their continued connection to the Sea Country on which field work for this study took place; the West Thalanyji, Eastern Kuku Yalanji, Yirrganydji, Bandjin, Djiru, Warrgamay, Wulgurukaba, Bindal, Manbarra, Ngaro, Gooreng Gooreng, Gurang, Bailai and Taribelang Bunda peoples and pay our respects to their elders, past, present, and emerging.
Conflict of interest
The authors declare that the research was conducted in the absence of any commercial or financial relationships that could be construed as a potential conflict of interest.
Publisher’s note
All claims expressed in this article are solely those of the authors and do not necessarily represent those of their affiliated organizations, or those of the publisher, the editors and the reviewers. Any product that may be evaluated in this article, or claim that may be made by its manufacturer, is not guaranteed or endorsed by the publisher.
Supplementary material
The Supplementary Material for this article can be found online at: https://www.frontiersin.org/articles/10.3389/fmars.2023.1274275/full#supplementary-material
References
Abrahms B., Hazen E. L., Aikens E. O., Savoca M. S., Goldbogen J. A., Bograd S. J., et al. (2019). Memory and resource tracking drive blue whale migrations. Proc. Natl. Acad. Sci. 116 (12), 5582–5587. doi: 10.1073/pnas.1819031116
Barker A., Frazier B., Bethea D., Gold J., Portnoy D. (2017). Identification of young-of-the-year great hammerhead shark Sphyrna mokarran in northern Florida and South Carolina. J. Fish Biol. 91 (2), 664–668. doi: 10.1111/jfb.13356
Barnett A., Abrantes K. G., Stevens J. D., Semmens J. M. (2011). Site fidelity and sex-specific migration in a mobile apex predator: implications for conservation and ecosystem dynamics. Anim. Behav. 81 (5), 1039–1048. doi: 10.1016/j.anbehav.2011.02.011
Barnett A., Braccini M., Dudgeon C., Payne N., Abrantes K., Sheaves M., et al. (2017). The utility of bioenergetics modelling in quantifying predation rates of marine apex predators: Ecological and fisheries implications. Sci. Rep. 7 (1), 1–10. doi: 10.1038/s41598-017-13388-y
Barnett A., Fitzpatrick R., Bradley M., Miller I., Sheaves M., Chin A., et al. (2022a). Scientific response to a cluster of shark bites. People Nat. 4 (4), 963–982. doi: 10.1002/pan3.10337
Barnett A. (2022b). Internal tagging methods. In Chapter 11: Research methods for marine and estuarine fishes (Holmes, B. J., S. M. Williams, A. Barnett, C. A. Awruch, L. M. Currey-Randall, L. C. Ferreira, C. Huveneers, R. L. Jones, S. J. Nowland, and A. Taylor.). In Wildlife Ethics in Australia (Eds: Helen Waudby, Bradley Smith, Damien Morrant ). CSIRO Publishing, Australia.
Barnett A., McAllister J. D., Semmens J., Abrantes K., Sheaves M., Awruch C. (2019). Identification of essential habitats: Including chimaeras into current shark protected areas. Aquat. Conservation: Mar. Freshw. Ecosyst. 29 (6), 865–880. doi: 10.1002/aqc.3087
Barnett A., Semmens J. M. (2012). Sequential movement into coastal habitats and high spatial overlap of predator and prey suggest high predation pressure in protected areas. Oikos 121 (6), 882–890. doi: 10.1111/j.1600-0706.2011.20000.x
Bauer S., Hoye B. J. (2014). Migratory animals couple biodiversity and ecosystem functioning worldwide. Science 344 (6179), 1242552. doi: 10.1126/science.1242552
Bennett-Williams J., Skinner C., Wyatt A. S., McGill R. A., Willis T. J. (2022). A multi-tissue, multi-species assessment of lipid and urea stable isotope biases in mesopredator elasmobranchs. Front. Mar. Sci. 9, 289. doi: 10.3389/fmars.2022.821478
Block B. A., Jonsen I. D., Jorgensen S. J., Winship A. J., Shaffer S. A., Bograd S. J., et al. (2011). Tracking apex marine predator movements in a dynamic ocean. Nature 475 (7354), 86–90.
Burton R. K., Koch P. L. (1999). Isotopic tracking of foraging and long-distance migration in northeastern Pacific pinnipeds. Oecologia 119, 578–585. doi: 10.1007/s004420050822
Carlisle A. B., Litvin S. Y., Madigan D. J., Lyons K., Bigman J. S., Ibarra M., et al. (2017). Interactive effects of urea and lipid content confound stable isotope analysis in elasmobranch fishes. Can. J. Fisheries Aquat. Sci. 74 (3), 419–428. doi: 10.1139/cjfas-2015-0584
Carter W. A., Bauchinger U., McWilliams S. R. (2019). The importance of isotopic turnover for understanding key aspects of animal ecology and nutrition. Diversity 11 (5), 84. doi: 10.3390/d11050084
Catford J. A., Wilson J. R., Pyšek P., Hulme P. E., Duncan R. P. (2022). Addressing context dependence in ecology. Trends Ecol. Evol. 37 (2), 158–170. doi: 10.1016/j.tree.2021.09.007
Cerutti-Pereyra F., Thums M., Austin C., Bradshaw C., Stevens J. D., Babcock R., et al. (2014). Restricted movements of juvenile rays in the lagoon of Ningaloo Reef, Western Australia–evidence for the existence of a nursery. Environ. Biol. Fishes 97, 371–383. doi: 10.1007/s10641-013-0158-y
Chapman B., Hulthén K., Brodersen J., Nilsson P. A., Skov C., Hansson L. A., et al. (2012). Partial migration in fishes: causes and consequences. J. Fish Biol. 81 (2), 456–478. doi: 10.1111/j.1095-8649.2012.03342.x
Chapman D. D., Gruber S. H. (2002). A further observation of the prey-handling behavior of the great hammerhead shark, Sphyrna mokarran: Predation upon the spotted eagle ray, Aetobatus narinari. Bull. Mar. Sci. 70 (3), 947–952.
Chin A., Kyne P. M., Walker T. I., McAULEY R. B. (2010). An integrated risk assessment for climate change: analysing the vulnerability of sharks and rays on Australia's Great Barrier Reef. Global Change Biol. 16 (7), 1936–1953. doi: 10.1111/j.1365-2486.2009.02128.x
Chin A., Simpfendorfer C., White W., Johnson G., McAuley R., Heupel M. (2017). Crossing lines: a multidisciplinary framework for assessing connectivity of hammerhead sharks across jurisdictional boundaries. Sci. Rep. 7 (1), 46061.
Cliff G. (1995). Sharks caught in the protective gill nets off KwaZulu-Natal, South Africa. 8. The great hammerhead shark Sphyrna mokarran (Rüppell). South Afr. J. Mar. Sci. 15 (1), 105–114.
Cliff G., Dudley S. (1991). Sharks caught in the protective gill nets off Natal, South Africa. 4. The bull shark Carcharhinus leucas Valenciennes. South Afr. J. Mar. Sci. 10 (1), 253–270. doi: 10.2989/02577619109504636
Coughenour M. B. (1991). Spatial components of plant-herbivore interactions in pastoral, ranching, and native ungulate ecosystems. Rangeland Ecol. Management/Journal Range Manage. Arch. 44 (6), 530–542.
Croft D. P., Madden J. R., Franks D. W., James R. (2011). Hypothesis testing in animal social networks. Trends Ecol. Evol. 26 (10), 502–507. doi: 10.1016/j.tree.2011.05.012
Crook K. A. (2020). Assessing the functional roles of rays in coastal sandflats. (Doctoral dissertation, James Cook University).
Crook K. A., Barnett A., Sheaves M., Abrantes K. (2019). Effects of lipid and urea extraction on stable isotope values (δ13C and δ15N) of two batoids: A call for more species-specific investigations. Limnology Oceanography: Methods 17 (11), 565–574.
Crook K. A., Sheaves M., Barnett A. (2022). Species-specific foraging behaviors define the functional roles of sympatric stingrays. Limnology Oceanography 67 (1), 219–230. doi: 10.1002/lno.11987
Csardi G., Nepusz T. (2006). The igraph software package for complex network research. InterJournal Complex Syst. 1695 (5), 1–9.
Espinoza M., Heupel M. R., Tobin A. J., Simpfendorfer C. A. (2016). Evidence of partial migration in a large coastal predator: opportunistic foraging and reproduction as key drivers? PloS One 11 (2), e0147608. doi: 10.1371/journal.pone.0147608
Espinoza M., Lédée E. J., Simpfendorfer C. A., Tobin A. J., Heupel M. R. (2015). Contrasting movements and connectivity of reef-associated sharks using acoustic telemetry: Implications for management. Ecol. Appl. 25 (8), 2101–2118. doi: 10.1890/14-2293.1
Espinoza M., Matley J., Heupel M. R., Tobin A. J., Fisk A. T., Simpfendorfer C. A. (2019). Multi-tissue stable isotope analysis reveals resource partitioning and trophic relationships of large reef-associated predators. Mar. Ecol. Prog. Ser. 615, 159–176. doi: 10.3354/meps12915
Fitzpatrick R., Thums M., Bell I., Meekan M. G., Stevens J. D., Barnett A. (2012). A comparison of the seasonal movements of tiger sharks and green turtles provides insight into their predator-prey relationship. PloS One 7 (12), e51927. doi: 10.1371/journal.pone.0051927
Flowers K. I., Heithaus M. R., Papastamatiou Y. P. (2021). Buried in the sand: Uncovering the ecological roles and importance of rays. Fish fisheries 22 (1), 105–127. doi: 10.1111/faf.12508
Frederiksen M., Harris M. P., Daunt F., Rothery P., Wanless S. (2004). Scale-dependent climate signals drive breeding phenology of three seabird species. Global Change Biol. 10 (7), 1214–1221. doi: 10.1111/j.1529-8817.2003.00794.x
Frisch A. J., Ireland M., Baker R. (2014). Trophic ecology of large predatory reef fishes: energy pathways, trophic level, and implications for fisheries in a changing climate. Mar. Biol. 161, 61–73. doi: 10.1007/s00227-013-2315-4
Gallagher A. J., Klimley A. P. (2018). The biology and conservation status of the large hammerhead shark complex: the great, scalloped, and smooth hammerheads. Rev. Fish Biol. Fisheries 28 (4), 777–794. doi: 10.1007/s11160-018-9530-5
Geijer C. K., Notarbartolo di Sciara G., Panigada S. (2016). Mysticete migration revisited: are Mediterranean fin whales an anomaly? Mammal Rev. 46 (4), 284–296.
Gómez C., Tenorio E. A., Montoya P., Cadena C. D. (2016). Niche-tracking migrants and niche-switching residents: evolution of climatic niches in New World warblers (Parulidae). Proc. R. Soc. B: Biol. Sci. 283 (1824), 20152458.
Graham F., Rynne P., Estevanez M., Luo J., Ault J. S., Hammerschlag N. (2016). Use of marine protected areas and exclusive economic zones in the subtropical western North Atlantic Ocean by large highly mobile sharks. Diversity Distributions 22 (5), 534–546. doi: 10.1111/ddi.12425
Griffin L. P., Casselberry G. A., Lowerre-Barbieri S. K., Acosta A., Adams A. J., Cooke S. J., et al. (2022). Predator–prey landscapes of large sharks and game fishes in the Florida Keys. Ecol. Appl. 32 (5), e2584. doi: 10.1002/eap.2584
Guttridge T. L., Van Zinnicq Bergmann M. P., Bolte C., Howey L. A., Finger J. S., Kessel S. T., et al. (2017). Philopatry and regional connectivity of the great hammerhead shark, Sphyrna mokarran in the US and Bahamas. Front. Mar. Sci. 4, 3. doi: 10.3389/fmars.2017.00003
Hammerschlag N., Gallagher A. J., Lazarre D. M., Slonim C. (2011). Range extension of the Endangered great hammerhead shark Sphyrna mokarran in the Northwest Atlantic: preliminary data and significance for conservation. Endangered Species Res. 13 (2), 111–116. doi: 10.3354/esr00332
Hammerschlag N., Luo J., Irschick D. J., Ault J. S. (2012). A comparison of spatial and movement patterns between sympatric predators: bull sharks (Carcharhinus leucas) and Atlantic tarpon (Megalops atlanticus). PloS One 7 (9), e45958. doi: 10.1371/journal.pone.0045958
Harry A., Macbeth W., Gutteridge A., Simpfendorfer C. (2011). The life histories of endangered hammerhead sharks (Carcharhiniformes, Sphyrnidae) from the east coast of Australia. J. Fish Biol. 78 (7), 2026–2051. doi: 10.1111/j.1095-8649.2011.02992.x
Hayward M. W., Kerley G. I. (2008). Prey preferences and dietary overlap amongst Africa's large predators. South Afr. J. Wildlife Research-24-month delayed Open Access 38 (2), 93–108. doi: 10.3957/0379-4369-38.2.93
Heithaus M., Dill L., Marshall G., Buhleier B. (2002). Habitat use and foraging behavior of tiger sharks (Galeocerdo cuvier) in a seagrass ecosystem. Mar. Biol. 140, 237–248. doi: 10.1007/s00227-001-0711-7
Heithaus M. R., Vaudo J. J., Kreicker S., Layman C. A., Krützen M., Burkholder D. A., et al. (2013). Apparent resource partitioning and trophic structure of large-bodied marine predators in a relatively pristine seagrass ecosystem. Mar. Ecol. Prog. Ser. 481, 225–237. doi: 10.3354/meps10235
Heithaus M. R., Wirsing A., Dill L. (2012). The ecological importance of intact top-predator populations: a synthesis of 15 years of research in a seagrass ecosystem. Mar. Freshw. Res. 63 (11), 1039–1050. doi: 10.1071/MF12024
Hemminga M., Mateo M. (1996). Stable carbon isotopes in seagrasses: variability in ratios and use in ecological studies. Mar. Ecol. Prog. Ser. 140, 285–298. doi: 10.3354/meps140285
Heupel M. R., Simpfendorfer C. A., Espinoza M., Smoothey A. F., Tobin A., Peddemors V. (2015). Conservation challenges of sharks with continental scale migrations. Front. Mar. Sci. 2, 12. doi: 10.3389/fmars.2015.00012
Holdo R. M., Holt R. D., Fryxell J. M. (2009). Grazers, browsers, and fire influence the extent and spatial pattern of tree cover in the Serengeti. Ecol. Appl. 19 (1), 95–109. doi: 10.1890/07-1954.1
Horne J. S., Garton E. O., Krone S. M., Lewis J. S. (2007). Analyzing animal movements using Brownian bridges. Ecology 88 (9), 2354–2363. doi: 10.1890/06-0957.1
Hsu H. H., Nazeer Z., Panickan P., Lin Y.-J., Qasem A., Rabaoui L. J., et al. (2022). Stomach content analysis for juvenile great hammerhead sharks sphyrna mokarran (Rüppel ) from the arabian gulf. Fishes 7 (6), 359.
Huaranca J. C., Villalba M. L., Negrões N., Jiménez J. E., Macdonald D. W., Pacheco L. F. (2019). Density and activity patterns of Andean cat and pampas cat (Leopardus jacobita and L. colocolo) in the Bolivian Altiplano. Wildlife Res. 47 (1), 68–76.
Hueter R., Heupel M., Heist E., Keeney D. (2005). Evidence of philopatry in sharks and implications for the management of shark fisheries. J. northwest atlantic fishery Sci. 35 (1), 239–247. doi: 10.2960/J.v35.m493
Hughes T. P., Kerry J. T., Álvarez-Noriega M., Álvarez-Romero J. G., Anderson K. D., Baird A. H., et al. (2017). Global warming and recurrent mass bleaching of corals. Nature 543 (7645), 373–377.
Hussey N. E., MacNeil M. A., Fisk A. T. (2010). The requirement for accurate diet-tissue discrimination factors for interpreting stable isotopes in sharks: Comment on: stable isotope dynamics in elasmobranch fishes. Hydrobiologia 654, 1–5. doi: 10.1007/s10750-010-0361-1
Hutchings P., Kingsford M., Hoegh-Guldberg O. (2019). The Great Barrier Reef: biology, environment and management (Csiro publishing).
Huveneers C., Simpfendorfer C. A., Kim S., Semmens J. M., Hobday A. J., Pederson H., et al. (2016). The influence of environmental parameters on the performance and detection range of acoustic receivers. Methods Ecol. Evol. 7 (7), 825–835. doi: 10.1111/2041-210X.12520
Jonsen I. D., Grecian W. J., Phillips L., Carroll G., McMahon C., Harcourt R. G., et al. (2023). aniMotum, an R package for animal movement data: Rapid quality control, behavioural estimation and simulation. Methods Ecol. Evol. 14 (3), 806–816. doi: 10.1111/2041-210X.14060
Kajiura S. M. (2001). Head morphology and electrosensory pore distribution of carcharhinid and sphyrnid sharks. Environ. Biol. Fishes 61, 125–133. doi: 10.1023/A:1011028312787
Kajiura S. M., Forni J. B., Summers A. P. (2003). Maneuvering in juvenile carcharhinid and sphyrnid sharks: the role of the hammerhead shark cephalofoil. Zoology 106 (1), 19–28. doi: 10.1078/0944-2006-00086
Kim S. L., del Rio C. M., Casper D., Koch P. L. (2012). Isotopic incorporation rates for shark tissues from a long-term captive feeding study. J Exp Biol, 215 (14), 2495–2500.
Kotiaho J. S., Kaitala V., Komonen A., Päivinen J. (2005). Predicting the risk of extinction from shared ecological characteristics. Proc. Natl. Acad. Sci. 102 (6), 1963–1967. doi: 10.1073/pnas.0406718102
Kranstauber B., Kays R., LaPoint S. D., Wikelski M., Safi K. (2012). A dynamic Brownian bridge movement model to estimate utilization distributions for heterogeneous animal movement. J. Anim. Ecol. 81 (4), 738–746. doi: 10.1111/j.1365-2656.2012.01955.x
Lagos N., Villalobos R., Vianna J. A., Espinosa-Miranda C., Rau J. R., Iriarte A. (2021). The spatial and trophic ecology of culpeo foxes (Lycalopex culpaeus) in the high Andes of northern Chile. Stud. Neotropical Fauna Environ., 1–10.
Lal A., Arthur R., Marbà N., Lill A. W., Alcoverro T. (2010). Implications of conserving an ecosystem modifier: increasing green turtle (Chelonia mydas) densities substantially alters seagrass meadows. Biol. Conserv. 143 (11), 2730–2738. doi: 10.1016/j.biocon.2010.07.020
Lédée E. J., Heupel M. R., Taylor M. D., Harcourt R. G., Jaine F. R., Huveneers C., et al. (2021). Continental-scale acoustic telemetry and network analysis reveal new insights into stock structure. Fish fisheries 22 (5), 987–1005.
Lemons G. E., Eguchi T., Lyon B. N., LeRoux R., Seminoff J. A. (2012). Effects of blood anticoagulants on stable isotope values of sea turtle blood tissue. Aquat. Biol. 14 (3), 201–206. doi: 10.3354/ab00397
Lima S. L. (2002). Putting predators back into behavioral predator–prey interactions. Trends Ecol. Evol. 17 (2), 70–75. doi: 10.1016/S0169-5347(01)02393-X
Lowe W. H., Allendorf F. W. (2010). What can genetics tell us about population connectivity? Mol. Ecol. 19 (15), 3038–3051.
Lubitz N., Bradley M., Sheaves M., Hammerschlag N., Daly R., Barnett A. (2022). The role of context in elucidating drivers of animal movement. Ecol. Evol. 12 (7), e9128. doi: 10.1002/ece3.9128
Lubitz N., Daly R., Filmalter J. D., Sheaves M., Cowley P. D., Naesje T. F., et al. (2023). Context drives movement patterns in a mobile marine predator. Movement Ecol. 11 (1), 28. doi: 10.1186/s40462-023-00390-5
Macdonald C., Jerome J., Pankow C., Perni N., Black K., Shiffman D., et al. (2021). First identification of probable nursery habitat for critically endangered great hammerhead Sphyrna mokarran on the Atlantic Coast of the United States. Conserv. Sci. Pract. 3 (8), e418. doi: 10.1111/csp2.418
MacKenzie K., Robertson D., Adams J., Altieri A., Turner B. (2019). Structure and nutrient transfer in a tropical pelagic upwelling food web: From isoscapes to the whole ecosystem. Prog. Oceanography 178, 102145. doi: 10.1016/j.pocean.2019.102145
Madsen T., Shine R. (1996). Seasonal migration of predators and prey–A study of pythons and rats in tropical Australia. Ecology 77 (1), 149–156. doi: 10.2307/2265663
Malpica-Cruz L., Herzka S. Z., Sosa-Nishizaki O., Lazo J. P. (2012). Tissue-specific isotope trophic discrimination factors and turnover rates in a marine elasmobranch: empirical and modeling results. Can. J. Fisheries Aquat. Sci. 69 (3), 551–564. doi: 10.1139/f2011-172
Martins A., Heupel M., Bierwagen S., Chin A., Simpfendorfer C. (2020). Diurnal activity patterns and habitat use of juvenile Pastinachus ater in a coral reef flat environment. PloS One 15 (2), e0228280. doi: 10.1371/journal.pone.0228280
Martins A., Matley J., Heupel M., Fisk A., Chin A., Simpfendorfer C. (2022). Trophic ecology of sympatric juvenile stingrays within a nursery area. Mar. Freshw. Res. 73 (5), 678–688. doi: 10.1071/MF21292
Mills L. S., Allendorf F. W. (1996). The one-migrant-per-generation rule in conservation and management. Conserv. Biol. 10 (6), 1509–1518. doi: 10.1046/j.1523-1739.1996.10061509.x
Mitchell M. S., Powell R. A. (2004). A mechanistic home range model for optimal use of spatially distributed resources. Ecol. Model. 177 (1-2), 209–232. doi: 10.1016/j.ecolmodel.2004.01.015
Nagelkerken I., Sheaves M., Baker R., Connolly R. M. (2015). The seascape nursery: a novel spatial approach to identify and manage nurseries for coastal marine fauna. Fish fisheries 16 (2), 362–371. doi: 10.1111/faf.12057
Niella Y., Flávio H., Smoothey A. F., Aarestrup K., Taylor M. D., Peddemors V. M., et al. (2020). Refined Shortest Paths (RSP): Incorporation of topography in space use estimation from node-based telemetry data. Methods Ecol. Evol. 11 (12), 1733–1742. doi: 10.1111/2041-210X.13484
Niella Y., Smoothey A. F., Taylor M. D., Peddemors V. M., Harcourt R. (2022). Environmental drivers of fine-scale predator and prey spatial dynamics in Sydney harbour, Australia, and adjacent coastal waters. Estuaries Coasts 45 (5), 1465–1479. doi: 10.1007/s12237-021-01020-2
O'Shea O. R., Thums M., Van Keulen M., Meekan M. (2011). Bioturbation by stingrays at Ningaloo reef, Western Australia. Mar. Freshw. Res. 63 (3), 189–197.
Payne N. L., Iosilevskii G., Barnett A., Fischer C., Graham R. T., Gleiss A. C., et al. (2016). Great hammerhead sharks swim on their side to reduce transport costs. Nat. Commun. 7 (1), 12289. doi: 10.1038/ncomms12289
Preen A., Marsh H., Lawler I., Prince R., Shepherd R. (1997). Distribution and abundance of dugongs, turtles, dolphins and other megafauna in Shark Bay, Ningaloo Reef and Exmouth Gulf, Western Australia. Wildlife Res. 24 (2), 185–208. doi: 10.1071/WR95078
Raoult V., Broadhurst M. K., Peddemors V. M., Williamson J. E., Gaston T. F. (2019). Resource use of great hammerhead sharks (Sphyrna mokarran) off eastern Australia. J. Fish Biol. 95 (6), 1430–1440. doi: 10.1111/jfb.14160
Renshaw S., Hammerschlag N., Gallagher A. J., Lubitz N., Sims D. W. (2023). Global tracking of shark movements, behaviour and ecology: A review of the renaissance years of satellite tagging studie –2020. J. Exp. Mar. Biol. Ecol. 560, 151841. doi: 10.1016/j.jembe.2022.151841
Richardson D. E., Marancik K. E., Guyon J. R., Lutcavage M. E., Galuardi B., Lam C. H., et al. (2016). Discovery of a spawning ground reveals diverse migration strategies in Atlantic bluefin tuna (Thunnus thynnus). Proc. Natl. Acad. Sci. 113 (12), 3299–3304. doi: 10.1073/pnas.1525636113
Rigby C., Barreto R., Carlson J., Fernando D., Fordham S., Francis M., et al. (2019). “Great hammerhead Sphyrna mokarran,” in The IUCN red list of threatened species.
Risk M., Sammarco P., Schwarcz H. (1994). Cross-continental shelf trends in δ 13 C in coral on the Great Barrier Reef. Mar. Ecol. Prog. Ser., 121–130. doi: 10.3354/meps106121
Roemer R. P., Gallagher A. J., Hammerschlag N. (2016). Shallow water tidal flat use and associated specialized foraging behavior of the great hammerhead shark (Sphyrna mokarran). Mar. Freshw. Behav. Physiol. 49 (4), 235–249. doi: 10.1080/10236244.2016.1168089
Rooney N., McCann K., Gellner G., Moore J. C. (2006). Structural asymmetry and the stability of diverse food webs. Nature 442 (7100), 265–269.
Rupp A., Bornatowski H. (2021). Food web model to assess the fishing impacts and ecological role of elasmobranchs in a coastal ecosystem of Southern Brazil. Environ. Biol. Fishes 104, 905–921. doi: 10.1007/s10641-021-01120-9
Scanes E., Scanes P. R., Ross P. M. (2020). Climate change rapidly warms and acidifies Australian estuaries. Nat. Commun. 11 (1), 1803. doi: 10.1038/s41467-020-15550-z
Shaw A. K. (2016). Drivers of animal migration and implications in changing environments. Evolutionary Ecol. 30, 991–1007. doi: 10.1007/s10682-016-9860-5
Shaw A. K. (2020). Causes and consequences of individual variation in animal movement. Movement Ecol. 8 (1), 12. doi: 10.1186/s40462-020-0197-x
Sheaves M., Baker R., Nagelkerken I., Connolly R. M. (2015). True value of estuarine and coastal nurseries for fish: incorporating complexity and dynamics. Estuaries Coasts 38, 401–414. doi: 10.1007/s12237-014-9846-x
Simpfendorfer C. A., Tobin A. J., Heupel M. R., Yates P., Munroe S. (2014). Drivers of juvenile shark biodiversity and abundance in inshore ecosystems of the Great Barrier Reef 11. Report to the National Environmental Research Program. Reef and Rainforest Research Centre Limited, Cairns.
Slatyer R. A., Hirst M., Sexton J. P. (2013). Niche breadth predicts geographical range size: a general ecological pattern. Ecol. Lett. 16 (8), 1104–1114. doi: 10.1111/ele.12140
Speed C. W., Field I. C., Meekan M. G., Bradshaw C. J. (2010). Complexities of coastal shark movements and their implications for management. Mar Ecol Prog Ser, 408, 275–293.
Stevens J. D., Lyle J. M. (1989). Biology of 3 hammerhead sharks (Eusphyra-blochii, sphyrna-mokarran and S-lewini) from northern Australia. Aust. J. Mar. Freshw. Res. 40 (2), 129–146. doi: 10.1071/MF9890129
Strong W. R., Snelson F. F., Gruber S. H. (1990). Hammerhead shark predation on stingrays: an observation of prey handling by Sphyrna mokarran. Copeia 1990 (3), 836–840. doi: 10.2307/1446449
Suraci J. P., Smith J. A., Chamaillé-Jammes S., Gaynor K. M., Jones M., Luttbeg B., et al. (2022). Beyond spatial overlap: harnessing new technologies to resolve the complexities of predator–prey interactions. Oikos 2022 (8), e09004. doi: 10.1111/oik.09004
Teitelbaum C. S., Mueller T. (2019). Beyond migration: causes and consequences of nomadic animal movements. Trends Ecol. Evol. 34 (6), 569–581. doi: 10.1016/j.tree.2019.02.005
Thomas S. M., Crowther T. W. (2015). Predicting rates of isotopic turnover across the animal kingdom: a synthesis of existing data. J. Anim. Ecol. 84 (3), 861–870. doi: 10.1111/1365-2656.12326
Tillett B. J., Meekan M. G., Field I. C. (2014). Dietary overlap and partitioning among three sympatric carcharhinid sharks. Endangered Species Res. 25 (3), 283–293. doi: 10.3354/esr00615
Tillett B., Meekan M., Field I., Thorburn D., Ovenden J. (2012). Evidence for reproductive philopatry in the bull shark Carcharhinus leucas. J. Fish Biol. 80 (6), 2140–2158. doi: 10.1111/j.1095-8649.2012.03228.x
Tumenta P. N., van’t Zelfde M., Croes B. M., Buij R., Funston P. J., Udo de Haes H. A., et al. (2013). Changes in lion (Panthera leo) home range size in Waza National Park, Cameroon. Mamm. Biol. 78, 461–469. doi: 10.1016/j.mambio.2013.08.006
Vander Zanden M. J., Clayton M. K., Moody E. K., Solomon C. T., Weidel B. C. (2015). Stable isotope turnover and half-life in animal tissues: a literature synthesis. PloS One 10 (1), e0116182. doi: 10.1371/journal.pone.0116182
Vaudo J. J., Heithaus M. R. (2013). Microhabitat selection by marine mesoconsumers in a thermally heterogeneous habitat: behavioral thermoregulation or avoiding predation risk? PloS One 8 (4), e61907. doi: 10.1371/journal.pone.0061907
Walker R. S., Novaro A. J., Perovic P., Palacios R., Donadio E., Lucherini M., et al. (2007). Diets of three species of Andean carnivores in high-altitude deserts of Argentina. J. Mammalogy 88 (2), 519–525. doi: 10.1644/06-MAMM-A-172R.1
Walton L. R., Cluff H. D., Paquet P. C., Ramsay M. A. (2001). Movement patterns of barren-ground wolves in the central Canadian Arctic. J. Mammalogy 82 (3), 867–876. doi: 10.1644/1545-1542(2001)082<0867:MPOBGW>2.0.CO;2
Watts H. E., Cornelius J. M., Fudickar A. M., Pérez J., Ramenofsky M. (2018). Understanding variation in migratory movements: a mechanistic approach. Gen. Comp. Endocrinol. 256, 112–122. doi: 10.1016/j.ygcen.2017.07.027
Webster M. S., Marra P. P., Haig S. M., Bensch S., Holmes R. T. (2002). Links between worlds: unraveling migratory connectivity. Trends Ecol. Evol. 17 (2), 76–83. doi: 10.1016/S0169-5347(01)02380-1
Wild C., Jantzen C., Struck U., Hoegh-Guldberg O., Huettel M. (2008). Biogeochemical responses following coral mass spawning on the Great Barrier Reef: pelagic–benthic coupling. Coral Reefs 27, 123–132.
Williams T. M., Estes J. A., Doak D. F., Springer A. M. (2004). Killer appetites: assessing the role of predators in ecological communities. Ecology 85 (12), 3373–3384. doi: 10.1890/03-0696
Wirsing A. J., Ripple W. J. (2011). A comparison of shark and wolf research reveals similar behavioral responses by prey. Front. Ecol. Environ. 9 (6), 335–341. doi: 10.1890/090226
Wosnick N., Niella Y. V., Navas C. A., Monteiro-Filho E. L., Freire C. A., Hammerschlag N. (2019). Multispecies thermal dynamics of air-exposed ectothermic sharks and its implications for fisheries conservation. Journal of. Exp. Mar. Biol. Ecol. 513, 1–9. doi: 10.1016/j.jembe.2019.01.002
Keywords: marine predators, movement ecology, feeding specialisation, predator-prey, context, habitat use, telemetry, inshore habitats
Citation: Lubitz N, Abrantes K, Crook K, Currey-Randall LM, Chin A, Sheaves M, Fitzpatrick R, Barbosa Martins A, Bierwagen S, Miller IB and Barnett A (2023) Trophic ecology shapes spatial ecology of two sympatric predators, the great hammerhead shark (Sphyrna mokarran) and bull shark (Carcharhinus leucas). Front. Mar. Sci. 10:1274275. doi: 10.3389/fmars.2023.1274275
Received: 08 August 2023; Accepted: 14 November 2023;
Published: 29 November 2023.
Edited by:
Sveinn Are Hanssen, Norwegian Institute for Nature Research (NINA), NorwayReviewed by:
Natasha Jeanne Gownaris, University of Washington, United StatesJianqing Lin, Shantou University, China
Copyright © 2023 Lubitz, Abrantes, Crook, Currey-Randall, Chin, Sheaves, Fitzpatrick, Barbosa Martins, Bierwagen, Miller and Barnett. This is an open-access article distributed under the terms of the Creative Commons Attribution License (CC BY). The use, distribution or reproduction in other forums is permitted, provided the original author(s) and the copyright owner(s) are credited and that the original publication in this journal is cited, in accordance with accepted academic practice. No use, distribution or reproduction is permitted which does not comply with these terms.
*Correspondence: Nicolas Lubitz, bmljb2xhcy5sdWJpdHpAbXkuamN1LmVkdS5hdQ==