 Hayden Close
 Gwladys Lambert1
94% of researchers rate our articles as excellent or good
Learn more about the work of our research integrity team to safeguard the quality of each article we publish.
Find out more
ORIGINAL RESEARCH article
Front. Mar. Sci., 03 January 2024
Sec. Marine Fisheries, Aquaculture and Living Resources
Volume 10 - 2023 | https://doi.org/10.3389/fmars.2023.1274136
This article is part of the Research TopicBlue Foods Security and SustainabilityView all 15 articles
Marine species with a pelagic larval phase have the potential to disperse hundreds of kilometres via ocean currents, thus connecting geographically distinct populations. Connectivity between populations therefore plays a central role in population dynamics, genetic diversity and resilience to exploitation or decline and can be an important vector in the management of fisheries. The scallop, Pecten maximus, is a valuable benthic bivalve with a variety of management measures at both regional and national scales. A bio-physical numerical model was developed to simulate and characterise the larval transport and population connectivity of scallops across commercial fishing grounds within the Irish and Celtic Seas. The model incorporated realistic oceanographic currents and known behavioural traits of P. maximus larvae including spawning times, pelagic larval duration, and vertical migration during the various developmental stages i.e., passive, active swimming, vertical migrations, since growth rates change with temperature, which varies spatially and temporally, it was used in the model to determine when an individual larva changed its behaviour. Simulations showed a high degree of connectivity between most populations, with multiple connections allowing for substantial exchanges of larvae. The exception was a population off North Cornwall that was entirely reliant on self-recruitment. A sensitivity analysis of the biological parameters suggested that ocean current patterns primarily controlled the connectivity network, but the strength of the connections was sensitive to spawning date and the specific features of diel vertical migrations. The model identified weakly connected populations that could be vulnerable to overfishing, and populations that are ‘strong connectors’ and a vital source of larvae to maintain the metapopulation. Our approach highlights the benefits of characterising population connectivity as part of an effective management strategy for sustainable fisheries.
Many marine benthic species have a pelagic larval stage whereby ocean currents can transport the larvae within the water column up to hundreds of kilometres over a few weeks (Shanks et al., 2003). For such species, they may exists as a metapopulation with spatially separated populations but with plentiful exchange of larvae between the geographically distant populations (Caley et al., 1996). This is important for gene flow and replenishment of natural populations and those which are commercial fishing grounds that become depleted e.g., through overfishing or disease (Malakoff, 1997). Some studies have suggested that over 60% of juvenile fish with a pelagic larval stage are returning to or being retained at their natal location (Swearer et al., 1999; Jones et al., 2009) – thereby posing the question as to the importance of connectivity networks within metapopulation dynamics.
Hydrodynamic models can simulate oceanographic circulation and variability that facilitate the transport of individual larvae and the dispersal of the spawned larval cohort. This provides the means to investigate the relative roles of different physical and bio-physical interactions; for example, inter-annual variability in heat- and wind-driven currents and seasonal spawning times (Robins et al., 2013). However, many models do not take account of the numerous behavioural characteristics with 56% of biophysical models published by 2019 assuming larvae are passive throughout development (Swearer et al., 2019). Nevertheless, many species of larvae go through various development stages such as being passive, actively swimming, performing diel vertical migrations, or delaying their settlement.
Spatial variability in scallop population sizes, commercial catch rates, biological characteristics, and oceanographic conditions pose difficulties for management. For example, assessing recruitment has been overlooked as a management tool but is now being considered (Nicolle et al., 2017; Handal et al., 2020; Hold et al., 2021). As a result, there may be little relationship between the spawning population and self-recruitment, which makes it difficult to use survey data, or commercial catch and effort data, to forecast the effects of management measures such as catch limitations, minimum landing sizes and effort restrictions. Predictions of connectivity and self-recruitment can help explain the species’ genetic structure, population dynamics, and aid in the management of the ecosystem or resource (Crooks and Sanjayan, 2006; Botsford et al., 2009; Nicolle et al., 2013). Species that experience population decline from disease or exploitation can eventually recover via self-recruitment and/or larval flow from connecting populations, provided the connectivity network is sufficient (Grimm et al., 2003; Gimenez, 2019). Therefore, there is a strong incentive to characterise connectivity networks for a range of ecologically sensitive and commercially important marine species (Miller, 2007).
The King scallop Pecten maximus is a large benthic marine bivalve found in shallow depressions in the seabed down to a depth of approximately 100 m, preferring firm sand and fine gravel substrate but occasionally found on muddy sands. P. maximus can typically live up to 20 years and is a hermaphrodite, releasing both spermatozoa and oocytes (Beaumont and Budd, 1983); fertilization occurs in open water leading to a planktonic larva. The pelagic larval duration (PLD) of scallop larvae depends on larval growth, which is contingent on ambient water temperature and from laboratory experiments has been shown to range between 78 days at 9°C and to 24 days at 18°C (Beaumont and Barnes, 1992). Scallop larvae develop through seven stages, from gametes to pediveliger, until they settle as post larva. Juvenile scallops continue to grow and only begin to spawn when they deposit their second annual growth ring in their shell. Spawning generally takes place in spring (April – May) and again in early autumn (end of August and September), with reports of additional spawning throughout the summer (Kaartveldt et al., 1987; Raby et al., 1994; Gallager et al., 1996; Garland et al., 2002). Scallops have been consistently one of the most highly valuable commercial species with total landings in 2020 of 57,434 tonnes of which 48,122 were from ICES area VII (Irish Sea) (ICES, 2021). The majority of the fisheries are managed under national and local legislation with no quotas or catch limits. Currently, methods used to manage the fisheries vary depending on the locality with differing minimum landing sizes, seasonal closures and regulation of fishing effort such as dredge numbers (ICES, 2021). These measures are aimed at making the fishery sustainable but are currently not based on bio-physical interactions, ecology or the wider ecosystem function. In the past, poor management of scallop fisheries has caused numerous scallop populations to undergo boom and bust cycles caused by unsustainable exploitation and variable recruitment (Shumway, 1991; Beukers-Stewart et al., 2003; Bloor et al., 2021). This has resulted in populations relying heavily on recruitment every year, which is a high risk strategy both biologically and economically (Beukers-Stewart and Beukers-Stewart, 2009).
Previous work examining connectivity networks through modelling approaches in P. maximus populations have focused on using a fixed PLD (Nicolle et al., 2013; Le Goff et al., 2017; Nicolle et al., 2017; Hold et al., 2021). In this study, we developed a 3-dimensional ocean model coupled to a Lagrangian particle tracking model (PTM) that used the modelled water temperatures to determine the growth rate, thus the time taken to reach each larval stage; hence providing detailed representation of the biological phenomenon in the simulation of the behavioural characteristics. We quantified the larval transport and population connectivity of scallop larvae from delineated scallop beds under a range of oceanographic conditions within the Celtic and Irish Seas region. In addition, a sensitivity analysis was conducted to validate the outcomes of the model with regards to key biological parameters such as the spawning times, larval migration strategies and settlement criteria, to identify potential yearly recruitment variability from the environmental variables.
We used outputs of simulated velocities for the Irish and Celtic Seas obtained from a pre-existing and validated three-dimensional ocean model, developed by Robins et al. (2013). These velocity fields were used to drive the advection and diffusion (sub-grid-scale mixing) of virtual larvae, iteratively through space and time, within a Lagrangian particle tracking model (PTM). The spatial domain of both models is shown in Figure 1.
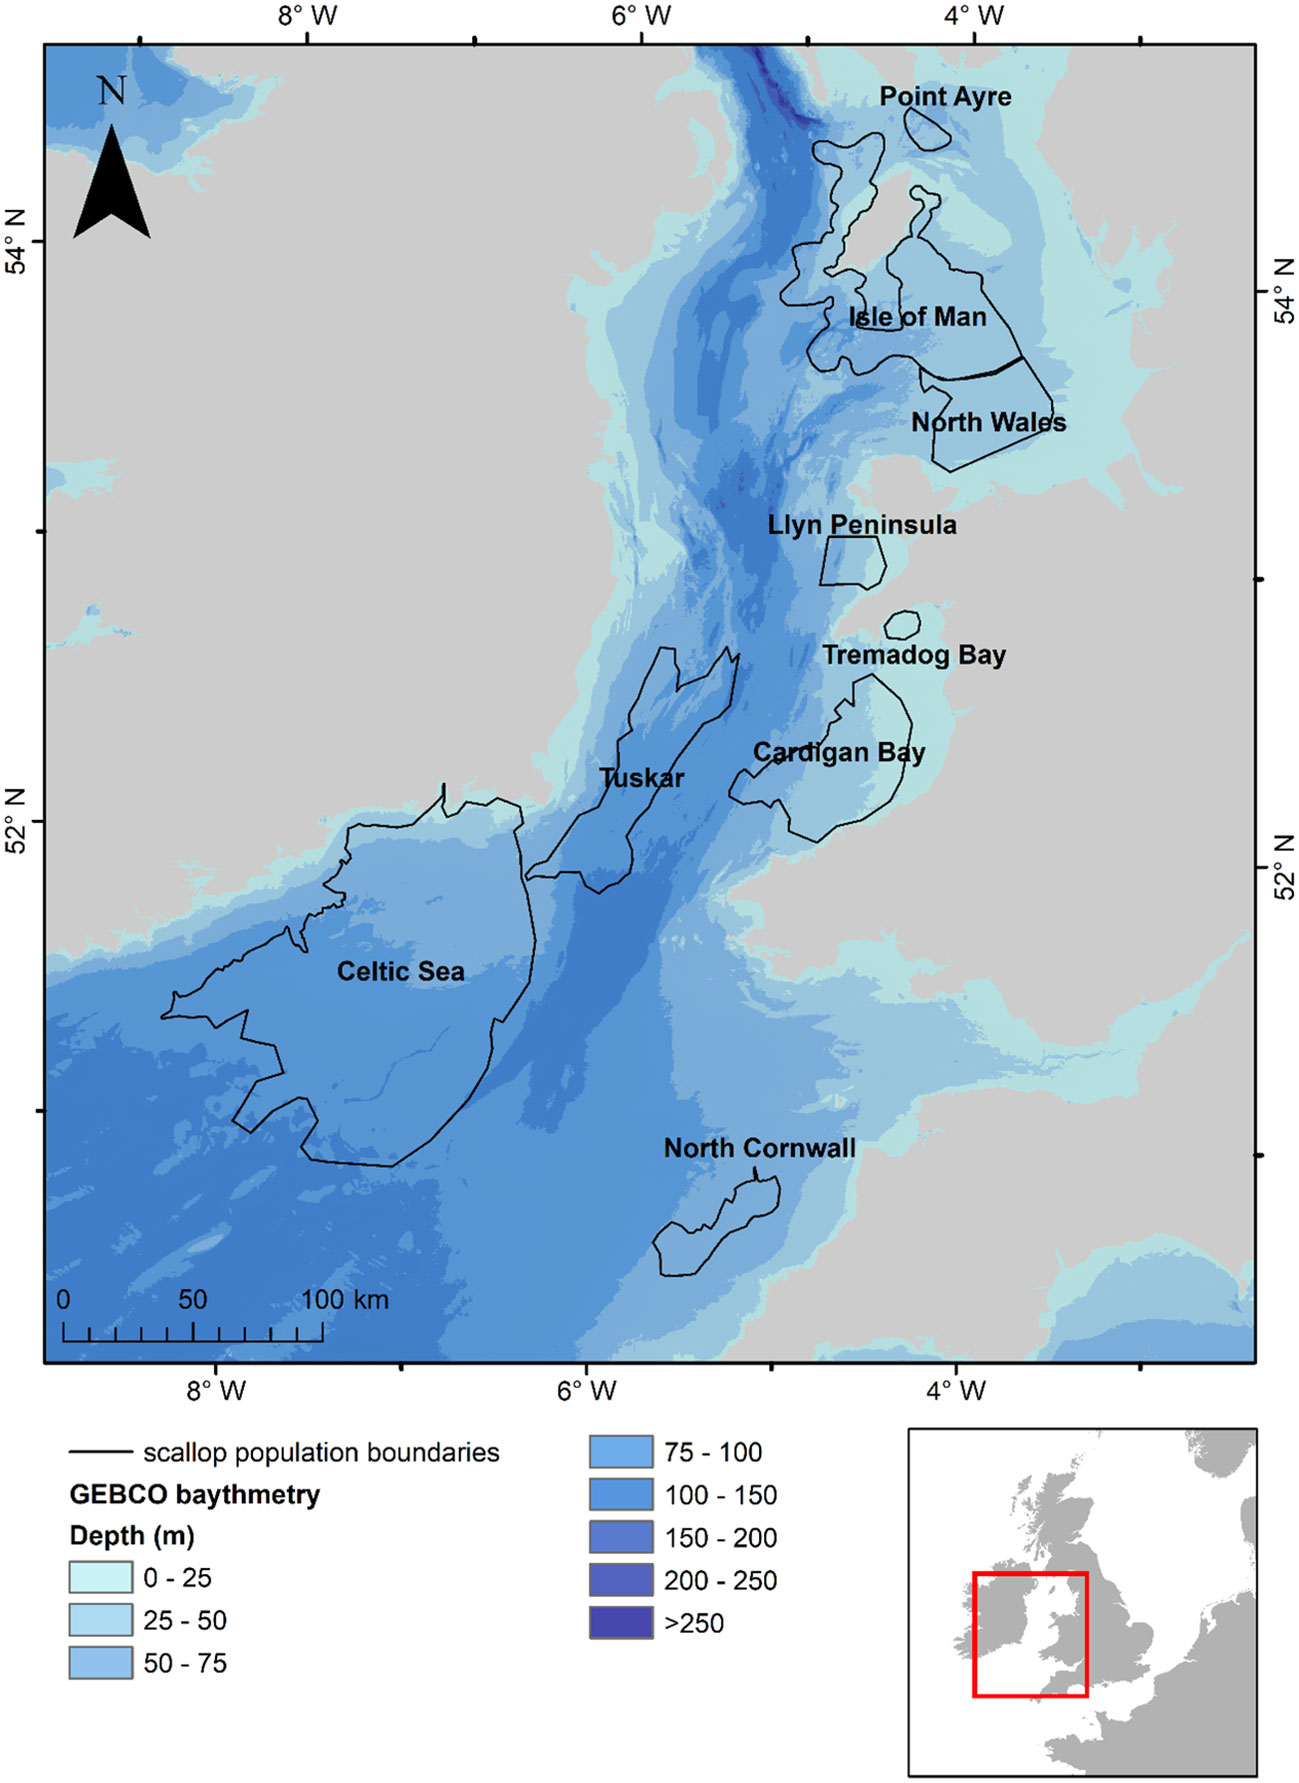
Figure 1 Map of the study area showing the identified scallop populations (ICES, 2021) that are modelled within the study along with sea surface temperatures for the 1st of September for 1990 predicted by the oceanographic model.
The 3D Princeton Ocean Model is described in detail by Blumberg and Mellor (1987) and the Celtic/Irish Sea setup used for this study is detailed by Robins et al. (2013). In summary, the model is based upon a parallelised and sigma-coordinate (terrain-following vertical layers) representation of the primitive equations that describe the conservation of momentum, thermal energy and continuity. Variables within the model (e.g. velocity, elevation, turbulence and temperature) are solved using finite-difference discretisation on an orthogonal Arakawa-C grid in the horizontal plane, which provides an accurate representation of the velocity around complex coastlines such as within the Irish Sea, due to the staggered computation of elevation and velocity nodes.
The model domain is 280 km by 708 km, with a horizontal cell size of 1/30° (longitude) by 1/60° (latitude) resulting in a resolution of approximately 2 × 2 km. In the vertical plane, there are 20 equally segmented sigma layers, with an average and maximum distance between the surface layer and the next layer of 4.3 and 9.6 m respectively, these distances change spatially following the underwater terrain (Robins et al., 2013). Accurate simulations of the long-term circulation are a major challenge to ocean modellers and confidence in the predictions of the model can only be achieved through extensive validation of a range of variables (Robins et al., 2013). The year 1990 was chosen for validation based upon it being a mean representation of the long term (1989-1998) climate (Neill et al., 2010) and availability of temperature records to evaluate the models ability to simulate stratification that can be important for larval transport.
The simulation consisted of a six-month, three-dimensional, barotropic (tide-driven and wind-driven circulation) and baroclinic (density-driven circulation caused by surface solar heating) simulation for the period 1st April – 30th September 1990. The model was forced at the open ocean boundaries of the domain with six tidal constituents including the dominant lunar and solar cycles (Robins et al., 2013). These two constituents were validated by comparing the simulated amplitudes and phases of the lunar and solar elevations with records from 18 coastal stations with records of known values (Robins et al., 2013). Both baroclinic and barotropic components of circulation have the potential to play an important role in larval transport and as a result, the main oceanographic factors that transport larvae are the residual currents and tidal velocities. Oceanographic conditions such as, stratification, gyres, tidal range and depth-averaged residual currents for the period 1st April – 30th September 1990 are presented in Robins et al. (2013). Wind effects also contribute to the residuals, although due to the stochasticity of the wind over several weeks these are small compared to baroclinic components and are confined to the surface layer.
The ocean model simulated temperature change within the domain. The temperature data was outputted every two days; therefore, the temperature was interpolated between the two nearest recordings to the particle tracking model time step. The oceanographic model was run, and the outputs saved every 30 minutes to be used ‘offline’; this meant that the model only had to be run once and allowed the computing time of the subsequent PTM to be drastically reduced.
A Langragian 3D PTM was developed in MATLAB to simulate the individual movement of particles spatially and temporally. These are based on advection (movement by simulated 3D currents from the ocean model), sub-grid-scale turbulent mixing, and the individual particle vertical migration parameterised on scallop behaviour. Turbulent mixing was simulated in the hydrodynamic model grid scale (i.e., >2 km). However, sub-2 km scale turbulence exists in reality and, so, was parameterised within the PTM (Robins et al., 2013). This was based upon random displacement models (random walks). For the random displacement, the longitudinal change in position (Δχ, Equation 1a), the latitudinal change in position (Δy, Equation 1b) and the depth change (Δz, Equation 1c) over each time step (every save) of the hydrodynamic model of 1800 seconds (Δt, 30 minutes) can be expressed as:
Where R is a random number in the range of 0 – 1 and r is the standard deviation of R cos(2πR). The horizontal diffusivities Kx and Ky (m2 s-1) were set to (u/100)2 and (v/100)2, respectively.
Simulated larvae were released from locations that are known to have substantial populations of scallops identified from fishing data and stock assessment surveys (ICES, 2021); these were the waters surrounding the Isle of Man, a small population to the northeast of the Isle of Man (hereafter, referred to as Point of Ayre), North Wales, Llyn Peninsula, Tremadog Bay, Cardigan Bay, Tuskar, Celtic Sea and North Cornwall (Figure 1).
Within the model the initial egg size for each larva was randomly assigned within the range 64.2 to 72.2 µm with a mean of 68.8 µm, source: Iroise Sea, France, (Cochard and Devauchelle, 1993; Paulet et al., 1995) to allow for variability among individuals.
The PLD, identified from controlled laboratory experiments for P. maximus larvae from fertilisation to metamorphosis, can last 24 – 78 days depending on sea temperatures (Comely, 1972; Gruffydd and Beaumont, 1972; Beaumont and Barnes, 1992; Robert and Gérard, 1999). PLD is determined by temperature-dependent growth rates, with faster growth in warmer waters. However, within the domain where land meets the sea, and particularly in small embayment’s, the temperature was overpredicted by the model, reaching in excess of 25°C. As a result, where the temperature exceeded 17°C, the maximum attainable temperature in the domain was limited to 17°C within the PTM as identified by the National Oceanography Centre (2022). The average sea surface temperature and bottom temperature is 8°C on the 1st April 1990 and is 15°C and 13.75°C on the 30th September respectively (Robins et al., 2013). To simulate growth rates throughout the PLD, a novel approach was coded using growth rates (Table 1), taken from Beaumont and Barnes (1992), at a given temperature and combining it with known sizes of each development stages at 16°C to estimate the size of the larvae at each stage within the larval development (Table 2). This was important as the different larval stages (with different sizes) have a different behaviour in the water. Natural variability is expected in growth rates of individuals or from local food availability (Cochard and Gerard, 1987). Therefore, a random element was introduced to the growth rates (Equation 2a) as they were determined from laboratory studies and fed a stable diet. The larval length was calculated by adding the growth rate per iteration to the starting egg size (Equation 2b); this was calculated using the following equations:
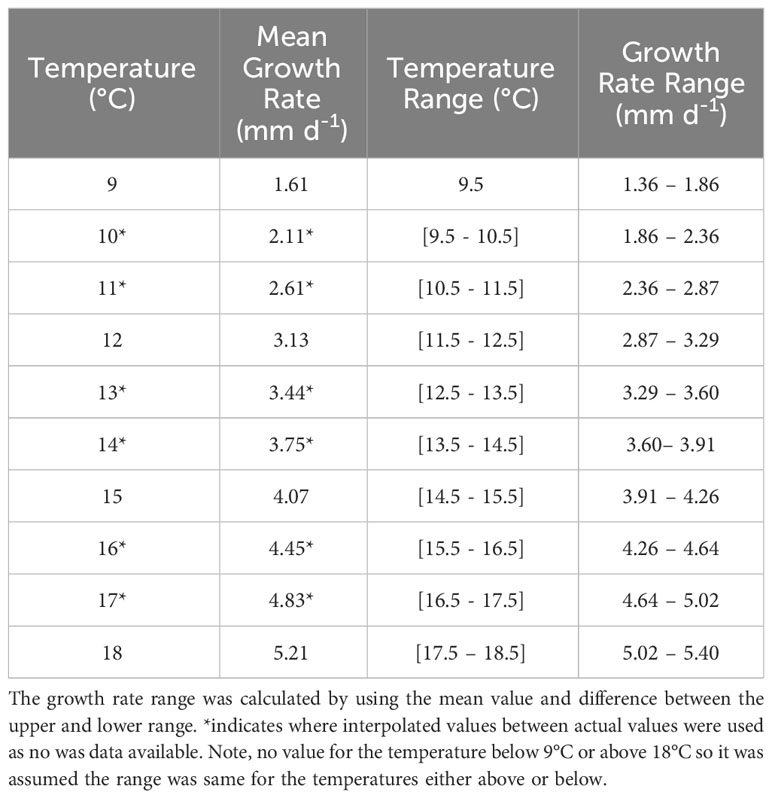
Table 1 Mean growth rates between 9 – 18°C taken from Beaumont and Barnes (1992) who assumed growth was linear.
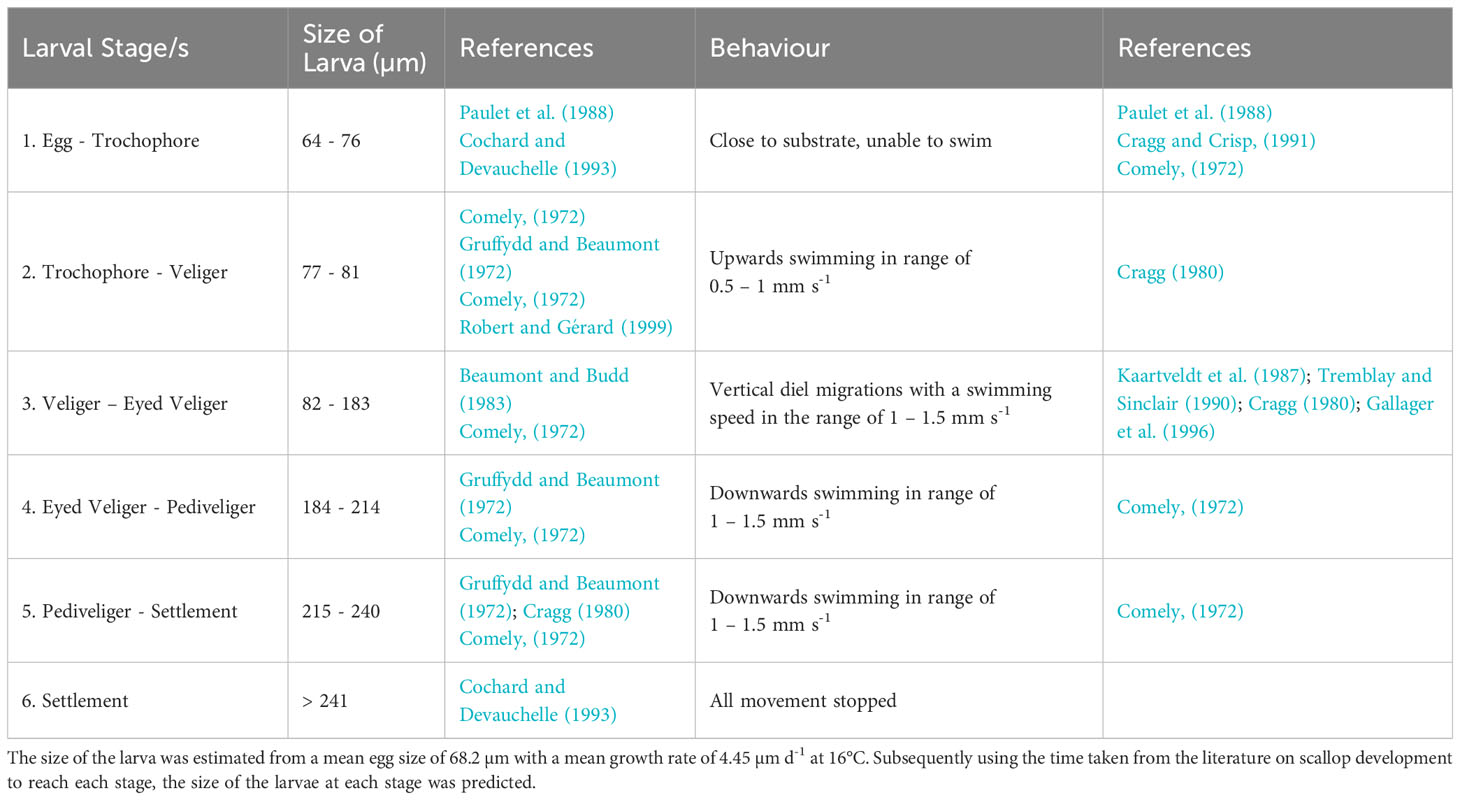
Table 2 The size of larvae stages within their development.
Where L is the lowest growth rate for a given temperature (Table 1), R is a random number in the range of 0 – 1 and Ra is the difference of the growth rate (Table 1) of the two temperature points either side of the given temperature and ts is the number of seconds in a 24 hour period (86400). The growth was assumed to be linear (Beaumont and Barnes, 1992).
In the model the larvae were grouped into five behavioural classes (Table 2) used to capture the development of behaviours in scallop larvae through their ontogeny. Vertical swimming behaviour was introduced into the model when the larvae became trochophores (77 µm) at a rate between 0.5 – 1.0 mm s-1 towards the surface (Cragg, 1980). Once the trochophores developed into veligers (82 µm), the swimming speed was assigned within the range of 1.0 – 1.5 mm s-1. Diel vertical migrations (DVMs) were introduced at the same time, sinking during the day and rising to the surface during the night. The depth below the surface of the DVMs that the scallop migrate to was limited to 10 m, as identified by Kaartveldt et al. (1987); Tremblay and Sinclair (1990) and Raby et al. (1994). Once the larvae became eyed veligers (184 µm) they begin to sink and stay just above the substrate. Many authors have described that sinking rates are quicker than swimming rates, but the former have not been quantified (Cragg, 1980; Gallager et al., 1996; Garland et al., 2002). Therefore, it was assumed that sinking rates were the same as the swimming rates for the PTM. All swimming rates were randomly assigned a value within the ranges described (Table 2).
Estimates of the length at which larvae settle is described as between 225 – 258 μm (Gruffydd and Beaumont, 1972; Cochard and Devauchelle, 1993; Andersen et al., 2011). For the PTM the mean value of 241 μm was used as a settlement length threshold. Within the model the particles only settled when they entered the population area polygons delineated in Figure 1. It has been found that the scallop larvae can delay their settlement typically by two weeks (Robert and Gérard, 1999; Robert and Nicholas, 2000); therefore, particles >241 μm were allowed 14 days to disperse to one of the defined populations. If they encountered a population boundary within this time, then they settled and if they had not entered a boundary after the 14 extra days then the larvae were deemed unsuccessful.
The particles have the potential to leave the model domain at open sea boundaries in the southwest in the Celtic Sea and in the northwest where the Irish Sea meets the North Atlantic (Figure 1). As a result, larvae which encountered the domain boundaries were excluded from the analysis, this was limited to those released from the Celtic Sea and totalled 6.88% of particles released from this site. Larvae that reached a vertical boundary (sea surface or bed), were reflected back into the water column at their position on the previous iteration step. Similarly, larvae that encountered the coastline were reflected back to their previous position within the water column. This allowed for the maximum larval transport potential of each larval cohort to be investigated, following similar methods employed by North et al. (2006) and Robins et al. (2013).
A minimum of 10,000 particles were released from each site, as Robins et al. (2013) identified that this was sufficient to satisfactorily simulate larval transport in this region (i.e. the transport pattern remains similar for larger numbers of particles). The larvae were randomly assigned to starting positions within the coordinates of each delineated population (Figure 1). Simulations were run for each site with all particles released on 1st April 1990 at once at 12:00, based on a spring spawning of P. maximus (Baird, 1966). At the end of each simulation the percentage of larvae settling within the natal population boundary (retention), settling within a different population boundary (connectivity) and those which did not settle with one of the delineated boundaries (unsuccessful) were calculated. A sensitivity analysis on the date of release and the biological parameters was also undertaken on Cardigan Bay, see Section 2.6.
Overall, the simulation of velocity and temperature fields from the oceanographic model were in good agreement with observational records and other models developed for this region (Xing and Davies, 2001; Horsburgh and Hill, 2003; Hartnett et al., 2007). A tidal analysis conducted by Robins et al. (2013) showed that the simulated circulation compared well with 18 coastal tide gauge stations, giving root-mean square errors of approximately 14 cm (M2) and 6 cm (S2) in elevation and 10° and 12° in phase. Comparisons of the simulated seasonal mean SST with satellite data (National Oceanography Centre 2022), showed that vertically mixed regions were 1-2°C cooler in the model than the satellite data. Despite this the Irish Sea front to the east of the Isle of Man and the Celtic Sea front across the St George’s Channel were well simulated. It is important that these are accurately simulated within the model as they can act as barriers to larvae (Vera et al., 2022). In addition, the simulated temperatures compared well with observed monthly mean surface and bottom temperatures at Port Erin, Isle of Man (see Robins et al., 2013).
The depth profile of an individual particle parameterised on P. maximus larva, released from Cardigan Bay on the 1st of April 1990 (Figure 2), illustrates the simulated vertical swimming behaviour at different stages of the pelagic life, with migrations from the seabed to the surface once the larva developed into a trochophore after a PLD of 7 days (Figure 2, stage 2); exhibited DVM to 10 m when they became eyed-veligers at day 10 (Figure 2, stage 3) and at day 62 the pediveliger sank to the seafloor to just above the seabed (Figure 2, stage 4). The larvae are supposed to be next to the seabed surface, however, small differences of up to 10 m were seen for the larvae, most likely caused by the vertical velocities exceeding the directional swimming ability of the larvae, although the larvae only remained above the seabed for a short time. Despite their position above the seabed, the larvae were assumed to have settled, a common approach in larval modelling (Hartnett et al., 2007; Nicolle et al., 2013).
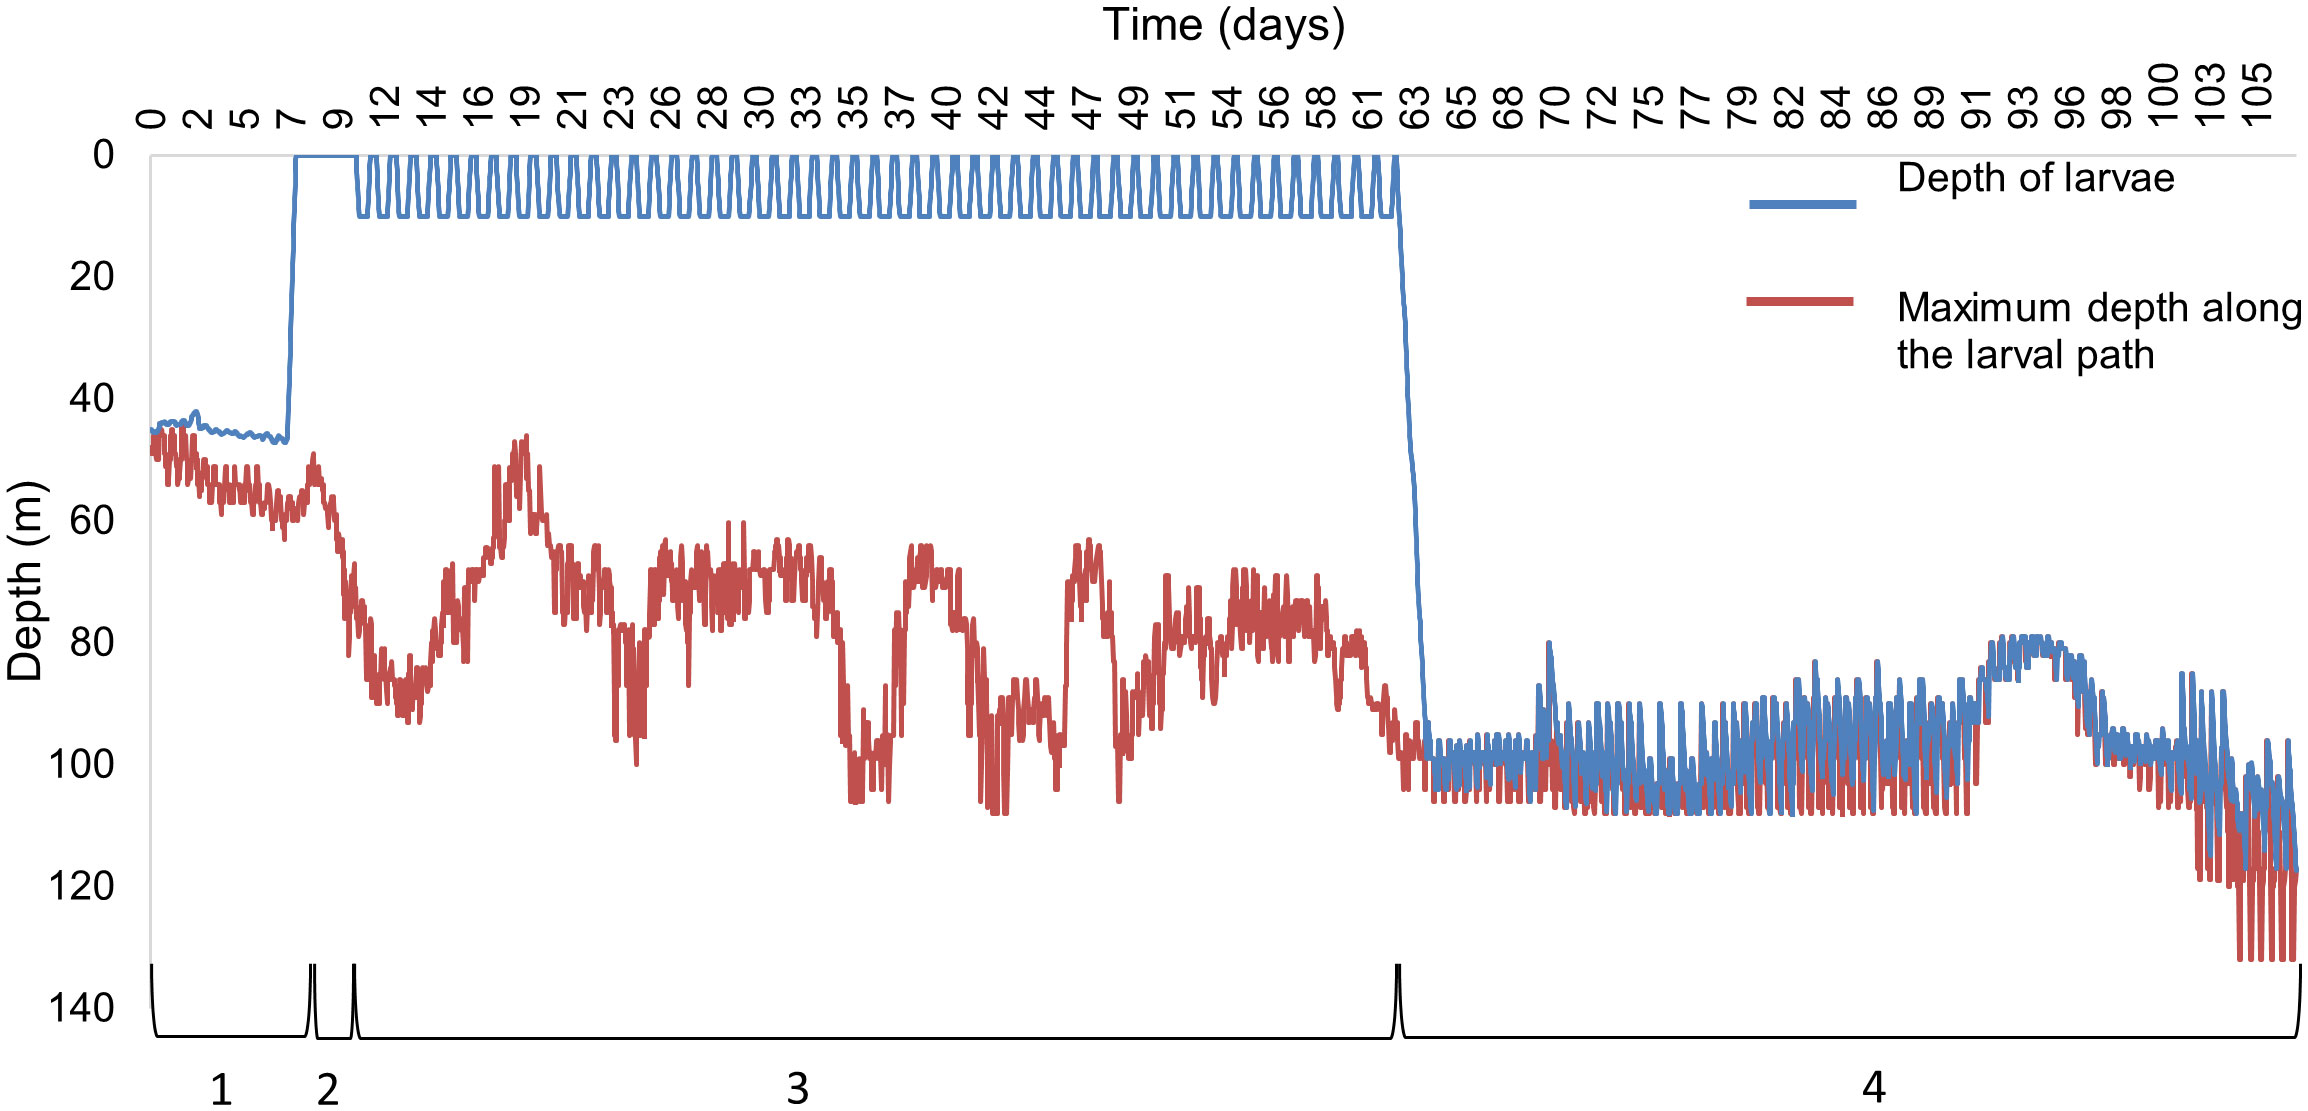
Figure 2 A depth profile of an individual P. maximus larva released from Cardigan Bay on 1st April 1990 showing the different swimming behaviours, (1) No swimming capacity, (2) swimming to the surface waters, (3) diel vertical migrations to 10 m, (4) swimming just above the seabed. The blue line indicates the vertical path of the larva and the red line indicates the maximum depth profile from the larval path.
A sensitivity analysis was conducted by varying the particle tracking model parameters for the Cardigan Bay population. The spawning times of adults are not clearly established on when larvae are released withing a tidal cycle (Mason, 1958; Comely, 1972; Bonardelli et al., 1996; Paugam et al., 2003); therefore, simulations were run with particles released on the 1st and 14th of every month from April to July to investigate the effect of the changing oceanographic parameters on a regular interval. All other simulations within Cardigan Bay were restricted to releases on 1st April. To test the sensitivity of the outputs to the growth rates, the values were restricted to the mean value identified by Beaumont and Barnes (1992), the mean ±1 and ±2 µm to allow for greater variability (Table 3). Scallop larvae have shown DVMs have generally only been observed in shallow depths (<15 m below surface) for scallop larvae from laboratory experiments (Kaartveldt et al., 1987; Raby et al., 1994; Gallager et al., 1996; Garland et al., 2002); therefore, to test the sensitivity of the model to the migration strategy, no migrations and migrations to a maximum of 5, 15, 20 and 25 m depth were modelled. As the settlement size can also vary, simulations on the settlement size were conducted using the minimum (225 µm) and maximum size defined (258 µm) (Gruffydd and Beaumont, 1972; Cochard and Devauchelle, 1993; Andersen et al., 2011). Larvae have been observed to delay their settlement by 2 – 3 weeks (Robert and Gérard, 1999; Robert and Nicholas, 2000) and it has been observed that bivalves can extend this by up to one month (Robert and Nicholas, 2000; Nicolas and Robert, 2001); therefore, this settlement delay was modelled using, 1 day, 1 week, 3 weeks, and 4 weeks.
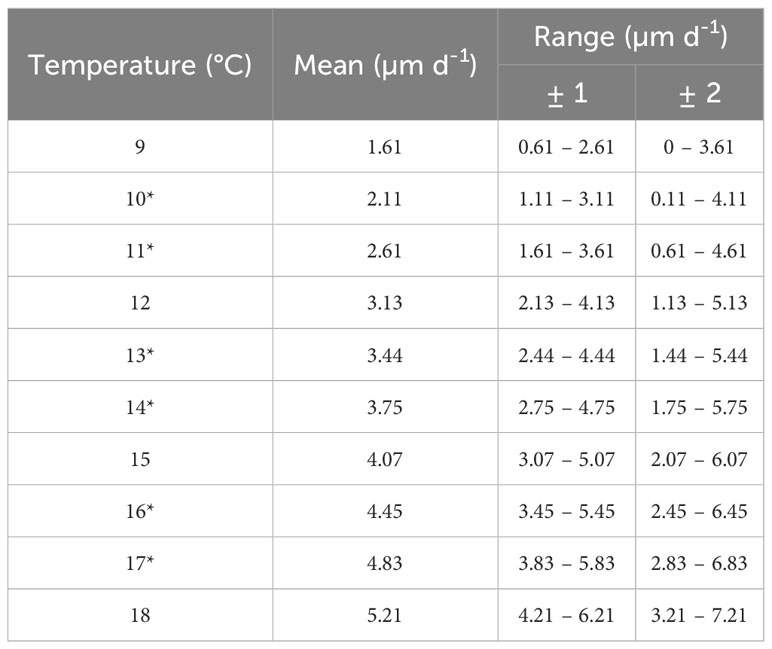
Table 3 Mean growth rates entered into the PTM for the temperatures between 9 and 18°C with growth rate range when ± 1 and ± 2 (µm d-1).
Random numbers were incorporated into the model to randomise the particle starting positions, starting egg size, distances and angles of the horizontal turbulent movement (Equations 1a, 1b), growth rates (Equation 2a), and swimming speeds. A different random number was used for each application based on the same seed. To test sensitivity to the random numbers used, the experiments were repeated three times with different random numbers.
The average effect of each biological factor on PLD and larval transport distance was determined using a General Linear Model (GLM) in R (R Core Team, 2022). This followed recommendations by White et al. (2014) that ecologists should focus on ‘biological significance’ such as effect sizes, since applying significance testing is not appropriate for modelling simulation outputs (Giménez et al., 2020). To determine which factors were the main drivers, the residuals from each simulation were compared for the PLD and population-averaged larval transport distance.
The mean PLD for all sites for the model was 95 days with the North Cornwall and the Llyn peninsula populations having the longest mean PLD at 109 and 107 days, respectively (Figure 3A). The smallest mean PLD was 83 days for North Wales. All sites except the Celtic Sea and Cornwall had larvae with PLDs across the range rather than aggregated around the mean. This is due to the larvae within the same location encountering areas of varying thermal properties that controls the growth rate. The mean larval transport distance of all sites combined (total distance travelled) was 2192 km with the longest mean transport distance of 3590 km for the Llyn Peninsula and the shortest for the Celtic Sea population, which is subject to low tidal velocities, at 1071 km (Figure 3B). In contrast, the pelagic larval distance for most of the populations tended to aggregate around the mean, with only a small number occasionally having a distance that was markedly different. However, larvae from within Cardigan Bay, Isle of Man and Tremadog Bay were subjected to varying tidal velocities such as strong tides around Anglesey, transporting them to the middle of the Irish Sea towards the Isle of Man. Interestingly, no relationship was observed between the PLD and distance travelled (Figure 3).
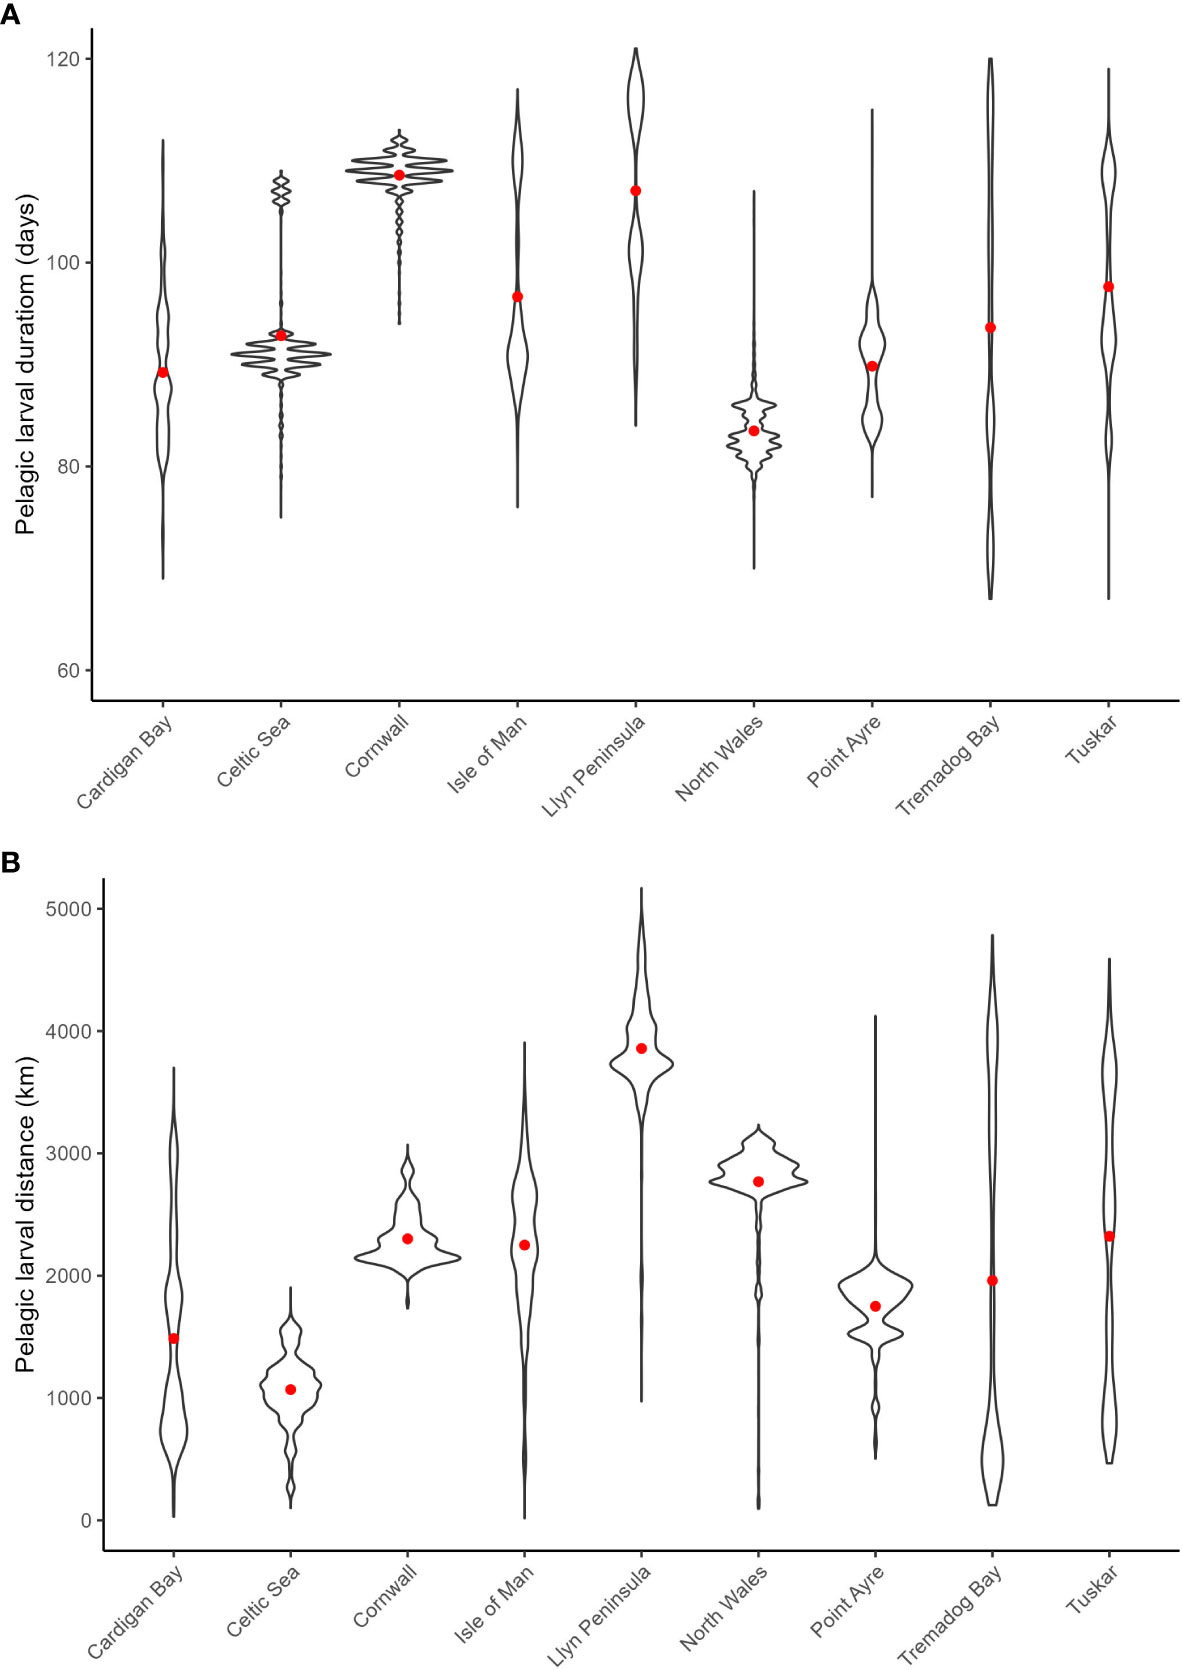
Figure 3 Violin plots for the pelagic larval duration (A) and larval transport distances (km) (B) with red dots denoting the mean values from spawning on the 1st April 1990 from all sites.
The regression analysis of connectivity and retention against the population-averaged larval transport distance, for all simulations conducted (n = 41), suggests that the shorter the distance travelled the greater number of larvae that are retained (Figure 4A, r2 = 0.30). Conversely, no relationship between distance and connectivity was found (Figure 4B, r2< 0.01).
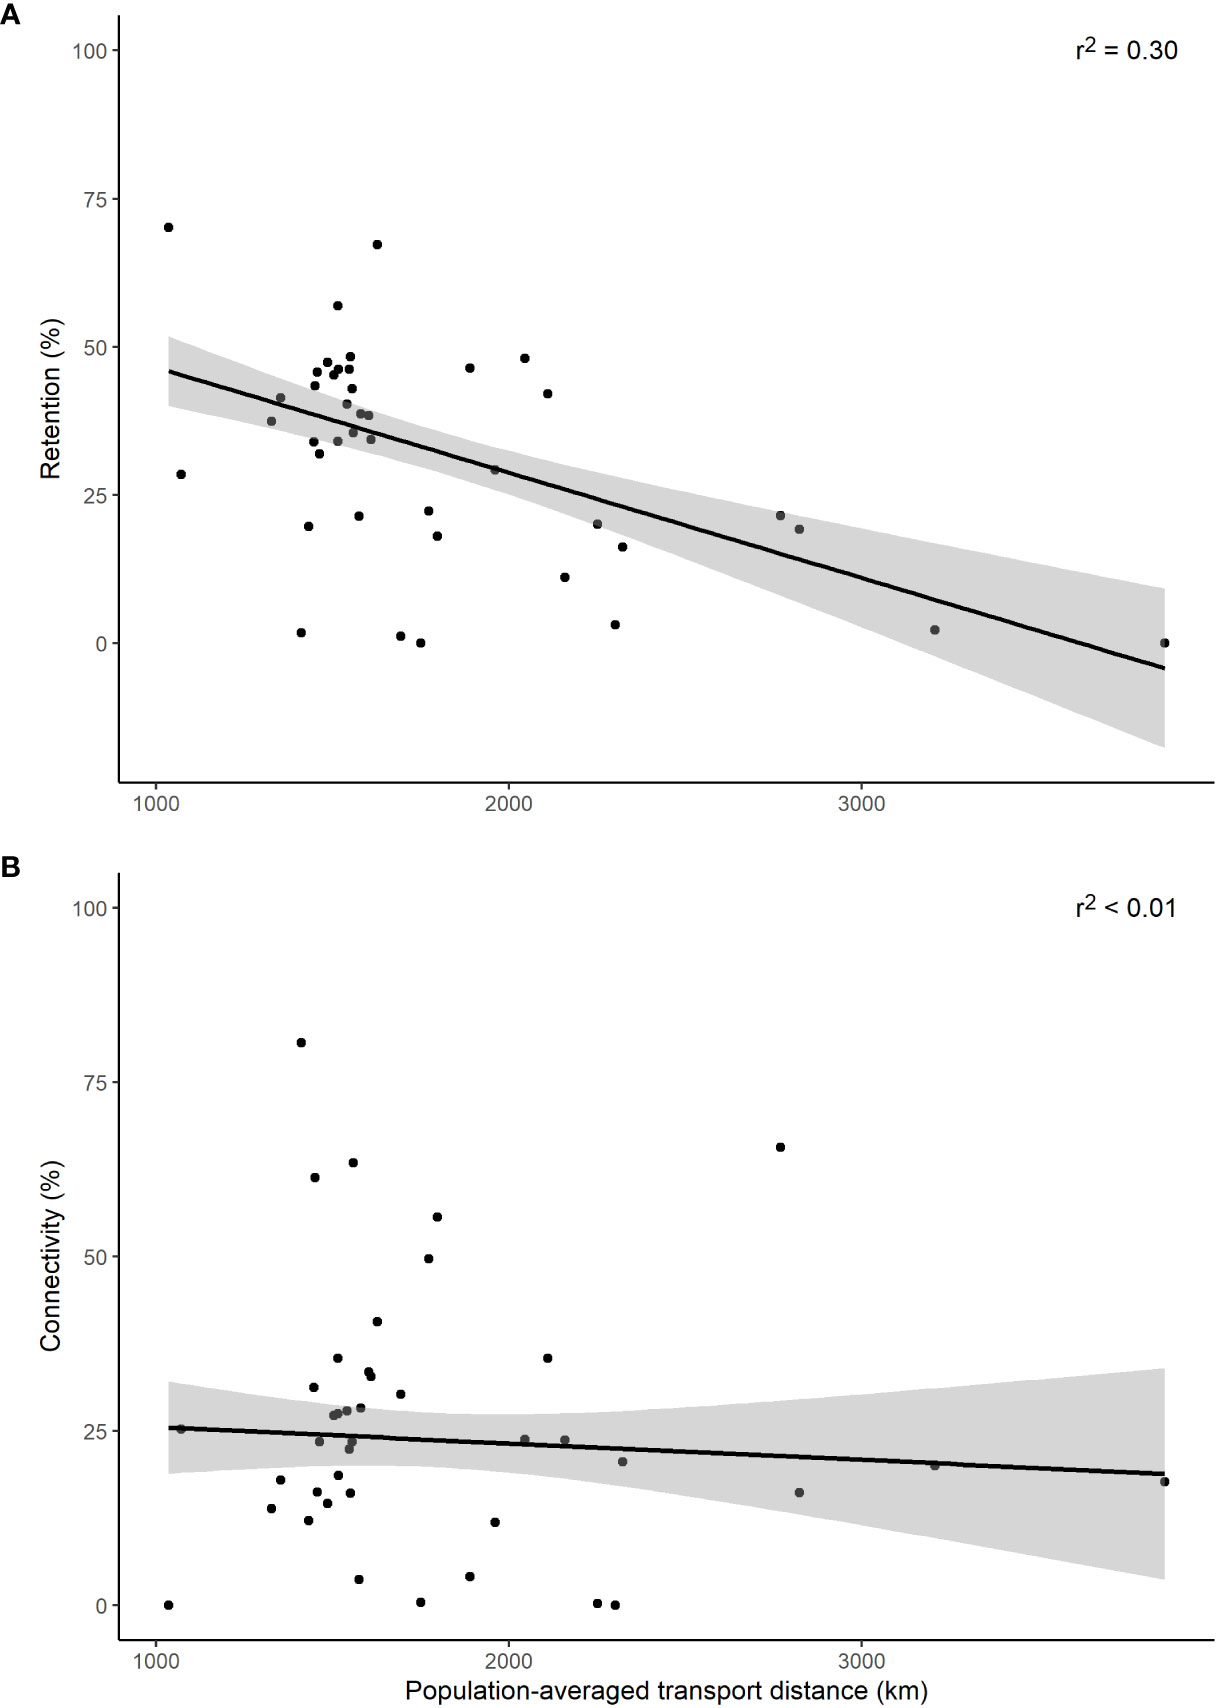
Figure 4 Retention (A) and connectivity (B) for the population-averaged larval transport distances (km). Black lines denote linear regression fit with the shaded area representing the 95% confidence intervals.
The mean larval settlement success (connectivity and retention) from all populations was 41.3%; retention and total connectivity between populations accounted for 20.3% and 21.0%, respectively, with connectivity occurring primarily between neighbouring populations. Hence, on average, 58.7% of larvae did not find a successful settlement site as delineated in this study. North Wales had the greatest larval settlement success of 89.1%, this was due to retention and primarily connecting to the adjacent Isle of Man population (Figure 5). Conversely, a high number of unsuccessful larvae were found from Point Ayre (99.5%) and North Cornwall populations (98.0%) (Figure 5). Greatest retention was found within the Celtic Sea and Isle of Man populations at 69.5% and 67.11%, respectively, whilst the least retention was found at in the Point Ayre and the Llyn Peninsula populations at < 0.1% and 0.9%, respectively (Figure 5). The number of populations that were connected varied; the Tremadog Bay population was the largest source of larvae, exporting to five different sites, whilst the Isle of Man population was the greatest sink for larvae with a total of four different sources (Figure 5). The Celtic Sea and North Cornwall populations did not connect to any other sites, but larvae had the potential to be retained (Figure 6). North Cornwall had a low retention of larvae (2.1%) and no external sources of larvae. Despite this, observations from Figure 6 demonstrate that North Cornwall had the potential for self-recruitment as most larvae were in close proximity to their release locations.
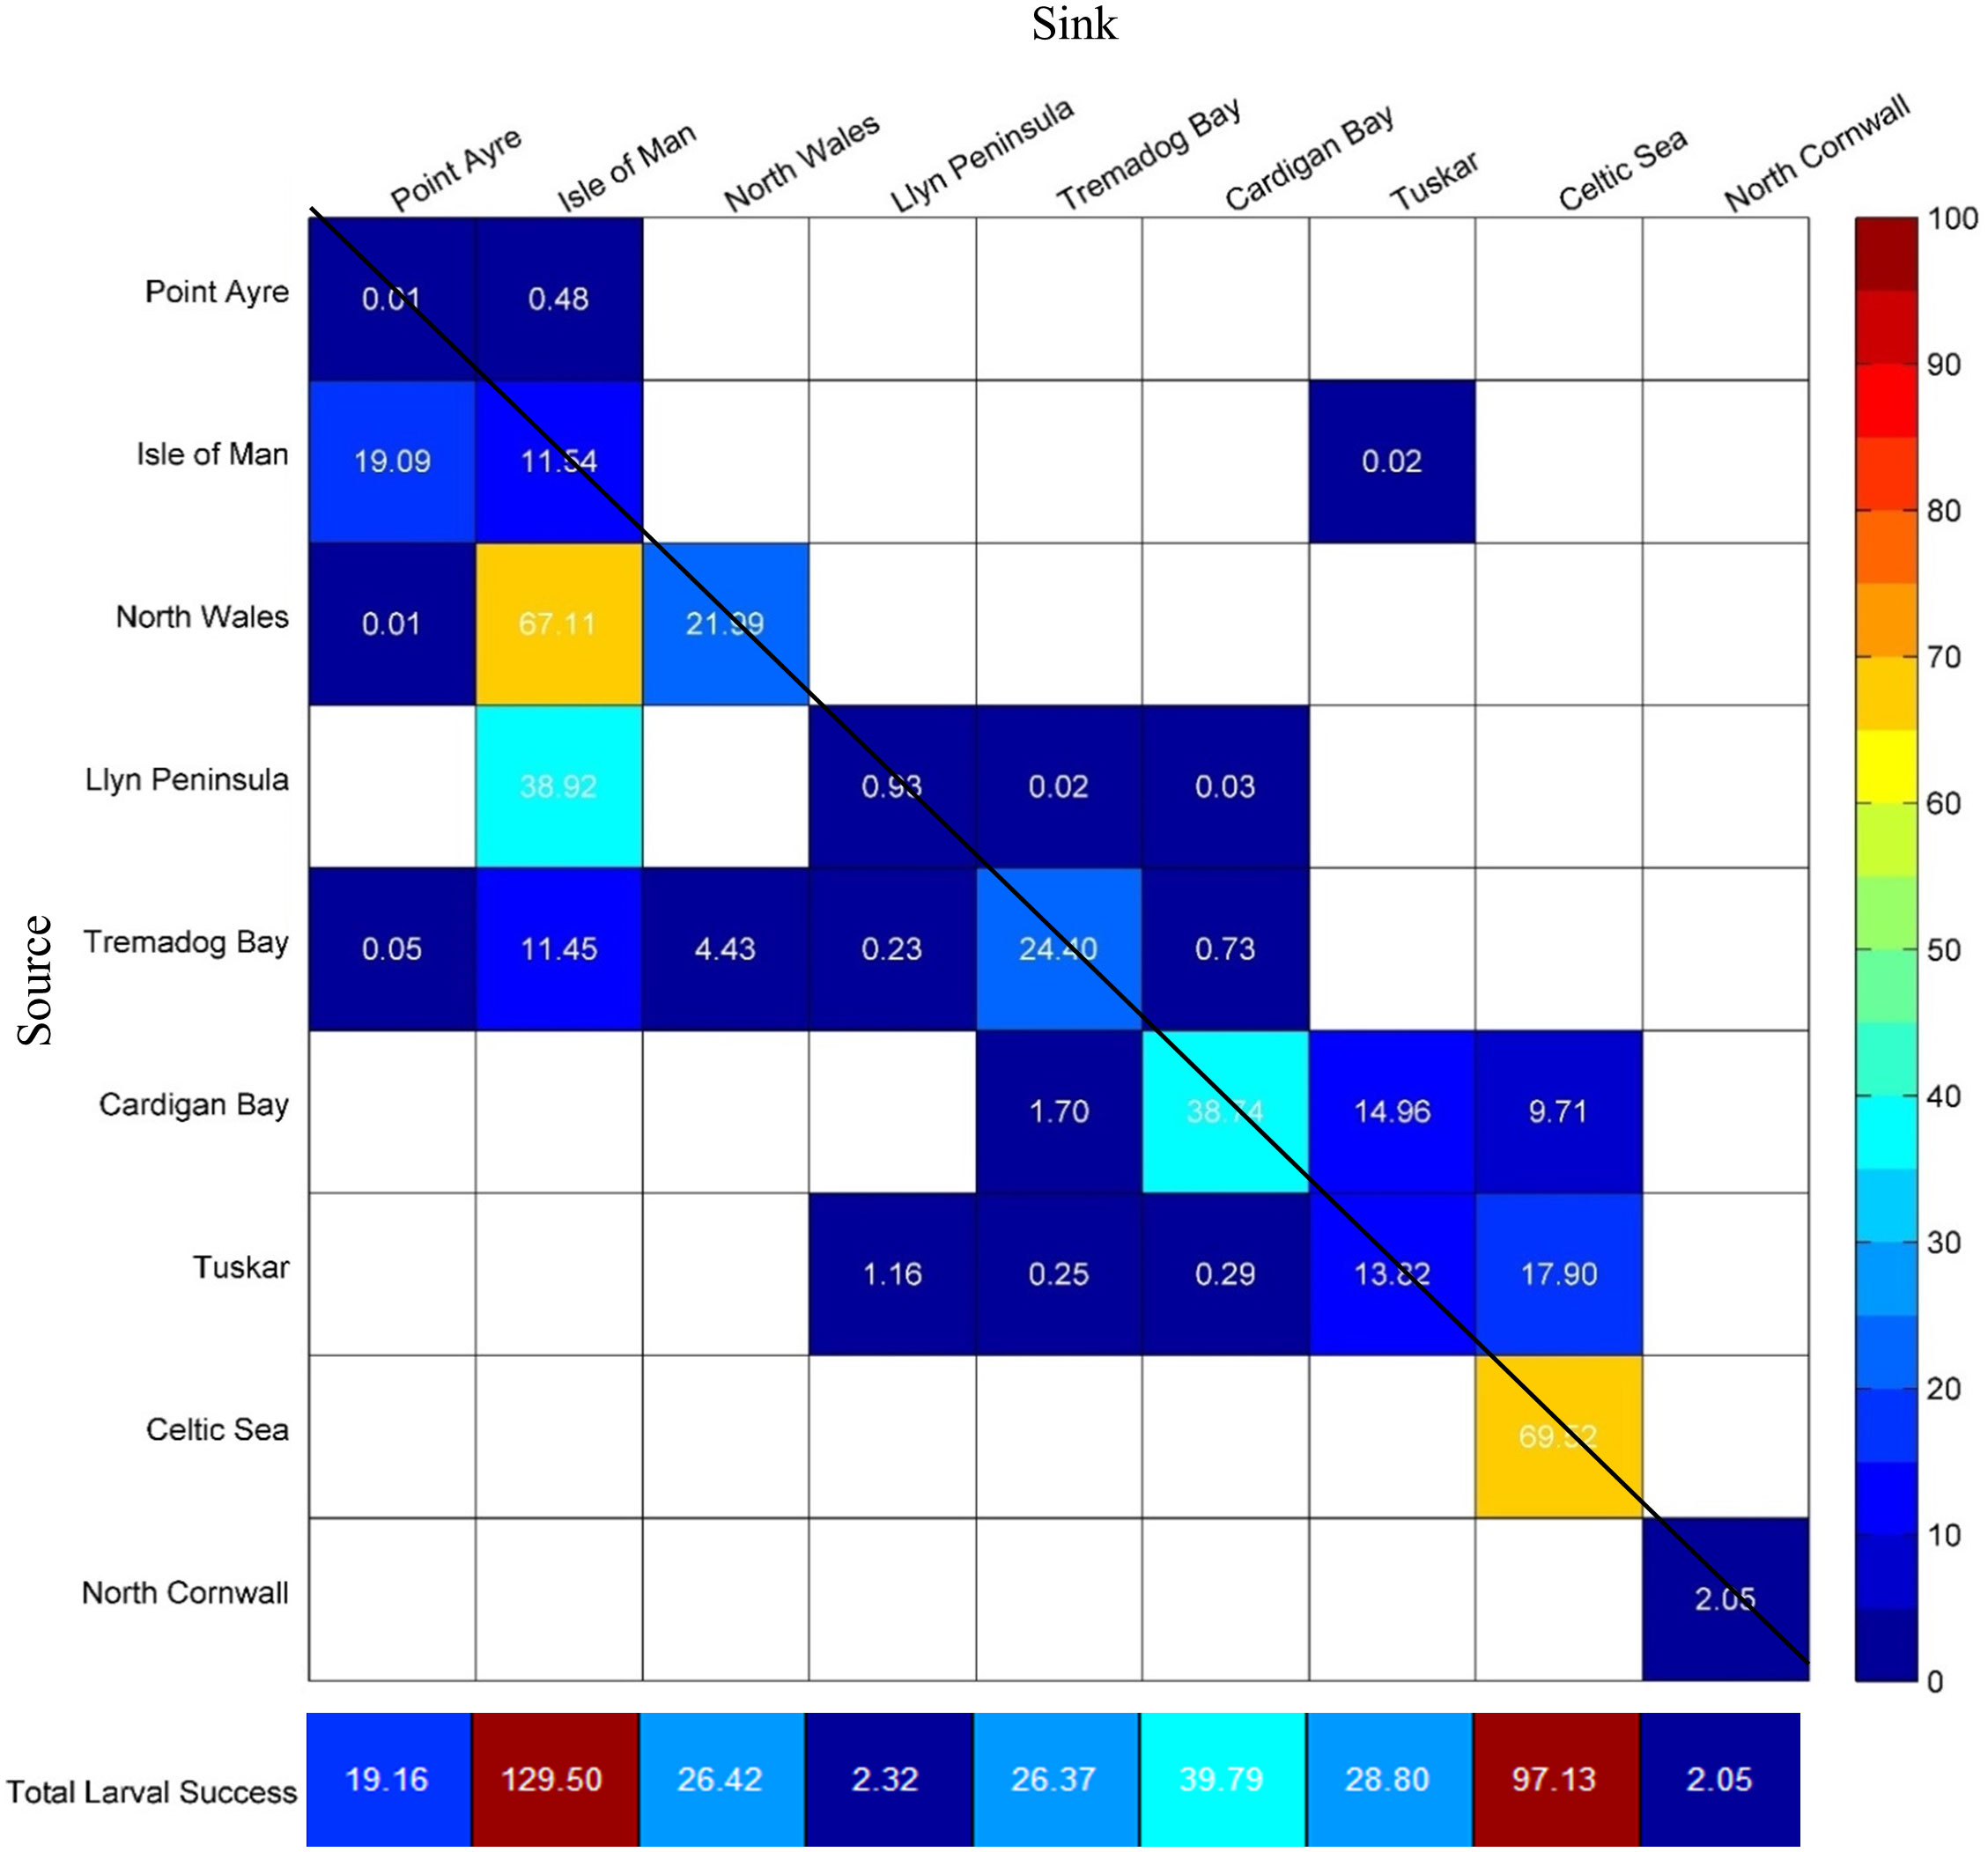
Figure 5 Connectivity matrix between larvae from a source (row) and sink (column). The colour scale represents the percentage (%) of larvae that are retained or connect to other populations; white cells indicate no connectivity. Retention within the same site is indicated by cells that cross the diagonal line. The total larval success indicating the retention and the larvae received from other populations (connectivity plus retention) for each site is shown below the matrix.
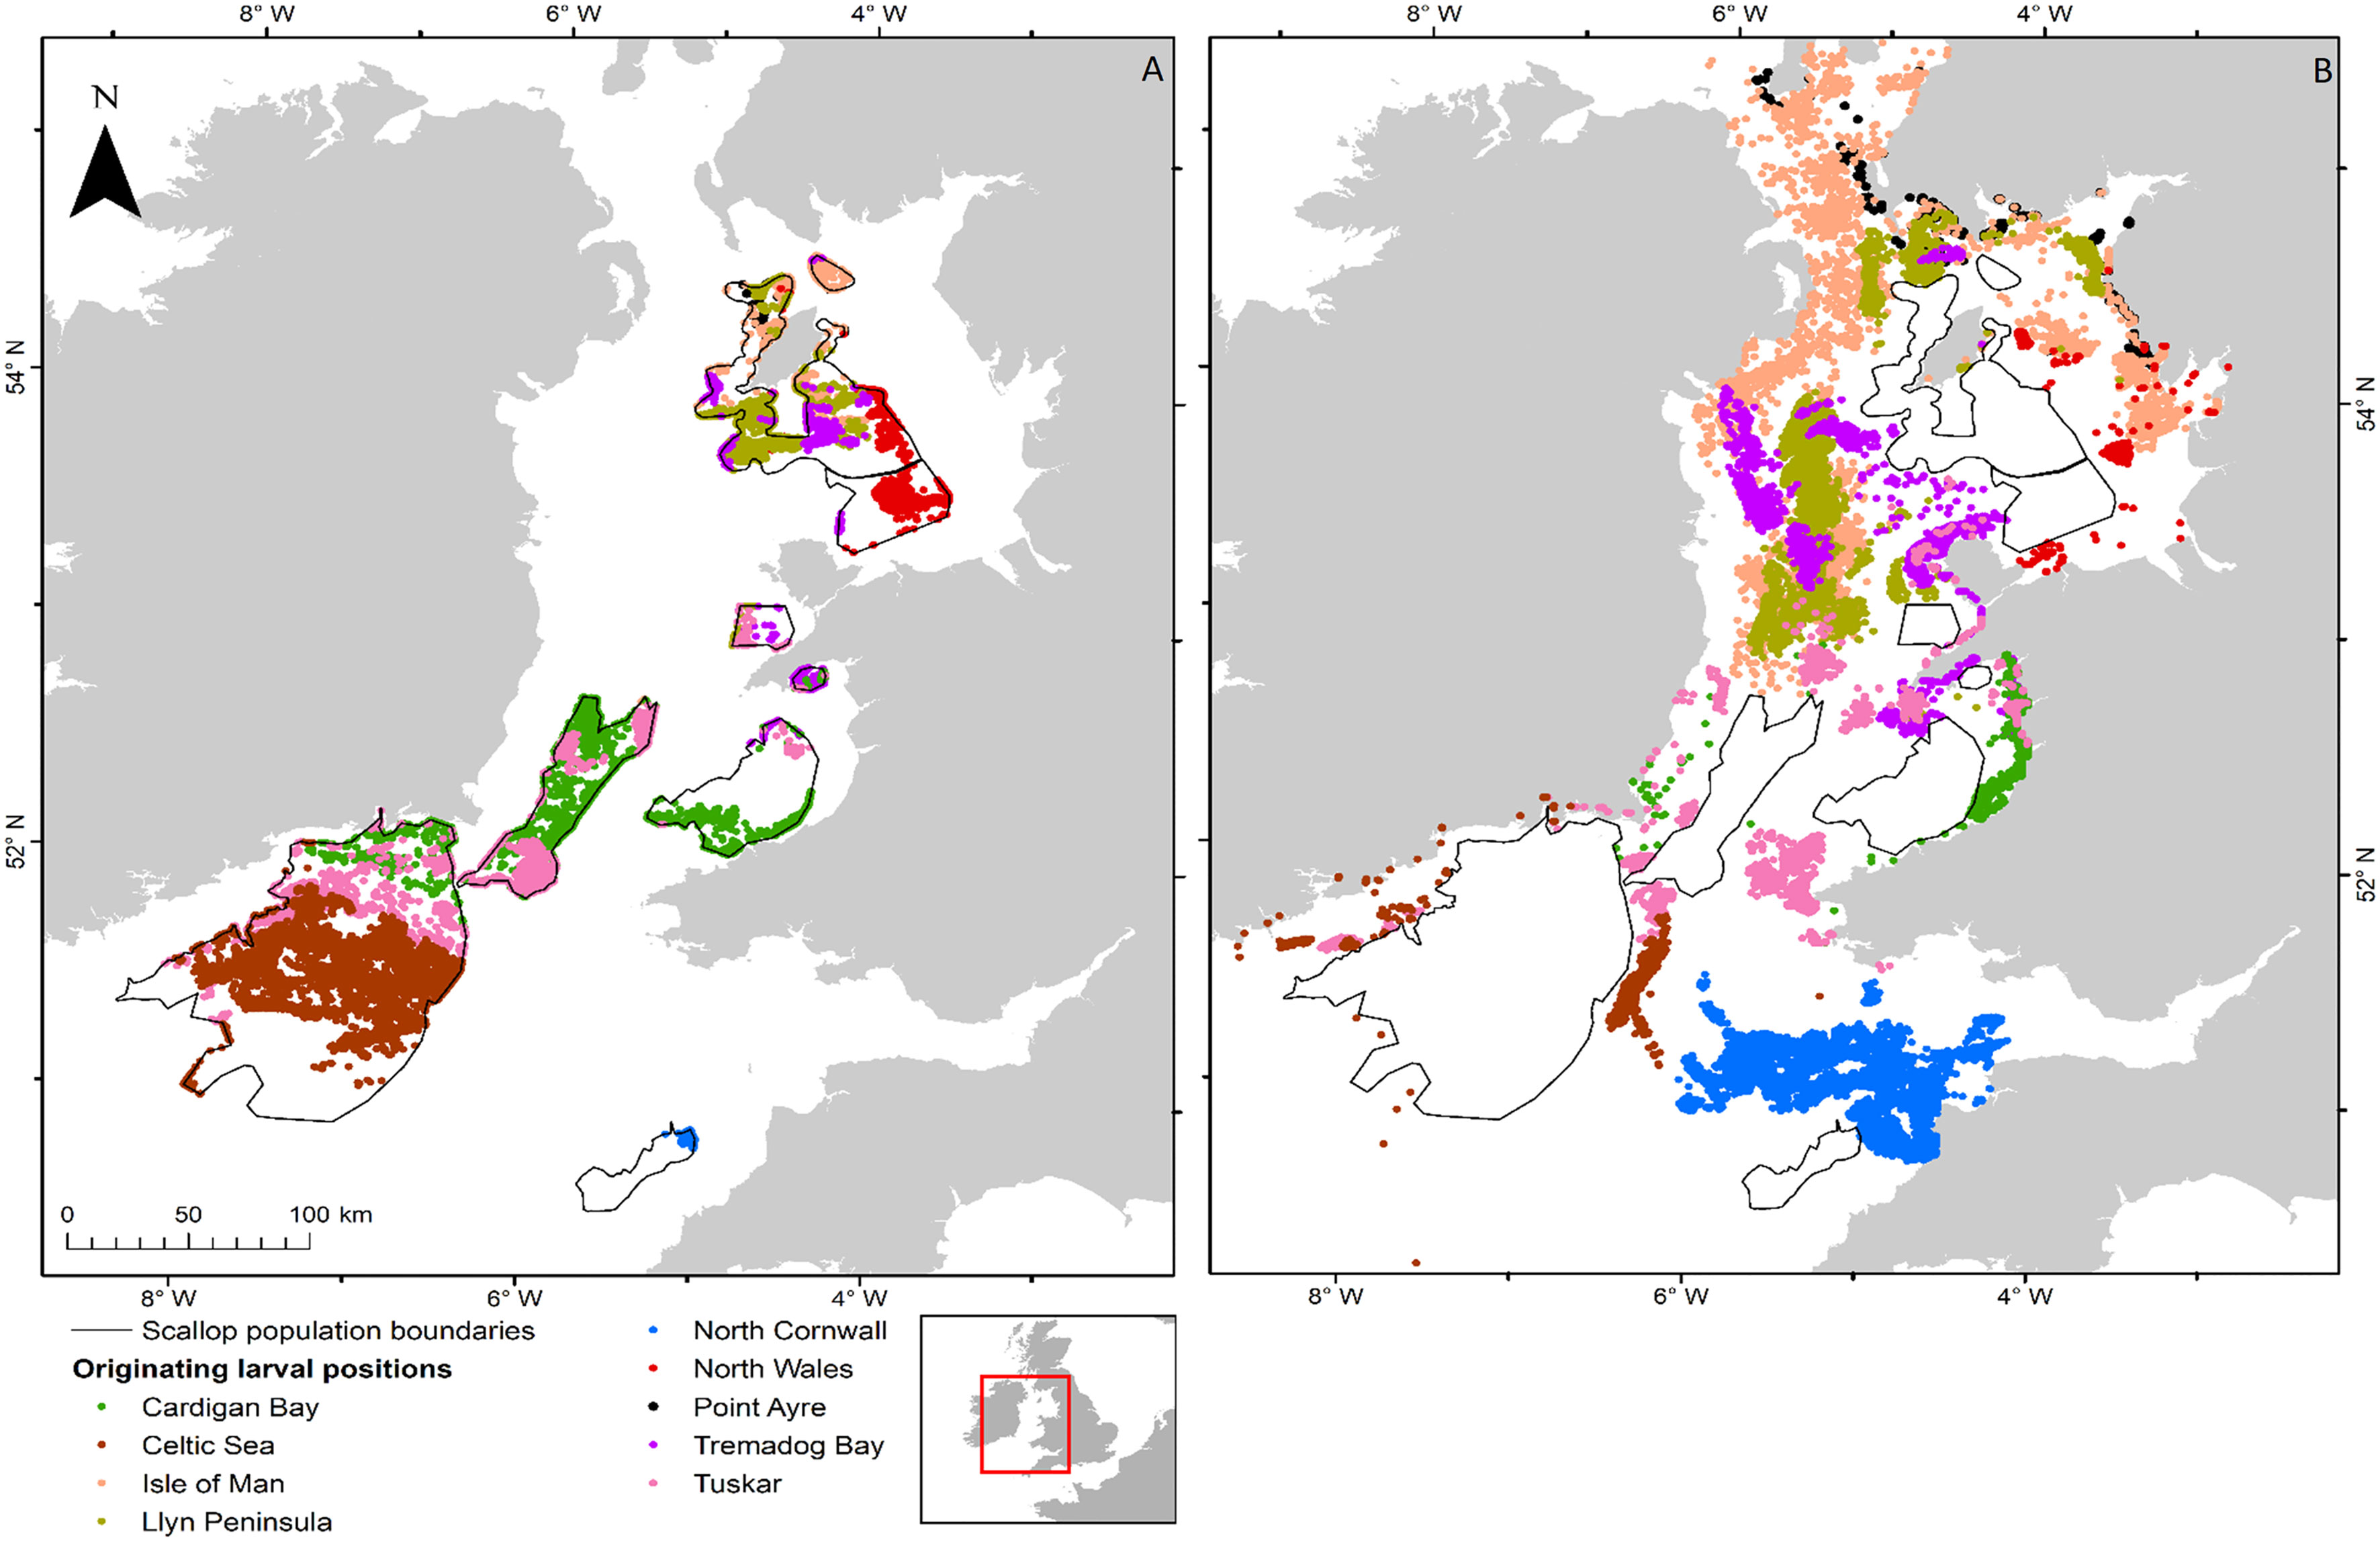
Figure 6 Distribution of larvae from spawning on the 1st April 1990 for P. maximus for all 9 populations within the Irish and Celtic Seas. (A) shows successful larvae and (B) shows unsuccessful larvae, the colour represents the site of release. The distribution of the larvae within the population is not representative of the distribution as larvae that are able to settle will do so at the edges of the sites, unless they are already within it.
The biological parameters included in the model explained 51% of variance in the PLD and 29% of the average larval transport distance from analysis on Cardigan Bay, with the remainder of the variation in these two metrics attributed to oceanographic conditions (Table 4). The release date contributed to 15% of the variation with a decrease in the PLD from 88.8 days when spawning was delayed from the 1st of April to 67.1 days for the 1st of June, due to increasing temperatures through the spring and summer. The exception from this trend was the simulation for the 1st of July which had a slightly longer PLD (Figure 7). The population-averaged transport distances increased from 1072 km in April to 2158 km in July with the exception of 1st of April and the 14th of June 1990 (Figure 8). The change in the spawning date only contributed to 4% of the total variance within the model (Table 4).
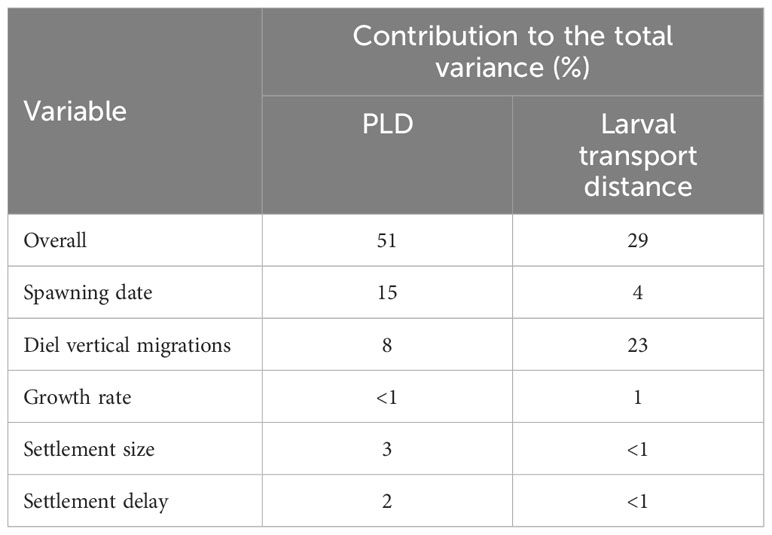
Table 4 Contribution (%) of each variable to the total variance determined from a general linear model.
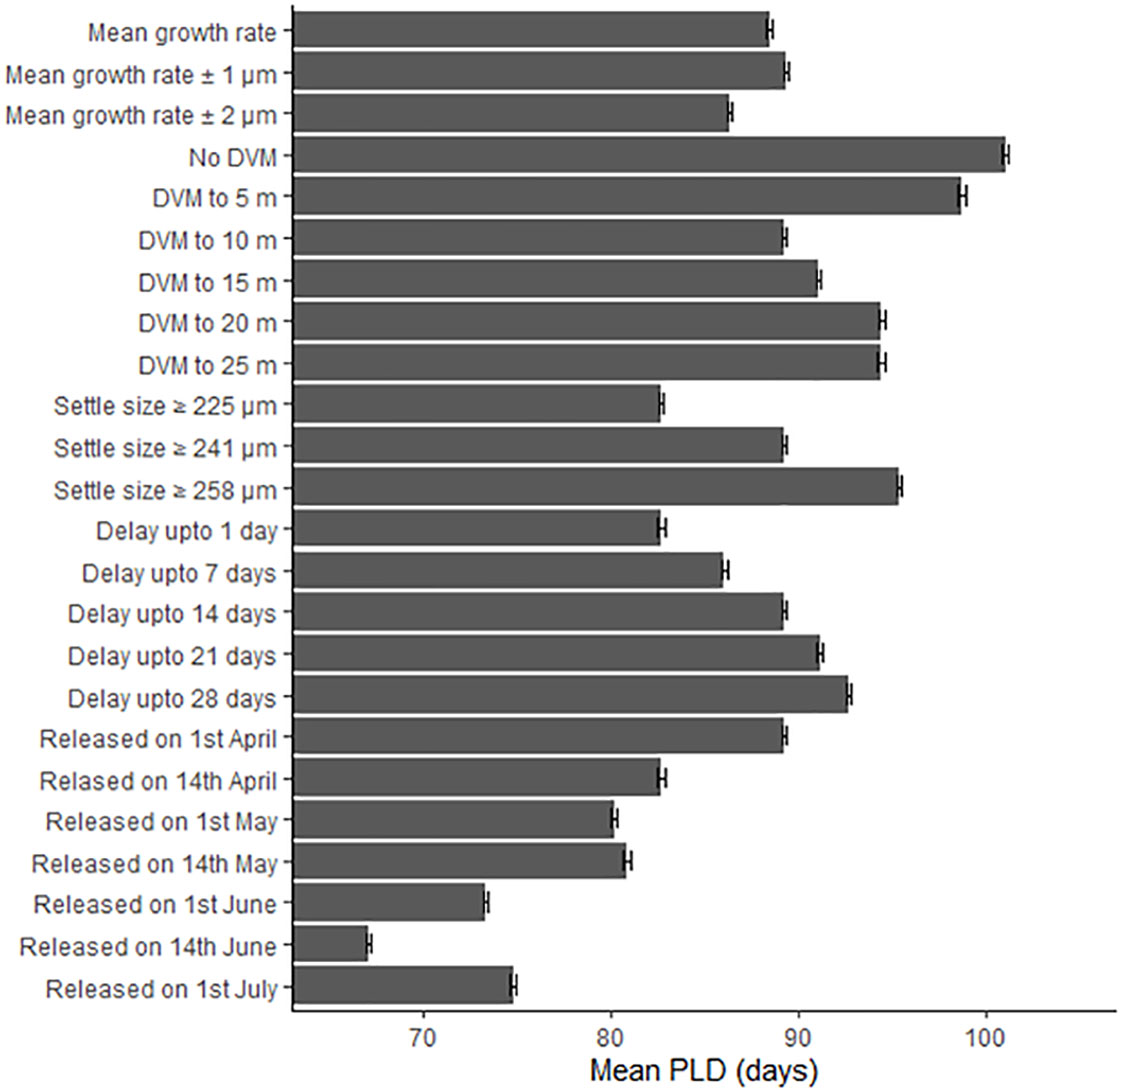
Figure 7 The effect of changing the growth rate, depth of the diel vertical migration (DVM), size at settlement, delay period and release date upon the pelagic larval duration (PLD) in days. Error bars represent the 95% confidence intervals.
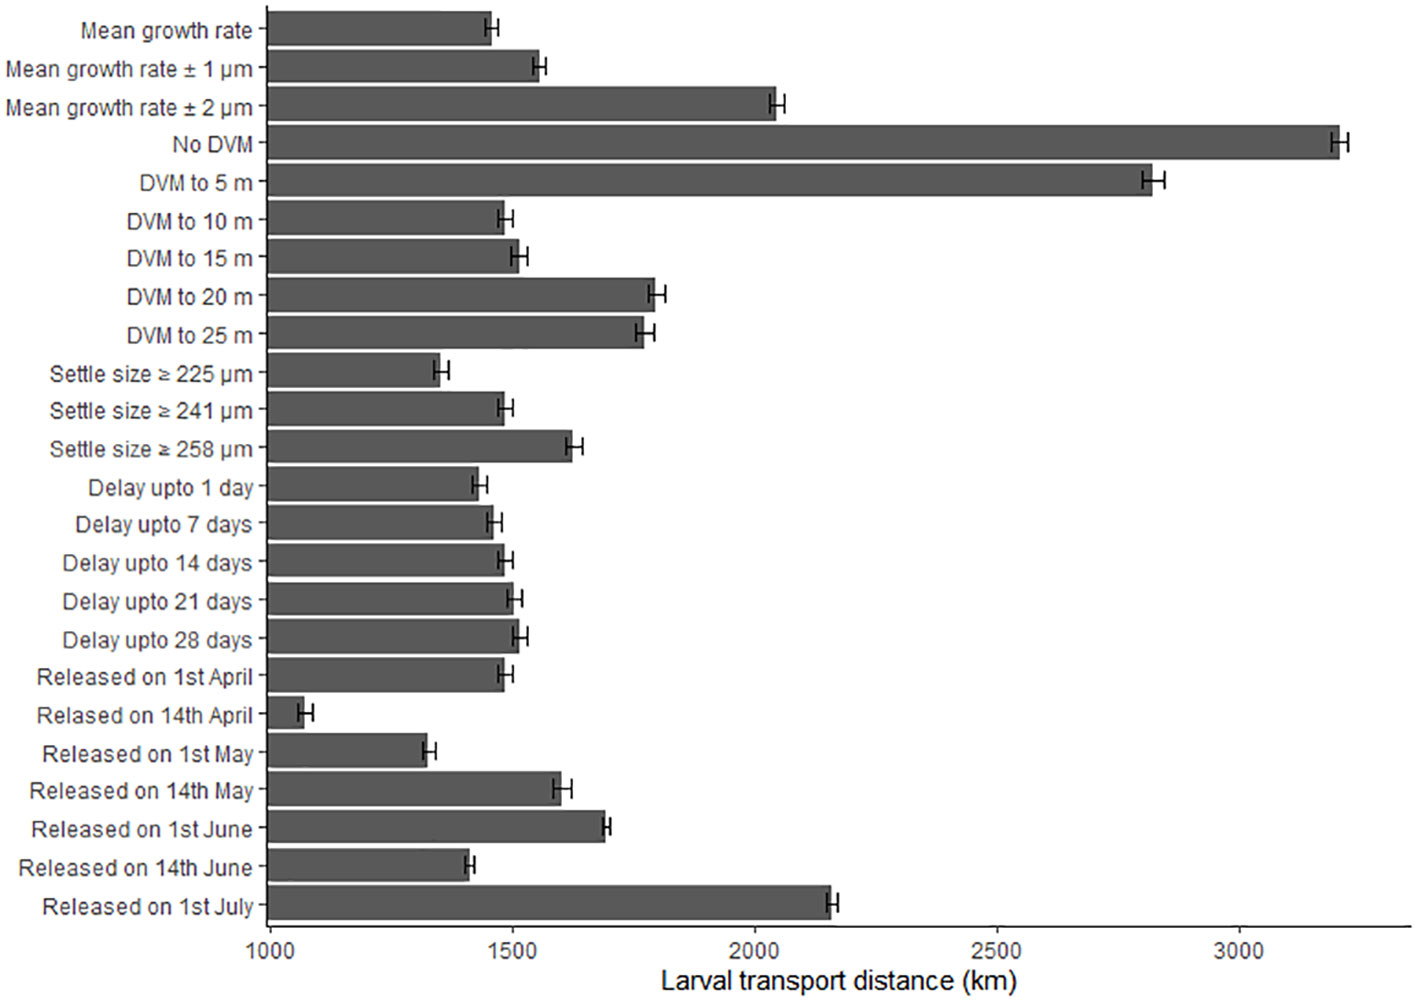
Figure 8 The effect of changing the growth rate, depth of the diel vertical migration (DVM), size at settlement, delay period and release date upon the larval transport distances (km). Error bars represent the 95% confidence intervals.
The proportion of larvae being retained larvae stayed broadly the same until June (Figure 9A) for each release date. This is due to larvae being transported away from the Cardigan Bay coast towards the Irish coastline driven by a thermal front that develops across the middle of Cardigan Bay. The total proportion of larvae connecting to other populations, primarily Tuskar, the Celtic Sea and to a lesser extent Tremadog Bay, also tended to be broadly the same at between 20 and 30% except for the larvae released on the 14th of June (Figure 9A) which had 80% of the larvae connecting to other populations and 2% of larvae being retained in Cardigan Bay. In most instances where larvae were transported away from Cardigan Bay, no suitable settlement site was found. The change in the spawning date did not appear to drastically change distribution of the larvae, the larvae tended to stay within the area between south Wales and Ireland. The only exception to this occurred in the July simulation when large numbers of larvae were transported north towards the centre of the Irish Sea, with relatively few larvae traveling west towards the Tuskar site and then moving southwest towards the Celtic Sea site, along the thermal front as modelled in previous months leading up to July (see Supplementary Material for detailed distribution maps).
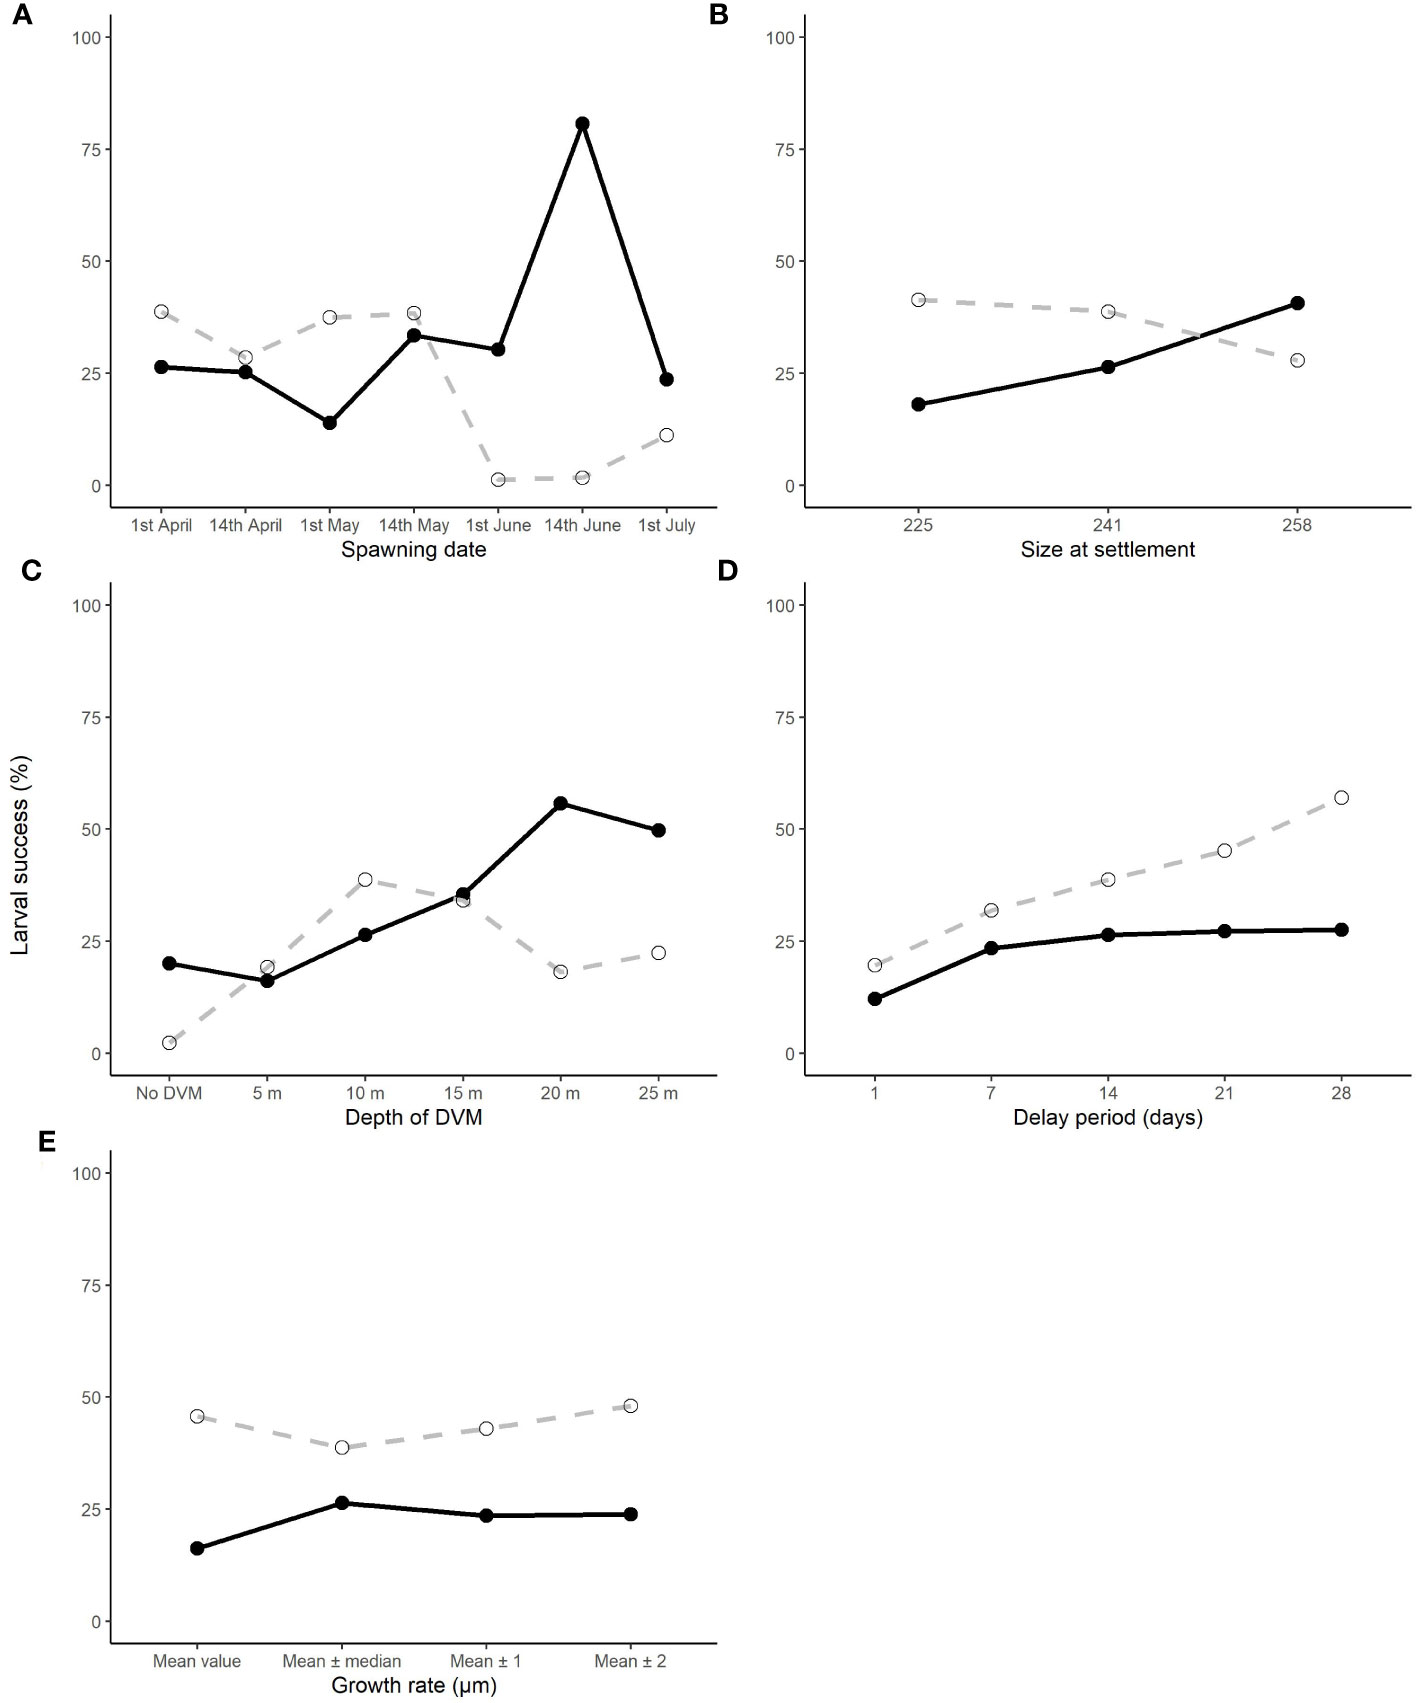
Figure 9 The effect of changing the spawning date (A), depth of the diel vertical migration (DVM) (B), growth rate (C), delay period (D) and size at settlement (E) upon the larval success rate of those which connect (dashed line) and those that are retained (black line) in their natal population.
Of the variance presented in the larval transport distances, 22% can be explained by the DVM, which only explained 8% of the variance in the PLD (Table 4). When no migrations occur and migrations up to 5 m occurred, most larvae travelled north to their final destination. When the DVM was 10 m or greater, the larval transport distance was much lower (Figure 9B) and they generally travelled towards the west and southwest along the Irish coast. Connectivity also increased with the depth of the DVM from 20% with no DVM to over 50% for DVMs to 20 and 25 m (Figure 9B).
Changes to larval size at settlement and changes to the time spawning could be delayed by, explained very little variance in the model for PLD (3% and 2% respectively) and larval transport distance (both <1%). Despite limited influence upon the PLD and transport distance, the retention of larvae increased when the delay period was extended but decreased when the size of settlement increased (Figure 9D). Conversely, the connectivity increased slightly with increasing settlement size (Figure 9E). The variation in growth rate had little effect contributing to <1% of the variance with little change in percentage of the retention and connectivity of the larvae (Figure 9C).
A random number was used within the model to simulate the natural variation in the environment. Observations from changing the random numbers in the parameters found differences in the distributions. Random numbers were used in assigning the individual larvae a starting position within a site, a starting egg size, the growth rate per iteration, the random walk and the swimming speed. However, the random number component explained <1% of the variance within the GLM.
Our results are based on mesoscale (2-10 km) and interannual-mean perspectives of the Celtic and Irish Seas circulation. The simulated velocities from the ocean model were generally in good agreement with other similar scale models developed for this region (Xing and Davies, 2001; Horsburgh and Hill, 2003; Hartnett et al., 2007; Hold et al., 2021). We incorporated the general seasonal development of the hydrodynamics with some realistic natural variability; however, several dispersive processes have not been fully characterised, such as circulation patterns associated with different synoptic storm tracks (Bricheno et al., 2023) and fine-scale coastal circulation associated with undulating topography (Ward et al., 2023) or estuaries (Robins et al., 2012). Extreme weather events may produce a connectivity network markedly different to the norm and could be an important vector in genetic structure over long-term cycles (Corte et al., 2018). Coastal and estuarine circulation will be an important driver of intertidal species such as mussels but arguably less important for scallops that inhabit deeper waters. However, simulations where large amounts of scallop larvae interacted with the coastline, such as larvae released from the Point Ayre population, may require a hydrodynamic model with a resolution higher than the 2 km used here for coastal modelling or unstructured grids which would allow high grid resolutions around the coast where it is needed, with coarser grids in more open water (Ward et al., 2023).
Many aspects of the behaviour and ecology of scallop larvae and juveniles are unknown and most investigations have been conducted in hatcheries under artificial conditions, which may have little relevance to the natural environment (Tian et al., 2009). In addition, some parameters are not well studied and/or have conflicting information available, for instance diel vertical migrations (Kaartveldt et al., 1987; Raby et al., 1994; Garland et al., 2002). The sensitivity analysis showed that, even if we varied the larval migration behaviour, similar connectivity networks prevailed as seen from similar results from modelling of scallop larvae by Hartnett et al. (2007) and Hold et al. (2020). However, the proportions of larvae that connected or were retained varied, which is key to understanding a population’s resilience to fishing pressure. This variability in strength of connectivity was primarily caused by the larval length at settlement, DVM, and the potential to delay settlement, and should be investigated further in more detail.
The study was novel in that the modelled temperature, which varied spatially and temporally, was used to influence the larval growth rate; many previous studies used a fixed PLD to determine the connectivity of populations (Hartnett et al., 2007; Tian et al., 2009). However, an analysis by Nicolle et al. (2013) found that a 1°C change in temperature resulted in an error of 4 days for a pelagic larval duration (PLD) of 34 days. The PLD estimated during this study (mean 95 days) were greater than those determined from in vitro studies of 78 days at 9°C decreasing to 24 days at 18°C (Beaumont and Barnes, 1992). There was a degree of uncertainty regarding the modelled temperature particularly in coastal regions, such as the Bristol Channel and small inlets and bays, reaching in excess of 25°C in the summer within the model. Additionally, the model produced areas of cooler waters (11°C in September) found around Anglesey, North Wales and the Southwest coast of England, when sea surface temperature in these regions is typically 14 – 15°C (National Oceanography Centre, 2022) although September offshore temperatures have been shown to be below 12°C (Hartnett et al., 2007). Incongruity between the PLDs is likely due to variation in starting size of the larvae and the settlement size. However, the sensitivity analysis of the delay period revealed interesting results in that after seven days the retention of larvae did not increase, not even after 21 days were given to allow the larvae to find a suitable settlement site. This suggests that all larvae that could have been retained were retained. However, overestimation of the connectivity could be caused by an increased PLD by delaying the settlement up to 28 days. Further research is needed to clarify the starting and settling size along with the maximum length of time P. maximus larvae can delay their settlement, as this would prevent overestimation of the connectivity between populations.
Additionally, it was expected that the shorter the PLD, the smaller the distance the larvae would travel. However, the larval transport distance increased with the change of release date when growth rates would be larger and thus cause shorter PLD. This increase in distance was caused by mesoscale density-driven (baroclinic) flows that develop in stratified regions where surface heating had led to increased stratification along oceanographic fronts where well-mixed waters meet. During spring and summer months, these residual baroclinic currents are enhanced by the thermal fronts that contribute significantly to the circulation of the Irish Seas. Therefore, greater distances were covered despite a decrease of over 10 days in the PLD.
Spawning for P. maximus is thought to occur bi-annually; once in spring (April – May) and once in autumn (September) (Mason, 1958; Minchin, 1985). However, spawning has been reported throughout the year (Gruffydd and Beaumont, 1972). The simulations revealed that, as the spawning date was moved later in the year (April through to September), the PLD decreased due to warming seas and faster growth, but the larval transport distance increased. The increase in distance was caused by mesoscale density-driven (baroclinic) flows that develop in stratified regions where surface heating had led to increased stratification along oceanographic fronts where well-mixed waters meet. During spring and summer months, these residual baroclinic currents are enhanced by the thermal fronts that contribute significantly to the circulation of the Irish Seas. Therefore, greater distances were covered despite a decrease of over 10 days in the PLD. This is countering the expected reduced larval transport distance from the shorter PLD, as predicted in Gallager et al. (1996) and Duarte (2007). Additionally, the regression analysis of connectivity and retention against the population-averaged transport distance, for all simulations conducted, suggests that the shorter the distance travelled the greater number of larvae that are retained. Conversely, no relationship between distance and connectivity was found. The results imply that retention may be increased for larvae developing in low energy environments such as the area around the Celtic Sea population. By contrast, decreased retention is expected in high-energy environments such as around Anglesey and the Llyn Peninsula where strong tidal (up to 3 m/s) and residual (up to 0.1 m/s) currents are found (Horrillo-Caraballo et al., 2021). Our simulations provide insights into larval transport from the early spawning in April/May, and for the potential of trickle spawning throughout the summer. Further studies could simulate the autumnal spawning, which may provide insightful results as the larvae become affected by the breakdown of the tidal mixing fronts and possibly increased storm activity.
The depth of the DVM has also been the subject of much discussion, with authors reporting shallow migrations between 5 – 15 m for P. maximus and Placopecten magellanicus (Kaartveldt et al., 1987; Tremblay and Sinclair, 1990; Raby et al., 1994; Gallager et al., 1996). When no migration occurred the larval transport distances were large and connectivity low, with retention particularly low, resulting in high proportions of larval wastage – a pattern that has been simulated in other models (Gilbert et al., 2010). Vertical migrations up to 5 m caused a 20% rise in the retention of larvae, demonstrating that the movement out of the immediate surface of the water can cause significant differences in the transport of larvae with DVMs after 20 m having a limited effect. This was because larvae may get entrained into different currents depending on the depth of the DVM and suggests that DVMs to 5 m or less are influenced by surface forcing rather than ocean currents. The retention of larvae when no DVM was used was 2% with surface forcing having a large role in the retention of larvae, particularly in the early stages when no migration behaviour has developed. Within the model, a fixed depth of the DVM was used but different stimuli such as light intensity (Kaartveldt et al., 1987), salinity discontinuation (Raby et al., 1994), increased pressure (Cragg, 1980) and stratification (Scrope-Howe and Jones, 1986; Tremblay and Sinclair, 1990; Raby et al., 1994) have been observed to modify the diel vertical migrations exhibited by veligers swimming behaviour. Therefore, local conditions might cause different depths of the DVM, thus causing differences in the temporal and spatial transport of the larvae.
Random elements introduced into the model to create variation such as small sub-scale turbulence (random walks), predator avoidance (swimming speed), food scarcity (growth rate) and release location had a minimal influence on the variance on the model. It may be that these small-scale effects do not have a large effect at the scale of the model but should be considered with higher resolution models.
Currently, scallop stocks are managed individually (ICES, 2021) with direct management in territorial waters (12 nautical miles) by regional bodies, and nationally for offshore waters within each country’s exclusive economic zone. The retention and connectivity from this study are magnitudes higher than expectations as no mortality was introduced into the model. However, the general dispersal patterns suggest that there is a single metapopulation within the Celtic and Irish Seas, except for North Cornwall which was reliant on self-recruiting. However, other scallop modelling had identified metapopulations within the English Channel and along the French coast, not within the scope of this study, which have the potential to act as a source for North Cornwall and the Celtic Sea populations (Le Goff et al., 2017; Nicolle et al., 2017). The four populations between the west coast of Wales and Ireland (Llyn Peninsula, Tremadog Bay, Cardigan Bay and Tuskar) appeared to be key to the metapopulation, with a large interchange of larvae which is consistent with other larval models for the region (Hartnett et al., 2007; Coscia et al., 2013). In particular, the exchange of larvae between these three central populations (Cardigan Bay, Tuskar and Tremadog Bay) suggests that they may be resilient to over-fishing as external sources of larvae may be able to replenish the populations (Grimm et al., 2003). Additionally, they also provide larvae for each other and for populations in the south (the Celtic Sea) and north (Isle of Man, North Wales and Point Ayre). The northern area of the Celtic Sea population is reliant on the import of larvae and to maintain the population abundance, the Tuskar and Cardigan Bay populations will need strong management if they are to provide a continual source of larvae. In addition, the central populations appear to be a vital source of larvae for the Llyn Peninsula population which has a low retention rate (0.9%), which acts as a steppingstone connecting the central populations to the northerly populations; but modelling by Hartnett et al. (2007) found retention may occur in this region. The North Wales population is also a crucial population, appearing to be reliant on self-recruitment with low external recruitment of larvae but a large percentage of its larvae connected to the Isle of Man population, an important fishing ground (ICES, 2021). It should also be noted that not all scallop populations were simulated or represented in the model, with populations identified from extensive fishing pressure with defined boundaries used (ICES, 2021). Other populations of scallops are known to occur in waters surrounding Northern Ireland (AFBI, 2012), Scotland (Dobby et al., 2012) and France (Nicolle et al., 2013) with international cooperation needed to provide accurate data. Additionally, populations exist on smaller scales such as within Skomer Marine Nature Reserve, but the area of these populations could not be defined or were too small in scale to be accurately modelled.
The study does not consider that in the natural environment larvae may not settle and recruit into the established populations or the consideration of mortality; it only reflects the probability for a larva to complete its larval lifespan and find a settlement substrate in the defined populations. To simulate the larval transport and define the patterns of dispersal a year with average conditions was chosen. To achieve realistic predictions for a given year for management measures, validated hydrodynamic models should be used. Particularly as scallops take approximately two years from fertilisation to become reproductively active adults (Devauchelle and Mingant, 1991). Therefore, the fishery can benefit if accurate oceanographic models for this period can be created annually to predict patterns of recruitment. This could provide information about when recruitment may be high or low, which could be proven by a coordinated stock assessment that would yield observed densities and distributions that would substantially improve the modelling. The implementation combined with microchemistry or genetic methods, could help validate patterns from mathematical models, particularly from external sources (Nicolle et al., 2013; Hold et al., 2021). For instance, in 1985 large numbers of larvae of P. maximus were trapped in an area with unsuitable settlement substrate by a whirlpool located in St. Brieuc Bay, France, which was caused by strong winds blowing in the opposite direction of the tidal currents. The poor recruitment of individuals from the larvae in 1985 was confirmed by a noticeable decline in the catch of adults three years later (Le Pennec et al., 2003). Therefore, understanding and predicting the larval transport can significantly improve fisheries management and conservation aims and objectives. Current management of scallops is conducted as though they are small unrelated stocks, but the results open up the possibility for the management of the fishery to be internationally integrated, so that the metapopulation can be maintained and to ensure resilience by recruitment from external sources.
The modelling conducted as part of this study provides the most detailed simulations of the connectivity of the well-known established P. maximus populations describing a large interconnected metapopulation in the Irish and Celtic Seas. The larval transport patterns, and hence connectivity networks, appeared to be driven by the hydrodynamics, but the proportion of larvae that were retained or dispersed to other populations appeared to be driven by the biological parameters. In particular, the sensitivity analysis demonstrated seasonal variability in spawning and the DVM may play an important role in the transport to geographically distinct areas. The PLD was overestimated in this study due to uncertainty in the starting larval size and final settlement size, and thus needs to be investigated further. However, a delay in settlement (longer PLD) had little effect on retention but suggest that modelled PLD that are longer than those that occur would overestimate the connectivity to other populations.
This study and others published in recent years (Tian et al., 2009; Nicolle et al., 2017; Hold et al., 2021) demonstrate that the current model of managing the fisheries is unsuitable, with populations reliant on retention and in some cases reliant on external recruitment. A strong effort should be made internationally to manage scallops based on their sensitivity to fishing pressure with key source populations given robust management measures.
The raw data supporting the conclusions of this article will be made available by the authors, without undue reservation.
HC: Conceptualization, Formal analysis, Investigation, Methodology, Writing – original draft, Writing – review & editing. GL: Conceptualization, Methodology, Supervision, Writing – review & editing. PR: Methodology, Software, Supervision, Writing – review & editing. LG: Conceptualization, Formal analysis, Supervision, Writing – review & editing.
The author(s) declare financial support was received for the research, authorship, and/or publication of this article. This research was funded by the Bluefish Project (Grant Agreement No. 80991, part-funded by the European Regional Development Fund (ERDF) through the Ireland Wales Co-operation Programme), the European Fisheries Fund, and the European Maritime Fisheries Fund (Fisher-Scientist Project, 81920). The publication costs were funded by Cefas.
To Authors thank Tiago Silva for reviewing the manuscript and for the reviewers for their feedback and Cefas for supporting the write-up and funding the publication.
The authors declare that the research was conducted in the absence of any commercial or financial relationships that could be construed as a potential conflict of interest.
All claims expressed in this article are solely those of the authors and do not necessarily represent those of their affiliated organizations, or those of the publisher, the editors and the reviewers. Any product that may be evaluated in this article, or claim that may be made by its manufacturer, is not guaranteed or endorsed by the publisher.
The Supplementary Material for this article can be found online at: https://www.frontiersin.org/articles/10.3389/fmars.2023.1274136/full#supplementary-material
AFBI (2012). Dredge Fisheries in Northern Ireland (Belfast).Sustainable Development Strategy for Northern Ireland’s Inshore Fisheries (afbini.gov.uk).
Andersen S., Christophersen G., Magnesen T. (2011). Spat production of the great scallop (Pecten maximus): A roller coaster. Can. J. Zoology 89 (7), 579–598. doi: 10.1139/z11-035
Baird R. H. (1966). Notes on an escallop (Pecten maximus) population in Holyhead harbour. J. Mar. Biol. Assoc. United Kingdom 46 (1), 33–47. doi: 10.1017/S0025315400017537
Beaumont A. R., Barnes D. A. (1992). Aspects of veliger larval growth and byssus drifting of the spat of Pecten maximus and Aequipecten (Chlamys) opercularis. ICES J. Mar. Sci. 49 (4), 417–423. doi: 10.1093/icesjms/49.4.417
Beaumont A. R., Budd M. D. (1983). Effects of self-fertilisation and other factors on the early development of the scallop Pecten maximus. Mar. Biol. 76, 285–289. doi: 10.1007/BF00393030
Beukers-Stewart B. D., Beukers-Stewart J. S. (2009). Principles for the management of inshore scallop fisheries around the United Kingdom (York: University of York).
Beukers-Stewart B. D., Mosley M. W. J., Brand A. R. (2003). Population dynamics and predictions in the Isle of Man fishery for the great scallop (Pecten maximus, L.). ICES J. Mar. Sci. 60 (2), 224–242. doi: 10.1016/S1054-3139(03)00005-5
Bloor I. S. M., Duncan P. F., Dignan S. P., Emmerson J., Beard D., Gell F. R., et al. (2021). Boom not bust: Cooperative management as a mechanism for improving the commercial efficiency and environmental outcomes of regional scallop fisheries. Mar. Policy 132, 1–10. doi: 10.1016/j.marpol.2021.104649
Blumberg A. F., Mellor G. L. (1987). “A description of a three-dimension coastal ocean circulation model,” in Three-dimensional coastal ocean models (Washington DC: Coastal and Estuarine Sciences, American Geophysical Union), 1–16.
Bonardelli J. C., Himmelman J. H., Drinkwater K. (1996). Relation of spawning of the giant scallop, Placopecten magellanicus, to temperature fluctuations during downwelling events. Mar. Biol. 124, 637–649. doi: 10.1007/BF00351045
Botsford L. W., Brumbaugh D. R., Grimes C., Kellner J. B., Largier J., O’Farrell M.R., et al. (2009). Connectivity, sustainability, and yield: Bridging the gap between conventional fisheries management and marine protected areas. Rev. Fish Biol. Fisheries 19, 69–95. doi: 10.1007/s11160-008-9092-z
Bricheno L., Amies J. D., Chowdhury P., Woolf D., Timmermans B. (2023). Climate change impacts on storms and waves relevant to the UK and Ireland. Mar. Climate Change Impacts Partnership Sci. Rev, 1–22. doi: 10.14465/2023.reu09.str
Caley M. J., Carr M., Hixon M., Hughes T., Jones G., Menge B. A.. (1996). Recruitment and the local dynamics of open marine populations. Annu. Rev. Ecol. systematics 27, 477–500. doi: 10.2307/4511867
Cochard J. C., Devauchelle N. (1993). Spawning, fecundity and larval survival and growth in relation to controlled conditioning in native and transplanted populations of Pecten maximus (L.): evidence for the existence of separate stocks. J. Exp. Mar. Biol. Ecol. 169 (1), 41–56. doi: 10.1016/0022-0981(93)90042-M
Cochard J.-C., Gerard A. (1987). “Artificial production of scallops spat Pecten maximus (L.): Analysis of factors affecting larval growth,” in Act Sixth International Pectinid Workshop, Menai Bridge. 9–14.
Comely C. A. (1972). Larval culture of the scallop Pecten maximus (L). ICES J. Mar. Sci. 34 (3), 365–378. doi: 10.1093/icesjms/34.3.365
Corte G. N., Gonçalves-Souza T., Checon H. H., Siegle E., Coleman R. A., Amaral A. C.Z.. (2018). When time affects space: Dispersal ability and extreme weather events determine metacommunity organization in marine sediments. Mar. Environ. Res. 136, 139–152. doi: 10.1016/j.marenvres.2018.02.009
Coscia I., Robins P., Porter J., Malham S., Ironside J. (2013). Modelled larval dispersal and measured gene flow: Seascape genetics of the common cockle Cerastoderma edule in the southern Irish Sea. Conserv. Genet. 14 (2), 451–466. doi: 10.1007/s10592-012-0404-4
Cragg S. M. (1980). Swimming behaviour of the larvae of Pecten maximus (L.) (Bivalvia). J. Mar. Biol. Assoc. United Kingdom 60 (3), 551–564. doi: 10.1017/S002531540004025X
Cragg S. M., Crisp D. J. (1991). The biology of scallop larvae. Biology Ecol. Aquaculture Scallops, Shumway S. E., Ed., Amsterdam: Elsevier, 75–132.
Crooks K. R., Sanjayan M. A. (2006). Connectivity conservation (Cambridge: Cambridge University Press).
Devauchelle N., Mingant C. (1991). Review of the reproductive physiology of the scallop, Pecten maximus , applicable to intensive aquaculture. Aquat. Living Resour. 4 (1), 41–51. doi: 10.1051/alr:1991004
Dobby H., Millar S., Blackadder L., Turriff J., McLay A. (2012). Scottish scallop stocks: Results of 2011 stock assessments. Scottish Marine and Freshwater Science 3 (10), 1–162.
Duarte C. M. (2007). Marine ecology warms up to theory. Trends Ecol. Evol. 22 (7), 331–333. doi: 10.1016/j.tree.2007.04.001
Gallager S. M., Manuel J. L., Manning D. A., O’Dor R. (1996). Ontogenetic changes in the vertical distribution of giant scallop larvae, Placopecten magellanicus, in 9-m deep mesocosms as a function of light, food, and temperature stratification. Mar. Biol. 124, 679–692. doi: 10.1007/bf00351049
Garland E. D., Zimmer C. A., Lentz S. J. (2002). Larval distributions in inner-shelf waters: The roles of wind-driven cross-shelf currents and diel vertical migrations. Limnology Oceanography 47 (3), 803–817. doi: 10.4319/lo.2002.47.3.0803
Gilbert C. S., Gentleman W. C., Johnson C., DiBacco C., Pringle J., Chen C. (2010). Modelling dispersal of sea scallop (Placopecten magellanicus) larvae on Georges Bank: The influence of depth-distribution, planktonic duration and spawning seasonality. Prog. Oceanography 87 (1–4), 37–48. doi: 10.1016/j.pocean.2010.09.021
Gimenez L. (2019). Incorporating the geometry of dispersal and migration to understand spatial patterns of species distributions. Ecography 42, 643–657. doi: 10.1111/ecog.03493
Giménez L., Robins P., Jenkins S. R. (2020). Role of trait combinations, habitat matrix, and network topology in metapopulation recovery from regional extinction. Limnology Oceanography 65 (4), 775–789. doi: 10.1002/lno.11347
Grimm V., Reise K., Strasser M. (2003). “Marine metapopulations: A useful concept?,” in Helgoland Marine Research 56, 222–228. doi: 10.1007/s10152-002-0121-3
Gruffydd L. D., Beaumont A. R. (1972). A method for rearing Pecten maximus larvae in the laboratory. Mar. Biol. 15 (4), 350–355. doi: 10.1007/BF00401395
Handal W., Szostek C., Hold N., Andrello M., Thiébaut E., Ewan H., et al. (2020). New insights on the population genetic structure of the great scallop (Pecten maximus) in the English Channel, coupling microsatellite data and demogenetic simulations. Aquat. Conservation: Mar. Freshw. Ecosyst. 30 (10), 1841–1853. doi: 10.1002/aqc.3316
Hartnett M., Berry A., Tully O., Dabrowski T. (2007). Investigations into the transport and pathways of scallop larvae - The use of numerical models for managing fish stocks. J. Environ. Monit. 9 (5), 403–441. doi: 10.1039/b617035h
Hold N., Robins P., Szotek C., Lambert G., Lincoln H., Le Vay L. (2021). Using biophysical modelling and population genetics for conservation and management of an exploited species, Pecten maximus L. Fisheries Oceanography 30 (6), 740–756. doi: 10.1111/fog.12556
Horrillo-Caraballo J. M., Yin Y., Fairley I., Karunarathna H., Masters I., Reeve D. E. (2021). A comprehensive study of the tides around the Welsh coastal waters. Estuarine Coast. Shelf Sci. 254, 107326. doi: 10.1016/j.ecss.2021.107326
Horsburgh K. J., Hill A. E. (2003). A three-dimensional model of density-driven circulation in the Irish Sea. J. Phys. Oceanography 33 (2), 343–365. doi: 10.1175/1520-0485(2003)033<0343:ATDMOD>2.0.CO;2
ICES (2021). The Scallop Assessment Working Group Report (WGSCALLOP). ICES Scientific Reports 3 (114), 106. doi: 10.17895/ices.pub.9561
Jones G. P., Almany G. R., Russ G. R., Sale P. F., Steneck R. S., vanOppen M. J.H., et al. (2009). Larval retention and connectivity among populations of corals and reef fishes: History, advances and challenges. Coral Reefs 28, 307–325. doi: 10.1007/s00338-009-0469-9
Kaartveldt S., Aksnes D. L., Egge J. K. (1987). Effect of light on the vertical distribution of Pecten maximus larvae. Mar. Ecol. Prog. Ser. 40, 195–197. doi: 10.3354/meps040195
Le Goff C., Lavaud R., Cugier P., Jean F., Flye-Sainte-Marie J., Foucher E., et al. (2017). A coupled biophysical model for the distribution of the great scallop Pecten maximus in the English Channel. J. Mar. Syst. 167, 55–67. doi: 10.1016/j.jmarsys.2016.10.013
Le Pennec M., Paugam A., Le Pennec G. (2003). The pelagic life of the pectinid Pecten maximus - A review. ICES J. Mar. Sci. 60, 211–233. doi: 10.1016/S1054-3139(02)00270-9
Malakoff D. (1997). Extinction on the high seas. Science 277, 486–488. doi: 10.1126/science.277.5325.486
Mason J. (1958). The breeding of the scallop, Pecten maximus (L.), in manx waters. J. Mar. Biol. Assoc. United Kingdom 37 (3), 653–671. doi: 10.1017/S0025315400005701
Miller T. J. (2007). Contribution of individual-based coupled physical-biological models to understanding recruitment in marine fish populations. Mar. Ecol. Prog. Ser. 347, 127–138. doi: 10.3354/meps06973
Minchin D. (1985). “Possible effects of an intense algal bloom of Gyrodinium aurelolum on a year class of scallops (Pecten maximus),” in Fifth international Pectinid Workshop(La Coruna, Spain).
National Oceanography Centre (2022). Available at: https://noc.ac.uk (Accessed June 20, 2022).
Neill S. P., Scourse J. D., Uehara K. (2010). Evolution of bed shear stress distribution over the northwest European shelf seas during the last 12,000 years. Ocean Dynamics 60, 1139–1156. doi: 10.1007/s10236-010-0313-3
Nicolas L., Robert R. (2001). The effect of food supply on metamorphosis and post-larval development in hatchery-reared Pecten maximus. Aquaculture 192 (2–4), 347–359. doi: 10.1016/S0044-8486(00)00462-2
Nicolle A., Dumas F., Foveau A., Foucher E., Thiébaut E. (2013). Modelling larval dispersal of the king scallop (Pecten maximus) in the English Channel: Examples from the bay of Saint-Brieuc and the bay of Seine. Ocean Dynamics 63, 661–678. doi: 10.1007/s10236-013-0617-1
Nicolle A., Moitié R., Ogor J., Dumas Foveau F. A., Foucher A., Thiébaut E. (2017). Modelling larval dispersal of Pecten maximus in the English Channel: A tool for the spatial management of the stocks. ICES J. Mar. Sci. 74 (6), 1812–1825. doi: 10.1093/icesjms/fsw207
North E. W., Hood R. R., Chao S. Y., Sanford L. P. (2006). Using a random displacement model to simulate turbulent particle motion in a baroclinic frontal zone: A new implementation scheme and model performance tests. J. Mar. Syst. 60 (3–4), 365–380. doi: 10.1016/j.jmarsys.2005.08.003
Paugam A., Le Pennec M., Marhic A., André-Fontaine G. (2003). Immunological in situ determination of Pecten maximus larvae and their temporal distribution. J. Mar. Biol. Assoc. United Kingdom 83 (5), 1083–1093. doi: 10.1017/S0025315403008300h
Paulet Y., Bekhadra F., Devauchelle N., Donval N., Dorange G. (1995). Cycles saisonniers, reproduction et qualite des ovocytes chez Pecten maximus en rade de Brest. Programme rade : 3è rencontres scientifiques internationales: actes de colloque. Brest les 14 - 15 16 mars 1995 au Quartz. 2 (15), 1–13. Available at: https://archimer.ifremer.fr/doc/00044/15495/.
Paulet Y. M., Lucas A., Gerard A. (1988). Reproduction and larval development in two Pecten maximus (L.) populations from Brittany. J. Exp. Mar. Biol. Ecol. 119 (2), 145–156. doi: 10.1016/0022-0981(88)90229-8
Raby D., Lagadeuc Y., Dodson J. J., Mingelier M. (1994). Relationship between feeding and vertical distribution of bivalve larvae in stratified and mixed waters. Mar. Ecol. Prog. Ser. 103, 275–284. doi: 10.3354/meps103275
R Core Team (2022). R: A language and environment for statistical computing (Vienna, Austria: R Foundation for Statistical Computing). Available at: https://www.r-project.org/.
Robert R., Gérard A. (1999). Bivalve hatchery technology: The current situation for the Pacific oyster Crassostrea gigas and the scallop Pecten maximus in France. Aquat. Living Resour. 12 (2), 121–130. doi: 10.1016/S0990-7440(99)80021-7
Robert R., Nicholas L. (2000). The effect of seawater flow and temperature on metamorphosis and post larval development in great scallop. Aquaculture Int. 8, 513–530. doi: 10.1023/A:1009274707986
Robins P. E., Neill S. P., Giménez L., Jenkins. , S. R., Malham S. (2013). Physical and biological controls on larval dispersal and connectivity in a highly energetic shelf sea. Limnology Oceanography 58 (2), 505–524. doi: 10.4319/lo.2013.58.2.0505
Robins P. E., Neill S. P., Giménez L. (2012). A numerical study of marine larval dispersal in the presence of an axial convergent front. Estuarine Coast. Shelf Sci. 100, 172–185. doi: 10.1016/j.ecss.2012.02.001
Scrope-Howe S., Jones D. A. (1986). The vertical distribution of zooplankton in the western Irish Sea. Estuarine Coast. Shelf Sci. 22 (6), 785–802. doi: 10.1016/0272-7714(86)90099-5
Shanks A. L., Grantham B. A., Carr M. H. (2003). Propagule dispersal distance and the size and spacing of marine reserves. Ecol. Appl. 13 (1), 159–169. doi: 10.1890/1051-0761(2003)013[0159:pddats]2.0.co;2
Shumway S. (1991). Scallops: Biology, Ecology and Aquaculture. Ed. Shumway S. (Amsterdam: Elsevier).
Swearer S. E., Caselle J. E., Lea D. W., Warner R. R. (1999). Larval retention and recruitment in an island population of a coral-reef fish. Nature 402, 799–802. doi: 10.1038/45533
Swearer S. E., Treml E. A., Shima J. S. (2019). ‘A review of biophysical models of marine larval dispersal’. Oceanography Mar. Biol, 1–32. doi: 10.1201/9780429026379-7
Tian R. C., Chen C., Stokesbury K. D.E., Rothschild B. J., Cowles G. W., Xu Q., et al. (2009). Modeling the connectivity between sea scallop populations in the Middle Atlantic Bight and over Georges Bank. Mar. Ecol. Prog. Ser. 380, 147–160. doi: 10.3354/meps07916
Tremblay M., Sinclair M. (1990). Diel vertical migration of sea scallop larvae Placopecten magellanicus in a shallow embayment. Mar. Ecol. Prog. Ser. 67, 19–25. doi: 10.3354/meps067019
Vera M., Maroso F., Wilmes S. B., Hermida M., Blanco A., Fernández C., et al. (2022). Genomic survey of edible cockle (Cerastoderma edule) in the Northeast Atlantic: A baseline for sustainable management of its wild resources. Evolutionary Appl. 15 (2), 262–285. doi: 10.1111/eva.13340
Ward S. L., Robins P. E., Owen A., Demmer J., Jenkins S. R. (2023). The importance of resolving nearshore currents in coastal dispersal models. Ocean Model. 183, 102181. doi: 10.1016/j.ocemod.2023.102181
White J. W., Rassweiler A., Samhouri J. F., Stier A. C., White C. (2014). Ecologists should not use statistical significance tests to interpret simulation model results. Oikos 123 (4), 385–388. doi: 10.1111/j.1600-0706.2013.01073.x
Keywords: scallop, fisheries, management, connectivity, retention, metapopulation, larvae
Citation: Close H, Lambert G, Robins P and Gimenez L (2024) Connectivity between populations of the scallop Pecten maximus in the Irish Sea and the implications for fisheries management. Front. Mar. Sci. 10:1274136. doi: 10.3389/fmars.2023.1274136
Received: 07 August 2023; Accepted: 28 November 2023;
Published: 03 January 2024.
Edited by:
Tangtian He, Hong Kong Polytechnic University, Hong Kong SAR, ChinaReviewed by:
Fabian J. Tapia, University of Concepcion, ChileCopyright © 2024 Close, Lambert, Robins and Gimenez. This is an open-access article distributed under the terms of the Creative Commons Attribution License (CC BY). The use, distribution or reproduction in other forums is permitted, provided the original author(s) and the copyright owner(s) are credited and that the original publication in this journal is cited, in accordance with accepted academic practice. No use, distribution or reproduction is permitted which does not comply with these terms.
*Correspondence: Hayden Close, aGF5ZGVuLmNsb3NlQGNlZmFzLmdvdi51aw==
Disclaimer: All claims expressed in this article are solely those of the authors and do not necessarily represent those of their affiliated organizations, or those of the publisher, the editors and the reviewers. Any product that may be evaluated in this article or claim that may be made by its manufacturer is not guaranteed or endorsed by the publisher.
Research integrity at Frontiers
Learn more about the work of our research integrity team to safeguard the quality of each article we publish.