 Dapeng Zou
 Jin Xie1
 Xiangmei Meng
 Jingchun Feng
 Guangming Kan
- 1Provincial Key Laboratory of Advanced Manufacturing Technology for Marine Energy Equipment, Guangdong University of Technology, Guangzhou, Guangdong, China
- 2Key Laboratory of Marine Geology and Metallogeny, First Institute of Oceanography, Ministry of Natural Resources (MNR), Qingdao, Shandong, China
- 3Key Laboratory of Seafloor Acoustic Detection Technology and Application, Qingdao (Preparatory), Qingdao, Shandong, China
- 4School of Ecology, Environment and Resources, Guangdong University of Technology, Guangzhou, China
- 5Research Centre of Ecology & Environment for Coastal Area and Deep Sea, Southern Marine Science and Engineering Guangdong Laboratory, Guangzhou, China
Numerous factors influence the acoustic characteristics of seafloor sediments, necessitating a comprehensive study that combines theoretical analysis, laboratory measurements and in situ measurements to support acoustic prediction and inversion. In this study, a porosity-based effective density fluid model (P-EDFM) is established to analyze the variation of acoustic properties with the porosity of seafloor sediments. On the biases of P-EDFM, the attribute of measured sound velocity and acoustic attenuation coefficient of seafloor sediment in Series 9B of the SAX99 was well interpreted within the frequency range of 25-100 kHz. The in situ measured sound velocity ratio was well predicated by the P-EDFM in the East China Sea and Yellow Sea. It reveals that the in situ sound velocity ratio decreases with increasing bulk porosity and with decreasing bulk density. The scattering and differences in the acoustic attenuation coefficient measured in situ in seafloor sediments are found to be greater than those observed for sound velocity. After considering the influence of temperature in the P-EDFM, the prediction of in situ sound velocity aligns well with the measured dataset. While, the acoustic attenuation coefficient exhibits an inflection point, increasing initially and then decreasing with changes in porosity, similar to the observed pattern in Hamilton’s observation and estimation. By incorporating temperature and frequency influences, the in situ measurements of sound velocity of seafloor sediments are corrected into laboratory sound velocities by using the P-EDFM. The result reveals the sediment samples’ sampling and transmitting process has a much greater impact on the sound velocity of sandy sediment in the East China Sea compared to muddy sediment. Overall, P-EDFM can predict the in situ sound velocity and sound attenuation coefficient under different temperatures and frequencies, with a lower prediction error for sound velocity compared to sound attenuation coefficient.
1 Introduction
The sound velocity and acoustic attenuation coefficient of seafloor sediments are crucial parameters in the fields of underwater acoustics, geo-acoustics, and sedimentary acoustics (Kim et al., 2018a; Buckingham, 2020; Yang and Jackson, 2020). They determine wave speed, acoustic impedance, path and distance of sound wave propagation. They are closely related to the sediment physical and mechanical properties, as well as to the measurement methods and environmental conditions. Currently, three primary methods are employed for obtaining the acoustic properties of seafloor sediments: geoacoustic inversion, laboratory acoustic measurement, and in situ acoustic measurement (Tao et al., 2006; Jackson and Richardson, 2007; Liu et al., 2019; Zou et al., 2022). Due to these methods differing in terms of measurement technology, frequency and environmental conditions, challenges arise on how to effectively apply different methods, diverse measurement datasets, and various fitting empirical equations from different sea areas. As in situ acoustic measurement technology improves, a series of in situ measurements were conducted within the frequency range of 1 kHz to 50 kHz (Kim et al., 2018b; Megan et al., 2019; Li et al., 2020; Wang et al., 2020; Wang et al., 2023) to establish a connection between high-frequency laboratory acoustic measurements ranging from 30 kHz to 1 MHz (Henfer et al., 2009; Zimmer et al., 2010; Wang et al., 2018b; Tang et al., 2019) and low-frequency geoacoustic inversion ranging from 0.1 Hz to 1 kHz (Ballard et al., 2018; Li et al., 2019; Belcourt et al., 2020). In situ acoustic measurement causes significantly less disturbance to seafloor sediments than laboratory acoustic measurement but with the complex process and long operation period. Furthermore, to obtain the physical characteristics of seafloor sediment and acoustic characteristics across a wider frequency range, it is necessary to collect sediment samples and transport them to the laboratory for measurement and analysis (Buckingham and Richardson, 2002; Kim et al., 2018c), conduct controlled environmental state measurement research (Kan et al., 2019; Zhou et al., 2019; Zou et al., 2021), and perform acoustic characteristic measurements at various frequencies (Zimmer et al., 2010; Yu et al., 2017; Wang et al., 2018b). The aforementioned research emphasizes the significance of factors such as physical properties of seafloor sediments, measurement frequency and measurement environmental state in understanding the differences in acoustic properties of seafloor sediments. These factors play a crucial role in comparing, applying, and enhancing the three marine acoustic detection methods.
Considering the influence of numerous factors on the acoustic characteristics of seafloor sediments, there is a need to minimize the impact of measurement methods by promoting in situ acoustic measurements. In situ measurements are highly valuable, but they still have limitations when it comes to complex marine environments, deep-layered detection and diverse wave propagation states. Laboratory measurements, on the other hand, are widely employed to conduct simultaneous physical and acoustic measurements (Hou et al., 2015; Wang et al., 2023), especially when precise control over real seafloor sediment samples is required. However, even with state-controlled measurement techniques, laboratory measurements alone do not provide a complete understanding of the different acoustic characteristics of seafloor sediments. By combining theoretical model calculations and analysis with limited in situ acoustic measurements and laboratory acoustic measurements, it becomes possible to obtain the general regularity and the specific differences of acoustic characteristics of various seafloor sediments across broad seafloor areas. Among of the various theories and models available (Jackson and Richardson, 2007; Yu et al., 2017; Wang et al., 2018b), the grain shearing model (GSM) (Buckingham, 1998) and the effective density fluid model (EDFM) (Williams, 2001) are widely used for analyzing seafloor sediment acoustics. The GSM effectively explains sound speed dispersion and attenuation coefficients of seafloor sediments observed in the SAX99 (Buckingham and Richardson, 2002). It also reveals the relationships between porosity and the physical/acoustic properties of seafloor sediments (Buckingham, 2005). However, it is seldom employed to analyze the influencing factors of sediment physical parameters and environmental state. On the other hand, the EDFM can well explain dispersion and attenuation characteristics observed in the SAX99 (Williams et al., 2002) and at Jiaozhou Bay (Wang et al., 2018b). It can also well reveal the influence of the environmental sates on the sound velocity (Zou et al., 2015; Kan et al., 2019), as well as the relationship between sound velocity and porosity (Zou et al., 2018). However, even as a simplified model based on the Biot theory (Biot, 1956a, 1956b), the EDFM still involves numerous parameters and challenges associated with difficult-to-measure parameters (Williams et al., 2002; Jackson and Richardson, 2007). Schock (2005) proposed an approach based on porosity and average particle size to express complex parameters like tortuosity factor, permeability, and pore size, aiming to invert the acoustic physical properties of seafloor sediments using the Biot model and Chirp sonar measurement reflection loss. Since several parameters in the theoretical model are related to the representative physical parameter of porosity, expressing challenging-to-measure parameters in terms of porosity can reduce measurement errors and value-selected errors. This approach leads to simplified model calculation relationships.
This research aims to elucidate the mechanisms, changes and influences on the acoustic characteristics of seafloor sediments in their true in situ state. To achieve this, a porosity-based effective density fluid model (P-EDFM) is established to investigate the influence of in situ acoustic characteristics of seafloor sediments and their associated influencing factors. Using P-EDFM, the impact of changes in porosity and density on the in situ sound velocity ratio of the seafloor sediment is analyzed, along with their relationships. Furthermore, the relationships between in situ sound velocity, acoustic attenuation coefficient, and porosity in different sea areas are explored. The study also addresses the influence of temperature and frequency dispersion on sound velocity and proposes a correction method to investigate the disparities between the in situ acoustic measurement and the laboratory acoustic measurement. The findings of this research provide valuable support for acoustic prediction, geoacoustic inversion, and underwater detection.
2 Principle of P-EDFM
EDFM adopts effective elastic modulus Keff and effective density ρeff establishes the expression of sound velocity (m/s) and sound attenuation coefficient (dB/m) as follows:
Where, η is the viscosity of the pore water, k is its permeability, and α is the tortuosity. Kg and Kw are the bulk modulus of solid grains and the bulk modulus of pore water, respectively, and n is the bulk porosity of the sediment. ρw, ρg, and ρs are the bulk densities of the pore water, solid grains, and sediment, respectively, . i is the imaginary part factor of the complex number, Re[] and Im[] represents the real part and imaginary part of the measurement result. F is a dynamic viscosity correction factor (Biot, 1956b; Williams, 2001), which is related to the detected angular frequency ω, pore size a, porosity n, pore water density ρw.
The relationship between tortuosity and porosity (Boudreau, 1996) is as follows,
The permeability expression (6a) is the correction of Hovem and Ingram formula by Schock (2005). According to the previous model analysis and data process, here the correction formula for the permeability can be written as Eq. (6b).
Based on the linearization transformation of the average particle diameter d (unit: mm) and the porosity n of Schock (2005), an E1 formula can be obtained as
The EDFM considering the porosity relationships of equations (5)-(7) is defined as porosity based EDFM (P-EDFM). Compared with the 9-parameter EDFM, P-EDFM has six parameters, the reference value of particle bulk modulus Kg is 36GPa with a referred range of 0.7~57GPa (Williams et al., 2002; Jackson and Richardson, 2007). Porosity n and the density of solid particles of seafloor sediment ρg can be directly measured. The density ρw, viscosity η, and the bulk elastic modulus of pore seawater Kw can be calculated directly by applying the seawater state equation formula (Jackson and Richardson, 2007) using the in situ measured environmental state parameters.
The analysis of the measurement data of seafloor sediment in Series 9B of SAX99 was performed using the porosity value of 0.37 and a particle volume elastic modulus of 36 GPa, as provided by Buckingham (2002). The laboratory standard measurement temperature conditions (23°C, 1 atm.) were considered, and the P-EDFM was employed for calculations. Equations (6a) and (6b) were compared, and Figure 1 demonstrates their ability to simultaneously explain the frequency dispersion characteristics of sound velocity within the range of 25-100 kHz and the relationships between the acoustic attenuation coefficient and frequency for the sandy seafloor sediment in Series 9B. However, certain calculation errors were still present in both sound velocity and acoustic attenuation coefficient. To account for the measured porosity ranges reported in the same experimental area of SAX99 (0.359-0.387, 0.34-0.48, and 0.41-0.52 for different measurement methods) (Williams et al., 2002), the lower limit value of 0.34 was selected for comparison, as shown in Figure 1. This selection reduced the errors between the model-calculated sound velocity and acoustic attenuation coefficient and the measured data, resulting in a higher precision in explaining the measured acoustic characteristic in Series 9B. Eq. (6b) provided higher precision compared to Eq. (6a). Consequently, the P-EDFM successfully explain the sound velocity and attenuation coefficient of Series 9B in SAX99 using 6 parameters, supporting the validity of acoustic prediction and inversion based on theoretical models derived from Biot Theory.
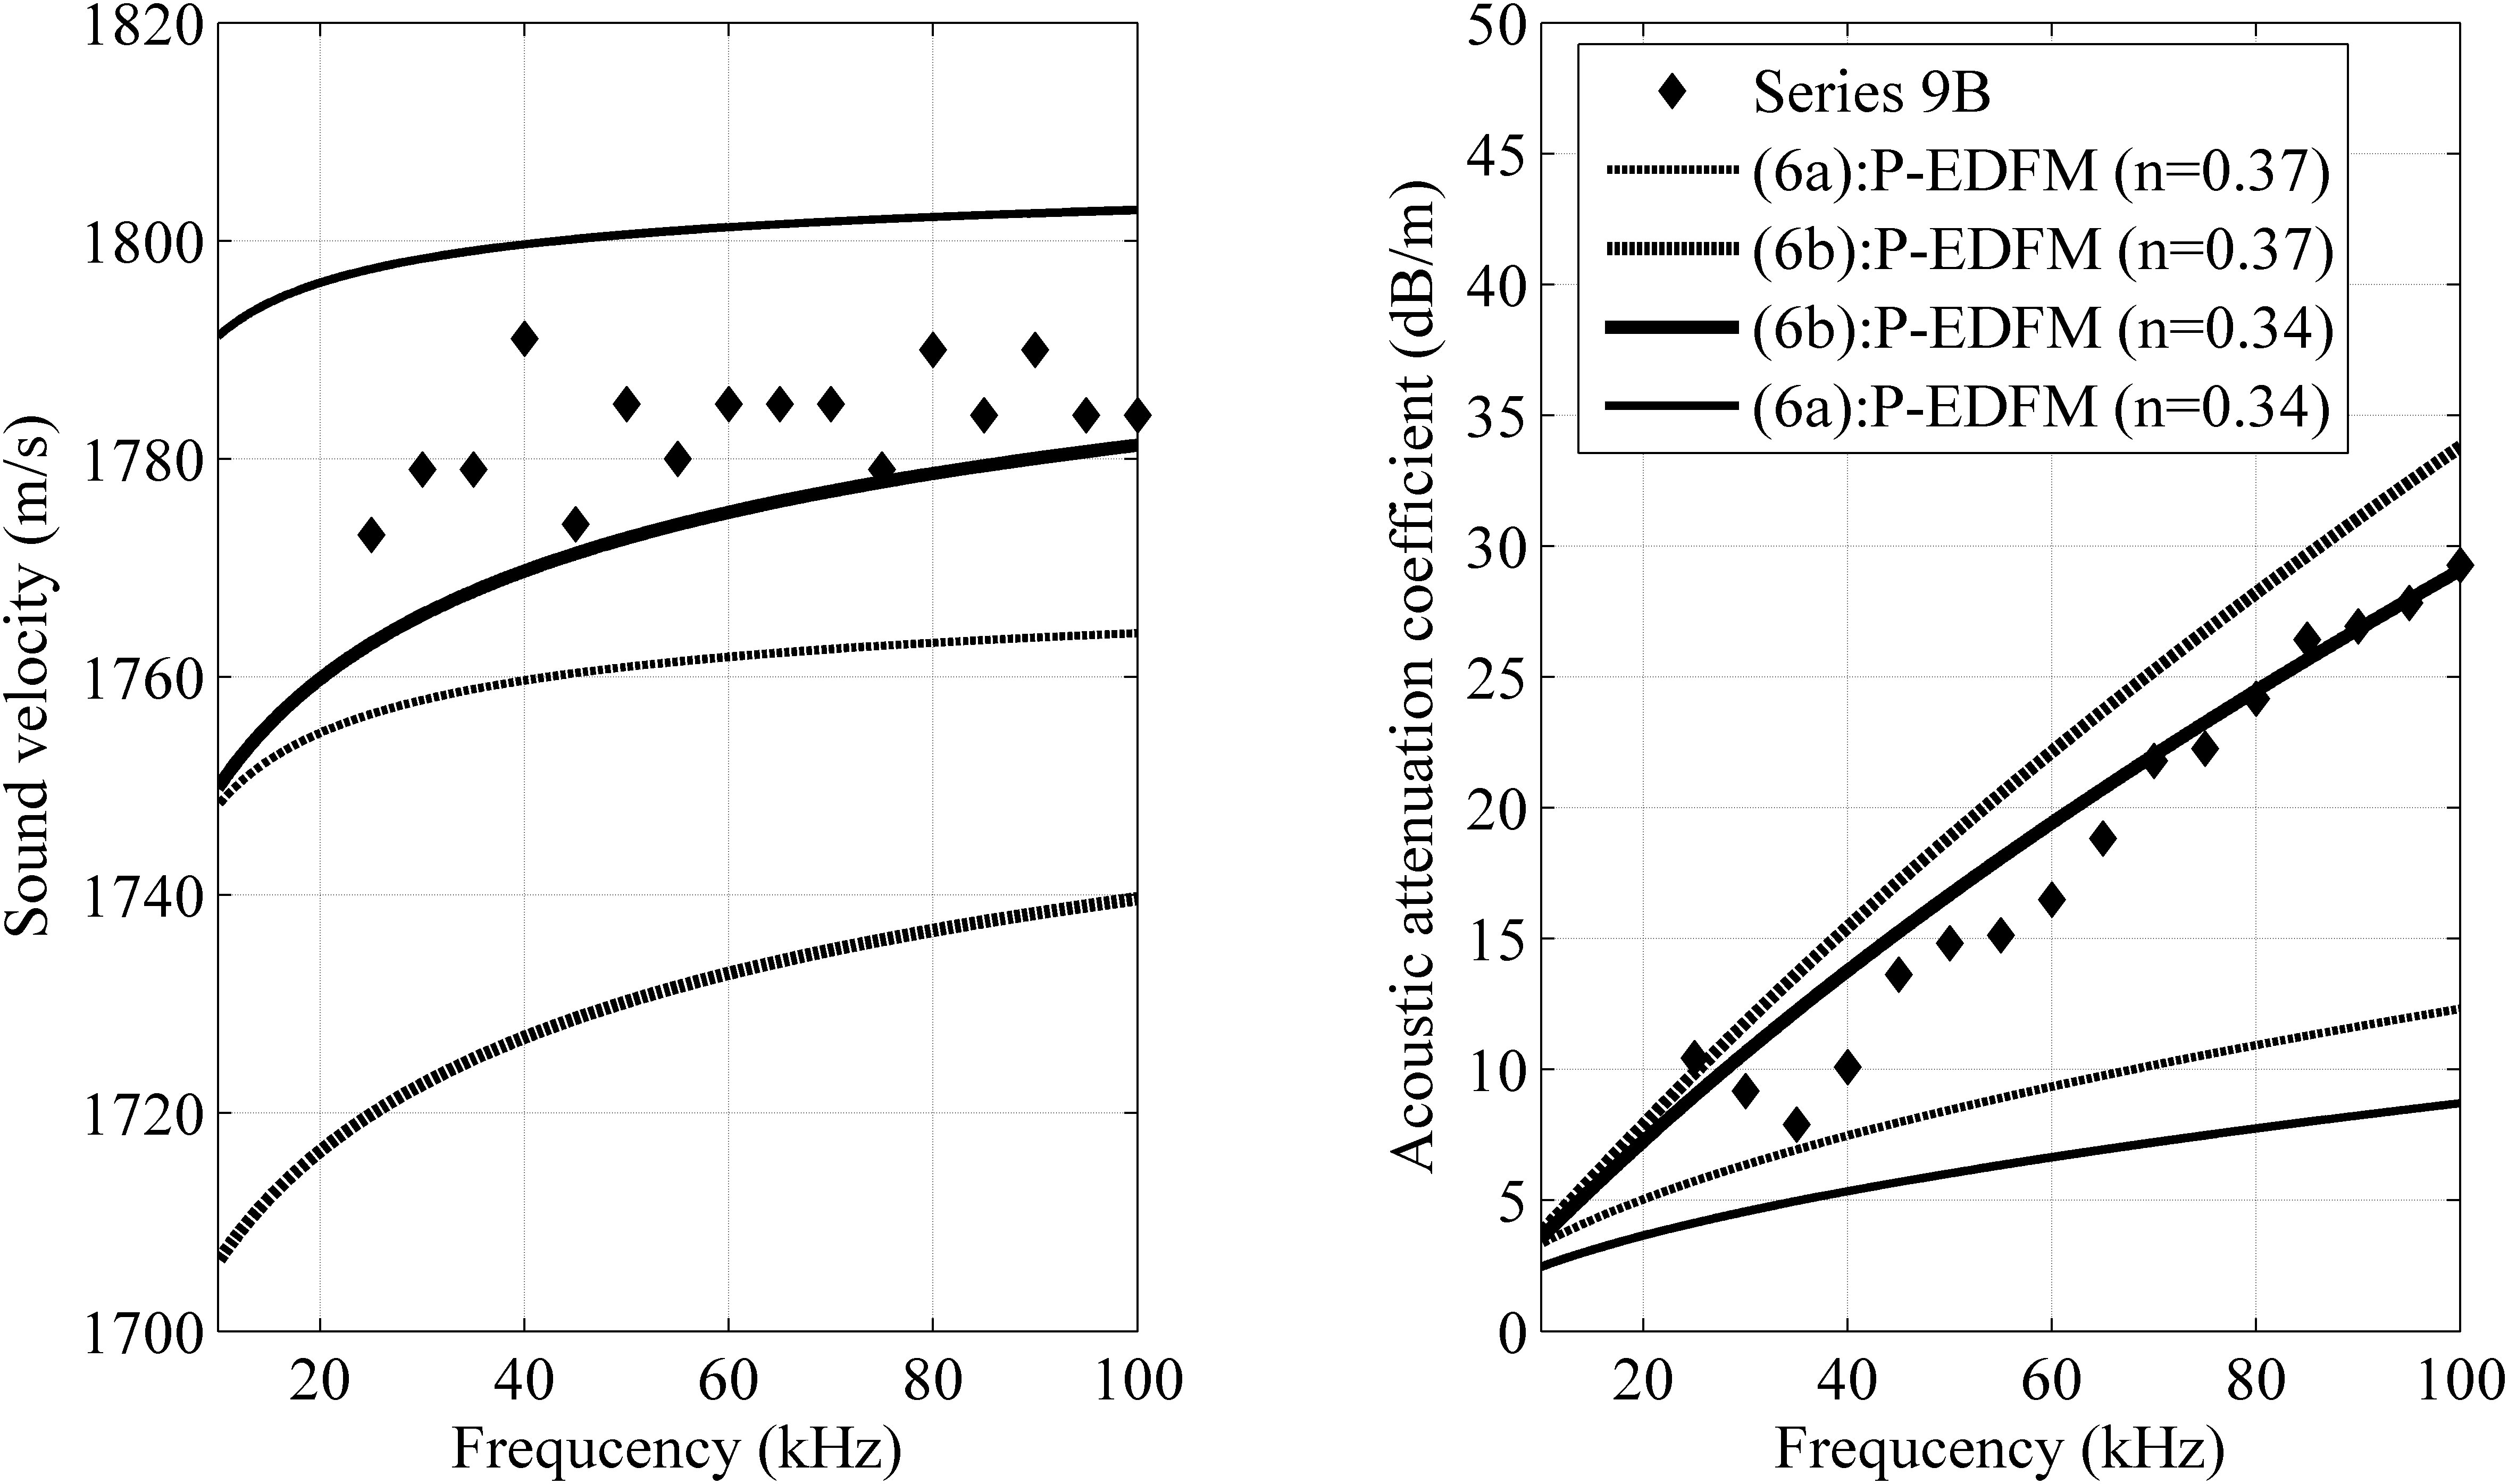
Figure 1 The acoustic characteristics of Series 9B in SAX99 (Buckingham and Richardson, 2002) based on P-EDFM.
3 Relationships between in situ sound velocity ratio and porosity, density
The in situ sound speed at 17 representative sites was measured in the East China Sea (ECS) during spring voyage in 2021, funded by the National Natural Science Foundation of China Open Research Cruise (Cruise No. NORC2021-02+NORC2021-301). The seafloor sediment samples include various sediment types, such as sand, sandy silt, silt, clayey silt, and silty clay. The in situ sound speed ratio and physical parameters are listed in Table 1.The depth of the ECS generally does not exceed 100 m. The temperature of the bottom seawater varies at different depths and during different seasons. For instance, the temperature at a depth of 60 m is approximately 3.6°C higher compared to that at 90 m. And the bottom water temperature in autumn is around 4.7°C higher than that in spring. Regarding the in situ and laboratory measurements of seafloor sediments in the ECS, environmental factors primarily change in temperature, with the pressure change being neglected (considering 1 MPa for 100 m, which has a minimal impact of about 1‰ on the sound velocity of seawater and seafloor sediments). These sediment types exhibit porosity ranging from 0.384 to 0.692, and sound velocity ratio ranging from 0.974 to 1.070 (Wang et al., 2023). These values align with the measurement datasets recorded on the continental shelf and continental slope of the North Pacific Ocean (Hamilton, 1971), the datasets in the South China Sea (SCS) (Wang et al., 2018a; Liu et al., 2019) and the datasets in the Yellow Sea (YS) (Kan et al., 2011; Liu et al., 2019). By utilizing the sound velocity ratio to analyze the relationships between acoustic and physical characteristics of different seafloor sediment types, the influence of in situ temperature variations at different measurement stations can be mitigated (Kan et al., 2019; Zou et al., 2021). Moreover, the wide ranges in porosity, density, and sand content in Table 1 also provide indicators of the scattering and complexity of seafloor sediment acoustic properties. Regression fitting reveals the following empirical relationships between the in situ sound velocity ratio Rv and porosity n and density ρs in the ECS (Wang et al., 2023) as follows:
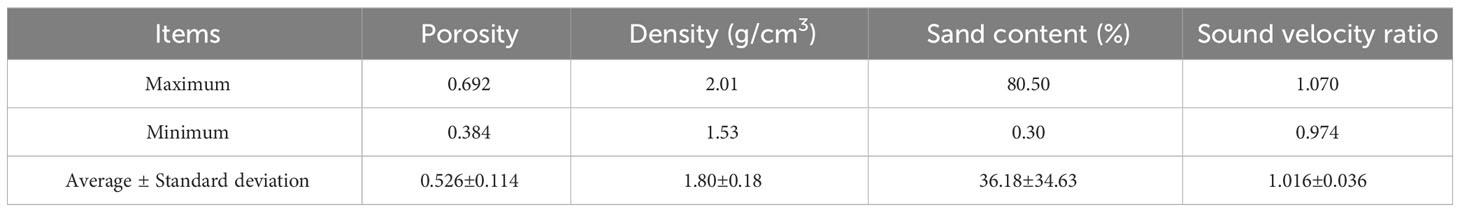
Table 1 Characteristics of 17 in situ acoustic measurement samples of seafloor sediments in the ECS.
The relationship between the average particle diameter d (unit: mm) and porosity n of the ECS samples is expressed as Eq. (10). The P-EDFM with Eq. (10) being applied is called ED group P-EDFM. The E1 group P-EDM with Eq. (7) is used as a comparison.
Based on the results illustrated in Figure 2, the calculation curve of the ED group P-EDFM exhibits high consistency with the measured values in the ECS and closely aligns with the empirical relationships expressed by Eq. (8). Although the E1 group P-EDFM does not exhibit as high interpretation accuracy as the ED group, it effectively explains the variations of in situ acoustic values with respect to porosity. The in situ dataset in the YS is taken as a comparison, as shown in Figure 2. The relationships between the in situ sound velocity ratio and porosity in the ECS and YS slightly differ, and generally conform to the rule that the in situ sound velocity ratio decreases with increasing porosity. Porosity is a comprehensive parameter that plays a crucial role in characterizing the physical and acoustic characteristics of seafloor sediments. Density, which is closely related to porosity, is another important parameter for describing the physical and acoustic characteristics of seafloor sediments. The relationship between density and the in situ sound velocity ratio in the two sea areas exhibits similarity. P-EDFM also can explain the trend of the in situ sound velocity ratio increasing with increasing density. Additionally, the interpretation accuracy of the sound velocity ratio and density obtained by ED group P-EDFM closely matches the empirical relationships expressed by Eq. (10), surpassing the calculation curve of E1 group P-EDFM, as depicted in Figure 2.
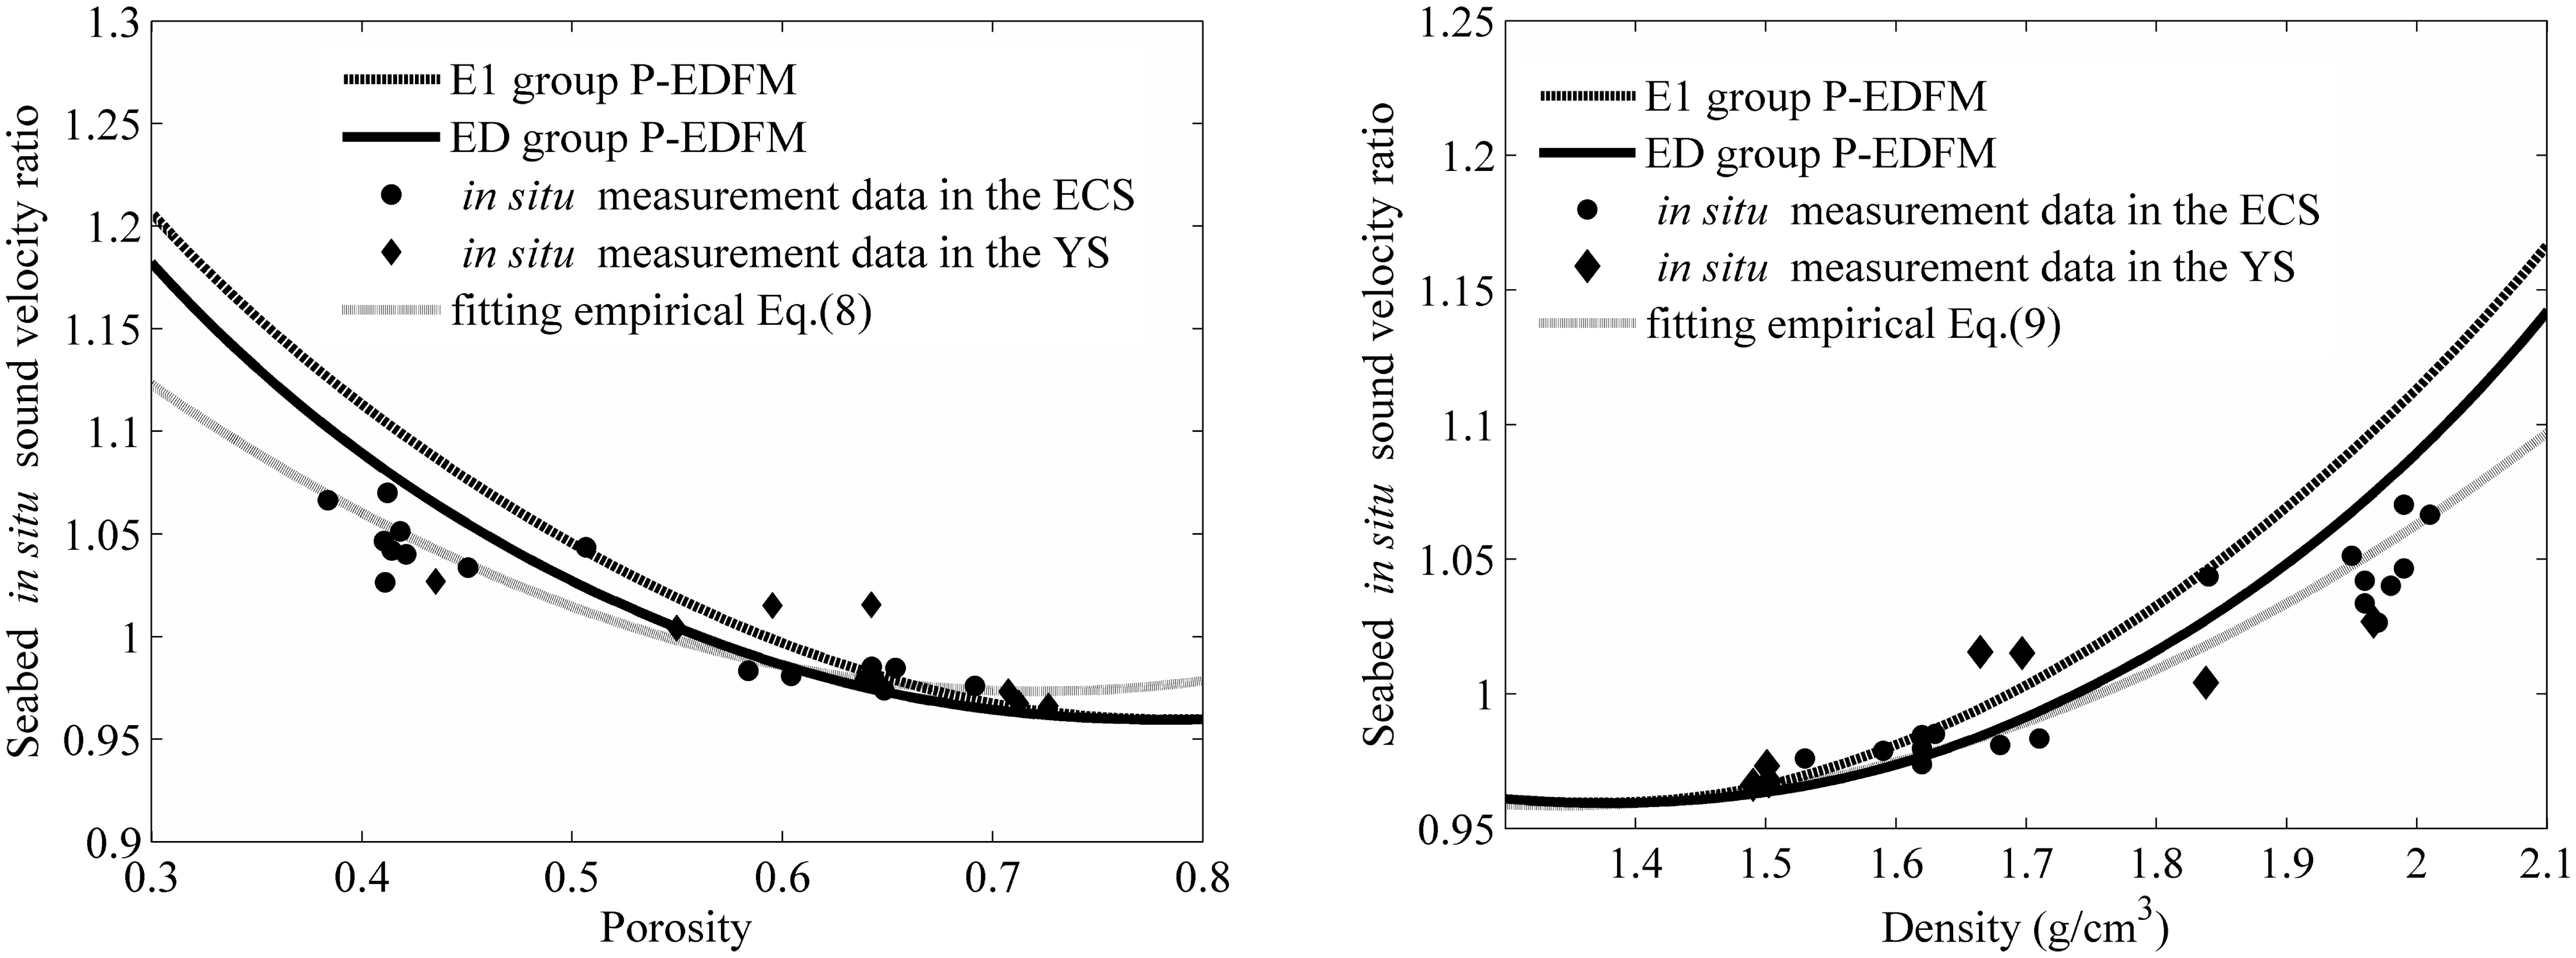
Figure 2 Relationships between in situ sound velocity ratio and porosity/density analyzed by P-EDFM.
The above observations indicate that the physical and acoustic characteristics of seafloor sediments exhibit both similarities and regularities across different sea areas, albeit with minor numerical differences. Through the application of the P-EDFM with the ED group’s fitted empirical equation, the interpretation accuracy of the ECS’s measurement data surpasses that of the E1 group, further confirming the overall similarity exists in the empirical relationships of physical and acoustic characteristics of seafloor sediments, but numerical differences exist among different sea areas. Therefore, in the application, on the one hand, the empirical relationships should be applied with the fitting formula obtained from the domestic sea area as far as possible; on the other hand, this difference also reveals the slight variations and scattering in the seafloor sediment characteristics of different sea areas.
Based on the analysis provided, it is evident that P-EDFM can effectively explain the variation of sound velocity and porosity measured in the laboratory, as well as the relationships between sound velocity ratio and porosity and density measured in situ. However, porosity, as a macro parameter, can only partially represent the general trends and common differences in seafloor sediments, and it may not fully capture the individual differences among sediment samples. The heterogeneity and anisotropy of factors such as pore size, pore channel connectivity, particle size, and particle shape within individual samples can lead to differences in density, elastic modulus, and sound transmission losses along the actual acoustic wave propagation path. These variations contribute to the disparities and scattering observed in the acoustic characteristics among different seafloor sediment samples. The scattering of the in situ sound velocity ratio in different sea areas can be accurately predicted by adjusting and optimizing parameters such as permeability, tortuosity factor, or pore size in the EDFM. However, P-EDFM limits the adjustment of these parameters and does not allow for arbitrary optimization. Although it may be challenging to accurately explain the specific differences among each seafloor sediment sample, P-EDFM can be applied to describe the overall trends of the porosity/density and acoustic characteristics of seafloor sediments, eliminating the ambiguity and subjectivity associated with manually adjusting or optimizing. Additionally, the establishment and application of empirical relationships usually should be restricted with the influence of environmental state and measurement frequency both in laboratory and in situ. Compared with the empirical relationships, the prediction and calculation of P-EDFM consider the effects of environmental conditions and measurement frequency and eliminate their influences to some extent.
4 In situ acoustic characteristics of seafloor sediments and its influencing factors
4.1 In situ acoustic characteristic analysis based on P-EDFM
Physical parameters, such as porosity and density of seafloor sediments, are typically obtained in laboratory conditions at room temperature. However, variations in seasons and geographical locations can introduce temperature differences in these physical parameters. To account for this, measurements are often standardized or assumed to be at 23°C. In situ measurements of seafloor sediment in the YS and ECS typically utilize similar methods and are conducted at a main frequency of 30-33 kHz (Liu et al., 2019) using similar methods. The dataset for in situ measurements reveals that the temperature of bottom seawater ranges from 8.5-17.9°C. Figure 3 illustrates the relationships between porosity and sound velocity and attenuation at different in situ temperatures. This analysis takes into account the impact of temperature, which is a significant factor to consider when comparing results obtained in different seasons and at various seafloor depths. Currently, there is no effective method to correct for the temperature effect on the sound attenuation coefficient, as the velocity ratio correction method is used specifically to address the impact on sound velocity (Zou et al., 2021).
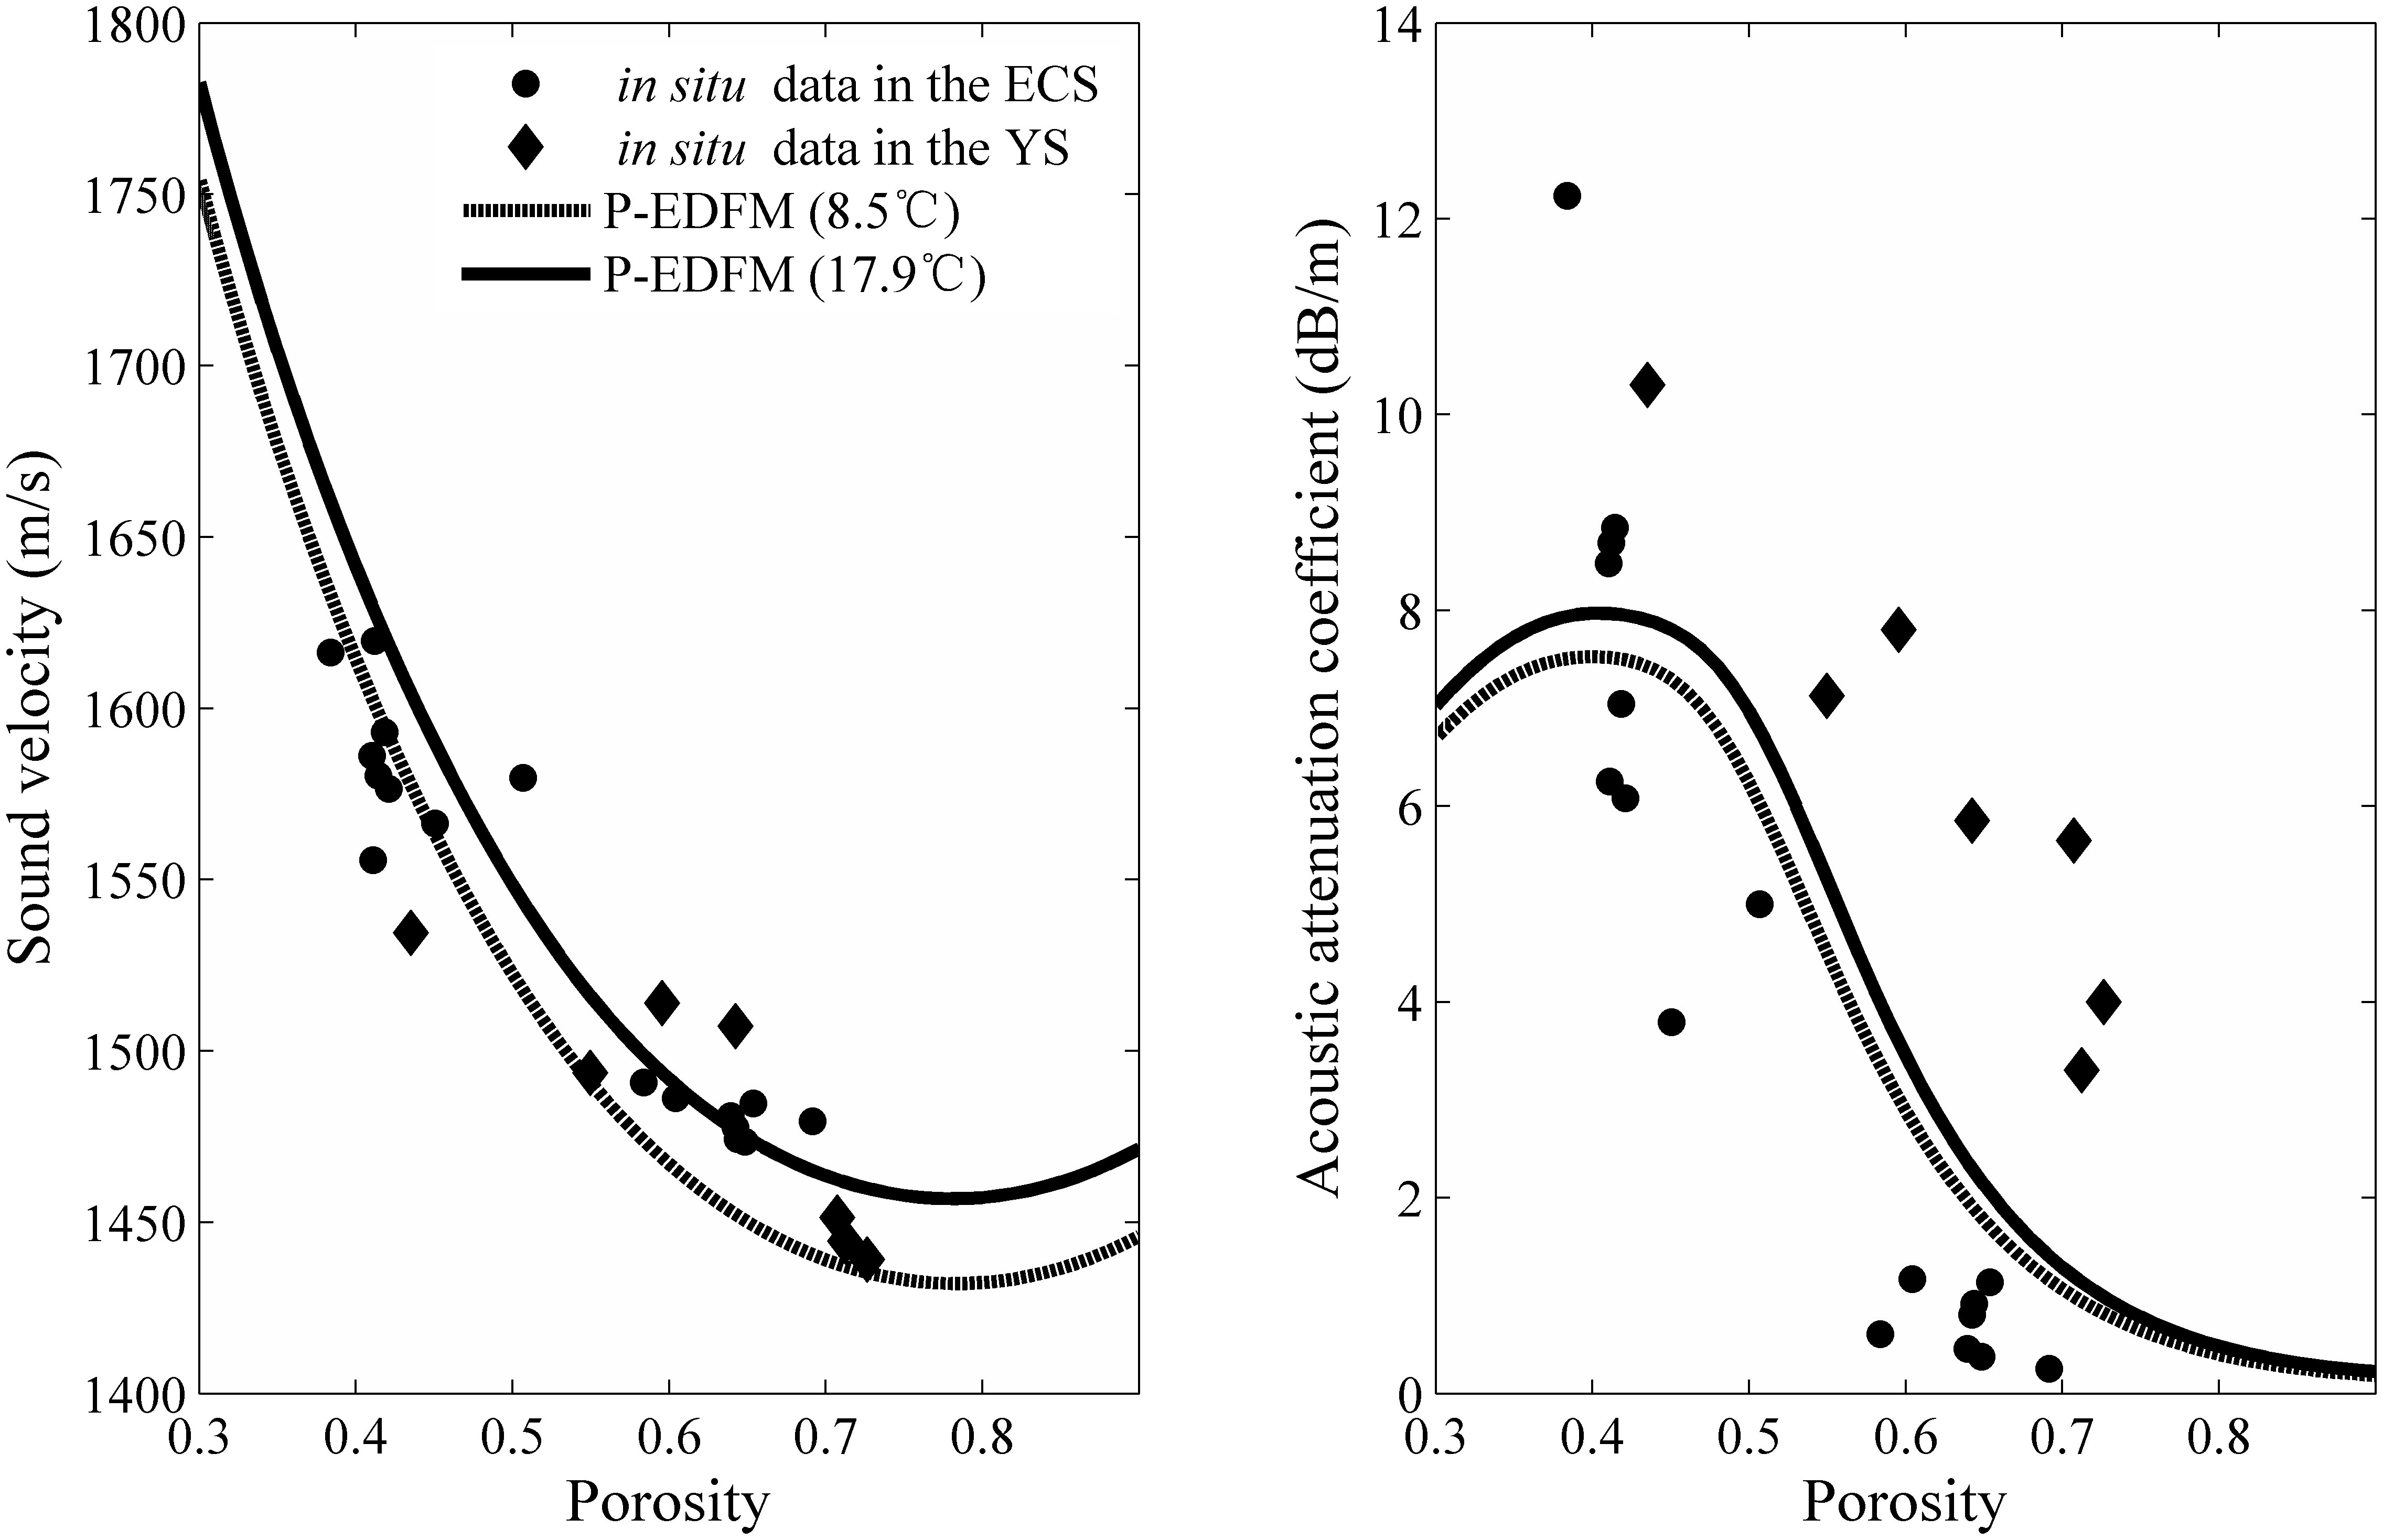
Figure 3 Calculation of the relationships between in situ sound velocity/acoustic attenuation coefficient and porosity of seafloor sediment based on P-EDFM within in situ temperature range.
In the in situ acoustic measurements conducted in the YS and ECS, the temperatures were 10.00±0.91°C and 16.96±1.06°C, respectively. The YS exhibited a lower average temperature and a smaller temperature scattering. There was a slight difference and small scattering in the in situ sound velocity data obtained from the two sea areas, with 0.095±0.026 in the YS and 1.016±0.036 in the ECS. But there were observed significant differences and large scattering in the in situ sound attenuation coefficient with 6.29±2.37 dB/m in the YS and 4.24±3.87 dB/m in the ECS. For sediments with the same porosity, the sound attenuation coefficient of sediments was generally higher in the YS compared to the ECS.
The influences of different in situ temperature and its range were taken into account of the actual in situ measurement data in the two sea areas in the ED group P-EDFM, as shown in Figure 3. Within the temperature range, the in situ sound velocity exhibits good conformity in measurement with the P-EDFM prediction, while the interpretation of the in situ acoustic attenuation coefficient varies significantly. An inflection point is observed at porosity of approximately 0.45, which aligns with previous observations and estimations made by Hamilton (1980) and Liu et al. (2019). While this analysis offers theoretical model support for the in situ measurement dataset, it does not effectively explain the scattering characteristics of the acoustic attenuation coefficient for porosities around 0.4, which are 10dB/m larger than the theoretical prediction. The scattering and measurement error of the acoustic attenuation coefficient may be larger than those of the sound velocity of seafloor sediments. This highlights the need for more comprehensive discussions and verifications regarding measurement accuracy and the factors influencing acoustic attenuation. Therefore, considering environmental factors, conducting more extensive and in-depth measurements of the acoustic attenuation coefficient will yield more comprehensive datasets. These data will help to clarify the in situ acoustic attenuation characteristics of seafloor sediments and test the applicability of P-EDFM.
4.2 Difference of sound velocity characteristics between in situ measurement and laboratory measurement
During the spring survey in the ECS, laboratory measurements were conducted on 17 samples to determine the sound velocity following the in situ measurement. As shown in Figure 4, the measured sound velocity in the laboratory was found to be higher than the in situ sound velocity. Among the 17 samples, the absolute difference between the laboratory and in situ sound velocities was much larger for the 9 sandy samples compared to the other 8 muddy samples (ie. silty and clayey sediments). The original in situ measurements at each station in the ECS had similar depths and temperatures, with an average in situ measurement temperature of 16.96±1.06°C and a measurement frequency of 33 kHz. In the laboratory, the collected samples were measured at a temperature of 22.0°C and a frequency of 100 kHz. As mentioned previously, the influence of pressure factors can be disregarded due to the shallow water depth. Therefore, apart from the disturbances caused by transitioning from the in situ to the laboratory measurements, differences in temperature and frequency also contribute to the influence of dispersion, temperature effect, and sample disturbance on the physical and acoustic properties of seafloor sediments.
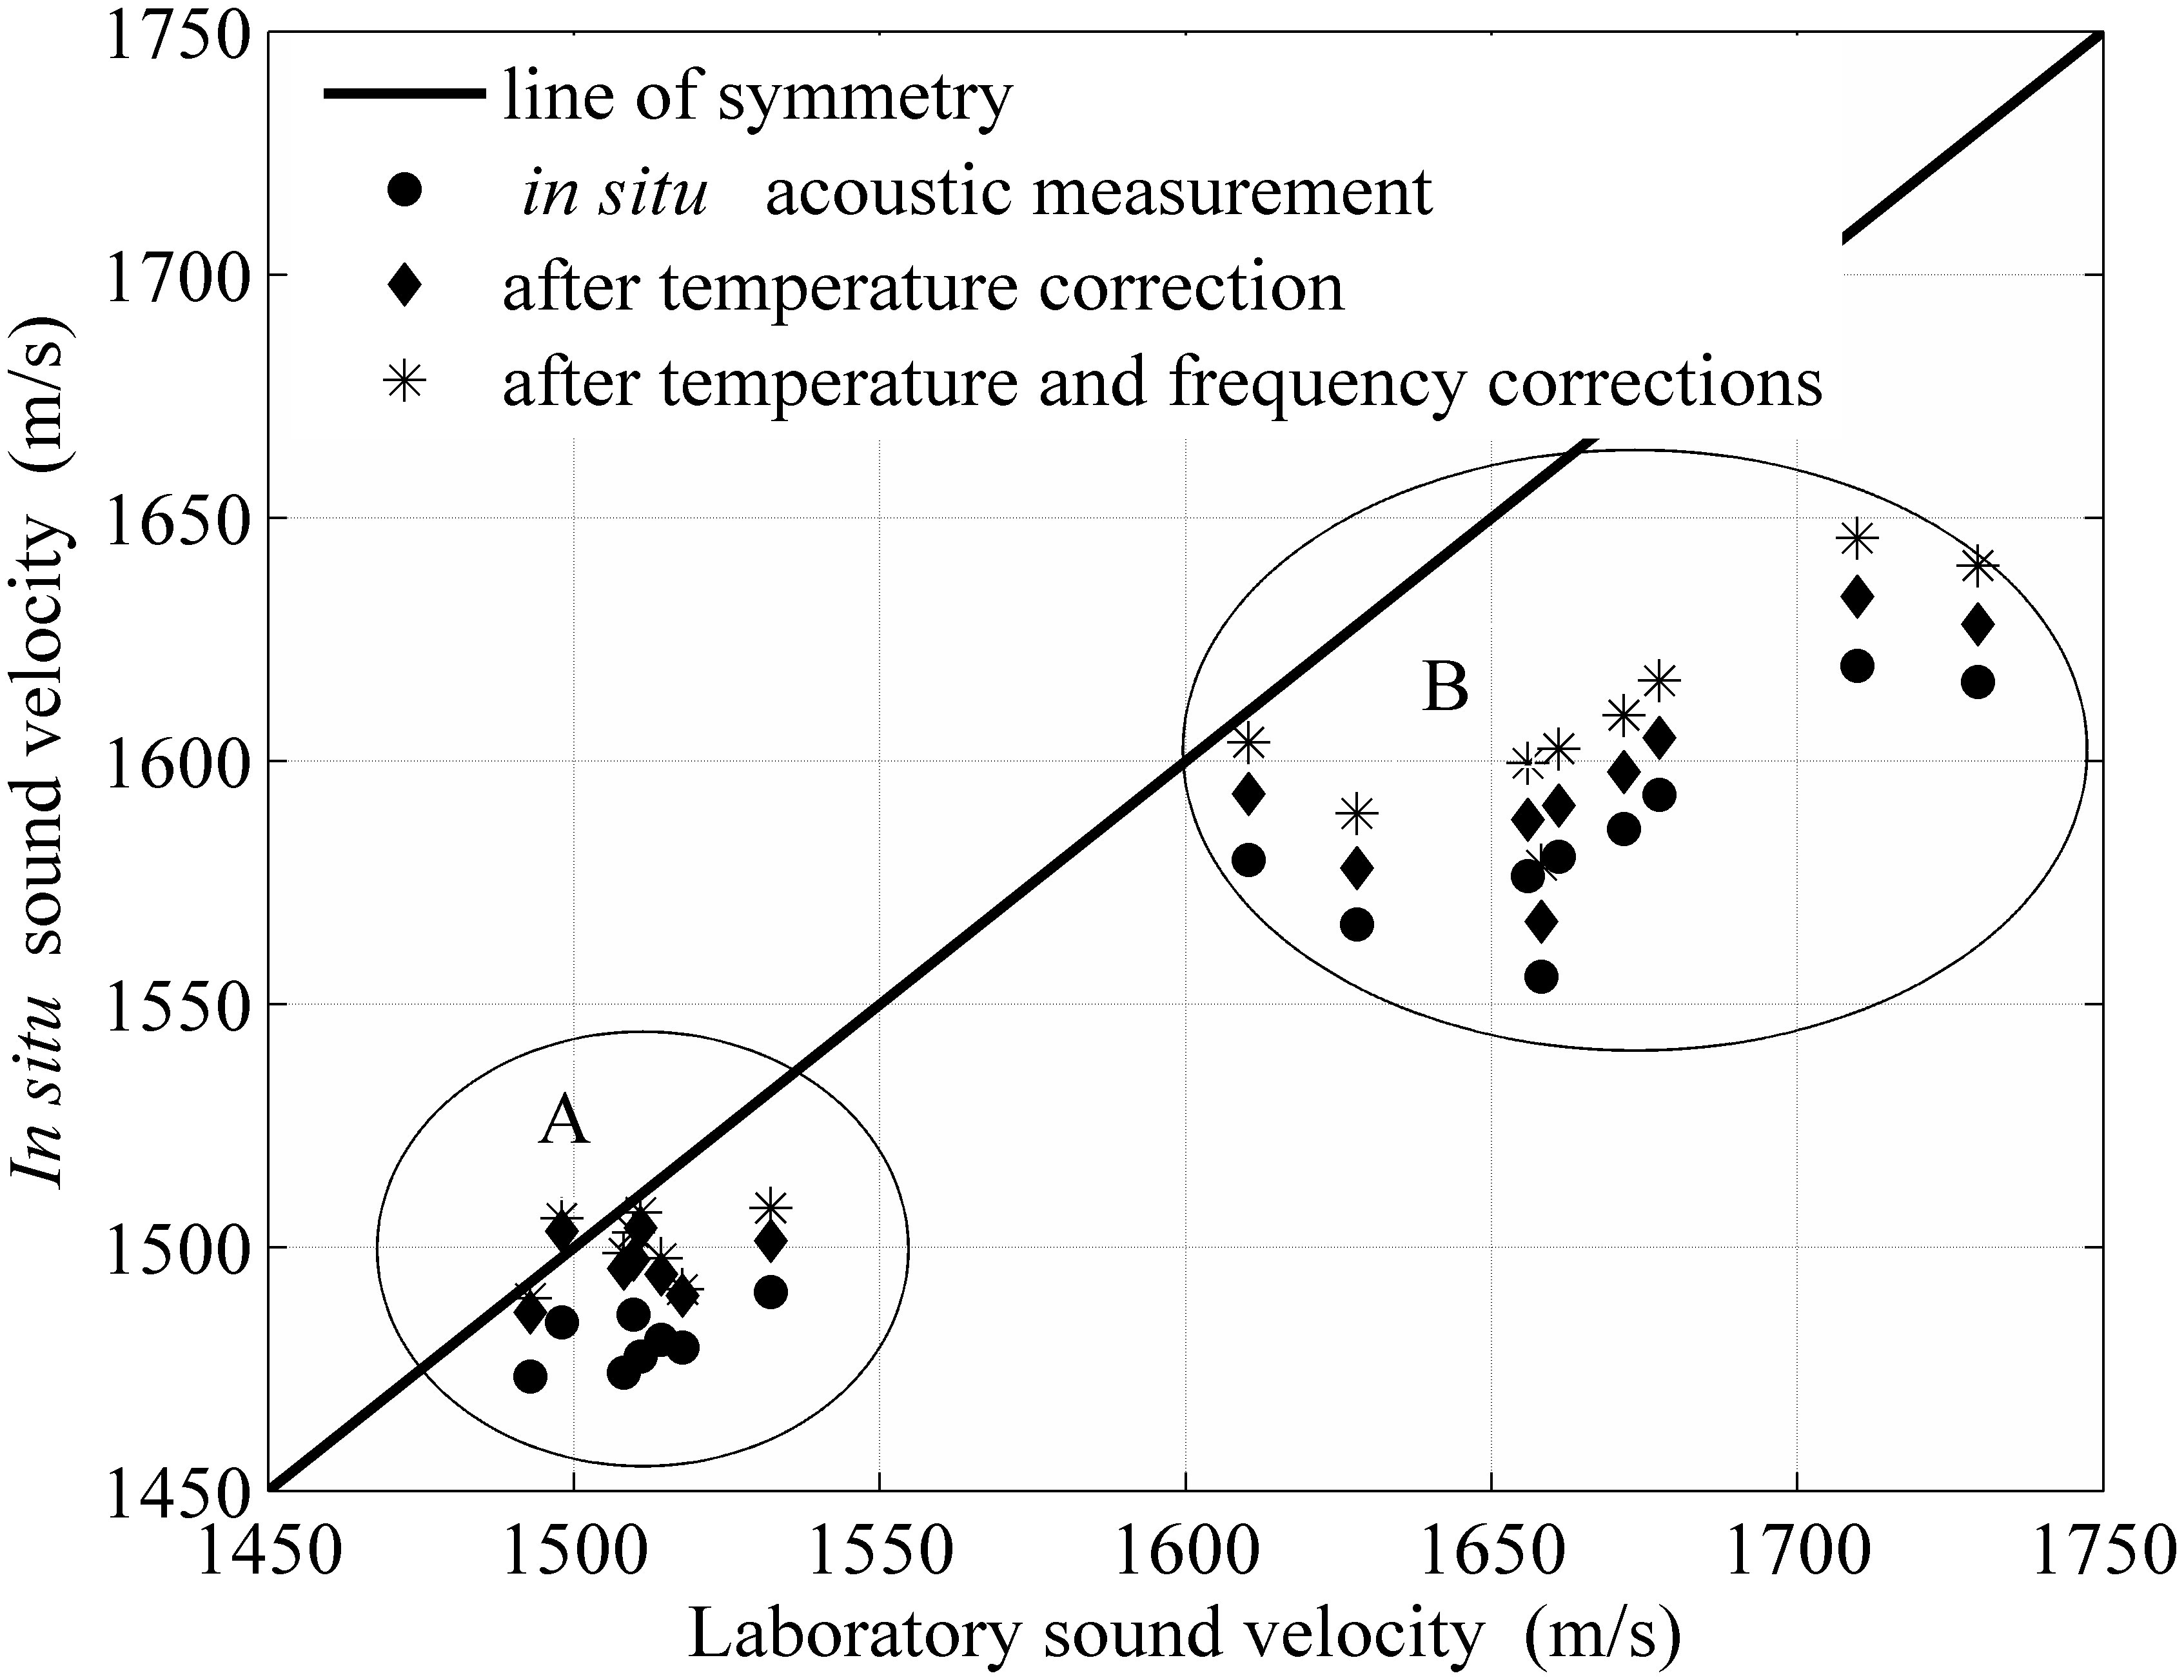
Figure 4 Comparison of sound velocity measured in situ and in laboratory before and after temperature correction and frequency correction.
A fixed sound velocity ratio correction method is employed to adjust the in situ temperature sate to the laboratory temperature state (Kan et al., 2019; Zou et al., 2021). The temperature-corrected in situ sound velocity values, compared with the laboratory-measured sound velocities, are presented in Figure 4. Even the temperature correction eliminates the influence of temperature differences between the seafloor in situ and laboratory measurements, significant differences still exist in the original measurements of sandy seafloor sediment samples.
Due to lacking measured values of sound velocity variations at different frequencies in the same state, theoretical calculations are used to obtain the theoretical sound velocity ratio, which is then applied to frequency correction. Only general regularities are examined, without conducting specific correction analyses for each sample. Each porosity of the 17 samples is inputted into the P-EDFM to obtain the theoretical sound velocities at 100 kHz and 33 kHz respectively. The theoretical sound velocity ratio, R ft, is then obtained, based on that all the original in situ measurement values are corrected to the laboratory measurement values using the following formula:
Where, R ft is the theoretical sound velocity ratio at two frequencies of f1 and f2, where f1 corresponds to high frequency of 100 kHz and f2 corresponds to low frequency of 33 kHz. cpf1′ and cpf2′ are the theoretical calculated sound velocities of high and low frequencies respectively. k f is the correction coefficient of sound velocity ratio at different frequencies, which represents the difference between theoretical calculation and actual measurement, where the value here selects 1. cpf1 and cpf2 are respectively the sound velocity of seafloor sediment after frequency correction and the sound velocity of seafloor sediment under the actually measured frequency state. Here cpf2 is the in situ measured sound velocity at 33 kHz.
After frequency corrections based on equations (11)-(13), the in situ measured sound velocity of muddy sediments closely matched the laboratory measured sound velocity, as depicted by type A in Figure 4. However, sediments primarily composed of sandy material still exhibit significant differences, as shown by type B in Figure 4. The physical properties of the sediments in the two zones are presented in Table 2. The two types exhibit significant variations in the porosity and composition content even there are from the same sea area. Considering the substantial difference in sandy particle percentage and the sound velocity variations after temperature and frequency corrections between the two types, it becomes evident that sandy sediments are more susceptible to disturbance due to their loose particle packing and are more affected by perturbations. The pore water in sandy sediments is more likely to flow, and the loose framework is prone to deformation and reconstruction, resulting in more significant errors caused by disturbance effects. Compared to sandy sediments, muddy sediments are denser, more viscous and firmly fixed in the sampling pipe. As a result, the disturbance effect is relatively weaker, making corrections easier between the in situ and laboratory states. This observation aligns with the fact that sampling sandy sediments is challenging due to their susceptibility to seawater erosion, vibration, and detachment, making it difficult to obtain more effective and intact samples. Li et al. (2013) highlighted that the processes of sample collection, transportation, and truncation have an impact on in situ and laboratory measurements. However, due to the difficulty in qualitatively and quantitatively analyzing patterns, these processes are typically handled with great care to minimize disturbances in the samples. Specifically, efforts are made to measure the samples as soon as possible after collection to reduce disturbances resulting from subsequent transportation, partitioning, and other procedures. Hence, sandy sediments are more suitable for in situ measurements or in situ simulation measurement experiments to reduce influences of sampling disturbances. This enables the further correction of measured data more precisely to apply for other various measurement environments and frequency states.
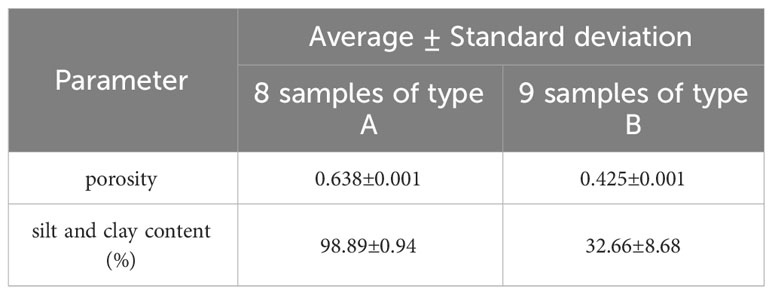
Table 2 Characteristics of type A and B of 17 in situ samples of seafloor sediments in ECS.
5 Conclusions
This study employed P-EDFM to investigate the influence of physical parameters, including porosity and density, as well as temperature environment, and measurement frequency on the in situ sound velocity and sound attenuation coefficient of seafloor sediments. P-EDFM offers a less parametric theoretical model for analyzing the acoustic and physical properties of seafloor sediments. P-EDFM elucidates the relationships between the in situ sound velocity ratio, acoustic attenuation coefficient, and porosity of seafloor sediments. It also analyzes the influence of temperature and frequency dispersion, providing a novel approach for evaluating, predicting, correcting and inverting acoustic and physical property parameters of seafloor sediments. These advancements offer convenience and contribute to the progress in this field of research. Some meaningful conclusions are drawn as follows:
(1) The sound velocity ratio of seafloor sediments and bottom seawater measured in situ in the ECS and YS exhibits decreases with increasing porosity and with decreasing density. This characteristic can be well explained by P-EDFM.
(2) The scattering and variation of the in situ acoustic attenuation coefficient of seafloor sediments are significantly greater than those observed in the sound velocity. Based on the ED group P-EDFM calculation, the interpretation of the in situ sound velocity using the empirical relationships between the average particle size and porosity in the ECS is highly accurate. However, the interpretation of the in situ acoustic attenuation coefficient is slightly less accurate. It is also observed that the acoustic attenuation coefficient initially increases and then decreases with changes in porosity.
(3) By comparing and analyzing the in situ and laboratory measurement results in the ECS and YS, P-EDFM is used to consider the effect of temperature variation and frequency dispersion, enabling the prediction of sound velocity and acoustic attenuation coefficient at different temperatures and frequencies more precisely. And the prediction error of sound velocity is lower than that of the sound attenuation coefficient.
(4) After applying temperature correction and frequency correction, the sound velocity of muddy seafloor sediments demonstrates consistency between laboratorial and in situ measurements. Conversely, for sandy seafloor sediments in the ECS, the sound velocity remains higher than the in situ measurements even after correction. This indicates that the disturbing factors in the sampling and laboratory measurement of sandy seafloor sediments cannot be disregarded. Therefore, when studying sandy seafloor sediments, it is advisable to utilize in situ measurement techniques or conduct in situ simulation experiments.
Data availability statement
The original contributions presented in the study are included in the article/supplementary materials. Further inquiries can be directed to the corresponding author.
Author contributions
DZ: Writing – original draft. JX: Writing – review & editing. XM: Writing – review & editing, Investigation. HS: Writing – review & editing. JF: Writing – review & editing. GK: Writing – review & editing.
Funding
The author(s) declare financial support was received for the research, authorship, and/or publication of this article. We would like to acknowledge the financial support received from the National Key Reasearch and Development Program of China (2021YFF0501200, 2021YFF0501201), and the National Natural Science Foundation of China (42227803, 42049902). Additionally, a portion of the data used in this research was made possible through the National Natural Science Foundation of China Open Research Cruise (NORC2021-02+NORC2021-301), which was funded by the Shiptime Sharing Project of the National Natural Science Foundation of China.
Acknowledgments
We would like to extend our gratitude to the team members from Guangdong University of Technology and the First Institute of Oceanography, Ministry of Natural Resources, who actively participated in the sampling of seafloor sediment samples, as well as the acoustic and physical measurements. We are also thankful for the First Institute of Oceanography, Ministry of Natural Resources, China, for conducting the cruise aboard R/V “XiangYangHong 18” and facilitating the collection of valuable data for our study.
Conflict of interest
The authors declare that the research was conducted in the absence of any commercial or financial relationships that could be construed as a potential conflict of interest.
Publisher’s note
All claims expressed in this article are solely those of the authors and do not necessarily represent those of their affiliated organizations, or those of the publisher, the editors and the reviewers. Any product that may be evaluated in this article, or claim that may be made by its manufacturer, is not guaranteed or endorsed by the publisher.
References
Ballard M. S., Costley R., Sagers J. D., Lee K. M., McNeese A. R., Hathaway K. K., et al. (2018). A comparison between directly measured and inferred wave speeds from an acoustic propagation experiment in Currituck Sound. J. Acoust. Soc. Am. 143 (1), 237–247. doi: 10.1121/1.5021244
Belcourt J., Holland C. W., Dosso S. E., Dettmer J., Goff J. A. (2020). Depth-dependent geoacoustic inferences with dispersion at the New England mud patch via reflection coefficient inversion. IEEE J. Ocean Eng. 45 (1), 69–91. doi: 10.1109/JOE.2019.2900115
Biot M. A. (1956a). Theory of elastic waves in a fluid-saturated porous solid, I. Low-frequency range. J. Acoust. Soc. Am. 28, 168–178. doi: 10.1121/1.1908239
Biot M. A. (1956b). Theory of elastic waves in a fluid-saturated porous solid, II. High-frequency range. J. Acoust. Soc. Am. 28, 179. doi: 10.1121/1.1908239
Boudreau B. P. (1996). The diffusive tortuosity of fine-grained unlithified sediments. Geochim. Cosmochim. Acta 60 (16), 3139–3142. doi: 10.1016/0016-7037(96)00158-5
Buckingham M. J. (1998). Theory of compressional and shear waves in fluidlike marine sediments. J. Acoust. Soc. Am. 103 (1), 288–299. doi: 10.1121/1.421091
Buckingham M. J. (2005). Compressional and shear wave properties of marine sediments: comparisons between theory and data. J. Acoust. Soc. Am. 117 (1), 137–152. doi: 10.1121/1.1810231
Buckingham M. J. (2020). Wave speed and attenuation profiles in a stratified marine sediment: Geo-acoustic modeling of seabed layering using the viscous grain shearing theory. J. Acoust. Soc. Am. 148 (2), 962–974. doi: 10.1121/10.0001778
Buckingham M. J., Richardson M. (2002). On tone-burst measurements of sound speed and attenuation in sandy marine sediments. IEEE J. Ocean Eng. 27 (3), 429–453. doi: 10.1109/JOE.2002.1040929
Hamilton E. L. (1971). Elastic properties of marine sediments. J. Geophys. Res. 76 (2), 579–604. doi: 10.1029/JB076i002p00579
Hamilton E. L. (1980). Geoacoustic modeling of the sea floor. J. Acoust. Soc. Am. 48 (5), 1313–1340. doi: 10.1121/1.385100
Henfer B. T., Jackson D. R., Williams K. L., Thorsos E. I. (2009). Mid-to high-frequency acoustic penetration and propagation measurements in a sandy sediment. IEEE J. Ocean Eng. 34 (4), 372–387. doi: 10.1109/joe.2009.2028410
Hou Z. Y., Guo C. S., Wang J. Q., Chen W. G., Fu Y. T., Li T. G. (2015). Seafloor sediment study from South China Sea: acoustic & physical property relationship. Remote Sens. 7 (9), 11570–11585. doi: 10.3390/rs70911570
Kan G. M., Zhao Y. X., Li G. B., Han G. Z., Meng X. M. (2011). Comparison on the sound speeds of seafloor sediments measured by in-situ and laboratorial technique in Southern Yellow Sea. J. Ocean Technol. 30 (1), 52–56. doi: 10.3969/j.issn.1003-2029.2011.01.013
Kan G. M., Zou D. P., Liu B. H., Wang J. Q., Meng X. M., Li G. B., et al. (2019). Correction for effects of temperature and pressure on sound speed in shallow seafloor sediments. Mar. Geores. Geotechnol. 37 (10), 1217–1226. doi: 10.1080/1064119X.2018.1545812
Kim G. Y., Narantsetseg B., Lee J. Y., Chang T. S., Lee G. S., Dong G. Y., et al. (2018a). Physical and geotechnical properties of drill core sediments in the Heuksan Mud Belt off SW Korea. Quat. Int. 468, 33–48. doi: 10.1016/j.quaint.2017.06.018
Kim G. Y., Park K. J., Lee G. S., Dong G. Y., Young K. S., Kim I. H. (2018b). KISAP: A new In-situ seafloor velocity measurement tool. Mar. Geores. Geotechnol. 36 (3), 264–270. doi: 10.1080/1064119X.2016.1236858
Kim S., Lee G. S., Kim D., Hahn J., Ryang W. (2018c). Variation of temperature-dependent sound velocity in unconsolidated marine sediments: Laboratory measurements. Mar. Geores. Geotechnol. 36 (3), 280–287. doi: 10.1080/1064119X.2016.1277442
Li G. B., Kan G. M., Meng X. M., Liu B. H., Han G. Z. (2013). Influence of environmental condition variations on laboratory acoustic velocity measurements of submarine sediments. Adv. Mar. Sci. 31 (03), 360–366. doi: 10.3969/j.issn.1671-6647.2013.03.008
Li G. B., Wang J. Q., Liu B. H., Meng X. M., Kan G. M., Han G. Z., et al. (2020). In-situ acoustic properties of fine-grained sediments on the northern continental slope of the South China Sea. Ocean Eng. 218 (108244), 1–8. doi: 10.1016/j.oceaneng.2020.108244
Li M. Z., Li Z. L., Li Q. Q. (2019). Geoacoustic inversion for bottom parameters in a thermocline environment in the northern area of the South China Sea. Acta Acustica 44 (03), 321–328. doi: 10.15949/j.cnki.0371-0025.2019.03.006
Liu B. H., Kan G. M., Li G. B., Yu S. Q. (2019). Measurement Techniques and Applications of Acoustic Properties of Submarine Sediments (Beijing: Science Press).
Megan S. B., Kevin M. L., Andrew R. M., Preston S. W., Jason D. C., John A. G., et al. (2019). In-situ measurements of compressional wave speed during gravity coring operations in the New England Mud Patch. IEEE J. Ocean Eng. 45 (1), 26–38. doi: 10.1109/JOE.2019.2924560
Schock S. G. (2005). A method for estimating the physical and acoustic properties of the sea bed using chirp sonar data. IEEE J. Ocean Eng. 29 (4), 1200–1217. doi: 10.1109/JOE.2004.841421
Tang C., Zheng X. Y., Li Y. F., Liu X., Xia Z. (2019). Geoacoustic properties measurement and analysis of gravity cores using MSCL in the Southern Beibu Gulf. Mar. Sci. 43 (10), 88–95. doi: 10.11759/hykx20190316001
Tao C. H., Wang D., Jin X. L. (2006). Marine Sediments Properties and In Situ Acoustic Measurements (Beijing: Ocean Press).
Wang J. Q., Kan G. M., Li G. B., Meng X. M., Zhang L. Q., Chen M. J., et al. (2023). Physical properties and in situ geoacoustic properties of seafloor surface sediments in the East China Sea. Front. Mar. Sci. 10, 1195651. doi: 10.3389/fmars.2023.1195651
Wang J. Q., Li G. B., Kan G. M., Liu B. H., Meng X. M. (2020). Experiment study of the in-situ acoustic measurement in seafloor sediments from deep sea. Chin. J. Geophys. 63 (12), 4463–4472. doi: 10.6038/cjg2020N0427
Wang J. Q., Li G. B., Liu B. H., Kan G. M., Sun Z. W., Meng X. M., et al. (2018a). Experimental study of the ballast in situ sediment acoustic measurement system in South China Sea. Mar. Geores. Geotechnol. 36 (5), 515–521. doi: 10.1080/1064119X.2017.1348413
Wang J. Q., Liu B. H., Kan G. M., Li G. B., Zheng J. W., Meng X. M. (2018b). Frequency dependence of sound speed and attenuation in fine-grained sediments from 25 to 250 kHz based on a probe method. Ocean Eng. 160, 45–53. doi: 10.1016/j.oceaneng.2018.04.078
Williams K. L. (2001). An effective density fluid model for acoustic propagation in sediments derived from Biot theory. J. Acoust. Soc. Am. 110 (5), 2276–2281. doi: 10.1121/1.1412449
Williams K. L., Jackson D. R., Thorsos E. I., Tang D., Schock S. G. (2002). Comparison of sound speed and attenuation measured in a sandy sediment to predictions based on the Biot theory of porous media. IEEE J. Ocean Eng. 27 (3), 413–428. doi: 10.1109/JOE.2002.1040928
Yang J., Jackson D. R. (2020). Measurement of sound speed in fine-grained sediments during the seabed characterization experiment. IEEE J. Ocean Eng. 45 (1), 39–50. doi: 10.1109/JOE.2019.2946004
Yu S. Q., Liu B. H., Yu K. B., Kan G. M., Yang Z. G. (2017). Study on sound-speed dispersion in a sandy sediment at frequency ranges of 0.5–3 kHz and 90–170 kHz. China Ocean Eng. 31 (1), 103–113. doi: 10.1007/s13344-017-0013-6
Zhou J. P., Tao C. H., Li H. X., Jin X. L., Qiu L., Zhang G. Y., et al. (2019). The physical model with temperature and pressure controlled for measuring acoustic velocity of marine sediments. Mar. Geores. Geotechnol. 37 (5), 633–640. doi: 10.1080/1064119X.2018.1469057
Zimmer M. A., Bibee L. D., Richardson M. D. (2010). Measurement of the frequency dependence of the sound speed and attenuation of seafloor sands from 1 to 400 kHz. IEEE J. Ocean Eng. 35 (3), 538–557. doi: 10.1109/JOE.2010.2056230
Zou D. P., Liu W., Long J. J. (2018). Relationship of sound speeds between compressional wave and shear wave of seafloor sediments. Acta Acustica 43 (6), 951–960. doi: 10.15949/j,cnki.0371-0025.2018.06.010
Zou D. P., Williams K. L., Thorsos E. I. (2015). Influence of temperature on the acoustic sound speed and attenuation of sand sediment. IEEE J. Ocean Eng. 40 (4), 969–980. doi: 10.1109/JOE.2014.2365072
Zou D. P., Ye G. C., Liu W., Sun H., Li J., Xiao T. B. (2022). Effect of temperature on the acoustic reflection characteristics of seafloor surface sediments. J. Ocean Univ. China 21 (1), 62–68. doi: 10.1007/s11802-022-4874-9
Keywords: sound velocity, porosity, seafloor sediment, in situ measurement, EDFM
Citation: Zou D, Xie J, Meng X, Sun H, Feng J and Kan G (2023) Analysis of the variation of in situ seafloor sediments acoustic characteristics with porosity based EDFM. Front. Mar. Sci. 10:1270673. doi: 10.3389/fmars.2023.1270673
Received: 01 August 2023; Accepted: 09 October 2023;
Published: 29 November 2023.
Edited by:
Xianbiao Lin, Ocean University of China, ChinaCopyright © 2023 Zou, Xie, Meng, Sun, Feng and Kan. This is an open-access article distributed under the terms of the Creative Commons Attribution License (CC BY). The use, distribution or reproduction in other forums is permitted, provided the original author(s) and the copyright owner(s) are credited and that the original publication in this journal is cited, in accordance with accepted academic practice. No use, distribution or reproduction is permitted which does not comply with these terms.
*Correspondence: Xiangmei Meng, bXhtZW5nQGZpby5vcmcuY24=; Han Sun, c3VuaGFuX2lvcmlAaG90bWFpbC5jb20=