
94% of researchers rate our articles as excellent or good
Learn more about the work of our research integrity team to safeguard the quality of each article we publish.
Find out more
ORIGINAL RESEARCH article
Front. Mar. Sci., 28 September 2023
Sec. Marine Biogeochemistry
Volume 10 - 2023 | https://doi.org/10.3389/fmars.2023.1269310
This article is part of the Research TopicBiogeochemical Responses to Physical Processes in the North Pacific and Its Adjacent Marginal SeasView all 9 articles
 Hui Zheng1,2,3
 Wen-Zhou Zhang1,2,3,4*
We used Biogeochemical-Argo (BGC-Argo) float observation profiles and satellite data to investigate the physical-biogeochemical processes of a phytoplankton biomass rise in the Kuroshio region south of Japan during a period of two sequential tropical cyclones (TCs)—Hagibis and Neoguri—in October 2019. During TC Hagibis, prominent sea surface cooling and surface chlorophyll-a (Chl-a) increase occurred within a pre-existing cyclonic eddy (CE) south of Japan. Because of TC-induced mixing and upwelling, the maximum cooling happened at the depth of 57 m where water temperature dropped by 6°C. The dramatic mixing and upwelling redistributed chlorophyll-a vertically (reducing subsurface Chl-a and increasing surface Chl-a) with little augment of depth-integrated Chl-a in the upper ocean above 160 m depth. Meanwhile, the mixing and upwelling transported nutrients from the subsurface to the surface layer. In the week after Hagibis, the depth-integrated Chl-a greatly increased. Subsequently, TC Neoguri obviously enhanced the augment of phytoplankton biomass although it was weaker than Hagibis. The upwelling induced by Hagibis increased nutrients in the water below 80 m, providing a very favorable condition for the subsequent TC Neoguri to further promote the growth of phytoplankton. The intense precipitation accompanying with Neoguri brought the coastal water with rich terrestrial material to offshore ocean, increasing nutrients and decreasing salinity in the subsurface layer. These both contributed to the marked increase in Chl-a during Neoguri. Our results demonstrated that the two sequential TCs worked together with a cyclonic eddy to cause a drastic and complex Chl-a enhancement event in the Kuroshio region south of Japan.
Tropical cyclones (TCs), known as typhoons in the northwestern Pacific, have considerable impacts on the upper ocean. The TC-induced upwelling, mixing and entrainment generally would cause a cold wake (surface cooling) along the TC track (Price, 1981; Dickey et al., 1998; Jacob et al., 2000). The surface cooling with the sea surface temperature (SST) decreasing is usually strong on the right (left) side of TC tracks in the Northern (Southern) Hemisphere, attributed to wind-current resonance (Price et al., 1994). The hydrographic responses of upper ocean to TCs are often accompanied by biogeochemical processes, frequently resulting in surface phytoplankton blooms in oligotrophic oceans (Subrahmanyam et al., 2002; Lin et al., 2003; Babin et al., 2004; Chacko, 2019). Two mechanisms have been proposed to explain the surface phytoplankton biomass increase caused by a TC: 1) the TC could directly bring subsurface water with more phytoplankton into surface layer via physical processes; 2) more nutrients are injected into surface layer by the TC-induced upwelling and entrainment, which facilitates phytoplankton growth in the surface layer (Gierach and Subrahmanyam, 2008; Ye et al., 2013; Zhao et al., 2013; Li et al., 2021a).
Upper ocean responses to TCs mainly depend on TC characteristics (e.g., wind speed and translation speed) and pre-TC ocean condition (e.g., mixed layer depth (MLD) and stratification). In general, strong and slow-moving TCs passing over the ocean with a shallow mixed layer (ML) readily cause sea surface cooling and phytoplankton blooms (Zhao et al., 2008; Lin, 2012; Mei et al., 2015; Wang, 2020). In addition, numerous studies suggest that a pre-existing cyclonic eddy with a shallow ML due to upwelling could strengthen the ocean responses to TCs, while an anticyclonic eddy has an opposite effect on account of the eddy-induced downwelling (Zheng et al., 2008; Liu et al., 2009; Jin et al., 2020). Walker et al. (2005) found two surface cooling patches and phytoplankton blooms within two cyclonic eddies (CEs), respectively, along the Hurricane Ivan’s track in the Gulf of Mexico. Lin (2012) conducted a series of numerical experiments to systematically study the TC-induced surface cooling. The SST drops by 4°C after removing the pre-existing anticyclonic eddy (ACE) in a super typhoon Maemi case, which is much higher than the remote sensing observation of 1.5°C. Analyzing 46 typhoons events from 1998 to 2013, Xu et al. (2017) indicated that the TC-induced surface Chl-a increase is significantly correlated with the pre-existing cyclonic circulation. Based on the composite analysis results, Liu and Tang (2018) demonstrated that more persistent SST cooling and greater phytoplankton blooms occur after typhoons passing by CEs compared with ACEs.
Upper ocean responses to two sequential TCs must be more complex than those to an individual TC. Here two sequential TCs means that the temporal interval between the two TCs passing over the same sea area is no more than 20 days, given that the e-folding recovery time of the TC-induced cold wake is 5-20 days (Price et al., 2008; Lin et al., 2017). Numerical simulations by Zheng et al. (2010) revealed that a previous typhoon (Rammasun) contributed to the phytoplankton bloom induced by a subsequent typhoon (Nakri) because Rammasun uplifted nitrate profiles before Nakri passage. However, Huang et al. (2016) using remote sensing sea surface data and CTD (conductivity, temperature, and depth) profiles suggested that a previous typhoon (Sinlaku) induced a thick ML which suppressed cold water injection into surface layer during a subsequent typhoon (Jangmi), leading to a relatively weak phytoplankton bloom during Jangmi. On account of few in-situ observations, physical and biogeochemical responses to two sequential TCs in an ocean environment full of eddies are still unclear. In October 2019, two sequential TCs—Hagibis and Neoguri—just passed over the same CE in the Kuroshio region south of Japan. A Biogeochemical-Argo (BGC-Argo) float (ID 2902754) happened to be cruising in this region during the two sequential TCs. These provided a great opportunity to study the evolutions of physical and biogeochemical processes in the upper ocean during two sequential TCs. The objective of this work is to gain new insights into the physical-biogeochemical response of the upper ocean to two sequential TCs.
The track data of TCs Hagibis and Neoguri were taken from the International Best Track Archive for Climate Stewardship (IBTrACS, Knapp et al., 2010; Knapp et al., 2018) dataset (https://doi.org/doi:10.25921/82ty-9e16), provided by the Joint Typhoon Warning Center (JTWC). This dataset includes the TC center location, maximum sustained wind (MSW) speed, minimum central pressure, radii of the specified winds (34, 50 and 64 knot) and MSW for four quadrants at 3-h intervals. The TC translation speed was defined as dividing the distance between two adjacent TC centers by the corresponding time span.
The BGC-Argo float 2902754 (Argo, 2000, https://data-argo.ifremer.fr) was deployed at 146.5°E, 29.9°N on 30 August 2018 which was equipped with an extensive range of biogeochemical and physical sensors to measure abundant parameters in the upper 1000 m, such as dissolved oxygen, Chl-a, particle backscattering at 700 nm, colored dissolved organic matter (CDOM), downwelling irradiance, nitrate, temperature, and practical salinity. According to Wang et al. (2021), the nitrate correction equation for this float can be expressed as follows:
Here, NitrateRaw and CycleNum represent the float-observed nitrate concentration and cycle number of the float, respectively. The nitrate data accuracy can be improved to 0.5 μmol/kg after the above drift adjustment (Johnson et al., 2017). Observation profiles were smoothed by a five-point running median filter to remove unusual spiny data, following Qiu et al. (2021). The MLD was determined by the depth at which water temperature is lower by 0.5°C than that at the sea surface, according to Kara et al. (2000). The euphotic zone depth (EZD) was defined as the depth of photon flux dropping to 1% of its sea surface value (Falkowaski, 1994).
To investigate the ocean responses to TCs Hagibis and Neoguri, satellite-derived SST, Chl-a, precipitation, absolute dynamic topography (ADT), and sea level anomaly (SLA) were applied in this study. Daily SST data at 9 km resolution were extracted from microwave and infrared (MW_IR) Optimally Interpolated (OI) SST daily products provided by the Remote Sensing Systems (RSS, https://data.remss.com/SST/daily/). Surface Chl-a concentrations were taken from the Moderate Resolution Imaging Spectroradiometer (MODIS) level-3 products with a resolution of 4 km×4 km (https://oceandata.sci.gsfc.nasa.gov/opendap/). Three-hourly precipitation data were from the Tropical Rainfall Measuring Mission (TRMM) project (Huffman, 2016). Daily ADT and SLA data were obtained from the Copernicus Climate Change Service (C3S) Climate Data Store (CDS, https://doi.org/10.24381/cds.4c328c78) with a resolution of 0.25°×0.25° (Copernicus Climate Change Service Climate Data Store, 2018).
The category 5 (on the Saffir-Simpson Hurricane Wind Scale) super typhoon Hagibis developed from a tropical depression in the northwestern Pacific on 4 October 2019 (Figure 1). It moved across a CE to the south of Japan with a MSW of ~48.9 m/s and a translation speed of ~7.3 m/s. Ten days later after TC Hagibis passage, TC Neoguri, a category 2 typhoon, passed over the same CE with a MSW of ~20.6 m/s and a translation speed of ~6.8 m/s. Figure 1 shows the location of the CE to the south of Japan, denoted by a patch of low and negative SLA, on October 5 before the two TCs arrived. This CE was quasi-stationary with almost no change in its central position during the influence period of the TCs (Figure S1).
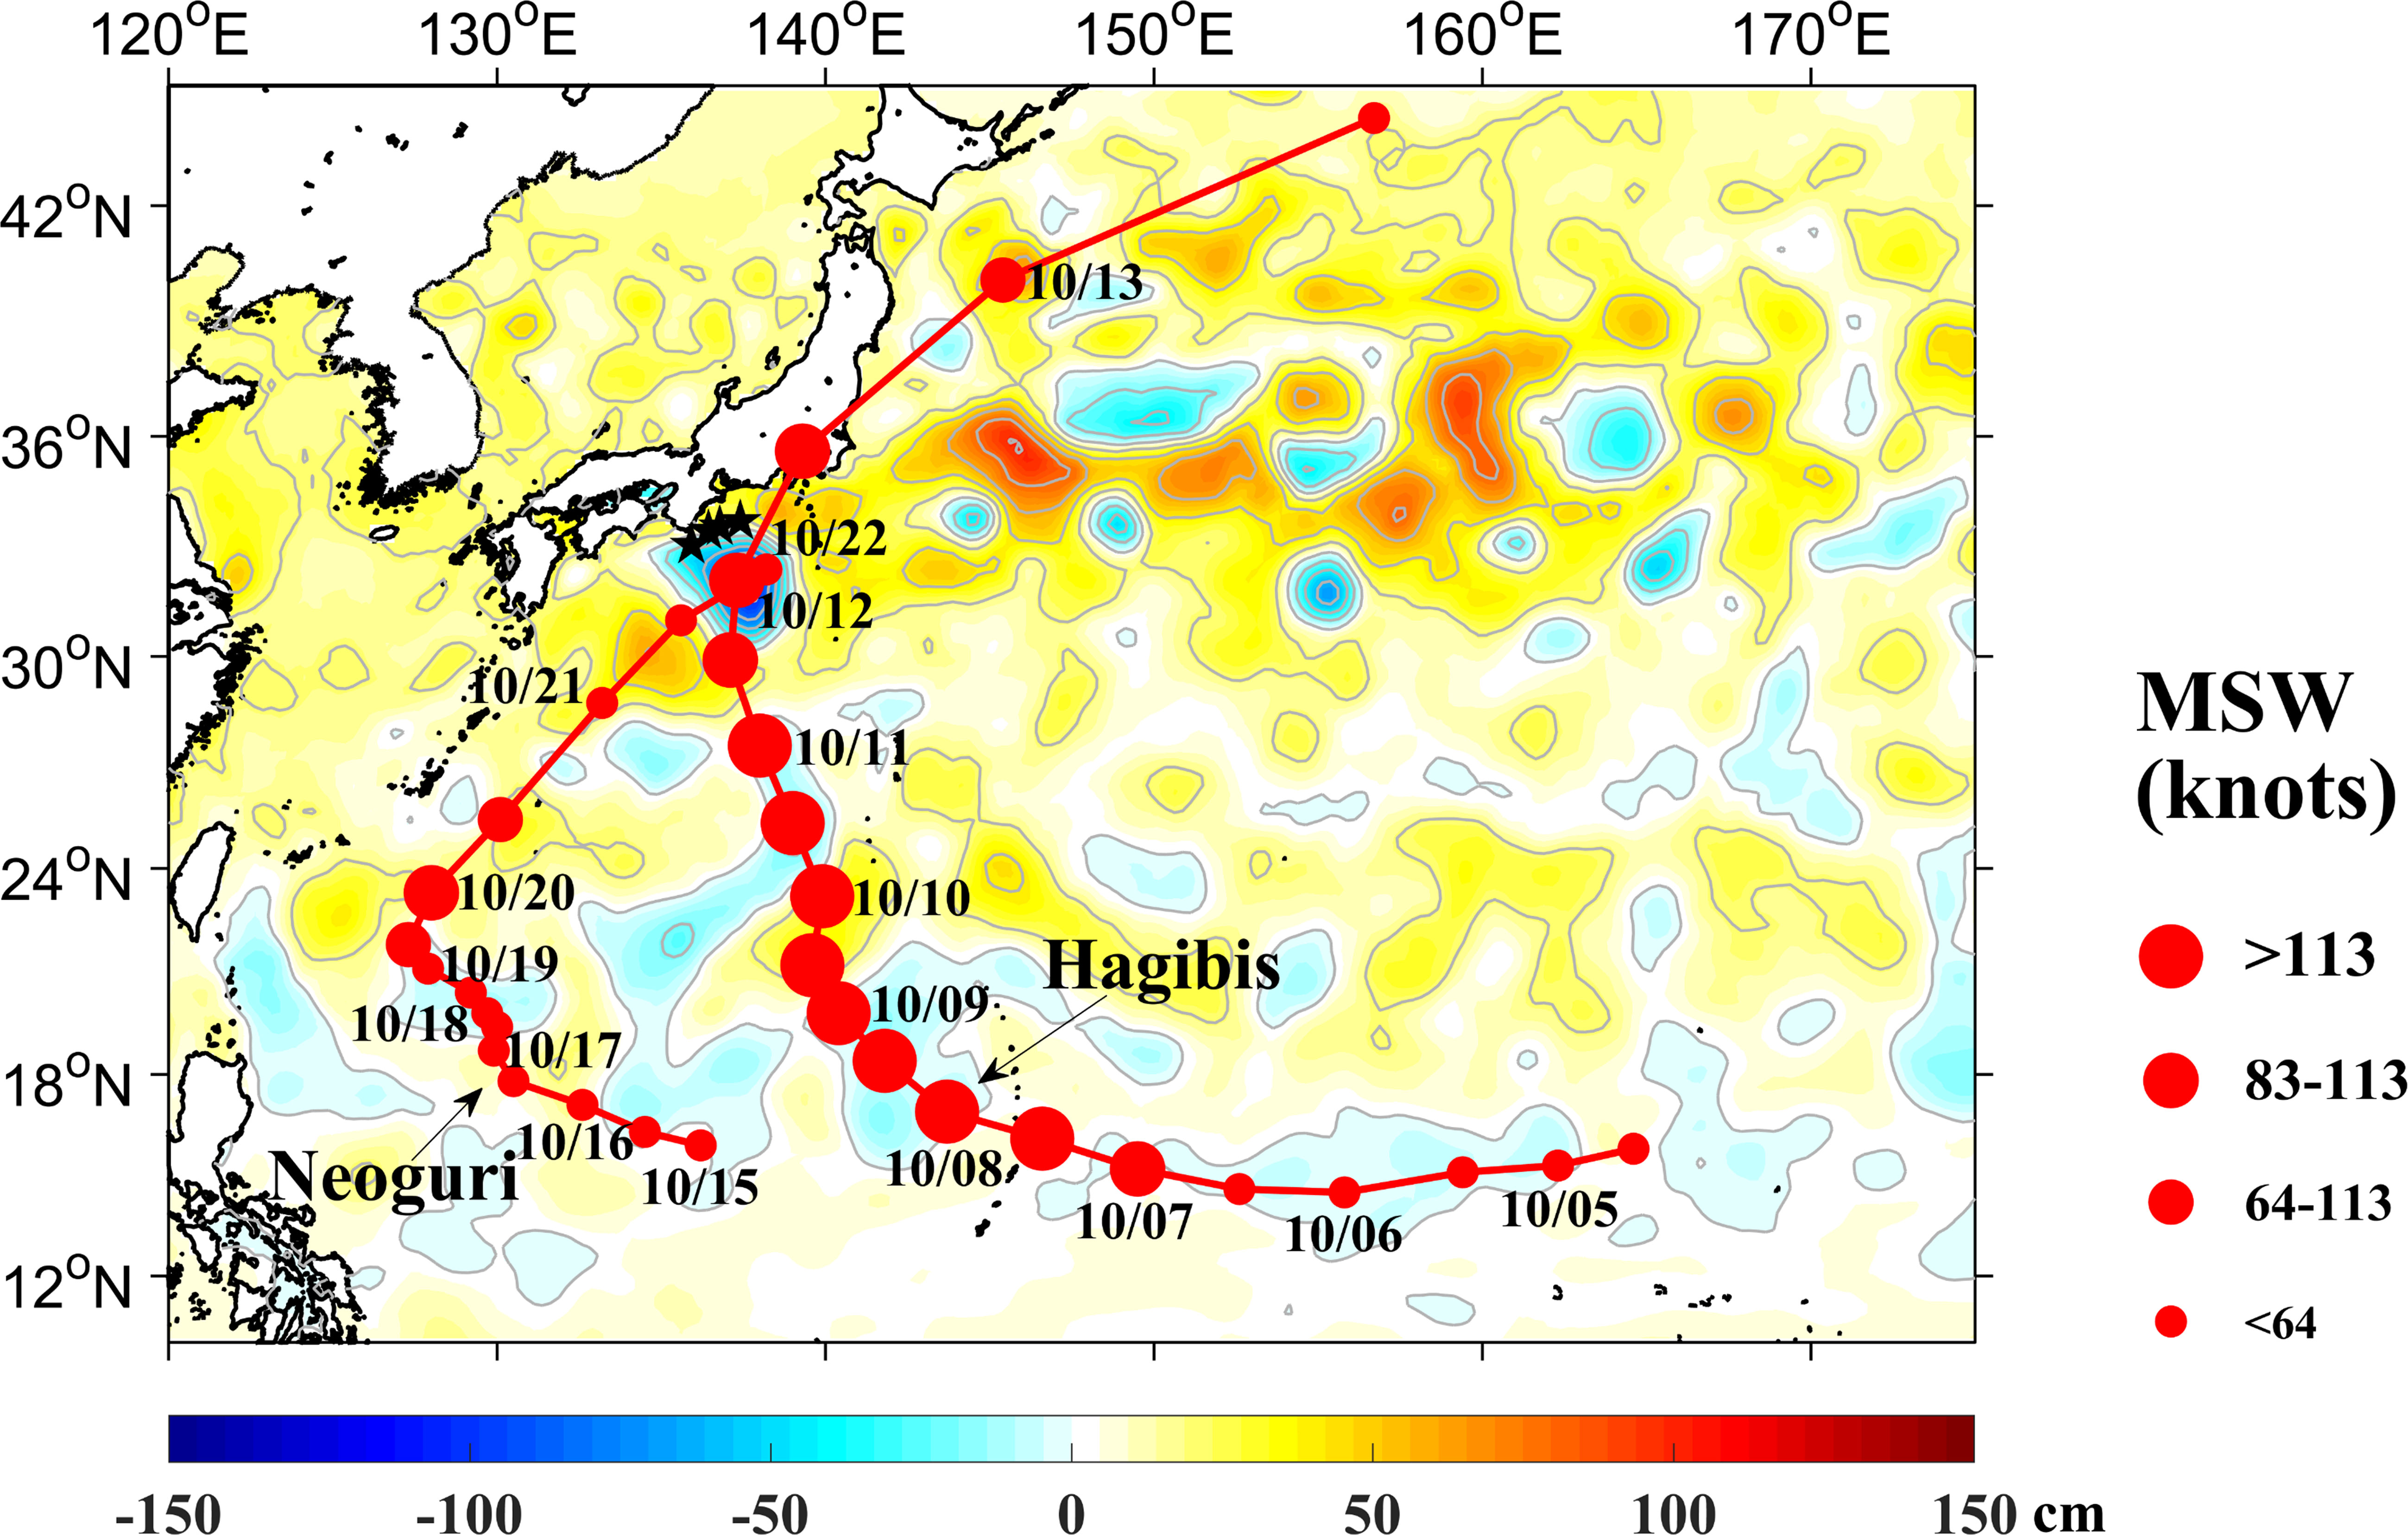
Figure 1 The SLA field (shading) on October 5, 2019 in the northwestern Pacific. Red lines are the tracks of TCs Hagibis and Neoguri. Red dots represent the 12-hourly TC centers and black pentagrams indicate the positions of BGC-Argo float 2902754 from October 9 to November 8.
Most of previous studies defined the effects of TCs as the differences of post-TCs and pre-TCs SST or Chl-a concentrations (Siswanto et al., 2009; Zhao et al., 2013; Huang et al., 2016; Li et al., 2021b). However, the background SST in the study area decreased continuously during the two sequential TCs because of the seasonal variation of air temperature. Hence, we chose the differences between daily SST anomalies and pre-TCs SST anomalies to investigate the impacts of Hagibis and Neoguri (Figure 2). Here, SST anomaly on a day was calculated by removing the climatic mean SST state on the corresponding date in a year from the SST, eliminating SST seasonal change. We defined the pre-TCs status as the average SST anomalies during the period of October 3-9 just before the TCs affected the study area. On October 10, two days before Hagibis arriving at the CE, remarkable surface cooling happened under the track of Hagibis with the maximum cooling of 4.9°C (Figure 2A). After Hagibis passed over the CE (Figure 2B), the average SST anomaly within the CE region dropped to about -1.0°C, but smaller in magnitude than the maximum cooling (-4.9°C) south of the CE. A notable feature of SST cooling was rightward bias as the same as past researches (e.g. Price et al., 1994). The maximum SST anomaly was gradually reduced to -3.8°C in the two days after Hagibis passage while the area-averaged SST cooling in the CE was still -1.0°C. The subsequent TC Neoguri induced a smaller SST anomaly mainly because the intensity of Neoguri was weaker than Hagibis (Figure 1). The area-averaged and maximum values of SST anomaly in the CE were -0.72°C and -2.0°C, respectively. The surface cooling almost disappeared one day after Neoguri passage.
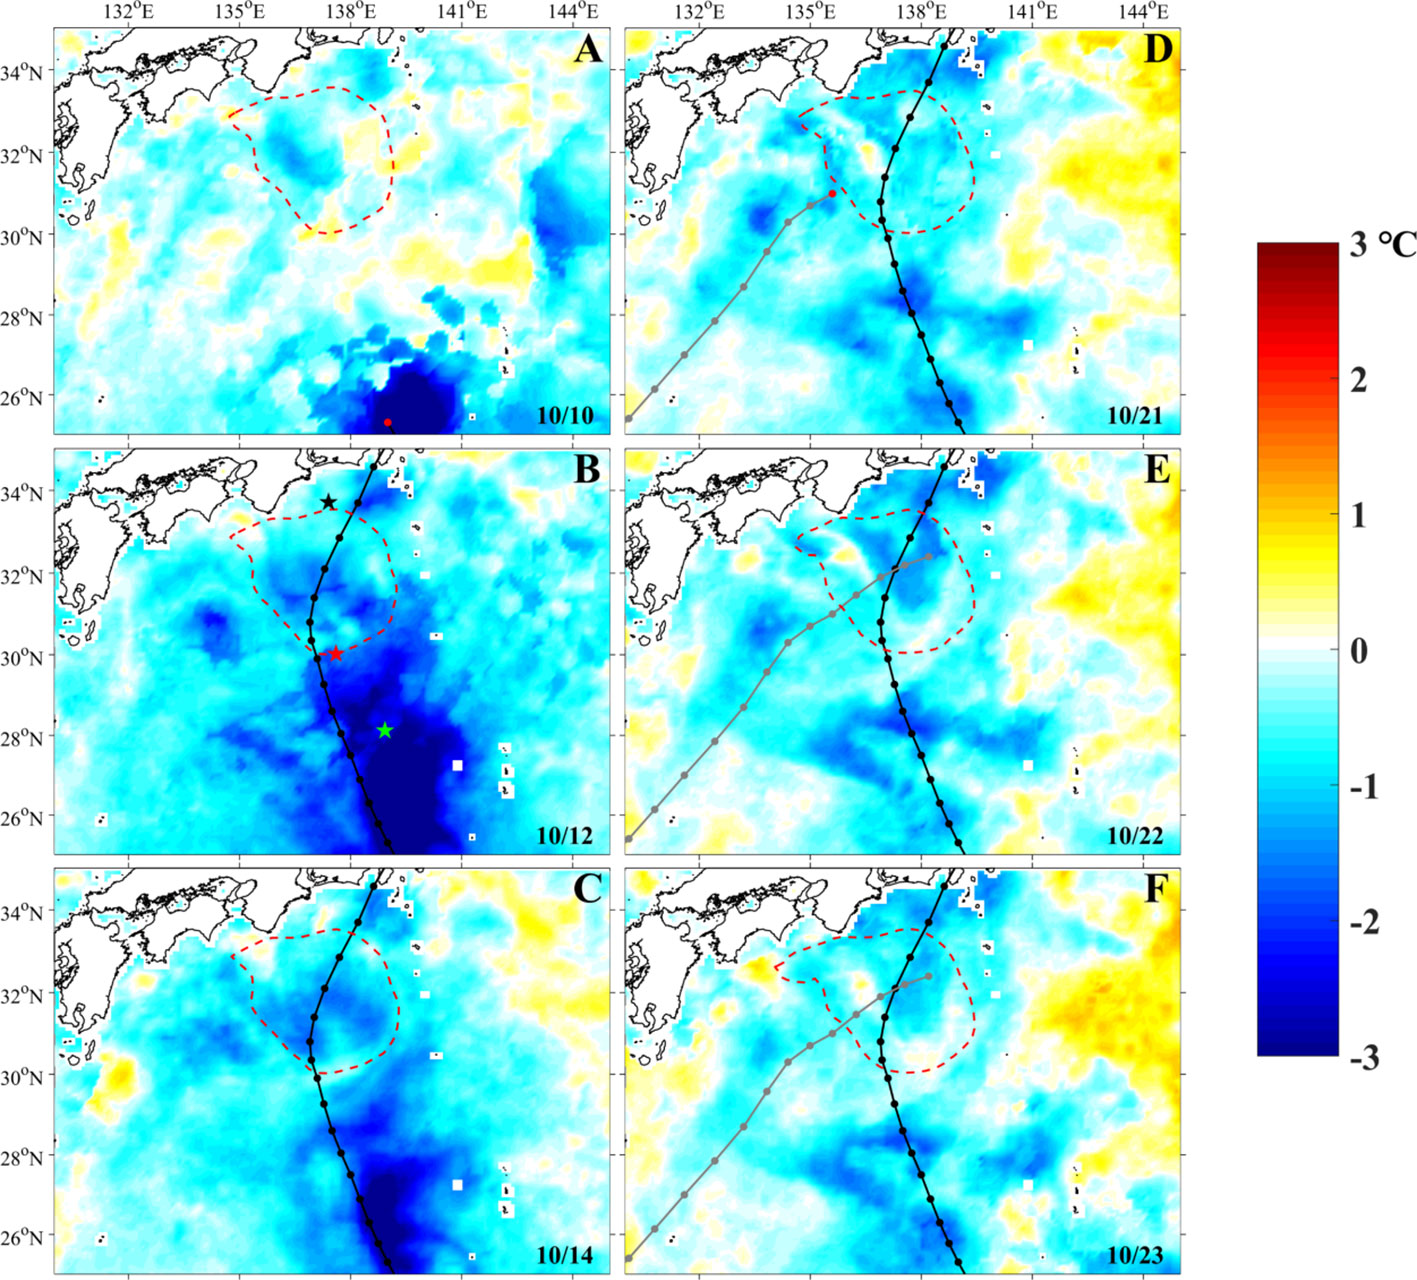
Figure 2 The changes of SST anomalies during the influence period of two sequential TCs Hagibis and Neoguri. Black and gray lines with dots represent the tracks of Hagibis and Neoguri, respectively. Black, red and green pentagrams in B denote the positions of Argo floats 2902754, 2903336 and 2902972, respectively, before TC Hagibis passage. Red dash lines are 0-cm SLA contours representing the edges of the CE.
An interesting feature in the Figure 2B is that the SST cooling along Hagibis track were separated by the Kuroshio indicated by ADT derived geostrophic currents in Figure 3A. Temperature profiles in the north of the Kuroshio, the Kuroshio, and the south of the Kuroshio were obtained by Argo floats 2902754, 2903336 and 2902972, respectively, on October 9, 5 and 7 before Hagibis passage (Figure 3B). Among these areas, the temperature below the ML in the Kuroshio was the highest with the weakest vertical temperature gradient. This is not beneficial to surface temperature drop due to TC-induced vertical mixing and upwelling, resulting in a weak surface cooling during Hagibis passage (Figure 2B). In contrast, the ML was shallow and the temperature gradient below the ML was strong in the area south of the Kuroshio, which was mainly responsible for the prominent TC-induced surface cooling there (Figure 2B). In the area north of the Kuroshio, the vertical temperature gradient was also strong but the ML was deeper than that in the south of the Kuroshio (Figure 3B) so the TC-induced surface cooling was weaker. Some studies have reported that stronger thermal stratification below shallower ML corresponds to stronger SST cooling induced by a TC (Schade and Emanuel, 1999; Mei et al., 2015).
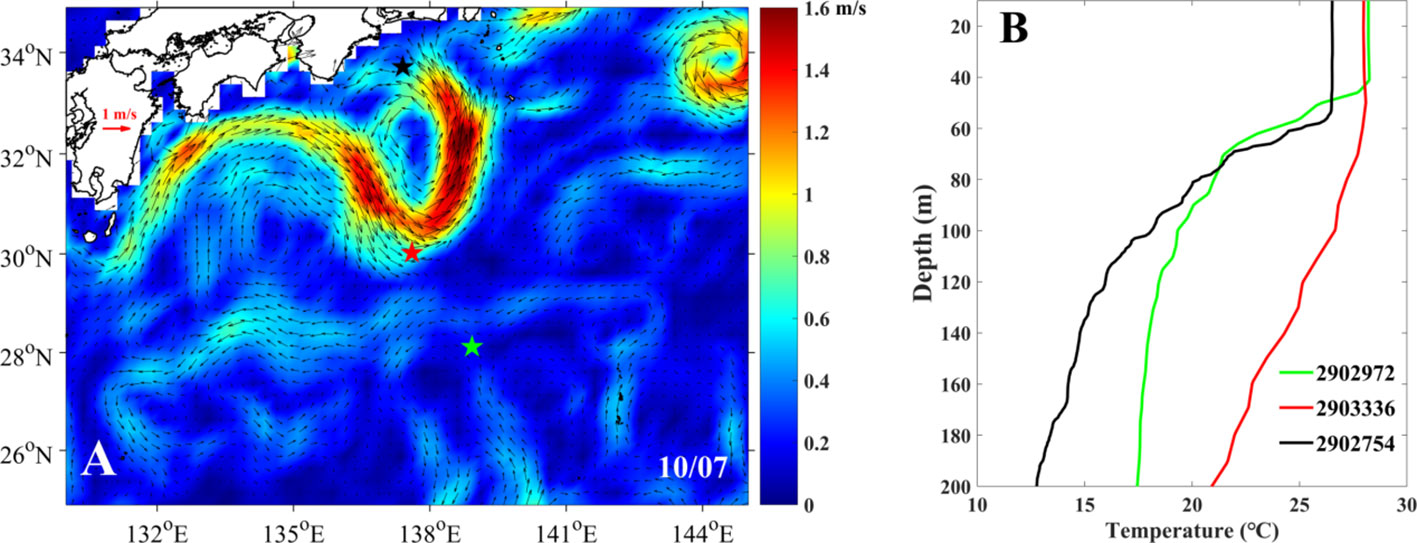
Figure 3 (A) ADT-derived geostrophic currents on October 7. (B) Black, red and green curves represent the temperature profiles observed by Argo floats 2902754, 2903336 and 2902972, respectively, on October 9, 5 and 7, and their observation positions are respectively marked by black, red and green pentagrams in (A).
Figure 4 demonstrates the variation of surface Chl-a concentration during the influence period of the TCs. Before Hagibis passage, the surface Chl-a concentration was very low in open ocean, however, within the CE it reached 0.12 mg/m3, probably attributed to the CE-induced upwelling (Gaube et al., 2014). After Hagibis passing over the CE, the surface Chl-a concentration increased to a peak value of 0.33 mg/m3 within the CE (Figure 4B). Same as the SST cooling, the increase of surface Chl-a was restricted in the Kuroshio which is identified as low-nutrient water. Figure 4C shows that about three days after Hagibis passage, the surface Chl-a concentration in the CE increased obviously with the maximum value of 0.68 mg/m3 while that was only 0.35 mg/m3 to the south of Kuroshio. Different from the pattern of SST response, the most striking increasing of surface Chl-a concentration was located at the CE center probably due to eddy pumping lifting the nutricline (Falkowski et al., 1991). Besides, upwelling within the CE was strengthened by Hagibis with the maximum SLA varied from -121 to -131 cm (Figure S1), implicating the further enhancement of nutrients for phytoplankton growth in the upper ocean. On October 17, five days after Hagibis, the increased phytoplankton biomass began to decline, and the maximum values of Chl-a concentration in the CE and to the south of the Kuroshio decreased to 0.56 and 0.19 mg/m3, respectively.
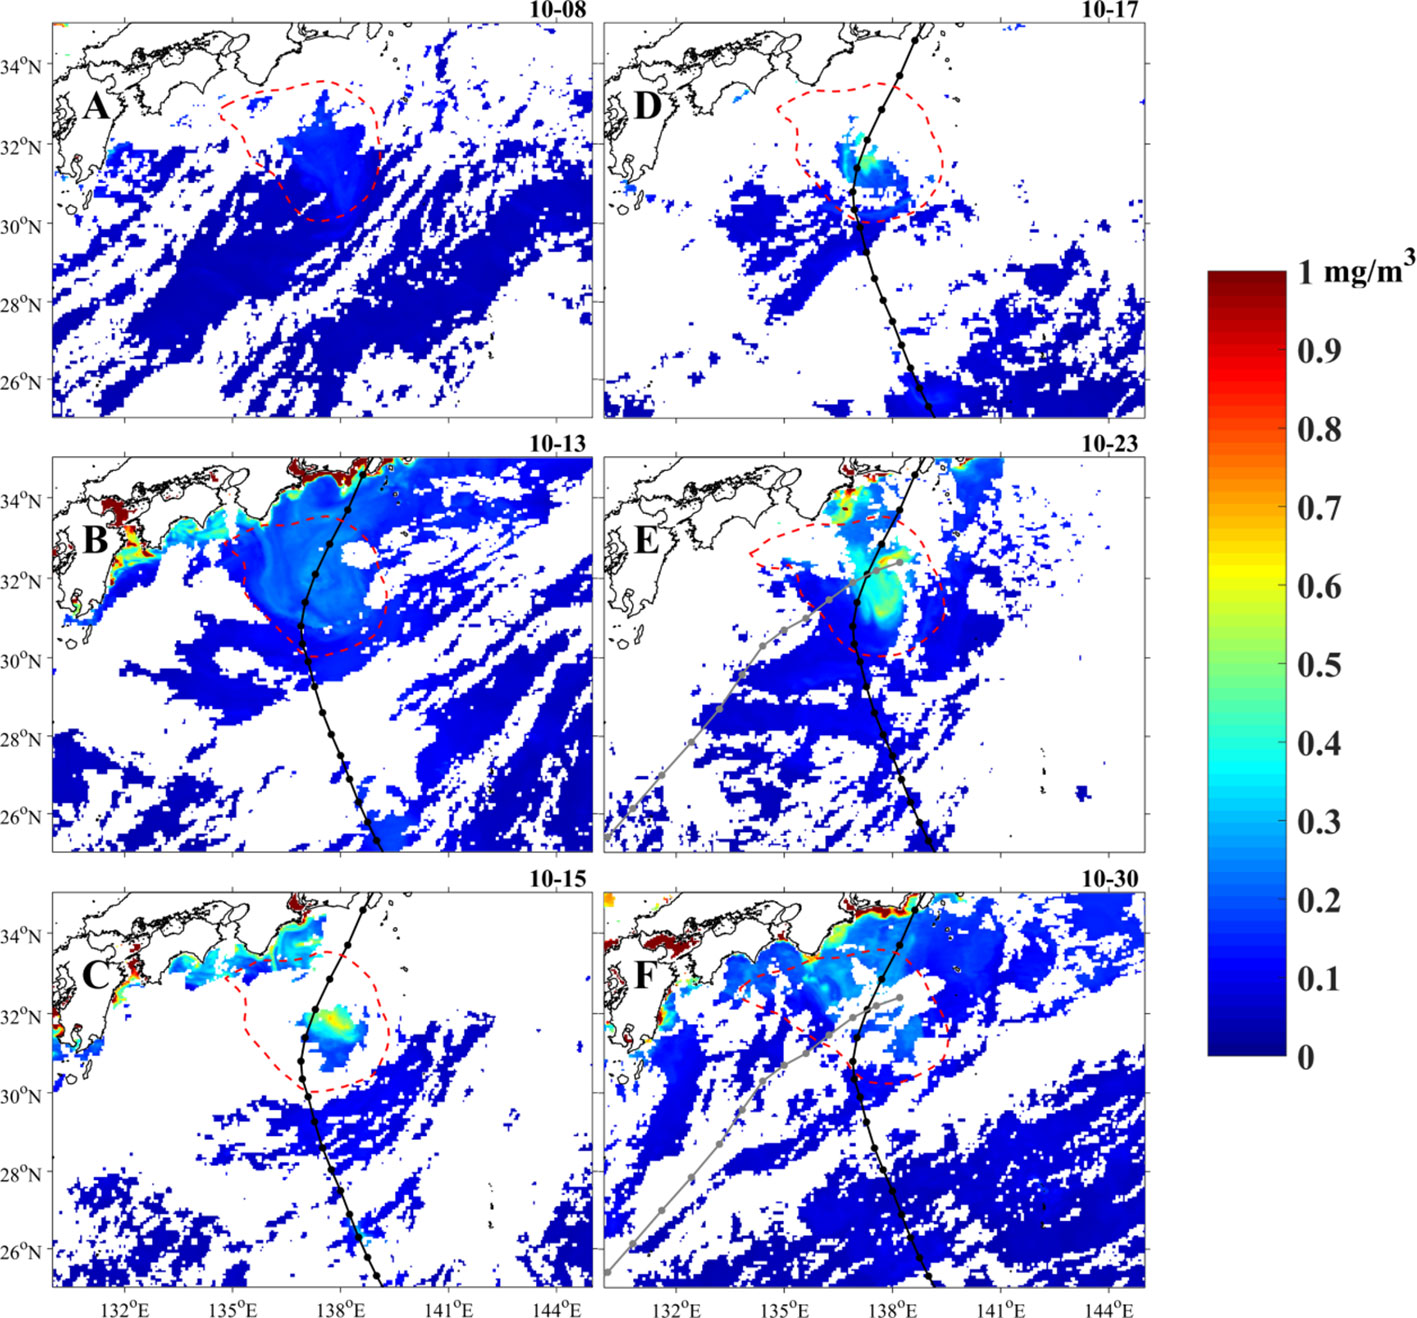
Figure 4 Surface Chl-a concentration. Black and gray lines with dots represent the tracks of Hagibis and Neoguri, respectively. Red dash line in each panel is 0-cm SLA contour representing the edge of the CE on the date indicated. The blank areas in each panel indicate no data due to cloud cover.
The surface Chl-a within the CE increased again soon after TC Neoguri passage with the area-averaged and maximum values reaching to 0.23 and 0.8 mg/m3, respectively. About one week later, it diminished rapidly with its maximum concentration decreasing to 0.51 mg/m3. Hagibis and Neoguri generated comparable and significant surface Chl-a increases although their intensity difference is conspicuous. Note that the translation speed of Neoguri (6.8 m/s) is slower than Hagibis (7.3 m/s), but Neoguri is not a slow-moving TC according to Li et al. (2021a). Li et al. (2021a) indicated that a TC that causes a significant ocean response usually has a translation speed<= 4 m/s. Chacko (2019) investigated the variability of TC-induced ocean biological response in the Indian Ocean from 1999 to 2016. Their results demonstrated that all TCs which had MSWs and translation speeds close to the corresponding values of Neoguri did not generate an obvious surface bloom. Similar results were also found by Pan et al. (2018) in the Northwest Pacific and South China Sea.
Seen from Figures 2, 4, the increase of surface Chl-a concentration apparently lagged the SST cooling because the phytoplankton need some time to grow by utilizing the nutrients injected from subsurface water. Pan et al. (2017) indicated that when the uplifted nitrate causes a phytoplankton bloom, Chl-a concentration reaches a peak three days after nitrate concentration begins to obviously increase. Zheng and Tang (2007) also found that the offshore bloom along the track of TC Damrey exhibited a Chl-a concentration peak five days after the lowest SST occurred.
Before the super typhoon Hagibis arrival, the vertical distribution of Chl-a obtained by BGC-Argo float 2902754 was characterized by a pronounced deep Chl-a maximum (DCM) reaching up to 0.48 mg/m3 (Figure 5C). The DCM is a ubiquitous phenomenon in worldwide oceans, formed by biological-chemical-physical interaction. In the stratified open ocean, the vertical stratification below the ML suppresses the supply of nutrients from subsurface layer, generally leading to a DCM beneath the MLD and at the top of nutricline within the euphotic layer where there are adequate nutrients and light (Furuya, 1990; Cullen, 2015; Wang, 2020; Chai et al., 2021; Zhuang et al., 2021). On October 9, 2019, The DCM occurred at the depth of 59.9 m just above the nutricline. Meanwhile, the EZD and MLD were 65.7 and 58.9 m, respectively (Figure 6), which reflects the above relationship.
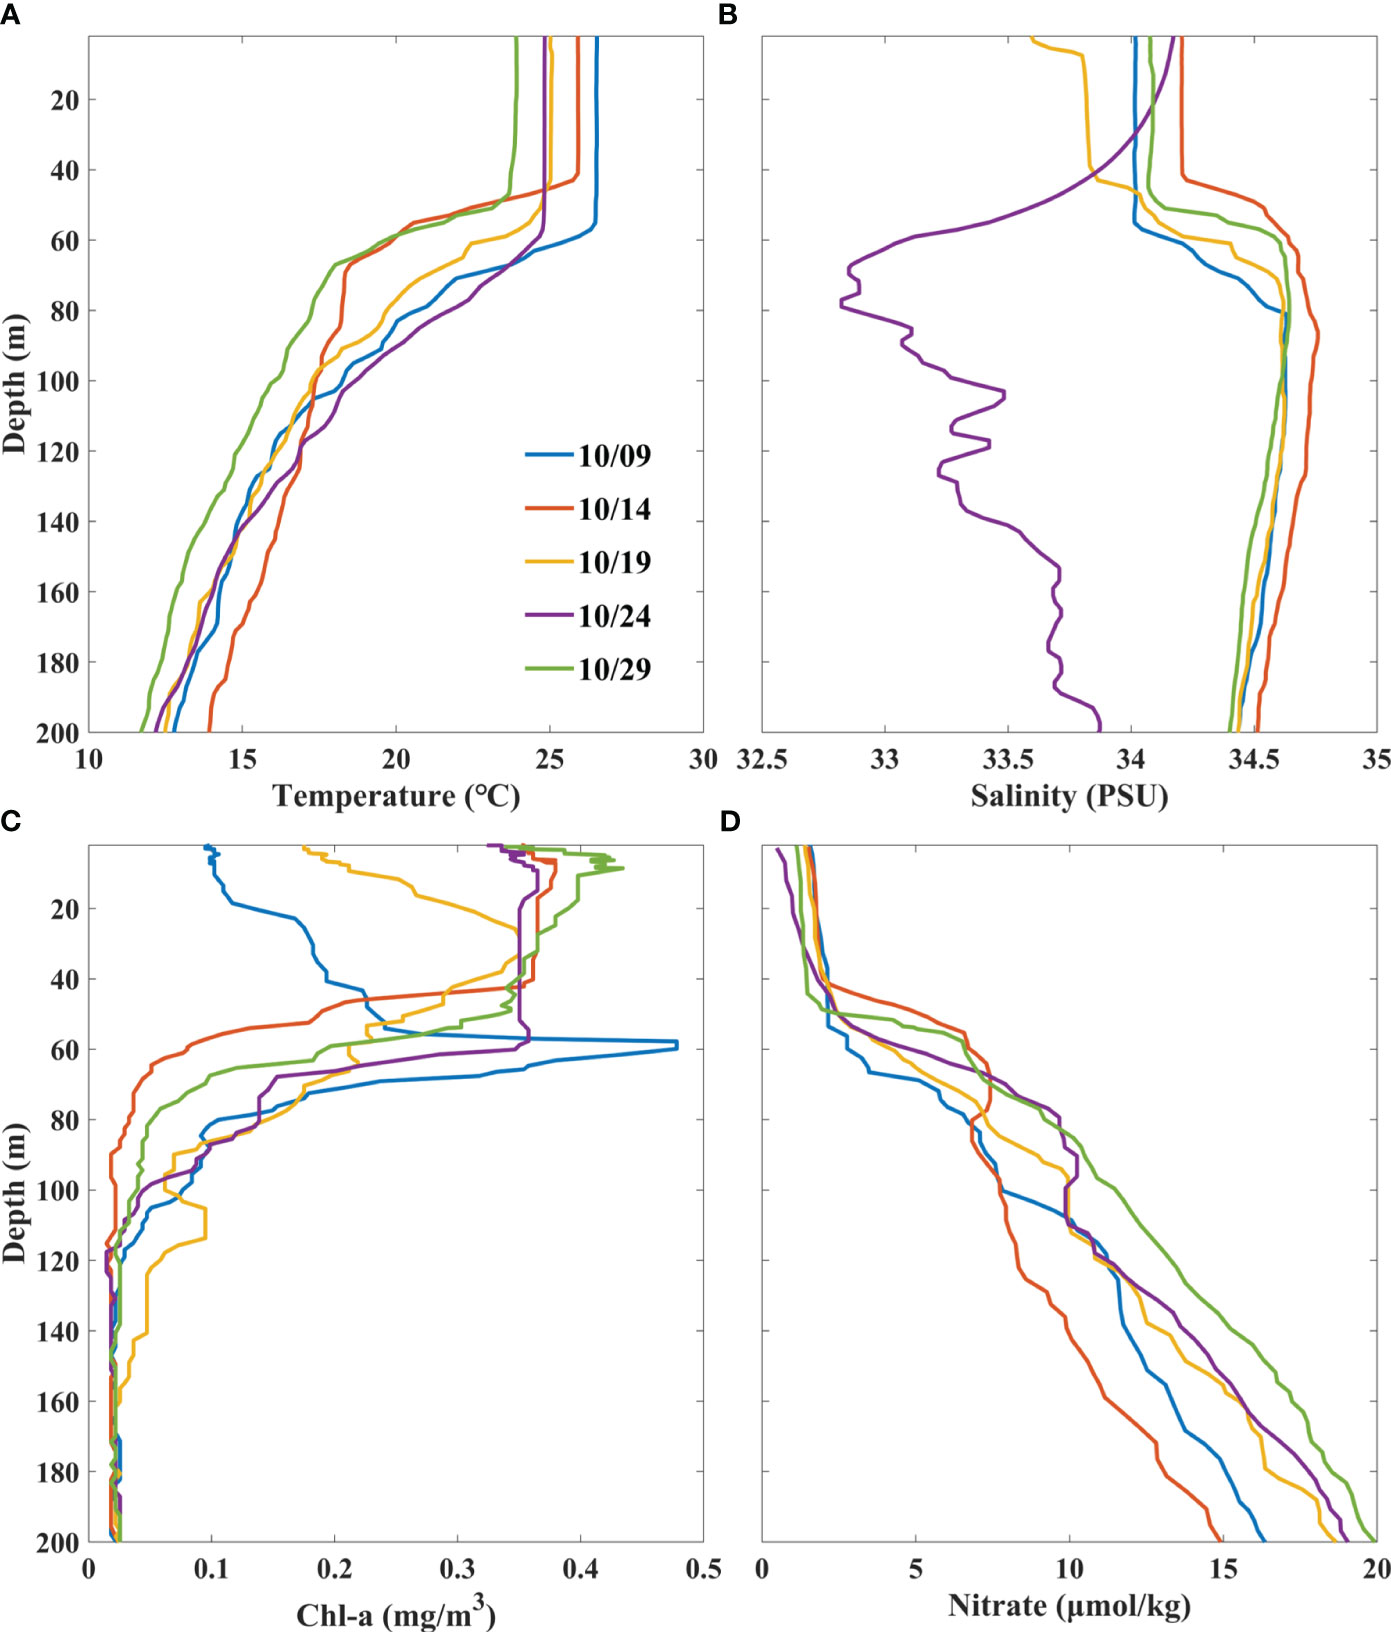
Figure 5 Vertical profiles of temperature [°C, (A)], salinity [PSU, (B)], Chl-a [mg/m3, (C)], nitrate [μmol/kg, (D)] from October 9 to 29, observed by BGC-Argo 2902754.
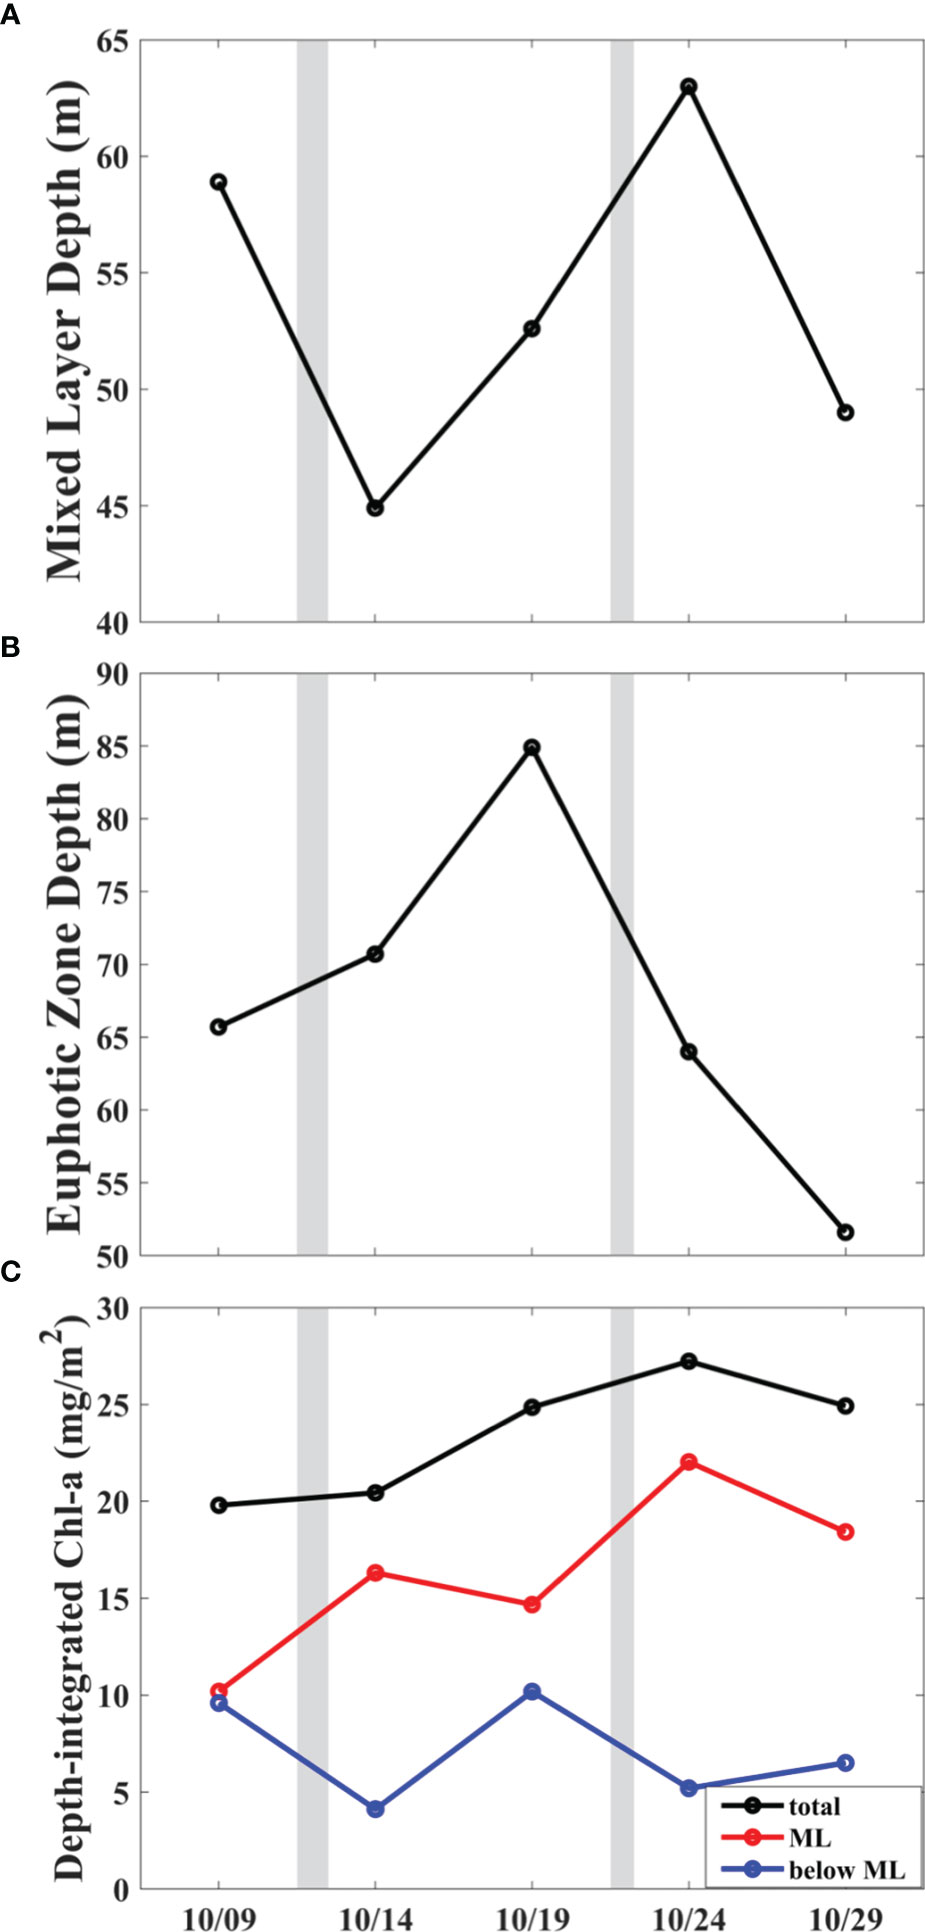
Figure 6 Time series of mixed layer depth (A), euphotic zone depth (B) and depth-integrated Chl-a (C) observed by BGC-Argo float 2902754. Black, red and blue lines in C represent the depth-integrated Chl-a in the entire column (0-160 m), the upper (0-MLD) and lower layers (MLD-160 m), respectively. The gray backgrounds denote the periods when Hagibis and Neoguri passed over the positions of the BGC-Argo.
On October 14, two days after Hagibis passage, the MLD decreased by ~14 m to 44.9 m probably due to strong upwelling induced by Hagibis with no distinct change in stratification intensity (Figures 5A, 6A, S2). A similar result was also observed by a Bio-Argo after TC Hudhud in the Bay of Bengal (Chacko, 2017). Shoaling of thermocline caused an intense cooling in the subsurface with the maximum temperature drop of 6°C at the depth of 57 m, while a slight temperature rise happened below the 100 m depth. At the same time, nitrate concentration increased distinctly in the upper layer but decreased below the 100 m depth. The temperature-salinity (T-S) property below the 100 m depth (near 25 kg/m3 sigma contour) was consistent with that of the Kuroshio water with high temperature and low nitrate (Figure S3), indicating the invasion of the Kuroshio water due to the deep convergence accompanying with the Hagibis-induced upwelling. The daily absolute geostrophic currents derived from altimeter ADT data also certified the invasion of the Kuroshio, showed in Figure 7.
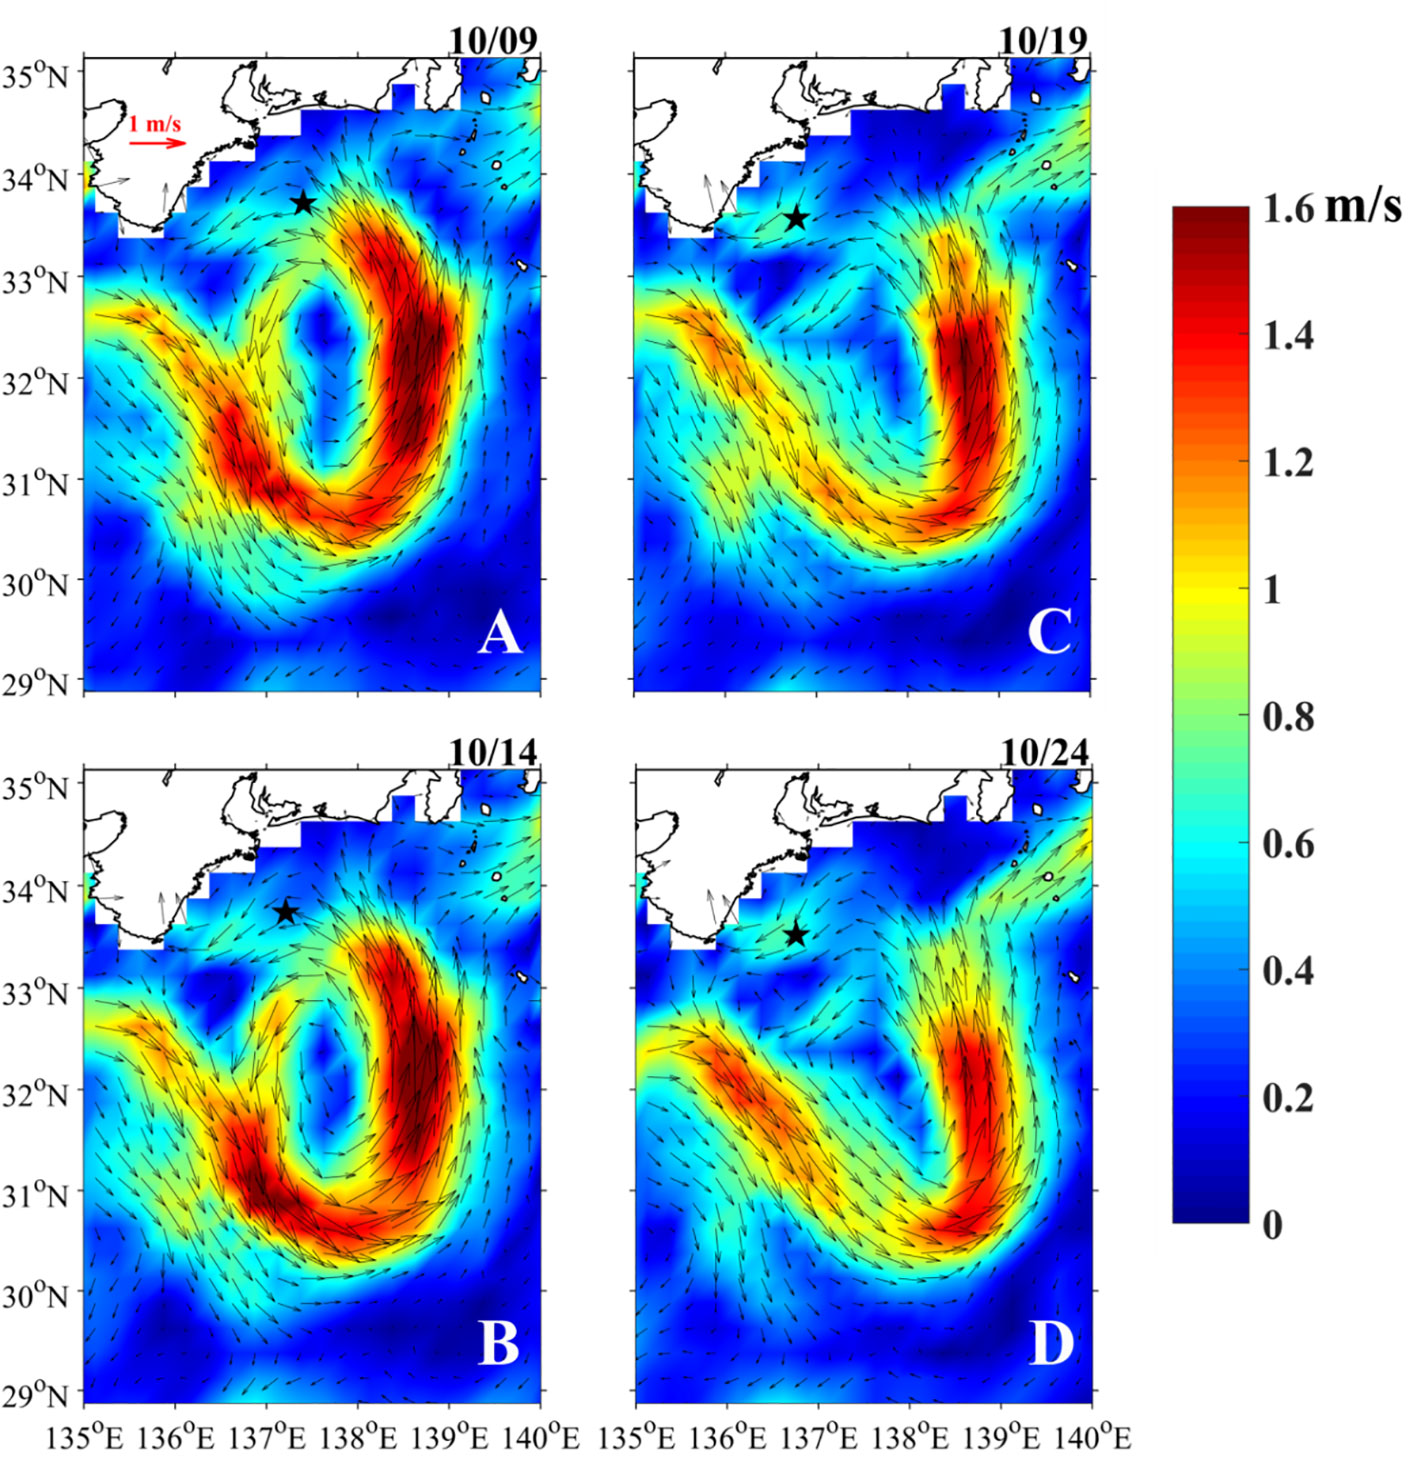
Figure 7 Absolute geostrophic currents (arrows and shading colors) and the positions of BGC-Argo float 2902754 (black pentagram) from October 9 to 24.
The DCM disappeared and the maximum Chl-a concentration occurred in the ML on October 14 (Figure 5C). The Chl-a concentration was remarkably higher than that before Hagibis passage in the ML, but the opposite was true below the ML. To further explore the reason of these Chl-a variations, here we define the upper ocean Chl-a content integrated from the surface to 160 m depth as depth-integrated Chl-a since the Chl-a concentration below 160 m depth is very low and negligible. The depth-integrated Chl-a on October 14 was 20.4 mg/m2 which was close to 19.8 mg/m2 on October 9 before the influence of Hagibis (Figure 6C), indicating the increase of surface Chl-a was mostly the result of Chl-a redistribution due to TC-induced physical processes (upwelling and mixing) rather than phytoplankton growth.
One week after Hagibis passage, Chl-a concentration decreased a little in the upper 44 m but increased significantly below it on October 19 (Figure 5C), compared with that on October 14. And a small Chl-a concentration peak of 0.35 mg/m3 was formed at the depth of 28 m. The depth-integrated Chl-a rose to 24.9 mg/m2 with a net increase of 4.5 mg/m2, indicating a great growth of phytoplankton. The growth of phytoplankton consumed much nutrients injected from the subsurface layer, resulting in the reduction of nitrate concentration within the euphotic zone above 80 m depth (Figure 5D). The salinity in the ML was much lower than that 5 days ago because of heavy precipitation (Figure 8A). These results manifest that Hagibis induced strong upwelling and mixing, resulting in an apparent cooling and Chl-a increase in the upper ocean, and the phytoplankton growth lagged the response of temperature and nitrate by approximately one week.
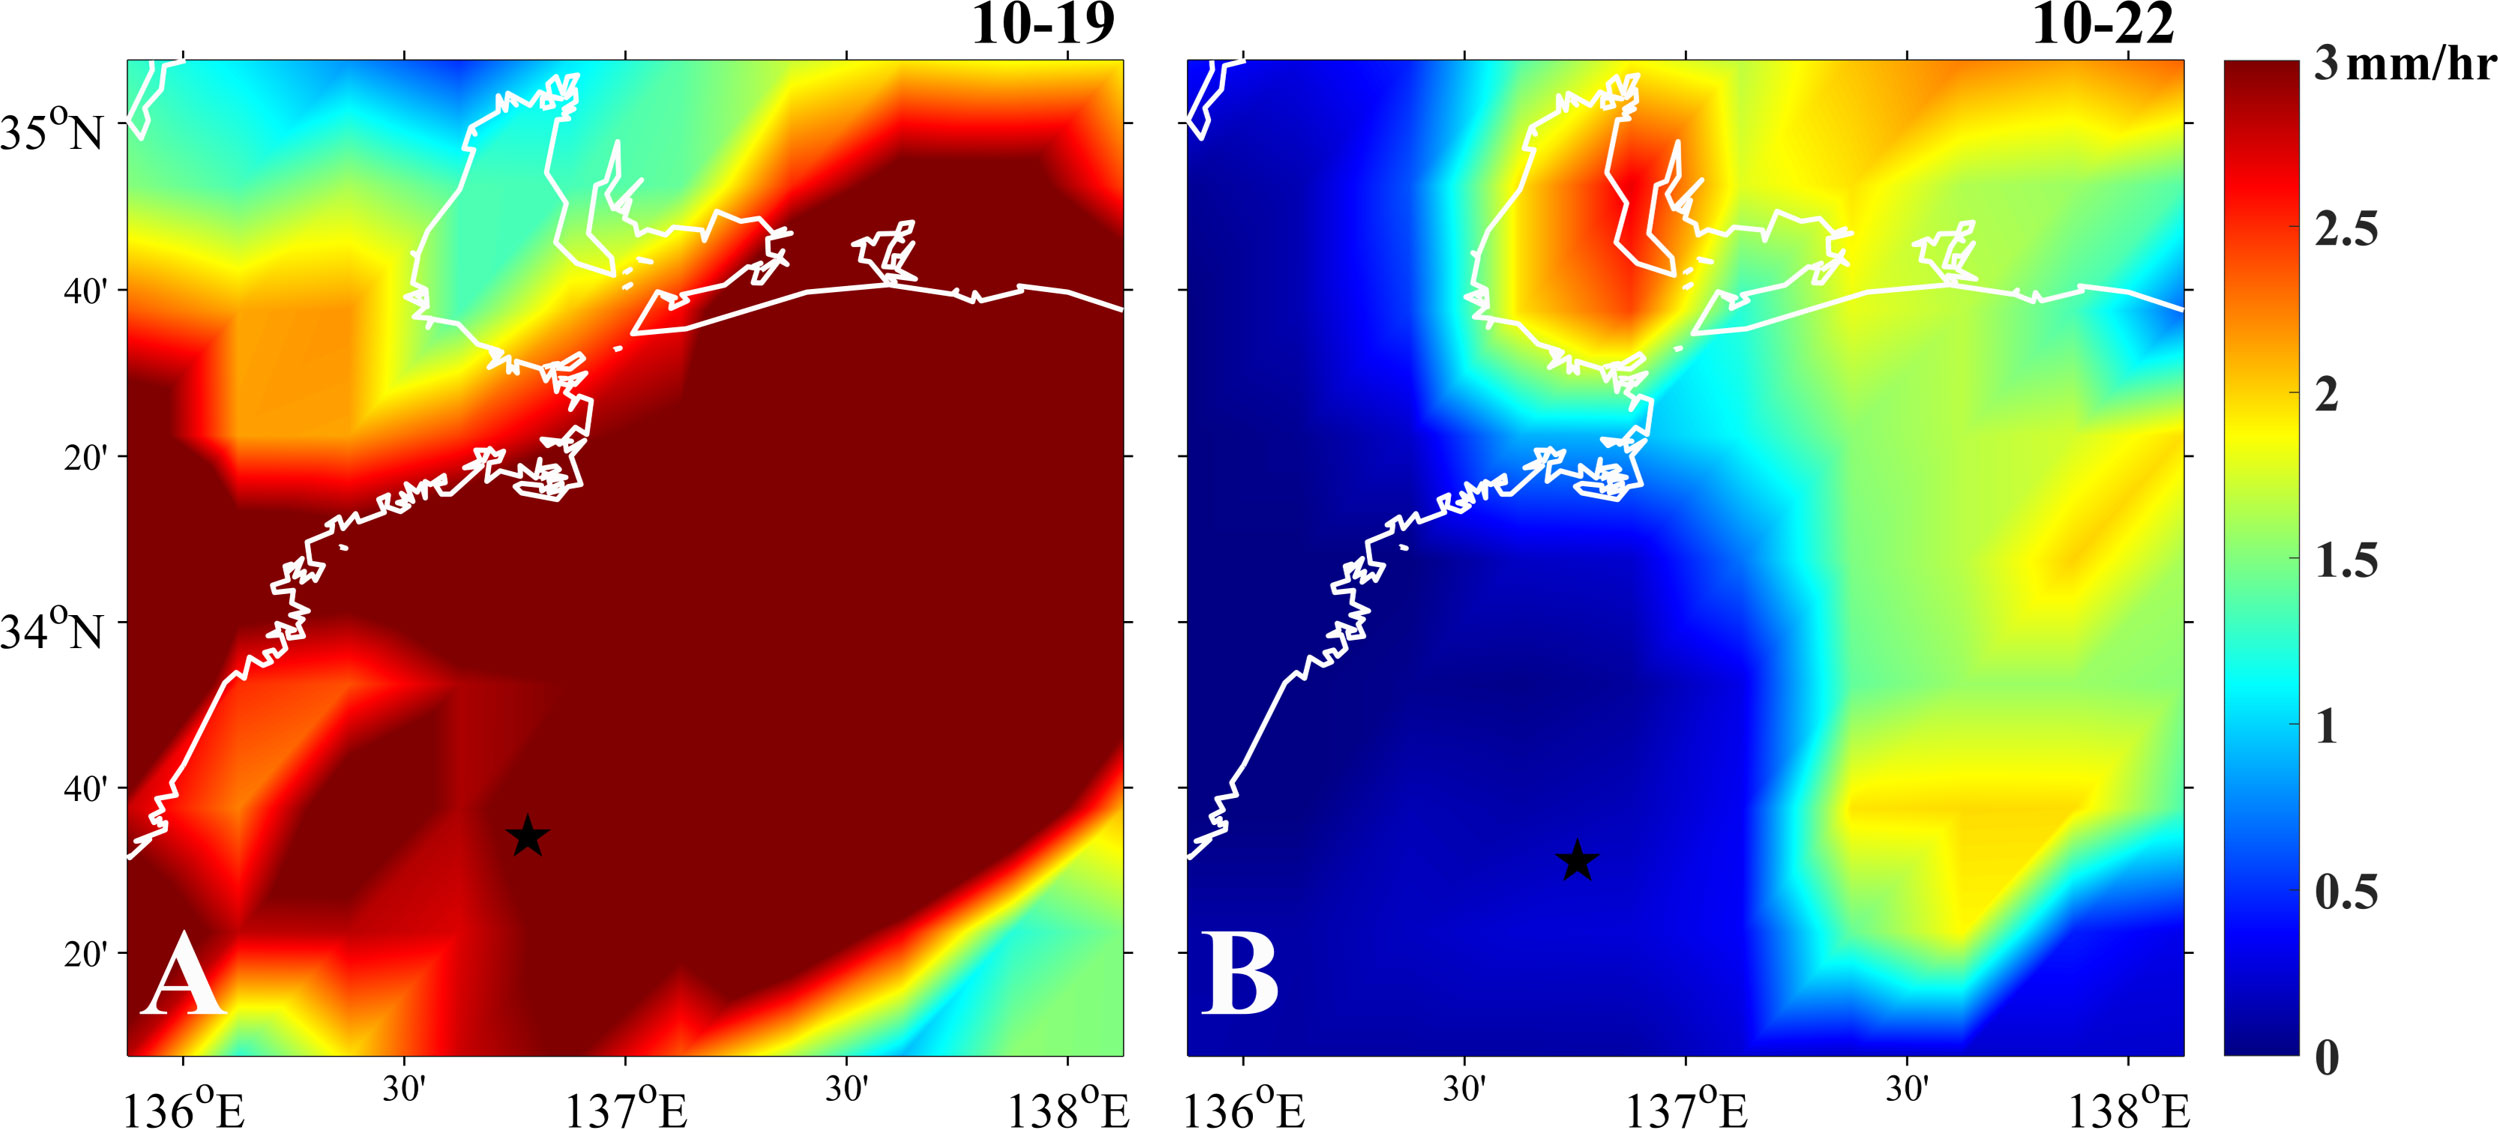
Figure 8 Daily precipitation on October 19 (A) and 22 (B). Black pentagrams denote the positions of BGC-Argo float 2902754 on October 19 (A) and 24 (B). White lines show the shorelines.
The vertical distribution of Chl-a was almost uniform in the ML soon after TC Neoguri passage (Figure 5C). The temperature profile on October 24 also presented an obvious mixing process with the MLD increasing about 10 m and temperature increasing in subsurface layer. Differing from Hagibis, Neoguri raised the depth-integrated Chl-a immediately, especially in the ML. The increase of depth-integrated Chl-a reached up to 2.4 mg/m2 despite the weak intensity of Neoguri. This unusual increase in phytoplankton biomass was attributed to both the uplift of nutrients due to the previous TC Hagibis and the influence of Neoguri. The abnormal profile of salinity on October 24 was affected by typhoon-induced flood-related hyperpycnal flow as reviewed by Liu et al. (2013) so that the salinity in the subsurface was very low compared with that before Neoguri passage (Figure 5B). An intense precipitation happened after Neoguri passage in the south of Japan (Figure 8B), which would bring flood-related fresh water with rich terrestrial sediment to offshore ocean, resulting in the low salinity in the subsurface layer. Meanwhile, this hyperpycnal flow might also contribute to the increase of subsurface nutrients and then Chl-a concentration on October 24 (Figures 5C, D). Five days later, the salinity profile on October 29 was restored to its pre-typhoon state (Figures 5B, S3).
A noteworthy feature in this case is that the weaker TC Neoguri rapidly generated an obvious augment of phytoplankton biomass in the upper ocean. A category 5 typhoon Trami in late September 2018 with average translation speed of 6.1 m/s barely caused net increase of primary production in the upper ocean observed by BGC-Argo float 2902750, in spite of the stronger intensity and slower translation speed compared to Neoguri (Chai et al., 2021). Huang et al. (2016) reported that TC Jangmi caused a weaker surface bloom owing to the thick ML induced by TC Sinlaku that passed earlier. In our study, the surface Chl-a concentration following Neoguri was slightly less than that on October 14 (Figure 5C), but a dramatical increase happened in the subsurface layer. Hence, the sequential TC-induced primary production increase would be underestimated if only satellite sensing surface data were used.
In this paper, we mainly investigated the upper ocean responses to two sequential TCs with a pre-existing CE in the Kuroshio region south of Japan based on the BGC-Argo float profiles and satellite-derived data. Hagibis, the TC occurring earlier, induced obvious cooling and a phytoplankton biomass increase in the surface layer within two days. However, the little increase in depth-integrated Chl-a indicated that the surface Chl-a enhancement at this time was almost the result of Chl-a redistribution because of the TC-induced upwelling and mixing. Additionally, more nutrients were injected into euphotic layer below the MLD due to the upwelling, providing an appropriate condition for phytoplankton growth in the next few days. Consequently, the depth-integrated Chl-a, especially below the ML, increased notably one week after Hagibis passage.
Compared with Hagibis, Neoguri, the TC occurring latter, had much weaker intensity than Hagibis, leading to a weaker SST cooling along its track. However, the satellite data indicated that Neoguri generated an obvious rise in Chl-a within the CE in the Kuroshio region immediately. This was also captured by the BGC-Argo observations. Although Neoguri was weaker, it caused a stronger phytoplankton biomass increase than Hagibis in this region. The previous TC, Hagibis, lifted nutrients to the upper layer, providing conditions that were very favorable to the phytoplankton growth during Neoguri. Furthermore, the intense precipitation induced by Neoguri in the south of Japan brought the coastal water with rich terrestrial material to offshore ocean, increasing nutrients and decreasing salinity. The forcing of Neoguri together with the above two factors resulted in the stronger enhancement of Chl-a.
Two sequential TCs could cause a much more complex biological response than a single TC, particularly in a coastal Kuroshio region demonstrated in this work. In addition, satellite sensing results alone may overestimate and underestimate the effect of TCs on the primary production in the upper ocean because of TC-induced vertical phytoplankton migration and phytoplankton growth in the subsurface, respectively.
The original contributions presented in the study are included in the article/Supplementary Material. Further inquiries can be directed to the corresponding author.
HZ: conceptualization, investigation, methodology, writing – review & editing, formal analysis, validation, visualization and writing – original draft. W-ZZ: conceptualization, formal analysis, investigation, methodology, writing – review & editing, fund acquisition, project administration, resources and supervision.
This work was jointly supported by the State Key R&D project (2022YFF0801404) and the National Natural Science Foundation of China (41776015).
The authors declare that the research was conducted in the absence of any commercial or financial relationships that could be construed as a potential conflict of interest.
All claims expressed in this article are solely those of the authors and do not necessarily represent those of their affiliated organizations, or those of the publisher, the editors and the reviewers. Any product that may be evaluated in this article, or claim that may be made by its manufacturer, is not guaranteed or endorsed by the publisher.
The Supplementary Material for this article can be found online at: https://www.frontiersin.org/articles/10.3389/fmars.2023.1269310/full#supplementary-material
Argo (2000) Argo float data and metadata from global data assembly centre (Argo GDAC). EANOE. Available at: https://www.seanoe.org/data/00311/42182.
Babin S. M., Carton J. A., Dickey T. D., Wiggert J. D. (2004). Satellite evidence of hurricane-induced phytoplankton blooms in an oceanic desert. J. Geophys. Res. 109, C03043. doi: 10.1029/2003jc001938
Chacko N. (2017). Chlorophyll bloom in response to tropical cyclone Hudhud in the Bay of Bengal: Bio-Argo subsurface observations. Deep-Sea Res. Part I-Oceanogr. Res. Pap. 124, 66–72. doi: 10.1016/j.dsr.2017.04.010
Chacko N. (2019). Differential chlorophyll blooms induced by tropical cyclones and their relation to cyclone characteristics and ocean pre-conditions in the Indian Ocean. J. Earth Syst. Sci. 128 (7), 128–177. doi: 10.1007/s12040-019-1207-5
Chai F., Wang Y., Xing X., Yan Y., Xue H., Wells M., et al. (2021). A limited effect of sub-tropical typhoons on phytoplankton dynamics. Biogeosciences 18 (3), 849–859. doi: 10.5194/bg-2020-310
Copernicus Climate Change Service Climate Data Store. (2018). Sea level gridded data from satellite observations for the global ocean from 1993 to present (Copernicus Climate Change Service (C3S) Climate Data Store (CDS). Available at: https://doi.org/10.24381/cds.4c328c78 (accessed January 20, 2022).
Cullen J. J. (2015). Subsurface chlorophyll maximum layers: enduring enigma or mystery solved? Annu. Rev. Mar. Sci. 7, 207–239. doi: 10.1146/annurev-marine-010213-135111
Dickey T., Frye D., McNeil J., Manov D., Nelson N., Sigurdson D., et al. (1998). Upper-ocean temperature response to hurricane Felix as measured by the Bermuda testbed mooring. Mon. Weather Rev. 126 (5), 1195–1201. doi: 10.1175/1520-0493(1998)126<1195:UOTRTH>2.0.CO;2
Falkowaski P. G. (1994). The role of phytoplankton photosynthesis in global biogeochemical cycles. Photosynth. Res. 39, 235–258. doi: 10.1007/BF00014586
Falkowski P. G., Ziemann D., Kolber Z., Bienfang P. K. (1991). Role of eddy pumping in enhancing primary production in the ocean. Nature 352, 55–58. doi: 10.1038/352055a0
Furuya K. (1990). Subsurface chlorophyll maximum in the tropical and subtropical western Pacific Ocean vertical profiles of phytoplankton biomass and its relationship with chlorophylla and particulate organic carbon. Mar. Biol. 107, 529–539. doi: 10.1007/BF01313438
Gaube P., McGillicuddy D. J., Chelton D. B., Behrenfeld M. J., Strutton P. G. (2014). Regional variations in the influence of mesoscale eddies on near-surface chlorophyll. J. Geophys. Res.-Oceans 119 (12), 8195–8220. doi: 10.1002/2014jc010111
Gierach M. M., Subrahmanyam B. (2008). Biophysical responses of the upper ocean to major Gulf of Mexico hurricanes in 2005. J. Geophys. Res. 113, C04029. doi: 10.1029/2007jc004419
Huang L., Zhao H., Pan J., Devlin A. (2016). Remote sensing observations of phytoplankton increases triggered by successive typhoons. Front. Earth Sci. 11 (4), 601–608. doi: 10.1007/s11707-016-0608-x
Huffman G. (2016). TRMM (TMPA-RT) near real-time precipitation L3 3 hour 0.25 Q21 degree x 0.25 degree V7. Eds. MacRitchie K., Greenbelt M. D.. (Goddard Earth Sciences Data and Information Services Center (GES DISC)). doi: 10.5067/TRMM/TMPA/3H-E/7
Jacob S. D., Shay L. K., Mariano A. J., Black P. G. (2000). The 3D oceanic mixed layer response to hurricane Gilbert. J. Phys. Oceanogr. 30 (6), 1407–1429. doi: 10.1175/1520-0485(2000)030<1407:TOMLRT>2.0.CO;2
Jin W., Liang C., Hu J., Meng Q., Lü H., Wang Y., et al. (2020). Modulation effect of mesoscale eddies on sequential typhoon-induced oceanic responses in the South China Sea. Remote Sens. 12 (18), 3059. doi: 10.3390/rs12183059
Johnson K. S., Plant J. N., Coletti L. J., Jannasch H. W., Sakamoto C. M., Riser S. C., et al. (2017). Biogeochemical sensor performance in the SOCCOM profiling float array. J. Geophys. Res.-Oceans 122 (8), 6416–6436. doi: 10.1002/2017jc012838
Kara A. B., Rochford P. A., Hurlburt H. E. (2000). An optimal definition for ocean mixed layer depth. J. Geophys. Res.-Oceans 105 (C7), 16803–16821. doi: 10.1029/2000jc900072
Knapp K. R., Diamond H. J., Kossin J. P., Kruk M. C., Schreck C. J. (2018). International best track archive for climate stewardship (IBTrACS) project, version 4. doi: 10.25921/82ty-9e16
Knapp K. R., Kruk M. C., Levinson D. H., Diamond H. J., Neumann C. J. (2010). The International Best Track Archive for Climate Stewardship (IBTrACS): Unifying tropical cyclone best track data. Bull. Amer. Meteorol. Soc 91 (3), 363–376. doi: 10.1175/2009bams2755.1
Li J., Yang Y., Wang G., Cheng H., Sun L. (2021a). Enhanced oceanic environmental responses and feedbacks to Super Typhoon Nida, (2009) during the sudden-turning stage. Remote Sens. 13, 2648. doi: 10.3390/rs13142648
Li J., Zheng Q., Li M., Li Q., Xie L. (2021b). Spatiotemporal distributions of ocean color elements in response to tropical cyclone: A case study of Typhoon Mangkhut, (2018) past over the northern South China Sea. Remote Sens. 13 (4), 687. doi: 10.3390/rs13040687
Lin I.-I. (2012). Typhoon-induced phytoplankton blooms and primary productivity increase in the western North Pacific subtropical ocean. J. Geophys. Res.-Oceans 117, C03039. doi: 10.1029/2011jc007626
Lin I., Liu W. T., Wu C.-C., Wong G. T. F., Hu C., Chen Z., et al. (2003). New evidence for enhanced ocean primary production triggered by tropical cyclone. Geophys. Res. Lett. 30 (13), 1718. doi: 10.1029/2003gl017141
Lin S., Zhang W.-Z., Shang S.-P., Hong H.-S. (2017). Ocean response to typhoons in the western North Pacific: Composite results from Argo data. Deep-Sea Res. Part I-Oceanogr. Res. Pap. 123, 62–74. doi: 10.1016/j.dsr.2017.03.007
Liu J. T., Kao S. J., Huh C. A., Hung C. C. (2013). Gravity flows associated with flood events and carbon burial: Taiwan as instructional source area. Annu. Rev. Mar. Sci. 5, 47–68. doi: 10.1146/annurev-marine-121211-172307
Liu F., Tang S. (2018). Influence of the interaction between typhoons and oceanic mesoscale eddies on phytoplankton blooms. J. Geophys. Res.-Oceans 123 (4), 2785–2794. doi: 10.1029/2017jc013225
Liu X., Wang M., Shi W. (2009). A study of a hurricane Katrina–induced phytoplankton bloom using satellite observations and model simulations. J. Geophys. Res. 114, C03023. doi: 10.1029/2008jc004934
Mei W., Lien C.-C., Lin I. I., Xie S.-P. (2015). Tropical cyclone–induced ocean response: A comparative study of the South China Sea and tropical northwest Pacific. J. Clim. 28 (15), 5952–5968. doi: 10.1175/jcli-d-14-00651.1
Pan G., Chai F., Tang D., Wang D. (2017). Marine phytoplankton biomass responses to typhoon events in the South China Sea based on physical-biogeochemical model. Ecol. Model. 356, 38–47. doi: 10.1016/j.ecolmodel.2017.04.013
Pan J., Huang L., Devlin A., Lin H. (2018). Quantification of typhoon-induced phytoplankton blooms using satellite multi-sensor data. Remote Sens. 10 (2), 318. doi: 10.3390/rs10020318
Price J. F. (1981). Upper ocean response to a hurricane. J. Phys. Oceanogr. 11 (2), 153–175. doi: 10.1175/1520-0485(1981)011<0153:UORTAH>2.0.CO;2
Price J. F., Morzel J., Niiler P. P. (2008). Warming of SST in the cool wake of a moving hurricane. J. Geophys. Res.-Oceans 113 (C7), C07010. doi: 10.1029/2007jc004393
Price J. F., Sanford T. B., Forristall G. Z. (1994). Forced stage response to a moving hurricane. J. Phys. Oceanogr. 24 (2), 233–260. doi: 10.1175/1520-0485(1994)024<0233:Fsrtam>2.0.Co;2
Qiu G., Xing X., Chai F., Yan X.-H., Liu Z., Wang H. (2021). Far-field impacts of a super typhoon on upper ocean phytoplankton dynamics. Front. Mar. Sci. 8. doi: 10.3389/fmars.2021.643608
Schade L. R., Emanuel K. A. (1999). The Ocean’s effect on the intensity of tropical cyclones: Results from a simple coupled atmosphere–ocean model. J. Atmos. Sci. 56 (4), 642–651. doi: 10.1175/1520-0469(1999)056<0642:TOSEOT>2.0.CO;2
Siswanto E., Morimoto A., Kojima S. (2009). Enhancement of phytoplankton primary productivity in the southern East China Sea following episodic typhoon passage. Geophys. Res. Lett. 36, L11603. doi: 10.1029/2009gl037883
Subrahmanyam B., Rao K. H., Srinivasa Rao N., Murty V. S. N., Sharp R. J. (2002). Influence of a tropical cyclone on chlorophyll-a concentration in the Arabian Sea. Geophys. Res. Lett. 29 (22), 1–4. doi: 10.1029/2002gl015892
Walker N. D., Leben R. R., Balasubramanian S. (2005). Hurricane-forced upwelling and chlorophyll-a enhancement within cold-core cyclones in the Gulf of Mexico. Geophys. Res. Lett. 32, L18610. doi: 10.1029/2005gl023716
Wang Y. (2020). Composite of typhoon-induced sea surface temperature and chlorophyll-a responses in the South China Sea. J. Geophys. Res.-Oceans 125, e2020JC016243. doi: 10.1029/2020jc016243
Wang T., Chai F., Xing X., Ning J., Jiang W., Riser S. C. (2021). Influence of multi-scale dynamics on the vertical nitrate distribution around the Kuroshio Extension: An investigation based on BGC-Argo and satellite data. Prog. Oceanogr. 193, 102543. doi: 10.1016/j.pocean.2021.102543
Xu F., Yao Y., Oey L., Lin Y. (2017). Impacts of pre-existing ocean cyclonic circulation on sea surface chlorophyll-a concentrations off northeastern Taiwan following episodic typhoon passages. J. Geophys. Res.-Oceans 122 (8), 6482–6497. doi: 10.1002/2016jc012625
Ye H. J., Sui Y., Tang D. L., Afanasyev Y. D. (2013). A subsurface chlorophyll a bloom induced by typhoon in the South China Sea. J. Mar. Syst. 128, 138–145. doi: 10.1016/j.jmarsys.2013.04.010
Zhao H., Han G., Zhang S., Wang D. (2013). Two phytoplankton blooms near Luzon Strait generated by lingering Typhoon Parma. J. Geophys. Res.-Biogeosci. 118 (2), 412–421. doi: 10.1002/jgrg.20041
Zhao H., Tang D., Wang Y. (2008). Comparison of phytoplankton blooms triggered by two typhoons with different intensities and translation speeds in the South China Sea. Mar. Ecol.-Prog. Ser. 365, 57–65. doi: 10.3354/meps07488
Zheng Z.-W., Ho C.-R., Kuo N.-J. (2008). Importance of pre-existing oceanic conditions to upper ocean response induced by Super Typhoon Hai-Tang. Geophys. Res. Lett. 35, L20603. doi: 10.1029/2008gl035524
Zheng Z.-W., Ho C.-R., Zheng Q., Kuo N.-J., Lo Y.-T. (2010). Satellite observation and model simulation of upper ocean biophysical response to Super Typhoon Nakri. Cont. Shelf Res. 30 (13), 1450–1457. doi: 10.1016/j.csr.2010.05.005
Zheng G. M., Tang D. (2007). Offshore and nearshore chlorophyll increases induced by typhoon winds and subsequent terrestrial rainwater runoff. Mar. Ecol.-Prog. Ser. 333, 61–74. doi: 10.3354/meps333061
Keywords: chlorophyll-a enhancement event, tropical cyclone, BGC-Argo, Kuroshio region, eddy
Citation: Zheng H and Zhang W-Z (2023) An extraordinary chlorophyll-a enhancement event jointly induced by two sequential tropical cyclones in the Kuroshio region south of Japan. Front. Mar. Sci. 10:1269310. doi: 10.3389/fmars.2023.1269310
Received: 29 July 2023; Accepted: 06 September 2023;
Published: 28 September 2023.
Edited by:
Fajin Chen, Guangdong Ocean University, ChinaCopyright © 2023 Zheng and Zhang. This is an open-access article distributed under the terms of the Creative Commons Attribution License (CC BY). The use, distribution or reproduction in other forums is permitted, provided the original author(s) and the copyright owner(s) are credited and that the original publication in this journal is cited, in accordance with accepted academic practice. No use, distribution or reproduction is permitted which does not comply with these terms.
*Correspondence: Wen-Zhou Zhang, endlbnpob3VAeG11LmVkdS5jbg==
Disclaimer: All claims expressed in this article are solely those of the authors and do not necessarily represent those of their affiliated organizations, or those of the publisher, the editors and the reviewers. Any product that may be evaluated in this article or claim that may be made by its manufacturer is not guaranteed or endorsed by the publisher.
Research integrity at Frontiers
Learn more about the work of our research integrity team to safeguard the quality of each article we publish.