- 1Department of Oceanography, National Institute of Oceanography and Experimental Geophysics, Trieste, Italy
- 2Oceanography Center, University of Cyprus, Nicosia, Cyprus
- 3Institute of Earth Sciences, The Hebrew University of Jerusalem, Jerusalem, Israel
Wavelet ridge analysis was applied to the data of drifters caught in the Cyprus Gyre in the eastern Mediterranean Sea to study surface currents at low (rotating circulation) and high (near-inertial motion) frequencies. Drifter observations indicate that the orbital speed is highest at about 30 km from the gyre center (reaching ~45 cm/s) and that the Rossby number in the gyre can be as high as 0.25. Drifters also show that strong near-inertial currents with speed of 35-40 cm/s can exceed the gyre rotation speed and that the background vorticity inside the gyre generally shifts the effective inertial frequency to values smaller than the local inertial frequency. As a result, the near-inertial currents are subinertial and are trapped in the mesoscale vortex. For example, the near-inertial motions in the Cyprus Gyre in June 2017 reached 40 cm/s in its inner core with a red shift of ~0.1 cpd, while on its edge they were limited to 10-20 cm/s, under similar wind forcing. This difference is due to trapping of the near-inertial energy inside the gyre. The observed inertial currents are largely driven by the local wind, especially when the effective inertial frequency becomes diurnal and resonance with wind diurnal variability occurs. A damped slab model of the inertial currents in the mixed layer is only partially successful in simulating the observations.
1 Introduction
Ocean currents vary over a wide range of temporal and spatial scales, from the thermohaline geostrophic circulation of the world ocean (thousands of kilometers) to microstructure turbulence (centimeters). However, the broad spectrum of ocean currents is dominated by several peaks at specific frequencies, corresponding to mesoscale eddies and fronts, near-inertial and tidal currents. These circulation features mix and transport water properties, dissolved gases, contaminants and trace substances. In particular, mesoscale ocean eddies, at spatial scales from about 10 to 100 km, play an important role in mixing tracers such as heat, carbon and nutrients in the ocean (Martínez-Moreno et al., 2021).
Although widespread in the world ocean, wind-driven near-inertial waves or near-inertial oscillations (NIOs) are generally intermittent in time and highly variable in space (D'Asaro, 1985a; Kunze, 1985; Elipot and Lumpkin, 2008; Alford, 2020). They are mostly dominant in the surface mixed layer but propagate downward in the underneath thermocline. Longuest vertical modes can propagate over long distances towards the equator (Alford, 2003) while waves with shorter vertical wavelengths can produce local turbulence and mixing in the water column due to shear instability. Hence, they are critical to the overall energy of the ocean because they carry a significant fraction of kinetic energy into the interior of the ocean (Ferrari and Wunsch, 2009; Alford et al., 2016). Near-inertial waves are also important because by breaking they can cause mixing that affects biological productivity (Granata et al., 1995), maintains the ocean thermohaline circulation (Munk and Wunsch, 1998), and impacts ocean climate (Jochum et al., 2013: Whalen et al., 2020). The formation and temporal evolution of NIOs forced by winds have been studied with some success using various dynamical models (see review in Alford, 2020).
NIOs interact with the shear of mean or low-frequency currents, and the vorticity of the background mesoscale circulation significantly modifies their frequency (Mooers, 1975; Perkins, 1976; Kunze, 1985; Kunze et al., 1995). In particular, anticyclonic vorticity lowers the effective inertial frequency and subinertial NIOs are trapped and enhanced in areas of negative vorticity (Kawaguchi et al., 2020). For mean currents with vorticity, the effective inertial frequency, which is the lowest frequency at which free internal gravity waves can exist, is given by (Kunze, 1985; Poulain et al., 1992):
where f = 2 Ω sin(latitude) is the local inertial frequency and Ω is the angular velocity of the Earth. The formation, propagation and energetics of NIOS in geostrophic shear flows and strongly baroclinic currents have been studied by Kunze (1985) and Whitt and Thomas (2013); Whitt and Thomas (2015). The trapping of NIOs in an anticyclonic eddy under normal atmospheric conditions was studied by Martínez-Marrero et al. (2019) using ship-mounted acoustic Doppler current profiler (ADCP) observations. The propagation and trapping of NIOs were also investigated by Byun et al. (2010) in the East/Japan Sea using moored temperature and velocity measurements and by Cuypers et al. (2012) using conductivity-temperature-depth (CTD) measurements and lowered acoustic Doppler current profiler (ADCP) in the Eastern Mediterranean Sea (EMS). Cuypers et al. (2012) found strong NIOs at the base of an anticyclonic mesoscale eddy south of Cyprus, called the Cyprus Eddy or the Cyprus Gyre (CG), along with high dissipation rates. Inspired by these observations, Lelong et al. (2020) performed numerical simulations to investigate the role of near-inertial/eddy interactions in energy transfer from the surface mixed layer. They found that wind-driven inertial energy propagates downward in the CG as near-inertial waves and accumulate at the base of the gyre near 600-m depth, where shear instability and turbulent dissipation is likely to happen.
NIOs at the ocean surface occur ubiquitously as small loops in the tracks of Lagrangian drifters (Poulain, 1990; Poulain et al., 1992; D'Asaro et al., 1995; Niiler and Paduan, 1995; van Meurs, 1998; Elipot and Lumpkin, 2008; Rohrs et al., 2023) which can be up to ~10 km in diameter. Several statistical methods have been used to extract the near-inertial signals from drifter velocity time series: complex demodulation (Poulain, 1990; Poulain et al., 1992; Chaigneau et al., 2008), scale spectral moment (Poulain et al., 1992), spectral method (Elipot et al., 2010) and wavelet analysis (Lilly and Gascard, 2006; Lilly et al., 2011; Lilly and Perez-Brunius, 2021). NIOS have also been studied in the world ocean using surface drifts of Argo floats (Park et al., 2004; Park et al., 2005).
Observations of NIOs in the Mediterranean Sea date back to the 1960s and 1970s (Lacombe and Gonella, 1964; Gonella et al., 1967; Perkins, 1972; Millot and Crépon, 1981), using moored current meters and thermistor chains. More recently, they have been measured with ADCPs and current meters on the shelf in the Western Mediterranean Sea (Rippeth et al., 2002; Petrenko et al., 2005). Maximum surface NIOs can reach 60 cm/s (Petrenko et al., 2005) and occur mainly in summer when enhanced in the surface mixed layer.
Surface currents in the EMS is characterized by a mean cyclonic basin-wide circulation, multiple cyclonic gyres and recurrent or quasi-permanent anticyclonic structures (Robinson et al., 1991; Estournel et al., 2021; Menna et al., 2021). The circulation and water mass properties of these eddies have been described in several papers (Menna et al., 2012; Menna et al., 2021: Amitai et al., 2010; Hayes et al., 2019; Mauri et al., 2019) using in situ observations (drifter, Argo float and glider) and satellite data (sea surface temperature, absolute dynamic topography). In particular, the CG is a major quasi-permanent vortex south of the island of Cyprus. It is located near, and partially controlled by, Eratosthenes Seamount, a major topographic feature with a horizontal extent of ~100 km, an elevation of ~2000 m, a peak depth of ~690 m and a center near 33°N37.50’ and 32°E41.25’ (see Figure 1). It has been extensively studied using satellite and in situ observations (ship-based, glider, Argo float and drifter measurements) by Zodiatis et al. (2005); Groom et al. (2005); Cuypers et al. (2012); Menna et al. (2012), and Mauri et al. (2019), to name a few. The CG is similar to an anticyclonic mode water eddy (Fernández-Castro et al., 2020) with upward bending of the isopycnals over a warm and saline pycnostad extending between roughly 100 and 350 m, and a downward bending below it (Hayes et al., 2011; Cuypers et al., 2012; Mauri et al., 2019). On top of this feature a mixed layer and seasonal thermocline prevail most of the year. The hydrodynamic theory of the CG was recently investigated by Egorova et al. (2022) and Pirro et al. (2023), with particular focus on its generation mechanism. The basic characteristics of the CG were estimated by Prigent and Poulain (2017) from drifter tracks: they found a radius ~40 km, rotation period ~5-10 days, and southeastward translation at ~150 m/day in spring and summer 2017.
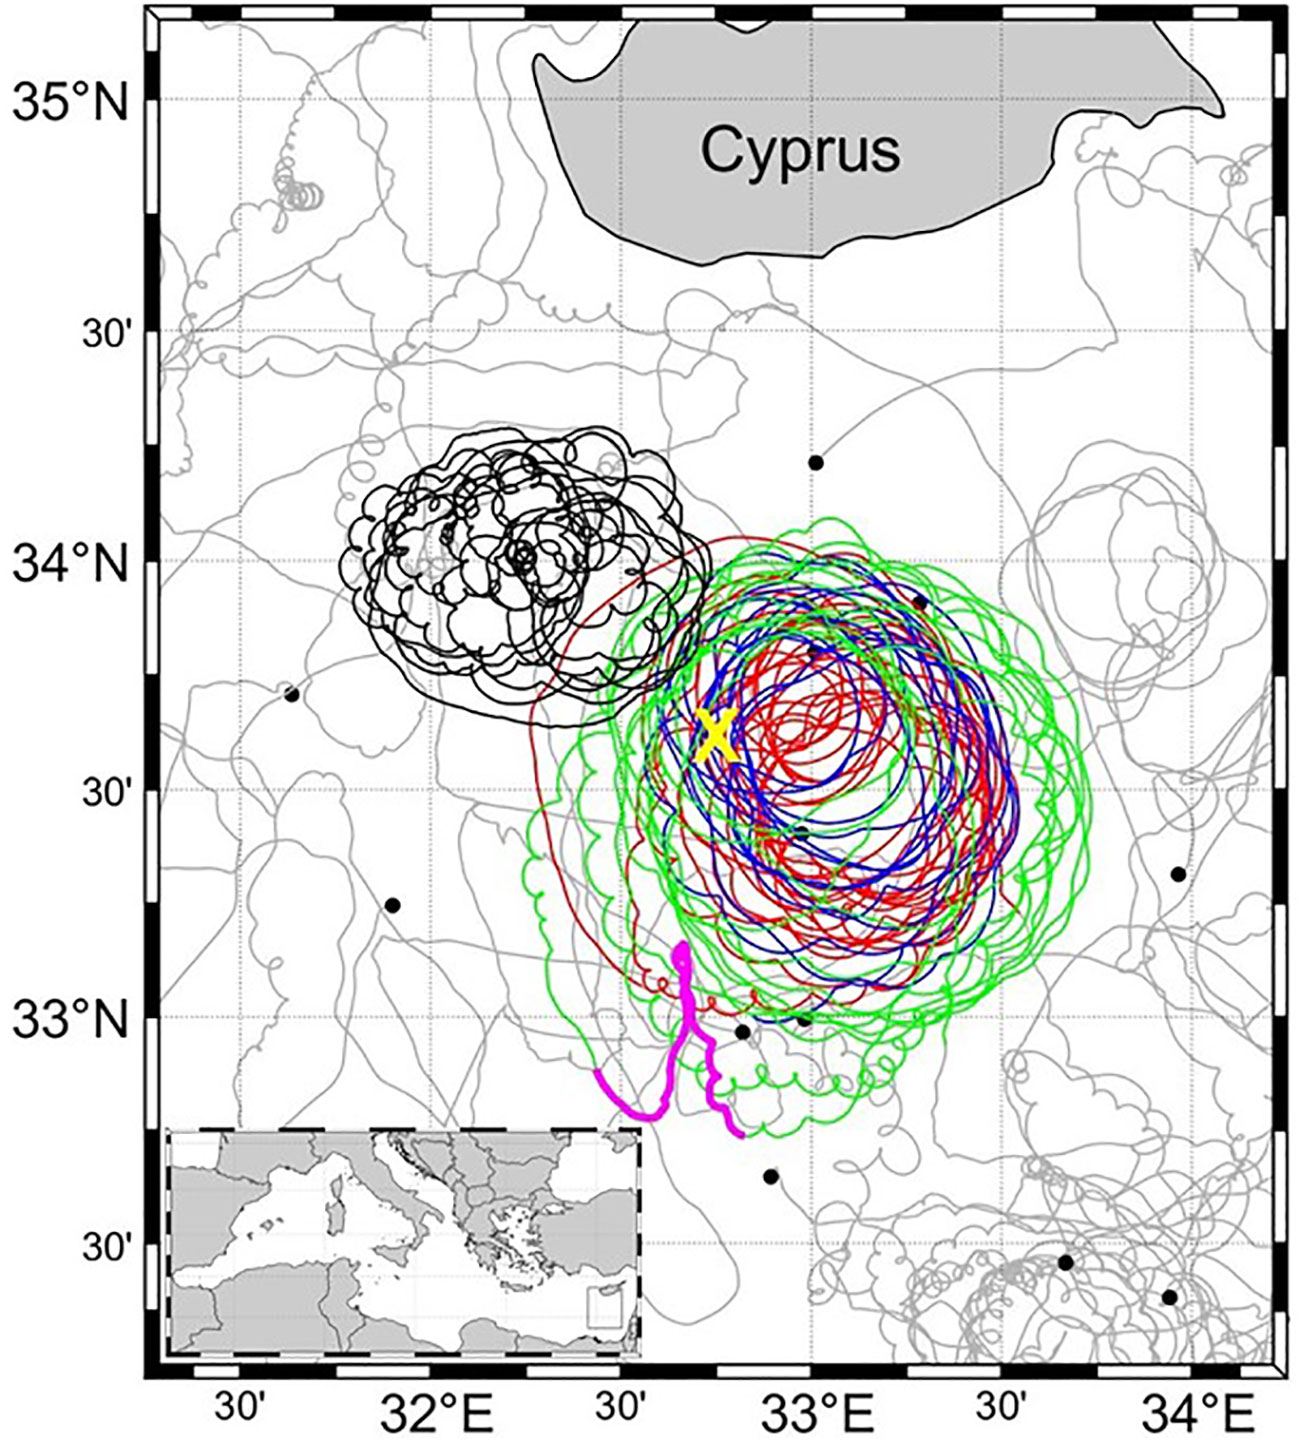
Figure 1 CINEL and MELMAS drifter data in 2017-2019 south of Cyprus in the Eastern Mediterranean Sea: deployment locations (black dots) and tracks (gray). The drifter tracks caught in the CG are shown with colors (in 2017) and in black (in 2019). The location of the Eratosthenes Seamount is shown with a yellow “X”. A kink in the drifter track is indicated in magenta. Inset: Mediterranean Sea with rectangle corresponding to the study area south of Cyprus.
This work follows up on the study of Prigent and Poulain (2017). The data of near-surface currents provided by Lagrangian drifters deployed in the EMS (Figure 1) are exploited to further study the morphology and kinematics of the CG and the NIOs amplified in its core. Details on the drifter data and ancillary operational products are provided in Section 2, along with information about the wavelet ridge analysis applied to the drifter position and velocity time series. Results on the characteristics of the CG and NIOs are presented in Section 3, including a focused analysis of the effective inertial frequency and its relationship to background vorticity and of the forcing by the local winds. The main results are discussed and summarized in Section 4.
2 Data and methods
2.1 Drifter data
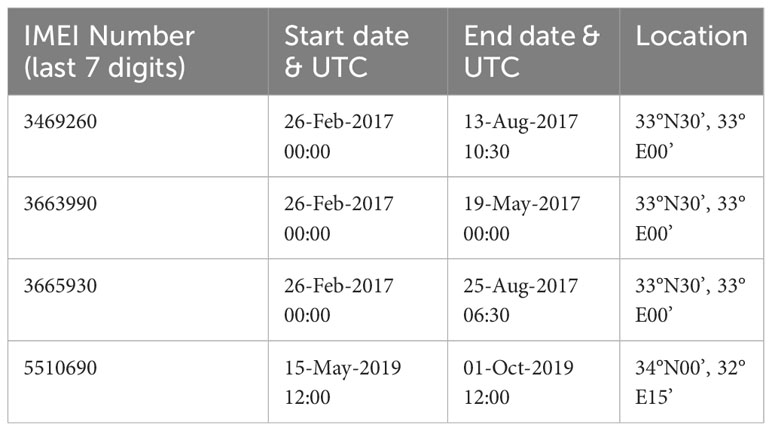
The drifter data used in this work were downloaded from the OGS Mediterranean drifter database (Menna et al., 2017). They include Surface Velocity Program (SVP) drifters deployed in the EMS as part of two projects: the CIrculation and water mass properties in the North Eastern Levantine (CINEL) project in 2016-2018, and the Monitoring of the Eastern Levantine with Mobile Autonomous Systems (MELMAS) project in 2018-2020. SVP drifters are fitted with a drogue to measure the currents at 15-m nominal depth. The trajectories of all CINEL (16 units) and MELMAS (12 units) drifters in the EMS are shown in Figure 1. Trajectory segments of drifters captured in the CG are highlighted in color and in black. In 2017, three drifters stayed in the gyre for up to 6 months (Table 1). One additional drifter sampled the CG between May and October 2019. In 2017, the CG was centered southeast of the Eratosthenes Seamount, while in 2019 it was more to the northwest (see Figure 1).
In the OGS database, SVP data were processed using standard methods for editing and interpolation (Menna et al., 2017; Menna et al., 2018). Velocities were estimated by finite differencing successive Global Positioning System (GPS) positions interpolated at 0.5 h intervals.
2.2 Operational products
Daily absolute dynamic topography (ADT) and corresponding absolute geostrophic velocities on a 0.125° Mercator projection grid were downloaded from the Copernicus Marine Environment Monitoring Service for the EMS area. The ADT was determined by adding the sea level anomaly to the 20-year synthetic mean over the period 1993-2012 (Rio et al., 2014).
Data of wind speed and direction 10 m above sea level were downloaded from the Copernicus Climate Data Store for 2017 and 2019 in the EMS. They correspond to the fifth generation ECMWF reanalysis (ERA5) for global climate and weather and are available on a 0.25° x 0.25° grid at hourly intervals.
2.3 Data analysis methods
We used wavelet ridge analysis to characterize elliptical (or circular) motions in the drifter tracks (Lilly and Gascard, 2006: Lilly et al., 2011; Lilly and Perez-Brunius, 2021). The method was applied to the partial track segments when the drifters were rotating in the CG. The positions were first converted to zonal and meridional distances with respect to an approximated mean position of the gyre center. Second, we calculated the bivariate rotary wavelet continuous transforms of the position and velocity time series using generalized Morse wavelets for both negative (anticyclonic) and positive (cyclonic) rotations. Then, a ridge detection algorithm was applied to identify the continuous one-sided ridges with maximum transform amplitudes. Since we are only interested in the properties of the anticyclonic CG and the NIOs, the ridge detection analysis was only performed for negative rotary wavelet transforms. More details about the wavelet ridge analysis can be found in the Appendix.
Spectral analysis was performed on the wind and drifter velocity time series, using the multi-taper approach using seven slepian tapers with a time-bandwidth product of 4 (Percival and Walden, 1993).
Following D’Asaro (1985b), a simple damped slab model of the mixed layer was used to estimate inertial currents forced by the local wind stress. ERA5 winds were used along with and an effective inertial frequency equals to f and 90% f. For the period between May and September, the depth of the mixed layer was set at 20 m. For late winter and early spring (March and April), it was chosen to decrease linearly between 200 and 20 m in two months, to represent the formation of the seasonal mixed layer. The best qualitative fit with the drifter observations was obtained using a damping coefficient of 1/3 d-1.
3 Results
3.1 The CG in 2017
As an example, the amplitude of the anticyclonic rotary wavelet transform is plotted versus time and period (scale) in Figure 2 for one of the three drifters that were trapped in the CG between February and August 2017. Results are shown for both position and velocity time series, and estimated ridges are highlighted. The signature of both the orbital motion of the CG and the NIOs is well detected by the ridge analysis. The NIOs are more visible in the wavelet transforms calculated with the drifter velocities because their speeds are comparable to the gyre rotation speed. In contrast, for position wavelets, the looping tracks caused by the gyre and NIOs have radii that differ by an order of magnitude. As a result, NIOs are barely visible when using the same color scale.
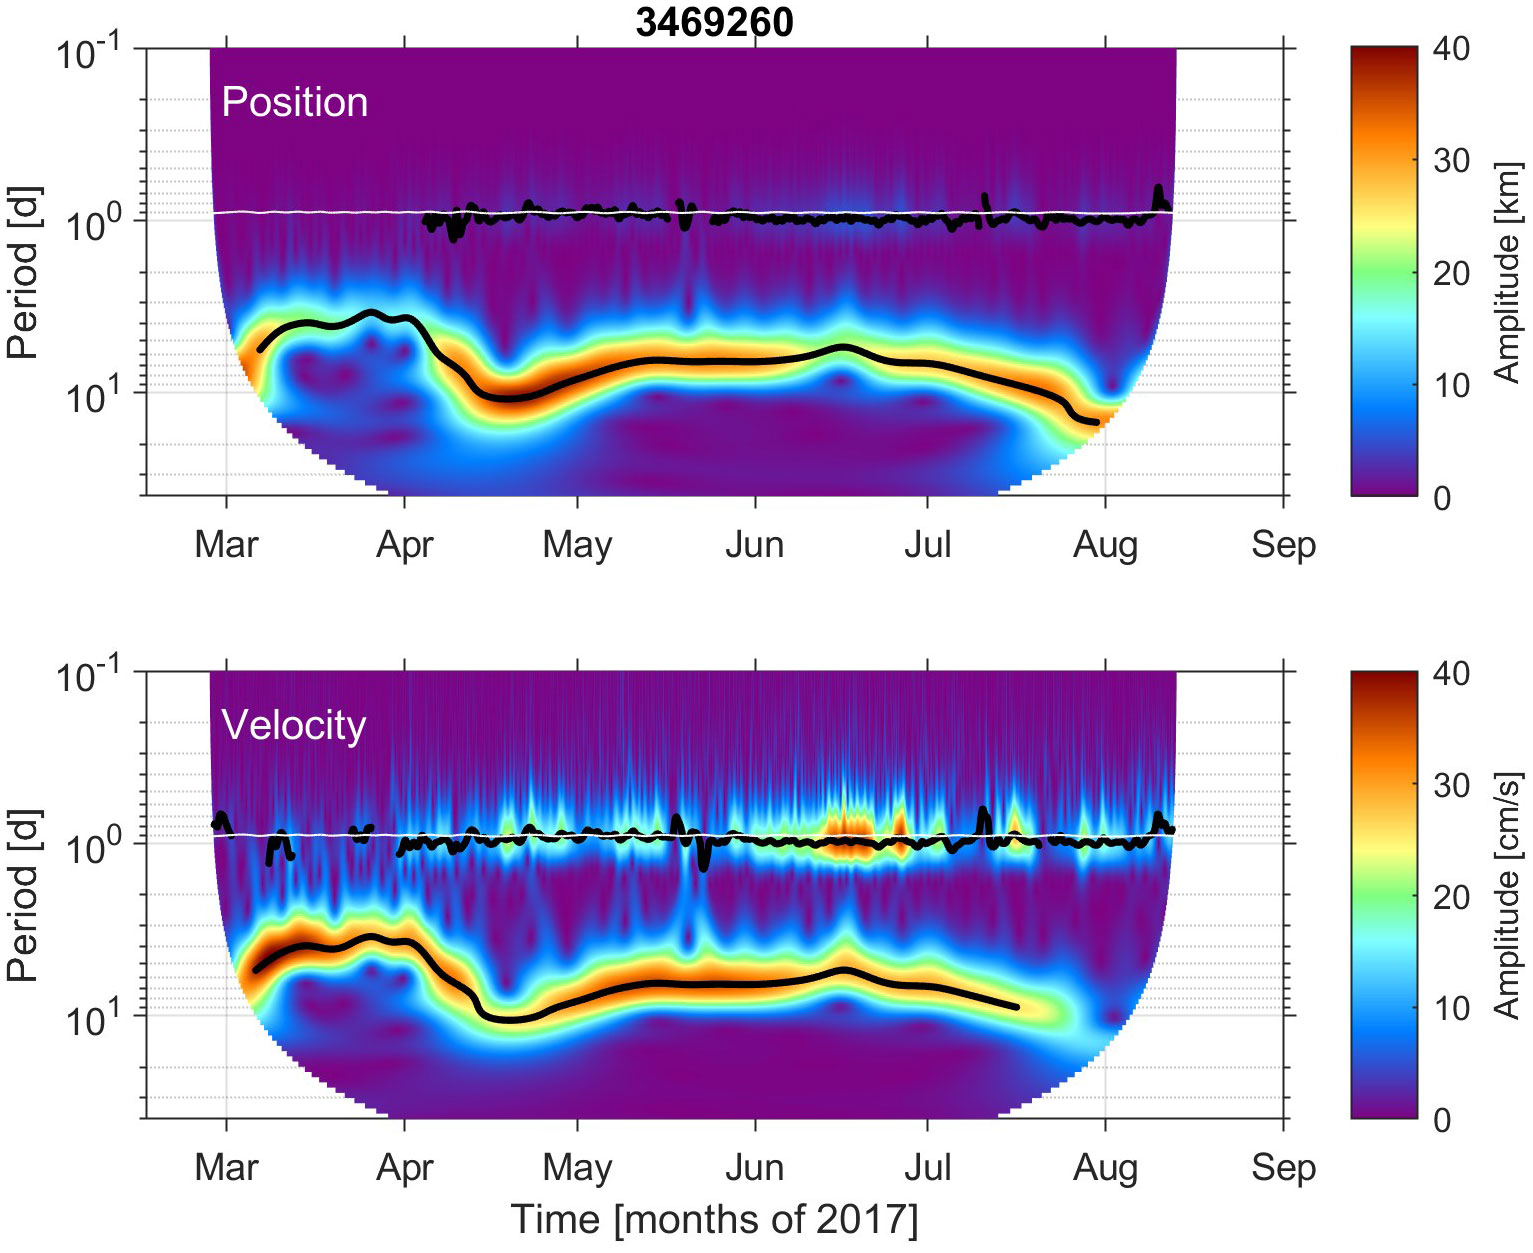
Figure 2 Anticyclonic rotary wavelet transform amplitudes versus time and periods for drifter 3469260 trapped in the CG between 26 February and 13 August 2017, using position (top) and velocity (bottom) time series. Black curves represent the main trimmed ridges at the low (gyre rotation) and high (near-inertial) frequencies. The inertial period is shown with a white line.
The characteristics of the CG rotation and NIOs along the detected ridges are plotted as a function of time in Figures 3–5. For drifter 3469260 (Figure 3), the period of gyre rotation varies from 4 to 11 days, and the semi-axes of the drifter loops span 12-42 km. In April, the semi-minor axis is significantly smaller than the semi-major axis. This corresponds to an eccentricity close to 0.6-0.7 of the drifter orbit. In March, the maximum orbital speed of the CG is up to 41 cm/s while NIOs are quite lacking. In contrast, in June, the rotation speed of the gyre drops to 30 cm/s and NIOs dominate (with speeds reaching 39 cm/s). Drifter 3663990 (Figure 4) stayed in the CG only for two months (March and April) at a radius of 20-40 km, a period of 5-10 days and an orbital speed near 40 cm/s. NIOs were significant only in late April and early May, with amplitude exceeding 25 cm/s. Initially, drifter 3665930 rotated around the gyre with fast speed (~ 45 cm/s) at a radius of 30-40 km (Figure 5). In early April, the radius and speed decreased to ~20 km and ~10 cm/s, but this was due to a kink in the track corresponding to another small circulation feature near the edge of the CG (see Figure 1). Later the drifter stabilized with a radius of ~50 km, a speed of 20-25 cm/s and a period of 15-20 days. The NIOs were mostly significant in May with amplitudes greater than 30 cm/s (Figure 5).
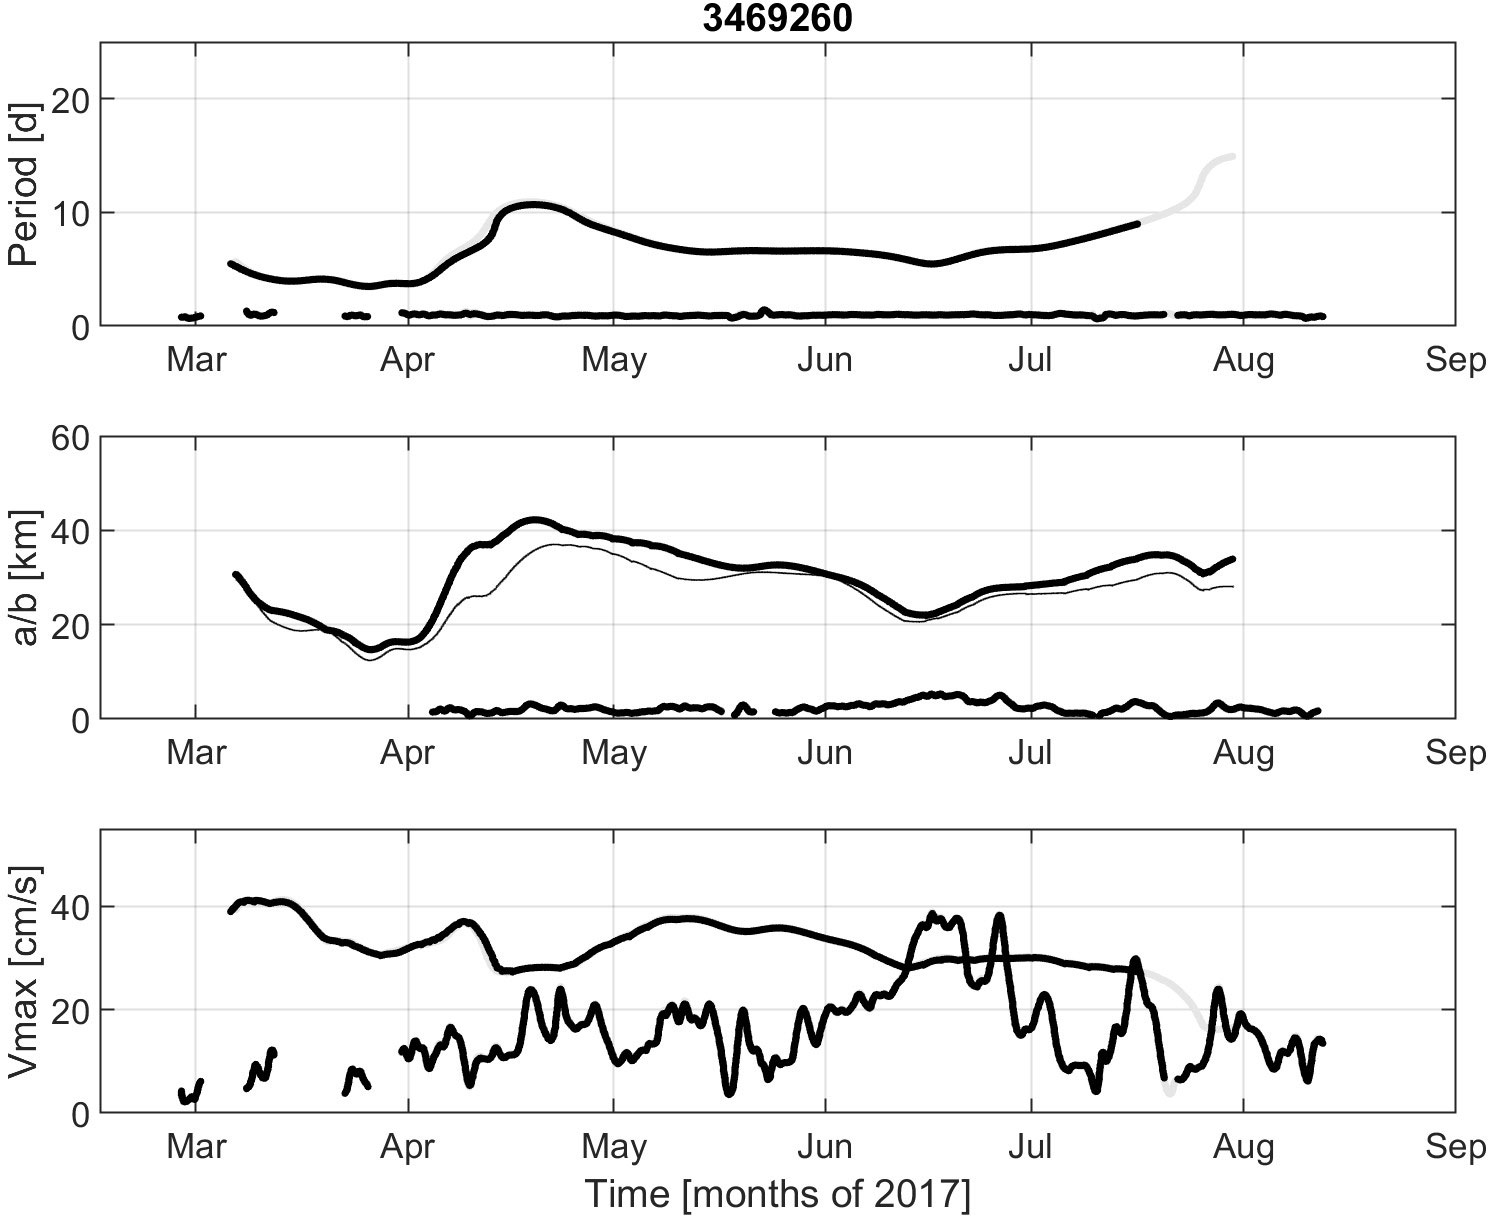
Figure 3 Characteristics of the elliptical motion corresponding to the position (gray) or velocity (black) wavelet ridges shown in Figure 2 for drifter 3469260. Top: Period. Middle: Semi-major axis (a, thick) and semi-minor axis (b, thin). Bottom: Maximum speed (Vmax). The anticyclonic rotary motion of the drifter in the CG (longer period and larger axes) and the near-inertial motions (period near one day and shorter axes) are nicely separated. The speed of the NIOS is intermittent and can exceed at times the rotation speed of the gyre.
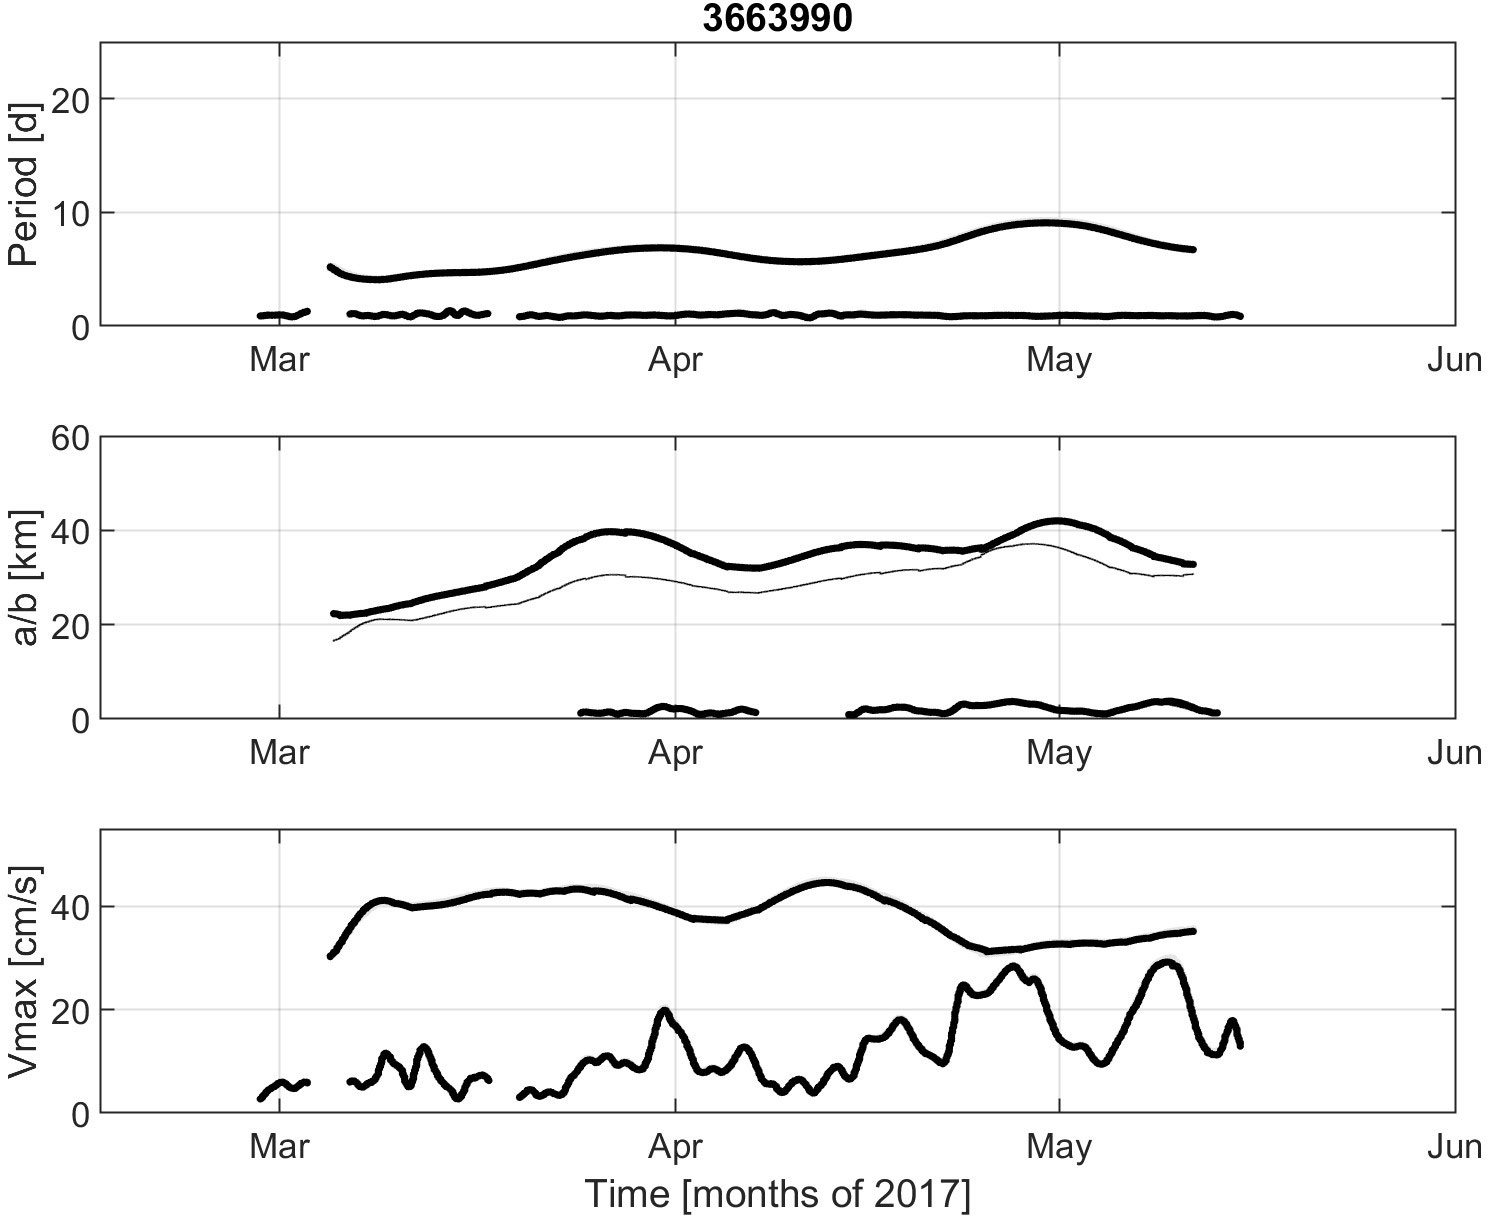
Figure 4 Same as Figure 3 but for drifter 3663990.
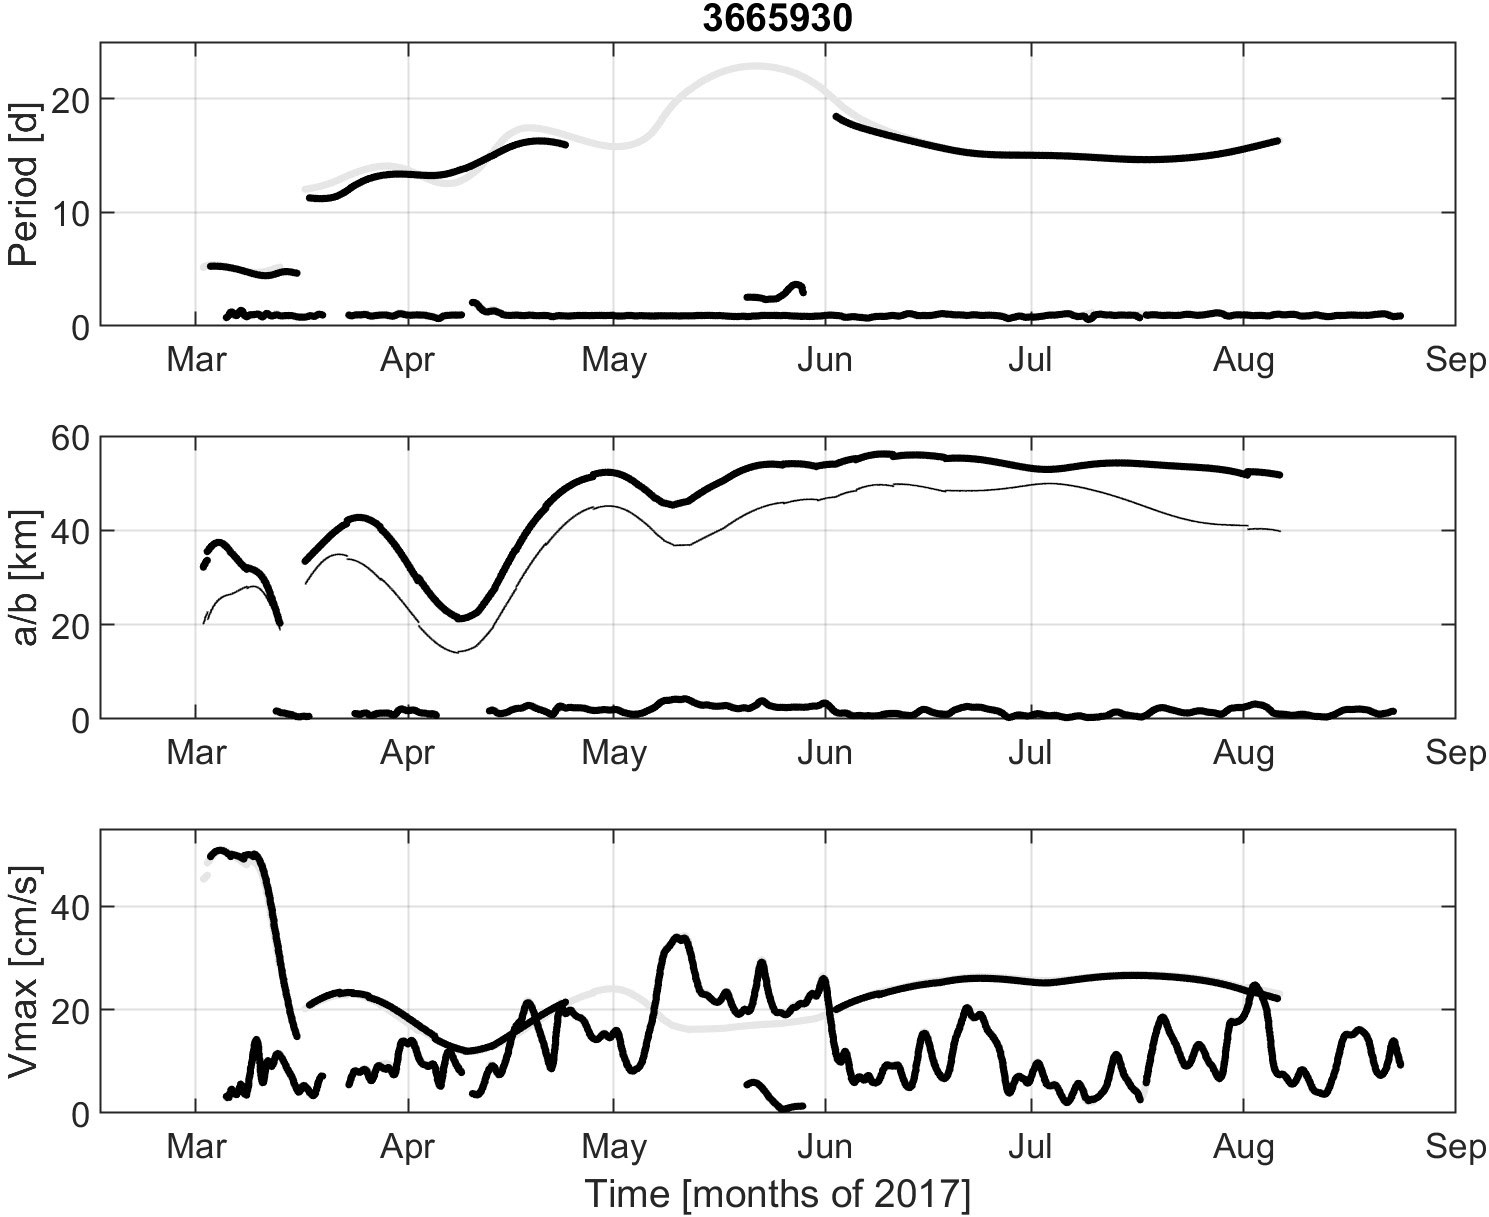
Figure 5 Same as Figure 3 but for drifter 3665930.
The location of the center of the CG was estimated from the three drifters by removing the gyre orbital motion and NIOs from the original tracks. It was found that, between March and July 2017, the CG moved to the southeast with speed of 0.2 km/day (not shown). This is in good agreement with previous estimates by Prigent and Poulain (2017).
The characteristics of the NIOs in the CG, based on the three drifters trapped in 2017, are intermittent in time (Figure 6). Speed (radius) varies between zero and 39 cm/s (5.1 km). The amplitude of the NIOs can be significantly different from one drifter to the other, although they are separated by less than 100 km. For instance in June, the speed of drifter 3665930 is bounded by 20 cm/s, while as seen above, the speed of the other drifter reaches ~40 cm/s. The effective inertial frequency is generally redshifted by about 10% in June-August. In contrat, there is no significant shift in late April and May. There is only a qualitative agreement between the inertial currents simulated by the damped slab model and those observed by the drifters. If a red shift of inertial frequency of 10% is used, inertial currents are stronger, especially in June when the effective inertial frequency of the drifter currents is shifted by about 10% and is nearly diurnal.
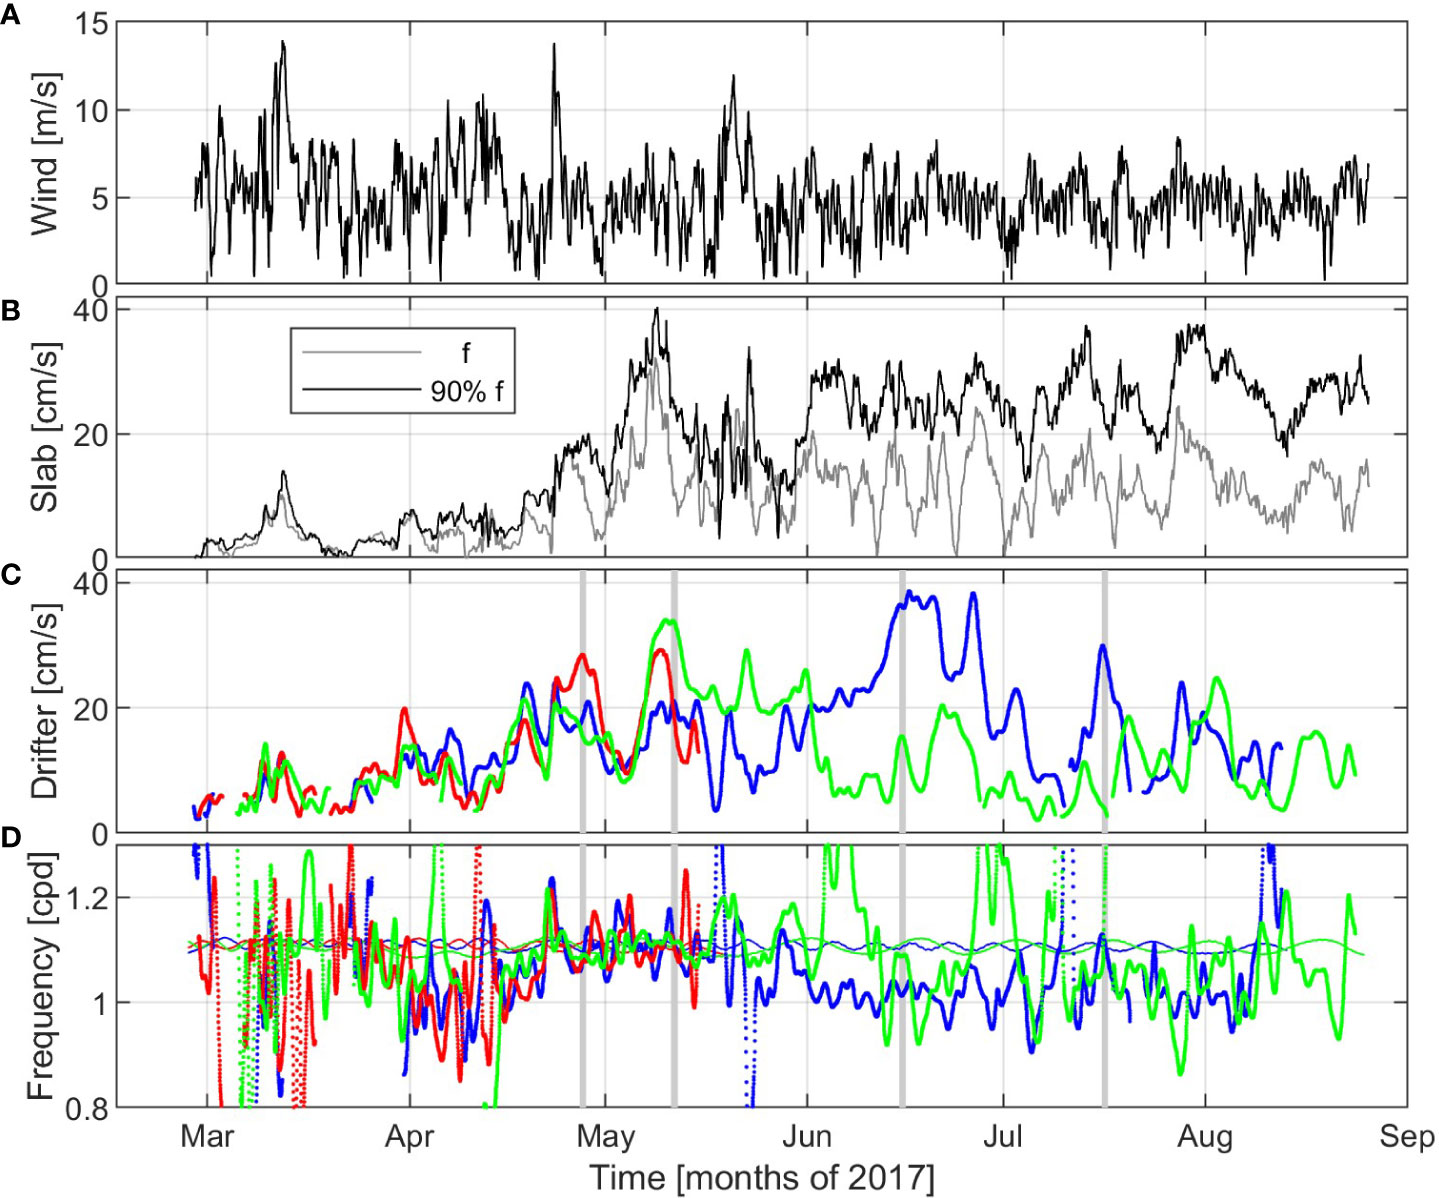
Figure 6 ERA5 wind speed interpolated at the CG center (33°N30’, 33°E) (A). Speed simulated by a damped slab model of the mixed layer with effective inertial frequency equals to f (gray) and 90% f (black) (B). Maximal orbital speed (C) and frequency (D) of near-inertial motions as determined with wavelet ridge analysis (using velocity time series) for the three drifters trapped in the CG: 3469260 (blue), 3663990 (red) and 3665930 (green). The inertial frequency at the latitude of the drifters is shown with thin lines of the same color in the bottom panel. The days with strong NIOs considered later in the paper are highlighted with gray bars.
The rotational properties of both the gyre and the NIOs can be illustrated by plotting the mean orbital speed against the geometrical mean radius. This is shown in Figure 7 for the three drifters in the CG using position wavelet results. NIOs appear on the straight line with a slope or angular velocity slightly greater than f for radius values less than ~5 km. For larger radius (between 15 and 55 km), the results correspond to the gyre rotation. For radii of 20-30 km, the mean rotation speed is maximum (approaching 45 cm/s), while for 40-50 km, it is limited by 25 cm/s. Orbital speeds less than 20 cm/s for radii of 20-40 km are due to a kink in the track of drifter 3665930 that does not follow the main CG rotation. The angular velocity in the gyre varies from f/4 in its inner core (15 km from the center) to f/20 or less near its outer edge. Therefore, the maximum Rossby number within the gyre is about 0.25. From Stokes’ theorem, it can be deduced that the average vorticity within the inner loop is twice the angular velocity, i.e., close to f/2.
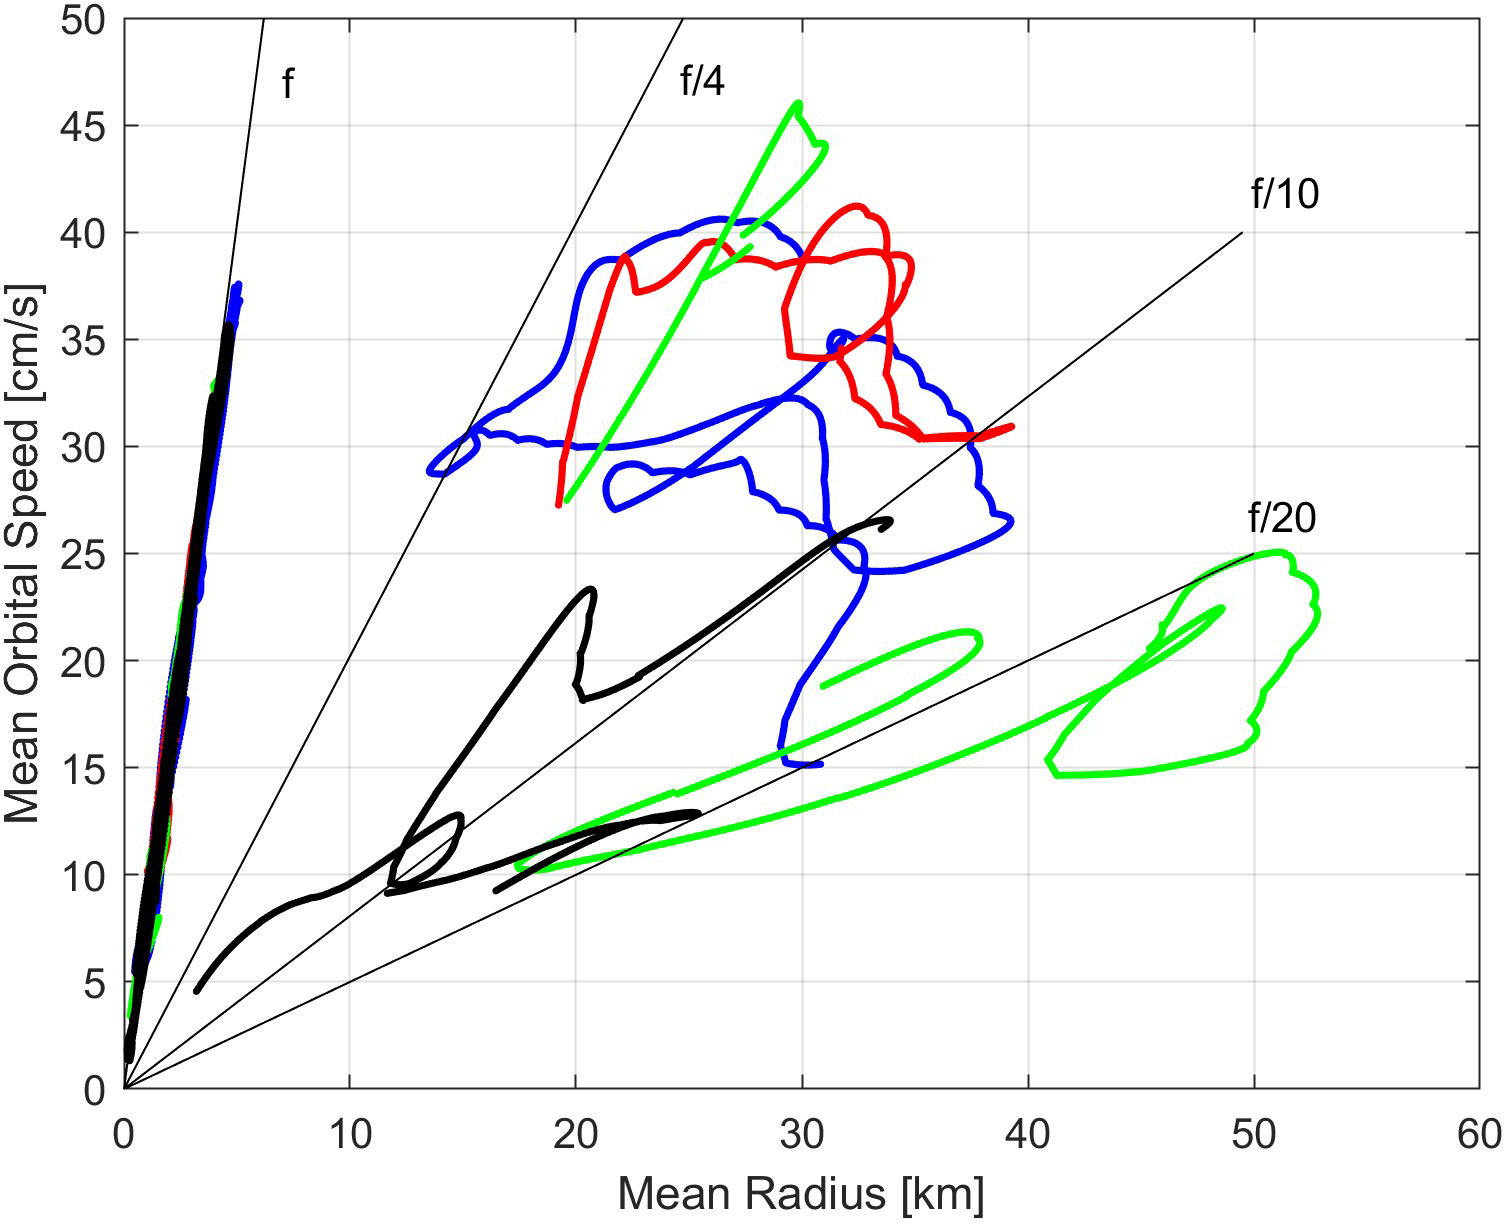
Figure 7 Mean orbital speed versus geometrical mean radius for the drifters trapped in the CG in 2017 (3469260 - blue, 3663990 – red, and 3665930 - green) and in 2019 (5510690 – black), using the ridges detected in position wavelet transform amplitudes. Black lines indicates slopes or angular velocities near f, f/4, f/10 and f/20.
Power and cross rotary spectra of the ERA5 wind near the CG and the drifter currents (see Figure 8, where drifter 3469260 was used as an example) reveal that most of the variability of winds and currents is in the diurnal band. The diurnal wind amplitude is 1-3 m/s and the inner coherence-squared (not shown) is significant with a value of 0.45. At high frequencies (> 1 cpd) both winds and drifter currents are rotating in the clockwise direction.
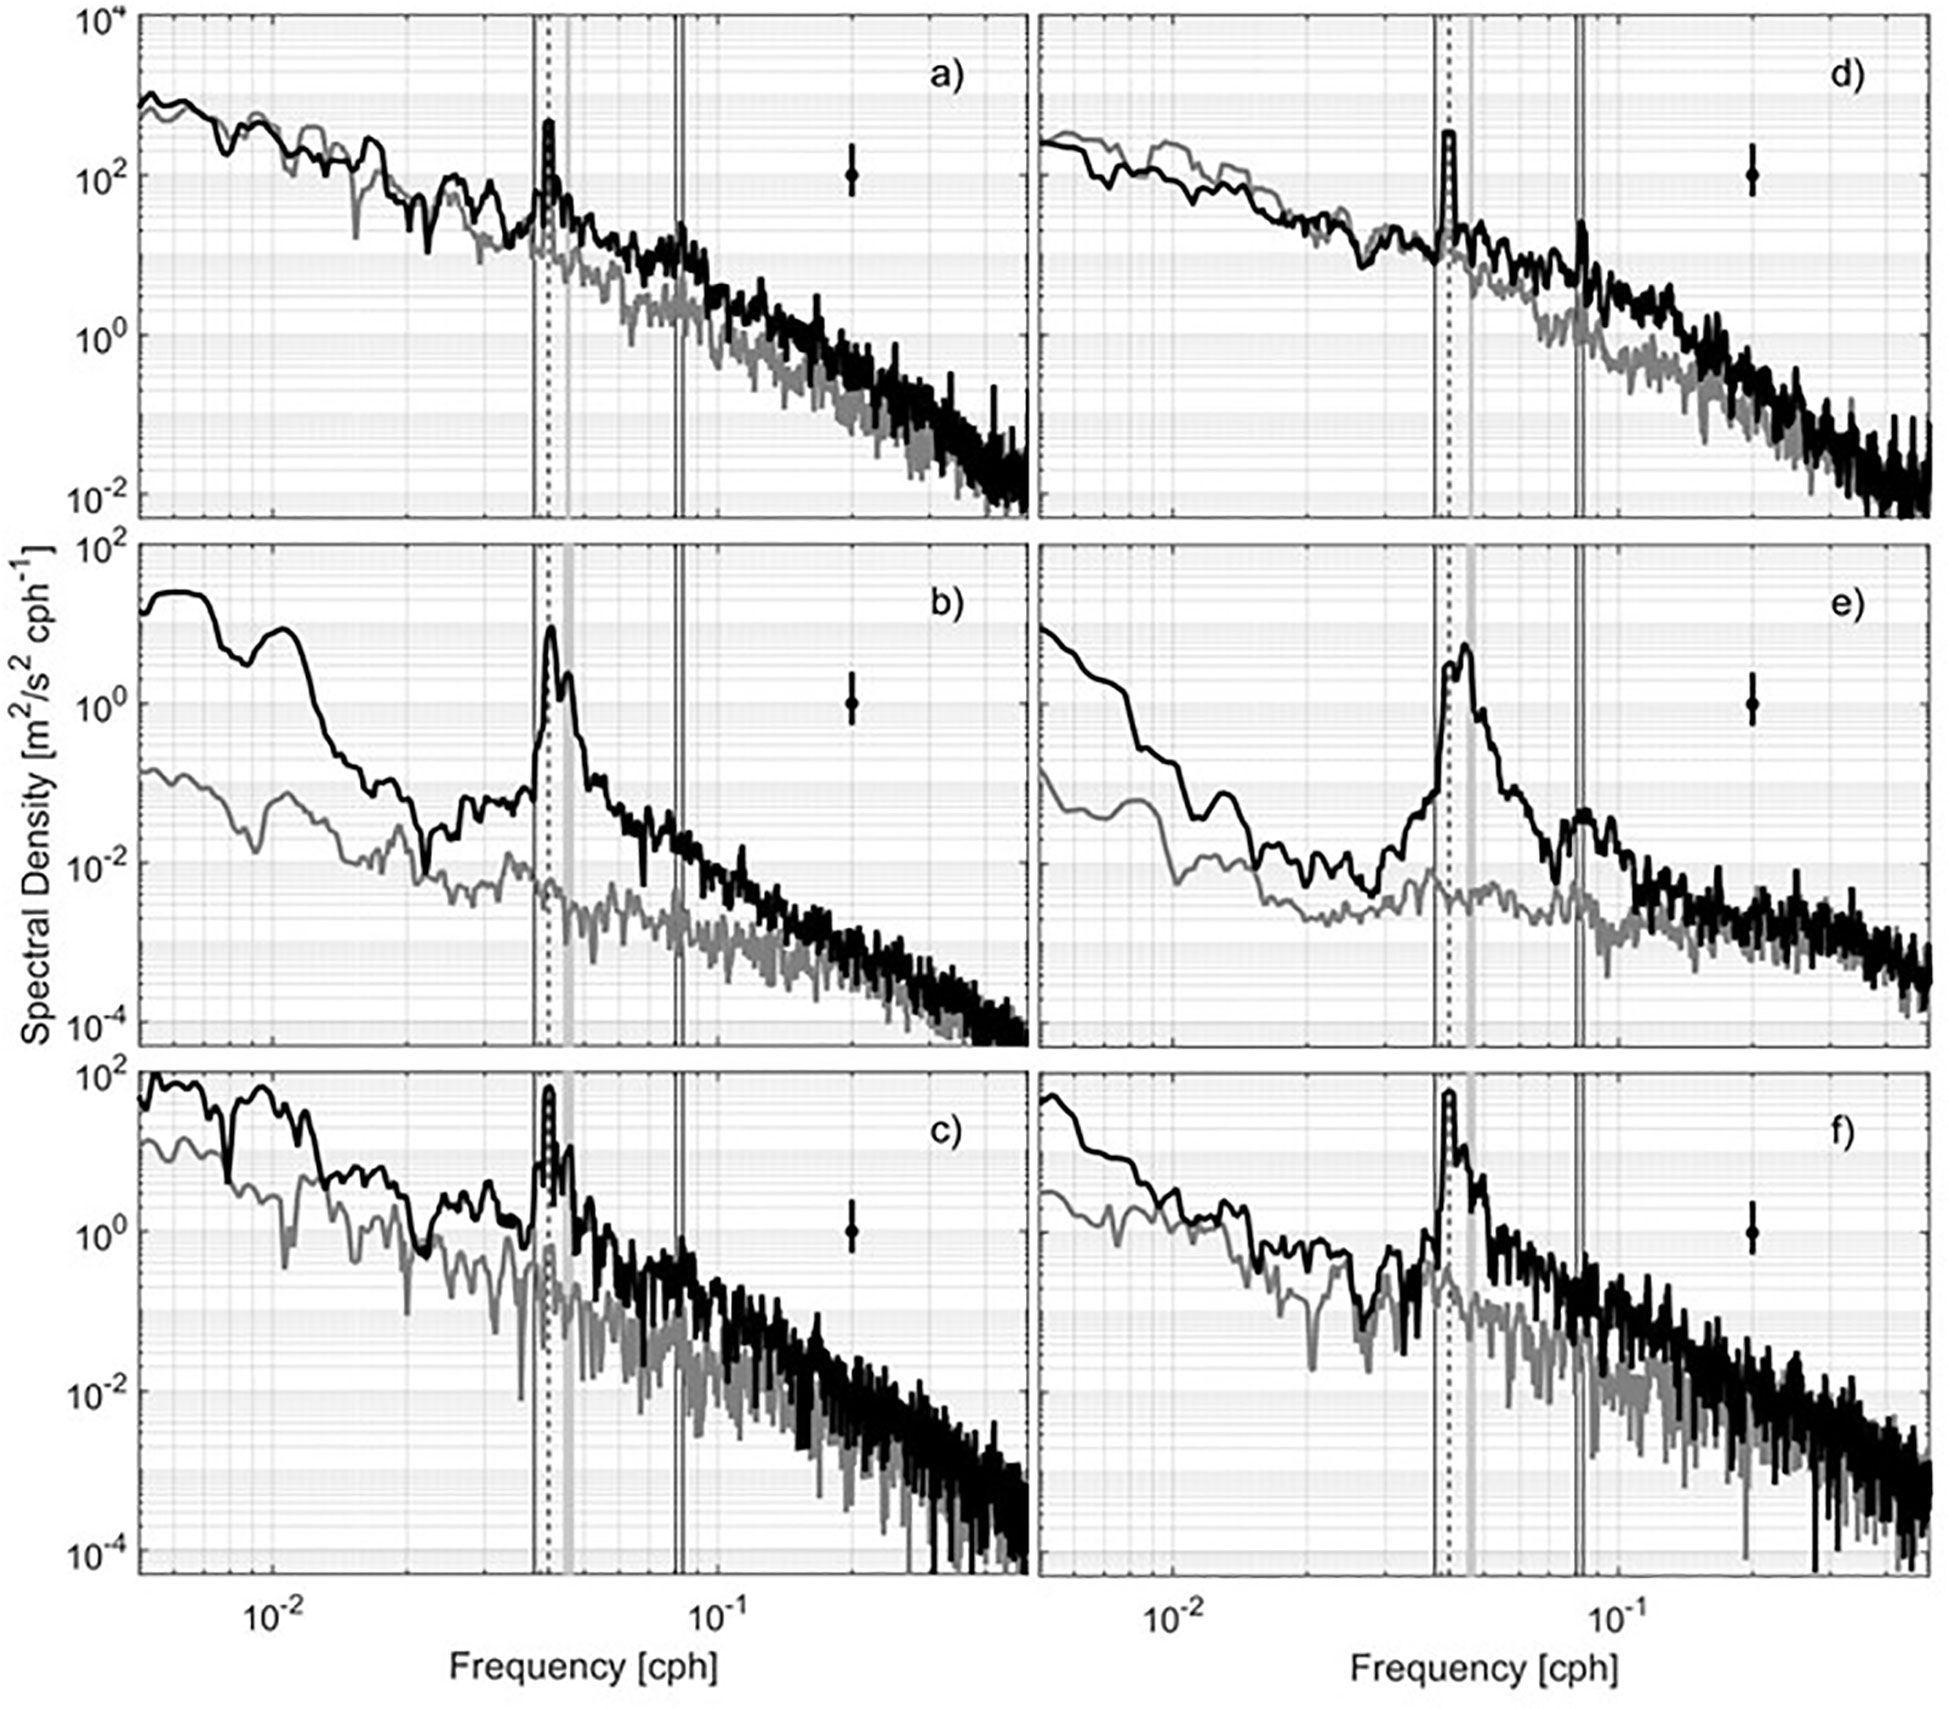
Figure 8 Power rotary spectra of (A) the ERA5 wind at 33°N30’, 33°E and (B) the currents measured by drifter 3469260 between 27 February and 1 September 2017. Cross rotary spectrum of the ERA5 wind and drifter velocities (C). Power rotary spectra of (D) the ERA5 wind at 34°N, 32°E15’ and (E) the currents measured by drifter 5510690 between 15 May and 1 October 2019. Cross rotary spectrum of the ERA5 wind and drifter velocities (F). Clockwise (black) and counterclockwise (gray) rotary components are shown, as well as the 95% confidence interval. Tidal (O1, K1, M2 and S2) are shown with black vertical lines, while the inertial frequency is depicted with a gray vertical band and the diurnal frequency with a dashed line.
3.2 The CG in 2019
Also in 2019, a drifter (5510690) was caught in the CG, which was located northwest of Eratosthenes Seamount (Figure 1) and moving slowly (~0.2 km/day) westward.
In late May and early June, the period, semi-major axis and maximum orbital speed of the drifter loop are near ~10 days, ~40 km and ~30 cm/s, respectively (Figure 9). These values decrease to ~5 days, ~5 km and ~5 cm/s in June and July, indicating some convergence and spiraling of the drifter track. The drifter then stabilizes, in August and September, with a period of 10-15 days, a semi-major axis of ~20 km and a maximum speed of ~10 cm/s. NIOs are intermittent and dominate in June-July, with speed approaching 40 cm/s (Figures 9, 10). Again, the slab model is only partially successful in predicting the observed inertial currents. For example, there is a good agreement for the maxima in early June and mid-July (Figure 10). As for the effective inertial frequency of the drifter velocities, it is essentially redshifted by 5-10% f during large amplitude events.
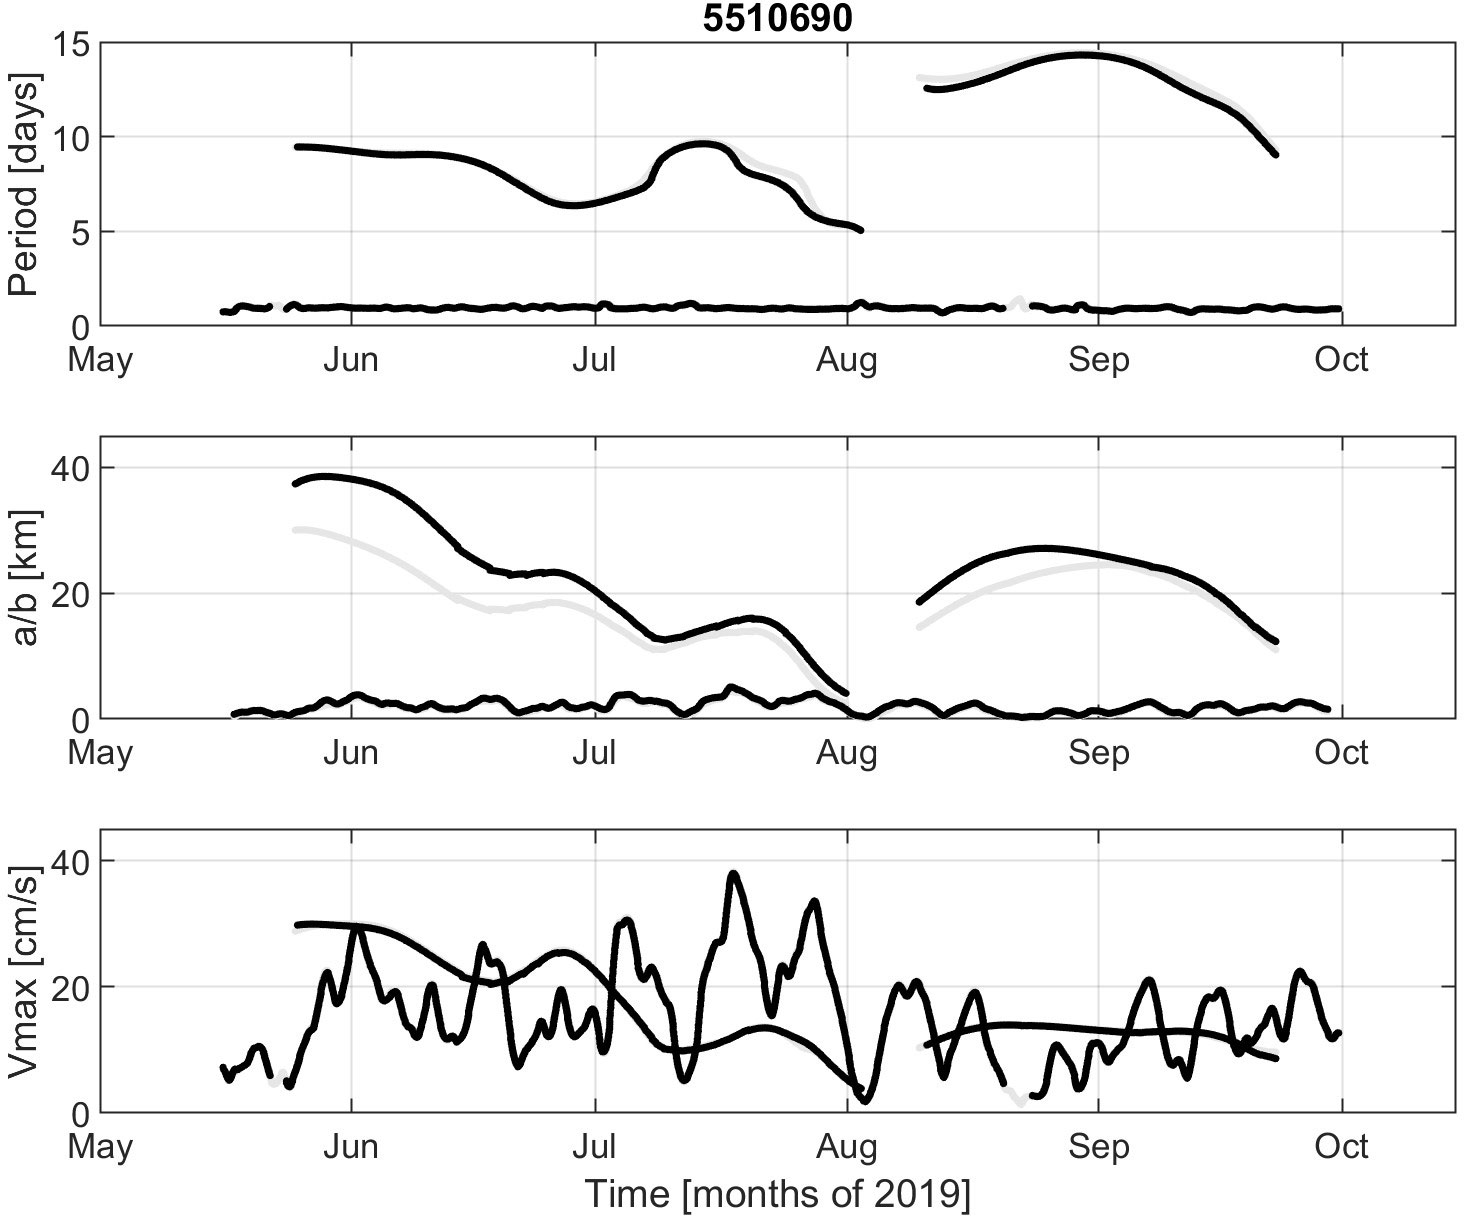
Figure 9 Characteristics of the elliptical motion corresponding to the position (gray) or velocity (black) wavelet ridges for drifter 5510690 trapped in the CG in 2019. Top: Period. Middle: Semi-major axis (a, thick) and semi-minor axis (b, thin). Bottom: Maximum speed (Vmax).
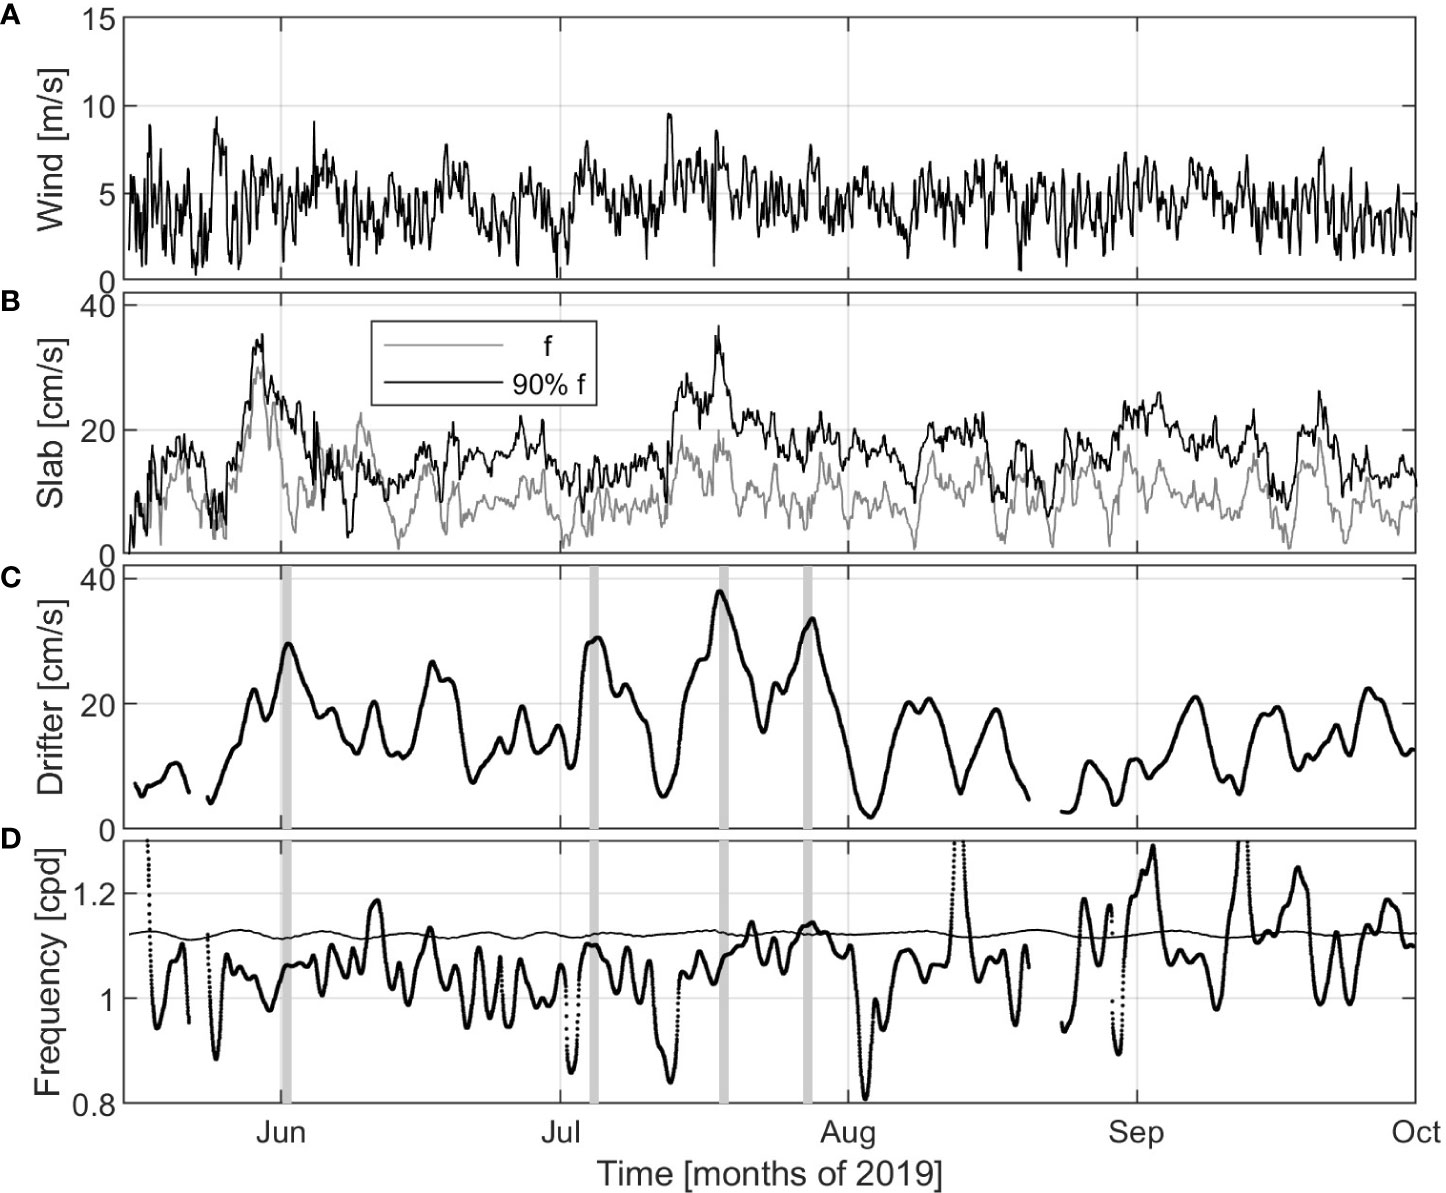
Figure 10 ERA5 wind speed interpolated at the CG center (34°N, 32°E15’) (A). Speed simulated by a damped slab model of the mixed layer with effective inertial frequency equals to f (gray) and 90% f (black) (B). Maximal orbital speed (C) and frequency (D) of near-inertial motions as determined with wavelet ridge analysis (using velocity time series) for drifter 5510690 trapped in the CG in 2019. The inertial frequency at the latitude of the drifter is shown with a thin line in the bottom panel. The days with strong NIOs considered later in the paper are highlighted with gray bars.
In late May and early June, the angular velocity is ~f/10 for a radius near 30 km, where the orbital speed is highest (more than 25 cm/s, see Figures 7 and 9). In June and July, the orbital speed decreases quasi linearly to about 5 cm/s, until the drifter has almost converged to the gyre center (only 4 km radius). During this period, the gyre is thus in quasi solid-body-rotation with a nearly constant angular velocity near f/10.
Figure 8 shows the power and cross rotary spectra for the ERA5 winds and the drifter velocities in the CG from 15 May to 1 October 2019. Again, the high-frequency winds and currents are mostly clockwise. A significant peak corresponds to the diurnal wind. For the drifter, there is a double peak at diurnal and inertial frequencies. The inner-coherence-squared at the diurnal frequency is high (near 0.8; not shown).
3.3 Frequency shift and background vorticity
We now focus on the main NIO events as detected in the drifter tracks while they were trapped in the CG. We examine the NIOs in more detail in terms of amplitude and effective inertial frequency, and compare the drifter results with maps of relative vorticity calculated from the absolute geostrophic velocities estimated from satellite altimetry.
We first consider the CG in 2017 (colored tracks in Figure 1). We focus on four selected events where at least one drifter showed large NIOs with speed reaching 30 cm/s (see Table 2 and gray bars in Figure 6). They are around 27 April, 11 May, 15 June and 16 July 2017. The weeklong tracks centered on the above dates are overlaid on maps of geostrophic vorticity (Figure 11). Vorticity derived from satellite altimetry and drifter tracks are in good qualitative agreement in the CG, particularly for the location of the gyre center. If the distance between the center and where the orbital speed is highest (and the vorticity changes sign) is considered as the size of the gyre, it can be seen that satellite estimates (diameter ~100 km) are larger than drifter estimates (diameter ~50 km; see Figure 7). This is to be expected since the satellite altimetry gridded products are smoothed over tens of kilometers. The maximum anticyclonic (negative) geostrophic vorticity in the core of the CG can exceed 0.2 f (on 27 April and 11 May), but is much smaller than the mean vorticity derived from the drifters rotating in inner loops (near 0.5 f).
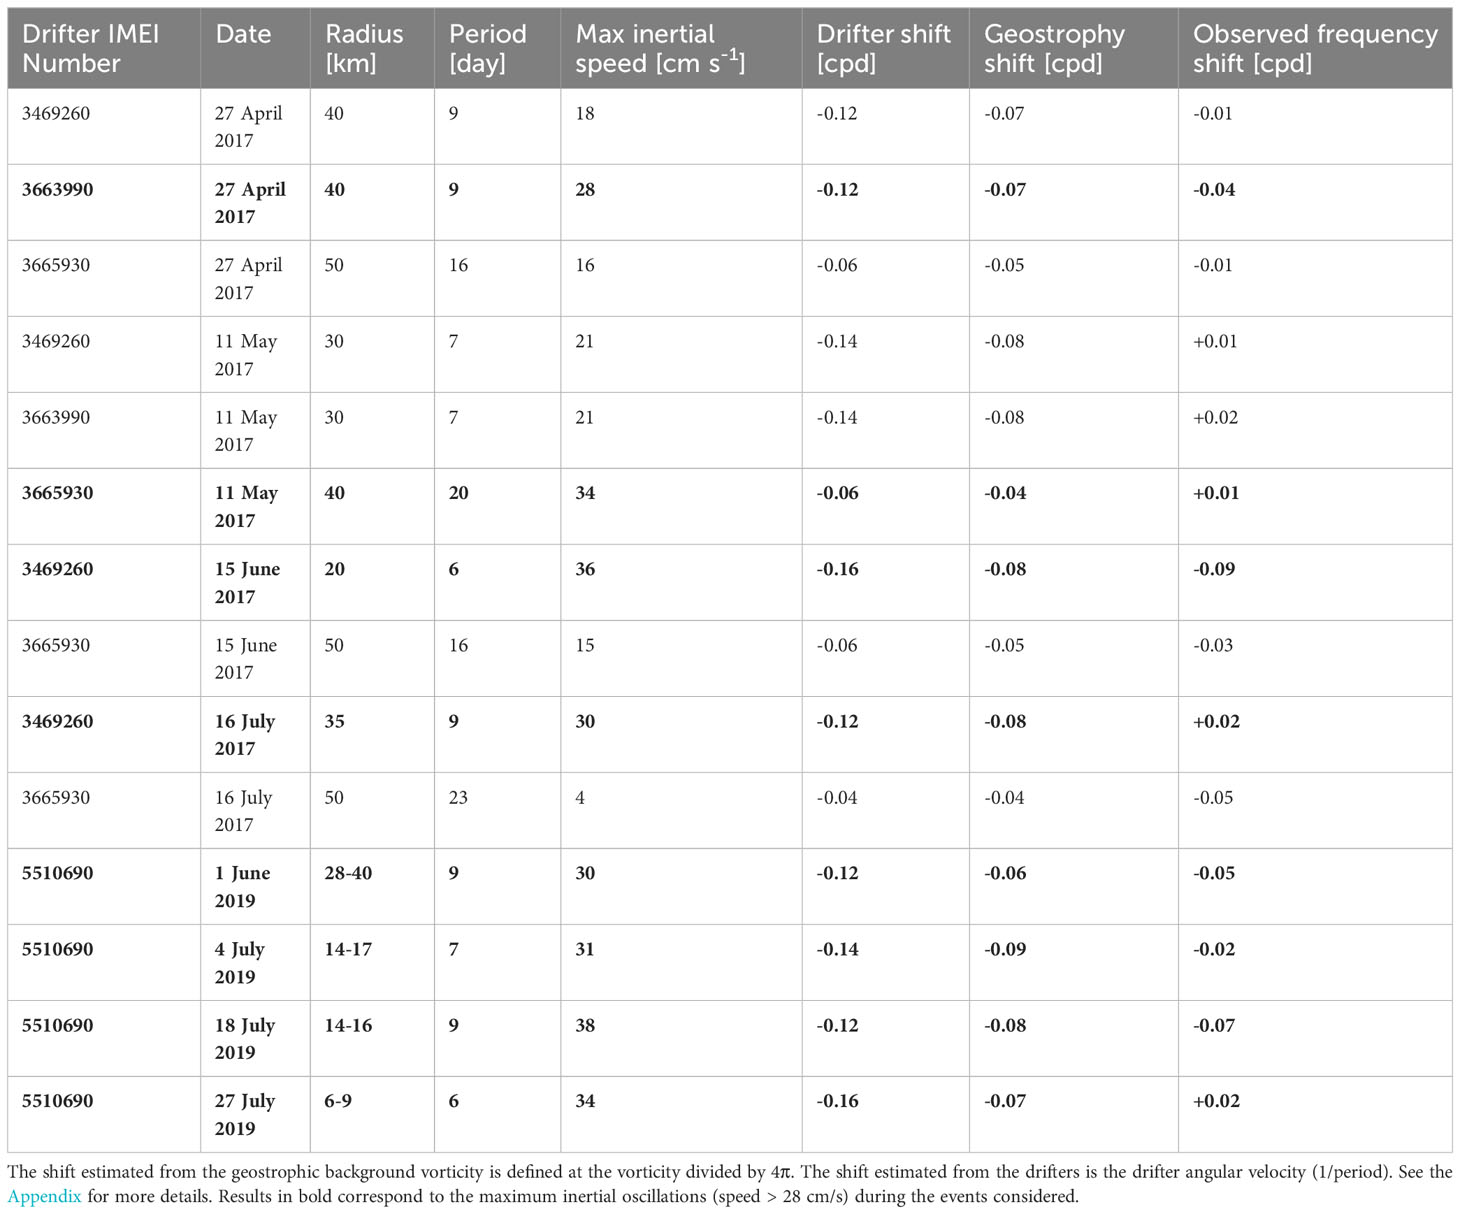
Table 2 Characteristics of the drifter orbiting tracks and NIOs at selected times in the CG (gray lines in Figures 6 and 10).
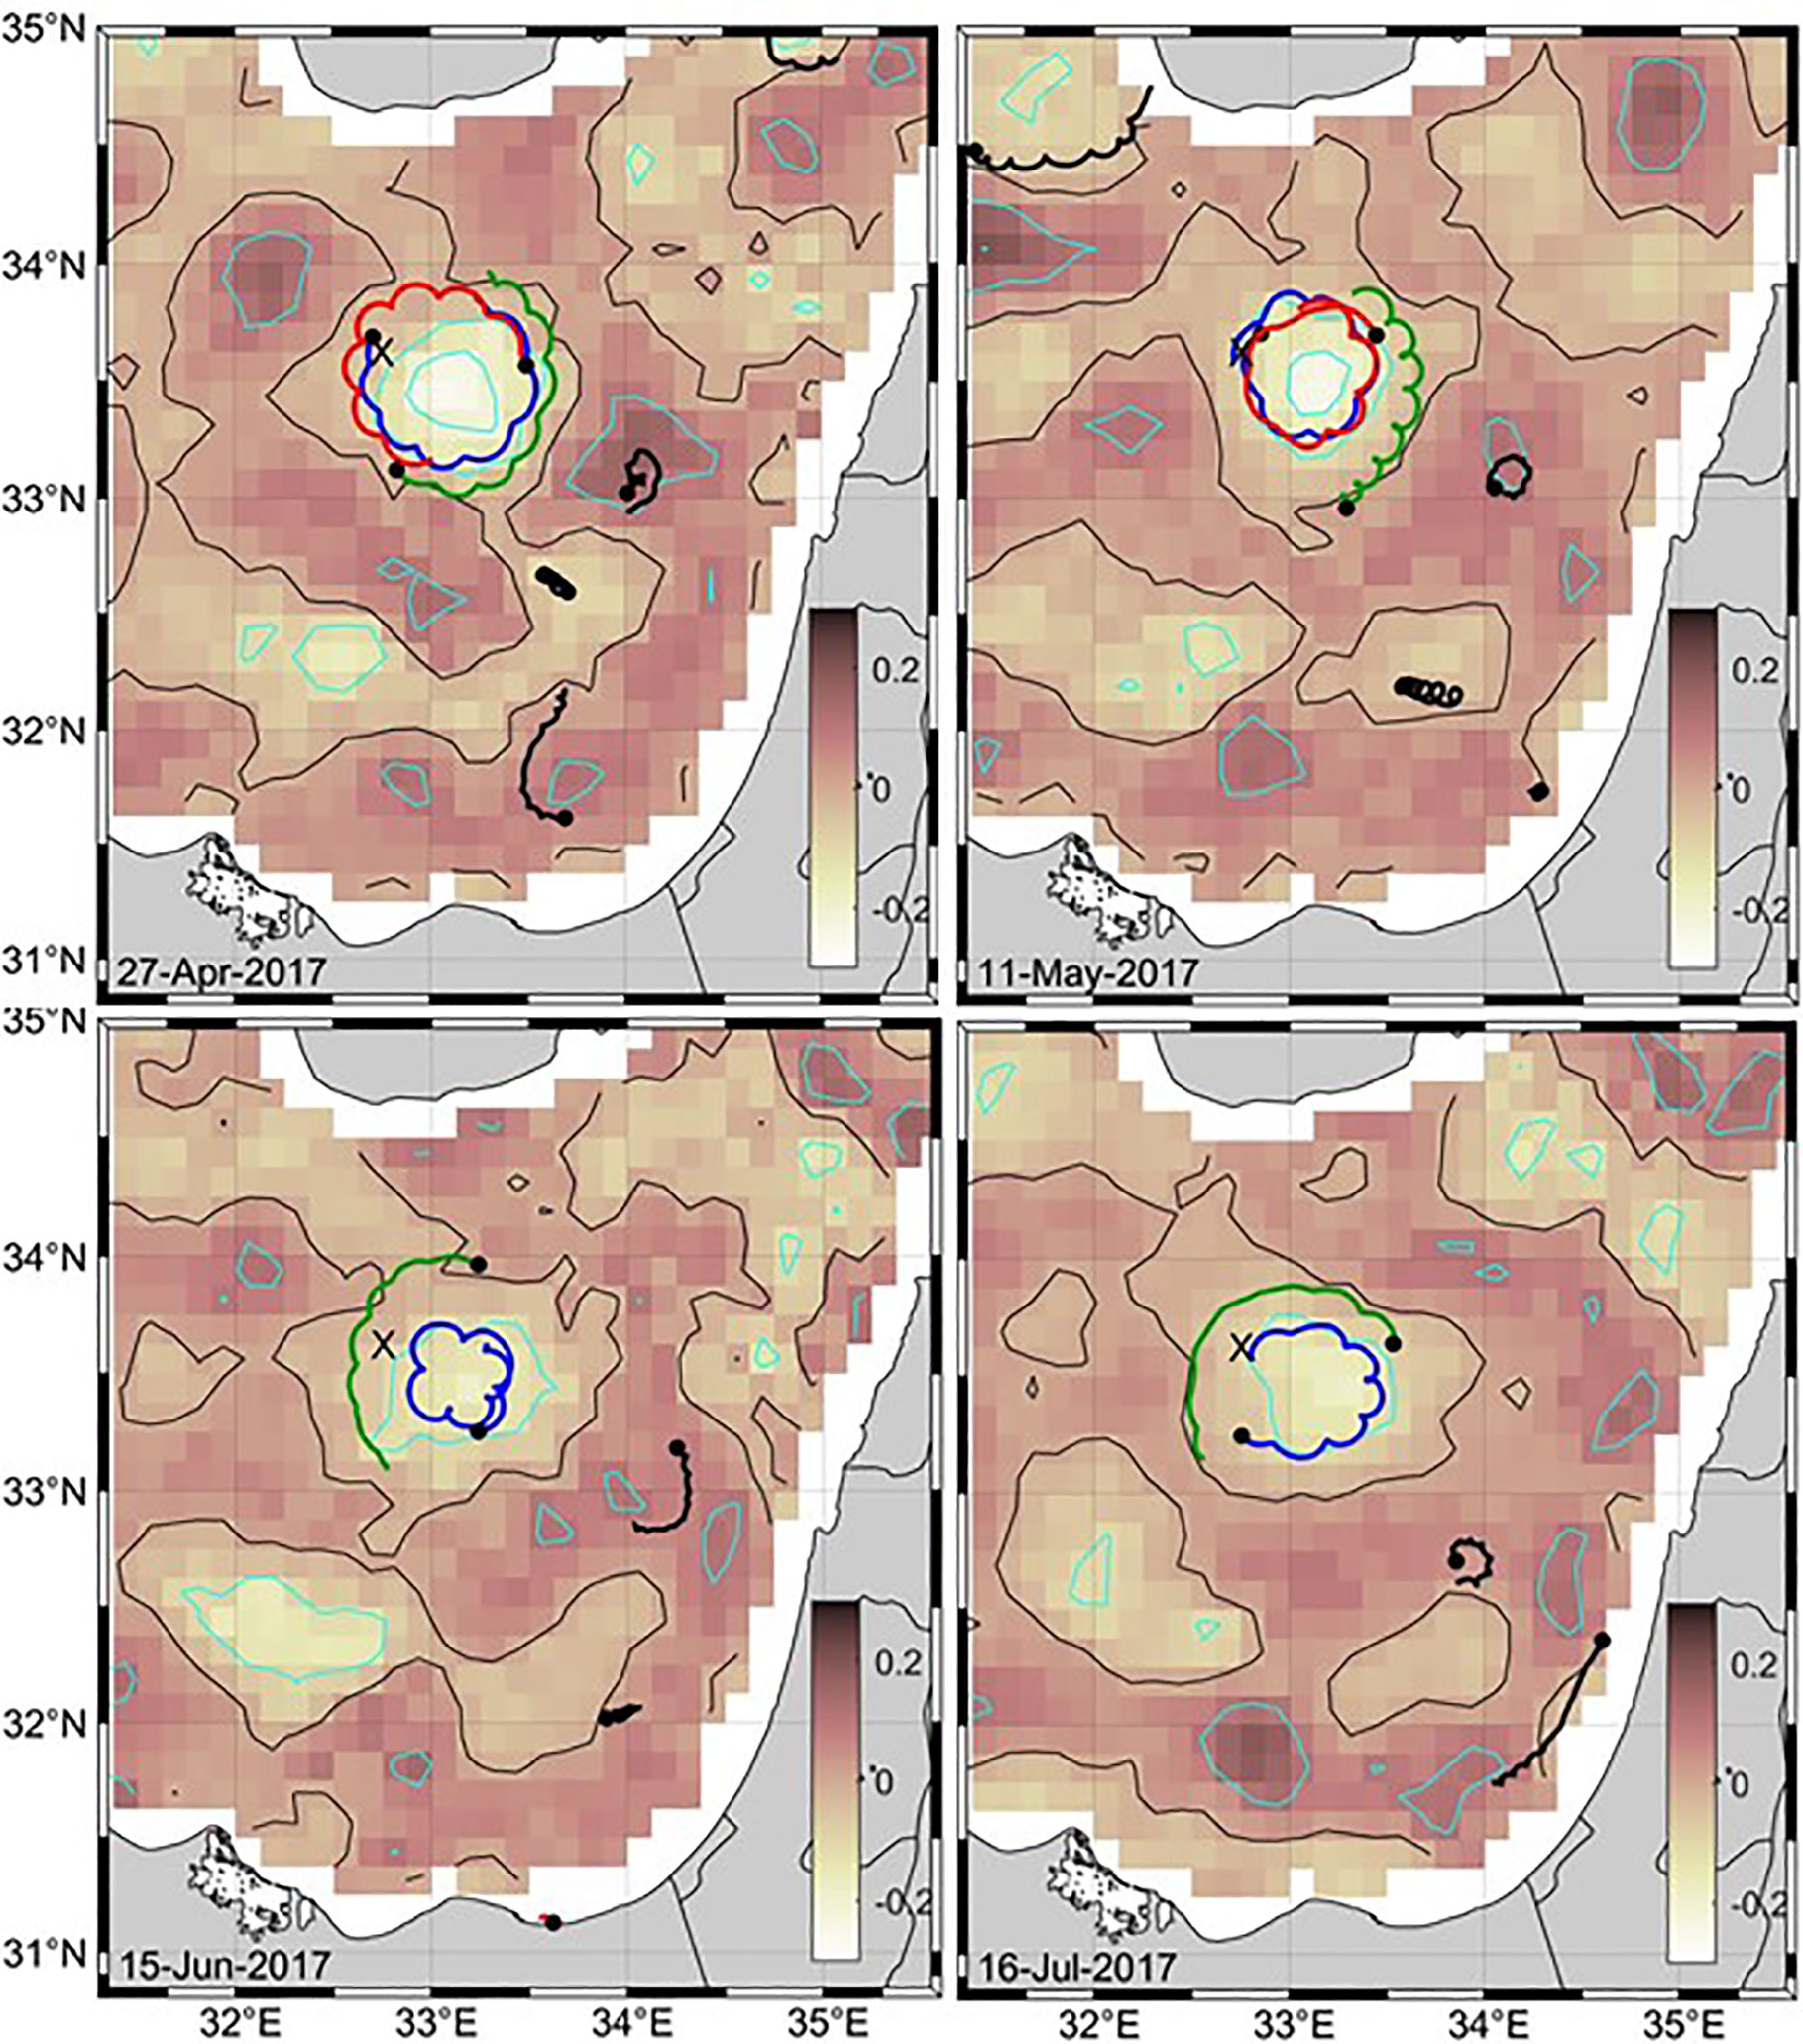
Figure 11 Week-long drifter tracks (with a circle at the end) centered on 27 April, 11 May, 15 June and 16 July 2017, superimposed on the mean geostrophic vorticity ζ for the same periods. Vorticity is scaled by the local inertial frequency f. Contours for ζ = 0 (black) and ζ = -0.2f, -0.1f, 0.1f and 0.2f (cyan) are also shown. The drifter tracks trapped in the CG are depicted in blue (3469260), red (3663990) and green (3665930). The location of the Eratosthenes Seamount is shown with an “X”.
For the drifter caught in the CG in 2019 (black track in Figure 1) the following events with strong NIOs were considered: 1 June and 4, 18 and 27 July 2019 (see Table 2, gray bars in Figure 10 and tracks on maps of geostrophic vorticity in Figure 12). Again, the location of the CG estimated with the drifter and satellite data coincide well. In this case, the track of only one drifter in the CG does not allow assessing the size of the rotating vortex. The maximum anticyclonic (negative) geostrophic vorticity in the core of the CG is ~0.1 f, smaller than the mean vorticity calculated from the drifter track.
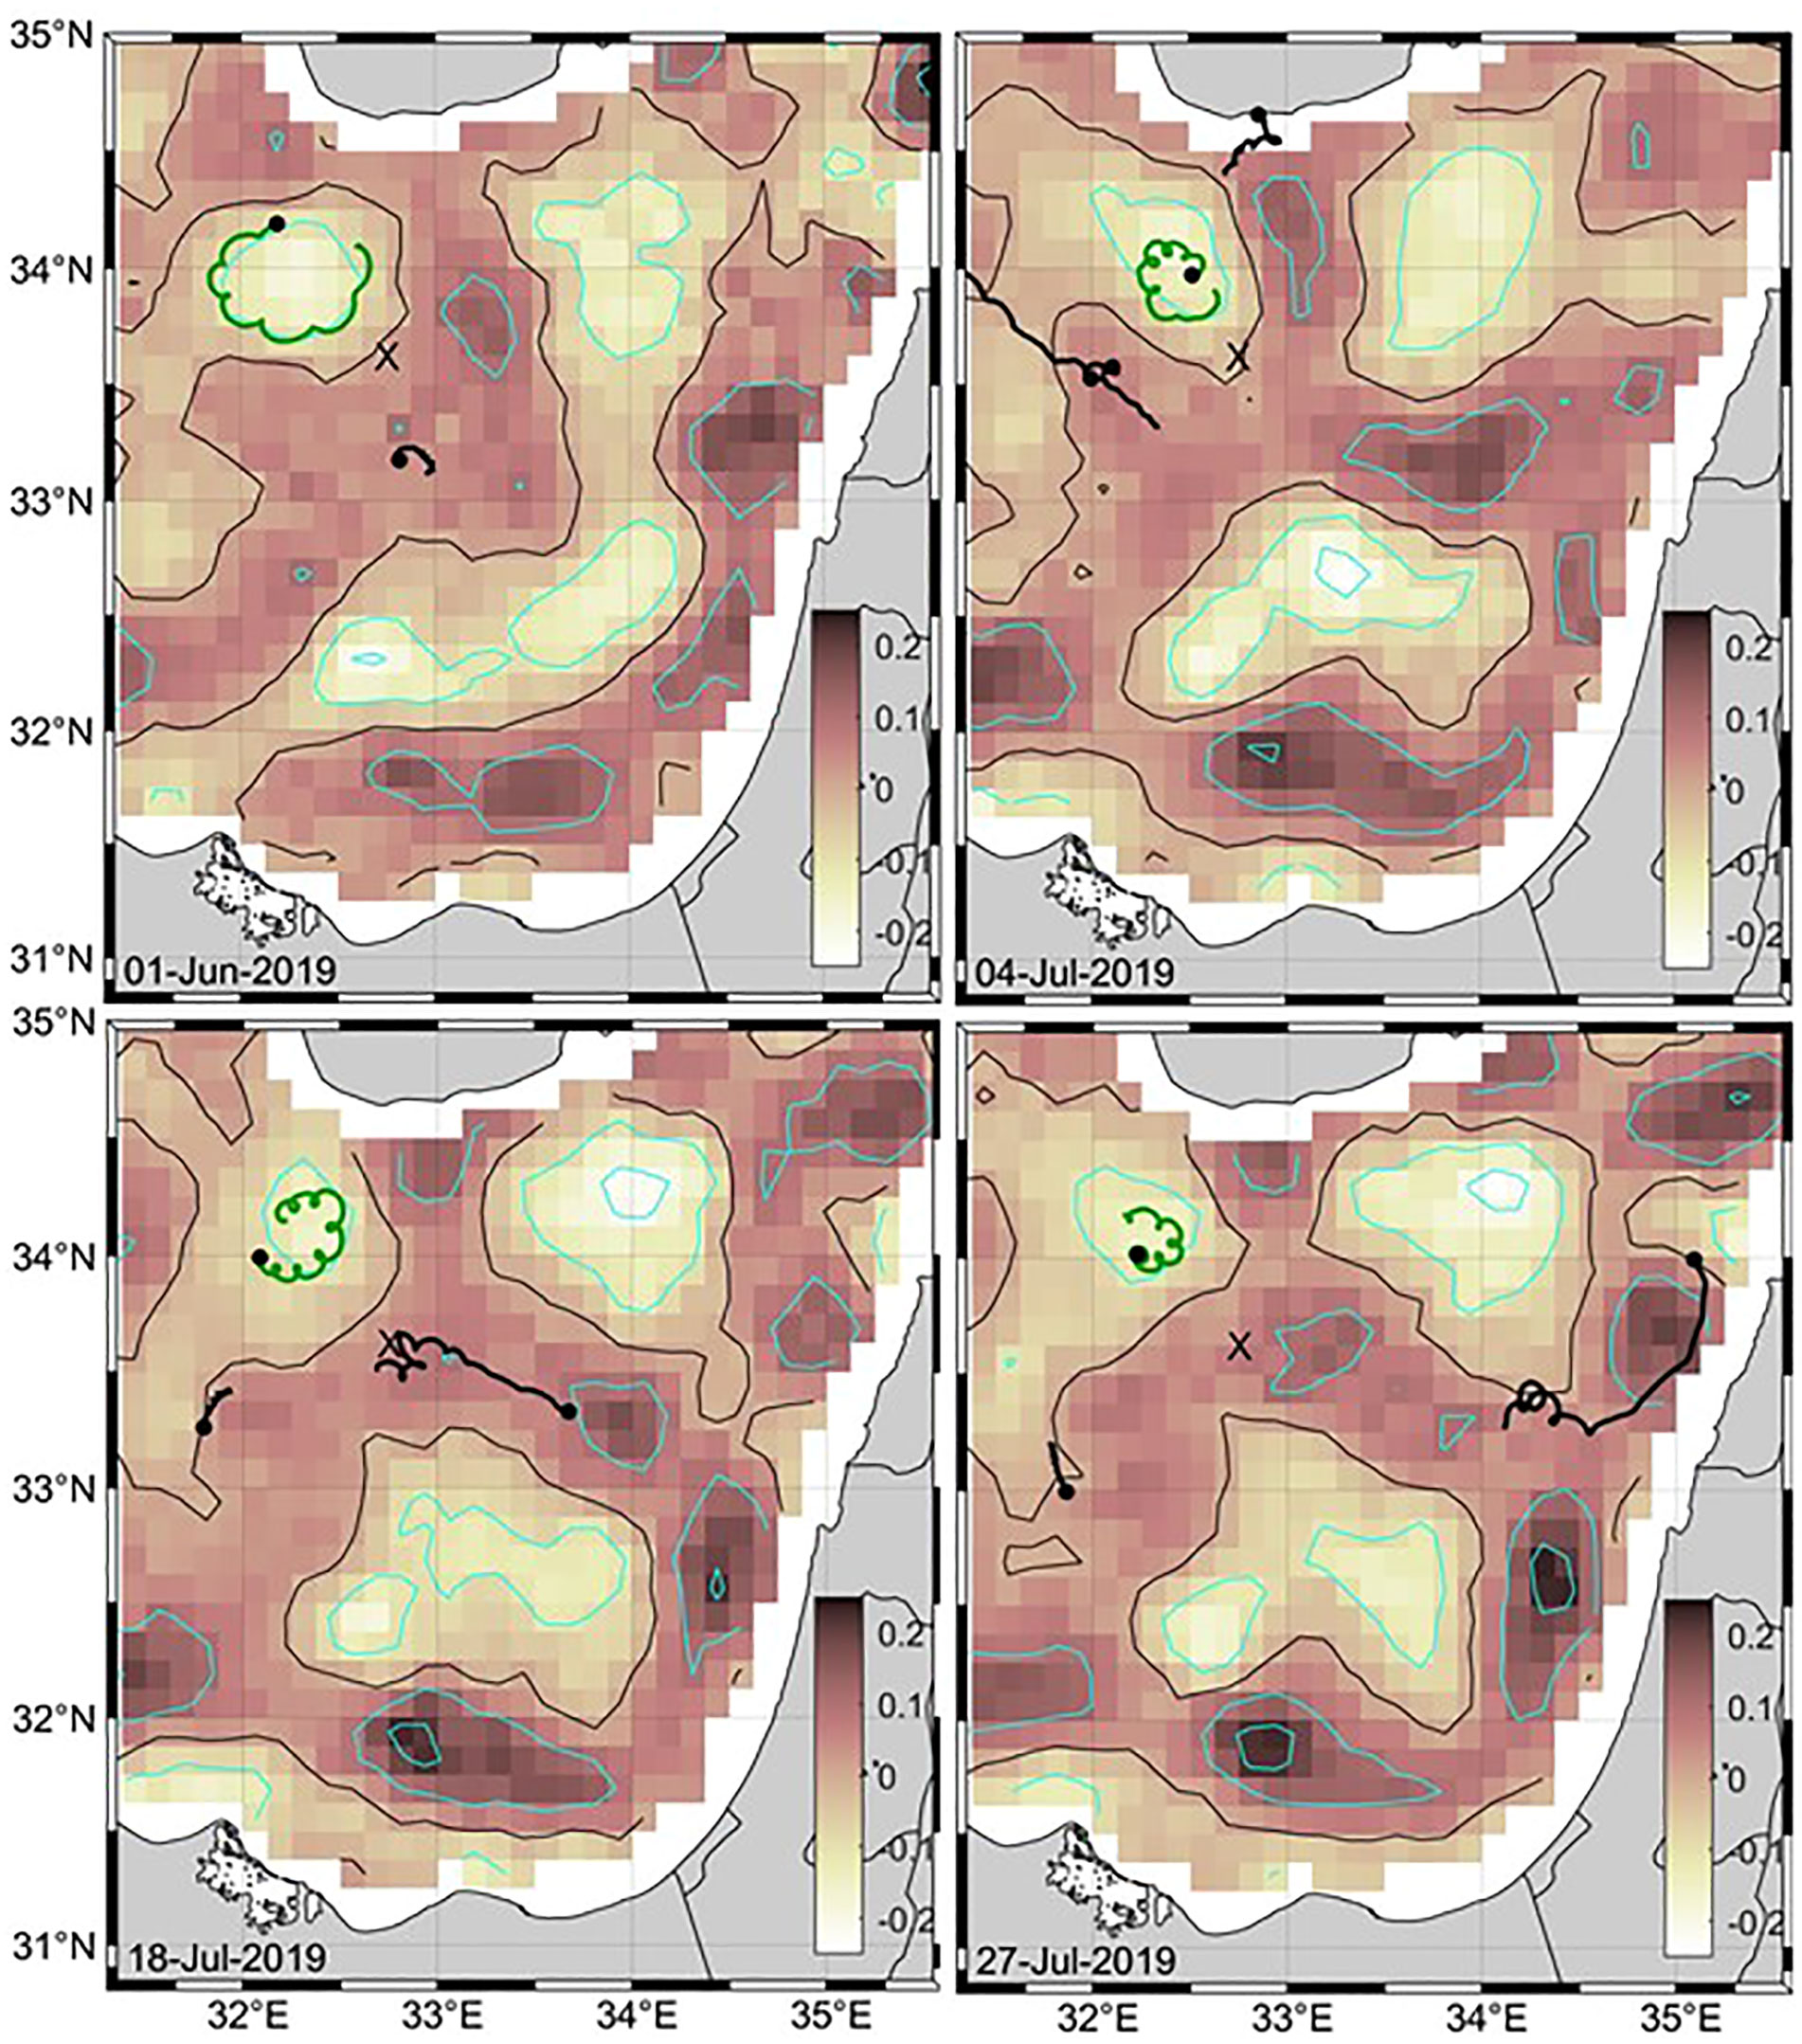
Figure 12 Week-long drifter tracks (with a circle at the end) centered on 1 June, 4 July, 18 July and 27 July 2019, superimposed on the mean geostrophic vorticity ζ for the same periods. Vorticity is scaled by the local inertial frequency f. Contours for ζ = 0 (black) and ζ = -0.2f, -0.1f, 0.1f and 0.2f (cyan) are also shown. The drifter track trapped in the CG is depicted in green (5510690). The location of the Eratosthenes Seamount is shown with an “X”.
The inertial frequency shift calculated with equation 1 using the geostrophic vorticity values averaged along the drifter paths is listed in Table 2. Details about this calculation can be found in the Appendix. Since vorticity is negative, the shift is negative and as large as -0.09 cpd. The frequency shift estimated by the wavelet ridge analysis is also shown for comparison. For the drifters that have large amplitude NIOs (greater than 28 cm/s), it is mostly negative and of the same order of magnitude as the value estimated by equation 1. There are a few exceptions with a small positive shift of 0.01-0.02 cpd, but this value is comparable to the accuracy of our frequency estimate. The most significant cases with good agreement between observed and calculated frequency shifts occur on 15 June 2017 and 18 July 2019, with a frequency shift approaching -0.1 cpd.
The frequency shift that corresponds to the average vorticity within the drifter orbits estimated from the drifter angular velocity and Stokes’ theorem is also given in Table 2. It is simply the reciprocal of the period of rotation (see the Appendix). This shift estimate is always negative but is generally larger than the geostrophic estimate (in absolute value). It is close to the shift due to the actual vorticity at the drifter location only if we can assume solid-body rotation, which, in practice, is only the case for a small radius less than 10-20 km. For the cases of strong NIOs in June 2017 and July 2019, this shift estimate can be much larger in absolute value with respect to the geostrophic and observed frequency shifts. In summary, the comparison between the observed frequency shift and the values using equation 1 and vorticity estimates remains very qualitative. We investigate it further in the next section for the case of strong NIOs in June 2017.
3.4 Drifter and geostrophic vorticity
It is well known that vorticity estimated from geostrophic currents derived from satellite altimetry measurements are underestimated given the spatial resolution of satellite sub-tracks (tens of kilometers) and grid interpolation. Therefore, it is interesting to try to estimate the vorticity from the drifter tracks themselves. Let us focus on the two drifters that were trapped in the CG in June 2017 to estimate the vorticity in the gyre. Drifter 3469260 rotates at a radius ~20 km with orbital speed of about 30 cm/s (Figures 3, 7 and 13). Inertial currents approach 40 cm/s (Figure 6). The other drifter (3665930) located farther out with a radius of ~50 km has an orbital speed of about 20 cm/s. In Figure 11 (lower-left panel), their tracks are overlaid on a map of geostrophic vorticity derived from satellite altimeter measurements and averaged over a week centered on 15 June.
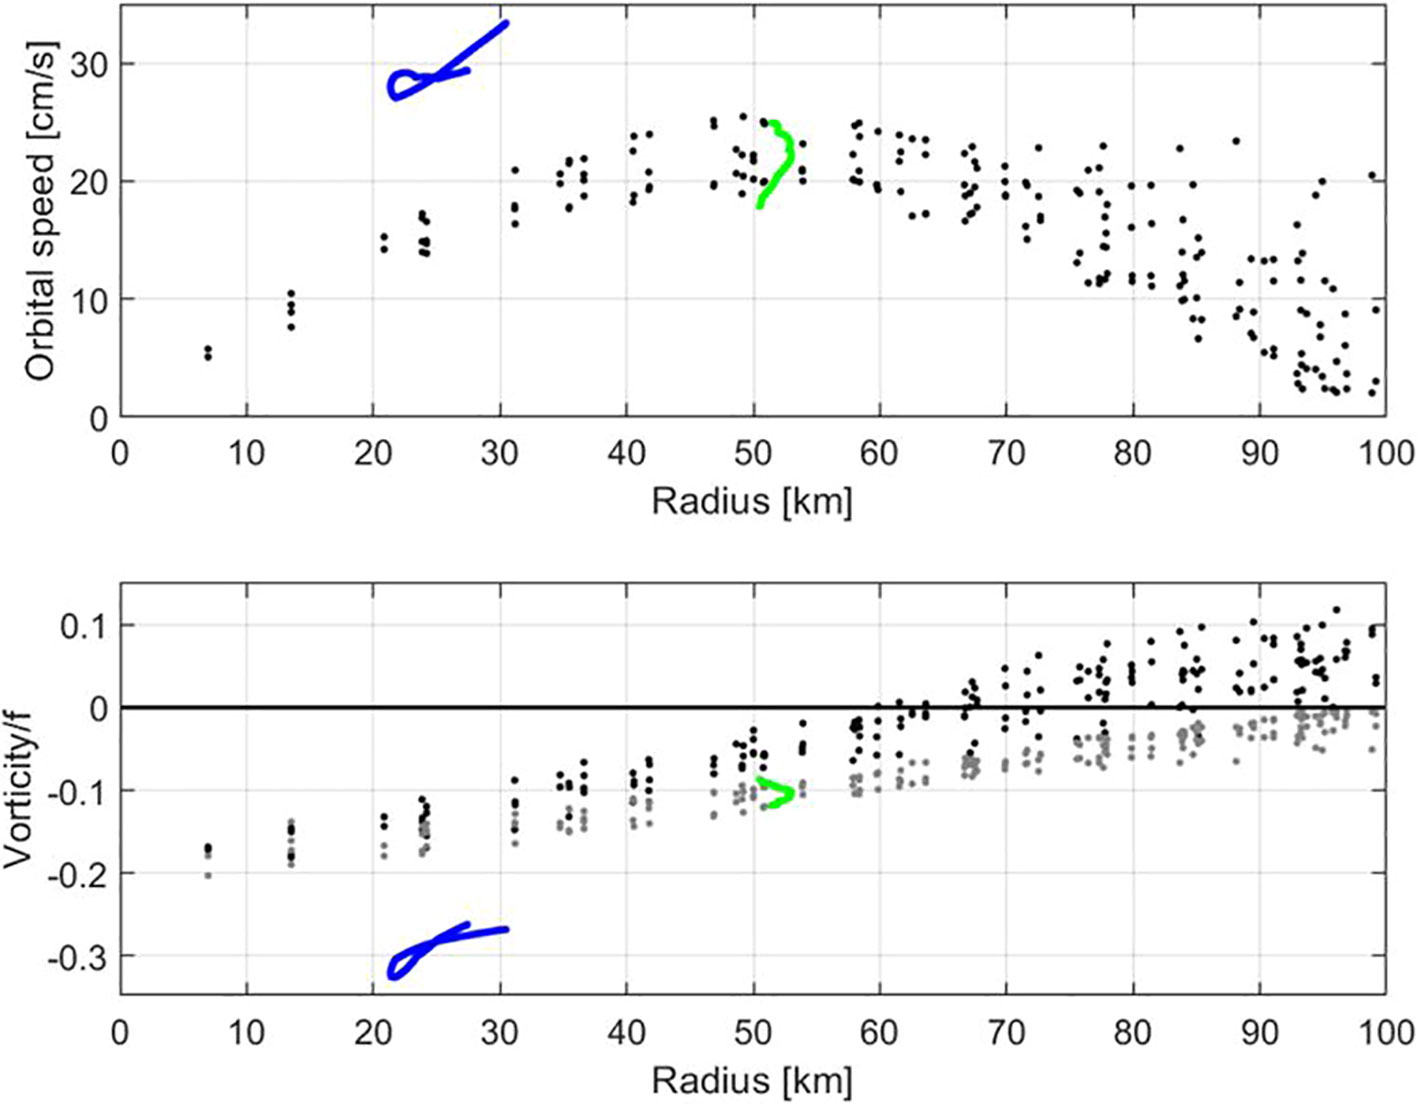
Figure 13 Top panel: Orbital speed versus radius using geostrophic currents estimated from satellite altimetry and averaged over the entire month of June 2017 and using a mean CG center location at 33°N30’ and 33°E11.25’ (black dots). Orbital speed of drifter 3469260 (blue) and 3665930 (green). Bottom panel: Geostrophic vorticity versus CG radius using mean geostrophic currents in June 2017 (black dots). Mean geostrophic vorticity inside circle with given radius estimated from the geostrophic currents (gray dots) and drifters (blue and green) using Stokes’ theorem.
We now assume that the properties of the CG are constant in June 2017 and consider the orbital speed and vorticity calculated from the geostrophic mean currents in June 2017. They are plotted against radius in Figure 13, assuming a CG center is located at 33°N30’ and 33°E11.25’. The geostrophic orbital speed is largest (~ 25 cm/s) for radii between 50 and 60 km. Drifter 3665930 has approximately the same orbital speed at the same radius. In contrast, for a shorter radius of 20-30 km, the drifter orbital speed (drifter 3469260, ~30 cm/s) is much larger than the geostrophic counterpart (15 cm/s).
The geostrophic vorticity approaches -0.2f in the center of the CG and passes through zero just outside the track of drifter 3665930 at ~60 km. With only a few drifters orbiting in the CG we can estimate the mean vorticity only within their looping tracks corresponding to a given radius using Stokes’ theorem. This is an overestimate because the vorticity, in absolute value, always decreases with increasing distance from the gyre center. The mean vorticity inside the orbit is twice the drifter angular velocity. The mean vorticity reaches -0.3f at a radius of 20-30 km (drifter 3469260) and is ~0.1f at a radius near 50 km (drifter 3665930). The mean vorticity inside an orbit with a given radius can also be calculated from the angular velocity of the mean geostrophic currents along the circular path (gray dots in Figure 13, lower panel). Again, for the outer drifter (3469260), the estimates of geostrophic and drifter mean vorticity are comparable. For the inner drifter (3665930), however, the drifter estimate is twice the geostrophic result.
In the core of the CG, the satellite-derived geostrophic currents underestimate the vorticity while we overestimate the vorticity using the drifter currents and Stokes’ theorem. As a result, we can conclude that our best estimate of vorticity is ~-0.2f for a radius of 20-30 km. Near the edge of the gyre, for a radius of 50-60 km, the two estimates are similar and close to the actual value. NIOs trapped in the CG in June 2017 should be red-shifted with respect to the local inertial frequency by about half the vorticity mentioned above, i.e., by 0.1f. This is indeed compatible with the observed frequency shift of -0.1 cpd listed in Table 2.
4 Discussion and conclusions
Several drifters deployed in the EMS were caught in the surface anticyclonic circulation of the CG for months in 2017 and 2019. In addition to the loops caused by gyre rotation (with a radius of order of 10 km), smaller clockwise loops with a radius of a few kilometers intermittently occured in the drifter tracks. These drifters provided a unique opportunity to study the morphology and kinematics of the CG and the NIOs trapped in it. Wavelet ridge analysis was applied to characterize these two rotational motions and to study the interaction between them. Ridges were identified following the maxima in the anticyclonic wavelet transforms of the drifter position and velocity time series (Figure 2) from which orbital parameters such as period, size (major and minor axes of the orbit) and strength of the orbital motion were estimated (Figures 3–5, 9).
In 2017, the CG was located southeast of Eratosthenes Seamount, moving slowly toward the southeast at a rate of 0.2 km/day (Figure 1). The drifters orbited with radii between 15 and 50 km. Typical maximum orbital speed of 30, 45 and 25 cm/s were observed at radii of 15, 30 and 50 km, respectively (Figure 7). Defining the gyre size with the radius at which the negative vorticity passes through zero, the CG has a diameter of ~ 60 km. Within its inner core (radius less than 15 km) the mean vorticity is 0.5f and the Rossby number is ~0.25. The looping tracks also show that the CG can have significant eccentricity (see, for example, drifter 3665930 in Figure 5 where the semi-minor axis is constantly smaller than the semi-major axis).
In 2019, the CG was more to the northwest and moving slowly westward (Figure 1). Only one drifter was trapped in the gyre and the radius of its orbit varies from 5 to 40 km (Figures 7, 9). Orbital speed increases almost linearly with radius, reaching about 25 cm/s at 35 km, corresponding to solid-body-rotation with an angular velocity of ~0.1f (or Rossby number ~ 0.1). Therefore, the strength of the vortex in 2019 is weaker compared to 2017. The size of the gyre is also not precisely defined because the drifter did not sample its outer edge (for radius larger than 30 km) where vorticity becomes positive.
The small loops that occur intermittently along the drifter tracks are NIOs and their frequency is close to the local inertial frequency f (Figures 6, 10). Several events of strong NIOs (with speed near or above 30 cm/s, and a peak value of ~40 cm/s) occur both in 2017 and 2019. The more frequent occurrence of NIOs between April and August is related to the formation of a surface mixed layer with an underlying seasonal thermocline, in which NIOs are enhanced. A damped slab model was used to simulate the surface NIOs. Although model parameters were chosen to maximize agreement with drifter observations (see, for instance, the good agreement for the event in mid-May 2017, Figure 6), the simple model was only partially successful in reproducing the observations (see, e.g., the event in mid-June 2017). This discrepancy may be due to 1) the inaccuracy of the ERA5 products that are be too smoothed spatially and underestimated with respect to real surface winds, and 2) more complex dynamics including the vertical propagation of the near-inertial energy below the mixed layer and the amplification of NIOs at the base of the CG near 500 m depth (see Lelong et al., 2020). In June 2017, it is noteworthy that the amplitude of NIOs sampled by drifters less than 100 km apart can vary significantly from one drifter to another. For example, in June 2017, the speed of the NIOs measured by drifter 3665930 is limited to 20 cm/s, while for the other drifter (3469260) it reaches ~40 cm/s, as seen above. Hence, due to the redshifting of the effective inertial frequency by the CG vorticity, and consequent horizontal trapping, strong NIOs entered in resonance with the diurnal variability of the local wind, under rather normal atmospheric conditions, similar to the case reported by Martínez-Marrero et al. (2019) in the Atlantic Ocean. Note that the clockwise diurnal loops in the drifter trajectory are redshifted NIOs resonantly forced by the diurnal wind, and not by other mechanisms such as diurnal tides.
For strong NIO events, the frequency shift, defined as the difference between the observed effective near-inertial frequency and the local f, is generally negative and can reach -0.1 cpd (Figures 6, 10). Theoretically, it should be related to the background vorticity by equation 1 (Kunze, 1985). Therefore, we compared this shift for each strong NIO event in 2017 and 2018, with two estimates of background vorticity: the geostrophic vorticity derived from satellite altimetry data and the mean vorticity in the inner core of the CG estimated from the drifter angular velocity and Stokes’ theorem (see Table 2 and Figures 11, 12). In summary, the comparison is not very satisfactory mostly because the background vorticity estimates have large error bars and may be due to the validity of equation 1 itself, which is an approximation of more complicated dynamics (see Kunze, 1985; Lelong et al., 2020).
Finally, we focused on the two drifters caught in the CG in June 2017 (Figure 13). At the edge of the gyre (radius ~ 50 km) the drifter orbital speed is similar to the geostrophic estimate. At shorter radii (20-30 km), the drifter rotation is about twice the geostrophic current. If we can assume solid-body rotation in the inner part of the gyre, there is also a factor of two between the vorticity estimates, with the drifter vorticity reaching -0.3 f. Since the geostrophic value is an underestimate and the drifter-derived result is somehow overestimated, we can guess that the actual vorticity near the drifter should be ~ -0.2 f.
In summary, we were successful to diagnose the kinematics of the CG and the NIOs trapped inside its core using the data of a few drifters and statistical methods based on wavelets. However, more high-frequency observations of currents and water mass properties are needed, especially in the water column, to further investigate the dynamics of this important circulation feature of the Eastern Mediterranean Sea and its interaction with trapped near-inertial waves.
Data availability statement
The datasets presented in this study can be found in online repositories. The names of the repository/repositories and accession number(s) can be found below: doi:10.6092/7a8499bc-c5ee-472c-b8b5-03523d1e73e9.
Author contributions
P-MP: Conceptualization, Formal Analysis, Funding acquisition, Methodology, Resources, Writing – original draft. MM: Data curation, Writing – review & editing. EM: Writing – review & editing. AP: Writing – review & editing. DH: Resources, Writing – review & editing. HG: Funding acquisition, Project administration, Writing – review & editing.
Funding
The authors declare financial support was received for the research, authorship, and/or publication of this article. This study was financed by the United States Office of Naval Research as part of the CINEL project (award N000141512459) and by the Italian Ministry of Foreign Affairs and the Israeli Ministry of Innovation, Science and Technology (MELMAS project).
Acknowledgments
We gratefully acknowledge the captain and crew of the R/V Medexplorer for their help with the drifter deployment in the Eastern Mediterranean. We also thank Antonio Bussani and Riccardo Gerin for processing the drifter data. Wavelet ridge analysis was performed using the jLab data analysis package for Matlab, v.1.7.1, doi:10.5281/zenodo.4547006 (http://www.jmlilly.net/software). This study has been conducted using E.U. Copernicus Marine Service Information (CMEMS; DATASET-DUACS-NRT-MEDSEA-MERGED-ALLSAT-PHY-L4-V3) and wind products from the Climate data Store (ERA5 hourly data on single levels from 1940 to present). We thank the two reviewers for their constructive comments which helped improve the original manuscript.
Conflict of interest
Author DH was employed by the Cyprus Subsea Consulting and Services C.S.C.S. Ltd.
The remaining authors declare that the research was conducted in the absence of any commercial or financial relationships that could be construed as a potential conflict of interest.
Publisher’s note
All claims expressed in this article are solely those of the authors and do not necessarily represent those of their affiliated organizations, or those of the publisher, the editors and the reviewers. Any product that may be evaluated in this article, or claim that may be made by its manufacturer, is not guaranteed or endorsed by the publisher.
References
Alford M. H. (2003). Redistribution of energy available for ocean mixing by long-range propagation of internal waves. Nature 423, 159–163. doi: 10.1038/nature01628
Alford M. H. (2020). Revisiting near-inertial wind work: slab models, relative stress, and mixed layer deepening. J. Phys. Oceanogr. 50, 3141–3156. doi: 10.1175/JPO-D-20-0105.1
Alford M. H., MacKinnon J. A., Simmons H. L., Nash J. D. (2016). Near-inertial internal gravity waves in the ocean. Annu. Rev. Mar. Sci. 8, 95–123. doi: 10.1146/annurev-marine-010814-015746
Amitai Y., Lehahn Y., Lazar A., Heifetz E. (2010). Surface circulation of the eastern Mediterranean Levantine basin: insights from analyzing 14 years of satellite altimetry data. J. Geophys. Res. 115, C10058. doi: 10.1029/2010JC006147
Byun S.-S., Park J. J., Chang K.-I., Schmitt R. W. (2010). Observation of near-inertial wave reflections within the thermostad layer of an anticyclonic mesoscale eddy. Geophys. Res. Lett. 37, L01606. doi: 10.1029/2009GL041601
Chaigneau A., Pizarro O., Rojas W. (2008). Global climatology of near-inertial current characteristics from Lagrangian observations. Geophys. Res. Lett. 35, L13603. doi: 10.1029/2008GL034060
Cuypers Y., Bouruet-Aubertot P., Marec C., Fuda J.-L. (2012). Characterization of turbulence from a fine-scale parameterization and microstructure measurements in the Mediterranean Sea during the BOUM experiment. Biogeosciences 9, 3131–3149. doi: 10.5194/bg-9-3131-2012
D'Asaro E. A. (1985a). Upper ocean temperature structure, inertial currents, and Richardson numbers observed during strong meteorological forcing. J. Phys. Oceanogr. 15, 943–962. doi: 10.1175/1520-0485(1985)015<0943:UOTSIC>2.0.CO;2
D'Asaro E. A., Eriksen C. C., Levine M. D., Paulson C. A., Niiler P., Van Meurs P. (1995). Upper-ocean inertial currents forced by a strong storm. Part I: data and comparisons with linear theory. J. Phys. Oceanogr. 25, 2909–2936. doi: 10.1175/1520-0485(1995)025<2909:UOICFB>2.0.CO;2
D’Asaro E. (1985b). The energy flux from the wind to near-inertial motions in the surface mixed layer. J. Phys. Oceanogr. 15, 1043–1059. doi: 10.1175/1520-0485(1985)015<1043:TEFFTW>2.0.CO;2
Egorova V. M., Zyryanov V. N., Sokolovskiy M. A. (2022). The hydrodynamic theory of the Cyprus Eddy. Ocean Dynamics 72, 1–20. doi: 10.1007/s10236-021-01484-7
Elipot S., Lumpkin R. (2008). Spectral description of oceanic near-surface variability. Geophys. Res. Lett. 35, L05606. doi: 10.1029/2007GL032874
Elipot S., Lumpkin R., Prieto G. (2010). Modification of inertial oscillations by the mesoscale eddy field. J. Geophys. Res. 115, C09010. doi: 10.1029/2009JC005679
Estournel C., Marsaleix P., Ulses C. (2021). A new assessment of the circulation of Atlantic and Intermediate Waters in the Eastern Mediterranean. Progr. Oceanogr. 198, 102673. doi: 10.1016/j.pocean.2021.102673
Fernández-Castro B., Evans D. G., Frajka-Williams E., Vic C., Naveira-Garabato A. C. (2020). Breaking of internal waves and turbulent dissipation in an anticyclonic mode water eddy. J. Phys. Oceanogr. 50, 1893–1914. doi: 10.1175/JPO-D-19-0168.1
Ferrari R., Wunsch C. (2009). Ocean circulation kinetic energy: reservoirs, sources, and sinks. Annu. Rev. Fluid Mech. 41 (2009), 253–282. doi: 10.1146/annurev.fluid.40.111406.102139
Gonella J., Eskenazi G., Fropo J. (1967). Résultats des mesures de vent et de courant à la bouée-laboratoire au cours de l'année 1964. Cahiers Oceanog. 19 (3), 195–218.
Granata T., Wiggert J., Dickey T. (1995). Trapped, near-inertial waves and enhanced cholorophyll distributions. J. Geophys. Res. 100, 20793–20804. doi: 10.1029/95JC01665
Groom S., Herut B., Brenner S., Zodiatis G., Psarra S., Kress N., et al. (2005). Satellite-derived spatial and temporal biological variability in the Cyprus Eddy. Deep-Sea Res. II 52, 2990–3010. doi: 10.1016/j.dsr2.2005.08.019
Hayes D. R., Schroeder K., Poulain P.-M., Testor P., Mortier L., Bosse A., et al. (2019). “Review of the circulation and characteristics of intermediate water masses of the mediterranean: implications for cold-water coral habitats,” in Mediterranean cold-water corals: past, present and future, vol. 9 . Eds. Orejas C., Jiménez C. (Cham: Springer). doi: 10.1007/978-3-319-91608-8_1
Hayes D. R., Zodiatis G., Konnaris G., Hannides A., Solovyov D., Testor P. (2011). “Glider transects in the Levantine Sea: Characteristics of the warm core Cyprus Eddy,” in OCEANS 2011 IEEE, Santander, Spain. 1–9. doi: 10.1109/Oceans-Spain.2011.6003393
Jochum M., Briegleb B. P., Danabasoglu G., Large W. G., Norton N. J., Jayne S. R., et al. (2013). The impact of oceanic near-inertial waves on climate. J. Clim. 26, 2833–2844. doi: 10.1175/JCLI-D-12-00181.1
Kawaguchi Y., Wagawa T., Igeta Y. (2020). Near-inertial internal waves and multiple-inertial oscillations trapped by negative vorticity anomaly in the central Sea of Japan. Prog. Oceanogr. 181, 102240. doi: 10.1016/j.pocean.2019.102240
Kunze E. (1985). Near-inertial wave propagation in geostrophic shear. J. Phys. Oceanogr. 15, 544–565. doi: 10.1175/1520-0485(1985)015<0544:NIWPIG>2.0.CO;2
Kunze E., Schmitt R. W., Toole J. M. (1995). The energy balance in a warm-core ring's near-inertial critical layer. J. Phys. Oceanogr. 25, 942–957. doi: 10.1175/1520-0485(1995)025<0942:TEBIAW>2.0.CO;2
Lacombe H., Gonella J. (1964). Oscillations d'inertie des masses d'eau en Méditerranée Occidentale. Compt. Rend. 259, 2487–2490.
Lelong M., Cuypers Y., Bouruet-Aubertot P. (2020). Near-inertial energy propagation inside a Mediterranean anticyclonic eddy. J. Phys. Oceanogr. 50, 2271–2288. doi: 10.1175/JPO-D-19-0211.1
Lilly J. M., Gascard J.-C. (2006). Wavelet ridge diagnosis of time-varying elliptical signals with application to an oceanic eddy. Nonlin. Processes Geophys. 13, 467–483. doi: 10.5194/npg-13-467-2006
Lilly J. M., Olhede S. C. (2012). Generalized Morse wavelets as a superfamily of analytic wavelets. IEEE T. Signal Proces. 60, 6036–6041. doi: 10.1109/TSP.2012.2210890
Lilly J. M., Perez-Brunius P. (2021). Extracting statistically significant eddy signals from large Lagrangian datasets using wavelet ridge analysis, with application to the Gulf of Mexico. Nonlinear. Proc. Geoph. 28, 181–212. doi: 10.5194/npg-28-181-2021
Lilly J. M., Scott R. K., Olhede S. C. (2011). Extracting waves and vortices from Lagrangian trajectories. Geophys. Res. Lett. 38, L23605. doi: 10.1029/2011GL049727
Martínez-Marrero A., Barceló-Llull B., Pallàs-Sanz E., Aguiar-González B., Estrada-Allis S. N., Gordo C., et al. (2019). Near-inertial wave trapping near the base of an anticyclonic mesoscale eddy under normal atmospheric conditions. J. Geophys. Res. Oceans 124, 8455–8467. doi: 10.1029/2019JC015168
Martínez-Moreno J., Hogg A. M., England M. H., Constantinou N. C., Kiss A. E., Morrison A. K. (2021). Global changes in oceanic mesoscale currents over the satellite altimetry record. Nat. Clim. Change 11, 397–403. doi: 10.1038/s41558-021-01006-9
Mauri E., Sitz L., Gerin R., Poulain P.-M., Hayes D. R., Gildor H. (2019). On the variability of the circulation and water mass properties in the Eastern Levantine Sea between September 2016–August 2017. Water 11 (9), 1741. doi: 10.3390/w11091741
Menna M., Gerin R., Bussani A., Poulain P.-M. (2017). The OGS Mediterranean drifter database: 1986-2016 (Trieste, Italy). Tech. Rep. OGS 2017/92 OCE 28 MAOS. 34 pp.
Menna M., Gerin R., Notarstefano G., Mauri E., Bussani A., Pacciaroni M., et al. (2021). On the circulation and thermohaline properties of the eastern mediterranean sea. Front. Mar. Sci. 8. doi: 10.3389/fmars.2021.671469
Menna M., Poulain P.-M., Bussani A., Gerin R. (2018). Detecting the drogue presence of SVP drifters from wind slippage in the Mediterranean Sea. Measurement 2018, 125, 447–453. doi: 10.1016/j.measurement.2018.05.022
Menna M., Poulain P.-M., Zodiatis G., Gertman I. (2012). On the surface circulation of the Levantine sub-basin derived from Lagrangian drifters and satellite altimetry data. Deep-Sea Res. I 65, 46–58. doi: 10.1016/j.dsr.2012.02.008
Millot C., Crépon M. (1981). Inertial oscillations on the continental shelf of the Gulf of Lions – observations and theory. J. Phys. Oceanogr. 11 (5), 639–657. doi: 10.1175/1520-0485(1981)011<0639:IOOTCS>2.0.CO;2
Mooers C. N. K. (1975). Several effects of a baroclinic current on the cross-stream propagation of inertial-internal waves. Geophys. Fluid. Dyn. 6, 245–275. doi: 10.1080/03091927509365797
Munk W., Wunsch C. (1998). Abyssal recipes II: energetics of tidal and wind mixing. Deep-Sea Res. I 45, 1977–2010. doi: 10.1016/S0967-0637(98)00070-3
Niiler P. P., Paduan J. D. (1995). Wind-driven motions in the Northeast Pacific as measured by Lagrangian drifters. J. Phys. Oceanogr. 25, 2819–2830. doi: 10.1175/1520-0485(1995)025<2819:WDMITN>2.0.CO;2
Park J. J., Kim K., Crawford W. R. (2004). Inertial currents estimated from surface trajectories of ARGO floats. Geophys. Res. Lett. 31, L13307. doi: 10.1029/2004GL020191
Park J. J., Kim K., King B. A. (2005). Global statistics of inertial motions. Geophys. Res. Lett. 32, L14612. doi: 10.1029/2005GL023258
Percival D. B., Walden A. T. (1993). Spectral analysis for physical applications (New York, N. Y., USA: Cambridge University Press).
Perkins H. (1972). Inertial oscillations in the mediterranean. Deep-Sea Res. 19, 289–296. doi: 10.1016/0011-7471(72)90022-8
Perkins H. (1976). Observed effect of an eddy on inertial oscillations. Deep-Sea Res. 23, 1037–1042. doi: 10.1016/0011-7471(76)90879-2
Petrenko A., Leredde Y., Marsaleix P. (2005). Circulation in a stratified and wind-forced Gulf of Lions, NW Mediterranean Sea: in situ and modeling data. Cont. Shelf Res. 25, 7–27. doi: 10.1016/j.csr.2004.09.004
Pirro N., Negretti M. E., Laxenaire R., Menna M., Martellucci R., Bosse A., et al. (2023). Formation mechanism of Cyprus Eddy and downstream eddies: laboratory experiments and in-situ observations. Sci. Rep. in preparation.
Poulain P.-M. (1990). Near-inertial and diurnal motions in the trajectories of mixed layer drifters. J. Mar. Res. 48, 793–823.
Poulain P.-M., Luther D. S., Patzert W. C. (1992). Deriving inertial wave characteristics from surface drifter velocities: frequency variability in the tropical Pacific. J. Geophys. Res. 97 (C11), 17947–17959. doi: 10.1029/92JC01381
Prigent A., Poulain P.-M. (2017). On the Cyprus eddy kinematics. Tech. Rep. OGS. 2017/77 sez. OCE 19 MAOS. 11 pp.
Rio M. H., Pascual A., Poulain P.-M., Menna M., Barcelò B., Tintorè J. (2014). Computation of a new mean dynamic topography for the Mediterranean Sea from model outputs, altimeter measurements and oceanographic in situ data. Ocean Sci. 2014, 10, 731–744. doi: 10.5194/os-10-731-2014
Rippeth T. P., Simpson J. H., Player R. J., Garcia M. (2002). Current oscillations in the diurnal–inertial band on the Catalonian shelf in spring. Cont. Shelf Res. 2, 247–265. doi: 10.1016/S0278-4343(01)00056-5
Robinson A. R., Golnaraghi M., Leslie W. G., Artegiani A., Hecht A., Lazzoni E., et al. (1991). The eastern Mediterranean general circulation: features, structure and variability. Dyn. Atmos. Oceans 15, 215–240. doi: 10.1016/0377-0265(91)90021-7
Rohrs J., Halsne T., Sutherland G., Dagestad K.-F., Hole L. R., Brostrom G., et al. (2023). Current shear and turbulence during a near-inertial wave. Front. Mar. Sci. 10. doi: 10.3389/fmars.2023.1115986
van Meurs P. (1998). Interactions between near-inertial mixed layer currents and the mesoscale: the importance of dpatial variabilities in the vorticity field. J. Phys. Oceanogr. 28, 1363–1388. doi: 10.1175/1520-0485(1998)028<1363:IBNIML>2.0.CO;2
Whalen C. B., de Lavergne C., Naveira Garabato A. C., Klymak J. M., McKinnon J. A., Sheen K. L. (2020). Internal wave-driven mixing: governing processes and consequences for climate. Nat. Rev. Earth Environ. 1, 606–621. doi: 10.1038/s43017-020-0097-z
Whitt D. B., Thomas L. ,. N. (2013). Near-inertial waves in strongly baroclinic currents. J. Phys. Oceanogr. 43, 706–725. doi: 10.1175/JPO-D-12-0132.1
Whitt D. B., Thomas L. N. (2015). Resonant generation and energetics of wind-forced near-inertial motions in a geostrophic flow. J. Phys. Oceanogr. 45, 181–208. doi: 10.1175/JPO-D-14-0168.1
Zodiatis G., Drakopoulos P., Brenner S., Groom S. (2005). Variability of the Cyprus warm core eddy during the CYCLOPS project. Deep-Sea Res. II 52, 2897–2910. doi: 10.1016/j.dsr2.2005.08.020
Appendix
Wavelet ridge analysis
Bivariate rotary wavelet continuous transforms of drifter position or velocity time series is calculated using generalized Morse wavelets for both negative (anticyclonic) and positive (cyclonic) rotations. The generalized Morse wavelet is composed of a complex exponential (carrier) multiplied by a Gaussian window (envelope). In this analysis, the wavelet order and shape parameters are set to 3 and 4, respectively (see Lilly and Olhede, 2012). The wavelet is bandpass normalized, meaning that its Fourier transform has a peak value of 2 for all frequencies. The frequency resolution increases linearly with frequency: at 0.1 cpd it is ~ 0.07 cpd, while at 1 cpd it is ~0.7 cpd.
A ridge detection algorithm is applied to identify the continuous one-sided ridges with maximum transform amplitudes. The minimum number of wavelet length in a ridge is set to 2. The ridges are trimmed to exclude erroneous results at the beginning and end of the time series. In this work, the ridge detection analysis is only performed for negative rotary wavelet transforms to identify continuous anticyclonic rotary motions (gyre rotation and NIOs).
The semi-major axis (a), semi-minor axis (b) and inclination θ of the position or velocity ellipses are estimated from the negative (wn) and positive (wp) wavelet transform values along the ridges identified in the anticyclonic wavelets according to the following equations (Lilly and Gascard, 2006):
If Fp is the frequency of the ridges detected in the position wavelets, the maximum and minimum velocities of the drifter around the elliptical orbit are defined as Vmaxp = 2πa/Fp and Vminp = 2πb/Fp, where a and b are the semi-axes of the position ellipse. The geometrical mean radius is defined as , while the ellipse center is estimated by removing the rotational motion from the original position time series. The mean orbital speed is calculated by dividing the ellipse perimeter by the period. The eccentricity of the ellipse is defined as .
Inertial frequency and angular velocity
The local Coriolis or inertial frequency f is defined as 2 Ω sin(latitude), where Ω is the angular velocity of the Earth (7.29 10-5 rad/s). To be more precise, f is an angular frequency and the inertial frequency is equal to f/2π. Hence, equation 1 can be expressed as follows in terms of frequencies:
For example, if ζ = -0.15 f and latitude = 33.5°N, f = 8.0472 10-5 rad/s and ζ = -1.2 10-5 cps = 1.05 cpd. So the theoretical frequency shift is: 1.05/4π = 0.083 cpd.
Using Stokes’s theorem and assuming solid-body rotation, we have that ζ = 4 π/P, where P is the rotation period. Thus, the frequency shift is simply 1/P.
Note that inertial motions have an angular velocity of f, a vorticity of 2f according to Stokes’ theorem and a Rossby number, ratio of angular velocity and f, equal to 1.
Keywords: Eastern Mediterranean, Cyprus Gyre, near-inertial motion, drifters, wavelet analysis
Citation: Poulain P-M, Menna M, Mauri E, Pirro A, Hayes DR and Gildor H (2023) Drifter observations of surface currents in the Cyprus Gyre. Front. Mar. Sci. 10:1266040. doi: 10.3389/fmars.2023.1266040
Received: 24 July 2023; Accepted: 11 October 2023;
Published: 27 October 2023.
Edited by:
Chunyan Li, Louisiana State University, United StatesReviewed by:
Yang Ding, Ocean University of China, ChinaJohannes Röhrs, Norwegian Meteorological Institute, Norway
Copyright © 2023 Poulain, Menna, Mauri, Pirro, Hayes and Gildor. This is an open-access article distributed under the terms of the Creative Commons Attribution License (CC BY). The use, distribution or reproduction in other forums is permitted, provided the original author(s) and the copyright owner(s) are credited and that the original publication in this journal is cited, in accordance with accepted academic practice. No use, distribution or reproduction is permitted which does not comply with these terms.
*Correspondence: P.-M. Poulain, cHBvdWxhaW5Ab2dzLml0
†Present address: D. R. Hayes, Cyprus Subsea Consulting and Services C.S.C.S. Ltd, Nicosia, Cyprus
 P.-M. Poulain
 M. Menna
 E. Mauri1
 H. Gildor