 Dong Jinli
 Shen Manhong1,2
 Yu Xuan
- 1School of Business, Ningbo University, Ningbo, China
- 2Institute of Ecological Civilization, Zhejiang Agriculture and Forestry University, Hangzhou, China
The marine ecological and environmental problems caused by the mariculture industry have drawn considerable attention. The Slacks-based measure (SBM) model was applied to measure the eco-economic efficiency of China’s mariculture industry from 2011 to 2020, where the nitrogen and phosphorus pollutants produced in the mariculture process were the non-desired outputs. The results indicated that the average value of mariculture eco-economic efficiency in different provinces of China was above 0.8 in the higher status. The σ and β convergence analysis verified that the differences in the eco-economic efficiency of mariculture in coastal provinces of China were shrinking significantly (P = 0.017 and 0.000, respectively). There are imbalances in regions as the change of the East China Sea and the South China Sea showed an approximately “U” shaped state. The Chinese government should continue to strengthen its economic and policy support for mariculture to ensure its long-term green and healthy development in a long time.
1 Introduction
Given the increasing depletion of marine natural fishery resources and the weak growth of marine capture fisheries, the mariculture industry occupies an increasingly important position. With its vast sea area and long coastline, China has good conditions for supplying mariculture products, and the aquaculture production was 496,200 tons, a share of 56.7% of the total in 2020 (Food and Agriculture Organization of the United Nations, 2020). The mariculture industry is of great importance in promoting the economic and social development of coastal areas, ensuring the livelihood of coastal fishery people and the protein supply needs of the general public. As a resource and environment-dependent industry, the continuous development of mariculture has also resulted in varying degrees of environmental pollution and ecological damage (Yang, 2004; Wang et al., 2019), especially the ecological environment of the watershed (Nielsen et al., 2014; Pérez, 2021).
Generally, eco-economic efficiency refers to the input–output ratio of economic indicators to resource or environmental indicators (Bringezu et al., 2004). For the mariculture industry, the eco-economic efficiency of mariculture is the ratio between the resources invested in the production process of mariculture and its aquaculture products with the inevitable pollution caused by mariculture (Qin et al., 2018). Therefore, when examining the efficiency of mariculture, using positive output indicators alone, such as the output or output value of a unit of aquatic product, cannot objectively reflect the production relationship of aquaculture. Rather, it will be more adequately reflected in the coordination relationship among resources, environment, and economy in the process of mariculture by introducing the undesired output.
In the evaluation of ecological and economic efficiency, specific industries or regions are generally used as the research objects (Peng et al., 2020). From the perspective of the aquaculture industry, many studies have explored the evaluation of aquaculture, economic, and environmental efficiency. Xing and Xu (2016) measured and analyzed the economic and environmental efficiency of aquaculture using freshwater fish pond culture in different modes. Wan and Yang (2017) calculated the aquaculture technical efficiency of 29 provinces from 2007 to 2015 using stochastic frontier analysis method. Jiang et al. (2021) used the CD stochastic frontier production function to calculate the technical efficiency of China’s fisheries. However, the eco-economic efficiency researches should include resource conservation and environmental friendliness. In addition, the study of any single dimension, such as economic or environmental efficiency in fishery breeding, cannot fully reflect the actual situation of coordinated development of resources, environment, and economy. As a part of the aquaculture industry, mariculture involves economy, environment, and resource utilization efficiency simultaneously. However, relatively few research has been conducted on the eco-economic efficiency of the mariculture industry.
In some eco-economic efficiency studies, the selection of indicators for environmental economic investigation is different in marine areas. As a huge capacity pool, the discharge of land industrial, agricultural, and domestic water leads to the deterioration of seawater quality and thus affects the development of marine economy. Therefore, the amount of wastewater entering the sea is an undesirable indicator for the efficiency measurement of China’s provincial marine economy (Zhao et al., 2016). Changes in external seawater environmental quality, such as red tide and disease transmission, will also bring unavoidable losses to the mariculture industry; hence, the loss value of mariculture aquatic products is regarded as an undesirable output in the evaluation of mariculture green technology efficiency (Ji and Zeng, 2017; Ji et al., 2021). However, when focusing on the mariculture field, the undesired output in the process of mariculture is the focus of the investigation of the eco-economic efficiency of mariculture. On the one hand, the pollution caused by industrial, agricultural, and domestic sewage discharges to the mariculture environment is localized. It may affect the growth of mariculture products, such as ordinary cages, rafts, hanging cages, and bottom sowing in mariculture, but it is less likely to damage the value of ponds, factories, and deepwater cage culture. On the other hand, with the division and management of marine aquaculture areas, restricted aquaculture areas, and prohibited aquaculture areas, the negative impact of the external environment on mariculture has been reduced (Wang et al., 2020; Yu et al., 2020). Therefore, when focusing on the mariculture field, the undesired output of mariculture process is the key to investigate the ecological and economic efficiency of mariculture.
The large amounts of nutrients in the water, as well as changes in parameters such as temperature or salinity cause the proliferation of phytoplankton, which can lead to the deterioration of fish health or outright mortality. For example, in Chile, a globally renowned salmon producer, the input of large amounts of nitrogen and phosphorus in the aquaculture process exceeds the limits of environmental carrying capacity (Niklitschek et al., 2013), which the reasons for this phenomenon may be related to the conflicting demands of coastal space use and the potential impact of marine resources (Soto et al., 2019), faced with environmental challenges, new management laws may have to be proposed (Bustos-Gallardo and Irarrázaval, 2021). In the area of Dongshan Island, China, where cage aquaculture is well developing, the average values of total nitrogen and total phosphorus are much higher than the safe level by measuring the nutrient levels at different points, which are related to excessive fish feed and feces, and alternating farming and fallowing is suggested to mitigate the organic pollution (Cai, Z. Z et al, 2023). Therefore, the development of mariculture cannot be based solely on the economic value or yield of fishery products, and it is necessary to examine the impact of pollution on the whole mariculture (Martinez-Cordrero and Leung, 2004; Qin et al., 2018; Zhang et al., 2020; Yang et al., 2021). This paper takes the nitrogen and phosphorus pollutants produced in the process of mariculture as the undesirable output index to measure the eco-economic efficiency.
Especially after entering the 21st century, China began to propose the healthy development plan of aquaculture. What is the development level of the eco-economic efficiency of mariculture in different coastal provinces of China? Is there a considerable difference among provinces? Will this difference gradually shrink in the future? On the basis of the reality of the development of China’s mariculture industry, the ecological and economic efficiency of mariculture in different coastal provinces is measured and analyzed to reveal the development status of resources, environment, and economy in different coastal provinces. This study provides an effective theoretical and practical basis for the policy formulation and implementation of the long-term green and healthy development of China’s mariculture industry.
2 Materials and methods
2.1 Study region
The research object includes the 10 provinces (cities) in China’s coastal areas from 2010 to 2020, which can be divided into three sea zones: (1) the Yellow and Bohai Seas (Tianjin, Hebei, Liaoning, Shandong); (2) the South China Sea (Guangdong, Guangxi, and Hainan); (3) the eastern sea (Jiangsu, Fujian, Zhejiang). Shanghai is not included in the analysis because of the serious data loss and the small output value.
2.2 Input index data
The factors invested in fishery production mainly include capital, labor, and water area, where capital is expressed as the total investment in fishery fixed assets (Chen, 2010). The factors of production in the agricultural production process are usually divided into three categories: labor, land, and fixed assets. Combined with the characteristics of the mariculture industry, mariculture area, mariculture labor, and mariculture fixed assets (replaced by mariculture motorized fishing vessels) can then be used as input indicators (Ji and Zeng, 2016). The mariculture intermediate consumption is an important indicator of mariculture resource input, but it is difficult to determine directly from the available data and is generally obtained through indirect calculation of fishery intermediate consumption (Qin et al., 2018). Feed, water quality, and fry are the three major influencing factors in the process of mariculture production in China. The average mariculture area, feed input per unit area, and fry input per unit area can be used as indicators of mariculture resource input factors (Yang et al., 2021). On the basis of previous research, and the actual production and data availability and accuracy, this paper selects the mariculture area, the number of aquatic fry species invested in mariculture, the power of mariculture fishing vessels (Ji and Zeng, 2016; Yang et al., 2021), and the number of mariculture professionals employed in each province as input indicators in calculating the ecological efficiency of mariculture in China.
2.3 Output index data
Due to the variety of mariculture products, some marine products have high quantity and low price, such as shellfish. Using aquaculture output (Chen, 2010) as the expected output cannot truly reflect the expected output of mariculture. The selection of mariculture output value can better reflect the economic value of mariculture (Qin et al., 2018). Metabolic wastes, such as ammonia nitrogen and phosphate produced during the physiological activities of mariculture organisms, are the main nitrogen and phosphorus sources of self-pollution in aquaculture systems (Yuan et al., 2011; Liu et al., 2021; Zong et al., 2017). This paper applies the pollution production coefficient method (Qin et al., 2018; Li et al., 2021) to calculate the output of nitrogen and phosphorus pollutants in mariculture. The pollution coefficient (R) of feeding feed-type aquaculture organisms was searched according to the “Aquaculture Pollution Source Discharge Coefficient Manual.” The pollution coefficient (R) of shellfish aquaculture organisms was obtained from references (Bureau and Hua, 2010; Cao et al., 2015; Liu et al., 2018). For autotrophic organisms such as economic algae, are beyond the scope of this paper. Due to space reasons, the specific pollution coefficient table of nitrogen and phosphorus pollution in mariculture is omitted here.
The following formula:
where L is the pollution output of mariculture organisms1, R is the pollution production coefficient of the species, and W is the incremental production of the species2.
The specific design of indicators and variables is shown in Table 1.
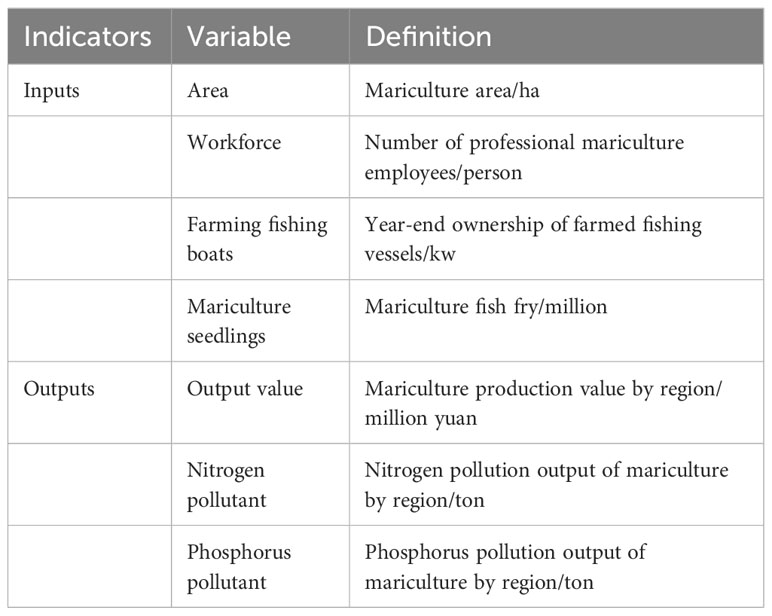
Table 1 Mariculture eco-economic efficiency input–output indicators.
The input and output index data of this paper are mainly derived from the “China Agriculture and Forestry Database” and “China Agriculture, Countryside and Farmer Database” in the EPS data platform and the “China Fishery Statistical Yearbook” over the years.
2.4 Super-efficient SBM-DEA model
In terms of research methods, the model parameter method is more often used in the study of the technical efficiency of single aquaculture (Wan and Yang, 2017; Jiang et al., 2021). China’s mariculture industry is characterized by different breeding methods and diverse breeding types. In comparison with the general production function method, the efficiency assessment is not sufficiently accurate. Charnes et al. (1978) proposed the data envelopment analysis (DEA) method, which is highly suitable for the evaluation of ecological and economic efficiency of mariculture. In comparison with SFA and other parameter evaluation methods, this model does not need to set the model form in advance, which can effectively avoid the subjectivity of parameter setting. In the process of studying production efficiency, it has the advantages of low sample size and no restriction of index dimension, which can solve the efficiency evaluation problem of multi-input and multi-output (Ji and Zeng, 2016).
The traditional DEA model does not consider the relaxation of input and output factors, which may lead to deviations in the calculation results. The production efficiency of the decision-making unit (DMU) is also easy to overestimate, and the consideration of external factors is not highly accurate. Tone (2001) proposed a non-radial and non-angle DEA analysis method, namely SBM model, to solve the drawbacks of the traditional DEA method. In the SBM model, relaxation variables are directly introduced into the objective function, which solves the problem of slackness in DMUs and considers the problem of efficiency evaluation in undesirable outputs. However, when the efficiency values of multiple efficiency DMUs are equal to 1 at the same time, ranking these DMUs effectively is difficult. To solve this problem, Tone (2002) further proposed the Super⁃SBM model based on modified slack variables, which effectively solves the drawback of SBM model that effective units cannot be evaluated and ranked further. The core of the model is that the super efficiency value of the effective DMU is generally greater than 1. When the effective DMU efficiency value is greater than or equal to 1, the larger the conclusion value is, the higher the efficiency will be.
The improved Super-SBM model was used to measure the eco-economic efficiency of mariculture. The specific principle is as follows. There exist n DMUs in the ecological economic system of mariculture. Particularly, various factor inputs, such as mariculture area and labor x ∈ Rm; the output value of the mariculture industry as the desired output y ∈ Rs1; and the nitrogen and phosphorus pollution as the non-desired output yb ∈ Rs2, which is defined in the following matrix:
Assuming X > 0, yg > 0, and yb > 0, the set of production possibilities is:
where λ is the weight vector, λ ∈ Rn. On the basis of the research idea of global DEA (Ji and Zeng, 2016), this paper envelopes the production possibility sets of all periods, that is, P = P1 ∪ P2 ∪… ∪ PT (P1, P2,…, PT represent the set of production possibilities for each period), and jointly constructs the production frontier, such that the DMUs of different periods are comparable.
The definition of the Super-SBM model with undesirable outputs is given by Tone (2002). The model is set as follows:
where λ is the weight vector; S−, Sg, and Sb are slack variables; S− denotes redundancy of inputs; Sg denotes deficiency of desired outputs; Sb denotes excess of undesired outputs; and ρ* is the strictly decreasing objective function of the three slack variables (i.e., the value of eco-economic efficiency of mariculture to be calculated). The function is efficient when and only when S− = Sg = Sb, and ρ* ≥ 1. When ρ*< 1 and at least one of the three slack variables S−, Sg, and Sb is not zero, there exists an efficiency loss in the DMU and the input–output should be improved.
2.5 Malmquist index model
The general DEA method can only measure the eco-economic efficiency value of different DMUs statically, and it cannot observe the efficiency changes under panel data (Lu and Fang, 2017; Tang et al., 2017; Xue et al., 2018). To analyze the dynamic change and efficiency decomposition of the eco-economic efficiency of mariculture, this paper uses the Malmquist index model to dynamically study the eco-economic efficiency of mariculture in different coastal provinces to further reveal the eco-economic development status of mariculture in China.
Färe et al. (1997) proposed a DEA-Malmquist model index based on the DEA model, which can evaluate the change of efficiency in multiple periods, and decomposed the causes of efficiency changes into different parts. To analyze the dynamic changes of the ecological and economic efficiency of mariculture, the Malmquist model was introduced with reference to Lu and Fang (2017). The Malmquist index consists of two components: one is the change in technical efficiency, and the other is the change in production technology. From period t to period t + 1, its calculation formula is as follows:
This can be illustrated by the formula of total factor productivity (TFP) = TC ×EC. TFP > 1 indicates the progress in mariculture eco-economic efficiency, TFP = 1 indicates the constant level of mariculture eco-economic efficiency, and TFP< 1 indicates the regression in mariculture eco-economic efficiency. The technical progress change (TC)is the change in technical change of DMU from period t to t + 1, which representing the degree of technological innovation in production. The technical efficiency change (EC) is the contribution of technical efficiency change to productivity from t to t + 1, which can be decomposed into pure technical efficiency index (PEC) and scale efficiency index (SEC).
2.6 Convergence analysis
In the mid-1960s, the neoclassical economic growth theory, represented by Solow and Swan, posits that in a closed economic system, the gap between the incomes of different economic individuals within the effective economy will decrease over time, which is represented by “convergence.” The convergence theory has been used in some research of economic development, such as productivity (Xu, 2010; Qian and Liu, 2014), energy and environment (Chen et al., 2012), and green economic development (Qian and Liu, 2014; Yang and Wang, 2019). To study the spatiotemporal variation of the eco-economic efficiency in mariculture, σ convergence and β convergence analyses were conducted for the eco-economic efficiency of mariculture in different coastal provinces of China.
2.6.1 σ convergence
The σ convergence examines the evolution process of the eco-economic efficiency of mariculture in different coastal provinces over time, focusing on the comparison of indicators from a perspective. If the difference in the eco-economic efficiency of mariculture in different provinces decreases over time, then σ convergence exists in the eco-economic efficiency of mariculture. , CV is the coefficient of variation, σ is the standard deviation of eco-economic efficiency value , and denotes the mean.
To further test the convergence status of σ for coastal eco-efficiency in China, the following model is constructed:
where σt denotes the standard deviation of mariculture eco-economic efficiency in year t, c is the intercept term, t is the time trend, and μ is the random disturbance term. When the coefficient θ is larger than 0 and passes the significance test, the eco-economic efficiency levels of mariculture in different provinces are expanding over time and do not have the convergence characteristics of σ. Conversely, when the coefficient θ is smaller than 0 and passes the significance test, the differences in eco-economic efficiency levels of different coastal provinces are gradually decreasing, showing the convergence phenomenon of σ at eco-efficiency levels. When the coefficient θ is equal to 0, the inter-provincial differences in eco-economic efficiency levels are almost unchanged, neither convergence nor divergence does exist.
2.6.2 β convergence
The β convergence reflects the rate of development of mariculture eco-economic efficiency in different coastal provinces, which is negatively correlated with the initial level and focuses on the comparison of indicators from a vertical perspective. It can be further divided into two types: absolute and conditional β convergence.
2.6.2.1 Absolute β convergence test
Absolute β convergence indicates that the growth rate of mariculture eco-economic efficiency among different provinces is negatively correlated with the initial level, that is, the growth rate of mariculture eco-economic efficiency in the backward regions is higher than that in the developed regions. Eventually, the mariculture eco-economic efficiency in different provinces will reach exactly the same steady-state growth rate and growth level.
The absolute β convergence model for the eco-economic efficiency of mariculture is as follows:
The relevant expression for the absolute rate of convergence λ is
where β is the convergence coefficient, e is a constant, T is the investigation time, and λ is the rate of convergence.
2.6.2.2 Conditional β convergence test
Conditional β convergence means indicates factors such as resource characteristics and environmental conditions of mariculture in different provinces vary. In addition, the gap between mariculture in backward coastal provinces and developed provinces does not narrow over time, but all move at their own equilibrium levels and eventually converge to their own stable levels. That is, a convergence of eco-economic efficiency exists between the same or similar regions, whereas different regions have different convergence states (Di Liberto et al., 2008). Existing studies have generally used panel data fixed-effects (FE) model to test the conditional β convergence, which includes some control variables to reflect the characteristics of different regions (Chen et al., 2012). In the conditional β convergence estimation model,
where EEIi,t and EEIi,t+1 are the mariculture eco-economic efficiency of province i in years t and t + 1, respectively; α is the constant term; β is the convergence coefficient; εi,t is the error term; X is the control variable; and λj is the coefficient of the jth control variable. If β< 0, the growth rate of eco-economic efficiency of mariculture is inversely proportional to the initial level. The areas with low eco-economic efficiency of mariculture have the trend of catching up with the areas with high eco-economic efficiency of mariculture. Moreover, there exists β convergence in the difference of mariculture eco-economic efficiency; otherwise, it diverges.
3 Results
3.1 Results of descriptive statistics of variables
The input–output indicators of 10 different coastal provinces and cities from 2011 to 2020 are below Table 2:
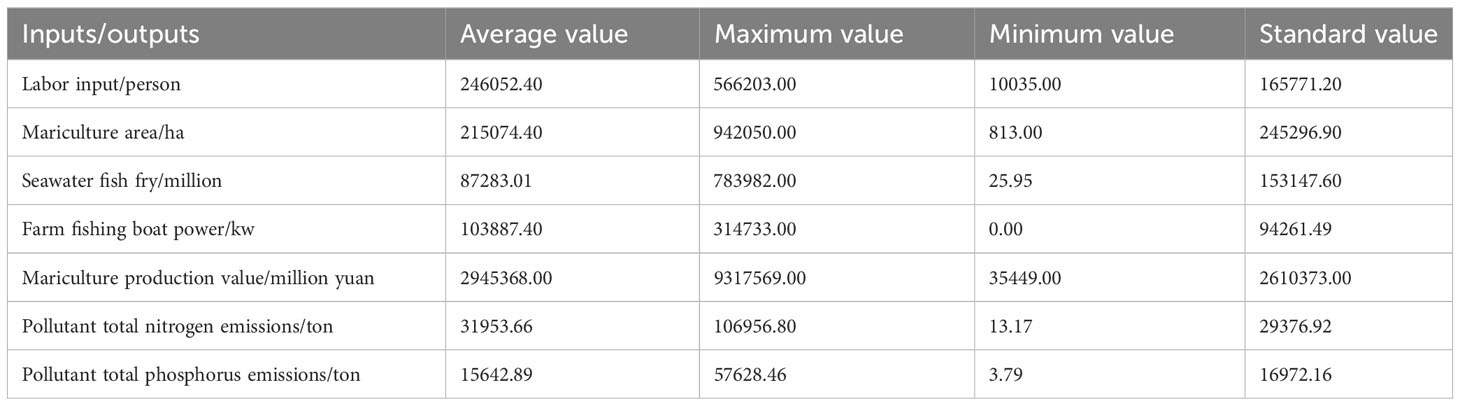
Table 2 Statistical description of mariculture input–output data (2011–2020).
3.2 Analysis of the measurement results of eco-economic efficiency
DEA-solver pro5.0 (http://www.saitech-inc.com/Products/Prod-DSP.asp) is used to calculate the SBM data envelopment model with undesirable outputs in 10 coastal provinces and cities from 2011 to 2020. The result shows that under the goal of adhering to the healthy development of aquaculture in China, most of the eco-economic efficiency of mariculture in coastal provinces and cities is in an effective state. Thus, the regional and time differences in the development of mariculture in different provinces and cities is difficult to compare fully. Therefore, MaxDEA Ultra 8 (http://www.maxdea.cn/) software is used to measure the super-efficiency SBM model with undesirable outputs, and the eco-economic efficiency value of mariculture in 10 coastal provinces and cities is obtained. The specific analysis results are shown in Table 3.
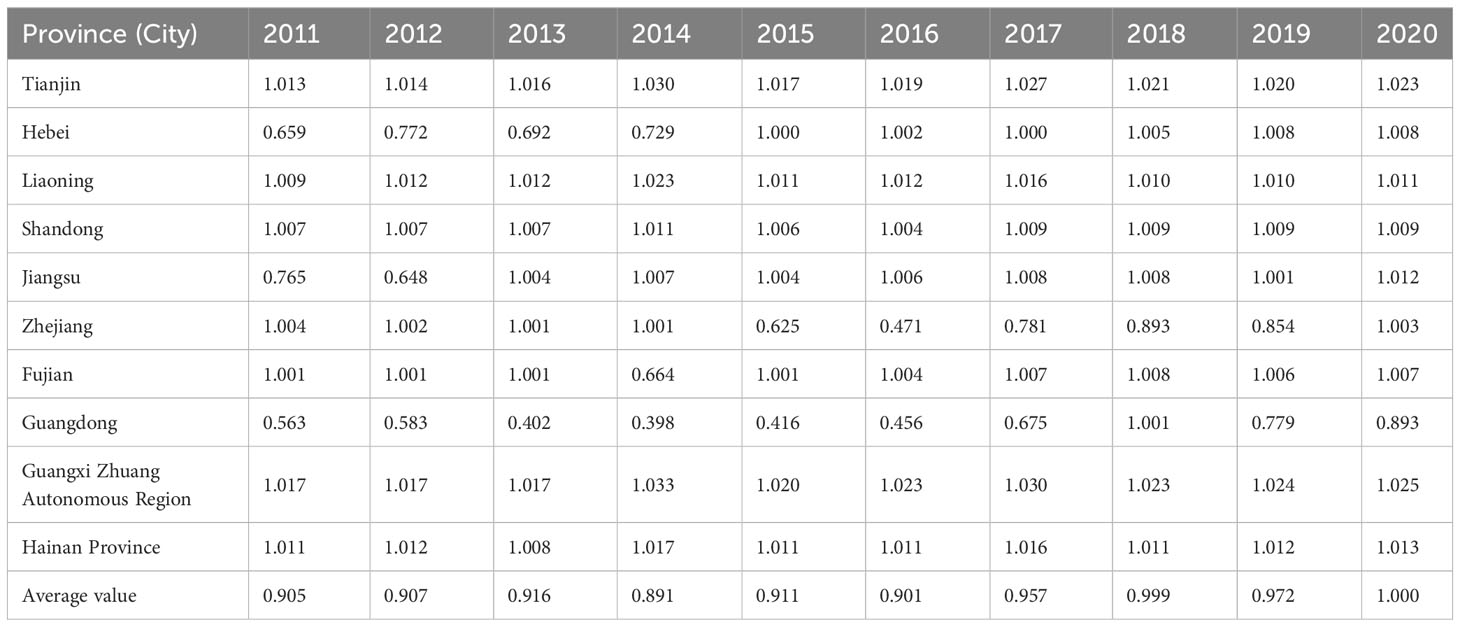
Table 3 Eco-economic efficiency value of marine aquaculture with undesirable output.
As shown in Table 3, the eco-economic efficiency of mariculture in most Chinese provinces and cities reached a relatively high level during the period of 2011–2020. Particularly, the average eco-economic efficiency level of mariculture in Guangxi, Tianjin, Liaoning, Hainan, and Shandong is greater than 1, which is in the stage of effective eco-economic efficiency. The production input and output efficiency is reasonable and is the first echelon. In addition, the average eco-economic efficiency of mariculture in Fujian, Jiangsu, Hebei, and Zhejiang Provinces is in the range of 0.8–1 level, and there exists room for improvement, in which the input and output efficiency is relatively reasonable and is the second echelon. The average eco-economic efficiency of Guangdong Province is the lowest (0.617).
The ecological and economic efficiency of the Yellow and Bohai Seas has shown a good steady state. Under the goal of coordinated development of mariculture eco-economy, the eco-economic efficiency of mariculture of the South China Sea, as the main tropical mariculture area in China, shows a gradually increasing semi “U” shaped state. The ecological and economic efficiency of mariculture in the eastern sea areas of China, mainly in Jiangsu, Shanghai (not calculated), Zhejiang, and Fujian, took 2016 as the time node, and the ecological and economic efficiency of mariculture showed a more obvious “U” shaped fluctuation state (Figure 1).
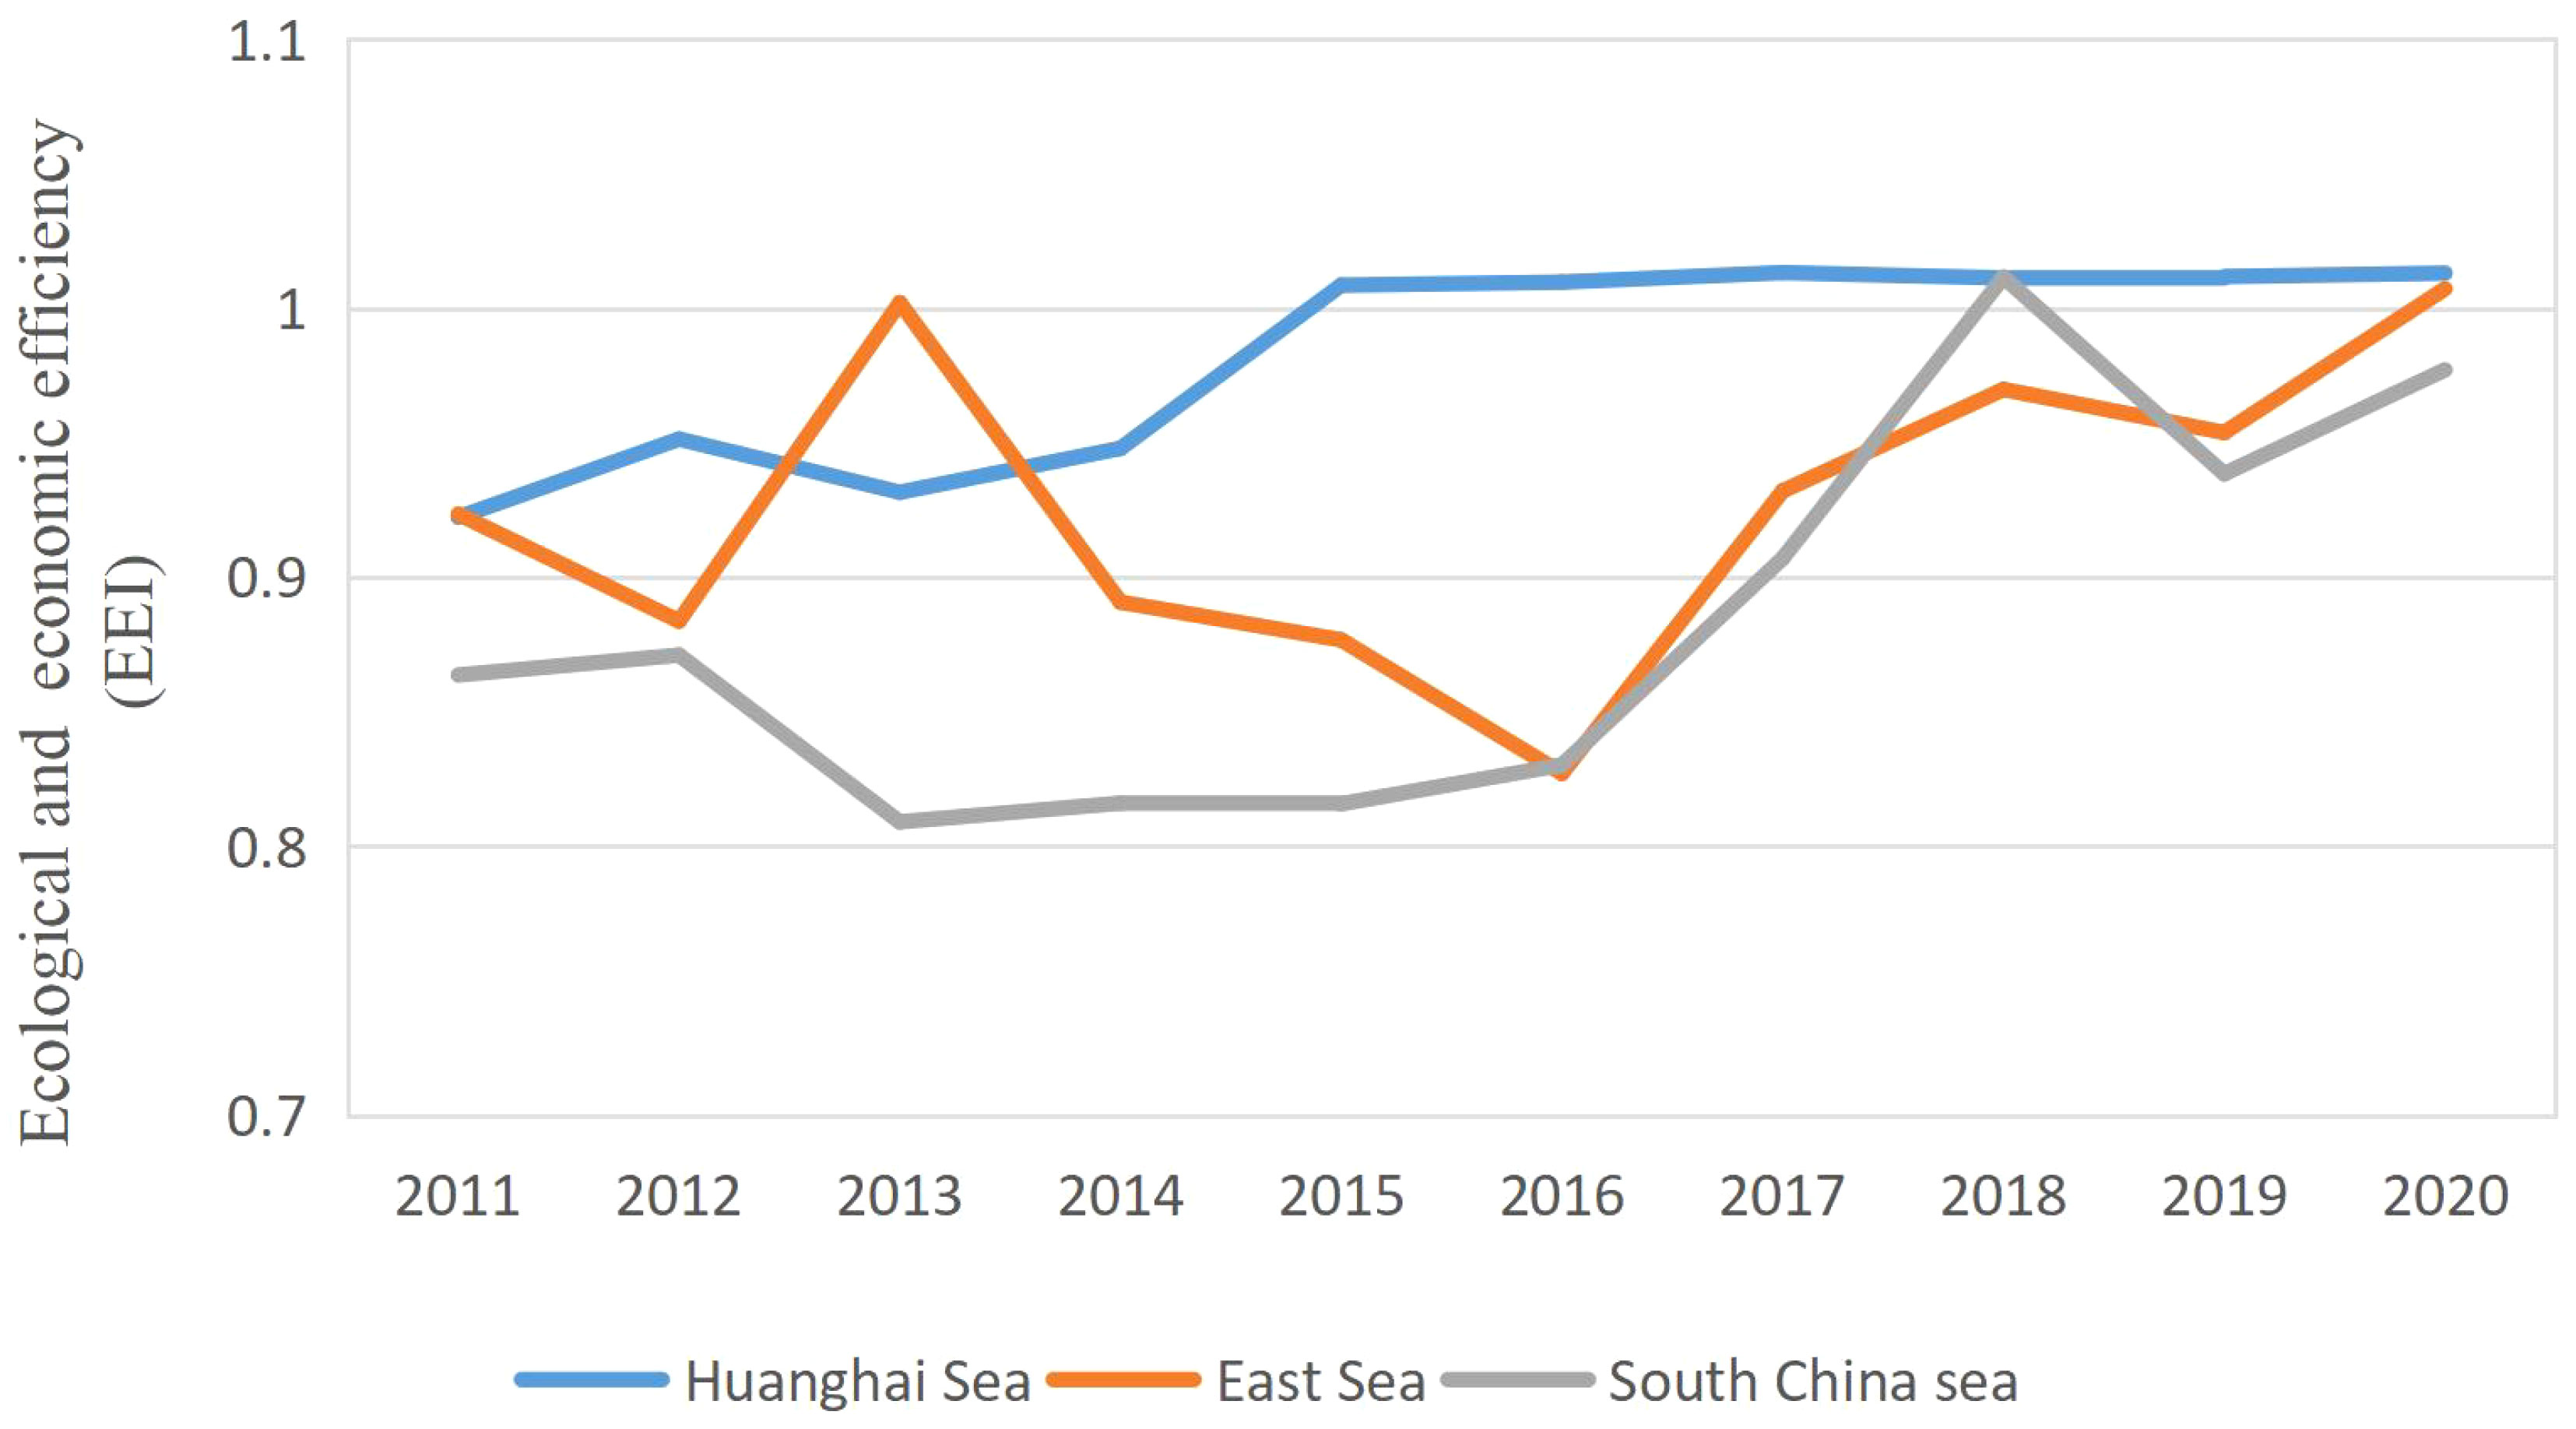
Figure 1 Temporal distribution of ecological and economic efficiency of mariculture in each sea area.
3.3 Eco-economic efficiency of mariculture Malmquist index analysis
The Malmquist model is used to analyze the dynamic changes of eco-economic efficiency of mariculture in China. China has insisted on the economic policies and management measures to actively develop the aquaculture of the 10 coastal provinces in the 21st century. The Malmquist eco-economic efficiency index is generally high in 2011–2012. Generally, most of the eco-economic efficiency indices of mariculture in different coastal provinces of China during 2011–2020 were greater than 1, indicating that the overall mariculture eco-economic efficiency change index of mariculture in China is in an increasing stage, as shown in Table 4.
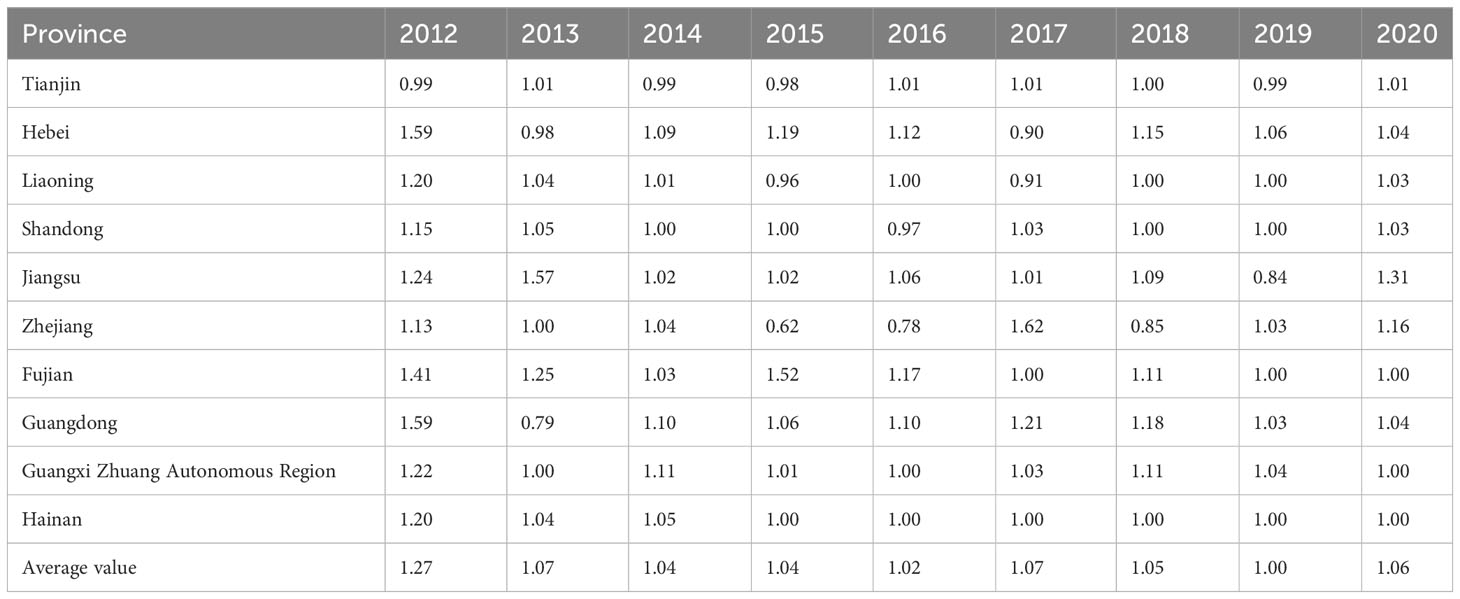
Table 4 Malmquist eco-economic efficiency index by province (2011–2020).
The Malmquist model is used to analyze the eco-economic efficiency index of mariculture in different coastal provinces of China (Figure 2). The technical progress change (TC) decreased after a sharp increase from 2011 to 2020, and tended to be stable at 1.0. The technical efficiency change (EC), also known as the “catch-up effect,” has been in a wave-like change, which is consistent with the MI index after 2015.
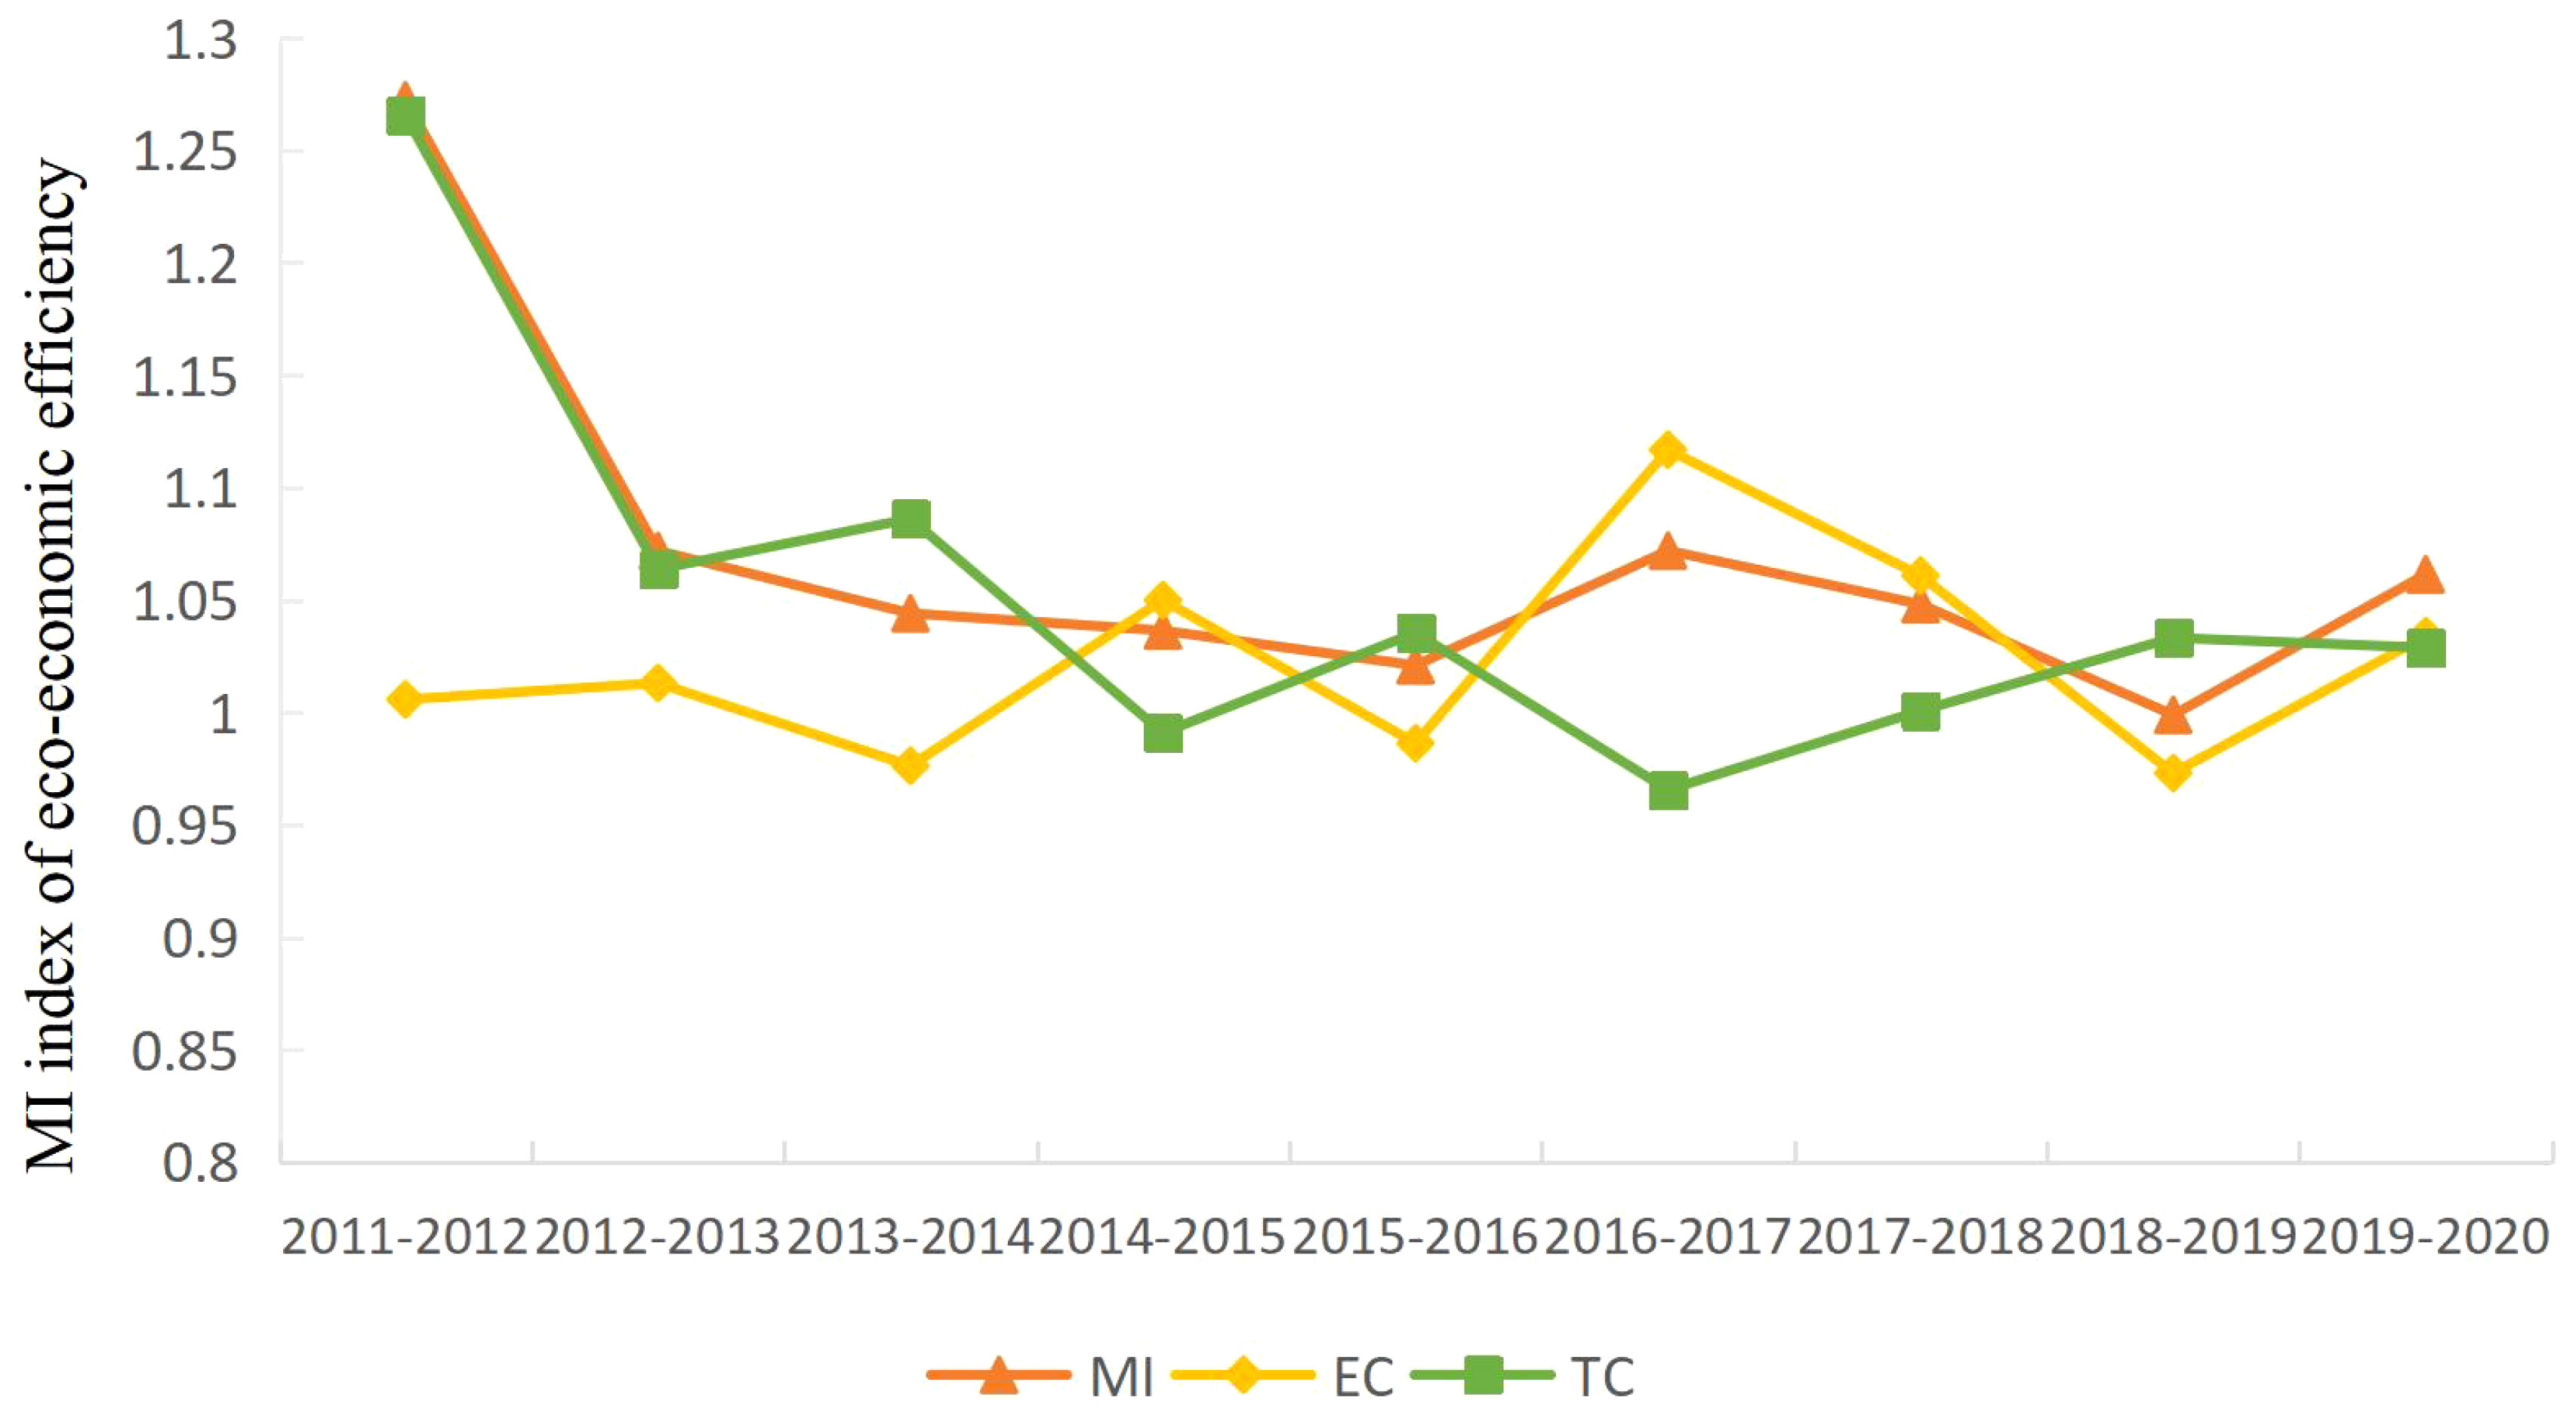
Figure 2 MI index of eco-economic efficiency and its decomposition in different coastal provinces of China (2011–2020).
Further analysis of the eco-economic efficiency index of each province through the efficiency decomposition model shows that (specific data omitted) the eco-economic efficiency index of mariculture fluctuates greatly in Jiangsu, Zhejiang, and Guangdong, as these provinces have strong economic development in the southeast coast. In 2011–2015, compared with other provinces, the average change of technical progress efficiency level of these provinces is high, but the technical efficiency value is low.
3.4 Convergence analysis of the eco-economic efficiency of mariculture
3.4.1 σ convergence analysis
From 2011 to 2016, the coefficient of variation and standard deviation of mariculture eco-economic efficiency in different coastal provinces of China showed a slight increase, indicating certain differences in mariculture eco-economic efficiency among different provinces. After 2016, the eco-economic efficiency of mariculture in various provinces of China showed a sharp downward trend. In 2019, it fluctuated slightly, but it still showed a downward trend (Figure 3). Generally, the difference of mariculture eco-economic efficiency in different coastal provinces of China initially increases and then decreases, and σ convergence exists. And the coefficient θ value of −0.017 has a p-value of 0.017, (** p< 0.05) within the national level (Equation 1).
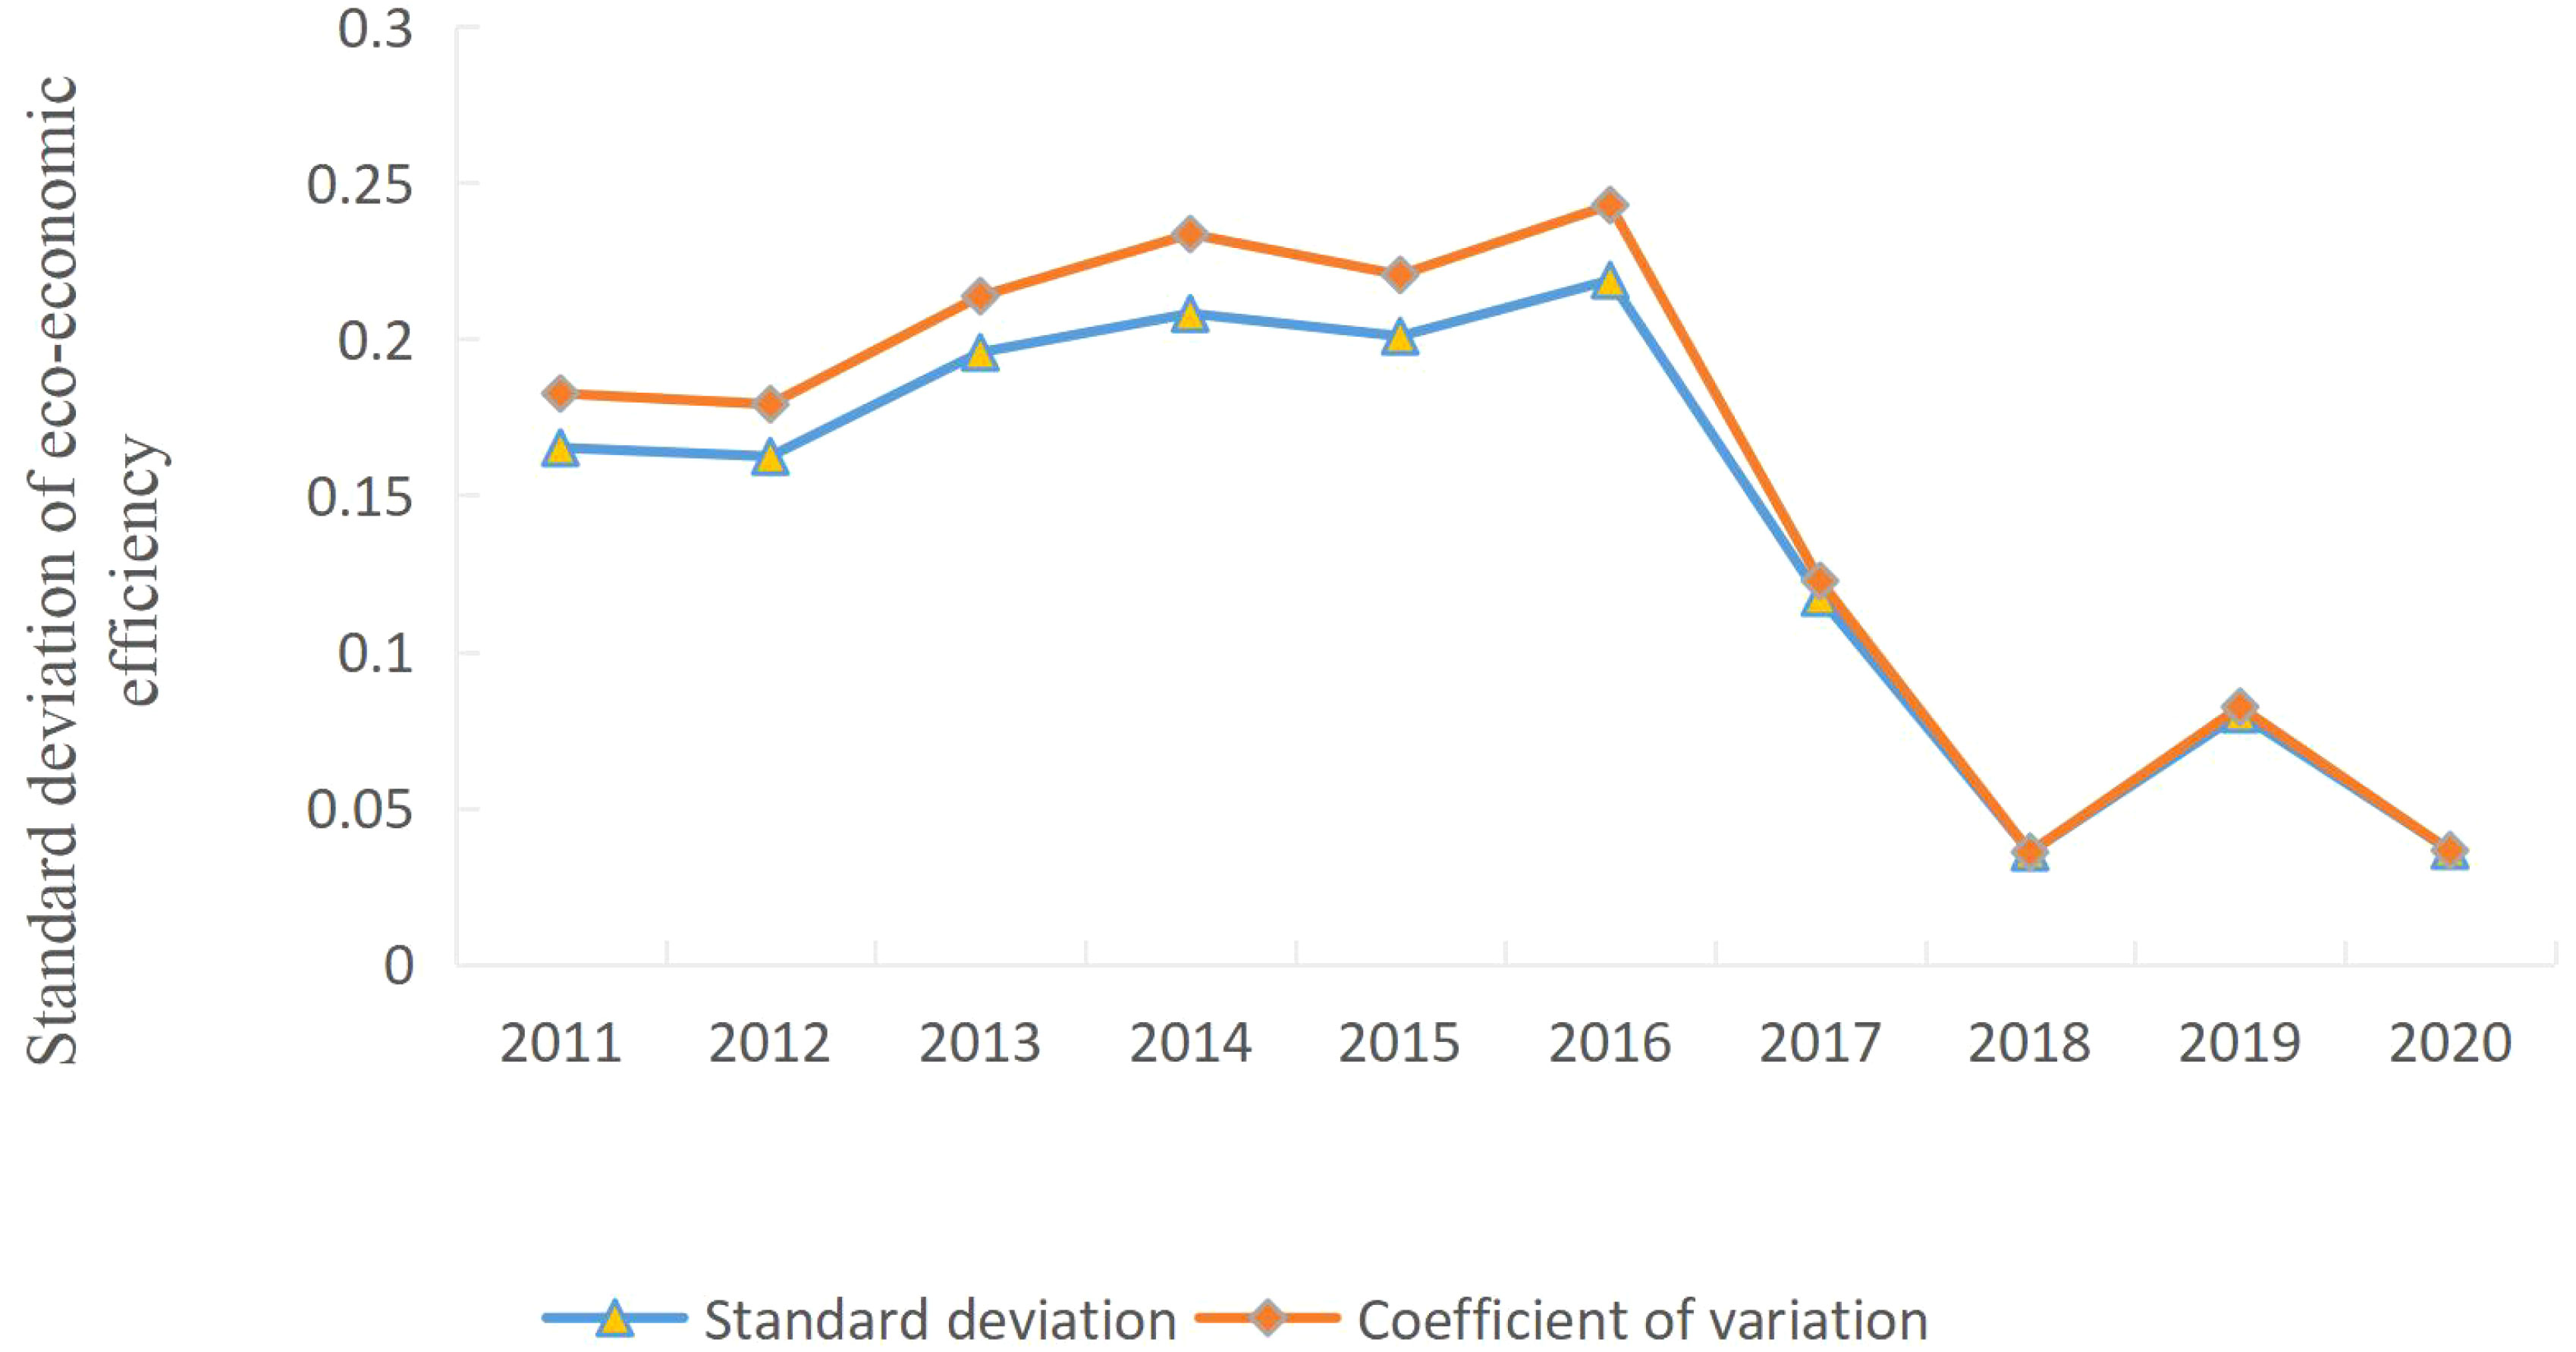
Figure 3 Standard deviation of eco-economic efficiency of mariculture in different coastal provinces of China.
3.4.2 β convergence analysis
Stata 15 is used to perform FE regression on the panel data of mariculture eco-economic efficiency in different provinces of China from 2011 to 2020. The β value is -0.418, where P = 0. After random-effects (RE) regression, the β value is -0.223, with P value of 0. The P value is 0.007, which is less than 0.05 in the Hausman test. Then, the FE model is selected as the regression result better than the RE model. Thus, the eco-economic efficiency of mariculture in different provinces of China shows an absolute β convergence.
To further test whether the eco-economic efficiency of mariculture in China shows conditional convergence, this paper introduces a control variable index3. In this index, the proportion of total marine economic output (GOP) to regional GDP (%) reflects the marine economic level of different provinces. The direct discharge of wastewater (DW) per ten-thousand-yuan GDP in coastal areas denotes the pollution control level of different coastal provinces. Population density (PER) is the level of local social development; and the proportion of marine researchers in the total population (SR) indicates the level of scientific and technological support. To eliminate the influence of heteroscedasticity, all data are logarithmically processed. The conditional convergence regression of the ecological and economic efficiency of mariculture in different provinces along the Chinese coast containing control variables is conducted using Equation (3), and the Hausman test is used to obtain a significance level of P< 0.05. The findings indicate that the conditional convergence FE is insignificant. Moreover, the FE regression correlation coefficient is β< 0, and the eco-economic efficiency of mariculture in different regions of China’s coastal areas show conditional convergence and is significant at 0.01%.
4 Discussion
In 1986, China’s first “Fishery Law” was promulgated, which clearly stated the principle of aquaculture-based fishery production. In the following 20 years, the production as the center has become the main goal of China’s mariculture policy. The long-term blind pursuit of the increase in quantity has gradually brought about various disadvantages, such as low profit level and environmental deterioration. The advent of the financial crisis in 2008 also had a huge impact on the originally unsustainable mariculture. After few years, the central government of China has increased its investment in fisheries, actively promoted the construction of modern fisheries, and improved the comprehensive production capacity of fisheries. The mariculture industry has also begun to shift from a single pursuit of production goals to focusing on environmental goals. From 2011 to 2015, under the downward trend of marine capture fisheries, China’s mariculture fisheries did not develop blindly and disorderly. On the contrary, with the active improvement and implementation of aquaculture environmental and economic policies, the goal of green and healthy development of mariculture in China has achieved good initial results.
The development of China’s mariculture industry also has the problem of local imbalance. The Yellow and Bohai Sea waters have been showing higher mariculture eco-economic efficiency relative to the East Sea waters and the South China Sea waters, whereas the mariculture eco-economic efficiency of the East Sea waters fluctuates significantly. The southeast coast (e.g., Jiangsu, Zhejiang, and Guangdong) has the strong economic development provinces and major traditional fishery producing areas in China, which indicates that the technical efficiency and technical progress efficiency have changed greatly through the ML index decomposition. Hence, the external demand and policy changes affect the ecological and economic efficiency of mariculture in these provinces, especially in Zhejiang Province. For example, the Malmquist index of eco-economic efficiency has been less than 1 for several years. The reason is the low technical efficiency due to insufficient production before 2016.
As a resource-dependent industry, mariculture is affected by differences in marine resources and environment, working population, regional economic development level, and other factors, as well as different possible marine fishery management measures and economic policies. The descriptive statistics of production input-output indicators of mariculture in 10 coastal provinces and cities during 2011-2020 varied widely, as well as the possible differences in marine fisheries management measures and economic policies, and the input-output indicators of different coastal provinces and cities and regions showed large differences. However, the long-term results do not change the trend that the ecological and economic efficiency of China’s mariculture fisheries has been improving.
5 Conclusion
Generally, the goal of green and healthy development of mariculture in China from 2011 to 2020 has achieved good results. The measurement of the eco-economic efficiency of mariculture in China indicates that the overall trend is upward. Except for a few provinces, the eco-economic efficiency of mariculture in most coastal provinces of China has reached an effective level. The difference in the eco-economic efficiency of mariculture in different coastal provinces of China is gradually decreasing. China’s coastal provinces are widely distributed, with different economic levels, population, and social development. In the mariculture field, the distribution of industrial structure also has its own characteristics. However, through the convergence of mariculture eco-economic efficiency in different provinces, the eco-economic efficiency of China’s mariculture industry is showing a decreasing trend in horizontal and vertical perspectives. With most of the eco-economic efficiency of mariculture in China being effective, the narrowing differences indicate that China’s policy goal of insisting on the green and healthy development of mariculture since 2010 is positive and effective. Especially after 2015, the difference in the eco-economic efficiency of mariculture in China has narrowed sharply. This phenomenon is also consistent with the development goal of ecological civilization that the Chinese government has always adhered to. Better coordination of the relationship between resources, environment, and economy, and stable and efficient promotion of the healthy development of China’s mariculture fishery have become the primary task facing the development of China’s mariculture industry.
Green and healthy aquaculture is the long-term goal for the future development of China’s mariculture industry. On the basis of the existing development, the Chinese government should continue to maintain the positive fiscal and economic policy; develop ecological and healthy aquaculture; reduce the pollution of mariculture; increase the treatment of mariculture tailwater; improve the level of mariculture technology, such as deep-sea aquaculture technology; and further improve the income level of coastal aquaculture people based on ensuring the quality and quantity of mariculture products. Under the goal of green and healthy development, the different coastal provinces of China should further implement the specific action goals of green and healthy seawater aquaculture according to the actual production of various regions, and develop a high level of modernized seawater aquaculture industry.
Data availability statement
The datasets presented in this study can be found in online repositories. The names of the repository/repositories and accession number(s) can be found in the article/supplementary material.
Author contributions
DJ: Investigation, Writing – original draft. SM: Funding acquisition, Supervision, Writing – review & editing. YX: Methodology, Software, Writing – review & editing.
Funding
This work was supported by the key project of the National Social Science Fund “Research on Fiscal and Taxation Policy System for Promoting Regional Ecological Innovation - Taking the Yangtze River Delta Region as an Example” (No.19AZD004). The funders had no role in study design, data collection and analysis, decision to publish, or preparation of the manuscript.
Conflict of interest
The authors declare that the research was conducted in the absence of any commercial or financial relationships that could be construed as a potential conflict of interest.
Publisher’s note
All claims expressed in this article are solely those of the authors and do not necessarily represent those of their affiliated organizations, or those of the publisher, the editors and the reviewers. Any product that may be evaluated in this article, or claim that may be made by its manufacturer, is not guaranteed or endorsed by the publisher.
Footnotes
- ^ On the basis of the various characteristics of sea areas in different coastal provinces of China and the differences in pond, factory, and cage culture methods, the nitrogen and phosphorus production of different mariculture varieties was calculated one by one. The total amount of nitrogen and phosphorus pollutants (L) was obtained as the undesirable output index of mariculture. The pollution of seedlings is neglected.
- ^ On the basis of the aquaculture production of fish, crustaceans, and shellfish, and a small number of other species in the “2011–2020 China Fisheries Statistical Yearbook.”
- ^ Data on the amount of direct discharge of sea wastewater are from the “China Marine Ecological Environment Bulletin,” and the other data are from the “China Marine Economic Statistical Yearbook 2011–2020.”
References
Bringezu S., Schutz H., Steger S., Baudisch J. (2004). International comparison of resource use and its relation to economic growth: The development of total material requirement, direct material inputs and hidden flows and the structure of TMR. Ecol. Economics 51 (1-2), 97–124. doi: 10.1016/j.ecolecon.2004.04.010
Bureau D. P., Hua K. (2010). Towards effective nutritional management of waste outputs in aquaculture, with particular reference to salmonid aquaculture operations. Aquaculture Res. 41 (5), 777–792. doi: 10.1111/j.1365-2109.2009.02431.x
Bustos-Gallardo B., Irarrázaval F. (2021). From crisis to stability and back again: the fragility of environmental governance in the Chilean salmon industry. Area Dev. Policy 7, 22–41. doi: 10.1080/23792949.2021.1910527
Cai Z. Z., Zeng J., Yang M. F., Lin Y. Q., Zheng H. D., Luo D. L., et al. (2023). Vertical distribution and pollution assessment of TN, TP, and TOC in the sediment cores of cage farming areas in Dongshan Bay of southeast China. Front. Environ. Sci. 11. doi: 10.3389/fenvs.2023.1216868
Cao F. L., Xia L. H., Guo Z. X., Feng H. Y. (2015). Advances in mariculture contamination. Guangdong Agric. Sci. 42 (22), 97–105. doi: 10.3969/j.issn.1004-874X.2015.22.018
Charnes A., Cooper W. W., Rhodes E. (1978). Measuring the efficiency of decision making units. Eur. J. Operational Res. 2 (6), 429–424. doi: 10.1016/0377-2217(78)90138-8
Chen D. M., Zhang R., Tan Z. X. (2012). Total factor energy efficiency and regional economic convergence in China: an empirical analysis based on dynamic panel data model. China Population Resour. Environ. 22 (1), 130–137. doi: CNKI:SUN:ZGRZ.0.2012-01-024
Chen S. (2010). An Analysis of the factories of input of flash water fisheries production in Hubei province. J. Huazhong Agric. Univ. (Social Sci. Edition) 2, 60–63. doi: 10.3969/j.issn.1008-3456.2010.02.011
Di Liberto A., Pigliaru F., Mura R. (2008). How to measure the unobservable: a panel technique for the analysis of TFP convergence. Oxford Economic Papers 60 (2), 343–368. doi: 10.1016/j.jsbmb.2005.07.001
Färe R., Grifell-Tatjé E., Grosskopf S., Knox Lovell C. A. (1997). Biased technical change and the Malmquist productivity index. Scandinavian J. Economics 99, 119–127. doi: 10.1111/1467-9442.00051
FAO (2023). Fishery and Aquaculture Statistics – Yearbook 2020. Rome: FAO Yearbook of Fishery and Aquaculture Statistics.
Ji J. Y., Xu Y., Li Y. M. (2021). Green technology efficiency measurement and its influencing factors in China’s aquaculture waters. Sci. Technol. Manage. Res. 41 (5), 205–212. doi: 10.3969/j.issn.1000-7695.2021.05.026
Ji J. Y., Zeng Q. (2016). A temporal and spatial analysis of mariculture green technical efficiency in China based on global DEA. Chin. J. Manage. Sci. 24 (S1), 774–778. doi: CNKI:SUN:ZGGK.0.2016-S1-110
Ji J. Y., Zeng Q. (2017). Study on the total factor productivity of China’s mariculture considered undesirable outputs based on Global Malmquist-Luenberger Index. J. Ocean Univ. China (Social Sci. Edition) 1, 43–48. doi: 10.16497/j.cnki.1672-335x.2017.01.007
Jiang Q. J., Liu C. X., Qiu K. C. (2021). Factor inputs, returns to scale and technical efficiency of Chinese fisheries. J. Fisheries Sci. 45 (5), 785–797. doi: 10.11964/jfc.20200712331
Li F. M., Lin X. G., Zhou J., Yuan S., Chen H. S. (2021). An assessment of pollutant discharge from mariculture of Guangdong Province. Chin. J. Oceanology Limnology 43 (4), 100–107. doi: 10.13984/j.cnki.cn37-1141.2021.04.014
Liu G. F., Xu P., Wu T., Xu Z. H., Xu G. C. (2018). Present condition of aquaculture nitrogen and environmental phosphorus pollution and future development strategy. Jiangsu J. Agric. Sci. 34 (1), 225–233. doi: 10.3969/j.issn.1000-4440.2018.01.033
Liu T. S., Yang B., He N., Kou J. F., Sun K. F. (2021). Assessment on the pollutants of mariculture wastewater in Maoming City. Ecol. Sci. 40 (4), 195–201. doi: 10.14108/j.cnki.1008-8873.2021.04.022
Lu Y. C., Fang S. M. (2017). Analysis of spatio-temporal evolution and influencing factors of eco-efficiency of urban construction land in WUHAN city circle based on SBM-DEA and Malmquist model. Resour. Environ. Yangtze Basin 26 (10), 1575–1586. doi: 10.11870/cjlyzyyhj201710010
Martinez-Cordrero F. J., Leung P. S. (2004). Sustainable aquaculture and producer performance: Measurement of environmentally adjusted productivity and efficiency of a sample of shrimp farms in Mexico. Aquaculture 241 (1-4), 249–268. doi: 10.1016/j.aquaculture.2004.07.028
Nielsen M., Ravensbeck L., Nielsen R. (2014). Green growth in fisheries. Mar. Policy 46, 43–52. doi: 10.1016/j.marpol.2014.01.003
Niklitschek E. J., Soto D., Lafon A., Molinet C., Toledo P. (2013). Southward expansion of the Chilean salmon industry in the Patagonian Fjords: main environmental challenges. Rev. Aquaculture 5, 172–195. doi: 10.1111/raq.12012
Peng D. Y., Zhang X., Liu S. (2020). Research on the evaluation of eco-Economic efficiency and the evolution of space and time in the Yangtze River economic belt. Ecol. Economy 36 (6), 44–50. doi: CNKI:SUN:STJJ.0.2020-06-010
Pérez L. M. (2021). Constructed wetlands for marine aquaculture wastewater treatment: A new challenge. Int. J. Oceanog. & Aquaculture 5 (1), 000202. doi: 10.23880/ijoac-16000202
Qian Z. M., Liu X. C. (2014). Study on regional differences and convergence of green economy efficiency in China. J. Xiamen Univ. (Arts Soc. Sciences) 1, 110–118. doi: CNKI:SUN:XMDS.0.2014-01-013
Qin H., Zhang Y., Lu Y. Y. (2018). Measurement and analysis of China’s mariculture eco-economic Efficiency: based on SBM model. J. Agrotechnical Economics 9, 67–79. doi: 10.13246/j.cnki.jae.2018.09.006
Soto D., León-Muñoz J., Dresdner J., Luengo C., Tapia Fabián J., Garreaud R. (2019). Salmon farming vulnerability to climate change in southern Chile: understanding the biophysical, socioeconomic and governance links. Rev. Aquaculture 11, 354–374. doi: 10.1111/raq.12336
Tang D., Huang S. W., Zheng Y. F. (2017). Regional difference of eco-economic efficiency in East China Coastal areas: an empirical analysis based on DEA-BCC and DEA-Malmquist two-step method. J. Shandong Technol. Business Univ. 31 (1), 28–33. doi: 10.3969/j.issn.1672-5956.2017.01.005
Tone K. (2001). A slack-based measure of efficiency in data envelopment analysis. Eur. J. Operational Res. 130 (3), 498–509. doi: 10.1016/S0377-2217(99)00407-5
Tone K. (2002). A slack-based measure of super-efficiency in data envelopment analysis. Eur. J. Operational Res. 143 (1), 32–41. doi: 10.1016/S0377-2217(01)00324-1
Wan G. Z., Yang W. (2017). Estimation and analysis of technical efficiency of aquaculture in China. China Fishery Economics 35 (4), 73–82. doi: CNKI:SUN:ZYJJ.0.2017-04-014
Wang Z. S., Li W. F., Liu Y. (2020). Technical and methodological system of “three lines and one single” ecological environment zoning management and control. Environ. Impact Assess. 42 (5), 5–10. doi: 10.14068/j.ceia.2020.05.002
Wang L. K., Shao X. H., Xu M., Chen S. (2019). Bioremediation of nitrogen- and phosphorus-polluted aquaculture sediment by utilizing combined immobilized effective microorganisms and sediment aeration technology. Int. J. Agric. Biol. Eng. 12 (6), 192–201. doi: 10.25165/j.ijabe.20191206.4904
Xing L. R., Xu X. (2016). Measurement and analysis of economic efficiency and environmental efficiency of aquaculture-taking freshwater fish pond culture under different models as an example. Agric. Technol. Economics 4, 105–113. doi: 10.13246/j.cnki.jae.2016.04.010
Xu G. Y. (2010). The convergence in carbon dioxide emissions: theoretical hypotheses and empirical research in China. J. Quantitative Tech. Economics 27 (9), 31–42. doi: 10.13653/j.cnki.jqte.2010.09.006
Xue X. Y., Ma J., Yang D. L. (2018). DEA-Malmquist model-based analysis of the efficiency of the subsidy policy for the increase of farmers’ income —— empirical evidence from panel data in Pudong New Area. Chin. J. Agric. Resour. Regional Plann. 39 (4), 152–161. doi: 10.7621/cjarrp.1005-9121.20180421
Yang Z. Y. (2004). On the non-point source of endogenous pollution in fishery and environmental economic policies for its treatment. Productivity Res. 9, 28–30. doi: CNKI:SUN:SCLY.0.2004-09-010
Yang Z. Y., Liu D., Peng L. W. (2021). Green development of mariculture in China: estimation, regional comparison and research on development strategy. Ecol. Economy 37 (11), 128–135.
Yang C., Wang M. L. (2019). Research on beef cattle total factor productivity growth and convergence in the context of grassland ecological protection subsidy policy. J. Agrotechnical Economics 3, 96–105. doi: CNKI:SUN:NYJS.0.2019-03-009
Yu L. C., Zhang W. G., Bi Q. (2020). Can the no-go zone policy achieve a win-win situation of environmental protection and economic development? Rural Economy 6, 91–98.
Yuan X. T., Zhang S. L., Liu S. X., Liang B., Liang Y. B., Zhang G. F. (2011). Self-pollution in Ruditapes philippinarum bottom-cultured area of Zhuanghe coast. Appl. Ecol. 22 (3), 785–792. doi: CNKI:SUN:YYSB.0.2011-03-033
Zhang X. X., Zheng S., Yu L. H. (2020). Green efficiency measurement and spatial spillover effect of China’s marine carbon sequestration fishery. China Rural Economy 10, 91–110.
Zhao L., Zhang Y. S., Wu D., Wang Y. M., Wu D. T. (2016). Marine economic efficiency and spatio-temporal characteristics of inter-province based on undesirable outputs in China. Scientia Geographica Sin. 36 (5), 671–680. doi: 10.13249/j.cnki.sgs.2016.05.004
Keywords: mariculture, eco-economic efficiency, Malmquist index, convergence, undesirable output
Citation: Jinli D, Manhong S and Xuan Y (2023) Study on the eco-economic efficiency of China’s mariculture based on undesirable output. Front. Mar. Sci. 10:1254537. doi: 10.3389/fmars.2023.1254537
Received: 07 July 2023; Accepted: 08 November 2023;
Published: 05 December 2023.
Edited by:
Yngvar Olsen, Norwegian University of Science and Technology, NorwayReviewed by:
Yang Gao, Zhejiang Ocean University, ChinaFranklin Isaac Ormaza-González, ESPOL Polytechnic University, Ecuador
Copyright © 2023 Jinli, Manhong and Xuan. This is an open-access article distributed under the terms of the Creative Commons Attribution License (CC BY). The use, distribution or reproduction in other forums is permitted, provided the original author(s) and the copyright owner(s) are credited and that the original publication in this journal is cited, in accordance with accepted academic practice. No use, distribution or reproduction is permitted which does not comply with these terms.
*Correspondence: Dong Jinli, MjAwMTAxMDAwNUBuYnUuZWR1LmNu