 Erin E. Black
 Christopher K. Algar
 Maria Armstrong2
- 1Department of Earth and Environmental Sciences, University of Rochester, Rochester, NY, United States
- 2Department of Oceanography, Dalhousie University, Halifax, NS, Canada
Coastal shelves are important regions for carbon transformation and storage, however, constraining coastal carbon budgets and their uncertainties remains a challenge. Repeated sampling of a semi-restricted coastal basin in Nova Scotia, Canada was performed in 2019 utilizing the 238U-234Th isotope system to estimate carbon flux in both the water column and surface sediments. 234Th fluxes in the Bedford Basin water column appeared to be in relative balance with those arriving at the seafloor averaged over spring and summer. The resulting carbon export estimates averaged ~70 mmol C m-2 d-1 for April through August of 2019 and 234Th-derived annual export estimates (19 mol C m-2 yr-1) were within a factor of three of the model-based estimates for the basin. Incorporating the results from prior research, this study constrains the major carbon sources and sinks in Bedford Basin. While the 238U-234Th method is well-established in the open ocean, its use in coastal shelf regions is still evolving. Pronounced 234Th deficits are unique to coastal zones and continue to raise important questions about the physical and biogeochemical factors that influence tracer distributions and the carbon estimates that are derived from them. Future paths and method refinements for utilizing the 238U-234Th system in coastal regions are put forth here, including the use of size-fractionated sampling, the need for boreal winter estimates, the quantification of horizontal mixing contributions, an analysis of the role of small particles in coastal carbon budgets, and the study of sediment resuspension’s impact on tracer distributions.
1 Introduction
Collectively, continental shelves constitute less than 10% of the global ocean area, while boasting ~20% of the ocean’s primary productivity (Jahnke, 2010). For North America, shelves are estimated to be the storage site for a fifth of the carbon entering coastal waters (Najjar et al., 2018). In addition, these regions also provide innumerable ecosystem services, such as food production and coastal protection (Costanza et al., 2014). Human actions, such as the addition of excess nitrogen and phosphorus in the form of fertilizer runoff (Galloway et al., 2004) and the release of chemical pollutants (e.g. fire retardants and mercury), are influencing coastal ecosystems at an alarming rate. Increased coastal hypoxia (Diaz and Rosenberg, 2008), ocean acidification, and harmful algal blooms (Paerl and Scott, 2010) are just a few of the problems threatening the ecological stability and economic profitability of coastal regions. To better address these anthropogenic influences, a deeper knowledge of how chemical constituents are altered, stored, and transported through coastal regions is needed. Furthermore, without repeated efforts we cannot assess trends in coastal chemical budgets as human impacts worsen or improve with remediation efforts.
Despite the relative ease of access to coastal waters, constraining carbon and nutrient cycling in these regions is often complicated. One-dimensional or 1-D models (e.g. Savoye et al., 2006) used in open ocean settings can be too simplistic for coastal systems with the effects of rapid currents, human influences, an abundance of natural sources and sinks (i.e., rivers, aerosols, and sediments), and the confluence of freshwater and marine systems. This complexity has led to high uncertainties for carbon burial in coastal regions (e.g. almost 50%, Najjar et al., 2018) and daily carbon fluxes have been shown to vary by up to two orders of magnitude in highly active shelf-slope regions (e.g. Biscaye and Anderson, 1994). There is an immediate need for improved constraint on each of the parameters that go towards these budgets, such as particulate carbon export, as changes in marine carbon cycling due to global climate change have already been observed in the North Atlantic (Osman et al., 2019).
To explore avenues for improving coastal carbon budgets, we study the semi-enclosed Bedford Basin in Nova Scotia, Canada (referred to also as ‘the basin’, Figure 1). The circulation patterns and structure of the 17 km2 basin result in relatively uniform salinity and density profiles below the mixed layer for most of the year (Figure 2) and the general application of 1-D assumptions in models (e.g. Burt et al., 2013). Most of the freshwater to the basin is supplied by a single source, the Sackville River, at the basin’s north end (5 m3 s-1 average annual inflow, Kepkay et al., 1997). The basin connects to the Atlantic Ocean via the 20 m-deep narrows of the Halifax Harbor at its southern end, which shelters the basin and creates two-layer, estuarine circulation (Figure 1). In the surface, the mean outflow of the basin is only 0.2 cm s-1 and there is limited exchange between the surface waters and those below the 20 m sill depth (Shan et al., 2011; Burt et al., 2013). Weekly hydrographic monitoring at the Compass Station (Figure 1) in Bedford Basin has been conducted since 1992 by the Fisheries and Oceans Canada (DFO) Bedford Basin Monitoring Program (Li and Dickie, 2001), providing a wealth of auxiliary data.
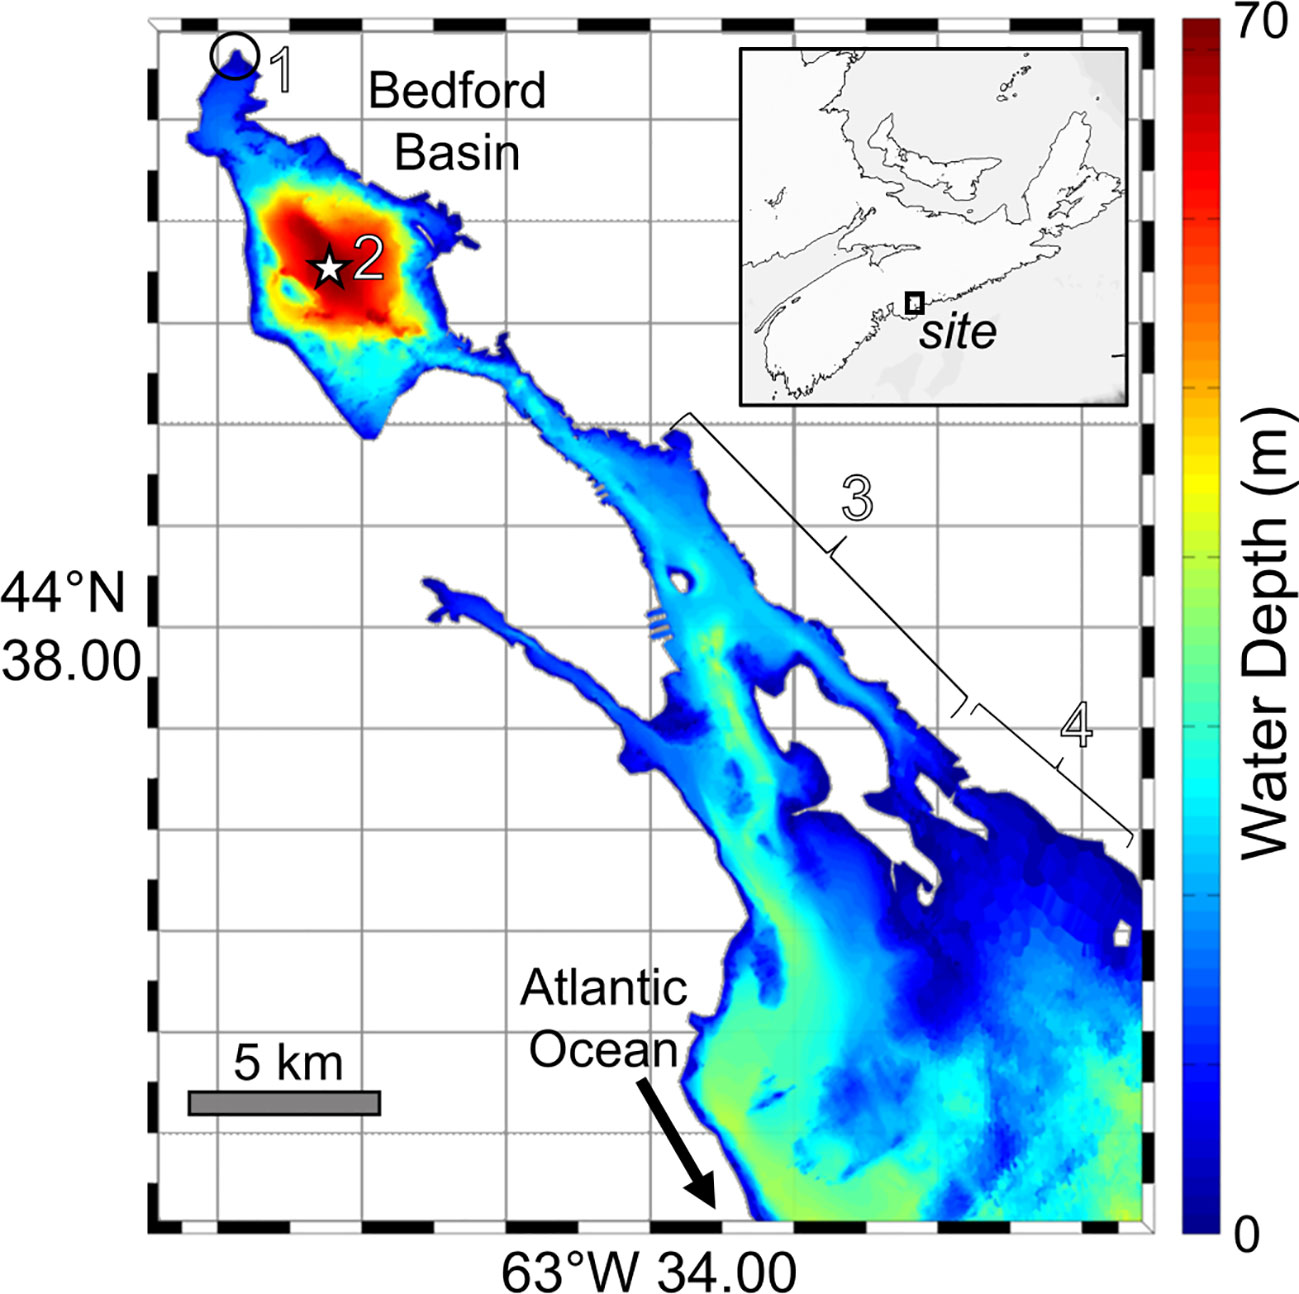
Figure 1 Bathymetry of Halifax Harbor. The Compass Station (location 2, 44° 41’ 30” N, 63° 38’ 30” W) is located at the deepest part of Bedford Basin, Nova Scotia, Canada (see inset). Location 1 is the mouth of the Sackville River. The approximate boundaries of the inner (3) and outer (4) regions of Halifax Harbor are indicated. Map bars (white-black) are equal to 1 minute.
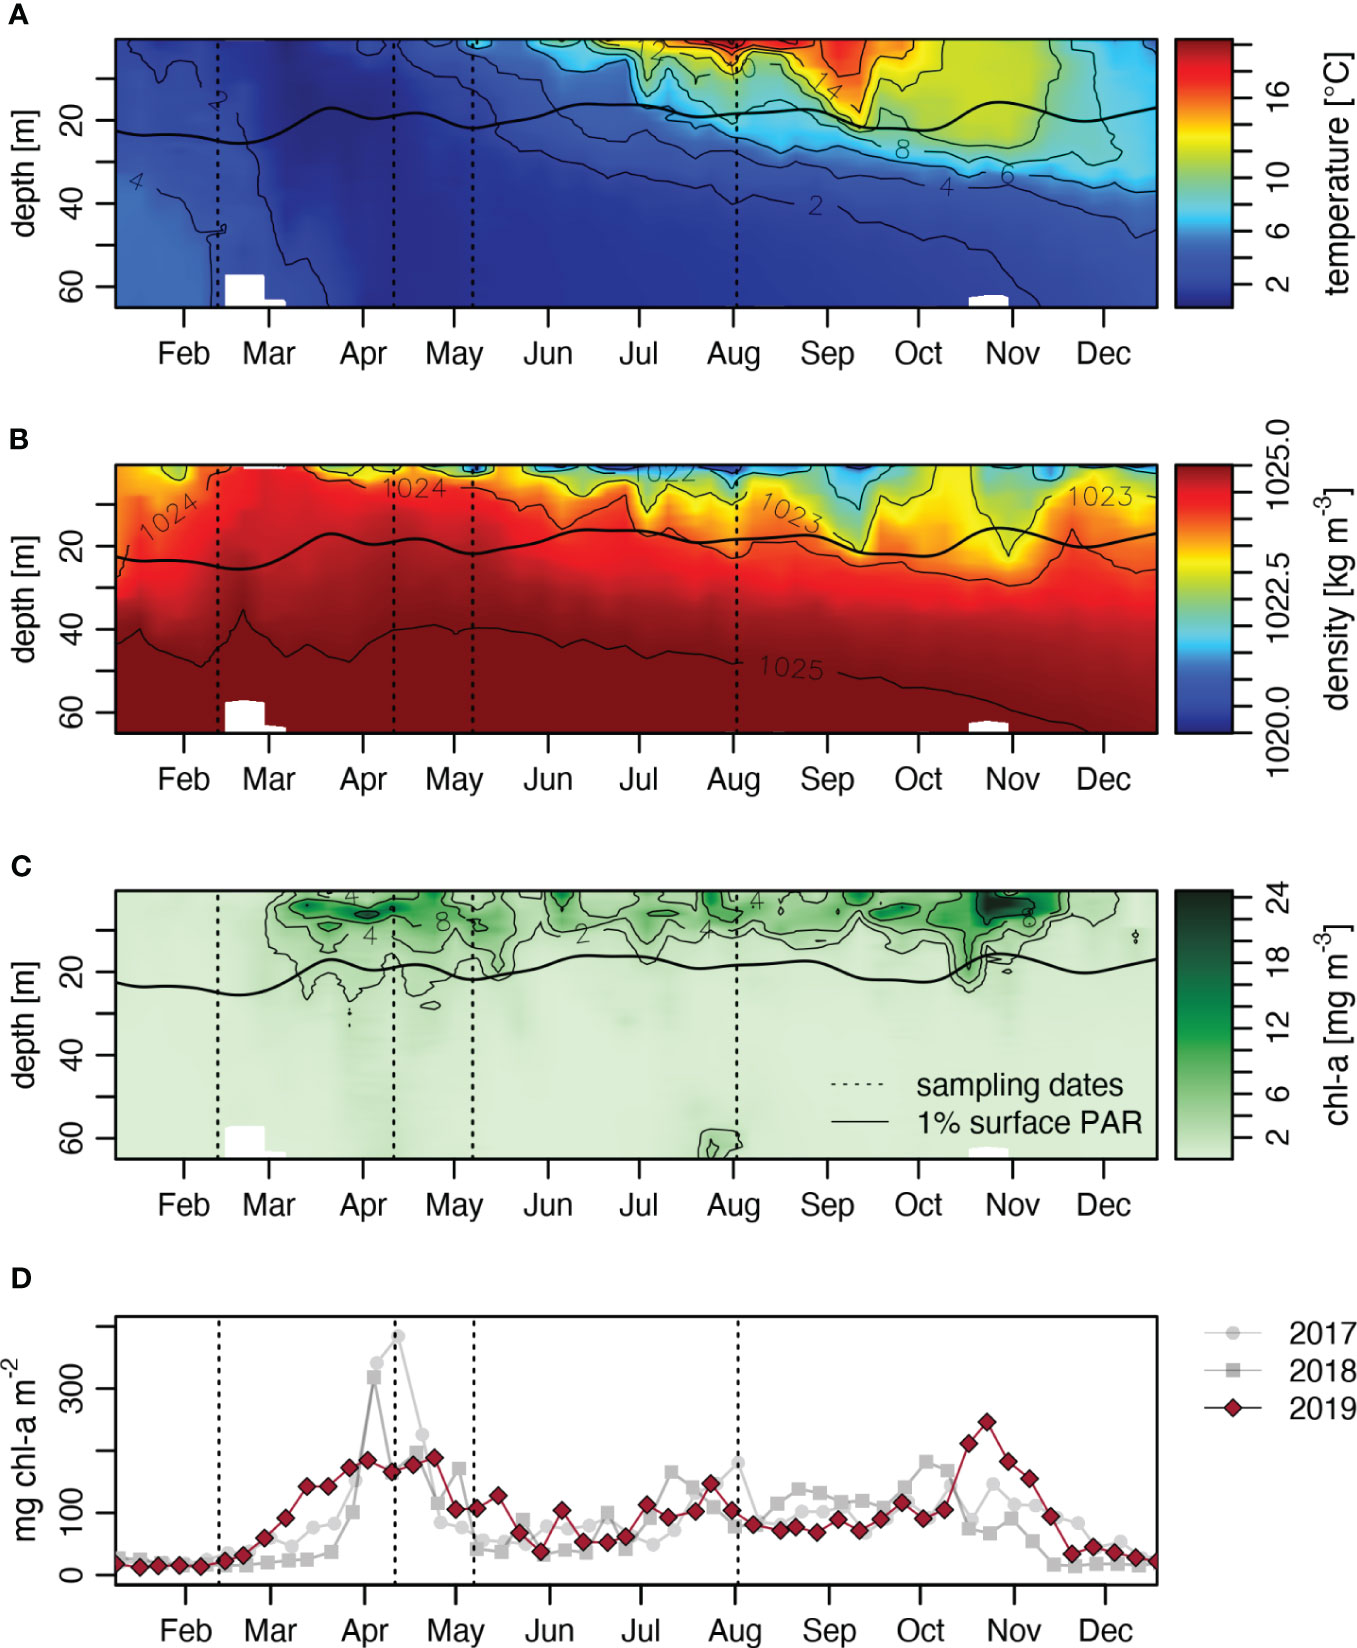
Figure 2 Hydrographic and biogeochemical conditions of Bedford Basin in 2019. From top to bottom are (A) temperature, (B) density, (C) Chlorophyll-a, and (D) integrated Chl-a inventory for entire water column. The horizontal, bolded black line in (A) to (C) indicates the euphotic zone as calculated from the depth of 1% surface PAR (photosynthetically available radiation). All measurements were taken at the Compass Station and data are publicly available at: www.bio-iob.gc.ca/science/monitoring-monitorage/bbmp-pobb/measurements-mesures-en.php (last access: 5 July 2022).
Methods for estimating particulate carbon flux in coastal zones are limited and sediment traps (e.g. Wei and Murray, 1992) often suffer from conveyance issues or hydrodynamic biases. In this study, we employ the 238U-234Th disequilibrium method to investigate the relationship between particulate water column and sediment column fluxes (Charette et al., 2001; Waples and Klump, 2013). The shallow water column and the semi-restricted circulation in the basin, confirmed by observations and modeling efforts (e.g. Shan and Sheng, 2012), suggest that the loss of particulates to transport out of the basin should be minimal. Here we test whether the signal of export captured by the short-lived isotope 234Th (half-life ~ 24 days) is mirrored in the 234Th inventories observed in the seafloor sediments by taking paired water column and sediment measurements. Furthermore, we quantify and compare both water column and sediment-based estimates of carbon flux utilizing this 238U-234Th method and make suggestions for future work in the Bedford Basin and beyond.
2 Materials and methods
Field and analytical methods are summarized here. Step-by-step methods, full metadata, and additional relevant literature references can be found at the locations in the Data Availability Statement. When appropriate, standard deviations are reported below as (± s.d.).
2.1 Sample collection and analyses
Sediment cores ranging from 20 to 32 cm in length were taken at the Compass Station (44° 41’ 30” N, 63° 38’ 30” W, Figure 1) on February 12th, April 12th, May 7th, and August 2nd of 2019 using a DC Denmark four-core multicorer. The cores were extruded and sectioned in 1-4 cm intervals, with greater resolution in the upper 5 cm. In August, two sets of paired cores (four cores total) were homogenized in 1 cm increments to provide more mass for analysis in the upper 5 cm and to test for spatial heterogeneity. Methods follow the general processing and counting procedures in Black and Buesseler (2014). Cores were analyzed for 234Th (63.3 keV) and ancillary isotopes at the Radionuclide Facility at Dartmouth College using Canberra Intrinsic High Purity Germanium Detectors. A visual inspection indicated that the sediments were fine-grained, organic-rich, and relatively homogenous. Porosity (i.e. water content) was determined for the upper 5 cm using the mass difference between wet and dry sediment subsamples, correcting for salt content, and assuming a sediment density of 2.65 g cm-3 (Burdige, 2006). Sediment uncertainties for 234Th activities are the propagation of gamma counting errors and an assessment of potential variability in porosity and density estimates. Carbon content of sediments was analyzed in the CERC.OCEAN facility at Dalhousie University using a Costech Instruments Elemental Combustion System 4010. The average carbon content (± s.d.) did not differ between acid-fumigated samples (n = 29, 5.5% ± 0.5%) and non-fumigated samples (n = 39, 5.7% ± 0.8%), suggesting that most of the total carbon is organic in nature. Therefore, it is assumed that the reported ‘total’ carbon content here can be used interchangeably with ‘organic’ carbon content.
Niskin bottles (2L to 10L) were used to collect seawater samples on April 11th, May 9th, and August 2nd and temperature, salinity, fluorescence, and oxygen profile data were collected with a Seabird SBE 19plus CTD. For size-fractionated particulate 234Th measurements (>51 µm and 1-51 µm), the ~42 liters were collected at three water depths. The ~42 liters collected at each depth were temporarily stored in cleaned plastic barrels prior to filtration on ship using a custom-built, 142 mm vertical filter apparatus. Elevated barrel water was vacuum pumped through a 51 µm pore size nitex filter and a pre-combusted 1 µm pore size quartz microfiber filter (QMA) in sequence. Filters were visually examined for swimmers and a 400 µm pre-filter test found none (August sampling). Particulate material from the nitex screens was rinsed onto pre-combusted 25 mm QMA using filtered seawater (<1 µm) and dried overnight. The 142 mm QMA were dried similarly and then a 25 mm punch was collected for successive 234Th and carbon measurements. The particulate samples were counted within 6 to 12 days of filtration using low-level beta GM multicounters at Woods Hole Oceanographic Institution (WHOI) and then again at least 5 months after filtration. Final counting was used to determine the residual particulate β activity derived from beta counting after all unsupported 234Th has decayed away (RAP234). RAP234 was first described in Lin et al. (2016) as a resuspension proxy. After beta counting, particle filters were analyzed for total carbon content at the CERC.OCEAN facility.
For total 234Th analyses, 4L seawater samples were collected with Niskins and prepared for counting with the precipitation method detailed in Pike et al. (2005) and amended in Black et al. (2018). In summary, the bottles were acidified the day of sampling with nitric acid and then spiked with 1 mL of 2.8 dpm g-1 230Th yield monitor. After ~8 hours of equilibration, solutions of KMn04 and MnCl2 were added to the 4L bottles. The pH was raised above 8 to allow for precipitation. After ~8 hours custom filterheads were added to the bottles and the total 234Th was collected (as a precipitate) on 25 mm QMAs. The initial counting of particulate and total 234Th samples was performed using low-level beta GM multicounters at WHOI within 4 to 12 days of filtration. After all beta counting was complete, a 229Th recovery yield monitor of 7.7 × 10³ dpm g-1 was added for the filter digestion and ICP-MS analysis. The average recovery was 83% with a s.d. of 13.5% and median of 85%. The uncertainties on total 234Th are derived from counting statistics and the extrapolation of errors associated with sample processing (i.e., mass and volume measurements, ICPMS recovery analysis).
2.2 Water column 234Th fluxes
The 238U-234Th method is an established technique for quantifying the particulate flux of chemical constituents in the open ocean on time scales from weeks to months (e.g. Buesseler et al., 1992; Benitez-Nelson et al., 2001; Benitez-Nelson et al., 2007). 234Th is particle reactive and originates from the decay of 238U, which is conservative with respect to salinity in typical open ocean environments (e.g. Owens et al., 2011; Not et al., 2012). A deficit of 234Th with respect to 238U is created when 234Th is transported out of surface waters via sinking particles more rapidly than the rate at which 234Th and 238U come into secular equilibrium with one another (i.e., when the 234Th present is supported by 238U). The particulate flux of 234Th in dpm m-2 d-1 (PTh) can be determined using the activity balance:
where Th is the total thorium-234 activity (dpm L-1), U is the total uranium-238 activity (dpm L-1), λTh is the decay constant of 234Th (0.0288 day-1), and V represents the sum of the advective and mixing-diffusive terms. In steady state conditions, when it can be determined or reasonably assumed that no significant change in thorium activities occurred over the time period of interest, the calculation for PTh at any depth z becomes:
The physical processes potentially impacting a local 234Th water column budget can be further described by:
where u is the zonal velocity, v is the meridional velocity, w is the upwelling-downwelling velocity, K are dispersion coefficients, and the gradients (∂ terms) are W-E, S-N, and vertical, respectively. The signs of the physical factor terms could change in time or space. The physical processes are accounted for with Equations (2) and (3) or, if 1-D steady state assumptions are valid for the region and time period, Equation (2) can be simplified to:
These determinations and assumptions are examined further in the Discussion.
2.3 Sediment accumulation flux of 234Th
The deficit of 234Th in the water column with respect to parent 238U reflects the removal of 234Th via particle settling. Therefore, in a 1-D system (i.e. no lateral losses and no significant temporal changes in 234Th activities), and assuming large particle settling rates of 10–150 m d-1 (McDonnell and Buesseler, 2010), we anticipate that the excess of 234Th in surface sediments is roughly equal to the deficit of 234Th in water column in the shallow Bedford Basin (~70 m water depth). Similar to Equation (4), the sediment accumulation flux of 234Th (Pseds) can be expressed as the integrated difference in sediment inventories of the parent 238U and the daughter 234Th multiplied by the decay constant for 234Th:
Here Th and U activities are in units of dpm m-3 and found by gamma counting dry sediments (dpm kg-1) and multiplying by the dry bulk density. Dry bulk density is assumed to be 0.080 g cm-3 (97% porosity, sediment grain density = 2.65 g cm-3). Excess 234Th (Thexcess) is the amount that is not in secular equilibrium with the 238U present in the sediments, presumably because it arrived via the supply of settling particles. Excess 234Th is typically observed in the top 3-5 cm, where recent sedimentation and bioturbation has occurred. The depth of equilibrium or integration (EQ) is where Thexcess is no longer measurable.
2.4 Residence times for 234Th
The residence time (τ) of a chemical constituent can be calculated by dividing the integrated inventory by a source or removal flux. Residence times provide insight into how the particle dynamics of a region impact the rate at which 234Th is scavenged from the dissolved pool and how quickly 234Th on smaller particles is incorporated into larger, sinking particle phases.
The residence time of scavenging or the transfer of dissolved 234Th (Thdiss) into the particulate phase can be calculated with:
where τscav is expressed in days, Thdiss is the dissolved activity, and U represents the total 238U activity (Baskaran et al., 1996). Likewise, the residence time of particulate 234Th (Thpart) with respect to removal via sinking particles can be determined as:
where the denominator corresponds to the flux as noted in Equation (4).
2.5 Determination of particulate carbon fluxes
While the 234Th method for the determination of particulate carbon fluxes has been less frequently applied in coastal regions (Charette et al., 2001; Waples et al., 2006; Le Moigne et al., 2013; Waples and Klump, 2013), the same principles used in the open ocean apply here as well. The flux of 234Th at a given depth z in the water column is combined with measurements of the POC:234Th ratio on sinking particles at that depth to determine POC flux:
Particles collected on 51 µm filters (‘large particles’) are often considered to be sinking and those from 1 to 51 µm (‘small particles’) to be suspended (Bishop et al., 1977). However, slowly settling, small particles have been shown to contribute to carbon fluxes (e.g. Durkin et al., 2015; Puigcorbé et al., 2015) and therefore the POC:234Th ratios were assessed for both size fractions in this study.
Here the sediment accumulation fluxes of 234Th with small and large particle POC:234Th ratios are also used to assess sedimentary carbon accumulation fluxes. POC:234Th ratios were measured at ~60-65m, which represent particles that are about to be deposited on the seafloor. These ratios were combined with the sediment accumulation fluxes of 234Th in Equation (8) to calculate the accumulation flux of POC in the surface sediments. For comparison, POC:234Th ratios in the uppermost surface sediments were also measured, which represent deposited material that has likely experienced some degree of diagenetic processing.
A range in daily net primary production (NPP) for the Bedford Basin was also found using available in-situ measurements and global database products (Supplementary Text 1.1). Benthic carbon fluxes (i.e., flux from the water column to the sediments) were then determined using the modeled NPP results. The model-based estimates are used here for broad comparison with the measurement-based, sediment trap and 234Th-derived carbon fluxes.
3 Results
3.1 General characteristics at the compass station
The base of the euphotic zone in Bedford Basin typically ranges from 15 to 25 m (Figure 2C). March 2019 marked the onset of increased Chlorophyll-a (Chl-a) concentrations in the euphotic zone (Figure 2C). Beginning in April-May, the water column slowly stratified and around July a persistent and significant temperature and density difference was observed between the upper ~20 m and the deeper water column. Due to persistent overcast skies in early 2019, the spring ‘bloom’ in the basin did not reach the peak levels of the two previous years (Figure 2D). Nevertheless, integrated Chl-a concentrations in the euphotic zone were noticeably higher in April compared to those observed in the months before or after April (e.g., February and June, Figure 2D).
3.2 Water column salinity, thorium activities, and carbon concentrations
Salinities (S) ranged from 29.7 to 31.3 and thus, salinity-derived 238U activities ranged from 2.02 dpm L-1 to 2.14 dpm L-1 (Figure 3A). 238U activities were derived using the Owens et al. (2011) relationship of 238U = 0.0786 × S – 0.315 and its associated uncertainties. At all sampling dates, total 234Th activities are lower than 238U activities at all depths, revealing a Th deficit in the entire water column. The lowest 234Th activities, however, were observed in the upper 5 to 10 meters in all months and especially in August. Total 234Th activities for all dates averaged (± s.d.) 0.9 ± 0.2 dpm L-1 and ratios of 234Th:238U ranged from 0.18 to 0.61 (Figure 3A).
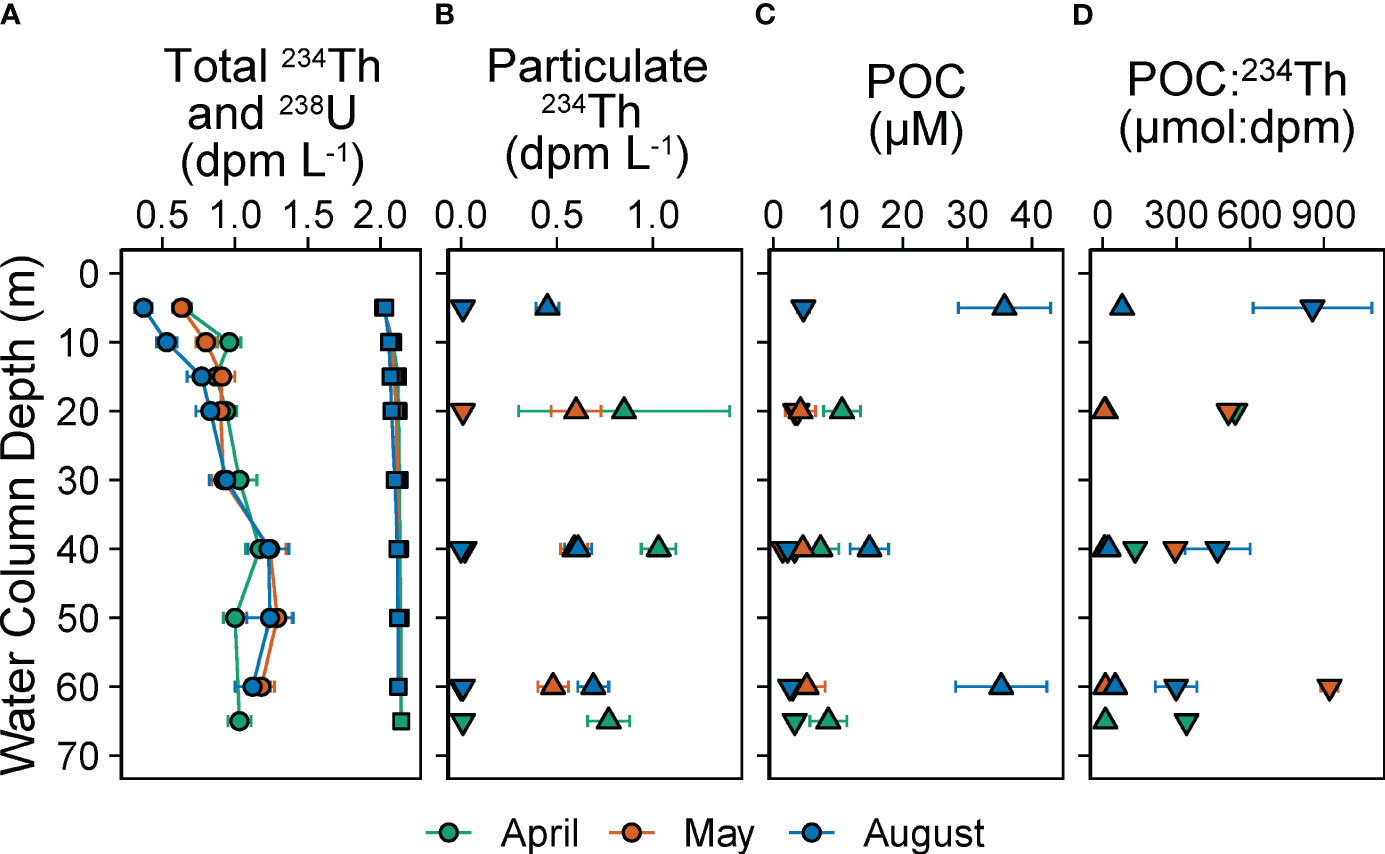
Figure 3 Seawater radioisotope activities and carbon concentrations at Compass Station. Panels show (A) total 234Th (•) and 238U (▪) activities, (B) size-fractionated 234Th activities, (C) size-fractionated POC concentrations, and (D) the particulate ratio of POC: 234Th for 2019. 238U activities were estimated using the Owens et al. (2011) U-salinity relationship and uncertainties are ~3%. Large particle (▾) and small particle (▴) data are the >51 µm and 1-51 µm fractions, respectively.
The particulate 234Th results were also relatively consistent between depths and sampling dates (Figure 3B). Large particle 234Th activities averaged 0.008 ± 0.006 dpm L-1 with a range of 0.003 to 0.02 dpm L-1. The small particle 234Th average was significantly higher and averaged 0.6 ± 0.2 dpm L-1 with a range of 0.29 to 1.0 dpm L-1. The large particle fraction was only 0.9% ± 0.6% of the total 234Th present and the small particle fraction was 63% ± 22% of the total. Total particulate RAP234 activities, the sum of the small and large particle RAP234, were generally below the method detection limit (~92 dpm m-3, Figure 4, left top). The detection limit for Bedford Basin is equivalent to two times the s.d. of the dipped blank mean. The highest RAP234 activity by far was measured at 40 m in August (170 dpm m-3) and all other RAP234 activities were below 120 dpm m-3. The small particle data dominated the RAP234 signal and the graph for small particle RAP234 is visually indistinguishable from the total particulate graph in Figure 4 (left top).
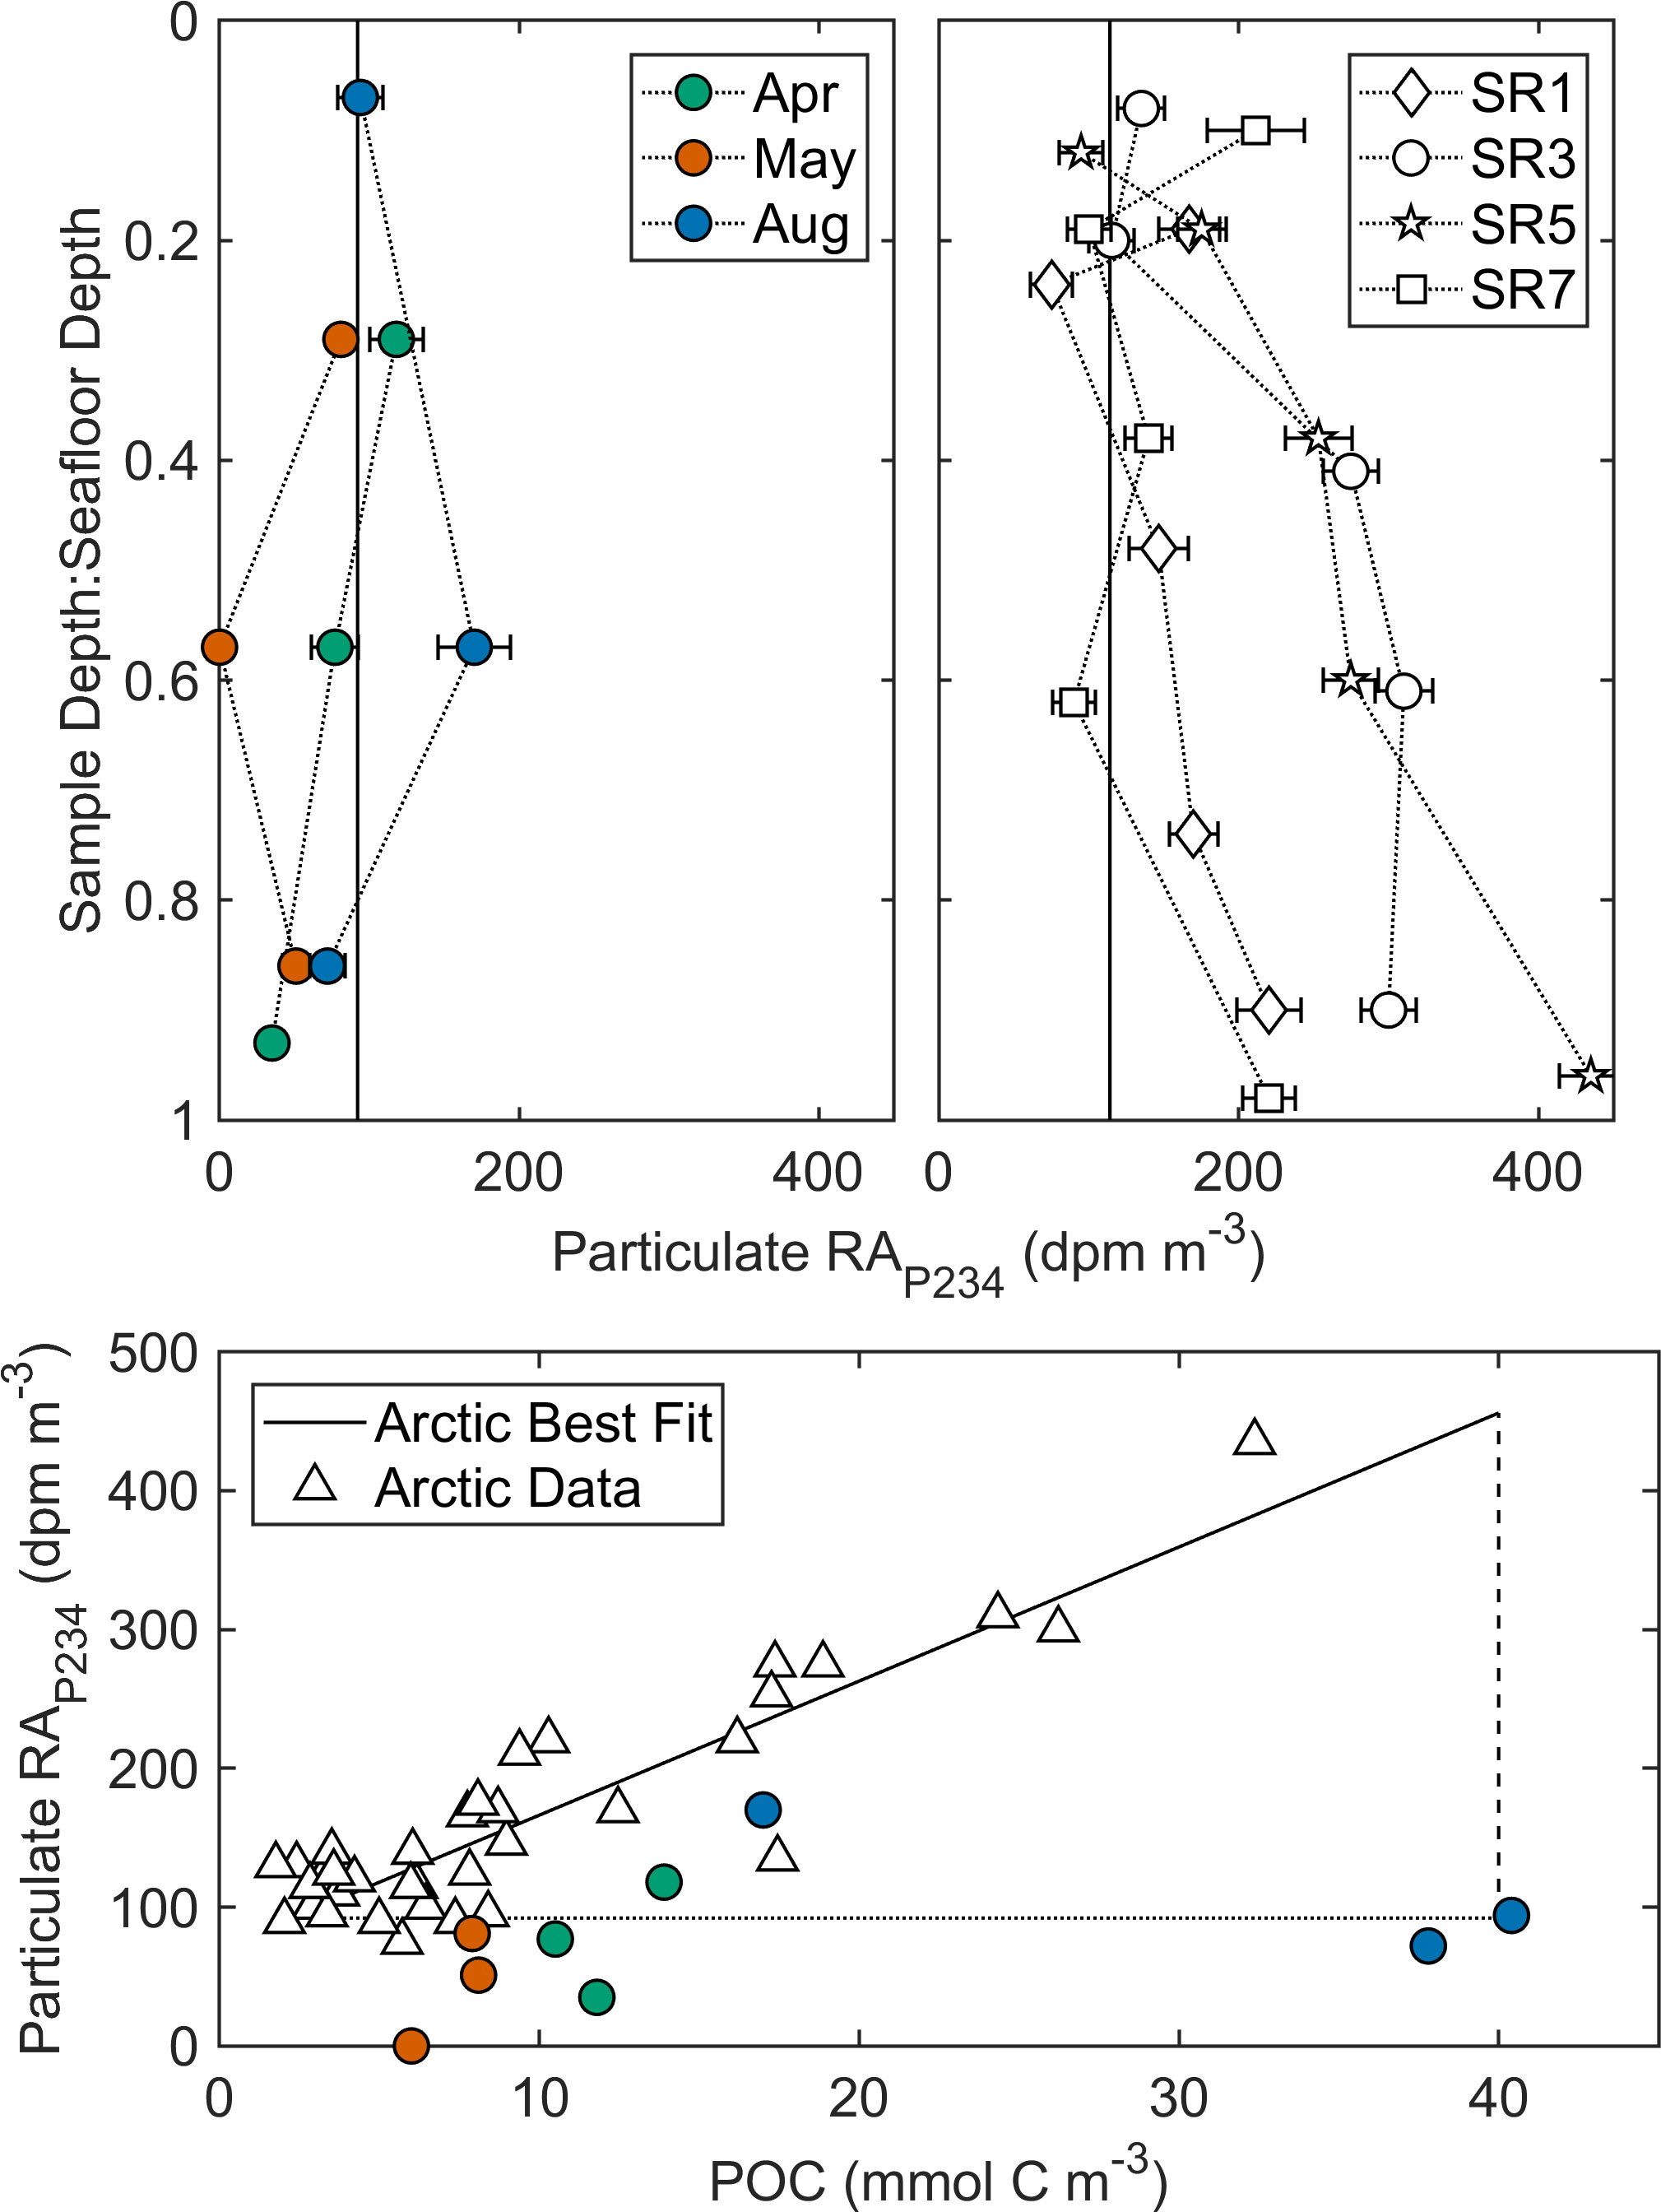
Figure 4 Particulate RAP234 at the Compass Station with coastal Arctic comparisons. The residual β activity of particulate 234Th (RAP234) is a novel proxy for resuspension that behaves in a similar manner to lithophile elements (Lin et al., 2016). Total RAP234 for the Bedford Basin (left top panel) are shown with select shallow Arctic Ocean results from Lin et al. (right top panel). Detection limits (vertical solid lines, top panels) are derived from filter blank analyses. The conceptual model proposed by Lin et al. (bottom panel) suggests that biological particle production (horizontal dotted line) increases POC without significantly increasing activities of parent isotopes found in sediments (i.e., 238U and 232Th). Conversely, resuspension processes (vertical dashed line) will increase parent isotope activities in water column particulates while bringing the POC typical of local sediments. As noted in Lin et al. (2016) the slope of the best fit (solid line) to the Arctic shelf data (triangles) falls well within the range of sedimentary ratios of parent isotopes to POC in the region.
The large and small particle POC concentrations averaged 3.0 ± 0.9 µM and 14 ± 13 µM, respectively (Figure 3C). The relative standard deviation for the large particle 234Th activities (78%) was much greater than that of the corresponding POC concentrations (30%). The reverse was true for the small particles, with the 234Th activity relative standard deviation at 39% and the POC concentration relative standard deviation at 90%. The large particle POC:234Th ratios averaged 485 ± 262 µmol:dpm and ranged from 132 to 923 µmol:dpm (Figure 3D). The small particle POC:234Th ratios were significantly lower, averaging 32 ± 39 µmol:dpm and ranging from 7 to 122 µmol:dpm. Like the 234Th partitioning, most of the total particulate carbon, averaging 17 µM, was in the small particle fraction (~75% on average).
3.3 Sedimentary carbon content and excess 234Th activities
Excess 234Th was concentrated in the upper 2 cm of the cores (Figure 5A). The 0-2 cm layer had a much higher 234Th activity in April (~30 dpm g-1) compared to the other dates (9 to 18 dpm g-1). The equilibrium depth was consistent and a lack of excess 234Th was always observed by ~5 cm core depth, with supported 234Th activities between 5 cm and 7 cm averaging 2.6 ± 0.2 dpm g-1 (s.d.). Sedimentary POC concentrations, averaging 4.8 ± 0.7 mmol C g-1 (Figure 5B), and %POC, averaging 5.8% ± 0.9%, were remarkably consistent with core depth between 0-5 cm. Including all the sampled sediment layers (0-32 cm), the average %POC was statistically the same at 5.6% ± 0.7% for all dates. The %POC found in this study matched well with historical coring efforts in the basin that found 4.6% at the Compass Station and between 4.3% and 5.8% nearby (Buckley et al., 1995). The POC:234Th ratios (Figure 5C) of interest are those in the 0-2 cm layers, because these layers are the most recently deposited. The POC:234Th in these layers averaged 355 ± 187 µmol dpm-1 and increased below 2 cm due to the drop in excess 234Th activities.
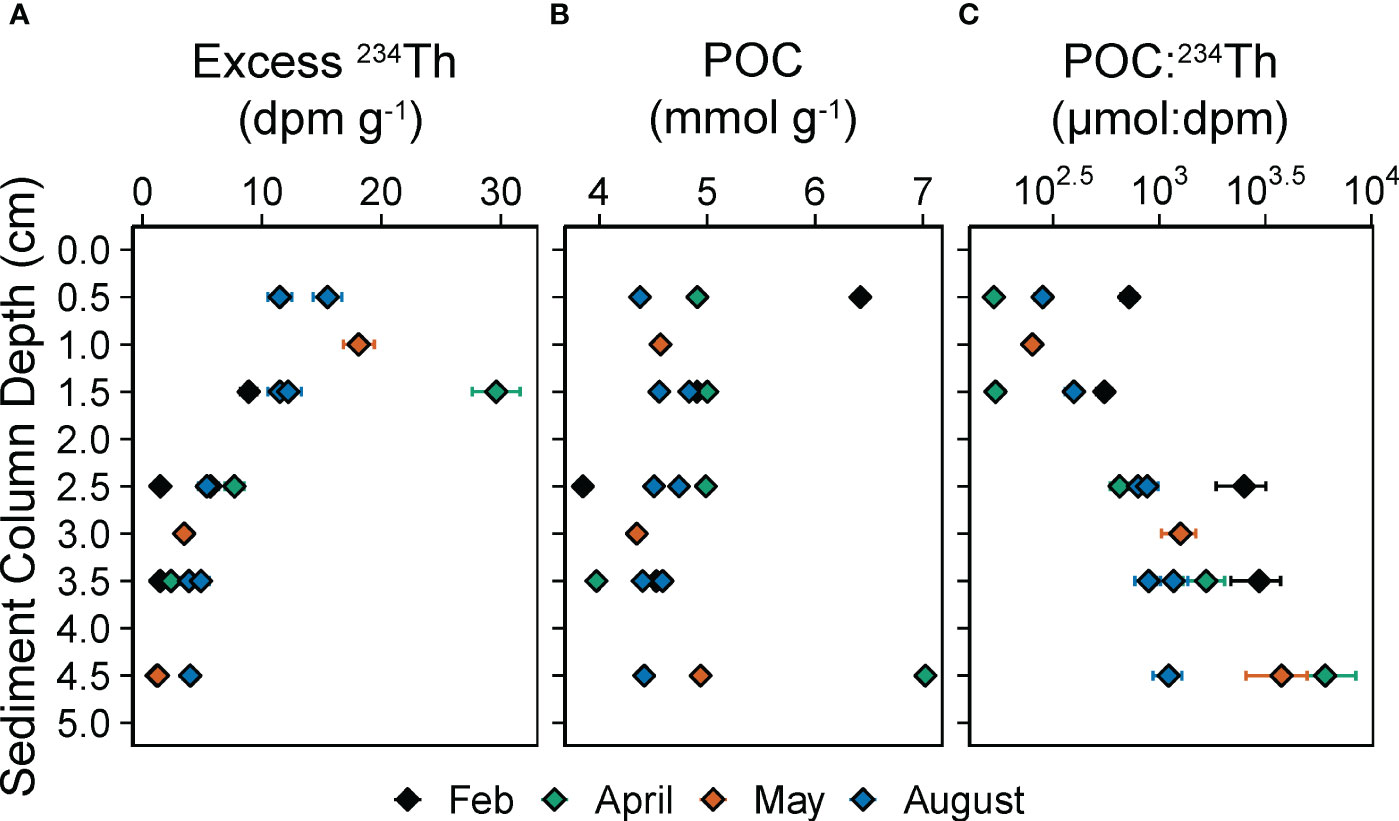
Figure 5 234Th activities and carbon concentrations in sediments at Compass Station. Panels show (A) excess 234Th or 234Th activities not supported by decay from parent 238U, (B) POC concentrations, and (C) the ratio of POC:excess 234Th for 2019. Two sets of sediment core data for August reflect the observed similarity within a given multi-corer deployment. Ratio uncertainties increase with depth within the sediment core because little excess 234Th is present below 2 cm.
3.4 234Th fluxes in the water column and to the sediments
The cumulative flux of 234Th in the water column linearly increased with water depth on all sampling dates (Figure 6) and always with a coefficient of determination (R2) > 0.99. If the data from all dates are combined, the resulting linear regression produces a rate of 31 dpm m-2 d-1 per meter (y-intercept = 135) or 34 dpm m-2 d-1 per meter assuming no 234Th flux at the sea surface. The 234Th fluxes at the deepest sampling depths for each date (60-65 m) are reported in Table 1 with linearly extrapolated values for the predicted flux at the sediment-water interface of ~70 m. The water column export of 234Th averaged 2000 dpm m-2 d-1 at 60 m to 65 m while the extrapolated flux of 234Th at 70 m is predicted to be 2300 dpm m-2 d-1 averaging all sampling dates. More variability was observed with the sediment accumulation fluxes of 234Th (Figure 6, Table 1), which averaged 2000 dpm m-2 d-1 but ranged from ~1100 dpm m-2 d-1 (February) to 3600 dpm m-2 d-1 (April). The 234Th fluxes from the August replicate cores were similar within the calculated uncertainties (Table 1).
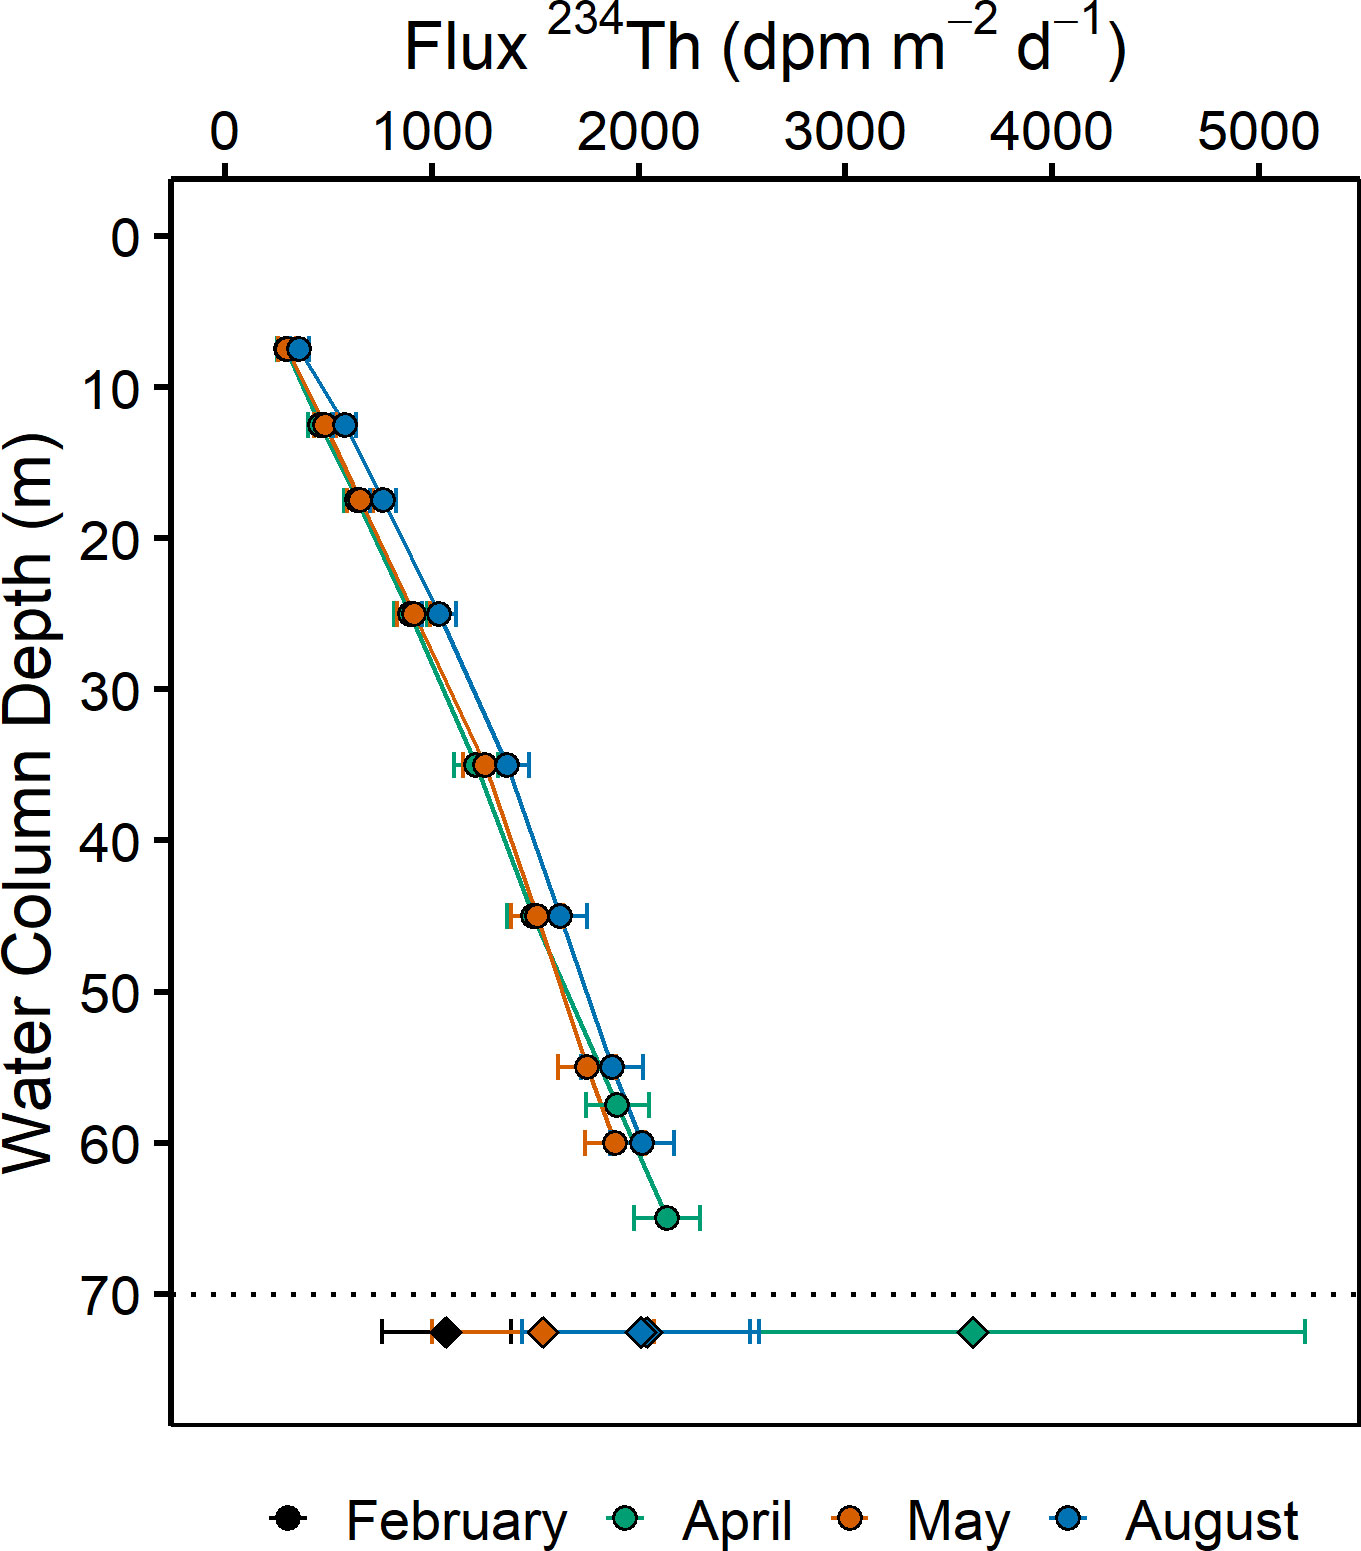
Figure 6 234Th flux with water depth. Seawater 234Th activities were used to derive water column 234Th fluxes (•). The water column 234Th flux uncertainties represent the propagated 234Th measurement uncertainty and a conservative 10% uncertainty on the 238U estimates (Section 4.1.3). Sediment inventories of excess 234Th were integrated from 0 to ~4 cm for a total 234Th flux to the sediments (♦). Sediment fluxes are shown as a single value below the dashed line approximating the sediment-water interface.

Table 1 234Th and carbon fluxes.
3.5 234Th residence times in Bedford Basin
The residence time of dissolved 234Th (τscav) at the Compass Station was 9 ± 8 days, while the residence time of particulate 234Th (τpart) was 21 ± 9 days. With most of the total 234Th present in the small particle (63%) and large particle (0.9%) phases, it is unsurprising that τscav<τpart was always observed. The mid-water column had the longest observed τscav in August (τscav = 25 days). The surface layers in April and August had the shortest (τscav = 1 to 2 days). This August surface layer also had the lowest total 234Th observed (Figure 3A).
3.6 234Th-derived particulate carbon export
The POC flux at 70 m, determined using a large particle ratio for Equation (4), reached a minimum in August (710 mmol C m-2 d-1) and a maximum in May (2070 mmol C m-2 d-1, Table 1). The average large particle POC flux was 1200 mmol C m-2 d-1. The POC fluxes calculated using the small particle POC:234Th ratios were much lower, averaging 70 mmol C m-2 d-1. In contrast to the large particle-based fluxes, the small particle-based carbon export shifted from 20-25 mmol C m-2 d-1 in April and May to a high of 150 mmol C m-2 d-1 in August. To determine the flux of POC to the sediments (i.e., the sediment accumulation flux of carbon), the large and small POC:234Th ratios from the 60-65 m water column samples were multiplied by the sediment accumulation flux of 234Th determined from the sediment cores. The average POC sediment accumulation fluxes (Table 1) were 1100 mmol C m-2 d-1 (large particle ratio) and 60 mmol C m-2 d-1 (small particle ratio). The average POC flux estimates determined from the water column and sediment measurements were therefore comparable for the respective POC:234Th ratios used, which is related to the similarity in observed 234Th fluxes (Table 1).
4 Discussion
4.1 238U-234Th system assumptions
To determine a 234Th budget for the water column at the Compass Station using Equation (4), to compare water column fluxes of 234Th to the sediment accumulation fluxes found using Equation (5), and to be able to evaluate the factors influencing the 234Th budget in Bedford Basin relative to those influencing other types of marine regimes, there are five main assumptions and sources of uncertainty to assess: steady state, 234Th measurements, 238U estimates, the significance of physical factors (i.e. advection), and the potential impact of sediment resuspension. A summary table of these assumptions and uncertainties is included Supplementary Table 1. Each element is explored in this section with respect to its potential influence on export calculations, except for 234Th measurements. In this study, 234Th measurement accuracy and precision were carefully evaluated by using process blanks, yield monitors, replicates, and beta counting standards.
4.1.1 Steady state assumption
During 2019, weekly Chl-a data at the Compass Station were assessed, and a concerted effort was made to conduct sampling events during periods of relative stability to minimize non-steady state effects (NSS, i.e., impacts of rapid temporal changes in Th activities over weeks to days). For example, the April 2019 event was conducted during the spring bloom plateau (Figure 2D). For the April to May sampling event transition, the NSS contribution to thorium export was estimated to be +70 dpm m-2 d-1 with a propagated uncertainty of ±140 dpm m-2 d-1. A comparable or lesser NSS component can be assumed for the August event, which had a much smaller pre-sampling decline in Chl-a than was seen in April-May (Figure 2D). Therefore, the maximum NSS contribution (+70 dpm m-2 d-1) and its uncertainty ( ± 140 dpm m-2 d-1) make up less than 7% of the average water column export of 234Th (~2300 dpm m-2 d-1) for these months using Equation (4). The uncertainty of ±140 dpm m-2 d-1 has been propagated through to the 234Th export fluxes reported in Table 1. Given the relatively small importance of the NSS factor during the 2019 sampling in this study, steady state conditions are confidently assumed for all three sampling periods. Nevertheless, steady state assumptions may not always hold in the basin and other coastal regions. When feasible, repeat sampling (every 1-4 weeks) is recommended, so that potential NSS conditions can be evaluated quantitatively (Savoye et al., 2006).
4.1.2 Use of a global 238U-salinity relationship
In open ocean 234Th studies, 238U is most often estimated by using salinity measurements and a global 238U-salinity relationship (e.g. Chen et al., 1986; Pates and Muir, 2007; Owens et al., 2011; Not et al., 2012), not by direct measurement. Areas receiving significant freshwater inputs, and thus those with low salinities (e.g. salinities<15, Andersson et al., 1995), could be depleted in 238U. If salinity were used to determine 238U activities in these locations, the 234Th export flux would be underestimated. Conversely, while these cases are rare, coastal regions with unique U-rich phosphate sediments (Swarzenski and Baskaran, 2007) and proximity to phosphate-fertilizer plants (Pates and Muir, 2007) can show local enrichments of 238U. The salinities recorded during the Bedford Basin 2019 sampling periods (29.7 to 31.3) reflect a much smaller range compared to what is often observed in the open ocean and along river-estuarine gradients (e.g. Swarzenski and Baskaran, 2007). The Bedford Basin salinity-derived 238U activities found using the Owens et al. (2011) relationship and the Not et al. (2012) relationship (salinity range = 0.1 to 135) were indistinguishable within the propagated uncertainties (maximum activity difference = 0.01 dpm L-1). Furthermore, a study of oxygen isotope endmembers in the basin indicates that freshwater contributes less than 20% to surface waters (5 m) and is negligible in the deeper waters of Bedford Basin (Kerrigan et al., 2017). Because marine waters are the major source to the basin throughout the year, it is unlikely that freshwater entering via the Sackville River plays a significant role in the 238U balance here. Finally, Gustafsson et al. (1998) sampled the semi-enclosed Casco Bay (~43.7°N, 70°W, an inlet of the Gulf of Maine) and found no 238U-salinity deviations for waters with salinities from 28.7 to 32.9.
Significant authigenic precipitation of 238U in the water column and/or in sediments (with anoxia) could lower the water column 238U relative to standard 238U-salinity relationships, such as Owens et al. (2011). Saanich Inlet is a fjord with similar structural characteristics to Bedford Basin (230 m water depth, salinity = 27 to 31), although it often has anoxic waters below its 80 m restrictive sill and measurable hydrogen sulfide (~30 m of bottom water, Todd et al., 1988). Despite the more extreme conditions in this fjord, Saanich Inlet surface waters (10 m) have measured 238U within 1% of the activities predicted by the Owens et al. relationship, and the semi-oxygenate waters (>10 µM O2) near the sill depth (70-110 m) only deviate ~7%, on average (Luo et al., 2014). Only in the anoxic waters below 160 m were deviations near 20% found. Water column deviations this large are typically observed in basins with permanent or prolonged anoxia like Saanich Inlet or the Black Sea (Anderson et al., 1989). These intense, prolonged conditions have yet to be observed in Bedford Basin (Rakshit et al., 2023). In October 2018, bottom waters (60 m) in Bedford Basin dropped to<50 µM O2, but waters were quickly ventilated and increased above 200 µM O2 in November. Oxygen concentrations at 60 m in Bedford Basin remained above 100 µM O2 during the entire 2019 period of sampling. Results from the aforementioned studies suggests that using a standard 238U-salinity relationship in Bedford Basin in 2019 is supported, albeit with a more conservative uncertainty estimate than the 3% typically propagated (Owens et al., 2011; Xie et al., 2020). Since 238U has never been measured directly in Bedford Basin and the ‘low O2’ waters of Saanich Inlet had a ~7% deviation from the Owens et al. relationship, an uncertainty of 10% is applied to the 238U estimates used in Equation (4) for this study.
4.1.3 Lateral advection potential
The potential impact of lateral advection on the 238U-234Th system could be significant in the upper 5-10 m (Shan et al., 2011; Shan and Sheng, 2012) if a gradient in 234Th existed in Bedford Basin. Surface currents at an average velocity of 0.17 km d-1 (Shan et al., 2011; Burt et al., 2013) can be applied in Equation (3) with a 234Th gradient to estimate the potential impact of lateral movement on the water column 234Th budget. An exact gradient cannot be determined because the 234Th activities at the edges of the basin (~20 m deep) are unknown at this time. However, 234Th results from three studies of similar northern, shallow, semi-enclosed basins (Radakovitch et al., 2003; Forster et al., 2009; Evangeliou et al., 2011), suggest that there would be no predictable, systematic difference between the 0-20 m 234Th activities at the Compass Station and those at the shallow edges of the basin (for further information see Supplementary Text 1.2, Supplementary Table 2, Supplementary Figure 1). Furthermore, the estuarine flow pattern in the upper 20-25 m in the basin (i.e. outflow to the ocean in the upper ~10 m and inflow from the ocean at ~10-20 m depth) works to even out any shallow, cross-basin gradients and produces well-mixed surface waters (Shan et al., 2011; Burt et al., 2013). Without straightforward evidence of depth-dependent patterns from other studies, no quantitative assumptions can be made here regarding which areas of the basin could potentially have more intense 234Th scavenging.
While evidence from the other studies noted above do not indicate that a predictable and significant activity difference (e.g., 0.5 dpm L-1) between Bedford Basin’s edges and the Compass Station would be present, an uncertainty associated with a hypothetical gradient is approximated here to assess how potential lateral advection along this gradient could influence the overall 234Th budget and Equation (4). Based on prior work along riverine and estuarine gradients (e.g. Swarzenski and Baskaran, 2007) and the horizontal water exchange in the basin along a transect from the river through the narrows, a likely gradient in the basin could form from the Sackville River mouth to the Compass Station (~ 3 km distance). If it is assumed that 234Th activities at the mouth were 25% less (0.57 dpm L-1) than the average 0-20 m activities at the Compass Station (0.76 dpm L-1), the resulting 234Th flux contribution would be ~220 dpm m-2 d-1. This flux is ~30% of the estimated 234Th flux at 20 m (725-854 dpm m-2 d-1) and is less than 10% of the full water column flux of 234Th calculated at 70 m. Importantly, the final comparison between the water column 234Th budget (~2300 dpm m-2 d-1) and the sediment accumulation budget (average 2000 ± 1000 dpm m-2 d-1, Table 1) does not change significantly if 220 dpm m-2 d-1 is subtracted from the surface layer 234Th flux. Thus, the impact of surface lateral advection on the water column flux is considered to either negligible or relatively small for the 2019 study period. To be conservative, however, the hypothetical uncertainty of ±220 dpm m-2 d-1 is propagated in the Equation (4) calculations (Table 1).
4.1.4 Horizontal mixing considerations
In the deep waters (>20 m) at the Compass Station, horizontal mixing (e.g., via eddy diffusion) could, in theory, influence 234Th activities. If a persistent 234Th activity gradient existed between the edges of the deep Bedford Basin and the waters at the Compass Station, horizontal mixing would act to even out the gradient on relatively short timescales. Assuming a typical eddy diffusivity coefficient (~1 m2 s-1, Shan et al., 2011), a gradient over 1 to 2 km (i.e. edges to center) would translate to a timescale for horizontal mixing of ~3 to 12 days. The rather short timescale of mixing (~half of timescale for 234Th decay) suggests that any temporary dissolved gradients in the deep basin would homogenize quickly. Thus, a large, persistent sink at the edges would need to exist to sustain even a small gradient in 234Th across the basin. In flux terms, a small gradient (e.g., 0.1 dpm L-1 234Th over 1000 m) translates to 8600 dpm m-2 d-1, which is ~4 times the estimated particulate flux of 234Th at the Compass Station using Equation (4). Horizontal mixing in the basin could therefore be very consequential to the 234Th budget in the basin, but significant mixing will only occur with a persistent sink at the basin edges.
There are two main possibilities for persistent deeper basin sinks (>20 m water depth). One possibility would be near-sediment interactions that remove 234Th. If dissolved 234Th could be impacted by interactions near the sediment water interface with sufficient porewater exchange, then more 234Th scavenging could occur near the interface. However, consistent activities of 238U, 232Th, 230Th, and 234Th measured in box core pore waters and overlying waters from Buzzards Bay, Massachusetts (<30 m water depth, Cochran et al., 1986) do not support this scenario. The other possibility would be consistent scavenging by resuspended sediments at the basin edges (>30 m depth). The broad possibility of resuspension in the basin is considered independently in the next section. Evaluating the specific potential for resuspension to function as a persistent sink driving pronounced (i.e., 8600 dpm m-2 d-1) horizontal mixing in the basin in 2019 is difficult without additional sampling. Resuspension at the basin edges would drive the movement of 234Th away from the Compass Station, leading to an overestimation of the associated vertical 234Th.
Data from other shallow coastal studies (Radakovitch et al., 2003; Forster et al., 2009; Evangeliou et al., 2011; Luo et al., 2014) do not provide a clear path for evaluating the possibility of a multi-season, persistent, systematic gradient between the basin edges and the Compass Station and thus, a quantitative assessment of this type of gradient is not attempted here (Supplementary Text 1.2). These studies showed variability in 234Th activities between depths, stations, and seasons, but no pattern was apparent. Thus, no uncertainty estimate is made here with respect to horizontal mixing’s potential influence on 234Th budgets at this time. Nevertheless, the possibility for resuspension-driven horizontal mixing influences is left open for future investigation.
4.1.5 Sediment resuspension evaluation
The resuspension of sediments up through the water column could impact the 238U-234Th relationship at the Compass Station directly (i.e., resuspended sediments from below scavenge additional 234Th from the water column) or indirectly, as described in the previous section on horizontal mixing (i.e., resuspension elsewhere in the basin that drives a mixing gradient). In shallow water regions like Bedford Basin, resuspension could be natural (i.e., caused by intrusion events) or anthropogenic (i.e., due to anchor drops and drags). Given that differences in light scatter have been observed in bottom waters in the basin previously (Azetsu-Scott and Johnson, 1994), resuspension likely occurs in Bedford Basin, but the frequency of resuspension events is unknown. Resuspension could occur only during annual deep water intrusion events (Burt et al., 2013) and this would perturb the water column 238U-234Th balance over a few weeks or less. If sampling were performed a month later, there would no longer be a measurable signal of the resuspension in the water column 234Th activities. Thus, for the purposes of this study, where no large water column physical events were observed prior to sampling (Figures 2A, B), only the potential for smaller resuspension episodes is assessed.
The possibility of small resuspension events in the weeks prior or during sampling events can first be evaluated by comparing POC:234Th ratios from sediments and water column samples. If the ratios for the small particles in the water column looked like those of the upper sediment layers, this could indicate recent resuspension in the basin. However, the small particle POC:234Th ratios are an order of magnitude less, on average, than the sedimentary POC:234Th ratios (Figure 5, Supplementary Figure 2) and there is no systematic increase in POC:234Th ratios with water column depth (Figure 3). If resuspension processes were less intense, but more frequent (i.e., only 2.5 mm resuspended at a time each day or each week), this small amount of sediment would still create a noticeable signal of resuspension in the water column. This amount of sediment resuspended over 10 m of the water column at the Compass Station in April 2019, would add 98 µmol L-1 of POC and 0.6 dpm L-1 of 234Th to each liter of bottom water. The small quantity of sediment would create POC concentrations in the water column an order of magnitude larger (up from 8 µmol L-1) and the 234Th activities would almost double (up from 0.77 dpm L-1). The ‘new’ resuspended water column ratio would be 76 µmol:dpm (up from 7 to 12 µmol:dpm). The resuspension-induced changes, if present, would be obvious in the water column measurements at Compass Station, but they are not. While measurements from the basin edges were not taken in 2019 to evaluate any 234Th gradients, it is difficult to imagine a scenario where processes resuspending sediment at the nearby basin edges would not also create a 234Th or POC resuspension signal at the Compass Station.
A novel resuspension proxy, RAP234, provides additional evidence that does not support resuspension as a significant process at the time of the sampling events in 2019. As described in Lin et al. (2016), RAP234 behaves in an analogous manner to lithophile elements and higher RAP234 is likely a result of resuspended sediment particles that are concentrated in supported 234Th (by the presence of the longer-lived parent 238U) and members of the 212Bi-228Th decay chain. Thus, as seen over coastal shelves in the Arctic, increasing RAP234 values towards the sea floor are a strong indicator of sediment resuspension (right top panel, Figure 4). Conversely, the RAP234 values from the Bedford Basin (left top panel, Figure 4) show no distinct patterns with depth and each sampling date has a different pattern with respect to depth. Only two samples from the Bedford Basin had RAP234 activities that were over the method limit and these two values were from surface and midwater depths on different dates. The occurrence of these higher RAP234 values appears to be random.
Combining POC and RAP234 values also provides a means for teasing apart the influence of purely biological processes and the impact of resuspension in the water column (bottom panel, Figure 4). Photosynthesis and biological particle production will increase POC in the water column without any significant impact on particulate activities of longer-lived U-Th decay series isotopes (e.g., 238U and 232Th). The upper and lower water column particulate samples from Bedford Basin in August (blue points to the far right in the bottom panel, Figure 4) are likely a direct reflection of only biological production because they contained negligible RAP234 but relatively high POC. Resuspension processes, on the other hand, bring both POC and an RAP234 signal. Resuspended sediment should create a characteristic slope in the particulate data that reflects the average POC of a basin’s sediments and the sum of the activities of 238U-234Th and 232Th-228Th decay chain constituents. The sum of sedimentary U-Th decay chain activities have not been measured in the Bedford Basin, but significant resuspension should push RAP234 activities closer to the Lin et al. best fit regression for the Arctic shelf (bottom panel, Figure 4). There are only two Bedford Basin points that fall above the method limit and neither appears to group with the Arctic shelf data. Furthermore, authigenic uranium is likely precipitating in the anoxic sediments at the Compass Station (Rakshit et al., 2023) and this might elevate RAP234 in resuspended sediments over what has been observed elsewhere (Figure 4). Thus, significant and/or systematic resuspension at the Compass Station is ruled out for the duration of the 2019 sampling events and no uncertainty adjustments are made for resuspension possibilities at this time. However, recommendations for future sampling efforts are provided in Section 5, including the continued use of the RAP234 proxy in Bedford Basin and elsewhere.
4.1.6 Vertical mixing potential
Physical studies of the Bedford Basin (e.g. Burt et al., 2013) generally have shown that 1-D assumptions are valid for much of the basin at most times of year. However, conditions in the basin can change quickly during times of deep-water ventilation and vertical mixing (Rakshit et al., 2023). An examination of the weekly Bedford Basin Monitoring Program data did not indicate any occurrences of rapid, basin-scale, events between March and August of 2019 (Figure 2; Rakshit et al., 2023) and so vertical rates of mixing and/or ventilation are not quantitatively assessed for the 2019 sampling periods. However, an inspection of the weekly Bedford Basin Monitoring Program physical data for these rare events is recommended for any future studies.
4.2 234Th and particle dynamics
As with other coastal systems, particle dynamics highly influence the 234Th distributions in the Bedford Basin. The substantial particulate fraction of 234Th, relative to the total 234Th activity measured, is typical (e.g. Wei and Murray, 1992; Charette et al., 2001). The particulate 234Th in this study averages ~63% of the total activity for all depths and dates, and in a prior study of the basin it was ~74% for surface waters (Niven et al., 1995). Similarly, the scavenging (9 ± 8 days) and particulate (21 ± 9 days) residence times calculated here fit well within the ranges observed in other coastal locations (Wei and Murray, 1992; Forster et al., 2009).
The Compass Station has considerable particle removal rates, illustrated by the 2:1 activity ratio of 238U to 234Th from May to August 2019 (Figure 3A). The extent of 234Th removal by particles can be seen in Figure 7, which combines August data from this study with 234Th:238U data from September 1997 transect off the Scotian Shelf (Charette et al., 2001). Open ocean locations typically have an active surface layer with a 234Th deficit and secular equilibrium throughout most of the remaining water column (far right, Figure 7), while the Compass Station does not reach equilibrium. The deficit is slightly larger in the euphotic zone (Figures 2, 3A) compared to the rest of the water column, but this study suggests that a 234Th:238U ratio of ≤0.6 is present at all depths for much of the year. In a prior weekly sampling study of the basin (0-5 m surface only), 234Th:238U ranged from 0.33 to 0.48 and total 234Th from 0.67 dpm L-1 (May 17) to 0.92 dpm L-1 (March 24, Niven et al., 1995). Similarly, most surface 234Th:238U ratios measured from February to April in 1998 fell between 0.3 and 0.7 (0-5 m, Azetsu-Scott and Niven, 2005). The general agreement between this study’s results (Figure 3A) and those from earlier studies (Niven et al., 1995; Azetsu-Scott and Niven, 2005), indicates that the particle dynamics in the surface of the basin have likely not been significantly changed by any natural or anthropogenic forcings over the last 30 years.
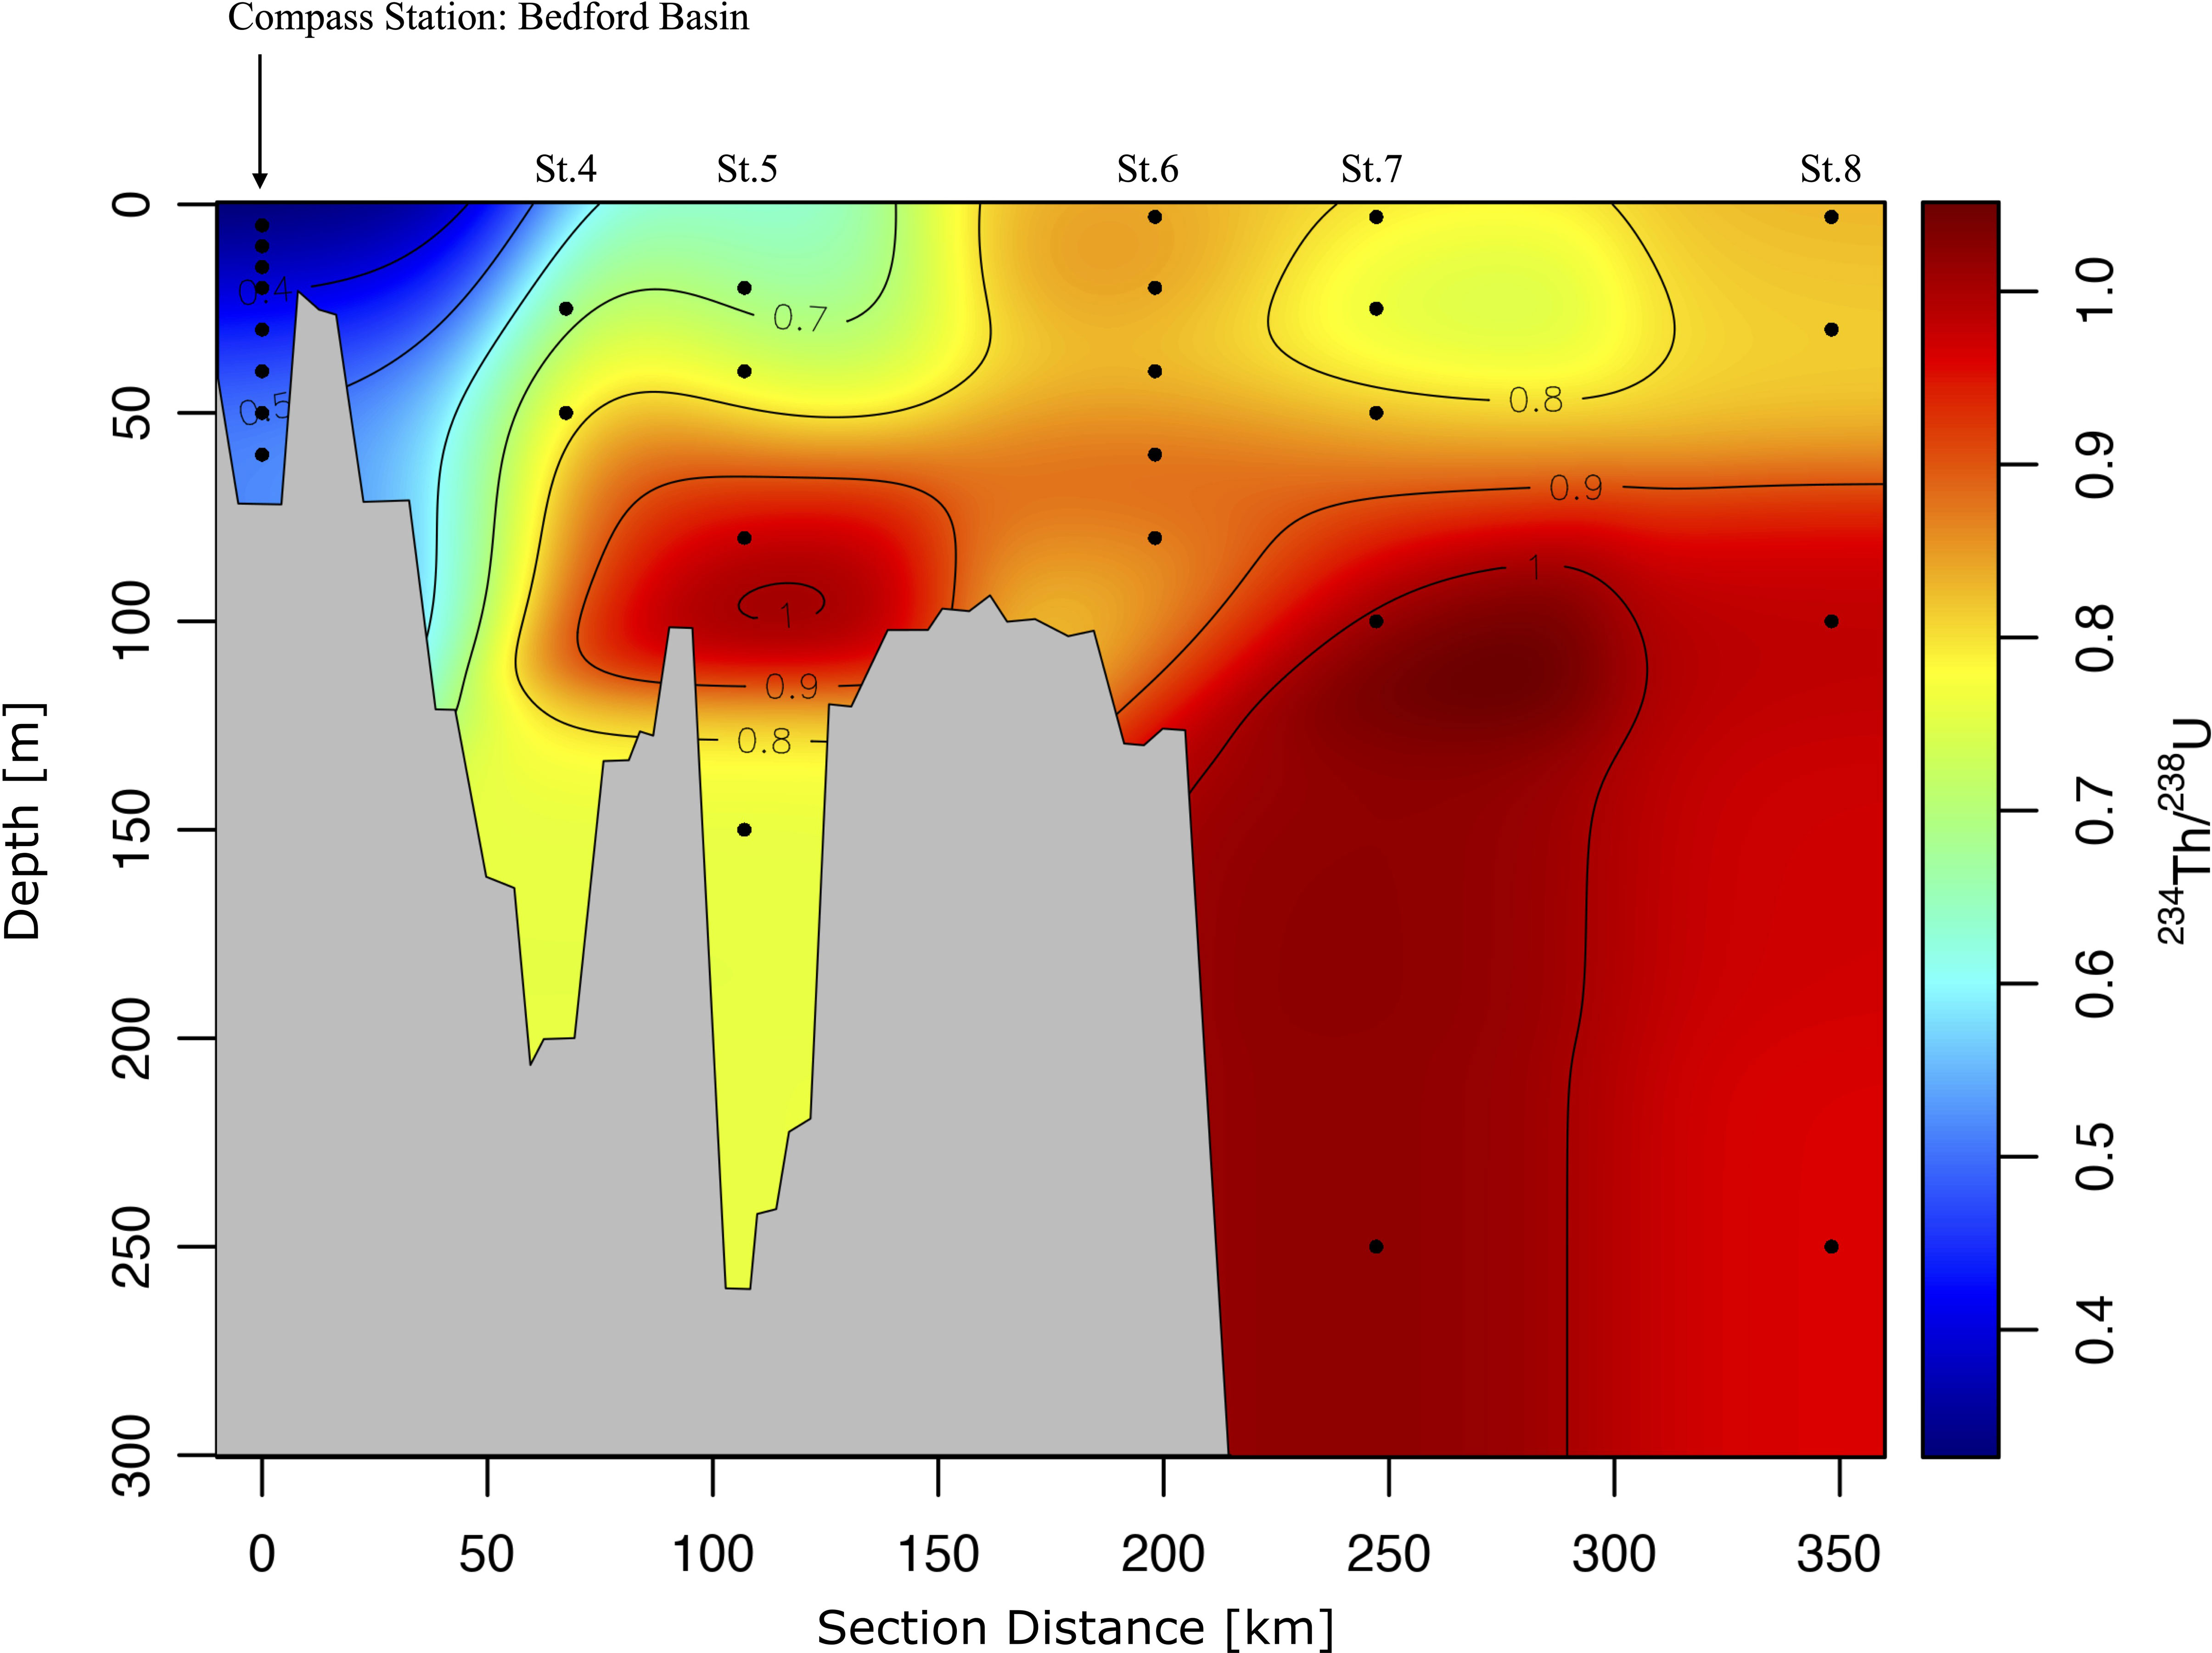
Figure 7 Total 234Th:238U activity ratios in seawater from Bedford Basin across the Scotian Shelf. Data from the Compass Station from this study (section distance = 0 km, August 2019) is shown with data from September 1997 (left to right, stations 4 to 8, Charette et al., 2001).
A particle tracking and connectivity model from the basin indicates that there is little particle loss from Bedford Basin to the rest of Halifax Harbor during normal flow times (i.e. in the absence of severe storms or intrusions, Shan and Sheng, 2012). This suggests that water column particles created in the basin stay in the basin and that export and accumulation budgets, in theory, should balance over annual timescales. However, particles in the water column likely have a multi-stage history. The sensitivity analysis of the 234Th budget assumptions (Section 4.1) suggests that complex particle dynamics and biogeochemical changes (e.g., shifts in community structure related to seasonality and bloom timing) must play a role in maintaining the observed 234Th deficit at the Compass Station in the warmer months of 2019. Slowly settling particles in the deeper layers of the Bedford Basin might help explain some of the 234Th deficits in the deeper water column. There is some evidence for slow settling in the Bedford Basin (Azetsu-Scott and Johnson, 1994). In March (peak of spring bloom) there were higher particle loads in the 0-8m surface mixed layer, while the rest of the water column had a smaller and uniform particle load. Then in mid-April to July, the presence of a benthic nepheloid layer was identified at a depth range of 45-65m using backscatter data. In late July-August the nepheloid layer was much thinner. While the cause or creation of the nepheloid layer is unknown, Azetsu-Scott and Johnson (1994) hypothesize that bloom material can travel rapidly (days) from the surface layer to depths below 50 m in the basin and then reside there for weeks before completely settling and accumulation on the sea floor. Slow settling material would not chemically resemble the sediment layers below and would still be part of the ‘fresh particle’ water column. However, these slow settling could scavenge additional dissolved 234Th from the bottom 10-20m of the water column before they fully become part of the seafloor sediment layers. The potential presence of ‘biogenic’ nepheloid layers and the possibility for true resuspension events (i.e., reentry of processed sediments into the water column) provide ample questions for future studies at the Compass Station and in other coastal regimes.
4.2.1 234Th activities on large particles
A puzzling result from this study is related to the large particles, which consistently have low 234Th activities (dpm L-1) when compared to those from the open North Atlantic (Owens et al., 2015) and the Scotian Shelf (Charette et al., 2001). In contrast to the average large particle 234Th activity measured in this study of 0.008 dpm L-1, the nearby Scotian Shelf had an average of 0.05 dpm L-1 (n = 20, Charette et al., 2001). This is the most proximal location, although much of the Scotian Shelf sampling was done at depths >150 m with a variety of sampling methods. Thus, whether real or created by methodological biases, the cause of the low 234Th activities on large particles here cannot be conclusively determined. Furthermore, few coastal studies have incorporated size-fractionated particulate sampling and many of these studies focused on the role of colloids (e.g. Baskaran et al., 2003). The apparent discrepancy in the large particle 234Th datasets from this study and Charette et al.’s (2001) work illustrates the need for more size fractionated particle coastal sampling, methodological comparisons (e.g., small volume bottles vs. large volume pumps) and an investigation of what particles are indeed sinking and being exported in coastal systems (see Supplementary Text 1.3 for additional discussion).
4.3 Balancing sediment and water column fluxes of 234Th
The similarity in water column 234Th fluxes between the sampling dates is striking (Figure 6). Despite seasonal changes in Chl-a (Figure 2C) and a greater partitioning of 234Th onto small particles in April and August, total 234Th does not vary substantially between the sampling periods (Figure 3A). The few studies of coastal regions where full profiles of total 234Th were collected also showed a linear increase in 234Th flux with depth. This study produced per meter fluxes of 31 dpm m-2 d-1 234Th (Figure 6), while those from Dabob Bay ranged from 33-43 dpm m-2 d-1 (Washington, USA, Wei and Murray, 1992), those from the Beaufort Sea Shelf in the Arctic ranged from 23-29 dpm m-2 d-1 (Baskaran et al., 2003), and those from Mecklenburg Bay were 28 dpm m-2 d-1 (southwestern Baltic Sea, Forster et al., 2009). This uniformity in fluxes is intriguing. It was not seen throughout the open and deeper regions (water depths >300 m) of the Gulf of Maine and the Scotian Shelf (Figure 7), nor was it observed on the Bering Sea Shelf (Baumann et al., 2013). These less-restricted coastal regions are likely impacted by bathymetric changes (Figure 7), more intense currents, and other physical factors, such as advection. Indeed, Charette et al. (2001) employed a 3-D model of the Scotian Shelf to evaluate local 234Th fluxes.
The March-August sediment accumulation fluxes for 234Th vary more than the water column fluxes (Figure 6). Although the two multicores collected simultaneously in August showed little difference (Table 1), in general, sediment-based radioisotope estimates inherently have larger uncertainties (e.g. Black and Buesseler, 2014) due to potential variations in grain size distribution, sediment composition (i.e. mineral type), and local processes (e.g. bioturbation). 210Pb profiles of all cores provide evidence of bioturbation in the top 10 cm of the sediment column (Supplementary Figure 3). A small part of the differences in 234Th accumulation flux between sampling dates could be due to factors that influence spatial variability, however, the trends from February to August cannot likely be explained by these factors alone. The sediment accumulation flux of 234Th in February is distinctly lower than in April, which could be explained by the onset of the spring bloom in March and April following a period of winter quiescence in phytoplankton activity. Other studies suggest that seasonal swings in sediment accumulation fluxes are possible, if not typical. Sediment fluxes in the Long Island Sound, a larger, but restricted basin averaging ~20 m water depth, have been shown to range from as little as 227 dpm m-2 d-1 and to as much as 4953 dpm m-2 d-1 across the basin (Aller et al., 1980; Aller and Cochran, 2019). At a single station sampled between May and August of the same year, the sediment fluxes varied by >3000 dpm m-2 d-1 (Aller and Cochran, 2019).
Despite the greater variability observed in sediment data, the average sediment accumulation of 234Th of 2000 dpm m-2 d-1 (s.d. ± 1000) is roughly equal to the measured water column average and the extrapolated water column average (2300 dpm m-2 d-1 at 70 m, Table 1) within the associated uncertainties. Similarly, good agreement was found between predicted water column 234Th fluxes and results from sediment measurements on the Scotian Shelf for locations with depths of 100 m to 300 m (Charette et al., 2001). However, station to station variation along the Scotian Shelf showed water column fluxes ranging from 1500 to 10000 dpm m-2 d-1. Thus, the more open shelf locations had significantly more variability in water column fluxes than was observed in the more restricted Bedford Basin. In the sediments of Bedford Basin, the larger range in accumulation estimates over the short-term (234Th-based) versus the more stable long-term estimates (210Pb, Supplementary Figure 3) indicates that seasonal studies of coastal regions would benefit from including multiple sets of replicates (spatial variability) and increased frequency of sampling efforts, including winter sampling (temporal variability). 234Th budgets may agree over annual timescales, as it appears they do in Bedford Basin in this study, but the stability of the water column 234Th activities juxtaposed with the fluctuations in the sediment 234Th inventories indicates that more can be learned about the seasonal controls on 234Th activities in the basin.
4.4 POC:234Th ratios strongly influence coastal carbon flux estimates
Since the averages of water column- and sediment-based 234Th fluxes overlap, the major source of variability in carbon flux estimates is related to the POC:234Th ratios (Table 1). Indeed, assessing POC:234Th ratios is an ongoing field of inquiry (e.g. Buesseler et al., 2006; Puigcorbé et al., 2020). In open ocean studies, the large particle ratio is most often utilized as representing sinking material. However, the POC:234Th ratio on large particles observed in this study for May (>900 µmol:dpm) would translate into an unreasonably high carbon flux of ~2100 mmol C m-2 d-1 at the Compass Station (Table 1). This POC flux estimate is more than an order of magnitude higher than models predict for coastal regimes globally (Siegel et al., 2014) and is unreasonable considering that all prior coastal export studies utilizing similar methods found fluxes less than 200 mmol C m-2 d-1. POC:234Th ratios ranging from 2 to 534 µmol:dpm have been observed previously on the Scotian Shelf and in the Gulf of Maine and, therefore some of the ratios >100 µmol:dpm in Bedford Basin could be attributed to natural, seasonal variability (Benitez-Nelson et al., 2000; Charette et al., 2001). Nevertheless, the >100 µmol:dpm ratios found in other studies were generally rare occurrences (Buesseler et al., 2006; Puigcorbé et al., 2020), whereas the high POC:234Th ratios measured on large particles were frequent in this study (for further discussion see Supplementary Text 1.3).
The remaining assessment of the basin’s carbon budget in the next sections focuses on the small particle ratio-based estimates only. The small particle ratios are emphasized for five reasons. First, the uniquely low large particle 234Th activities require corroboration with a multi-method sampling effort before export values well above 100 mmol C m-2 d-1 should be considered. Second, most other coastal 234Th-based studies employed total particulate ratios to calculate export, which are governed by small particles. Third, recent work has suggested that for some open ocean locations (e.g. North Atlantic at BATS, Durkin et al., 2015), coast-proximal regions (e.g. Puigcorbé et al., 2015) and shallow seas (Hung and Gong, 2010), small particles are important to the overall local flux of carbon. Fourth, large particle (>51 um) POC:234Th ratios from the nearby Gulf of Maine (March – Sept 1995, Charette et al., 2001) averaged (± s.d.) 49 ± 68 µmol:dpm, which is similar to the average found in Bedford Basin for small particles (32 ± 39 µmol:dpm). Fifth, using a simple Stokes ideal sphere approximation (particle density = 2 g cm-3), a ‘suspended’ 10 µm particle can pass through the entire 70 m water column at the Compass Station in ~4 days. More complex particle geometries and lower densities could potentially cause the suspended matter to move downward more slowly, however, with a 24-day half-life for 234Th, the suspended particles likely play a key role in the total export of carbon to the sediments.
4.5 A spring-summer carbon budget for Bedford Basin
Model-based NPP estimates from Beford Basin show a high degree of seasonal variability, ranging from 0.4 to 184 mmol C m-2 d-1 (Table 2). The yearly average NPP from these estimates, which utilize 2019 in-situ Chl-a data, is 66 mmol C m-2 d-1 (Table 2). This modeled yearly average matches well with the mean from prior incubation studies in the basin (50 mmol C m-2 d-1, Platt, 1975). The modeled NPP estimates also overlap with those reported for the Scotian Shelf and Gulf of Maine at 26-399 mmol C m-2 d-1 (August-September 1997, Charette et al., 2001). Broadly speaking, NPP in Bedford Basin is in the 100s of mmol C m-2 d-1 at peak times, often in spring, and in the 10s of mmol C m-2 d-1 otherwise. As with the export estimates, those for NPP illustrate the importance of multiple sample efforts in these types of dynamic coastal systems. NPP is the main source of carbon driving export and sedimentary accumulation of carbon in Bedford Basin and production will incorporate new fixed carbon from atmospheric CO2 and recycled carbon as discussed below. Other potential sources of dissolved carbon and POC to the basin, like the discharge from the Sackville River, have been previously constrained (Hargrave and Taguchi, 1978). Daily riverine inputs of POC of ~3 mmol C m-2 d-1 are small with respect to NPP and export estimates and it can be assumed that most of the POC created within the basin remains in the basin due to the shallow, restrictive sill at its south end (Figure 1; Shan and Sheng, 2012).
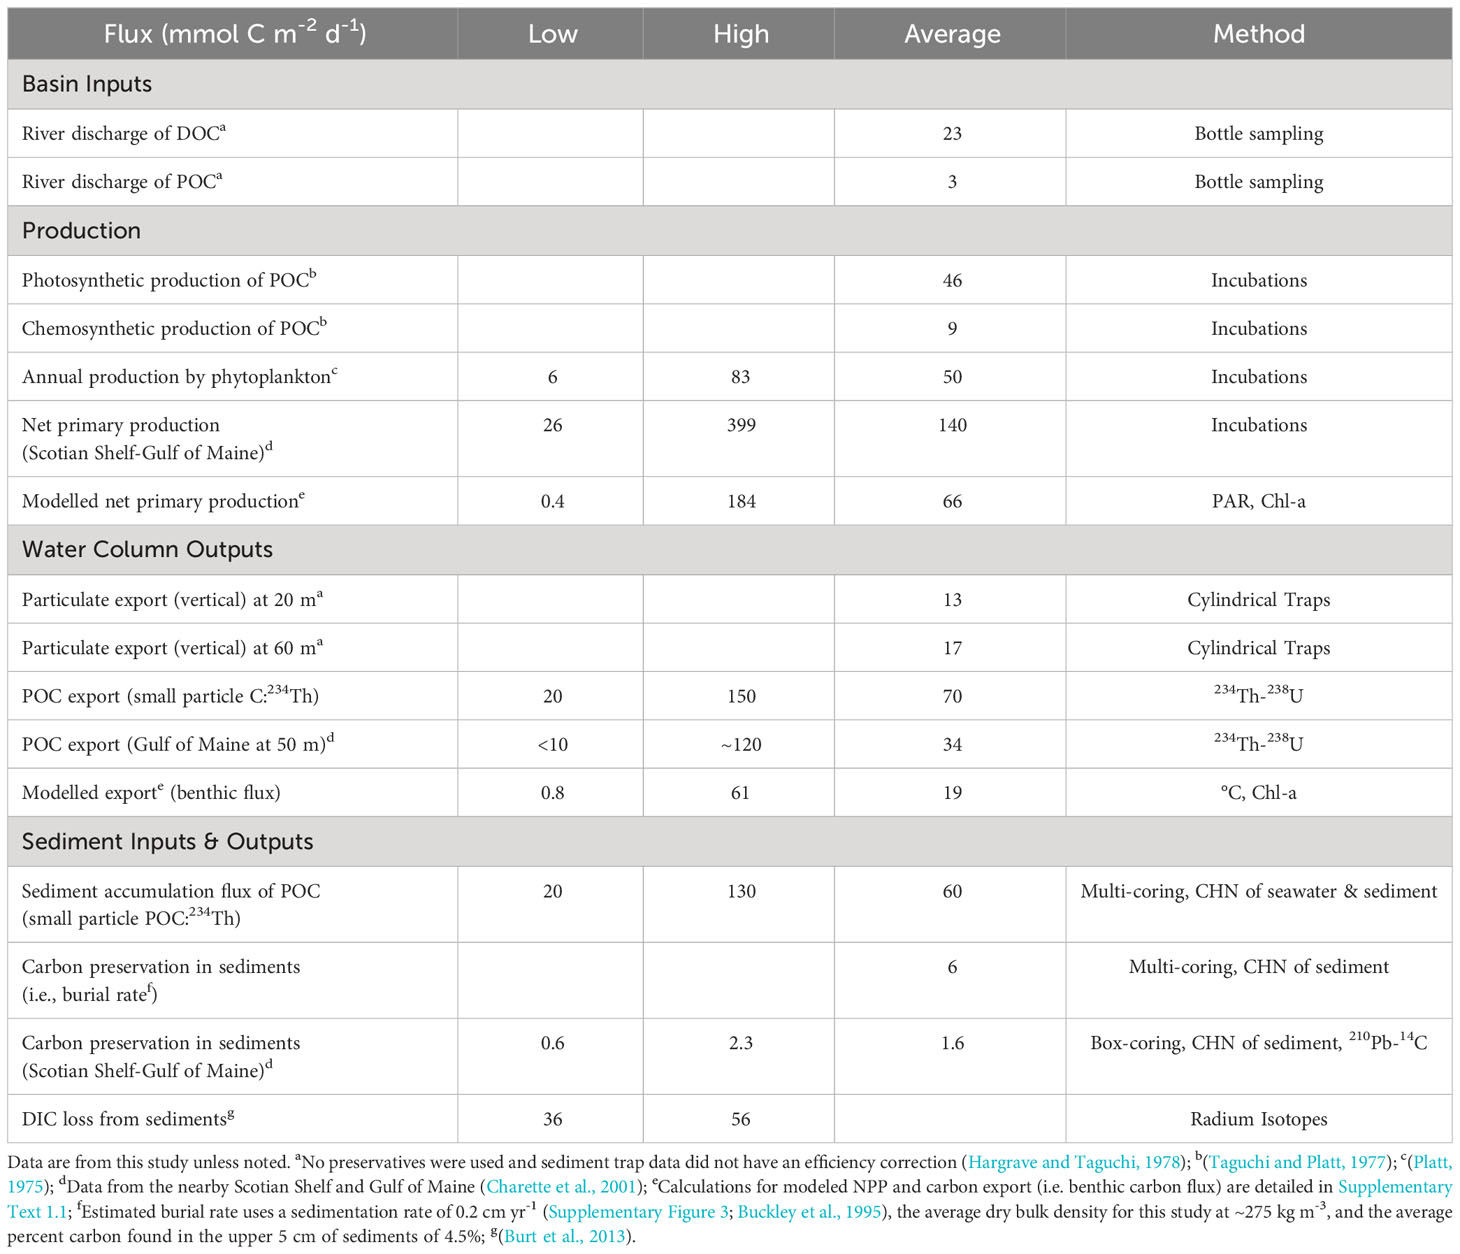
Table 2 Sources, sinks, and carbon cycling in Bedford Basin.
POC export fluxes for the entire water column, derived here from the small particle POC:234Th ratio and 234Th fluxes (hereafter referred to as POC export), ranged from ~25 mmol C m-2 d-1 in April and May 2019 to a high of 150 mmol C m-2 d-1 in August 2019 (Table 1). The mean export estimate for April to August of 70 mmol C m-2 d-1 (s.d. = 70, Table 1) compares favorably with historical observations from the basin and estimates from nearby coastal shelf locations. Prior estimates of export in Bedford Basin were measured using bottom tethered sediment traps and no preservatives, which can result in lower flux estimates due to particle remineralization and/or feeding by swimmers (Hargrave and Taguchi, 1976). Despite the differing methods, the average export reported in 1976 (17 mmol C m-2 d-1 at 60 m) is only slightly lower than the spring export estimates from this study (~25 mmol C m-2 d-1, Table 1). Full water column POC export from this 2019 study at ~70 m depth also fall in the range for those observed on the Scotian Shelf and in the Gulf of Maine at 50 m water depth (average = 34 ± 44 mmol C m-2 d-1, Charette et al., 2001) (Table 2).
As with the 234Th-based export estimates (and the model-based NPP results), large seasonal variations in export were observed in both Hargrave and Taguchi (1976) and Charette et al. (2001). Hargrave and Taguchi (1976) found six-fold seasonal swings from a maximum of 36 mmol C m-2 d-1 (April) to 2 mmol C m-2 d-1 (July). The Gulf of Maine had a peak spring bloom of ~120 mmol C m-2 d-1 and dramatically smaller summer-fall fluxes at<10 mmol C m-2 d-1. The 2019 Bedford Basin export fluxes showed the opposite trend in 2019, with higher fluxes in August (Tables 1, 2). One explanation for the differing seasonal trends is that 2019 was an uncharacteristic year in Bedford Basin, having a more prolonged spring bloom without a definitive peak (Figure 2D). Another reason for the differences could be the use of the large particle ratios in the Charette et al. (2001) study to determine export, which might reflect the prevalence of different communities and particle-formers at different times of year. While the export estimates from all three studies are overall comparable, the collective variability shows the importance of repeated sampling in coastal regions when attempting to decrease uncertainties on coastal carbon budget estimates. Furthermore, the broad similarity in average carbon export estimates from each study is curious considering that each method likely captures different particle types: Bedford Basin traps should collect truly sinking particles over the period of sampling (with noted the remineralization and swimmer caveats), the Gulf of Maine study used >51 µm large particles to find carbon flux, and this 2019 Bedford Basin study utilized 1-51 µm small particles to find carbon flux. Additional carbon flux studies utilizing size fractionated sampling methods could provide valuable insight into the potential biological and chemical similarities between large and small particles in coastal zones and the relative importance of small particles in export estimates.
Comparing the daily model-based and 234Th-derived estimates, the benthic carbon flux estimates from modeled NPP (0.8 to 61 mmol C m-2 d-1) appear to be lower, on average, than the 234Th-based carbon export estimates from Bedford Basin (20 to 150 mmol C m-2 d-1), and from the Gulf of Maine (<10 to ~120 mmol C m-2, Table 2). One reason for the difference in the three sets of results are that the model-based estimates incorporate Chl-a data from the entire year, including winter months, and so the lowest export times have yet to be quantified via 234Th measurements. The model-based estimates suggest that export is typically in the 10s of mmol C m-2 d-1,throughout the spring, summer, and fall, with higher export during the spring bloom. 234Th-based export estimates from Bedford Basin in August (Table 1) were much higher than modeled benthic carbon flux at that time (Table 2), but as noted earlier, export events of the same magnitude (>100 mmol C m-2 d-1) were also observed in Charette et al. (2001).
To calculate and compare annual estimates, it is assumed that the 234Th-derived Compass Station estimates are representative of the carbon flux during the most productive months in the basin (i.e., 9 months from March to November) and that relatively little flux occurs in the remaining winter months. This is supported by the model-based NPP and export trends. The average 234Th-based export of 70 mmol C m-2 d-1 for a 9-month period translates to an annual carbon flux estimate of ~19 mol C m-2 yr-1. The modeled daily benthic flux of 19 mmol C m-2 d-1 equates to an annual export of ~7 mol C m-2 yr-1 (Table 2), which agrees within a factor of two to three with the 234Th -based estimates. If only the April and May measurement-based export estimates are extrapolated over the 9-months (at 20-25 mmol C m-2 d-1), the 234Th-based annual estimate is the same as the modeled estimate at ~7 mol C m-2 yr-1. Considering the overall variability in the three measurement-based carbon fluxes and model assumptions, the general agreement between the two methods observed here is very encouraging.
Like the water column and sedimentary 234Th budgets (Figure 6, Tables 1, 2), the carbon export flux and the sediment accumulation flux of carbon also appear to be quasi-balanced if multi-timescale methods are utilized to create a sediment burial budget for the Compass Station. The sedimentary carbon content from this study (average weight % = 4.5%, upper 5 cm) and estimates of the sedimentation rate (0.2 cm yr-1 from this study via 210Pb, Supplementary Figure 3; Buckley et al., 1995) can be used to determine an apparent burial rate of organic carbon of 6 mmol C m-2 d-1 (dry bulk density ~275 kg m-3, Table 2). The average 234Th-based sediment accumulation flux is 60 mmol C m-2 d-1 (Table 2), suggesting that ~10% of exported carbon is buried. Consistent with these estimates, the amount of dissolved inorganic carbon lost from the sediments as a result of carbon respiration (36 to 56 mmol C m-2 d-1, Burt et al., 2013), implies that up to ~90% of the carbon export reaching the seafloor is re-released into the water column as dissolved inorganic carbon prior to burial. Caution should be used when comparing results derived from varying methodologies, however, as shown here, the broad patterns in the Bedford Basin emerge when multiple metrics for the same process are used (e.g., sediment rate) and repeated sampling is performed. The paired organic carbon export from the water column and its burial in sediments (this study) and the prior measures of inorganic carbon loss from the sediments via respiration (Burt et al., 2013) combine to close the internal, annual carbon cycling budget of Bedford Basin quite well (Tables 1, 2).
5 Recommendations and future work
The average water column and sediment accumulation fluxes of 234Th are in relative balance at the Compass Station (~2000 to 2300 dpm m-2 d-1) averaged over the spring-summer months. This makes Bedford Basin a promising location for more complex and observation-model paired studies of particle dynamics, the impact of community changes on biogeochemical cycles, and methodological development for coastal studies. The water column 234Th flux profiles are surprisingly constant, while the sediment fluxes appear to vary seasonally. This calls into question whether the sediment trends largely reflect seasonal water column events or if natural spatial variability (i.e., local differences in deposition, mineralogy, etc.) plays a more significant role. These data illustrate the importance of future multi-season radioisotope studies, and caution against the over-interpretation of single-event datasets in coastal zones. Furthermore, the results indicate the vital need for winter sampling and replicate coring efforts to assess temporal and spatial variability. Aside from a few time points for Saanich Inlet, British Columbia (Luo et al., 2014), there is a complete lack of winter sediment data for higher-latitude coastal regimes. Much could be learned about the Bedford Basin system and coastal carbon cycling in general by including wintertime observations, especially if winter is a radioisotope ‘reset’ period during which water column 234Th activities peak as Chl-a concentrations drop (Figures 2C, D).
As has been suggested by the data and discussion here, the contribution of small particles to coastal carbon fluxes is likely important and requires further investigation, especially with respect to seasonal changes in POC:234Th ratios. The carbon estimates compiled in this study show an approximately balanced carbon budget, where 234Th-based export estimates (20-150 mmol C m-2 d-1) are on par with those found in the nearby Gulf of Maine (<10-120 mmol C m-2 d-1, Table 2). The budget comparisons here are possible, in part, because the full water column was sampled at high resolution (i.e., 10-15m intervals), multiple sampling events have been considered, and various methods have been compared (i.e., modeled vs. sample-derived, large and small particles). This study has clearly illustrated the importance of multi-method process studies to understand the factors influencing coastal carbon budgets, including size-fractionated particle sampling, dual water column- and sediment-based flux quantification, and full water column measurements. Future coastal studies could pair size-fractionated sampling for 234Th with pigment, transmissometry, and/or imaging analyses to attempt to tease apart the complex particle dynamics influencing the pronounced, full water column deficits that are found in Bedford Basin and other coastal regimes. Both this study and Charette et al. (2001) showcase the highly variable seasonality of coastal carbon export and highlight the necessity of connecting the biogeochemical drivers with observed changes in thorium and carbon cycling in coastal basins. Without quantitative connections, we may never be fully able to close coastal carbon budgets, especially across more active coastal shelves.
To provide a more complete characterization of the entire basin’s dynamics and to investigate the impact of any potential transitory or unknown physical factors influencing the 234Th and carbon budgets at the Compass Station, future work could incorporate surface 234Th sampling near the Sackville River mouth and at the shallower basin edges. Additional sampling in these areas would aid the assessment of any potential resuspension impacts on the 234Th system, as well as inform about potential cross-basin 234Th gradients. When feasible, repeated sampling (every ~1-4 weeks) would help to assess the importance, if any, of non-steady state conditions. Because horizontal mixing could act over relatively short timescales (days to weeks) and contribute to apparent fluxes in smaller basins, sampling along transects (i.e., basin edges to center) in small basins like this one is recommended. Furthermore, the use of novel radioisotope-based proxies like RAP234 will aid in evaluating episodic processes, like resuspension, which could be initiated by physical events and that have the potential to impact carbon budget estimations. The potential for occasional resuspension events makes the Bedford Basin an excellent location for testing coastal resuspension proxies and future studies could follow a similar sampling strategy to that of Muir et al. (2005). These events no doubt have an impact on more open coastal regions like the Gulf of Maine, but resuspension is often noted and rarely able to be quantified (e.g. Charette et al., 2001).
In this study and others applying the 238U-234Th method in coastal settings, carbon cycling is typically the focus. However, this technique can also be applied to determine nitrogen and phosphorus budgets, which could aid in studies of how changes in nutrient budgets impact coastal hypoxia. Because Bedford Basin has a well-mixed surface and stable deep layer and displays classical Sverdrup spring bloom dynamics reminiscent of the North Atlantic, the carbon remineralization in the isolated deep waters results in the depletion of oxygen. Thus, the basin is an ideal location for understanding the development of hypoxia. Future methodological, modeling, and process-based studies can be performed in tandem to advance our understanding of how the constituents of coastal waters are impacted by particle dynamics and what role coastal zones play in the global cycling of elements and the biological carbon pump.
Data availability statement
The datasets presented in this study can be found in online repositories. The names of the repository/repositories and accession number(s) can be found below: Bedford Basin 2019 – Seawater: https://www.bco-dmo.org/dataset/889642 Black, E. E., Kienast, S. S. (2023) Seawater radioisotope (234Th) and carbon from sampling conducted at the Compass Station in Bedford Basin, Nova Scotia, Canada from April to August 2019. Biological and Chemical Oceanography Data Management Office (BCO-DMO). (Version 1) Version Date 2023-02-09. doi:10.26008/1912/bco-dmo.889642.1 Bedford Basin 2019 – Sediments: https://www.bco-dmo.org/dataset/889551 Black, E. E., Kienast, S. S. (2023) Carbon content and radioisotope data from sampling conducted at the Compass Station in Bedford Basin, Nova Scotia, Canada from February to August 2019. Biological and Chemical Oceanography Data Management Office (BCO-DMO). (Version 1) Version Date 2023-02-07. doi:10.26008/1912/bco-dmo.889551.1.
Author contributions
EB: Conceptualization, Formal Analysis, Funding acquisition, Investigation, Methodology, Writing – original draft, Writing – review & editing. CA: Conceptualization, Investigation, Methodology, Resources, Visualization, Writing – review & editing. MA: Investigation, Visualization, Writing – review & editing. SK: Conceptualization, Funding acquisition, Investigation, Methodology, Project administration, Resources, Writing – original draft, Writing – review & editing.
Funding
We gratefully acknowledge funding by the Ocean Frontier Institute, Research Nova Scotia, and NSERC.
Acknowledgments
We thank the crew of the SigmaT, Laura deGelleke, Anna Haverstock, Riley Karker, Sarah Burko, Charity Justrabo, Katie Frame, Emilie Burris, and Subhadeep Rakshit. Analytical assistance was provided by Erin Keltie and Jong Sung Kim (ICPMS, Dalhousie HERC), Joshua Landis and Carl Renshaw (Dartmouth), Claire Normandeau (Dalhousie CERC.OCEAN), and the Buesseler Lab (WHOI). A special thanks to Jessica Drysdale and Gretchen Swarr for their guidance on ICPMS methodology adaptations.
Conflict of interest
The authors declare that the research was conducted in the absence of any commercial or financial relationships that could be construed as a potential conflict of interest.
Publisher’s note
All claims expressed in this article are solely those of the authors and do not necessarily represent those of their affiliated organizations, or those of the publisher, the editors and the reviewers. Any product that may be evaluated in this article, or claim that may be made by its manufacturer, is not guaranteed or endorsed by the publisher.
Supplementary material
The Supplementary Material for this article can be found online at: https://www.frontiersin.org/articles/10.3389/fmars.2023.1254316/full#supplementary-material
Abbreviations
POC, particulate organic carbon; NPP, Net primary production; NSS, Non-steady state; Chl-a, Chlorophyll-a; RAP234, residual β activity of particulate 234Th.
References
Aller R. C., Benninger L. K., Kirk Cochran J. (1980). Tracking particle-associated processes in nearshore environments by use of 234Th/238U disequilibrium. Earth Planet. Sci. Lett. 47, 161–175. doi: 10.1016/0012-821X(80)90034-5
Aller R. C., Cochran J. K. (2019). The critical role of bioturbation for particle dynamics, priming potential, and organic c remineralization in marine sediments: Local and basin scales. Front. Earth Sci. 7. doi: 10.3389/feart.2019.00157
Anderson R. F., Fleisher M. Q., LeHuray A. P. (1989). Concentration, oxidation state, and particulate flux of uranium in the Black Sea. Geochim. Cosmochim. Acta 53, 2215–2224. doi: 10.1016/0016-7037(89)90345-1
Andersson P. S., Wasserburg G. J., Chen J. H., Papanastassiou D. A., Ingri J. (1995). 238U−234U and232Th−230Th in the Baltic Sea and in river water. Earth Planet. Sci. Lett. 130, 217–234. doi: 10.1016/0012-821X(94)00262-W
Azetsu-Scott K., Johnson B. D. (1994). Time series of the vertical distribution of particles during and after a spring phytoplankton bloom in a coastal basin. Cont. Shelf Res. 14, 687–705. doi: 10.1016/0278-4343(94)90113-9
Azetsu-Scott K., Niven S. E. H. (2005). The role of transparent exopolymer particles (TEP) in the transport of 234Th in coastal water during a spring bloom. Cont. Shelf Res. 25, 1133–1141. doi: 10.1016/j.csr.2004.12.013
Baskaran M., Santschi P. H., Guo L., Bianchi T. S., Lambert C. (1996). 234Th:238U disequilibria in the Gulf of Mexico: the importance of organic matter and particle concentration. Cont. Shelf Res. 16, 353–380. doi: 10.1016/0278-4343(95)00016-t
Baskaran M., Swarzenski P. W., Porcelli D. (2003). Role of colloidal material in the removal of 234Th in the Canada basin of the Arctic Ocean. Deep. Res. Part I Oceanogr. Res. Pap. 50, 1353–1373. doi: 10.1016/S0967-0637(03)00140-7
Baumann M. S., Moran S. B., Kelly R. P., Lomas M. W., Shull D. H. (2013). 234Th balance and implications for seasonal particle retention in the eastern Bering Sea. Deep. Res. Part II Top. Stud. Oceanogr. 94, 7–21. doi: 10.1016/j.dsr2.2013.03.008
Benitez-Nelson C. R., Buesseler O. K., Crossin G. (2000). Upper ocean carbon export, horizontal transport, and vertical eddy diffusitivity in the southwestern Gulf of Maine. Cont. Shelf Res. 20, 707–736. doi: 10.1016/S0278-4343(99)00093-X
Benitez-Nelson C., Buesseler K. O., Karl D. M., Andrews J. (2001). A time-series study of particulate matter export in the North Pacific Subtropical Gyre based on 234Th:238U disequilibrium. Deep. Res. I 48, 2595–2611. doi: 10.1016/S0967-0637(01)00032-2
Benitez-Nelson C. R., O’Neill Madden L. P., Styles R. M., Thunell R. C., Astor Y. (2007). Inorganic and organic sinking particulate phosphorus fluxes across the oxic/anoxic water column of Cariaco Basin, Venezuela. Mar. Chem. 105, 90–100. doi: 10.1016/j.marchem.2007.01.007
Biscaye P. E., Anderson R. F. (1994). Fluxes of particulate matter on the slope of the southern Middle Atlantic Bight: SEEP-II. Deep Sea Res. II 41, 459-509. doi: 10.1016/0967-0645(94)90032-9
Bishop J. K., Edmond J. M., Ketten D. R., Bacon M. P., Silker W. B. (1977). The chemistry, biology, and vertical flux of particulate matter from the upper 400 m of the equatorial Atlantic Ocean. Deep. Res. 24, 511–548. doi: 10.1016/0146-6291(77)90526-4
Black E. E., Buesseler K. O. (2014). Spatial variability and the fate of cesium in coastal sediments near Fukushima , Japan. Biogeosciences 11, 5123–5137. doi: 10.5194/bg-11-5123-2014
Black E. E., Buesseler K. O., Pike S. M., Lam P. J. (2018). 234Th as a tracer of particulate export and remineralization in the southeastern tropical Pacific. Mar. Chem. 201, 35–50. doi: 10.1016/j.marchem.2017.06.009
Buckley D. E., Smith J. N., Winters G. V. (1995). Accumulation of contaminant metals in marine sediments of Halifax Harbour, Nova Scotia: environmental factors and historical trends. Appl. Geochem. 10, 175–195. doi: 10.1016/0883-2927(94)00053-9
Buesseler K. O., Bacon M. P., Cochrant J. K., Livingston H. D. (1992). Carbon and nitrogen export during the JGOFS North Atlantic Bloom Experiment estimated from 234Th:238U disequilibria. Deep. Res. 39, 1115–1137. doi: 10.1016/0198-0149(92)90060-7
Buesseler K. O., Benitez-Nelson C. R., Moran S. B., Burd A., Charette M., Cochran J. K., et al. (2006). An assessment of particulate organic carbon to thorium-234 ratios in the ocean and their impact on the application of 234Th as a POC flux proxy. Mar. Chem. 100, 213–233. doi: 10.1016/j.marchem.2005.10.013
Burt W. J., Thomas H., Fennel K., Horne E. (2013). Sediment-water column fluxes of carbon, oxygen and nutrients in Bedford Basin, Nova Scotia, inferred from 224Ra measurements. Biogeosciences 10, 53–66. doi: 10.5194/bg-10-53-2013
Charette A., Pike M., Smith J. N. (2001). Investigating the carbon cycle in the Gulf of Maine using the natural tracer thorium 234. J. Geophys. Res. 106, 553–579. doi: 10.1029/1999jc000277
Chen J. H., Lawrence Edwards R., Wasserburg G. J. (1986). 238U, 234U and 232Th in seawater. Earth Planet. Sci. Lett. 80, 241–251. doi: 10.1016/0012-821X(86)90108-1
Cochran J. K., Carey A. E., Sholkovitz E. R., Surprenant L. D. (1986). The geochemistry of uranium and thorium in coastal marine sediments and sediment pore waters. Geochim. Cosmochim. Acta 50, 663–680. doi: 10.1016/0016-7037(86)90344-3
Costanza R., de Groot R., Sutton P., van der Ploeg S., Anderson S. J., Kubiszewski I., et al. (2014). Changes in the global value of ecosystem services. Glob. Environ. Change 26, 152–158. doi: 10.1016/j.gloenvcha.2014.04.002
Diaz R. J., Rosenberg R. (2008). Spreading dead zones and consequences for marine ecosystems. Sci. (80-. ). 321, 926–929. doi: 10.1126/science.1156401
Durkin C. A., Estapa M. L., Buesseler K. O. (2015). Observations of carbon export by small sinking particles in the upper mesopelagic. Mar. Chem. 175, 72–81. doi: 10.1016/j.marchem.2015.02.011
Evangeliou N., Florou H., Scoullos M. (2011). POC and particulate 234Th export fluxes estimated using 234Th/238U disequilibrium in an enclosed Eastern Mediterranean region (Saronikos Gulf and Elefsis Bay, Greece) in seasonal scale. Geochim. Cosmochim. Acta 75, 5367–5388. doi: 10.1016/j.gca.2011.04.005
Forster S., Turnewitsch R., Powilleit M., Werk S., Peine F., Ziervogel K., et al. (2009). Thorium-234 derived information on particle residence times and sediment deposition in shallow waters of the south-western Baltic Sea. J. Mar. Syst. 75, 360–370. doi: 10.1016/j.jmarsys.2008.04.004
Galloway J. N., Dentener F. J., Capone D. G., Boyer E. W., Howarth R. W., Seitzinger S. P., et al. (2004). Nitrogen cycles: Past, present, and future. Biogeochemistry 70, 153–226. doi: 10.1007/s10533-004-0370-0
Gustafsson Ö., Buesseler K. O., Geyer W. R., Moran S. B., Gschwend P. M. (1998). An assessment of the relative importance of horizontal and vertical transport of particle-reactive chemicals in the coastal ocean. Cont. Shelf Res. 18, 805–829. doi: 10.1016/S0278-4343(98)00015-6
Hargrave B. T., Taguchi S. (1976). Sedimentation measurements in Bedford Basin 1973-74 (Dartmouth, Nova Scotia). doi: 10.13140/2.1.2815.3125
Hargrave B. T., Taguchi S. (1978). Origin of deposited material sedimented in a marine bay. J. Fish. Res. Bd Canada 35, 1604–1616. doi: 10.1139/f78-250
Hung C. C., Gong G. C. (2010). POC/234Th ratios in particles collected in sediment traps in the northern South China Sea. Estuar. Coast. Shelf Sci. 88, 303–310. doi: 10.1016/j.ecss.2010.04.008
Jahnke R. A. (2010). “Global Synthesis,” in Carbon and Nutrient Fluxes in Continental Margins. Eds. Liu K.-K., Atkinson L., Quinones R., Talaue-McManus L. (Berlin Heidelberg: Springer), 597–615.
Kepkay P. E., Niven S. E. H., Jellett J. F. (1997). Colloidal organic carbon and phytoplankton speciation during a coastal bloom. J. Plankton Res. 19, 369–389. doi: 10.1093/plankt/19.3.369
Kerrigan E. A., Kienast M., Thomas H., Wallace D. W. R. (2017). Using oxygen isotopes to establish freshwater sources in Bedford Basin, Nova Scotia, a Northwestern Atlantic fjord. Estuar. Coast. Shelf Sci. 199, 96–104. doi: 10.1016/j.ecss.2017.09.003
Le Moigne F. A. C., Henson S. A., Sanders R. J., Madsen E. (2013). Global database of surface ocean particulate organic carbon export fluxes diagnosed from the 234Th technique. Earth Syst. Sci. Data 5, 295–304. doi: 10.5194/essd-5-295-2013
Li W. K. W., Dickie P. M. (2001). Monitoring phytoplankton, bacterioplankton, and virioplankton in a coastal inlet (Bedford basin) by flow cytometry. Cytometry 44, 236–246. doi: 10.1118/1.594729
Lin W., Chen L., Zeng S., Li T., Wang Y., Yu K. (2016). Residual β activity of particulate 234Th as a novel proxy for tracking sediment resuspension in the ocean. Nat. Sci. Rep. 6, 27069. doi: 10.1038/srep27069
Luo Y., Miller L. A., De Baere B., Soon M., Francois R. (2014). POC fluxes measured by sediment traps and 234Th:238U disequilibrium in Saanich Inlet, British Columbia. Mar. Chem. 162, 19–29. doi: 10.1016/j.marchem.2014.03.001
McDonnell A. M. P., Buesseler K. O. (2010). Variability in the average sinking velocity of marine particles. Limnol. Oceanogr. 55, 2085–2096. doi: 10.4319/lo.2010.55.5.2085
Muir G. K. P., Pates J. M., Karageorgis A. P., Kaberi H. (2005). 234Th:238U disequilibrium as an indicator of sediment resuspension in Thermaikos Gulf, northwestern Aegean Sea. Cont. Shelf Res. 25, 2476–2490. doi: 10.1016/j.csr.2005.08.009
Najjar R. G., Herrmann M., Alexander R., Boyer E. W., Burdige D. J., Butman D., et al. (2018). Carbon budget of tidal wetlands, estuaries, and shelf waters of eastern North America. Global Biogeochem. Cycles 32, 389–416. doi: 10.1002/2017GB005790
Niven S. E. H., Kepkay P. E., Boraie A. (1995). Colloidal organic carbon and colloidal 234Th dynamics during a coastal phytoplankton bloom. Deep. Res. II 42, 257–273. doi: 10.1016/0967-0645(95)00014-H
Not C., Brown K. A., Ghaleb B., Hillaire-Marcel C. (2012). Conservative behavior of uranium vs. salinity in Arctic sea ice and brine. Mar. Chem. 130–131, 33–39. doi: 10.1016/j.marchem.2011.12.005
Osman M. B., Das S. B., Trusel L. D., Evans M. J., Fischer H., Grieman M. M., et al. (2019). Industrial-era decline in subarctic Atlantic productivity. Nature 569, 551–555. doi: 10.1038/s41586-019-1181-8
Owens S. A., Buesseler K. O., Sims K. W. W. (2011). Re-evaluating the 238U-salinity relationship in seawater: Implications for the 238U–234Th disequilibrium method. Mar. Chem. 127, 31–39. doi: 10.1016/j.marchem.2011.07.005
Owens S. A., Pike S., Buesseler K. O. (2015). Thorium-234 as a tracer of particle dynamics and upper ocean export in the Atlantic Ocean. Deep. Res. II 116, 42–59. doi: 10.1016/j.dsr2.2014.11.010
Paerl H. W., Scott J. T. (2010). Throwing fuel on the fire: Synergistic effects of excessive nitrogen inputs and global warming on harmful algal blooms. Environ. Sci. Technol. 44, 7756–7758. doi: 10.1021/es102665e
Pates J. M., Muir G. K. P. (2007). U-salinity relationships in the Mediterranean: Implications for 234Th:238U particle flux studies. Mar. Chem. 106, 530–545. doi: 10.1016/j.marchem.2007.05.006
Pike S. M., Buesseler K. O., Andrews J., Savoye N. (2005). Quantification of 234Th recovery in small volume sea water samples by inductively coupled plasma mass spectrometry. J. Radioanal. Nucl. Chem. 263, 355–360. doi: 10.1007/s10967-005-0062-9
Platt T. (1975). Analysis of the importance of spatial and temporal heterogeneity in the estimation of annual production by phytoplankton in a small, enriched, marine basin. J. Exp. Mar. Bio. Ecol. 18, 99–109. doi: 10.1016/0022-0981(75)90067-2
Puigcorbé V., Benitez-nelson C. R., Masqué P., Verdeny E., White A. E., Popp B. N., et al. (2015). Small phytoplankton drive high summertime carbon and nutrient export in the Gulf of California and Eastern Tropical North Pacific. Global Biogeochem. Cycles 28 (8, 1309–1332. doi: 10.1002/2015GB005134
Puigcorbé V., Masqué P., Le Moigne F. A. C. (2020). Global database of ratios of particulate organic carbon to thorium-234 in the ocean: improving estimates of the biological carbon pump. Earth Syst. Sci. Data 12, 1267–1285. doi: 10.5194/essd-12-1267-2020
Radakovitch O., Frignani M., Giuliani S., Montanari R. (2003). Temporal variations of dissolved and particulate 234Th at a coastal station of the northern Adriatic Sea. Estuar. Coast. Shelf Sci. 58, 813–824. doi: 10.1016/S0272-7714(03)00187-2
Rakshit S., Dale A. W., Wallace D. W., Algar C. K. (2023). Sources and sinks of bottom water oxygen in a seasonally hypoxic fjord. Front. Mar. Sci 10. doi: 10.3389/fmars.2023.1148091
Savoye N., Benitez-Nelson C., Burd A. B., Cochran J. K., Charette M., Buesseler K. O., et al. (2006). 234Th sorption and export models in the water column: A review. Mar. Chem. 100, 234–249. doi: 10.1016/j.marchem.2005.10.014
Shan S., Sheng J. (2012). Examination of circulation, flushing time and dispersion in Halifax Harbour of Nova Scotia. Water Qual. Res. J. Canada 47, 353–374. doi: 10.2166/wqrjc.2012.041
Shan S., Sheng J., Thompson K. R., Greenberg D. A. (2011). Simulating the three-dimensional circulation and hydrography of Halifax Harbour using a multi-nested coastal ocean circulation model. Ocean Dyn. 61, 951–976. doi: 10.1007/s10236-011-0398-3
Siegel D. A., Buesseler K. O., Doney S. C., Sailley S. F., Behrenfeld M. J., Boyd P. W. (2014). Global assessment of ocean carbon export by combining satellite observations and food-web models. Global Biogeochem. Cycles 28, 181–196. doi: 10.1002/2013GB004743
Swarzenski P. W., Baskaran M. (2007). Uranium distribution in the coastal waters and pore waters of Tampa Bay, Florida. Mar. Chem. 104, 43–57. doi: 10.1016/j.marchem.2006.05.002
Taguchi S., Platt T. (1977). Assimilation of 14CO2 in the dark compared to phytoplankton production in a small coastal inlet. Estuar. Coast. Mar. Sci. 5, 679–684. doi: 10.1016/0302-3524(77)90092-5
Todd J. F., Elsinger R. J., Moore W. S. (1988). The distributions of uranium, radium and thorium isotopes in two anoxic fjords: Framvaren Fjord (Norway) and Saanich Inlet (British Columbia). Mar. Chem. 23, 393–415. doi: 10.1016/0304-4203(88)90107-7
Waples J. T., Benitez-Nelson C., Savoye N., Rutgers van der Loeff M., Baskaran M., Gustafsson Ö. (2006). An introduction to the application and future use of 234Th in aquatic systems. Mar. Chem. 100, 166–189. doi: 10.1016/j.marchem.2005.10.011
Waples J. T., Klump J. V. (2013). Vertical and horizontal particle transport in the coastal waters of a large lake: An assessment by sediment trap and thorium-234 measurements. J. Geophys. Res. Ocean. 118, 5376–5397. doi: 10.1002/jgrc.20394
Wei C. L., Murray J. W. (1992). Temporal variations of 234Th activity in the water column of Dabob Bay: Particle scavenging. Limnol. Oceanogr. 37, 296–314. doi: 10.4319/lo.1992.37.2.0296
Keywords: carbon, coastal, thorium, export, Bedford Basin Monitoring Program
Citation: Black EE, Algar CK, Armstrong M and Kienast SS (2023) Insights into constraining coastal carbon export from radioisotopes. Front. Mar. Sci. 10:1254316. doi: 10.3389/fmars.2023.1254316
Received: 06 July 2023; Accepted: 14 September 2023;
Published: 02 October 2023.
Edited by:
Ed Hathorne, Helmholtz Association of German Research Centres (HZ), GermanyReviewed by:
Frank Dehairs, Vrije University Brussels, BelgiumZvi Steiner, Helmholtz Association of German Research Centres (HZ), Germany
Copyright © 2023 Black, Algar, Armstrong and Kienast. This is an open-access article distributed under the terms of the Creative Commons Attribution License (CC BY). The use, distribution or reproduction in other forums is permitted, provided the original author(s) and the copyright owner(s) are credited and that the original publication in this journal is cited, in accordance with accepted academic practice. No use, distribution or reproduction is permitted which does not comply with these terms.
*Correspondence: Erin E. Black, ZS5ibGFja0Byb2NoZXN0ZXIuZWR1