 M. Dale Stokes
 James J. Leichter
 David Nadeau2
- 1Scripps Institution of Oceanography, University of California, San Diego, San Diego, CA, United States
- 2Retired, San Diego, CA, United States
A recent study conducted at the Point Loma wastewater outfall in San Diego used a novel sampling technique, the Pelagic Laser Tomographer (PLT), in combination with traditional water column profiling instruments to analyze suspended particulate distributions and effluent plume dynamics. Coastal wastewater discharges create buoyant plumes that interact with the surrounding water, and the tracking and mapping of the resulting diluted effluent is essential for monitoring outfall system performance. The results from the PLT sampling highlight the utility of high spatial and temporal resolution estimates of suspended particulate size spectra to help capture the dynamics of the plume interactions with the coastal current flow field. In addition, new tools like the PLT can help marine scientists estimate natural and anthropogenic particulate size distributions that are essential to our understanding sediment and pollutant transport, nutrient cycling, and ecosystem energy dynamics.
1 Introduction
Wastewater outfalls form the terminal structures for many municipal waste treatment systems, discharging treated effluent into natural bodies of water such as rivers, lakes, or coastal oceans. A primary purpose and design consideration for outfalls is the safe and efficient transport and diffusion of wastewater and discharge in order to mitigate local accumulation of effluent and the potential human health and ecological hazards (Payne and Hedges, 1990). When broadly dispersed into coastal oceans, discharged wastewater typically has lower salinity and density than the surrounding seawater and therefore can form buoyant plumes that interact with the 3-dimensional flow field above the discharge site. Outfall system designs include diffusers to better disperse point source material, maximizing wastewater dilution into the receiving water body and facilitating transport away from sensitive human or natural ecological areas. For example, matching effluent discharge velocities, port spacing, and diffusor lengths with the water depth and prevailing ocean current structure can maximize turbulent diffusion and mixing of the buoyant wastewater plume and increase gravitational spreading of the wastefield (Roberts, 1979). Dynamic processes including variable wastewater production and fluctuations in precipitation and stormwater patterns can all affect outfall operations and plume dynamics with important considerations for human and coastal ecosystem health (do Carmo et al., 2006).
In the design and operation of municipal wastewater outfalls, the tracking and mapping of discharges are critical, often costly, components of outfall permitting and compliance processes (Rogowski et al., 2012). Both traditional boat-based profile sampling and autonomous underwater vehicle technology have been employed in combination with numerical simulations to confirm acceptable and efficient discharge operations. However, such sampling is highly complex and it is difficult to identify and track discharged waters due to interactions with coastal currents, density stratification of coastal waters (and lakes), internal waves, variations in precipitation, and other environmental factors (Noble et al., 2001). For example, in monthly sampling via predetermined grids and traditional conductivity-temperature-depth (CTD) of the Point Loma outfall off San Diego, CA, investigators were only able to detect the discharge plume in 2 out of 16 monthly samplings (Terrill et al., 2009). Further, the dynamics and transport of materials within discharge plumes are likely to show complex spatial and temporal variation in response to the mixing and the changes in salinity, temperature, and currents structure in the local environment.
Technological advances in sensors and sampling platforms have significantly enhanced outfall plume tracking and mapping. Recent innovations include surface current identification from high frequency radar (e.g. Kim et al., 2010), natural and injected tracer studies (e.g. Washburn et al., 1992; Jones et al., 1993; Carvalho et al., 2002; Hunt et al., 2010), and fluorometry targeting color dissolved organic matter (CDOM) (Rogowski et al., 2012). While some of the techniques have proven effective in tracking plumes, little is known about the dynamics of suspended particulates or particulate size distributions in outfall plumes.
Past and current research in wastewater outfall performance has largely focused on design and compliance (Mukhtasor et al., 2002), treatment technology innovation (Missimer et al., 2015), as well as water quality and environmental impact mitigation strategies (Ahmed et al., 2019), and system resilience and adaptation to climate change impacts including extreme weather events and flooding and coastal sea level rise (Howard et al., 2010; Tavakol-Davani et al., 2016). Here we report on a novel sampling effort using a new sensor, the Pelagic Laser Tomographer (PLT) (Stokes et al., 2023) coupled to a traditional CTD instrument using boat-based profiling in the vicinity of the Point Loma wastewater outfall in San Diego, California USA. There are other instrument systems that provide estimates of particulate distributions however, these are primarily suited for sampling at lower spatial volume or lower temporal resolution or optimized for long duration open-ocean deployment scenarios (see Picheral et al., 2022 and references therein). The PLT generates unique high-resolution data on suspended particulate counts and size frequency distribution and this data coupled with traditional CTD profiling provide a new opportunity to consider the 3-dimensional distribution of particulates in a coastal ocean setting in relation to a wastewater outfall.
In addition to examining wastewater outfall plume dynamics, understanding the size distribution of particulates in natural water bodies, including coastal oceans, is important for studies of sediment and pollutant transport, nutrient cycling, and biological carbon fluxes mitigated by phytoplankton and zooplankton ecosystem dynamics. Techniques for estimated particle size distributions include laser diffraction, flow cytometry (typically on preserved samples), and in situ imaging via optical sensors (Kiko et al., 2022), each with commensurate advantages and limitations of resolution, accuracy, cost, and scalability among systems. In general, these systems seek to delineate particles among size classes, for example large particles (> 1 to several mm), macro- and micro-aggregates (0.2 mm to 1 mm, and 20 μm to 0.2 mm respectively), small particles (2 to 20 μm), and dissolved organic matter (< 2 μm). The distribution of particles among size classes can then provide valuable insight into their fate and transport and their transformations in space and time while suspended. A wide range of factors affect oceanic particle size distributions, including rates and identity of primary producers, zooplankton grazing, particle aggregation, as well as anthropogenic factors such as sedimentation and pollutant and wastewater discharge. Therefore, cost effective and efficient techniques for identifying particle distributions across space and through time can make valuable contributions to both fundamental and applied environmental research. Sediment transport is strongly affected by particulate distributions with heavier and larger particles sinking and being deposited faster than lighter and smaller ones. Biological and ecological processes including carbon and elemental cycling, contaminant accumulation, and rates of organic matter degradation are affected by particle distributions. While advances in remote sensing techniques have provided insight into near-surface particle distributions in open ocean environments (e.g. Kiko et al., 2022), in situ sampling is essential for both ground truthing and sampling at greater depths than typical depths of remote sensing via visible and multispectral light wave lengths (e.g. ~ 5 to 10 m depth).
2 Methods
The Point Loma sewer outfall has been operational since 1963 and is designed to discharge treated wastewater effluent into the Pacific Ocean. The shoreline facility provides wastewater management, water recycling and solids handling for the approximately 1100 km2 service area of the city of San Diego and surrounding metropolitan region (City of San Diego, 2015). Treated effluent is transported approximately 7 km offshore for diffusive discharge at approximately 100 m depth into the ocean. Two, 760 m long diffusor legs branch from the main pipeline axis (Figure 1). The diffusor legs vary from 2.1 to 1.2 m internal diameter and have a series of discharge ports (9.5 and 10.75 cm diameter) spaced approximately 7.3 m continuously along their length. The average effluent flow rate handled by the outfall is approximately 10.5 m3s-1 (equivalent to approximately 240 million gallons per day, MGD) and can manage more than 19 m3s-1 at peak wet weather flows (City of San Diego, 2015). For comparison, the effluent flow rate of the Point Loma outfall is approximately half that of the city of Los Angeles outfall (~ 500 MGD) and other similarly-populated cities.
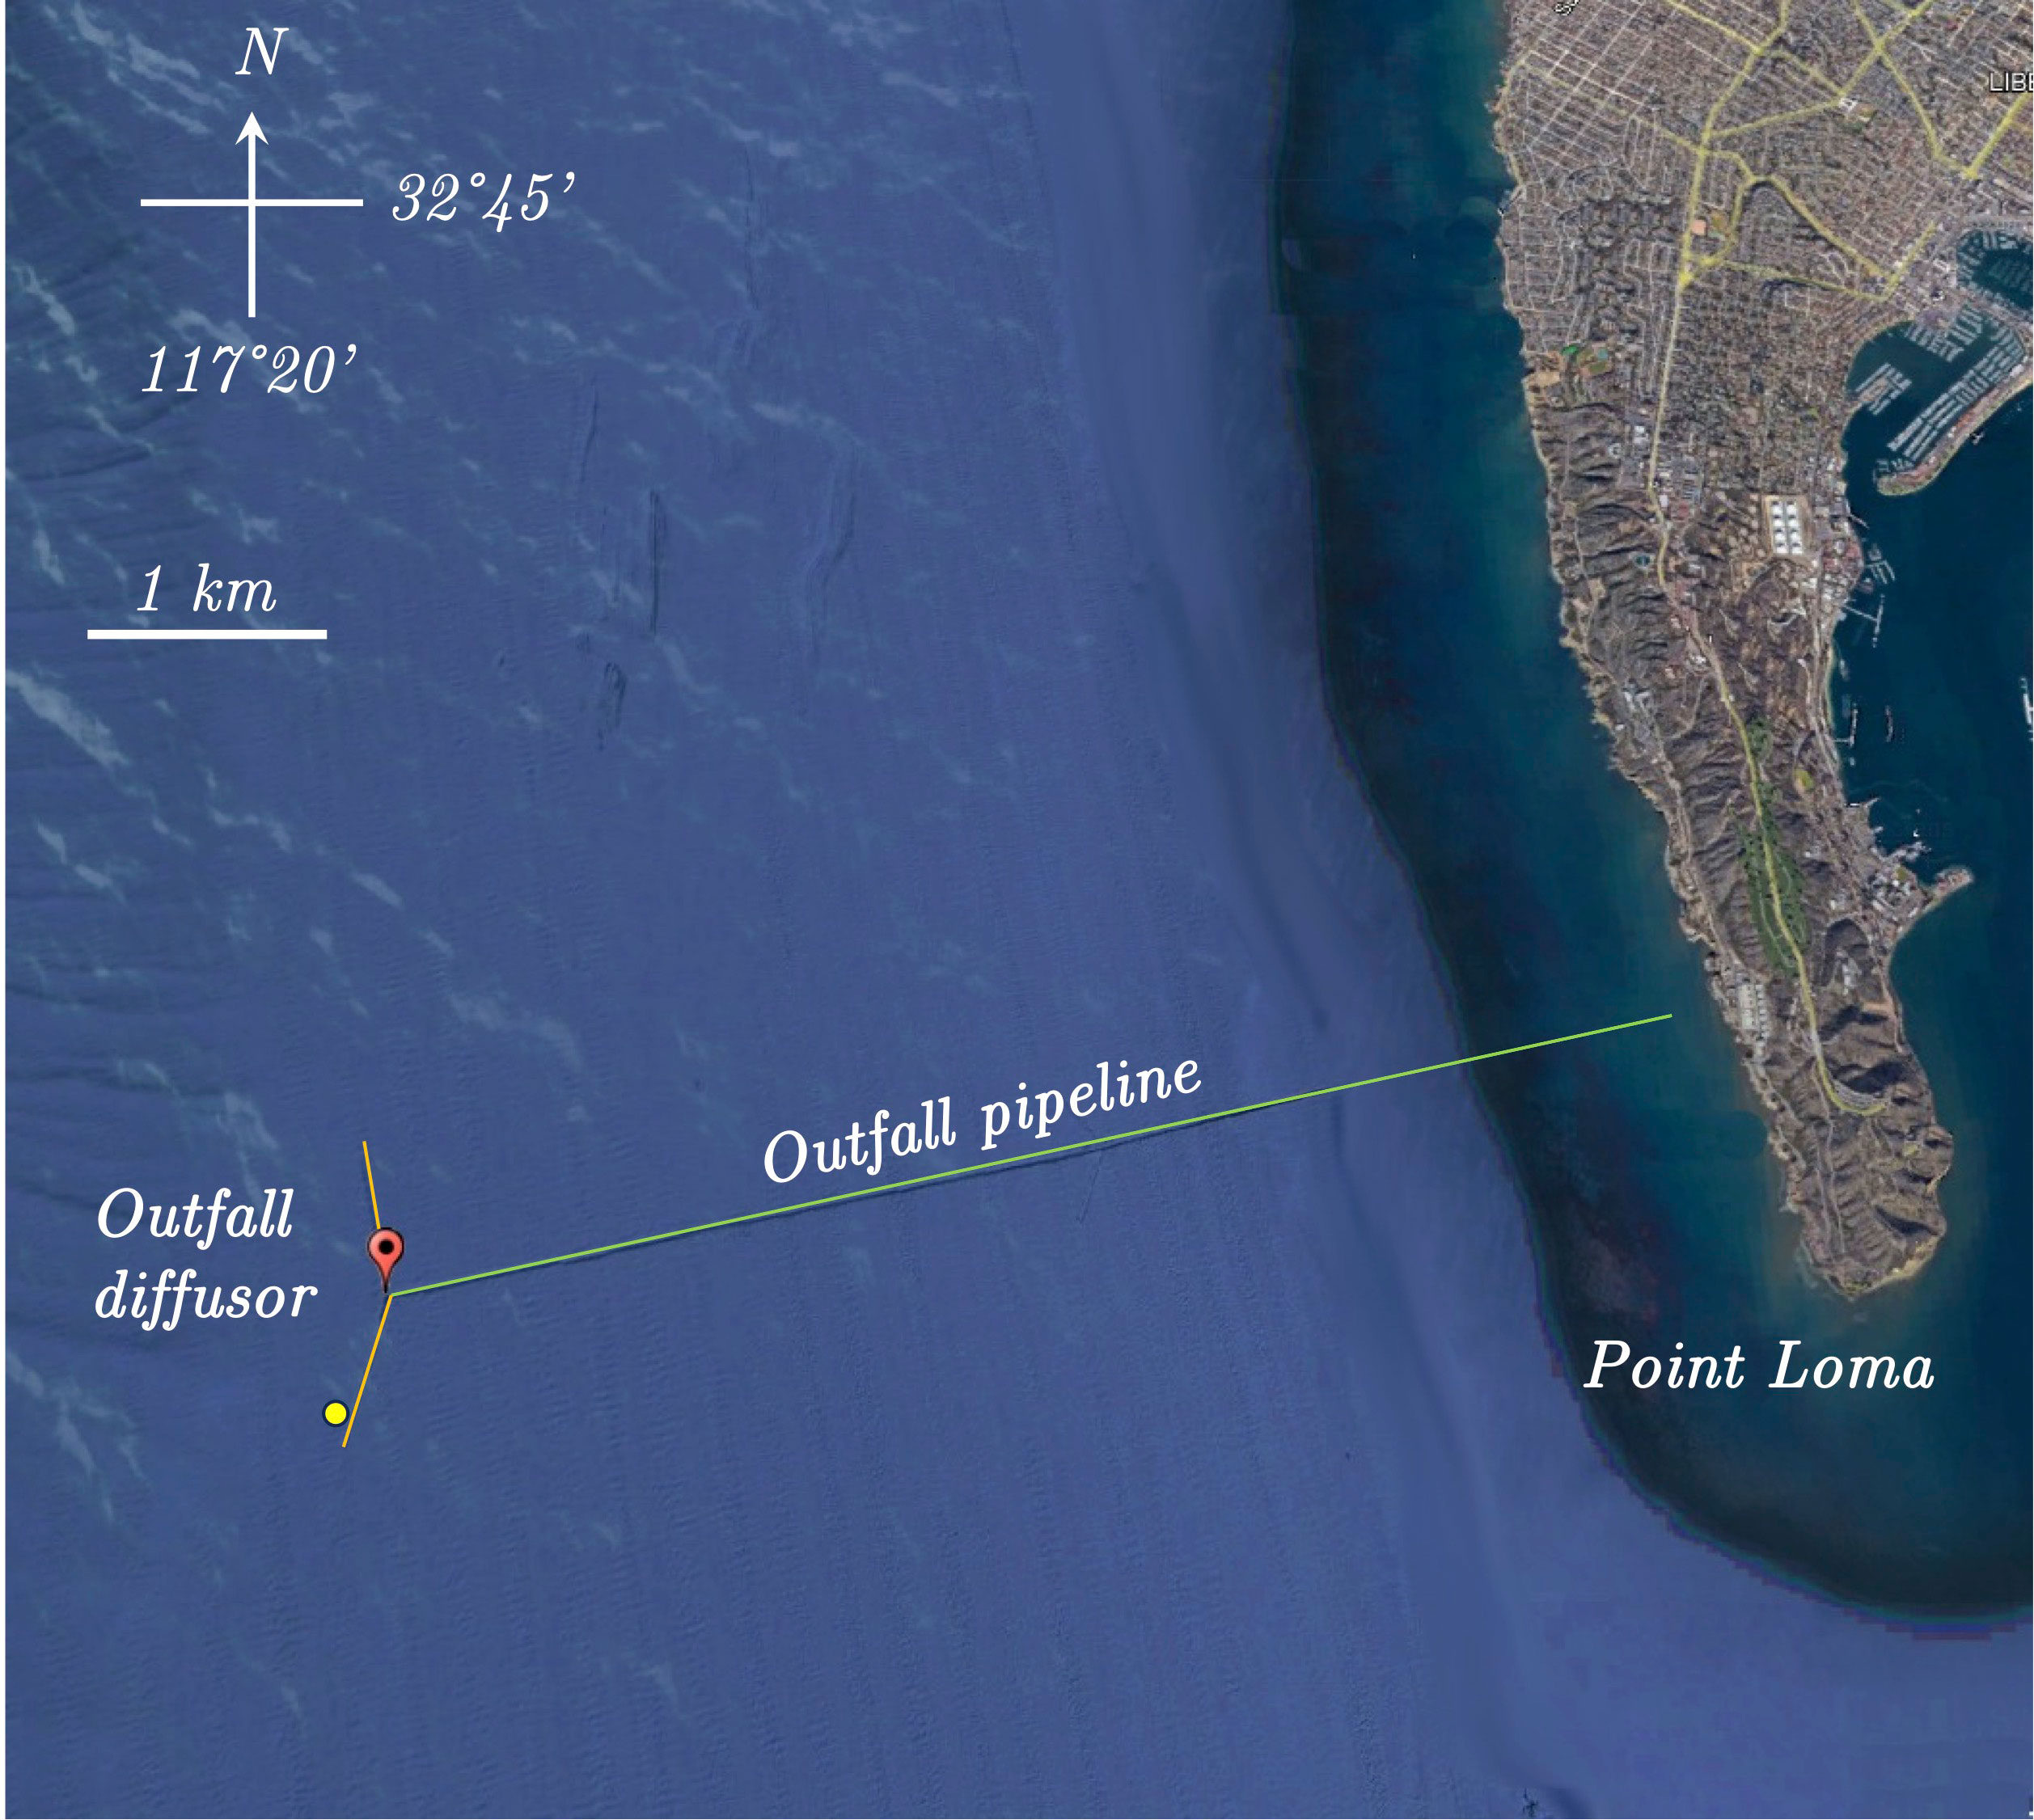
Figure 1 Location of study site, annotated on a GoogleEarth satellite image. The primary outfall pipeline is indicated by the green line, the diffusor branches at the west end of the pipeline are shown in orange. The red dot indicates the central location of the sampling grid. Yellow dot indicates the location of the Ocean Time-Series group instrument buoy and ADCP.
We conducted hydrographic and particulate sampling at the outfall diffusor location on May 23, 25, 26, 2023 from the R/V Beyster (Scripps Institution of Oceanography) which is equipped with dynamic positioning to maintain a geostationary position during winch operations. On May 23 and May 25, multiple sampling casts were made, starting centered on the outfall middle axis (Figure 1) and then moving in 500 m increments east, west then north and south each for a distance of 2 km (May 23) and in 50 m increments for a distance of 200 m on May 25. On May 26, continuous ‘yo-yo’ casts, profiling the water column from the surface to approximately 90 m were made from the central sampling station for a 5-hour sampling time series.
Hydrographic profiling was conducted with a Seabird Electronics SBE-19+ Conductivity-Temperature-Depth (CTD) recorder with attached SBE-43 dissolved oxygen sensor, and Wetlabs chlorophyll a fluorometer. The CTD, oxygen, and fluorometer sensors sample at 2 Hz continuously during descent and ascent. All sensors were factory calibrated. Data were post processed using Seabird software to remove points when the sensors were out of the water or during an initial ~60 second surface soak prior to descent, and to produce calibrated data from each sensor. Profile data were subsequently assembled and processed using Matlab scripts to produce individual casts and sectional views across space and time (for the yo-yo sampling on May 26).
The Pelagic Laser Tomographer (PLT) is a new, custom fabricated autonomous instrument designed to characterize the distribution of suspended particles and particle aggregates within the water column. The instrument uses a miniature high-resolution camera, a high-gain image intensifier, laser illumination and custom optics, power and microcontroller systems that together produce 3D scans of particles in a volume around the PLT as it traverses through the water (see instrument description in Stokes et al., 2023). The tomographic image data is post processed to produce a 3D volumetric visualization of the PLT path as well as dimensional statistics on the targets detected. The instrument was deployed attached to the exterior side of a rigid frame used to support a SeaBird Electronics CTD and fluorometer (Figure 2). The imaging plane of the PLT is a toroidal light sheet approximately 30 cm in radius, projected at right angles away from the mounting frame to minimize disturbance to the water column as the frame was deployed. During the sampling operations the PLT recorded particulate targets and its integrated sensor data at 2 Hz. Profiling winch speeds were slow (~10 cm s-1) in order to minimize disruptions to the flow field within the PLT imaging volume during sampling.
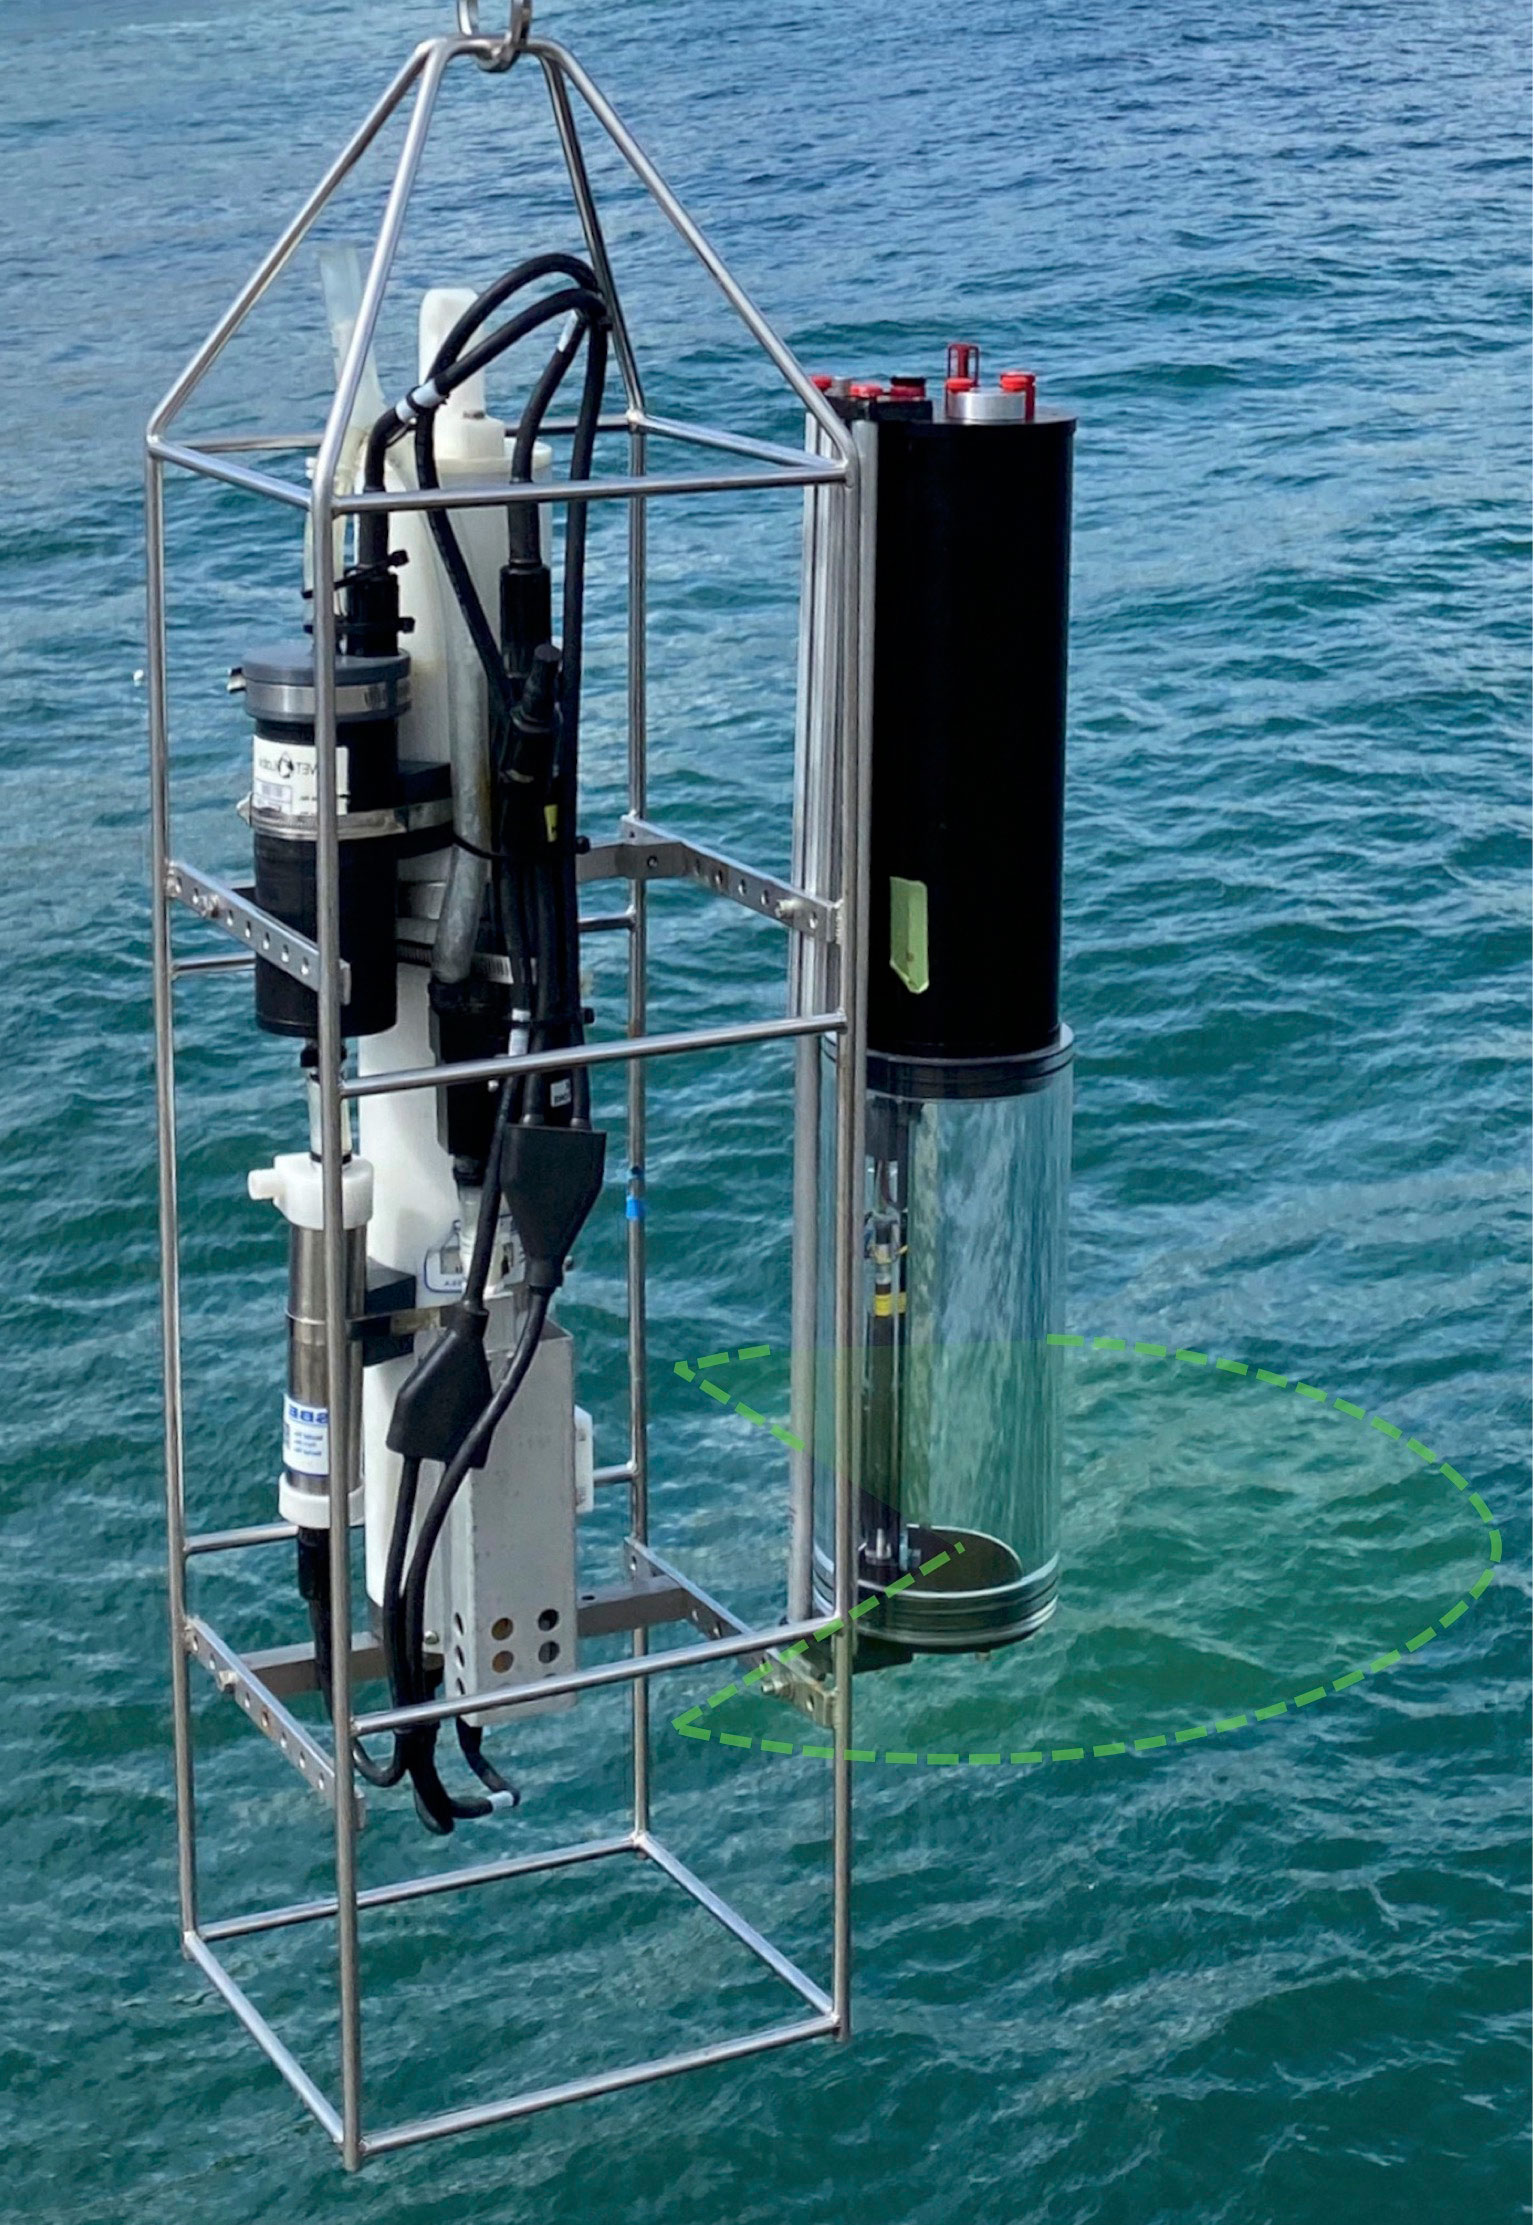
Figure 2 Image of the Pelagic Laser Tomographer (PLT) mounted onto the right side of the exterior frame supporting the CTD instrument package (SeaBird Electronics). The PLT imaging volume is outboard of the frame and indicated by the green shading.
Parameters output from processing the raw PLT data include the particle target depth, and spatial x and y location of particles imaged within the sampling area as well as each individual pixel coordinate making up a particulate target. These data were then processed using Matlab scripts into particle size and frequency vs. depth spectra which could be further processed into time series or spatial sectional views (see Davis and Sampson, 2002; Trauth et al., 2008). Individual particle analysis was conducted including estimates of particle solidity (defined as the particle area/particle convex hull) where values of 1 indicate a solid object and <1 indicate more irregularly bordered objects. Particle circularity (defined as the particle perimeter2/4·π·particle area) was also calculated where values close to one are closest to circular and >1 progressively elongate or irregular. The D-ratio, a dimensionless index derived from nearest-neighbor analysis was calculated for each tomographic slice to describe the degree of patchiness in particle spatial distributions (Davis and Sampson, 2002; Trauth et al., 2008). D ratios <1 indicate clumping in particle distributions, >1 indicate uniform distributions and ratios ~1 indicate random spatial distributions.
The city of San Diego, jointly with the Ocean Time-Series Group at the Scripps Institution of Oceanography, maintains an instrumented mooring which is located adjacent to the outfall. This includes a surface-mounted acoustic Doppler current profiler (ADCP – Teledyne RD Instruments Workhorse 300 kHz) as part of the water monitoring sensor suite on the mooring. Current velocity data for the study period was provided by the Ocean Time-Series Group. The data accessed here where the near real-time (raw) current meter records prior to quality controls and archiving, and thus include short gaps in the records near mid-night each data day. The data were contoured across the continuous time period of the PLT study and short gaps in the records result in vertical discontinuities each day when the time stamp records a new date. Real-time data and links to archived data can be found at: https://mooring.ucsd.edu/ploo/ploo_04/.
3 Results
As indicated in the ADCP velocity profiles (Figure 3) flow in the upper 50 m during the study period was predominantly southward (max. velocity ~ 0.4 m s-1) and towards the east with peak velocities ~ 0.2 to 0.5 m s-1 in a south-east direction. The direction of the predominant flow is consistent with flow approximately alongshore following the complex benthic topography of the Point Loma region. There is also evidence of lower velocities and some northward flow in the lower 40 to 50 m of the water column (bottom depth ~90 m at the mooring and current meter site) and without strong indications of shear in the alongshore flow. By contrast there is also clear evidence of oscillating eastward (onshore) and westward (offshore) in the East/West component of the flow field, and evidence of marked vertical shear in the onshore/offshore component. These observations are consistent with baroclinic internal tidal forcing in the lower ~40 m of the water column and shear associated with the thermocline/pycnocline located at ~ 40 to 50 m depth. Strong baroclinic forcing has been consistently observed in the vicinity of the Point Loma outfall and nearby locations along the coastline of San Diego and is a dominant component of the cross-shore and vertical velocities at this site. The baroclinic flows indicative of tidally driven motion are most evident in the lower 40 to 50 m of the water column and primarily in the easterly velocities cross-shore rather than the along-shore, north velocities.
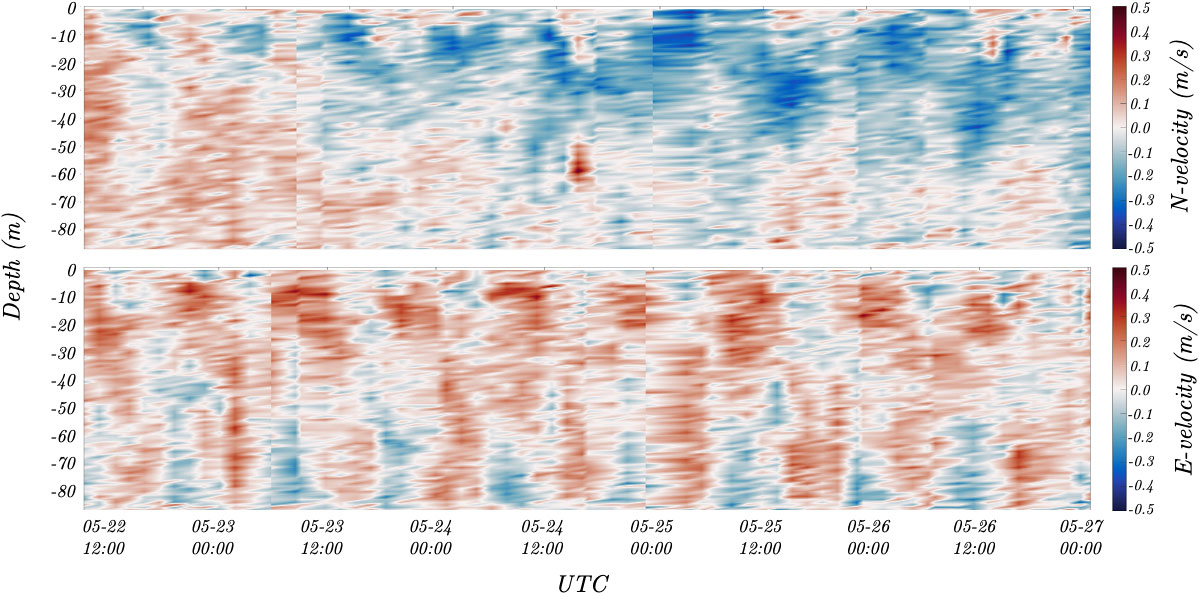
Figure 3 Water column current velocity vs. depth measured via an ADCP located adjacent to the study site, maintained as part of a real-time instrumented buoy in the Point Loma monitoring program by the SIO Ocean Time-Series group. Time is in UTC. During the period of this field study, water column flow was predominately to the south and east in the upper 50 m with tidal fluctuations. Note, because this study accessed near real-time data prior to quality controls, short gaps in data recording close to midnight each day appear as discontinuous vertical lines when the data are contoured continuously across time.
During the 5-hour time series on May 25, 2023, the water column shows stratification in temperature and salinity with depth (Figure 4), typical of coastal San Diego. The water temperature varied from approximately 17° C at the sea surface to approximately 11°C at 90 m depth. The calculated water column density varied from approximately 23 to 26 (sigma-t). There was a strongly delineated subsurface chlorophyll layer between approximately 20 to 50 m depth with chlorophyll concentrations approaching 5 µg L-1.
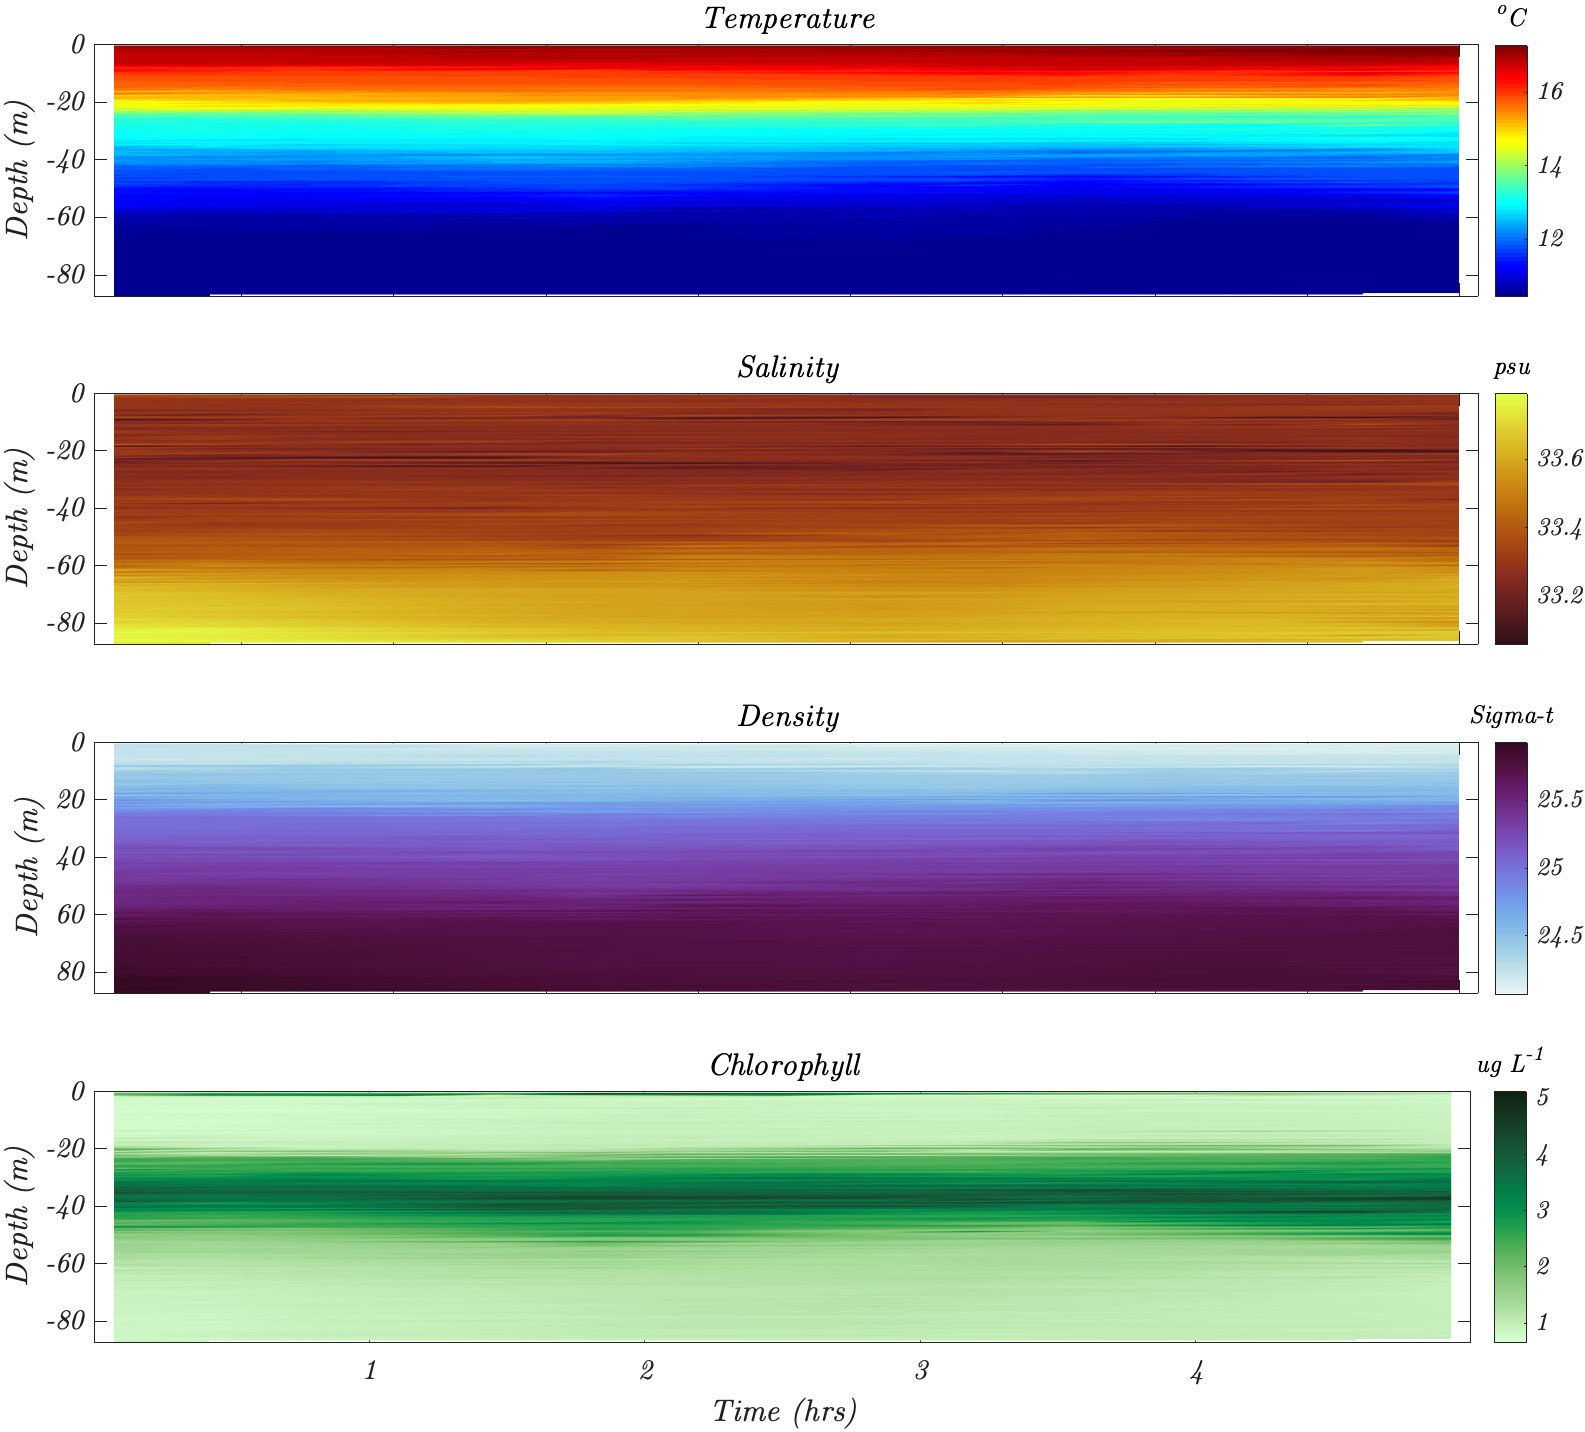
Figure 4 Time series of water column temperature, salinity, density and chlorophyll-a concentration vs. depth for an approximately 5-hour period on May 26, 2023 beginning at 10am, PST at a fixed position. Data was collected from the SeaBird Electronics CTD and Wetlabs fluorescence sensor (chlorophyll a) continuously profiling the water column at 10 min intervals.
The distribution of suspended particulate during the time-series sampling on May 26 was strongly stratified by depth (Figure 5), with the smallest particles (< 100 µm) present in high concentrations from the surface to approximately 45 to 50 m depth. Larger particles are less concentrated shallower than 20 m depth and decrease in number below 50 m. The layering of suspended particulate was mostly coherent over the 5-hour time series, however, pulses in particle concentration from < 10 particles L-1 to > 100 particles L-1can be seen especially near the base of the particulate layer and these varied over approximately 10 min (the time for a single hydrographic cast) to hourly time scales.
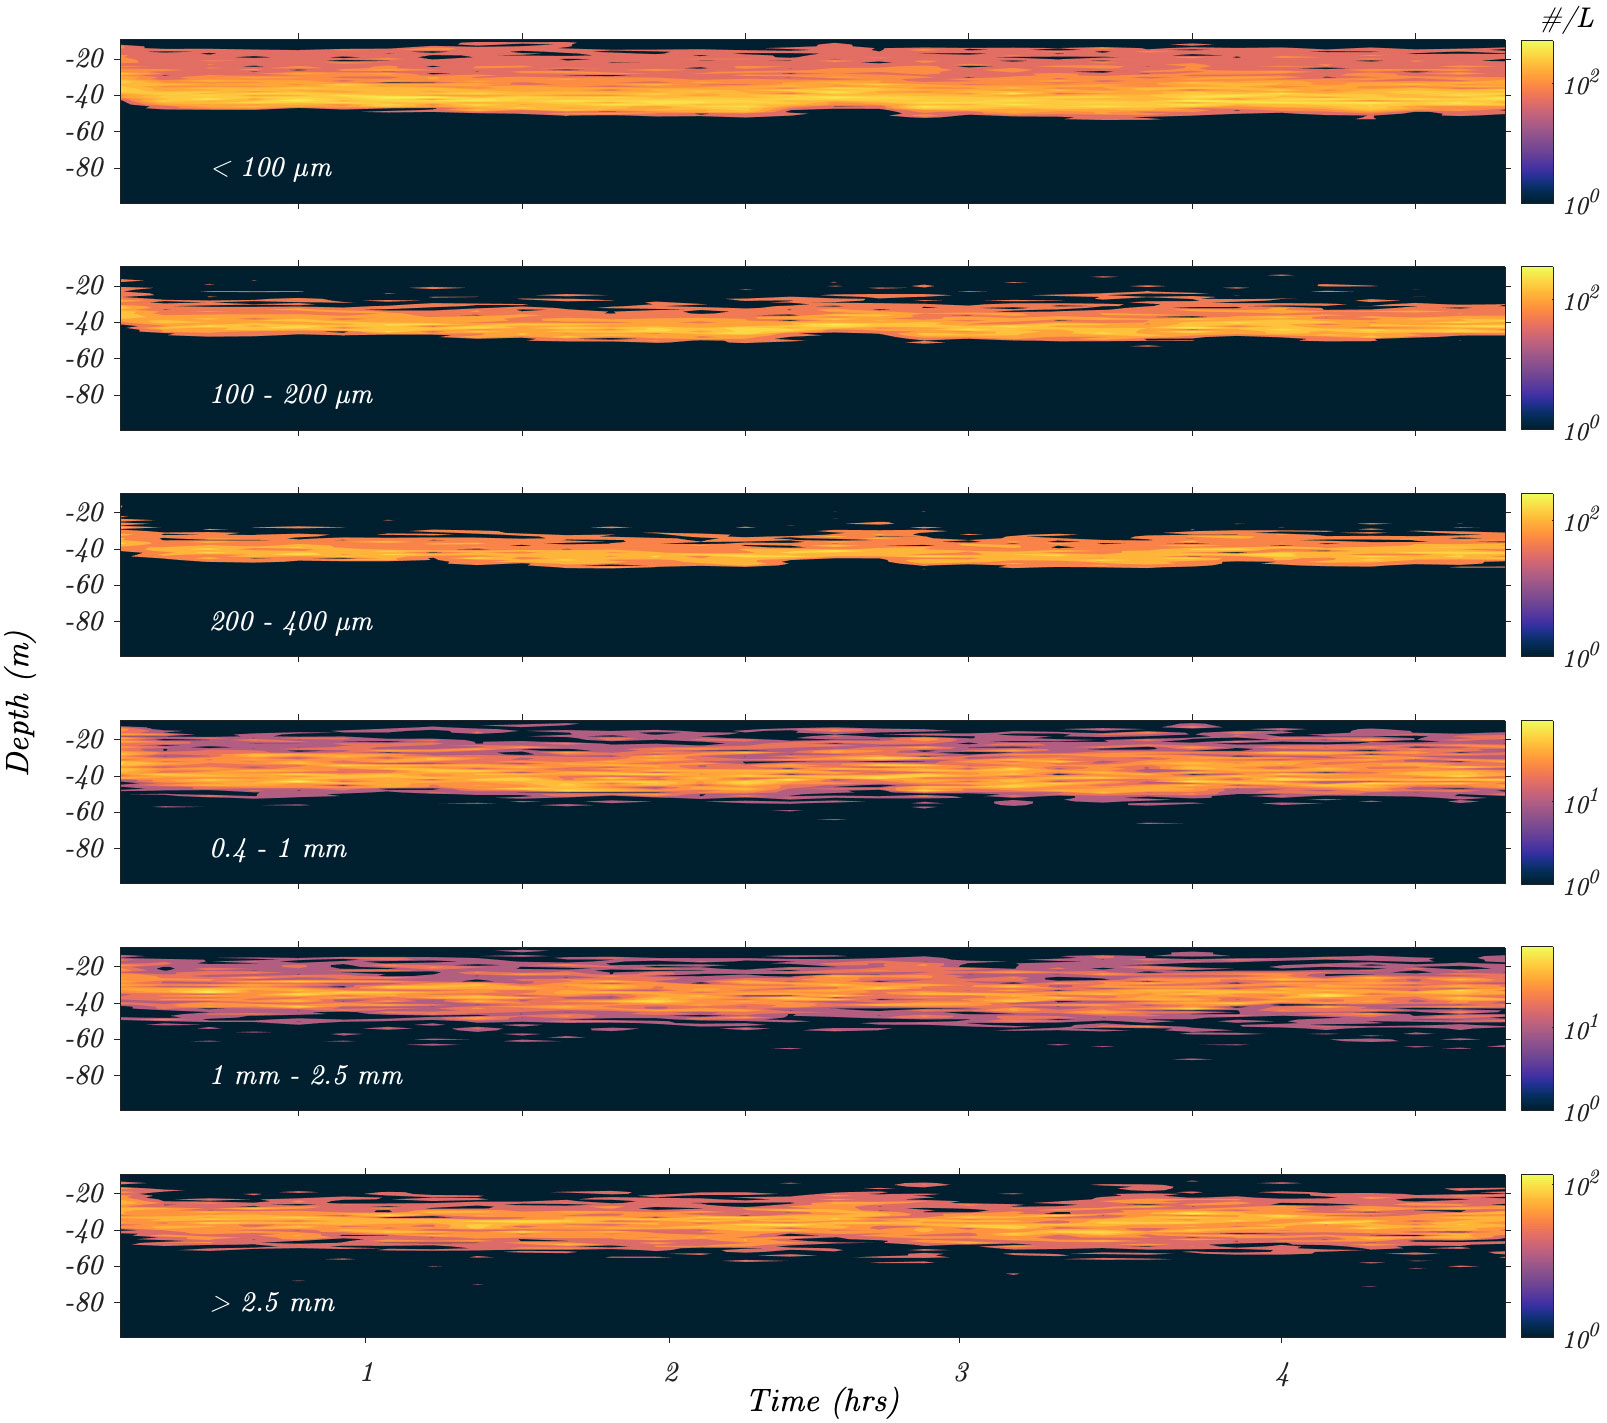
Figure 5 Time series of water column particulate concentrations collected concurrently with CTD data (Figure 4) by the PLT. Particulates have been binned by size (<100 µm, 100-200 µm, 200-400 µm, 0.4-1 mm, 1-2.5 mm, > 2.5 mm).
The temperature vs. salinity plot (Figure 6) of the hydrographic data from all 3 sampling days shows large scatter and is indicative of mixing within a stratified water column, as expected in this coastal zone and may also be influenced by the wastewater discharge plume. Distinct water masses with unique temperature and salinity signatures are apparent, as clearly evinced by the pattern of high chlorophyll a (i.e., 2 – 6 µg L-1) primarily confined to isopycnals around 25 (sigma-t). These are evident in the red and yellow points on the T-S plot coded by concomitant chlorophyll a concentration.
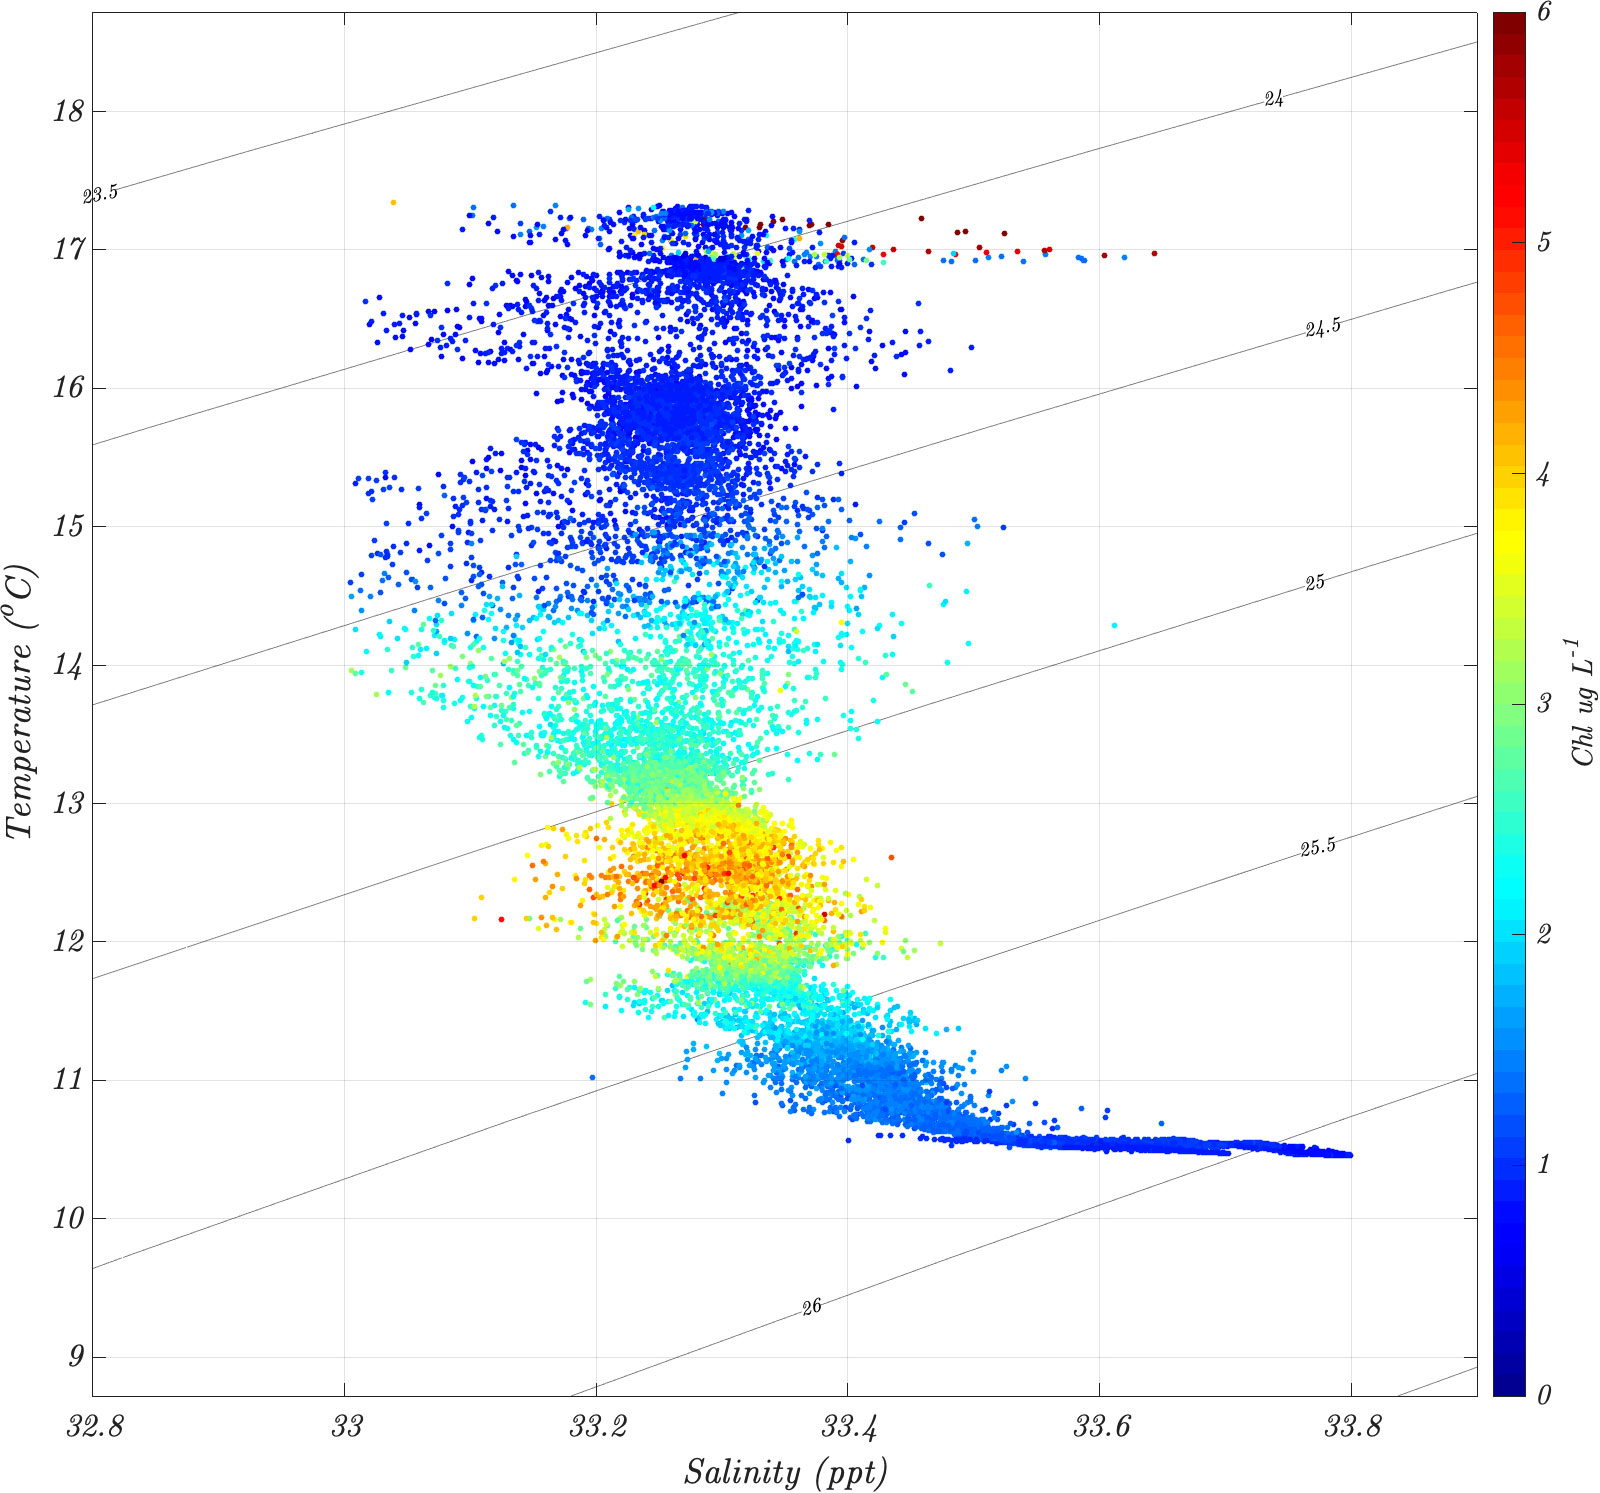
Figure 6 Temperature vs. Salinity for May 26, 2023, sampling period (Figures 4, 5). Isopycnal lines are in Sigma-theta notation. Data points are color-coded by chlorophyll concentration.
Along 400 m cross sections (Figures 7, 8) variations in the distribution of suspended particulates are evident. Layers of low and high particulate concentration can be seen extending over 10’s m in both the along-shore (N to S) and cross-shore (W to E) directions. An increase in the depth range of highest concentrations of particulates, particularly in the larger diameter particulates (> 1 mm) can be seen trending southward along the N-S axis of the pipeline diffusors, and above the diffusor axis (red arrow in Figure 8). The concentration data are plotted on a logarithmic scale indicated by the color axis. It is important to note that the low concentrations in deeper water evident in Figures 5, 7, 8 are not zero, but are exponentially lower than the high concentrations closer to the pycnocline and thus appear as dark areas on the logarithmically scaled plots.
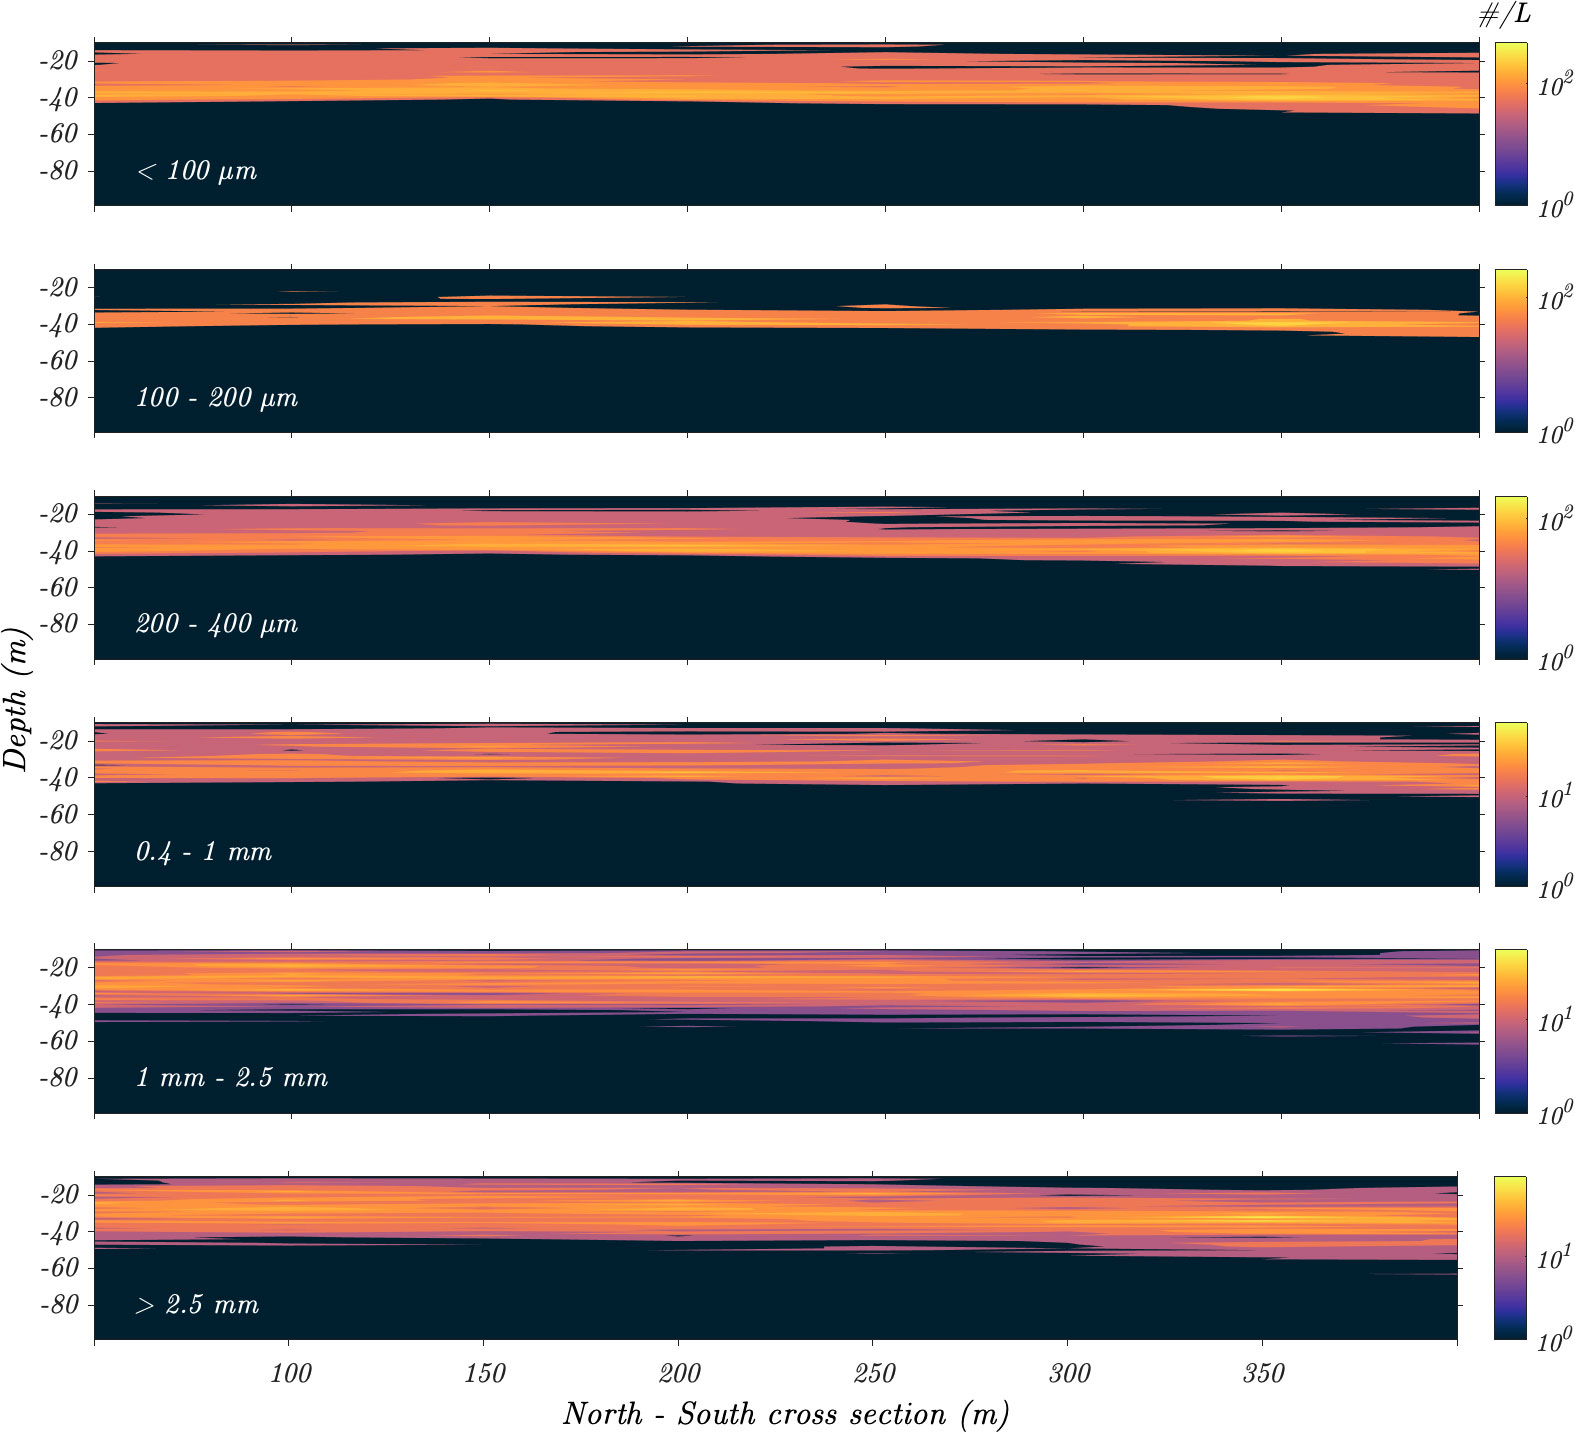
Figure 7 Water column particulate concentrations on May 25, 2023, collected from a north to south transect along the outfall diffuser. PLT and CTD casts were collected at 50 m intervals. Particulates have been binned by size (<100 µm, 100-200 µm, 200-400 µm, 0.4-1 mm, 1-2.5 mm, > 2.5 mm).
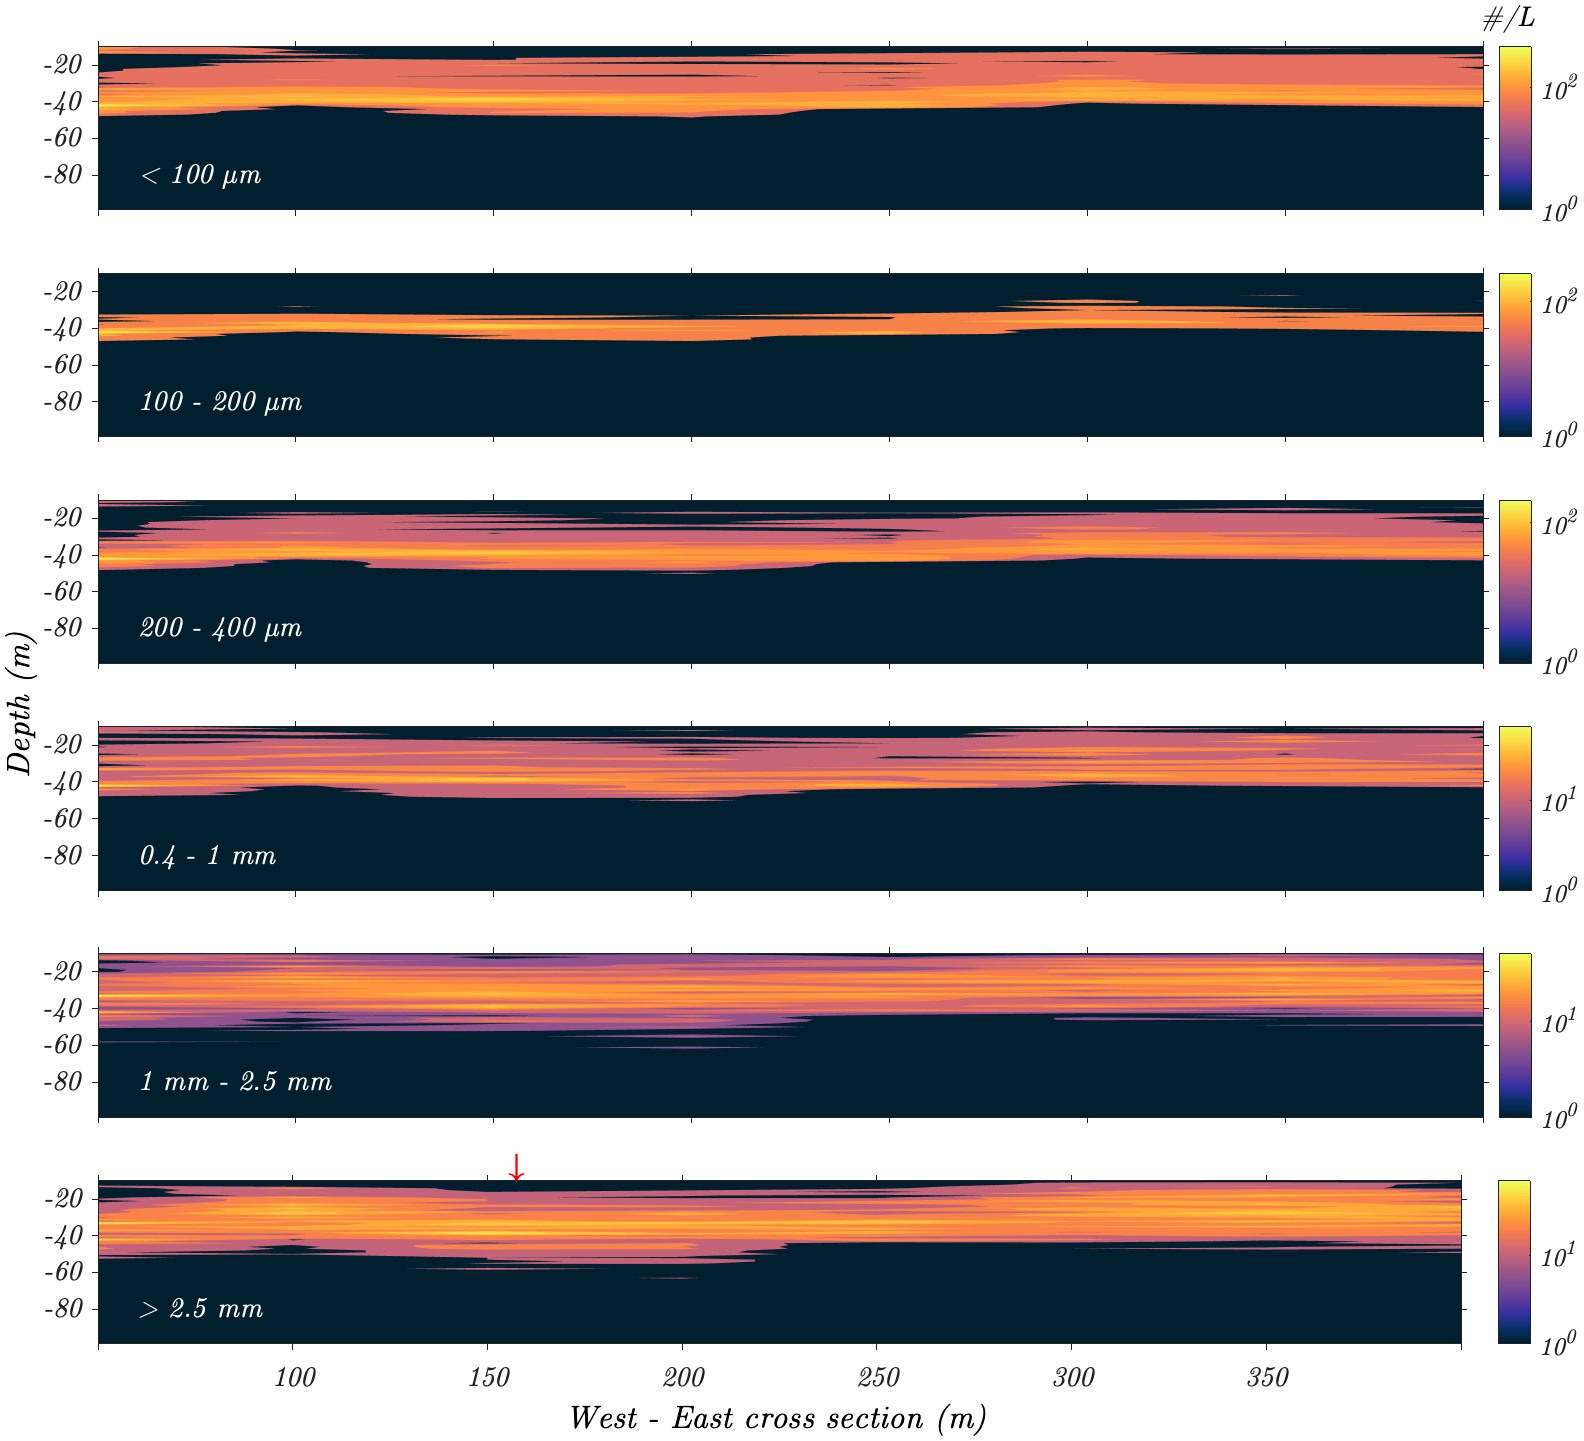
Figure 8 Water column particulate concentrations on May 25, 2023, collected from a west to east transect across the long axis of the outfall diffuser. PLT and CTD casts were collected at 50 m intervals. Approximate axis of the diffusor shown by the red arrow. Particulates have been binned by size (<100 µm, 100-200 µm, 200-400 µm, 0.4-1 mm,-2.5 mm, > 2.5 mm).
The distribution of suspended particulates (which includes both natural and anthropogenic particles and aggregates) from a single cast shows variation with depth, as would be expected although not typically visualized in standard hydrographic sampling (Figure 9). The concentration of the smallest particulates (~100 µm diameter) detected by the PLT is higher than the larger particulate (i.e., > 1 mm) and tends to decrease with depth. Particulate concentrations are higher in the upper 40 m and show a peak concentration at approximately 30 m depth. The peak in particulate concentration coincides with the peak of the chlorophyll maximum layer (from approximately 25 to 35 m depth), and small variations in particulate concentration track variations in water column density associated with water temperature and salinity. The single particle measure of solidity suggest that suspended particulate targets (which includes aggregates) include more particulates with irregular voids and less solid mass (solidity values < 1) and more elongate forms (circularity > 1) in the upper 40 m of the water column and tending to become more solid and spherical below the chlorophyll maximum layer. The particulate spatial distribution tends to be more spatially clumped (D-ratio < 1) through the chlorophyll maximum layers and tending to be more randomly distributed in suspension shallower and deeper in the water column.
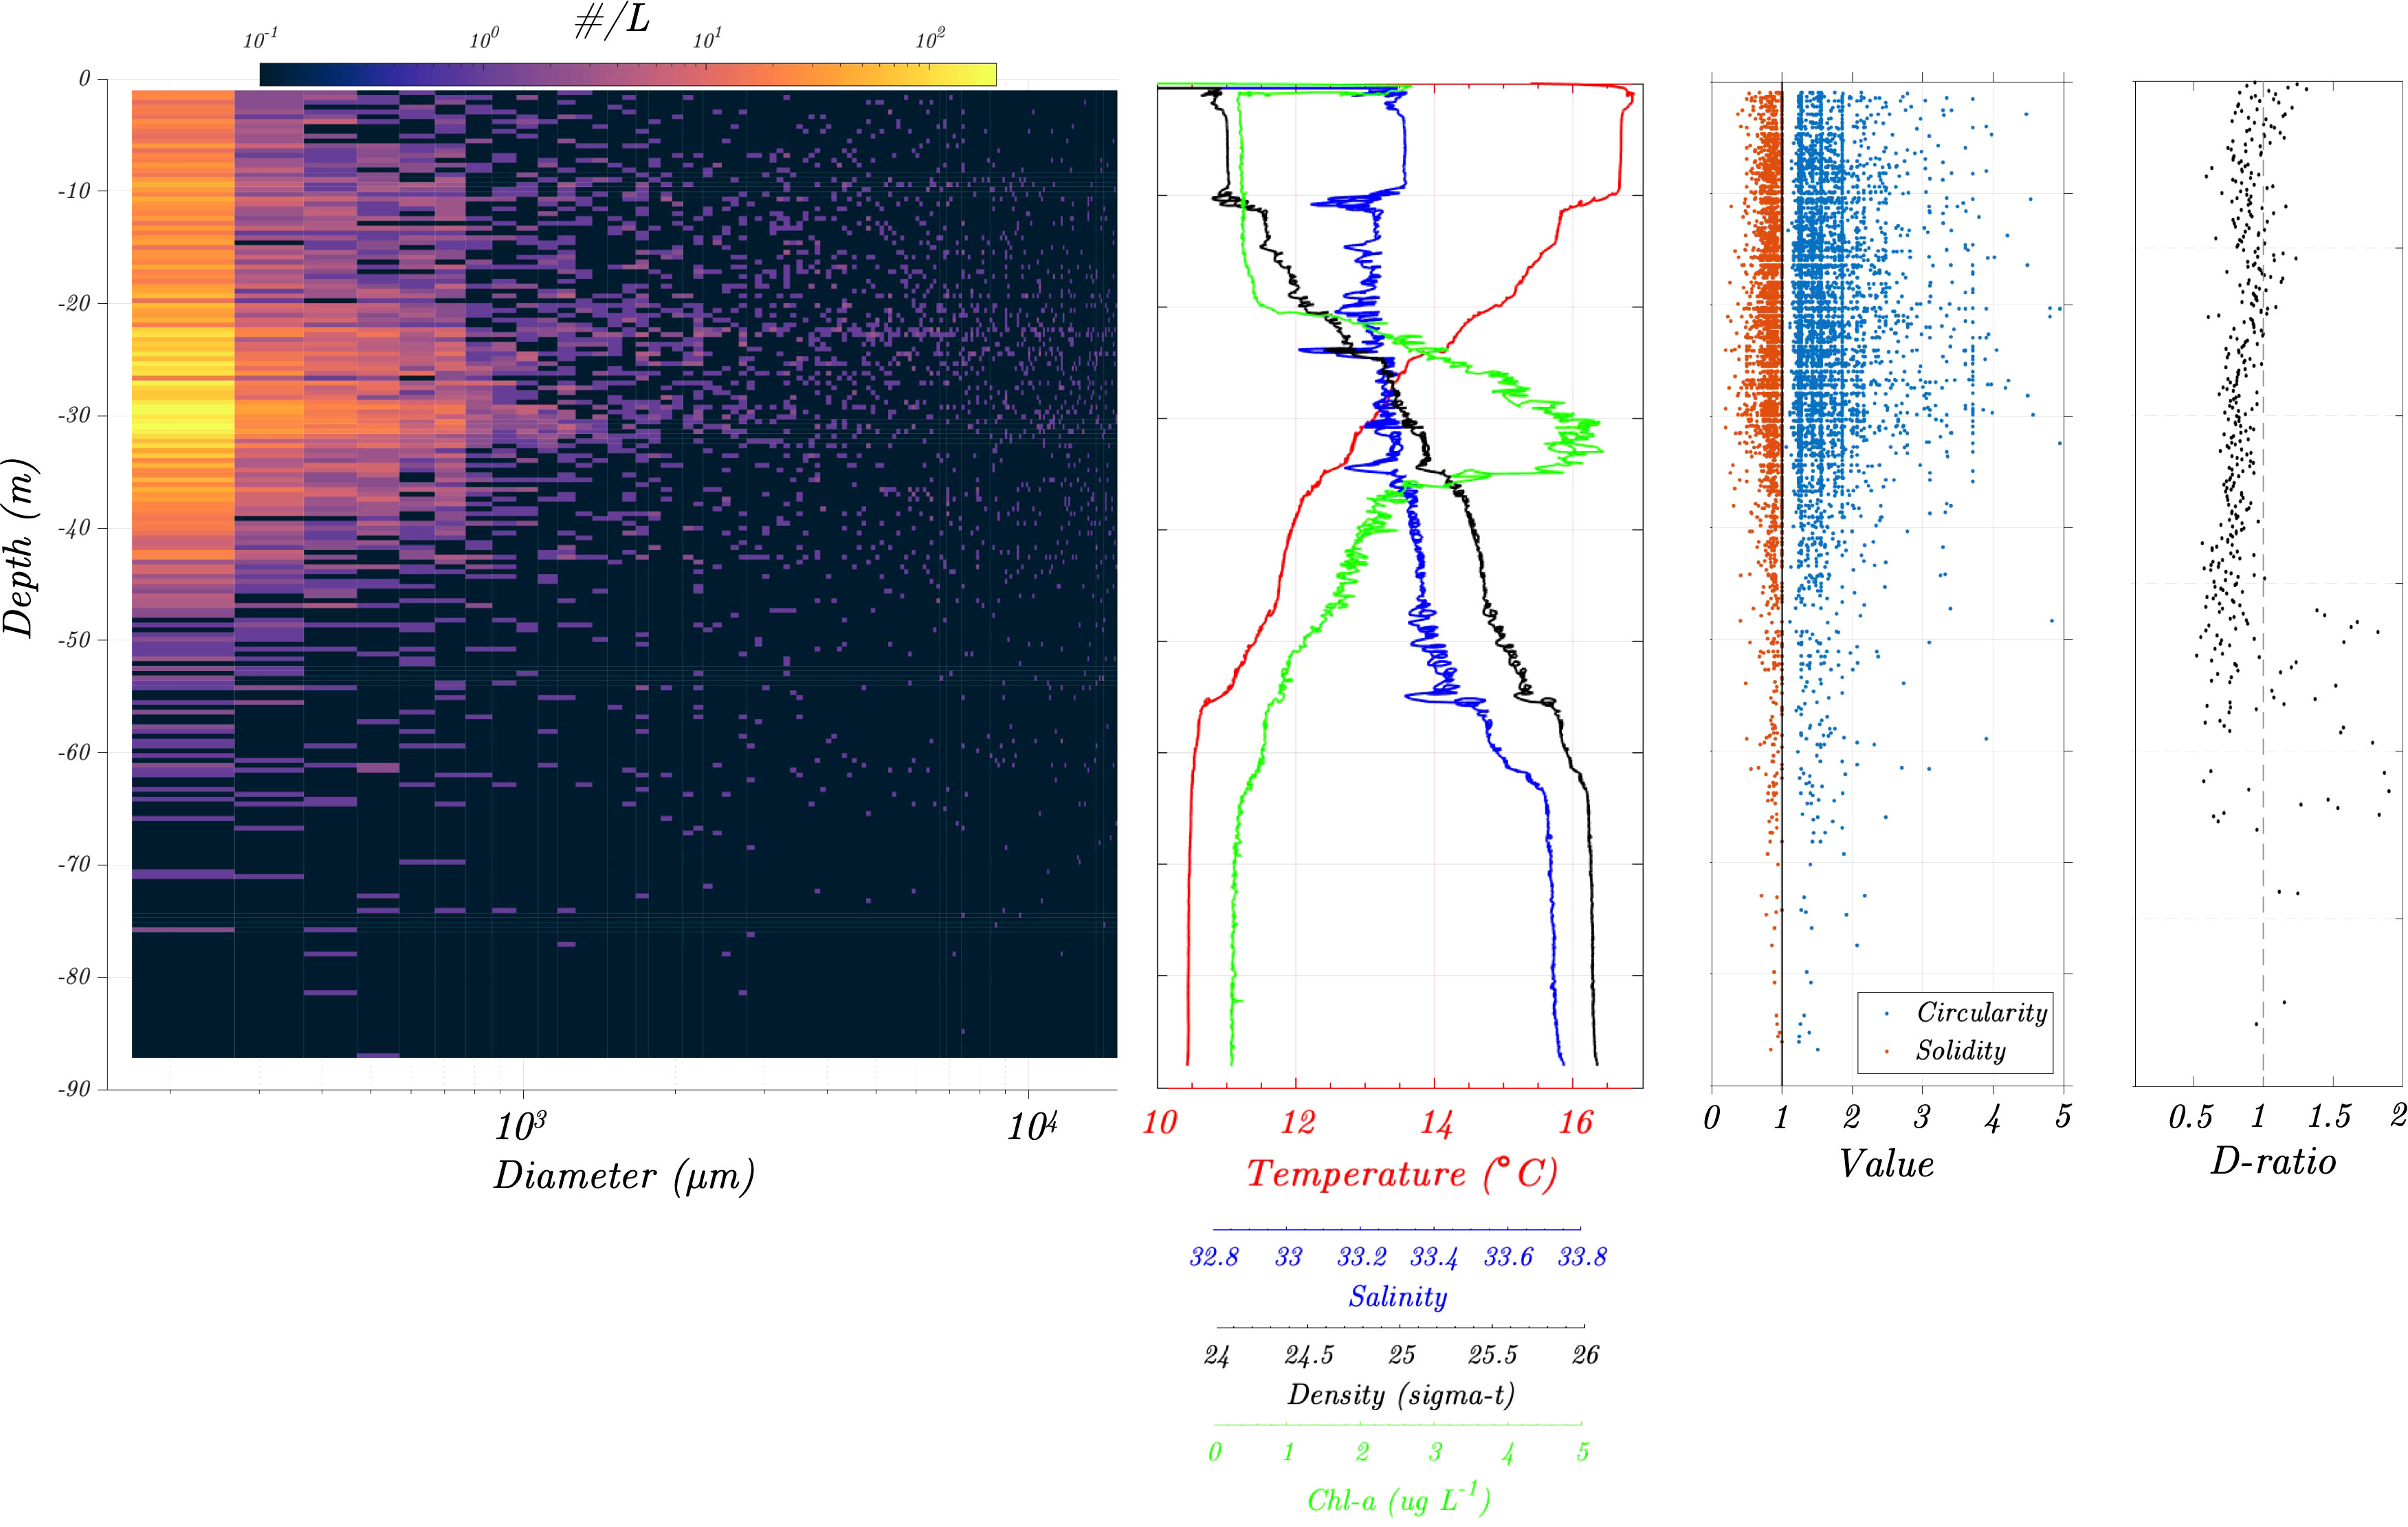
Figure 9 Example data from a single cast, May 25, 2023 (red arrow Figure 8). At left, particulate concentration size spectrum (~ 100 µm bin size) with depth. Center column indicates coincident CTD data (salinity, temperature, density and chlorophyll concentration). Right columns indicate single particle parameters: circularity, solidity (circularity > 1, are less spherical and more elongate, and solidity <1 are less solid with irregular boundaries) and the spatial D-ratio (<1 indicates clumped particulate distributions, ~1 indicate random particulate distributions, >1 indicate more uniform spatial distributions).
4 Discussion
Ocean particle size spectra and their variation across depths are driven by, and therefore can provide insight into ecosystem trophic dynamics, carbon and nutrient cycling, sediment transport, and sources of contaminants in marine and aquatic systems. Here the ability to quantify vertically resolved particle distributions co-located with hydrographic data in the vicinity of a wastewater outfall provides a novel opportunity to consider interacting environmental background signals with potential anthropogenic impacts in an energetic and dynamic coastal setting. The current meter and hydrographic observations illustrate the dominant alongshore flows of surface waters, as well as the persistent cross shore baroclinic variation typical of coastal sites in southern California influenced by strong internal tides long recognized as important sources of mixing in the nearshore (e.g. Summers and Emery, 1963; Lerczak et al., 2003; Becherer et al., 2020). The particle distributions upstream, and at the stations further from the outfall provide a view of the natural distributions associated with coastal ocean processes in this region, while patterns at stations closer to the outfall are suggestive of combined natural and anthropogenic influences. In association with the downstream (Figure 7) and cross shore locations (Figure 8) closer to the outfall we see evidence of increasing depth of regions of high particle concentrations, particularly for the larger size classes of particles. This suggests locations closer to the outfall may have a tendency for the combined effects of particle discharge directly from the outfall and aggregation formation associated with mixing of plume effluent with the coastal background waters.
Instruments, like the PLT, which facilitate in situ analysis can also provide insight into particle dynamics not available from traditional instrumentation. As indicated in Figure 10, which identifies depth and spatial patterns in particulate diameter, solidity and circularity along the sampling transects, particles are not necessarily constrained by water density as they are advected near the outfall. Mean particle diameters tend to be greater at or below the chlorophyll maximum as well as being less solid (<1) however, there is considerable patchiness in the distribution perhaps as a result of the numerous outfall vents situated along the pipeline as well as small scale vagaries in the current flow field. It should be noted that the PLT data cannot differentiate between particle targets that are biotic (living or dead) and abiotic. Some of the large particles identified by the PLT, i.e., > 1-2 mm in size are found in varying concentration throughout the water column are suggestive of either free-swimming plankton, or low-density aggregates and flocculants with settling velocities much lower than an equivalently sized mineral or metallic particle which subsequently would be expected to sediment out of the water in the low current velocities measured along the coast.
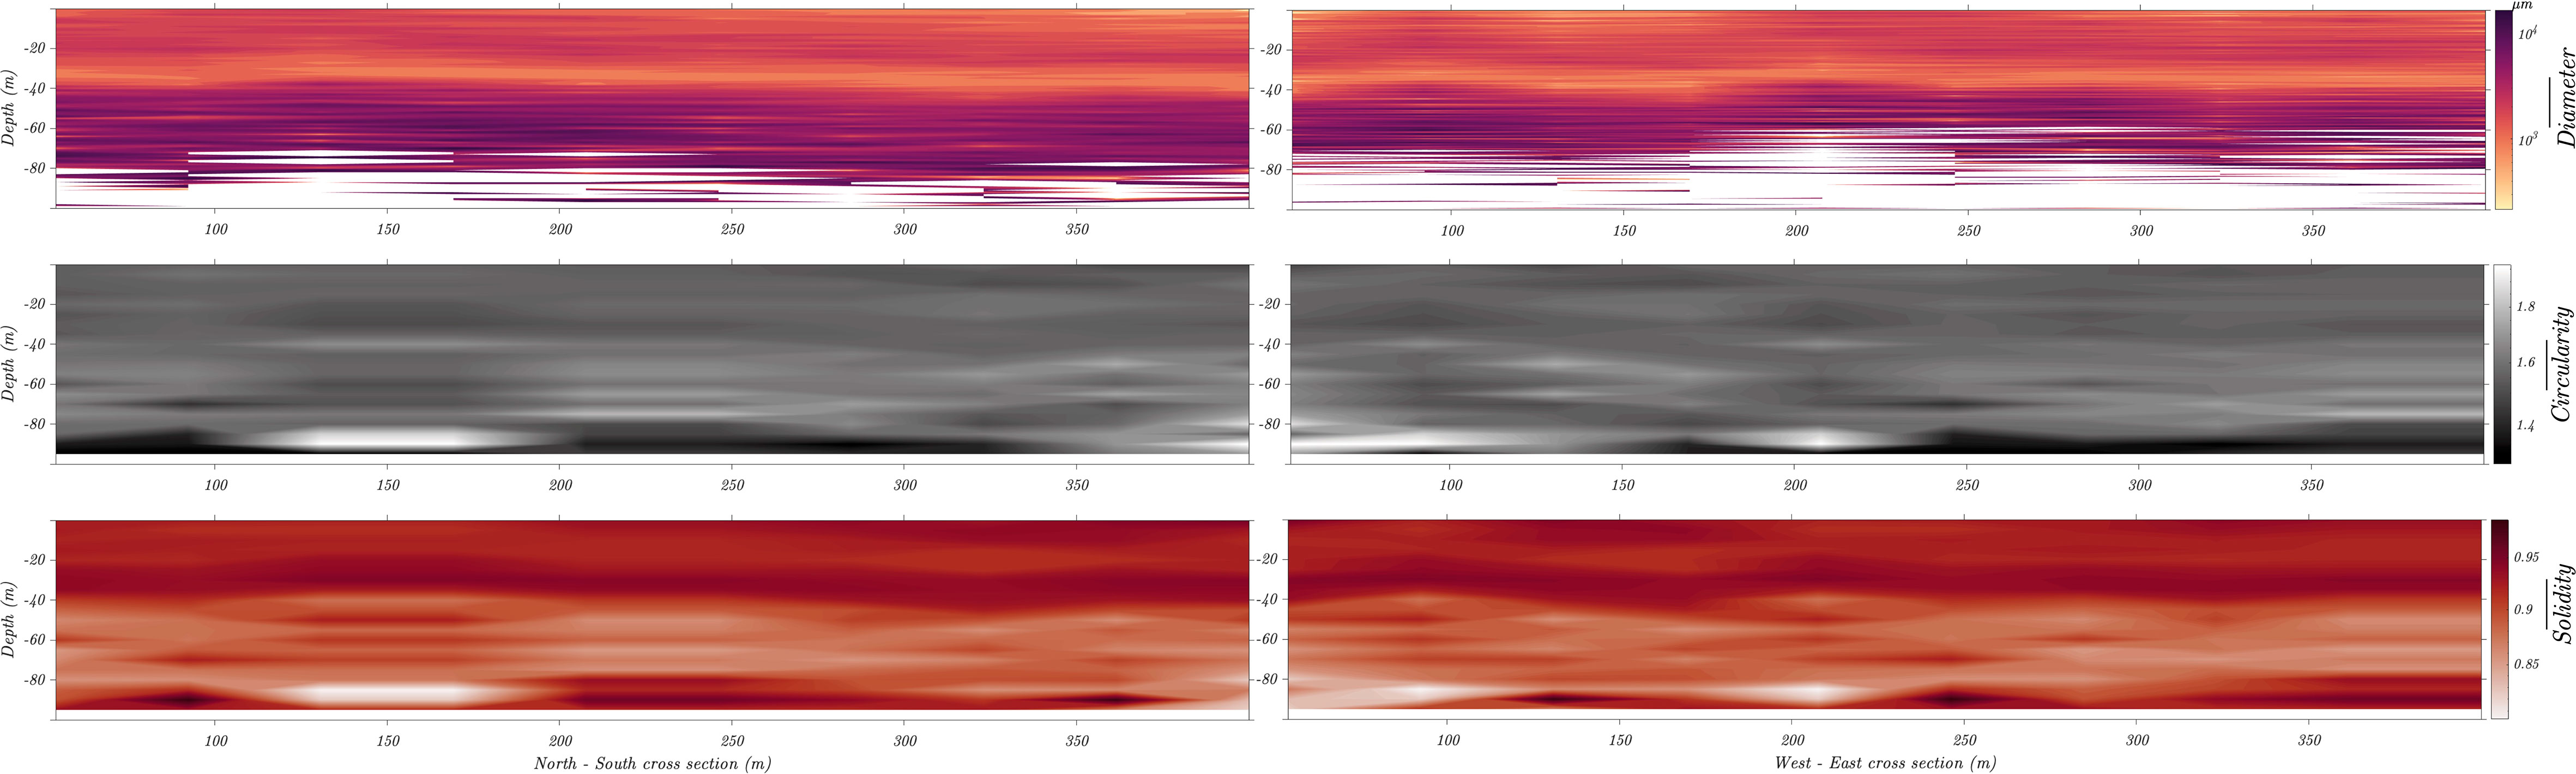
Figure 10 Particulate summaries (mean diameter, mean solidity, and mean circularity) from the water column on May 25, 2023, collected from a north to south transect along the outfall diffuser and from a west to east transect across the long axis of the diffusor (see also Figures 7–9). Sample casts were collected at 50 m intervals. Sparse data was binned in ~ 1 m depth intervals.
The time varying spatial distribution of an effluent plume is difficult to track and map particularly with fixed station sampling designs (e.g., Terrill et al., 2009; Rogowski et al., 2012). The height to which a wastewater diffuser plume rises in the ocean can vary dynamically depending on a range of factors, including the design of the diffuser, the characteristics of the wastewater being discharged, and the environmental conditions at the discharge site. Time series data of particulate distributions from the PLT illustrate the temporal variability in plume characteristics in the water column near the outfall, in a manner not feasible from single point (in space and time) methodologies. The autonomous underwater vehicle (AUV) studies by Rogowski et al. (2012) at the Point Loma outfall showed that a properly equipped AUV was able to map the outfall plume at a spatial resolution not feasible via traditional boat-based hydrographic casts, however, an AUV is not able to monitor the dynamics of plume interactions with the surrounding water with the same temporal fidelity as a continuously profiling stationary sampler like the PLT. Both sampling platforms are able to resolve the oceanographic conditions (currents, tides, internal waves etc.) that influence the rise of the buoyant effluent plume jet and then its shear-enhanced mixing as the plume reaches its density equilibrium with the surrounding ocean. The complex and variable mixing of the effluent plume with the local water is reflected in the scatter evident in the T-S plot in Figure 6. Temperature and salinity show high scatter most likely due to the mixing of the fresh, buoyant plume within the stratified, denser coastal waters over a 5-hour period. We note that some of the scatter in the warmest waters (around 17° C, the approximate sea surface temperature during the sampling days) may be due to sampling errors induced by boat motion and bubble plumes injected around the sampling frame when close to the surface.
Previous studies of the Point Loma outfall have indicated that the effluent plume typically spreads horizontally into a wastefield at approximately 70 m depth (City of San Diego, 2015). This depth is controlled by the density stratification due to salinity and temperature gradients in the water column during the dilution and mixing of the ejected wastewater and varies throughout the year. The stratification is modified on shorter spatial and temporal scales by internal tides, internal wave and wind-induced upwelling. Due to the location of the outfall near the edge of the Californian mainland shelf, the net transport of the effluent plume is controlled by the net southward flow of the California Current near the surface and by the slower, net northward flow of the California Undercurrent near the benthos, superimposed with the aforementioned local fluctuations in water column structure. The primary direction of the plume transport is approximately north south following the local coastal isobaths. The cross-shelf transport of the plume is likely to be significantly more influenced by processes (like internal waves) that vary at tidal or shorter periods.
In addition to the specific application described here, that of sampling particle distributions in the vicinity of an outfall site, the PLT or similar technology can be applied to a broad range of problems in coastal and open ocean research. While particle concentrations can be sampled via traditional hydrography with depth-specific bottle sampling and subsequent capture onto filters, these cost and time intensive techniques have limited vertical resolution and limited ability to differentiate particle size spectra. Here, a large-volume optical approach yields highly resolved views of particles that can be analyzed among specific size classes across an entire water column profile. Combining the PLT with a standard CTD, or in future with a range of additional sensors, would provide the novel ability to consider relationships among particle distributions and environmental factors associated with distinct water masses. The PLT design is flexible and not limited to the current configuration with the CTD and associated frame. We envision future applications including configuration with autonomous underwater vehicles (AUVs) for high resolution 3-dimensional mapping (see Picheral et al., 2022), and configuration with fixed location moorings for detailed time series studies, or configuration onto autonomous drifter profilers or ocean gliders and multi-vehicle and robotic sampling efforts (Faria et al., 2014; Ferreira et al., 2019). The PLT would be ideally suited for short term (< 8 hr) robotic surveys of outfall regions as it could provide a spatial context to what is traditionally conducted as spot sampling from a limited number of locations. Longer duration surveys would require an expansion of the instrument memory, or an increase in the PLT frame sampling interval with a concomitant decrease in spatial resolution. This new frontier in mapping particle size spectra is likely to compliment, rather than replace, traditional and developing oceanographic research methods.
Data availability statement
The raw data supporting the conclusions of this article will be made available by the authors, without undue reservation.
Author contributions
MS, JL and DN all contributed to the conception and design of the study. DS and JL performed field data collection and post-processing of the instrument data. DN created the custom software for the processing of PLT data and processed the raw PLT field data. DS and JL performed statistical analysis and wrote the first draft of the manuscript. All authors contributed to manuscript revision, read, and approved the submitted version.
Funding
This research was made possible by grant support to the authors by the Seaver Institute and National Science Foundation award OCE1924467.
Acknowledgments
The authors wish to thank Captain Brett Pickering of the R/V Beyster (Scripps Institution of Oceanography) for his able assistance during the field sampling program. In addition, the authors wish to thank USN midshipmen Cecilia Wheeler and Eric Esqueda for their assistance in the field and during the processing of acquired CTD data. The authors would also like to thank Uwe Send and Jeffrey Sevadjian of the SIO Ocean Time-Series Group for access to ADCP data at the study site.
Conflict of interest
The authors declare that the research was conducted in the absence of any commercial or financial relationships that could be construed as a potential conflict of interest.
Publisher’s note
All claims expressed in this article are solely those of the authors and do not necessarily represent those of their affiliated organizations, or those of the publisher, the editors and the reviewers. Any product that may be evaluated in this article, or claim that may be made by its manufacturer, is not guaranteed or endorsed by the publisher.
References
Ahmed W., Hamilton K., Toze S., Cook S., Page D. (2019). A review on microbial contaminants in stormwater runoff and outfalls: Potential health risks and mitigation strategies. Sci. Total Environ. 692, 1304–1321. doi: 10.1016/j.scitotenv.2019.07.055
Becherer J., Moum J. N., Colosi J. A., Lerczak J. A., McSweeney J. M. (2020). Turbulence asymmetries in bottom boundary layer velocity pulses associated with onshore-propagating nonlinear internal waves. J. Phys. Oceanogr. 50 (8), 2373–2391. doi: 10.1175/JPO-D-19-0178.1
Carvalho J. L., Roberts P. J., Roldão J. (2002). Field observations of Ipanema Beach outfall. J. Hydraulic Eng. 128 (2), 151–160. doi: 10.1061/(ASCE)0733-9429(2002)128:2(151
City of San Diego (2015) Application For Renewal of NPDES CA0107409 and 301(h) Modified Secondary Treatment Requirements (POINT LOMA OCEAN OUTFALL). Available at: https://www.sandiego.gov/sites/default/files/ploovol1_15.pdf (Accessed 2023-05-1).
do Carmo A., Pinho J. L. S., Vieira J. M. P. (2006). Contribution to the preservation of healthy coastal ecosystems. Water pollut. VIII: Model. Monit. Manage. 1, 15–24. doi: 10.2495/WP060021
Faria M., Pinto J., Py F., Fortuna J., Dias H., Martins R., et al. (2014). “Coordinating UAVs and AUVs for oceanographic field experiments: Challenges and lessons learned,” in 2014 IEEE International Conference on Robotics and Automation (ICRA). 6606–6611 (Hong Kong: IEEE). doi: 10.1109/ICRA.2014.6907834
Ferreira A. S., Costa M., Py F., Pinto J., Silva M. A., Nimmo-Smith A., et al. (2019). Advancing multi-vehicle deployments in oceanographic field experiments. Autonomous Robots 43, 1555–1574. doi: 10.1007/s10514-018-9810-x
Howard G., Charles K., Pond K., Brookshaw A., Hossain R., Bartram J. (2010). Securing 2020 vision for 2030: climate change and ensuring resilience in water and sanitation services. J. Water Climate Change 1 (1), 2–16. doi: 10.2166/wcc.2010.105b
Hunt C. D., Mansfield A. D., Mickelson M. J., Albro C. S., Geyer W. R., Roberts P. J. (2010). Plume tracking and dilution of effluent from the Boston sewage outfall. Mar. Environ. Res. 70 (2), 150–161. doi: 10.1016/j.marenvres.2010.04.005
Jones B. H., Dickey T. D., Washburn L., Manov D. (1993). Physical and biological dynamics of sewage outfall plumes in the coastal region: an integrated observational approach. WIT Trans. Ecol. Environ. 2, 527–534.
Kiko R., Picheral M., Antoine D., Babin M., Berline L., Biard T., et al. (2022). A global marine particle size distribution dataset obtained with the Underwater Vision Profiler 5. Earth Syst. Sci. Data. 14, 4315–4337. doi: 10.5194/essd-14-4315-2022
Kim S. Y., Cornuelle B. D., Terrill E. J. (2010). Decomposing observations of high-frequency radar-derived surface currents by their forcing mechanisms: Decomposition techniques and spatial structures of decomposed surface currents. J. Geophys. Res.: Oceans 115 (C12). doi: 10.1029/2010JC006222
Lerczak J. A., Winant C. D., Hendershott M. C. (2003). Observations of the semidiurnal internal tide on the southern California slope and shelf. J. Geophys. Res.: Oceans 108 (C3), 527–534. doi: 10.1029/2001JC001128
Missimer T. M., Jones B., Maliva R. G. (2015). Intakes and outfalls for seawater reverse-osmosis desalination facilities: innovations and environmental impacts (Switzerland: Springer). doi: 10.1007/978-3-319-13203-7
Mukhtasor, Lye L. M., Sharp J. J. (2002). Methods of compliance evaluation for ocean outfall design and analysis. Environ. Manage. 30, 536–546. doi: 10.1007/s00267-002-2642-6
Noble M. A., Sherwood C. R., Lee H. L., Xu J., Dartnell P., Robertson G., et al. (2001). “Transport processes near coastal ocean outfalls,” in MTS/IEEE Oceans 2001. An Ocean Odyssey. Conference Proceedings (IEEE Cat. No. 01CH37295), Honolulu, HI, USA, Vol. 3. 1996–2000 (Hawaii: IEEE). doi: 10.1109/OCEANS.2001.968152
Payne J. A., Hedges P. D. (1990). An evaluation of the impacts of discharges from surface water sewer outfalls. Water Sci. Technol. 22 (10-11), 127–135. doi: 10.2166/wst.1990.0297
Picheral M., Catalano C., Brousseau D., Claustre H., Coppola L., Leymarie E., et al. (2022). The Underwater Vision Profiler 6: an imaging sensor of particle size spectra and plankton, for autonomous and cabled platforms. Limnol. Oceanogr.: Methods 20 (2), 115–129. doi: 10.1002/lom3.10475
Roberts P. J. (1979). Line plume and ocean outfall dispersion. J. Hydraul. Division 105 (4), 313–331. doi: 10.1061/JYCEAJ.000517
Rogowski P., Terrill E., Otero M., Hazard L., Middleton W. (2012). Mapping ocean outfall plumes and their mixing using autonomous underwater vehicles. J. Geophys. Res.: Oceans 117 (C7). doi: 10.1029/2011JC007804
Stokes M. D., Nadeau D. R., Leichter J. J. (2023). The Pelagic Laser Tomographer for the study of suspended oceanic particulates. IEEE J. of Oceanic Engineering. in press.
Summers H. J., Emery K. O. (1963). Internal waves of tidal period off Southern California. J. Geophys. Res. 68 (3), 827–839. doi: 10.1029/JZ068i003p00827
Tavakol-Davani H., Goharian E., Hansen C. H., Tavakol-Davani H., Apul D., Burian S. J. (2016). How does climate change affect combined sewer overflow in a system benefiting from rainwater harvesting systems? Sustain. cities Soc. 27, 430–438. doi: 10.1016/j.scs.2016.07.003
Terrill E., Pyle R., Winslow K., Kim S. Y., Hazard L., Otero M., et al. (2009). Coastal Observations and Monitoring in South Bay San Diego IBWC/Surfrider Consent Decree (San Diego: CH2M Hill).
Trauth M. H., Gebbers R., Marwan N., Sillmann E. (2008). MATLAB recipes for earth sciences Vol. 34 (Berlin: Springer).
Keywords: particulates, pelagic, instrumentation, wastewater, plume, outfall
Citation: Stokes MD, Leichter JJ and Nadeau D (2023) Suspended particulates at the Point Loma, California wastewater outfall. Front. Mar. Sci. 10:1251162. doi: 10.3389/fmars.2023.1251162
Received: 30 June 2023; Accepted: 08 September 2023;
Published: 22 September 2023.
Edited by:
Michele Mossa, Politecnico di Bari, ItalyReviewed by:
Oliver B. Fringer, Stanford University, United StatesAnabela Oliveira, National Laboratory for Civil Engineering, Portugal
Copyright © 2023 Stokes, Leichter and Nadeau. This is an open-access article distributed under the terms of the Creative Commons Attribution License (CC BY). The use, distribution or reproduction in other forums is permitted, provided the original author(s) and the copyright owner(s) are credited and that the original publication in this journal is cited, in accordance with accepted academic practice. No use, distribution or reproduction is permitted which does not comply with these terms.
*Correspondence: M. Dale Stokes, ZHN0b2tlc0B1Y3NkLmVkdQ==