
94% of researchers rate our articles as excellent or good
Learn more about the work of our research integrity team to safeguard the quality of each article we publish.
Find out more
ORIGINAL RESEARCH article
Front. Mar. Sci. , 07 December 2023
Sec. Marine Pollution
Volume 10 - 2023 | https://doi.org/10.3389/fmars.2023.1251068
 Inta Dimante-Deimantovica1*
 Alise Bebrite1
 Māris Skudra1Inga Retike2
 Maija Viška1Jānis Bikše2
 Marta Barone1Anda Prokopovica1Sanda Svipsta1
 Juris Aigars1
Microplastic pollution has become widespread, occurring even in areas with low anthropogenic impacts, small human populations, and low tourism intensity. Marine beach sand represents the interface between inland and marine environments and acts like a fingerprint of all the processes happening within the onshore catchment and in the sea, driven by marine hydrodynamic processes. An extensive dataset is required from different coastal ecosystems to understand microplastic pollution. Here, we set the baseline for micro- and mesoplastic pollution distribution in 24 beaches along the Latvian coastline (Northern Europe, Baltic states), filling the existing knowledge gap and contributing to the global understanding of microplastic particles presence, transport, and the processes governing its dynamics. We also highlight citizen science as a fundamental tool to support data collection and raise awareness about microplastic pollution, as samples were collected by up to 250 volunteers during organized campaigns. To improve the understanding of the driving forces responsible for plastic pollution distribution along beaches, we analyzed sand granulometry, sample location, hydrodynamic variables (waves and currents), and tourism/leisure intensity. Our results demonstrate that the semi-closed Gulf of Riga beach environment contains fewer micro- and mesoplastic particles (0.10 particles/kg dry sand) compared to the open Baltic Sea (0.16 particles/kg dry sand). For microplastic size fraction particularly, a separate cluster can be distinguished showing a higher microplastic concentration and greater presence of fibers associated with coarser beach sand in the open Baltic Sea and eastern part of the Gulf of Riga. Recreational activity was not observed to have any statistically significant effect on microplastic distribution. We have concluded that hydrodynamics is an important factor for microplastics distribution and accumulation, but the impacts are of local scale, and results vary significantly among existing studies.
Since the mass production of plastic was initiated in the 1950s—when 1.5 million metric tons were generated—global production has increased to 390.7 million metric tons in 2021 (Plastic production worldwide 2021, 2023). Only approximately 9% of all plastic is recycled, and 12% is incinerated (Geyer et al., 2017), while the remainder circulates in the environment and can become integrated into food chains. Microplastics are small pieces of plastic, less than 5 mm in length, which are either produced commercially or derived from the fragmentation of larger plastic items; these microplastics have become widespread pollutants, posing physical and toxic harm to both ecosystems and organisms, especially in aquatic habitats (de Sá et al., 2018; Botterell et al., 2019; Campanale et al., 2020; Bhuyan, 2022). There are no signs of a possible decrease in global plastic production in the near future (Geyer et al., 2017); therefore, the regular collection of accurate data is imperative for monitoring the impact and expansion of microplastic pollution. This is particularly important for human-impacted, pollution-sensitive, and dynamic ecosystems such as coastal beaches.
Moreover, the European Commission has defined qualitative descriptors (D) that describe a good marine environmental status (GES) in the Marine Strategy Framework Directive of the European Union. In this framework, D10 descriptors aim to protect the marine environment against harm from litter. One of the primary criteria of D10 describes the effects of composition, amount, and spatial distribution of micro-litter on the coastline (European Parliament, and Council of the European Union, 2008). Microplastics have also been suggested as a criterion for environmental certification – Blue Flag beach status, which is a recognized trademark describing high standards of sustainable beach management that considers environmental, educational, safety, and accessibility aspects (Kutralam-Muniasamy et al., 2022). Consequently, different guidelines for microplastics monitoring have been developed, and numerous studies have reported concentrations of microplastics in beach sand worldwide (Wessel et al., 2016; Besley et al., 2017; Duncan et al., 2018; Eo et al., 2018; Constant et al., 2019; Gauci et al., 2019; GESAMP, 2019; González-Hernández et al., 2020; Haseler et al., 2020; AMAP, 2021; Chouchene et al., 2021; Wu et al., 2021; Gyraite et al., 2022; Lyu et al., 2022; Mesquita et al., 2022; Nhon et al., 2022). Hence, the amount of available data on microplastic pollution in beach sand has grown rapidly, but still, few studies have been conducted explaining the reasons and impacting factors of pollution patterns and dynamics for a particular area. Various aspects have to be considered - beach exposure to anthropogenic pressure, point and diffuse pollution sources, climate conditions, tidal regime, and hydrodynamics of the water. There are conflicting research conclusions, and multiple replications of studies in different locations are needed to be able to extrapolate the data. For instance, Vermeiren et al. (2021) and Enders et al. (2019) found that sand granulometry determines microplastic abundance, while Urban-Malinga et al. (2020) concluded that microplastic concentration is not related to sand granulometry. In several studies, this is indicated as an unresolved research question (Alomar et al., 2016; Schröder et al., 2021). Lately, the role of coastal area water hydrodynamics has been highlighted, suggesting physical processes (i.e., wave energy, currents) affect plastic particles and may overcome the effects of other impacting factors (Urban-Malinga et al., 2020), i.e., high microplastic concentration is associated with low-energy areas (Harris, 2020), and fiber distribution particularly is impacted by wave characteristics and rip currents (Misic et al., 2019).
In our study, we compiled comprehensive baseline data for micro- (1–5 mm) and mesoplastic (>5 mm) pollution along 24 marine beaches in Latvia, northeastern Europe. The Baltic Sea is a shallow, brackish intercontinental sea and one of the world’s largest brackish water basins, with a surface area of 370 000 km2 and an average depth of 55 m. The Gulf of Riga (GoR) is a semi-enclosed basin located in the eastern part of the Baltic Sea. The GoR covers an area of approximately 17 913 km2 (volume 405 km3, average depth 26 m) (Leppäranta and Myrberg, 2009). It is connected to the Baltic Sea via two shallow straits – the Irbe Strait in the west and Suur Strait in the north, with the majority (70-80%) of water exchange occurring through the Irbe strait (Petrov, 1979). The catchment area of the GoR is 134 000 km2, and five major rivers (Daugava, Gauja, Lielupe, Salaca, and Pärnu) discharge into the GoR. The majority of the freshwater (86%) discharges in the southern part of the gulf (Berzinsh, 1995); thus, together with the limited water exchange with the open Baltic Sea, a salinity gradient can be observed from the Irbe strait to the south and southeast of the GoR. A common perception of the GoR is that the outflow/inflow occurs through the surface/bottom layers via the Irbe strait with cyclonic (anti-clockwise) mean surface circulation within the gulf (Leppäranta and Myrberg, 2009). Nevertheless, model analyses in the GoR (Soosaar et al., 2014; Lips et al., 2016a; Lips et al., 2016b) have shown that variations exist to this “common perception” - cyclonic and anticyclonic circulation patterns alternate in the GoR depending on the season and other factors.
The Baltic Sea is exposed to many hazardous substances and pollutants, including inputs from wastewater treatment plants, agricultural activities, atmospheric deposition, and transboundary pollution (HELCOM, 2022). The Baltic Sea also accounts for 15% of global cargo traffic (HELCOM, 2009), with a shipping concentration that is among the highest in the world. Almost 90 million people inhabit the drainage basin of the Baltic Sea (Döös et al., 2004; Mälkki and Perttilä, 2012). To sum up, anthropogenic pressure is high, as is sensitivity to environmental pollution. At the same time, coastline biotopes are significant for ecological functioning and suitable for recreation and tourism.
To date, microplastic data of Latvian beach sand have only been presented in a single peer-reviewed publication (Haseler et al., 2020). The authors included four Latvian sites in a larger dataset and used a sand rake as a sample collection tool. Due to the preconditions needed (dry and fine sediments with no pebbles or gravel) and uncertainties regarding the sampled sand volume (the sampling depth of the top sand layer is approximately between 3 and 5 cm), this method has never been repeated, neither in those four beaches nor in other beaches in Latvia.
Due to the high profile and social importance of our subject matter, sample collection was conducted by non-professional volunteers under the guidance of professional research personnel. This citizen science approach has been applied in many research fields, including surveys of microplastics in beach areas. For instance, the United States Environmental Protection Agency has developed a citizen science protocol for sampling microplastic pollution on beaches (US EPA, 2021). A methodological approach and new tool kit to collect microplastics from sand, water, and biota in Scotland have been provided by Paradinas et al. (2021). Concentrations of metals on microplastics were analyzed using citizen science in Australia (Carbery et al., 2020). Several studies on microplastic distribution have been supported by citizen science participants locally, i.e., in Chile (Hidalgo-Ruz and Thiel, 2013), France (Doyen et al., 2019), Isles of Scilly, UK (Nel et al., 2020), Ecuador (Jones et al., 2022), and globally (Bosker et al., 2017; Lots et al., 2017). Commonly mentioned potential benefits of citizen scientists’ involvement in water-related studies were listed by Walker et al. (2021); of those we found relevant to our study were public engagement, raising awareness, material/knowledge gain, and mutual trust development. The goal of this study was to fill in the existing research gap on microplastic pollution distribution along the Baltic Sea coast in Latvia, thereby contributing to a global understanding of the occurrence, dynamics, and future trends of microplastics in beach sediments. Here, we present data from 24 beaches located both in the Gulf of Riga (GoR) and the open-sea part. In addition to our descriptive results, we address the following research questions: (1) do our results (the concentration, shape, and polymer type of microplastic particles) differ between the coast of the open sea and the GoR?; (2) is the concentration of microplastic particles sand grain-size distribution dependent (sand granulometry approach)?; (3) does the concentration of microplastic particles correlate with the suitability of beaches for recreational activities? Possible microplastic pollution transport patterns were discussed using the obtained data from SmartBuoys as complementary material to the present but rather limited (based on in situ measurements) knowledge regarding current dynamics in the study field. Measured wave characteristics from the SmartBuoys were used to see if there is some difference in the open Baltic Sea compared to the GoR regarding the characteristics of microplastics (e.g., particle size).
The coast of the Baltic Sea is 498 km long in Latvia and is located adjacent to both the open sea (Eastern Gotland basin) and the shallow semi-isolated GoR. Most beaches are sandy; however, gravel, pebble, and rocky seashores are also encountered. Approximately 44% of the population inhabits coastal areas, mainly concentrated in four large cities: Riga, Jurmala, Liepaja, and Ventspils. During the summer, the number of inhabitants increases appreciably in coastal cities and villages. The study area also includes the free ports of Riga and Ventspils, the Liepaja Special Economic Zone, and seven small ports (Nikodemus et al., 2018). We included 24 beaches in our study (Figure 1), which differed in terms of accessibility, nearest settlement size, available infrastructure, and visitor population. A detailed description of each beach is provided in the Supplementary Material (Table S1).
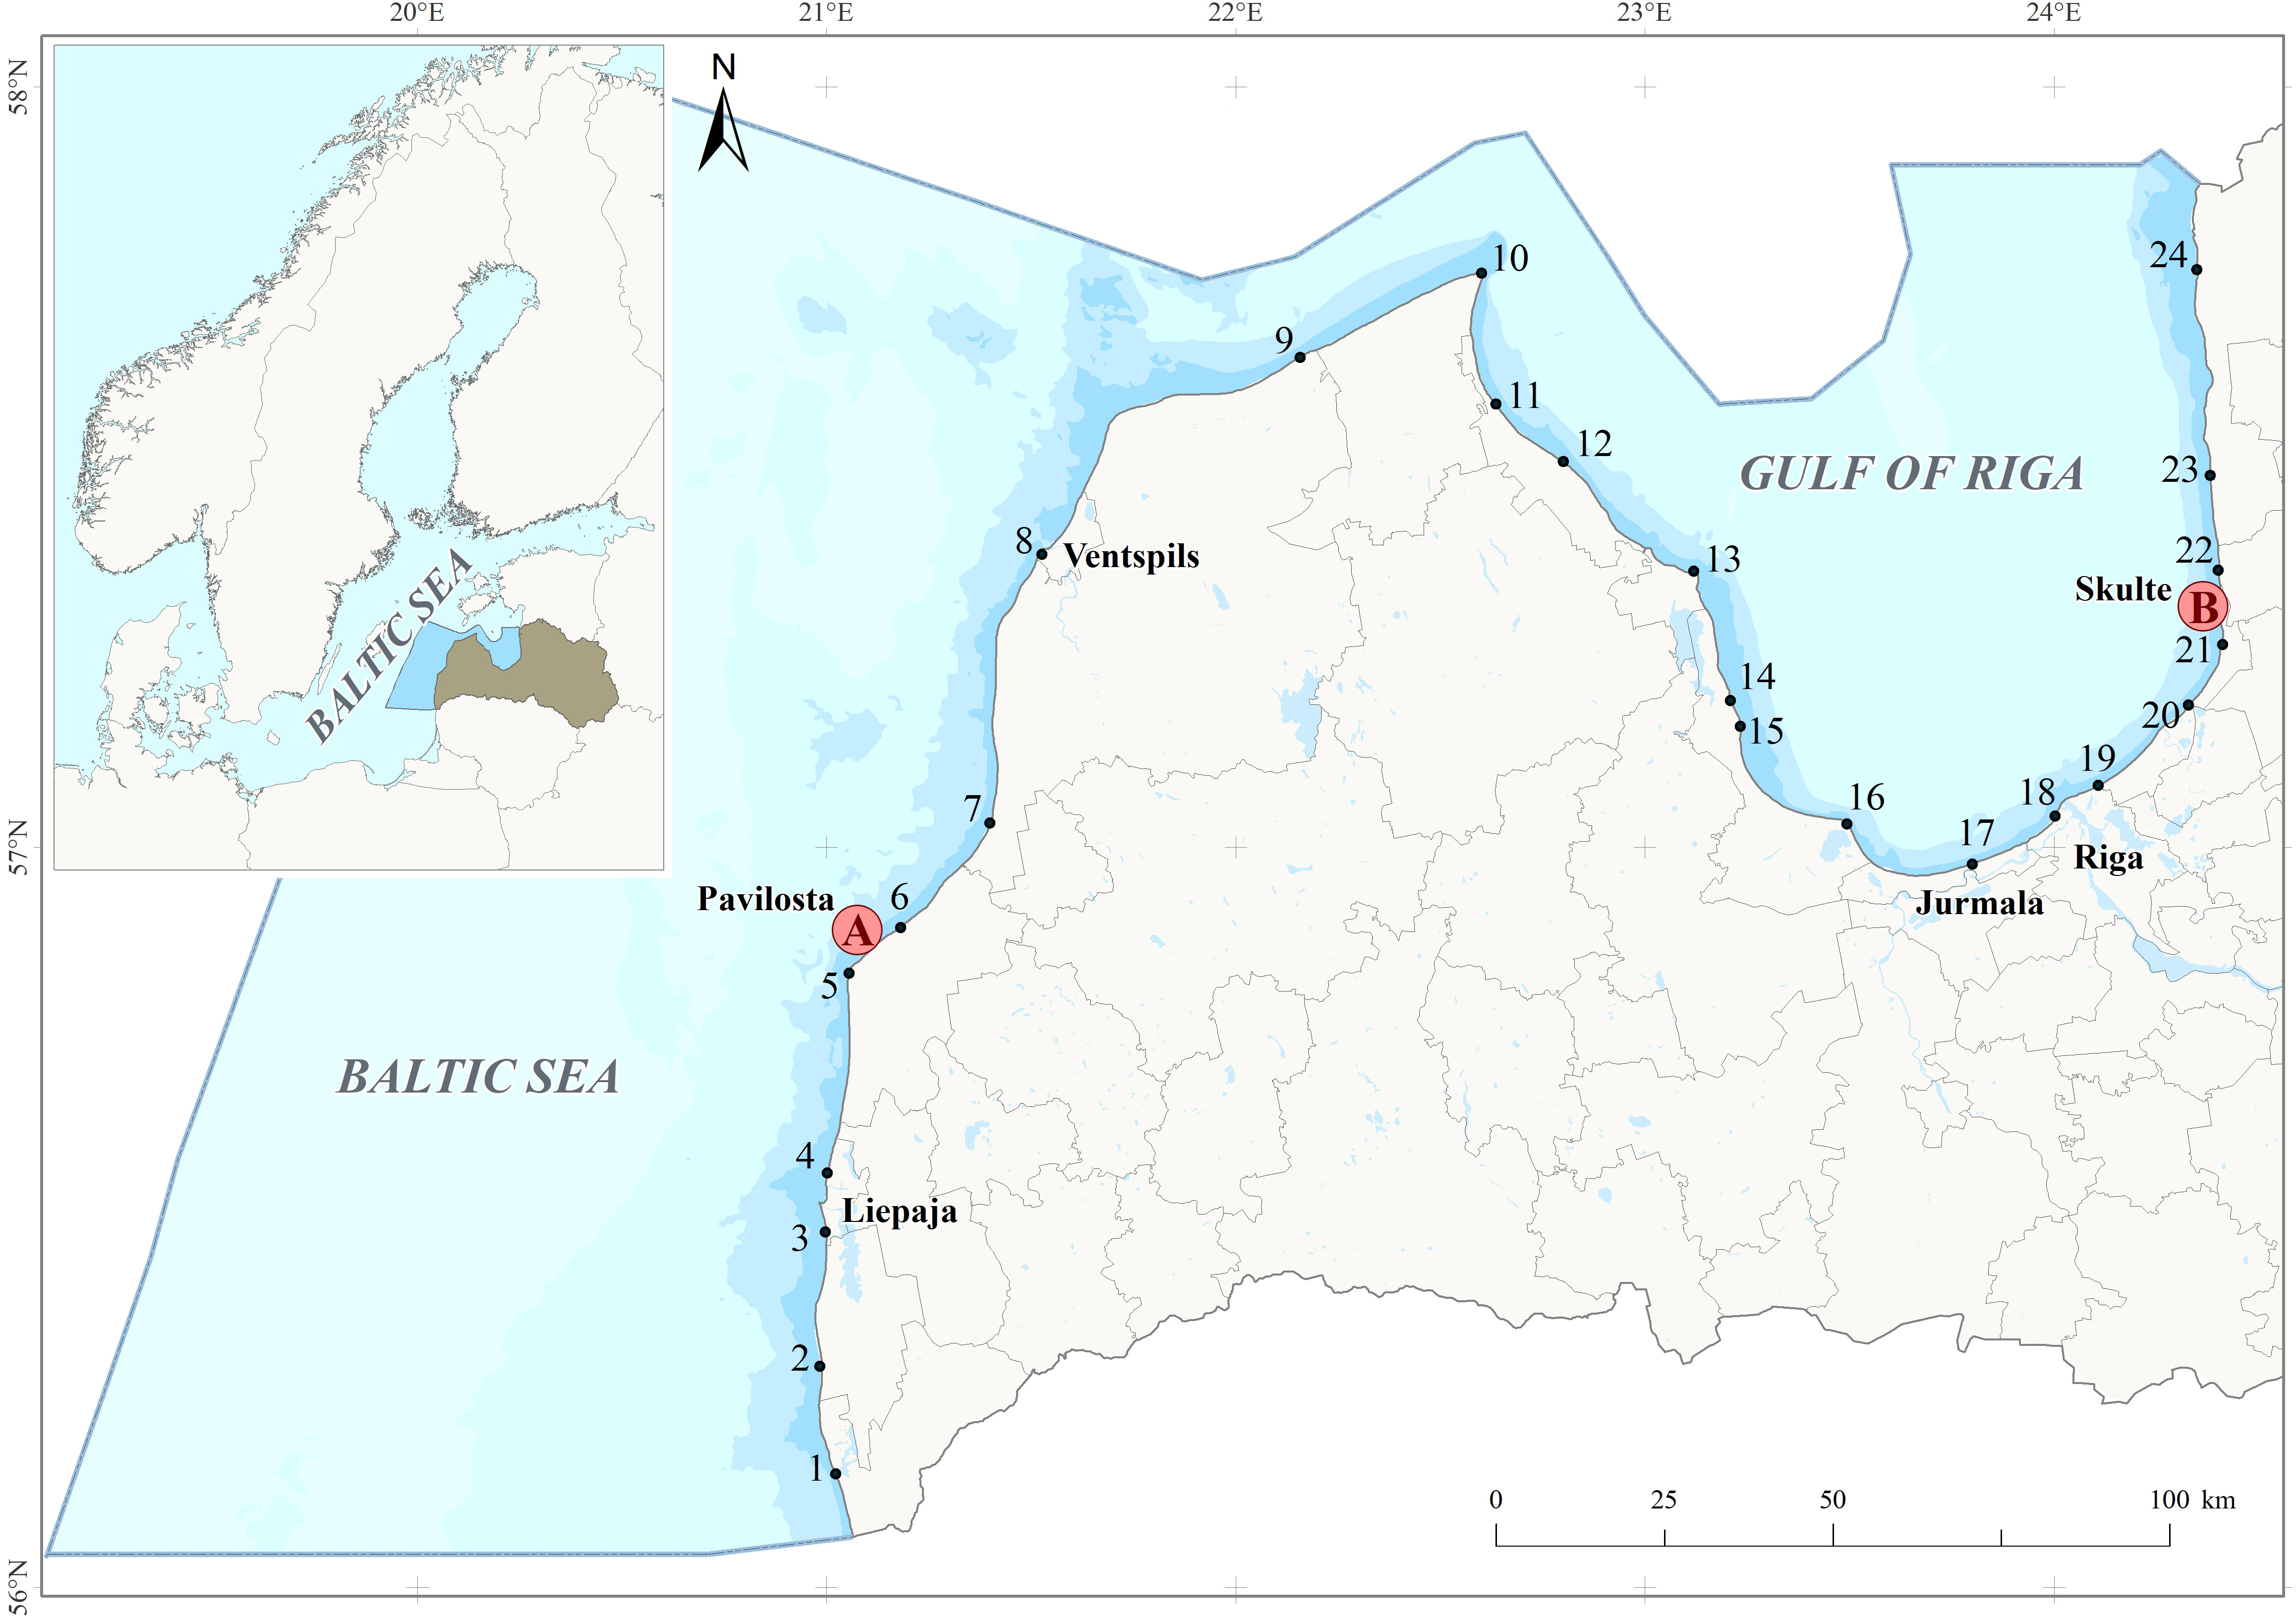
Figure 1 Sampling sites for micro- and mesoplastic pollution survey – 24 beaches along the Latvian sea coast and the placement of SmartBuoys. 1-Pape; 2-Jurmalciems; 3-Liepaja; 4-Liepaja Karosta; 5-Akmenrags; 6-Pavilosta; 7-Jurkalne; 8-Ventspils; 9-Irbe river inflow; 10-Kolka; 11-Purciems; 12-Roja; 13-Mersrags; 14-Abragciems; 15-Engure; 16-Lapmezciems; 17-Majori; 18-Daugavgriva; 19-Vecaki; 20-Lilaste; 21-Saulkrasti; 22-Laucu akmens; 23-Tuja; 24-Salacgriva; SmartBuoy near Pavilosta port (A); SmartBuoy near Skulte port (B).
SmartBuoy data were obtained from two smart buoy systems – one is deployed in the eastern coast of the open Baltic Sea near the Pavilosta port, with coordinates of 56.88985 N and 21.07413 E, and the other is deployed in the eastern coast of the GoR near the Skulte port, with coordinates of 57.31998 N and 24.36355 E (see Figure 1, red circles A and B, respectively). Data about the surface currents (speed, direction) and wave characteristics from the year 2021 (May-September) with a temporal resolution of 1h were analyzed in relation to the study theme. The speed and direction of currents were acquired using a single-point ZPulse® Doppler Current Sensor 4420 (Aanderaa, Norway, connected to a SmartGuard measurement system) with a resolution of 0.1 mm/s and 0.01˚, respectively. Data about wave characteristics were acquired using Wave and Tide Sensor 5218 (Aanderaa, Norway, connected to the SmartGuard measurement system). The significant wave height (Hs) and peak wave period (Tp) were recorded as wave parameters. The wave measurements were based on the pressure time series measured over a time period of 120 seconds.
Wave power was calculated for each instant using the following deepwater formula:
where P is the wave energy flux per unit of wave crest length, ρ is the water density, and g is acceleration due to gravity (Dean and Dalrymple, 1991; Thorpe, 1999; Dean and Dalrymple, 2001).
The project activity was initiated and partly funded by the Latvian student sorority Selga.
The study design was developed by the Latvian Institute of Aquatic Ecology (LIAE). To manage the sampling effort required along a 498 km-long coastline, citizen scientists were recruited. The criteria for selection comprised an interest in the study topic and an ability to be present in the designated sampling areas at a specific time/date.
Sampling protocol was prepared and initially field tested by LIAE. Based on that, an informative short video was prepared and distributed among potential citizen scientists. The citizen scientists were recruited through personal contacts of the student sorority Selga and mainly consisted of sorority members and their families and friends of varying ages, educational backgrounds, and knowledge. On some occasions, NGOs, government representatives, local school children, journalists, and sailing foundation representatives also participated.
Overall, approximately 250 citizen scientists participated in the sample and data collection. All were informed about the project, its aims, and the need for their assistance, and quality measures and safety issues were discussed. Professional researchers introduced the citizen scientists to the sampling methodology, followed by a practical demonstration of the techniques required. At least one LIAE representative was present at all sampling instances to ensure quality control, guidance, and safety. Following the initial sampling sessions, feedback was collected from the citizen scientists regarding field protocols, and their comments were addressed to improve the protocols. Slight protocol adjustments did not affect the study concept or sampling effort to affect the results.
Our sampling points at the 24 beaches were selected based on information from a 10-year campaign known as “My Sea” by the Foundation for Environmental Education in Latvia, during which macro-garbage including plastic was surveyed along the Latvian coastline. Hence, all sampling points were in accessible, well-recognizable areas. The coordinates and description of each site are presented in the Supplementary Material (Table S1). Each sampling kit consisted of a net, measuring tape, 0.5 m × 0.5 m metal frame, glass jars, plastic containers, metal spatulas, metal buckets, sieves, metal cups, and wash bottles (Figure 2). In addition, the participants used aluminum folium, scissors, water-resistant markers (for labeling), labeling tape, and forceps. All jars and metal items were pre-washed in the laboratory, the jars were rinsed with filtered distilled water and covered with foil and a metal lid.
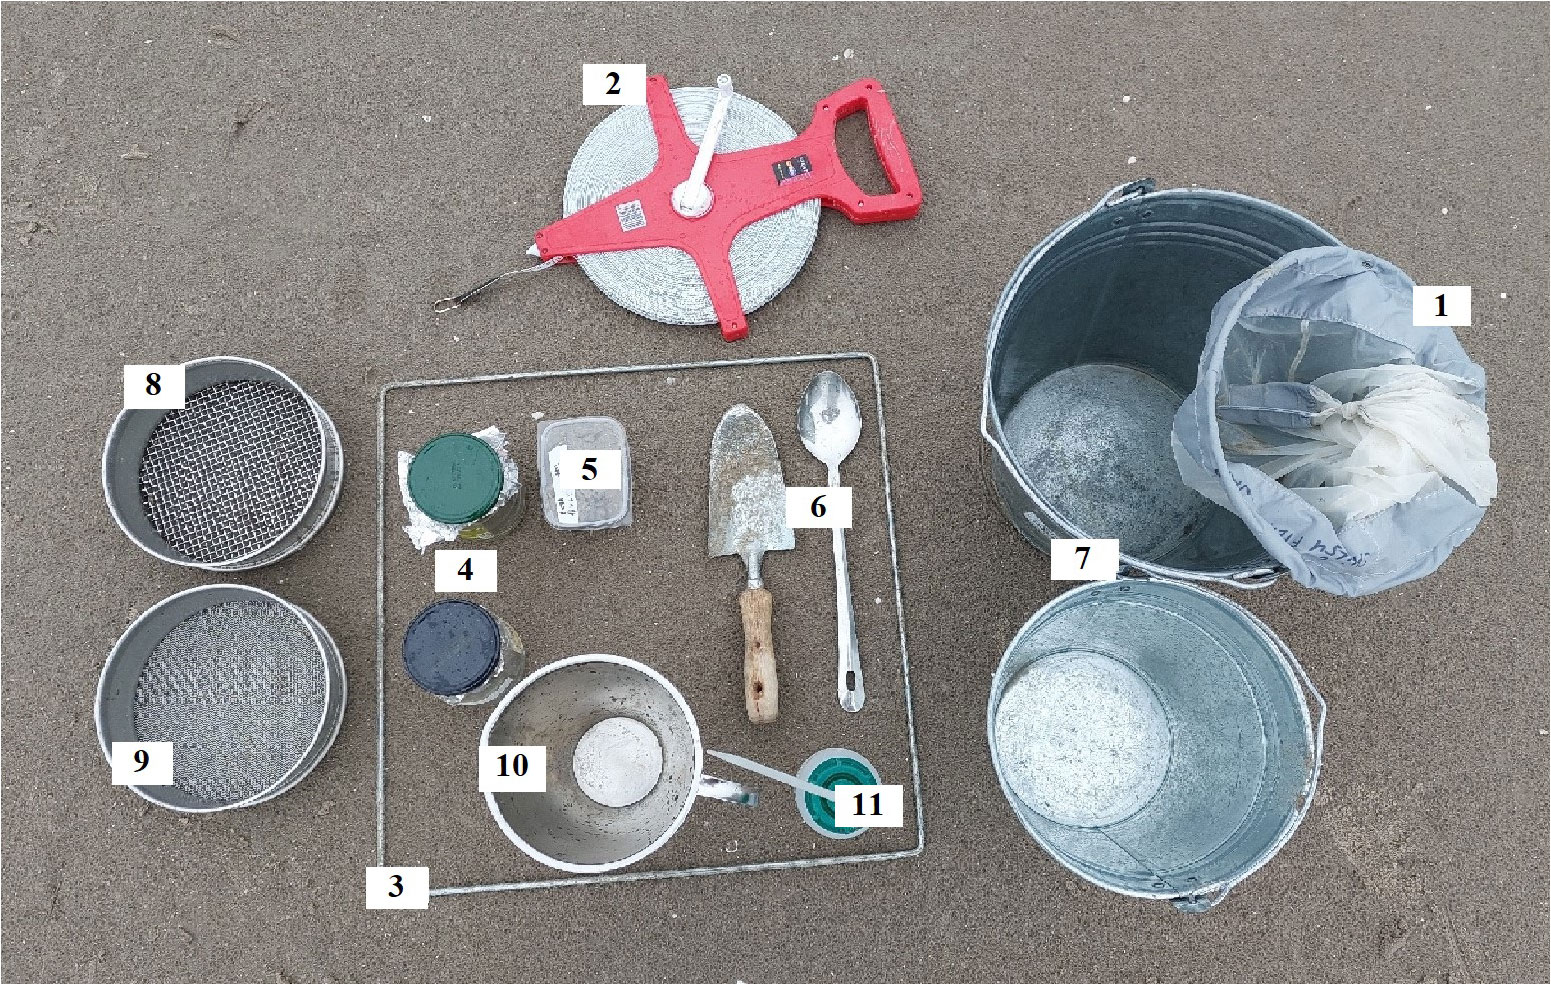
Figure 2 Sampling kit for the collection of micro- and mesoplastic samples from beach sand: 1 - nylon net (mesh size 90 µm) for seawater filtration; 2 - 100 m measuring tape for transect location; 3 - metal frame (0.5 m x 0.5 m); 4 - washed, rinsed, and labeled glass jars covered with aluminum folium and a metal lid for collected samples and blank samples; 5 - labeled plastic container for granulometry sample; 6 - metal spatulas for sand and granulometry sample collection; 7 - metal buckets for collecting sand, transporting seawater, and storing filtered seawater; 8 - stainless steel sieve (200 mm x 50 mm, ISO 3310-1, mesh size 5 mm); 9 - stainless steel sieve (200 mm x 50 mm, ISO 3310-1, mesh size 1 mm); 10 - metal measuring cup for pouring water; 11 - wash bottle for rinsing sample remnants off the sieve and into a jar.
At the beginning of sampling, a 100 m transect was drawn parallel to the coastline using a measuring tape. Samples were taken near the water line, where beach sand is regularly washed by the seawater. Along each transect, three samples of 0.5m x 0.5m frames were collected. The locations of frames along the 100 m transect were chosen by randomly generated numbers.
The largest items of organic origin (such as plants) were collected and rinsed with seawater that had been filtered through a nylon net with a mesh size of 90 µm. Large and visible meso- and macroplastic particles (e.g., cigarette filters, ear swabs, fragments of plastic bags) were rinsed and placed in labeled glass jars. The metal spatula was used to collect the top layer of sand within each frame up to a depth of approximately 5 cm, rendering a total sample volume of 15 L of sand per bucket. Thus, the total sample volume along a transect was contained in three 15 L buckets.
The collected sand was sieved through 5 mm and 1 mm sieves, placed one above the other to separate mesoplastics (>5 mm) and microplastics (1-5 mm). Filtered seawater was poured over the sieves to facilitate the process. The material collected on the sieves was flushed with a wash bottle into labeled glass jars, which were subsequently covered with foil and a metal lid. During sampling from one of the frames, an open jar was left nearby to serve as a blank sample (to collect possible contamination from the air and participants’ clothes, etc.).
Depending on substrate geology, sand grains varied in size. When the sand was too coarse to be sieved on site, it was delivered to the LIAE in a covered bucket for density separation.
In the laboratory, samples collected on 5 mm sieve were flushed with filtered distilled water and, hence, were ready for analysis, while material collected on a 1 mm sieve required a more laborious purification procedure. Samples were transferred from the glass jar to glass beakers. If a sample still contained sand or was delivered as a bucket with coarse sand, it was subjected to density separation. Sand in the bucket was first well mixed, and a subsample of two liters was taken for density separation. Since two liters is a rather large sample volume, it was divided into smaller portions and underwent density separation one by one. Sodium chloride (NaCl) solution was used to remove the sand particles present in the sample. The salt solution was prepared in a two-liter beaker by adding 300 grams of table salt to one liter of tap water and heated/stirred at 50°C until a solution with a density of 1.2-1.3 g/cm3 was obtained. Next, the salt solution was filtered through a glass fiber (GF) filter (pore size 1.2 µm). Density separation was conducted three times in the glass beaker for each sample. The liquid fraction was passed through a 100 µm sieve. After the density separation, samples were flushed with filtered distilled water back into the beaker. Further processing of the samples was aimed at destroying the organic matter.
Hydrogen peroxide (H2O2, 30%) at a proportion of 1:0.5 was added, and the sample was then placed in a Julabo SW22 shaking water bath at 100 rpm and a temperature of 50°C for 48h. The sample was then filtered through a 100 μm sieve and transferred to the previously used glass beaker by rinsing with filtered distilled water. Filtering and rinsing occurred between each treatment step. If the removal of organic material was not yet sufficient, 10% sodium hydroxide (NaOH) was added at a ratio of 1:3, and the sample was again placed in the shaking bath at 100 rpm and 50°C for 48 h.
On very rare occasions, for some of the samples extremely rich with organic matter, the next processing step after the use of NaOH was an enzymatic and Fenton reaction. Enzymatic treatment was applied by adding 300 mL of acetate buffer (pH 4.8), 0.5 mL of cellulase enzyme blend (activity >1000 U/mL, Sigma Aldrich), and 0.5 mL of Viscozyme L. cellulolytic enzyme mixture (activity >100 FBGU/g, Sigma Aldrich) to the sample. Samples were placed in the shaking bath at 100 rpm and a temperature of 50°C for 48 h. The Fenton reaction was used as the final treatment step. Samples were fixed at 200 mL with filtered distilled water, cooled to 15–20°C, and supplemented with 145 mL of 50% H2O2 and 65 mL of 0,1 M NaOH. Then, 62 mL of 0,1 M FeSO4 was slowly added dropwise. To avoid heating of the solution and to keep it at an optimal temperature range (20–30°C), the beakers were placed in an ice bath. The Fenton reaction was allowed to proceed for 24 h. After the respective purification steps described above, the samples were filtered through a glass fiber filter (∅47 mm, pore size 1.2 µm) using a vacuum filtration machine. Blank samples were processed following the longest purification procedure.
Visual analysis of the samples was performed using a Leica DM400 B LED microscope with a lens magnification of 2.5. The microscope was equipped with a DFC 295 camera, utilizing the Leica Application Suite V4.1. The color, size, and shape (fiber, fragment, and film; see examples in Supplementary Material, Figure S1) were determined for each particle.
Particles of suitable size for chemical composition analysis were manually picked with tweezers and placed on a Thermo Fisher Scientific Nicolet iS20 diamond-backed spectrometer. The Fourier transform infrared–attenuated total reflection (ATR-FTIR) spectroscopy method was used, in which a spectrum was taken for each particle, which was automatically compared with those in the reference spectrum library database (supported by Thermo Fisher Scientific OMNIC 9 software). Each particle was scanned at 32 times per second, a spectral resolution of 4 cm-1, and a data spread of 0.482 cm-1. The results are presented as absorbance values. The wavelength range was from 400 cm-1 to 4000 cm-1. The results were considered reliable if the particle spectrum match with a database entry was >70%. For particles that were too fine (i.e., fibers) to be handled with tweezers, a hot needle test was performed to establish their origin as natural or synthetic.
Grain-size analysis was conducted by the sieving method (sieve assembly - Prüfsieb Tesa Sieve) using Retsch GmbH AS 200 sieves. Before sieving, the samples were dried in 200 mL drying cups. Eight sieves with mesh sizes between 0.063 mm and 2 mm were used. In cases when pebbles were visible in a sample, a sieve with a 4 mm aperture was added. Each sample was sieved for 10 min, and the content of each sieve was weighed. The results produced a percentage breakdown that was used to calculate the percentages of the grain-size groups using R package G2Sd (Fournier et al., 2014). Finally, six groups of grain-size classes were established - gravel (2-8mm), very coarse sand (1-2mm), coarse sand (500µm-1mm), medium sand (250-500µm), fine sand (125-250µm), and very fine sand (63-125µm), according to the classification by Wentworth (1922).
The following measures were taken to prevent sample contamination. Prior to sample collection, citizen scientists were informed of the importance of selecting appropriate clothing (i.e., those manufactured from natural fabrics or solid waterproof jackets were preferred over fleece jackets). Participants wearing nail polish were requested not to collect or sieve sand with their naked hands.
During the sampling and processing, only metal and glassware (apart from measuring tape and wash bottle) were used to prevent plastics from entering samples from the materials used. For each sampling transect, a blank sample was collected. In the laboratory, gloves and cotton coats were always used. Sample processing was performed in a fume hood, and sample beakers were always covered with aluminum foil to avoid contamination while samples were not being processed or placed in the shaking heating bath. The same beaker was used for each sample during treatment, and it was thoroughly rinsed to minimize particle loss. Recovery tests (three replicates) for plastic pellets made of polystyrene (PS) of 2.1 mm in diameter size (source – diamond painting beads widely available from different producers) were made following the longest purification procedure and revealed 99% recovery.
The number of variables to be included in the principal component analysis (PCA) and hierarchical cluster analysis (HCA) was chosen iteratively to consider the amount of non-detects and to avoid collinearity between variables and deterioration of the results due to small variations within the variables. The retained seven variables were: particles/kg dry sand (i.e., concentration), non-fiber particles\kg dry sand (further as nonFiber_concentration), fiber particles/kg dry sand (Fiber_concentration), mean particle length (mean_length), the mean of the sand grain-size distribution (mean_aritm), the percentage of sediment of the grain-size distribution that was retained in the Fine Sand class (between 125 and 250 micrometers) (f_sand), and the ratio of the 90th percentile and the 10th percentile of the grain-size distribution (D90/D10). To allow differentiation between micro- and mesoplastic pollution, datasets for particle sizes of 1-5 mm and >5 mm were analyzed separately. The variables were tested for normality and log-transformed if necessary. Standardization (z scores) was applied to both log-transformed and non-transformed data so that each variable was weighted equally. Varimax rotation was used in the PCA, whereas a combination of squared Euclidean distance (as a similarity measure) and Ward’s method for linkage distance was used in the HCA.
The GoR sites were divided into three groups according to their location, i.e., the western, eastern, and southern part of the GoR: western (10. Kolka, 11. Purciems, 12. Roja, 13. Mersrags, 14. Abragciems, 15. Engure, 16. Lapmezciems); eastern (20. Lilaste, 21. Saulkrasti, 22. Laucu akmens, 23. Tuja, 24. Salacgriva); and southern (17. Majori, 18. Daugavgriva, 19. Vecaki).
Coastal area suitability for recreation was one of the variables considered versus found plastic concentration. Three assessment classes were used according to Ruskule et al. (2018): 1. - low/very low suitability for recreational use, usually for seasonal use only; 2. - moderate suitability, extensively used for traditional activities; 3. - high/very high value of suitability for recreation. Each sampling site was assigned a class number.
Multivariate statistical analysis was carried out by statistical software SPSS version 22, but the rest of the statistical tests were carried out in R version 4.3.0., ArcMap10, and MS Excel, and R using ggplot2 package was used for figure visualizations.
The average significant wave height measurements retrieved from the SmartBuoys ranged from 0.4 to 1 m in the open Baltic Sea (Pavilosta) and from 0.2 to 0.5 m in the GoR (Skulte). The maximum significant wave height reached 3.5 m in the open Baltic Sea in July 2021 and 2 m in the GoR in September 2021. These maximum wave heights occurred only for a short period of time in the 99th and 95th percentiles of all the data for both areas (Figure 3A). The median significant wave height was up to six times lower than the maximum significant wave height at Pavilosta and ten times lower at Skulte. The wave power was much higher in the open Baltic Sea, reaching a maximum of close to 60 kW/m, contrary to the 13 kW/m measured in the GoR; however, these peaks were very short lived. The average wave energy in the open Baltic Sea ranged between 0.7 and 4.0 kW/m and 0.3 and 1.0 kW/m in the GoR (Figure 3B).

Figure 3 The distribution of wave parameters near Skulte port (Gulf of Riga) and Pavilosta port (open Baltic Sea) during May-September 2021: (A) Significant wave height measurements, light gray bars: maximum significant wave height, other bars: 99%, 95%, average, and 50% quantiles of significant wave height; (B) Wave energy flux per unit of wave crest length, light gray bars: maximum wave power, other bars: 99%, 95%, average, and 50% quantiles of wave power.
The speed and direction of currents during the whole period (May-September 2021) on the eastern coast of the GoR revealed a rather clear dominance of S-SW (180-225˚) currents, with currents >10 cm/s predominantly lying in this direction sector (Figure 4A). The second most pronounced direction sector was S-SE, while other directions were less pronounced. The average current speed during the whole period was 10.2 cm/s. On a monthly scale, May and June were characterized predominantly by S-SW currents, and currents with speed >10 cm/s were typically aimed at this sector of direction in both months. The average current speed in May (10.4 cm/s) exceeded that observed in June (7.5 cm/s) by almost 3.0 cm/s. In July, August, and September, the average current speeds were 8.0, 9.9, and 15.1 cm/s, respectively. July was characterized as the most diverse month in terms of the direction of currents. Currents with speeds <20 cm/s were rather equally distributed in the following directions: N-NE, E-NE, E-SE, S-SE, and S-SW. However, almost all currents with speeds >20 cm/s were still associated with S-SE and S-SW directions. In August, S-SE and S-SW currents prevailed, whereas in September, the main direction of the currents was roughly equally distributed between the N-NE and S-SW sectors.
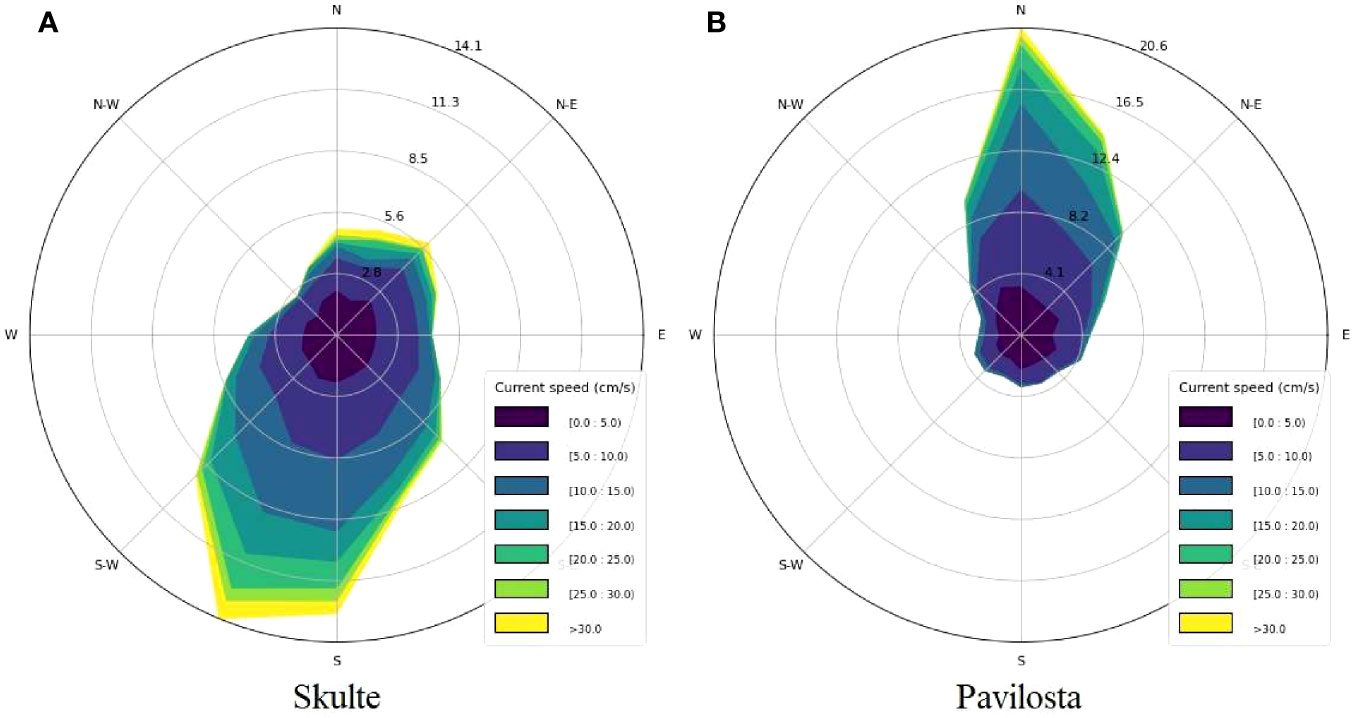
Figure 4 Distribution of current speed and direction during May-September 2021: (A) Near Skulte port (Gulf of Riga); (B) Near Pavilosta port (open Baltic Sea).
The speed and direction of currents during the whole period (May-September 2021) on the eastern coast of the open Baltic Sea revealed a clear dominance of N currents, with currents >10 cm/s mostly lying in the N-NE (0-45˚) and N-NW (315-360˚) direction sector (Figure 4B). Only a minor proportion of currents with speeds >10 cm/s moved in other directions. The average current speed was 8.0 cm/s.
On a monthly scale, May and June were dominated by N-NE currents, with average speeds of 8.1 and 7.0 cm/s, respectively. In July, August, and September, the currents were more evenly distributed between the N-NE and N-NW sectors, with average current speeds of 11.0, 5.5, and 8.4 cm/s for these directions, respectively. In general, current directions in the open Baltic Sea were less diverse than those observed in the GoR from May to September 2021.
The granulometric composition of sand is presented in Figure 5. Both in the open-sea part and the GoR, most of surveyed beaches were composed of fine and medium-sized sand. Gravel, coarse, and/or very coarse sand were dominant at only a few sites, namely, 1. Pape, 4. Liepajas Karosta, 14. Abragciems, 21. Saulkrasti, and 24. Salacgriva.
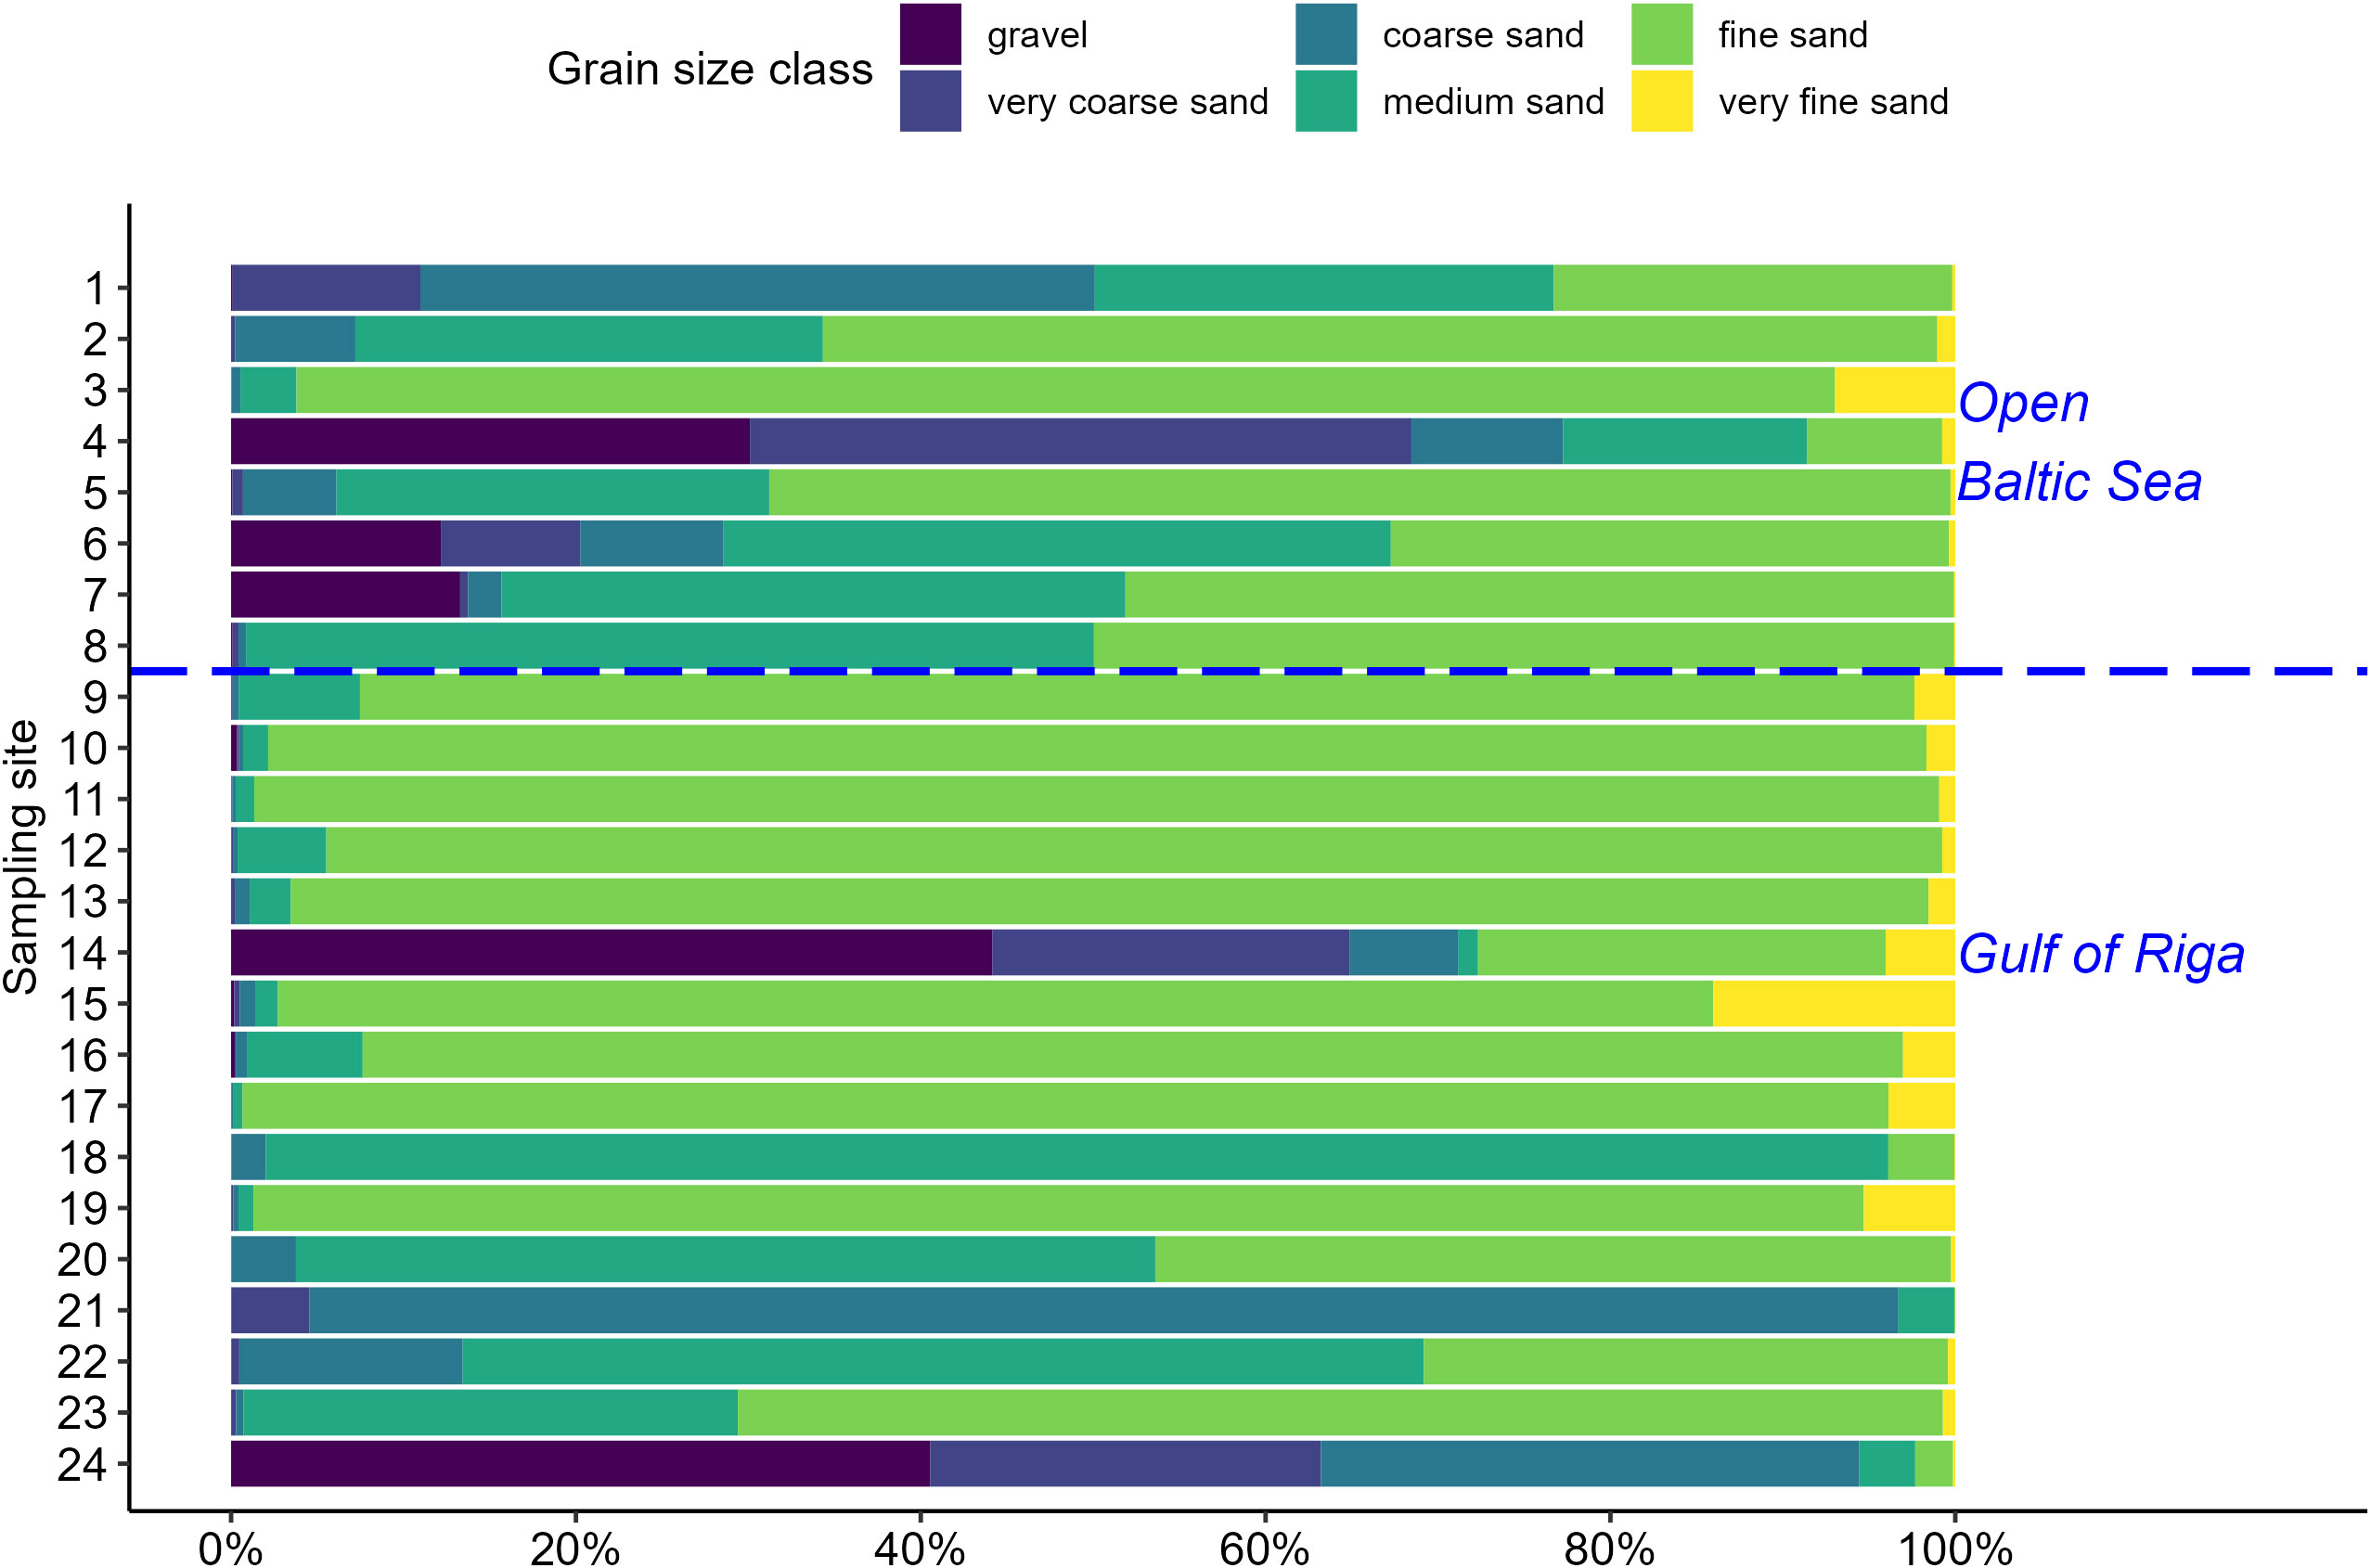
Figure 5 Granulometric composition of sand samples collected along the shores of the open Baltic Sea and the Gulf of Riga (with sampling sites as per Figure 1).
Mesoplastics were found in 22 beaches (of the 24 in total investigated), with concentrations varying from 0.01 particles/kg dry sand (p/kg) in sampling sites 3. Liepaja, 7. Jurkalne, 11. Purciems, 21. Saulkrasti, and 24. Salacgriva to 0.69 p/kg (19. Vecaki) and 0.50 p/kg (8. Ventspils) (see Supplementary Materials, Figure S2, Table S5). The average particle concentration in the open Baltic sea beach sand was 0.16 p/kg, while in the GoR beach sand it was 0.10 p/kg.
Microplastics were found in all beaches, with concentrations varying from 0.31 p/kg (4. Liepaja) to 11.17 p/kg and 8.70 p/kg (5. Akmenrags and 6. Pavilosta, respectively) (see Supplementary Materials, Figure S2, Table S4). The average particle concentration in the open Baltic sea beach sand was 3.93 p/kg, and in the GoR beach sand, it was 2.44 p/kg (Figure 6).

Figure 6 Micro- and mesoplastic in beach sand at study sites (as in Figure 1). (A) Concentration (particles/kg dry sand); (B) Particles size fractions percentage distribution.
Considering all size groups with 1 mm difference (according to the major dimension), the smallest particles (1-2 mm) were most abundant compared to the largest particles (>5 mm), while the rest of the size groups were distributed in between in descending order (Figure 6).
Fibers constituted more than 60% of all mesoplastic particles (major dimension ranging from 5.03 mm to 120.12 mm), and around 31% were fragments. Film particles were less common (approximately 5%). In some beaches, i.e., 5. Akmenrags, 8. Ventspils, and 17. Majori, fragments were the dominant type of particles.
In the microplastics fraction (1-5mm), almost 70% of particles were fibers, around 30% were fragments (dominating in 5. Akmenrags, 8. Ventspils, and 14. Abragciems), and less than 1% belonged to films (Figure 7).
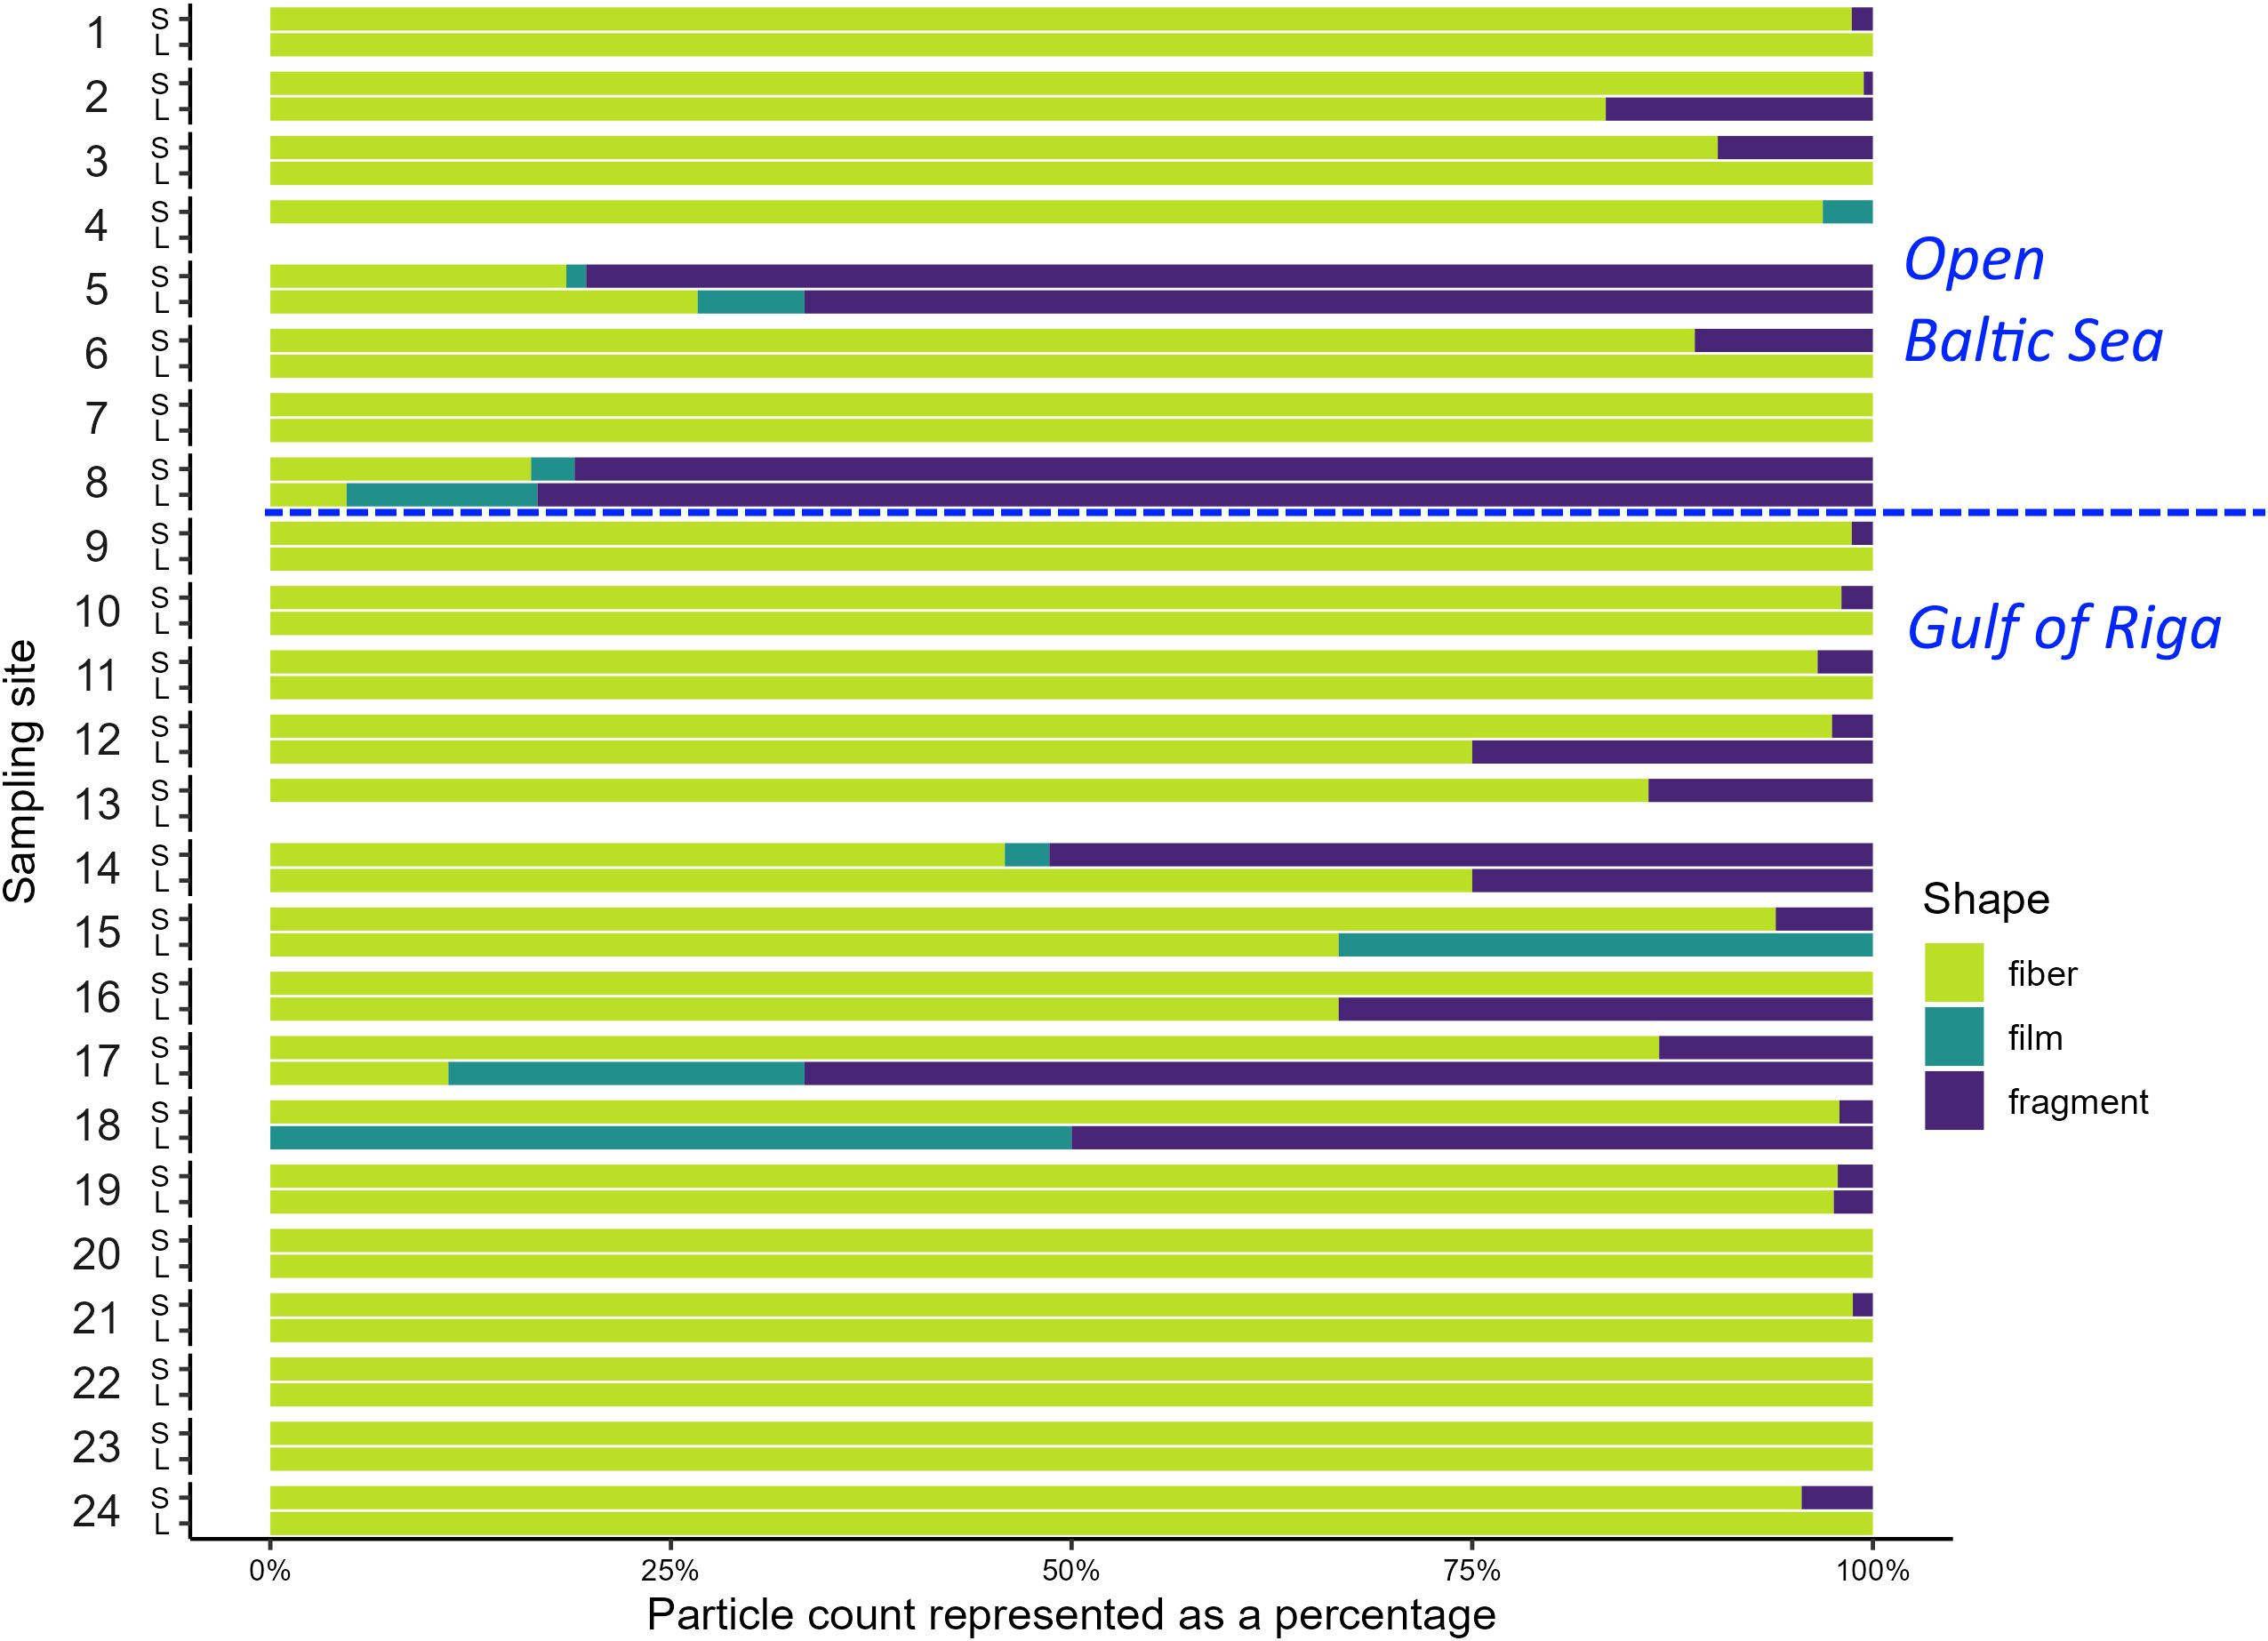
Figure 7 Percentage distribution of micro- (S) and mesoplastic (L) particles according to their shape. Sampling sites as per Figure 1.
The most dominant particle colors both for meso- and microplastic fractions were black (28% and 29%), white (27% and 15%), blue (11% and 25%), and transparent (10% and 9%). Other colors recorded, which did not exceed 9%, were red, pink, purple, green, grey, orange, yellow, brown, and multicolored.
A total of 212 particles were detected in the mesoplastics fraction, of which the polymer type was determined for 76 particles (35.8% of the total number of particles). Of those, polyethylene (PE) constituted 57.9%, polypropylene (PP) 26.3%, and polystyrene (PS) 1.3%; other types of plastic (13.2%), e.g., polyester (PES), acrylic, and polyurethane (PUR), were also found. Moreover, 1.3% consisted of particles that were not identified as plastic, i.e., chitin, cotton, or linen.
A total of 3454 particles were detected in the microplastics fraction, of which the polymer type was determined for 988 particles (28.6%): PE - 70.3%, PP - 21.5%, and PS - 3.8% were the most common types of polymers. Meanwhile, 1.6% consisted of other types of polymers, e.g., PES, acrylic, ethylene-vinyl acetate (EVA), polyethylene terephthalate (PET), and polylactide acid (PLA). Slightly more than 2% were identified as non-plastic particles.
ANOVA indicated no significant differences in particle concentrations between the open Baltic Sea and the GoR sampling sites or between the eastern, western, and southern GoR regions (particles 1-5mm p=0.184; particles >5mm p=0.706). However, when only the GoR western (sampling sites 10. Kolka, 11. Purciems, 12. Roja, 13. Mersrags, 14. Abragciems, 15. Engure, and 16. Lapmezciems) and eastern (20. Lilaste, 21. Saulkrasti, 22. Laucu akmens, 23. Tuja, and 24. Salacgriva) parts were compared, the t-test indicated significant differences among particle concentrations for particle size 1-5mm (p=0.027) (Figure 8).

Figure 8 Boxplots of particle concentrations (particles/kg dry sand) divided according to sampling location (brackets above indicate the t-test significance levels).
There was no significant relationship between the coastal area suitability for recreation and particle concentrations (Figure 9); nevertheless, the boxplots and p-values of the t-test implied that the relationship is clearer among non-fiber particles (Figure 9B) than among fiber particles (Figure 9A).
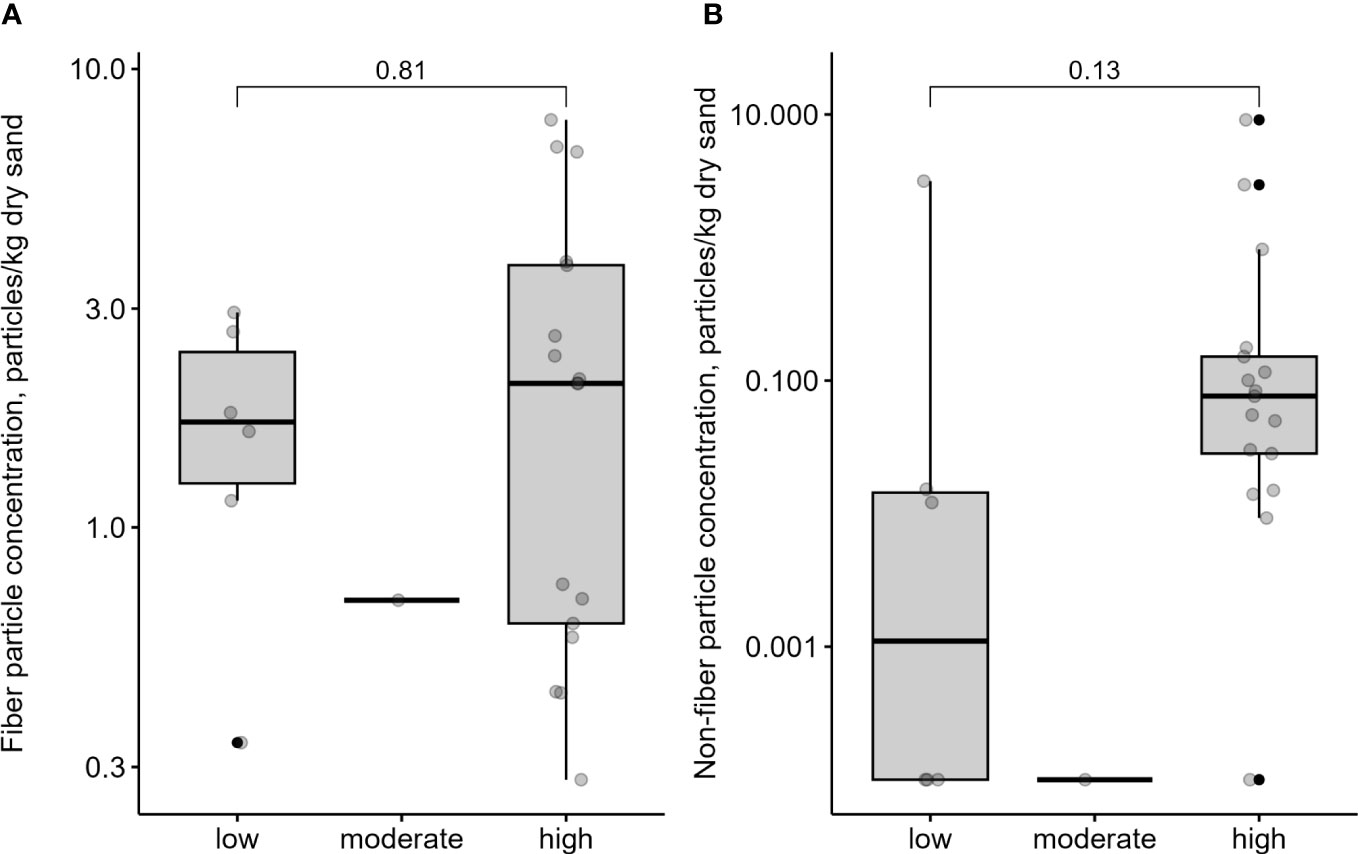
Figure 9 Boxplots of fiber (A) and non-fiber (B) particle concentrations (particles/kg dry sand) as divided in classes for suitability of coastal sites for recreation (brackets above indicate the t-test significance levels), adapted from Ruskule et al. (2018): low - low/very low suitability for recreational use; moderate - moderate suitability, extensively used for traditional activities; high - high/very high value of suitability for recreation.
Multivariate statistics (PCA and HCA analyses) were used to identify if there was a connection between the particle descriptives and sediment granulometry variables. Two principal components (PCs) for both datasets (1-5 mm and >5 mm particle size) were retained, with eigenvalues larger than 1 (Kaiser, 1958) and explaining around 70% of the total variance in both datasets (see Supplementary Material, Table S2). Two clusters from the HCA were delineated in both datasets (see Supplementary Material, Table S3 for more details). The combined results of the multivariate analyses are shown in Figure 10.
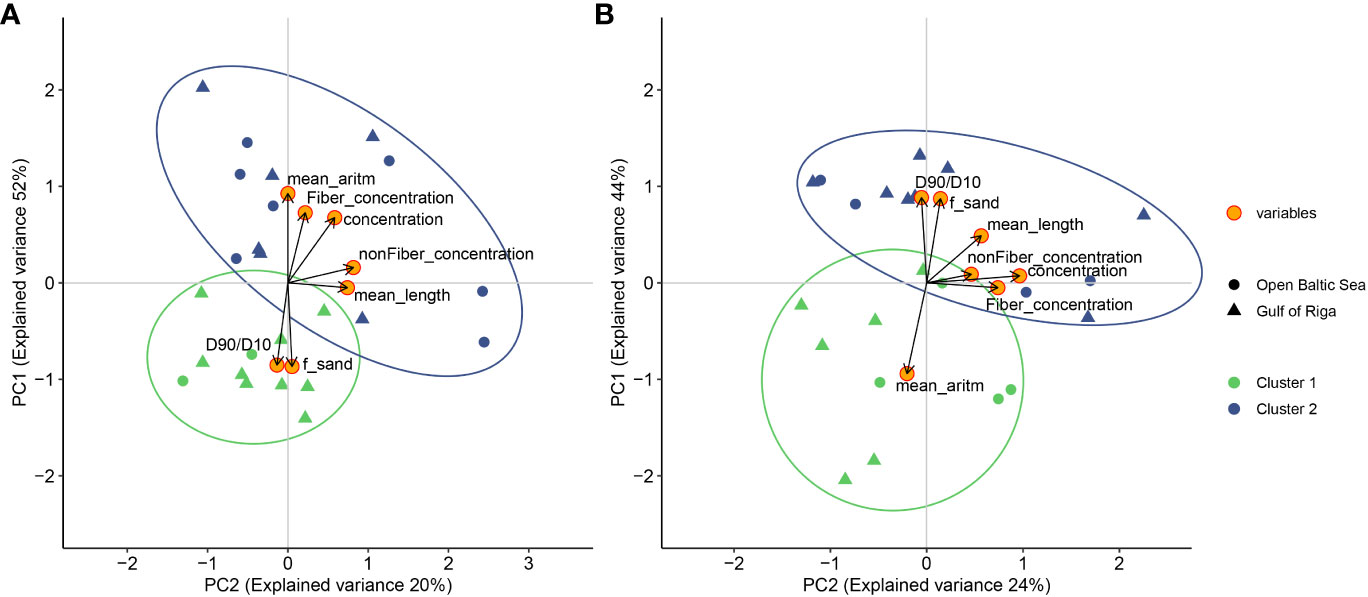
Figure 10 Multivariate statistical analyses for (A) microplastic dataset with particle size 1-5 mm and (B) mesoplastic dataset with particle size >5 mm. Samples are grouped by color according to the representative clusters identified via hierarchical cluster analysis and by shapes according to the sampling site location in either the open Baltic Sea or the Gulf of Riga (GoR). Coordinates of variables along the principal components 1 and 2 show granulometry variables and particles descriptives: D90/D10 - the ratio of the 90th percentile and the 10th percentile of the grain-size distribution; f_sand - percentage of the grain-size Fine Sand class (125 - 250 µm); mean_length - mean particle length; concentration - particles/kg dry sand; non-fiber particles\kg (i.e., fragments and foils, further as nonFiber_concentration), fiber particles/kg dry sand (Fiber_concentration); mean_aritm - the mean of the grain-size distribution. Two sites (4-Liepaja Karosta and 13-Mersrags) were not included in the multivariate analysis of the meso-dataset (B) as no particles were found there.
In the microplastic dataset, PC1 showed (Figure 10A) an increase in the mean values of the sand grain size (mean_aritm) along with the particles/kg dry sand (concentration) and fiber particles per kg (Fiber_concentration) increase, indicating that a higher concentration of particles and especially fiber particles was found in coarser sand. Pearson correlation coefficients supported the results, i.e., the concentration of all the particles (“concentration” variable), and fiber particles showed a positive correlation with the mean sand grain size (mean_aritm) (Supplementary Material, Figure S3). While PC2 indicated that non-fiber particle concentration is not dependent on sediment granulometry. Moreover, insignificant Pearson correlation coefficients between non-fiber particles and any sand grain size parameters were observed.
In the mesoplastic dataset, PC1 and PC2 did not reflect (Figure 10B) any granulometry impacts on the particle variables (concentration, nonFiber_concentration, and Fiber_concentration). Similar to the PCA results, the concentration of particles of size >5 mm did not show significant correlations with the sand grain-size parameters (Supplementary Material, Figure S4).
As can be observed from Figure 10A, samples from the microplastic dataset (particle size 1-5 mm) grouped into Cluster 1 mostly represented the GoR, with emphasis on the western and, partly, the southern parts. Some samples showed slightly positive PC2 loadings, while none had positive PC1 scores. The majority of Cluster 2 samples were located in the open Baltic Sea and eastern part of the GoR. Most of these samples had high positive PC1 loadings, indicating a relationship between sand granulometry and fiber particles – a higher total particle concentration and higher fiber particle concentration were observed together with larger average sand grain sizes. Some samples from Cluster 2 also had positive PC2 loadings, indicating that the samples also contained non-fiber particles. There was no clear division between the locations of the sampling sites based on the variables used in the HCA for the mesoplastic dataset (particle size >5 mm) (Figure 10B).
Figure 11 illustrates the two clusters with a statistically significant different concentration of 1-5 mm p/kg (p<0.001 for all particles; p=0.3 for non-fiber particles; p=0.005 for fiber particles). No statistically significant differences were observed in particle concentrations when comparing sampling sites between the open Baltic Sea and the GoR (p = 0.26 for 1–5 mm and p = 0.37 for >5 mm particles).
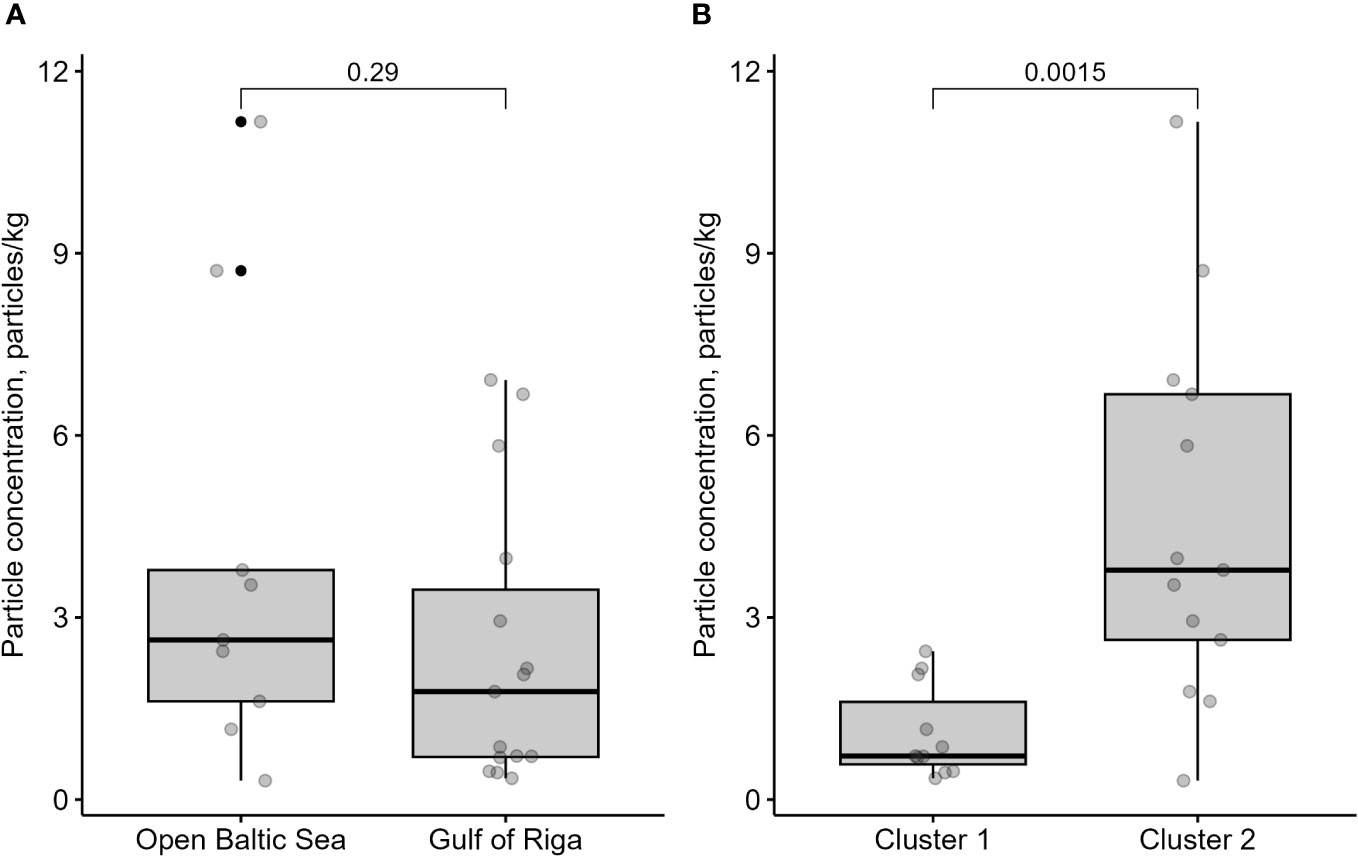
Figure 11 Boxplots displaying the differences in particle concentrations (particles/kg dry sand) for the microplastic dataset (1-5 mm) grouped by (A) samples collected from the open Baltic Sea and Gulf of Riga sampling sites and (B) the delineated two clusters by hierarchical cluster analysis. The number above the horizontal line indicates the p-value of the t-test in the group comparison.
We found considerable differences of micro- and meso- plastics abundance and particles’ shape between the sampling sites from the open Baltic Sea and the western, southern, and eastern parts of the semi-closed GoR. On average, fewer particles were present in both the micro- and mesoplastic samples of the GoR compared to those of the open Baltic Sea sites. The GoR samples were associated with finer sand particles; along the open Baltic Sea coastline, there were higher concentrations of plastic particles in coarser sand, and this was particularly relevant for fiber-shaped particles. Fibers comprised the dominant form in both the micro- and mesoplastic datasets.
Piperagkas and Papageorgiou (2021) reported that lightweight microplastics, mostly composed of microfibers and membranes in their study, could move further than hard microplastics and varied less during the seasonal sampling. Liebezeit and Dubaish (2012) suggested that fibers might exhibit a different settling behavior to granular microplastics. Experimental observations show that cylindrical microplastic particles (including fibers) tend to settle with their long axis predominantly horizontal (Goral et al., 2023). Nevertheless, if we look closer (data statistical analysis), there are factors also distinguishing between different parts of the GoR; hence, it turns out the eastern part of the GoR is more similar to the open Baltic Sea (higher total particles/fibers concentration associated with coarser sand). The western and southern GoR sampling sites were grouped into a second cluster that was characterized by more fine sand and lower total particle/fiber concentrations. These two clusters were valid only for microplastics (1-5 mm). Data were not sufficient to form conclusions about polymer-type distribution within different fractions and sampling sites.
Wave energy is lower in the Baltic Sea than in other areas of Europe. The average wave energy in the Baltic Sea is around 2.4 to 5.2 kW/m (Waters et al., 2009; Kovaleva et al., 2017), while it is around 12–17 and 24–48 kW/m in the North Sea and Atlantic Ocean, respectively (Sørensen and Chozas, 2010). Our calculations using real-time significant wave height data obtained from a SmartBuoy near Pavilosta showed an average wave energy of 2.28 kW/m during May–September 2021. In the GoR, due to its sheltered location and limited wind fetch, the wave power density is generally below 1 kW/m, with the highest values occurring in winter (Soomere, 2005; Kovaleva et al., 2017). SmartBuoy data in the GoR near the Skulte harbor showed average wave power at 0.63 kW/m for the time period of May-September 2021. According to existing studies, the beaches that are exposed to higher energy waves in general have coarser sediments than beaches exposed to lower energy waves, i.e., lower energy waves tend to create a more mixed grain-size distribution (Dean and Dalrymple, 2001; Ashton and Murray, 2006). Areas with higher wave energy have an increased speed of water flow and, hence, increased ability to lift and move the particles. Thus, larger sediments are deposited while the finer are carried away. Areas with low wave energy are dominated in general by fine-grained sediments. Simultaneously, the fraction of coarse-grained sediments within the dominating fine sediments is also expected to be rather quiescent as the energy is too low for them to be stirred up and carried further. Nevertheless, fine materials in low-energy environments can still be transported long distances before the settlement (McLaren and Bowles, 1985; Dean and Dalrymple, 2001; Webb et al., 2019).
SmartBuoy measurements from the open Baltic Sea (Pavilosta) showed a clear dominance of northerly currents, which agrees with an overview of the Baltic Sea physical oceanography (Omstedt et al., 2014) in which it was concluded that a strong and stable cyclonic gyre is evident in the Baltic proper. We therefore suggest that, in this region, surface currents transport microplastics to the north along the shoreline and as far as the entrance to the Irbe Strait. Here, further flow might divert between entering the Irbe Strait and proceeding further north, depending on the wind force and atmospheric conditions. Possible microplastic movement within or via the Irbe Strait is difficult to predict as this area is very dynamic, and it strongly depends on water density and sea level differences between the two basins (Baltic proper and GoR), as well as wind force. Nevertheless, existing data show that outflow occurs in the northern part, and inflow along the southern slope is associated with a quasi-permanent S-shaped salinity front in the Irbe Strait (Lilover et al., 1998).
The GoR area has much lower wave power than that of the open Baltic Sea, and it is a low-energy area where the majority of the sampling sites are dominated by fine and medium grain size, as can be seen in Figure 5. In contrast, the Baltic Sea coastline adjacent to high-energy wave action was dominated by gravel, coarse sand, and very coarse sand. Wave energy is one of the key factors in the microplastic fragmentation process, during which fragile plastic pieces create a secondary source of microplastics in marine environments (Costa et al., 2010; do Sul and Costa, 2014; Harris, 2020), i.e., plastic particles are becoming smaller and more numerous as wave energy increases. Coarser sand also serves as a filter trapping various types of microplastics in the beach, including fibers (Chubarenko et al., 2018). Consequently, areas with higher wave energy, i.e., dynamic water circulation and coarser sand, are expected to be more contaminated and have a higher density of microplastics due to fragmentation, filtration, and resuspension processes (Chubarenko et al., 2018; Rey et al., 2021), which is consistent with our results considering differences between the open Baltic Sea part and GoR. However, Vermeiren et al. (2021) emphasized that the relationship between sediment grain size and microplastic deposition on sandy beaches is not well understood. Contrary to our findings, previous studies have demonstrated that higher microplastic concentrations can be found in finer coastal sediments (Harris, 2020; Mendes et al., 2021; Wilson et al., 2021). According to research by Harris (2020), the dispersal of microplastic is comparable to the movement of natural sediments: coarse-grained and dense particles are deposited close to their sources, and less dense, smaller particles remain in suspension in low-energy environments (Gob et al., 2010; Mendes et al., 2021). Wilson et al. (2021) also noted that sheltered coastal areas with lower wave energies and finer sediments have a higher abundance of microplastics. Pinheiro et al. (2019) showed that beaches protected by rocks contain significantly more microplastics than exposed beaches. Compared to the studies mentioned above, the coastlines of both the open Baltic Sea and GoR are rather regular, containing no uneven features (bays, protruding cliffs, etc.). Hence, there are no natural or artificial shelters present. However, the farthest eastern point of the country (Sampling site 5. Akmenrags), which can be considered as a sheltered, accumulating area, contained the highest concentration of plastics found within our study (Figure 6).
Either the semi-enclosed GoR itself is the source of microplastics or microplastics enter the gulf from coastal regions or via rivers; the dynamics of the currents are one of the key factors when talking about possible transport mechanisms of microplastics within the gulf. As the GoR has estuary-type characteristics, the common concept of the gulf is that outflow/inflow occurs through the surface/bottom layers via the Irbe strait with cyclonic (anti-clockwise) mean surface circulation within the gulf (Yurkovskis et al., 1993; Elken et al., 2003; Leppäranta and Myrberg, 2009). Moreover, historical surveys have shown that cyclonic patterns can change to anticyclonic (Berzinsh, 1980; Lips et al., 1995). These cyclonic/anticyclonic gyres, together with the characteristics of river plume dynamics, have been described in more detail in model studies (Soosaar et al., 2014; Lips et al., 2016a; Lips et al., 2016b), which demonstrated that the circulation pattern is largely influenced by the prevailing winds across different seasons and years.
In situ current measurements in the GoR are scarce, and only a few publications include such data. Our data, obtained from SmartBuoy measurements during May–September 2001, are nevertheless in accordance with the model findings by Lips et al. (2016a) – in the eastern part of the gulf, the direction of surface currents was S-SW, confirming the conclusion that in the warm season (when stratification has been formed), the GoR is characterized by the anticyclonic circulation pattern. Circulation patterns and their changes determine the general dynamics and characteristics of the entire gulf. For example, due to the summertime anticyclonic circulation, freshwater (together with suspended matter) from the south can be transported along the west coast, measured as a decreased salinity in surface waters (Lips et al., 2016b). Excessive freshwater discharge in the southern and southeastern parts via three large rivers—the Daugava, Lielupe, and Gauja—is another feature of the GoR. Further transport of microplastics within the gulf is largely affected by freshwater flow characteristics in combination with the morphology of the gulf itself. Most freshwater in the southeast propagates to the north along the east coast of the GoR, forming a buoyant coastal plume (e.g., Elken et al., 2003). We suggest that this is one of the main reasons why we observed noticeably higher microplastic concentrations in south-east beaches 19. Vecaki, 20. Lilaste, and 21. Saulkrasti (Figure 6) in comparison to most of the sampling sites in the GoR (Supplementary Material, Figure S2). Many authors have previously emphasized the importance of freshwater rivers as a source of microplastic pollution (Claessens et al., 2011; Vianello et al., 2013; Frishfelds et al., 2022). The Latvian coastline, especially the GoR, receives freshwater from many rivers, some of them also of transboundary origin.
In addition, local processes such as upwellings can potentially shift microplastic particles away from coastal regions or invoke microplastics into the water column from sediments. However, thus far, few studies have focused on this phenomenon (Díez-Minguito et al., 2020; Mishra et al., 2022; Chen et al., 2023).
The identification of links between microplastic pollution and human activities is a complex task, and previous studies have often presented ambiguous conclusions. Human population density has been among the key drivers for microplastic contamination (Corcoran et al., 2020; Vermeiren et al., 2021). Van Cauwenberghe et al.’s (2015) review article highlighted that microplastics are more often abundant in densely populated areas, while high anthropogenic inputs of microplastics were observed through rivers, coastal tourism, and harbor activities by Vetrimurugan et al. (2020). However, Claessens et al. (2011) could not establish a clear link between local human activities and microplastic concentrations; however, elevated concentrations appeared to be linked to harbor sediments. Similarly, our study showed no clear relationship between the suitability of coastal areas for recreational and tourism activities and particle concentrations.
According to official Latvian statistics from 2020 regarding population density by place of residence (people/km2) (Central Statistical Bureau of Latvia, 2022), the areas where we observed higher micro- and mesoplastic concentrations—i.e., along the open Baltic Sea coastline—are considerably less populated (mostly 3–10 people/km2) than the GoR region, where the capital city of Riga is located (more than 50% of the country’s inhabitants live in Riga and its vicinity). The same can be concluded about coastal suitability for recreation – the open Baltic Sea coastline has lower suitability for tourism and leisure compared to the GoR (Ruskule et al., 2018). Considering the data of Latvian beach visitors per year, the same coherence can be observed – all the most visited beaches are located in the GoR area, which is also generally more visited than the beaches located in the open Baltic Sea area (Klepers et al., 2020). Hence, we would like to emphasize that the population density and tourism intensity in our study area are negligible compared to other research areas, where a correlation between microplastic concentration and tourism activities was observed.
Microplastic pollution is a crucial environmental issue that requires targeted and effective communication to raise awareness and consequently promote action toward mitigating the pollution. The approach used in this study - the involvement of citizens in sample collection - rendered the otherwise unseen pollution visible to members of the public and built their understanding of the extent of microplastic pollution; when tackling the issue of plastic pollution, citizen science greatly facilitates the formation of evidence-based policies (Nelms et al., 2022). In our study, approximately 250 participants of different ages took part, representing different sectors – society at large, NGOs, education institutions, municipalities, and mass media. Since it was the first ever instance of micro- and mesoplastic pollution mapping along the whole coastline of the country, it received considerable reflection via local and national media websites, local press, radio, and television. The LIAE team representatives were also invited to take part in discussions and present their findings on different happenings to society at large. Hence, the citizen science approach used in this study has contributed to public education and environmental awareness. This is likely to influence policymaking decisions at both the local and national levels in terms of initiating new research, implementing improved monitoring strategies, and promoting sustainable pollution mitigation policies. Nevertheless, it is important to follow some basic rules when employing citizen science advantages – instructions given need to be short, clear, and simple and must be repeated on every occasion of data collecting, and feedback is important.
Microplastic pollution in beach sand was found in all 24 sampling sites along the Latvian coastline, while mesoplastic pollution occurred in 22 sites. For both the micro- and mesoplastic datasets, fibers were the most common. Microplastic particle shape and abundance differed between the open Baltic Sea and the GoR; a distinction could also be made between the eastern part and the rest of the GoR, most likely owing to the impact of hydrodynamics (waves and currents). Sand granulometry was associated with microparticle concentrations. However, the influence of tourism/leisure intensity on the distribution of microplastic pollution did not show a clear pattern. We propose several factors to be analyzed in microplastic pollution studies to support the result interpretation, namely, the sampling season impact, wave energy, wind, current patterns, sand granulometry, and pollution sources. More studies are encouraged that address these factors as microplastic pollution can vary locally and temporarily. As more data are collected, it can be valuable to use model simulations to determine the possible transport of microplastics (e.g., inserting microplastics as tracer particles in the model, looking for possible transport dynamics, and comparing with the available in situ data/samples obtained). Since microplastic pollution in the beach environment is expected to be set as one of the micro-litter baselines in Europe, with threshold values to be established, a unified methodology regarding sampling, samples preparation, analysis, and data interpretation is highly recommended.
The original contributions presented in the study are included in the article/Supplementary Material. Further inquiries can be directed to the corresponding author.
ID-D and JA performed the conceptualization and design of the study. ID-D, AB, MB, AP, and SS took part in the sample collection, purification, and analysis. JB and IR ensured the data and statistical analysis, including visualization. MS and MV contributed to environmental data collection, analysis, and interpretation. All authors contributed to manuscript text preparation. All authors contributed to the article and approved the submitted version.
The author(s) declare financial support was received for the research, authorship, and/or publication of this article. This work was supported by voluntary donations from the student sorority Selga, the European Regional Development Fund post-doctoral projects No.1.1.1.2/VIAA/2/18/359 and No.1.1.1.2/VIAA/4/20/733, ESF Project No. 8.2.2.0/20/I/003 “Strengthening of Professional Competence of Daugavpils University Academic Personnel of Strategic Specialization Branches 3rd Call”, and the European Economic Area (EEA) Financial Mechanism 2014–2021 Baltic Research Programme (grant EMP480).
We would like to acknowledge all citizen scientists for the collected samples and LIAE colleagues Natalija Suhareva, Sintija Busmane, and Sandra Sprukta for their practical support of this study.
The authors declare that the research was conducted in the absence of any commercial or financial relationships that could be construed as a potential conflict of interest.
All claims expressed in this article are solely those of the authors and do not necessarily represent those of their affiliated organizations, or those of the publisher, the editors and the reviewers. Any product that may be evaluated in this article, or claim that may be made by its manufacturer, is not guaranteed or endorsed by the publisher.
The Supplementary Material for this article can be found online at: https://www.frontiersin.org/articles/10.3389/fmars.2023.1251068/full#supplementary-material
Alomar C., Estarellas F., Deudero S. (2016). Microplastics in the Mediterranean Sea: Deposition in coastal shallow sediments, spatial variation and preferential grain size. Mar. Environ. Res. 115, 1–10. doi: 10.1016/j.marenvres.2016.01.005
AMAP (2021) AMAP litter and microplastics monitoring plan (Tromsø, Norway). Available at: https://www.amap.no/documents/doc/amap-litter-and-microplastics-monitoring-plan/3522 (Accessed June 6, 2023).
Ashton A. D., Murray A. B. (2006). High-angle wave instability and emergent shoreline shapes: 1. Modeling of sand waves, flying spits, and capes. J. Geophys. Res. Earth Surf. 111. doi: 10.1029/2005JF000422
Berzinsh V. (1980). Interannual and seasonal changes of water salinity in the Gulf of Riga. Rybokhozyaistvennye issledovaniya 15, 3–12.
Berzinsh V. (1995). Hydrology in ecosystem of the gulf of riga between 1920 and 1990 (Tallinn: Estonian Acad. Publ).
Besley A., Vijver M. G., Behrens P., Bosker T. (2017). A standardized method for sampling and extraction methods for quantifying microplastics in beach sand. Mar. pollut. Bull. 114, 77–83. doi: 10.1016/j.marpolbul.2016.08.055
Bhuyan M. (2022). Effects of microplastics on fish and in human health. Front. Environ. Sci. 10. doi: 10.3389/fenvs.2022.827289
Bosker T., Behrens P., Vijver M. G. (2017). Determining global distribution of microplastics by combining citizen science and in-depth case studies. Integr. Environ. Assess Manage. 13, 536–541. doi: 10.1002/ieam.1908
Botterell Z. L. R., Beaumont N., Dorrington T., Steinke M., Thompson R. C., Lindeque P. K. (2019). Bioavailability and effects of microplastics on marine zooplankton: A review. Environ. pollut. 245, 98–110. doi: 10.1016/j.envpol.2018.10.065
Campanale C., Massarelli C., Savino I., Locaputo V., Uricchio V. F. (2020). A detailed review study on potential effects of microplastics and additives of concern on human health. Int. J. Environ. Res. Public Health 17, 1212. doi: 10.3390/ijerph17041212
Carbery M., MacFarlane G. R., O’Connor W., Afrose S., Taylor H., Palanisami T. (2020). Baseline analysis of metal(loid)s on microplastics collected from the Australian shoreline using citizen science. Mar. pollut. Bull. 152, 110914. doi: 10.1016/j.marpolbul.2020.110914
Central Statistical Bureau of Latvia (2022) Population in cities, towns and counties. Available at: https://stat.gov.lv/en/statistics-themes/population/population/247-population-and-population-change (Accessed June 30, 2023).
Chen X., Zhao P., Wang D., Wang L., Zhao H., Wang X., et al. (2023). Microplastics in marine sediments in Eastern Guangdong in the South China sea: factors influencing the seasonal and spatial variations. Water 15, 1160. doi: 10.3390/w15061160
Chouchene K., Prata J. C., da Costa J., Duarte A. C., Rocha-Santos T., Ksibi M. (2021). Microplastics on Barra beach sediments in Aveiro, Portugal. Mar. pollut. Bull. 167, 112264. doi: 10.1016/j.marpolbul.2021.112264
Chubarenko I., Esiukova E., Bagaev A., Isachenko I., Demchenko N., Zobkov M., et al. (2018). “Chapter 6 - behavior of microplastics in coastal zones,” in Microplastic contamination in aquatic environments. Ed. Zeng E. Y. (Amsterdam, Netherlands:Elsevier), 175–223. doi: 10.1016/B978-0-12-813747-5.00006-0
Claessens M., Meester S. D., Landuyt L. V., Clerck K. D., Janssen C. R. (2011). Occurrence and distribution of microplastics in marine sediments along the Belgian coast. Mar. pollut. Bull. 62, 2199–2204. doi: 10.1016/j.marpolbul.2011.06.030
Constant M., Kerhervé P., Mino-Vercellio-Verollet M., Dumontier M., Sànchez Vidal A., Canals M., et al. (2019). Beached microplastics in the Northwestern Mediterranean Sea. Mar. pollut. Bull. 142, 263–273. doi: 10.1016/j.marpolbul.2019.03.032
Corcoran P. L., de Haan Ward J., Arturo I. A., Belontz S. L., Moore T., Hill-Svehla C. M., et al. (2020). A comprehensive investigation of industrial plastic pellets on beaches across the Laurentian Great Lakes and the factors governing their distribution. Sci. Total Environ. 747, 141227. doi: 10.1016/j.scitotenv.2020.141227
Costa M. F., Ivar do Sul J. A., Silva-Cavalcanti J. S., Araújo M. C. B., Spengler Â., Tourinho P. S. (2010). On the importance of size of plastic fragments and pellets on the strandline: a snapshot of a Brazilian beach. Environ. Monit. Assess 168, 299–304. doi: 10.1007/s10661-009-1113-4
Dean R. G., Dalrymple R. A. (1991). Water wave mechanics for engineers & Scientists (Singapore: World Scientific Publishing).
Dean R. G., Dalrymple R. A. (2001). Coastal processes with engineering applications (Cambridge: Cambridge University Press). doi: 10.1017/CBO9780511754500
de Sá L. C., Oliveira M., Ribeiro F., Rocha T. L., Futter M. N. (2018). Studies of the effects of microplastics on aquatic organisms: What do we know and where should we focus our efforts in the future? Sci. Total Environ. 645, 1029–1039. doi: 10.1016/j.scitotenv.2018.07.207
Díez-Minguito M., Bermúdez M., Gago J., Carretero O., Viñas L. (2020). Observations and idealized modelling of microplastic transport in estuaries: The exemplary case of an upwelling system (Ría de Vigo, NW Spain). Mar. Chem. 222, 103780. doi: 10.1016/j.marchem.2020.103780
Döös K., Meier H. E. M., Döscher R. (2004). The baltic haline conveyor belt or the overturning circulation and mixing in the baltic. Ambio 33, 261–266. doi: 10.1579/0044-7447-33.4.261
do Sul J. A. I., Costa M. F. (2014). The present and future of microplastic pollution in the marine environment. Environ. pollut. 185, 352–364. doi: 10.1016/j.envpol.2013.10.036
Doyen P., Hermabessiere L., Dehaut A., Himber C., Decodts M., Degraeve T., et al. (2019). Occurrence and identification of microplastics in beach sediments from the Hauts-de-France region. Environ. Sci. pollut. Res. 26, 28010–28021. doi: 10.1007/s11356-019-06027-8
Duncan E. M., Arrowsmith J., Bain C., Broderick A. C., Lee J., Metcalfe K., et al. (2018). The true depth of the Mediterranean plastic problem: Extreme microplastic pollution on marine turtle nesting beaches in Cyprus. Mar. pollut. Bull. 136, 334–340. doi: 10.1016/j.marpolbul.2018.09.019
Elken J., Raudsepp U., Lips U. (2003). On the estuarine transport reversal in deep layers of the Gulf of Finland. J. Sea Res. 49, 267–274. doi: 10.1016/S1385-1101(03)00018-2
Enders K., Käppler A., Biniasch O., Feldens P., Stollberg N., Lange X., et al. (2019). Tracing microplastics in aquatic environments based on sediment analogies. Sci. Rep. 9, 15207. doi: 10.1038/s41598-019-50508-2
Eo S., Hong S. H., Song Y. K., Lee J., Lee J., Shim W. J. (2018). Abundance, composition, and distribution of microplastics larger than 20 μm in sand beaches of South Korea. Environ. pollut. 238, 894–902. doi: 10.1016/j.envpol.2018.03.096
European Parliament, and Council of the European Union (2008) Directive 2008/56/EC of the European Parliament and of the Council of 17 June 2008 establishing a framework for community action in the field of marine environmental policy (Marine Strategy Framework Directive). Available at: http://data.europa.eu/eli/dir/2008/56/oj/eng (Accessed June 5, 2023).
Fournier J., Gallon R. K., Paris R. (2014). G2Sd: a new R package for the statistical analysis of unconsolidated sediments. Geomorphol. Relief Process Environ. 20, 73–78. doi: 10.4000/geomorphologie.10513
Frishfelds V., Murawski J., She J. (2022). Transport of microplastics from the daugava estuary to the open sea. Front. Mar. Sci. 9. doi: 10.3389/fmars.2022.886775
Gauci A., Deidun A., Montebello J., Abela J., Galgani F. (2019). Automating the characterisation of beach microplastics through the application of image analyses. Ocean Coast. Manag 182, 104950. doi: 10.1016/j.ocecoaman.2019.104950
GESAMP (2019). Guidelines for the monitoring and assessment of plastic litter in the ocean. Eds. Kershaw P. J., Turra A., Galgani F., 123, Rep. Stud. GESAMP No. 99 (London, United Kingdom: GESAMP).
Geyer R., Jambeck J. R., Law K. L. (2017). Production, use, and fate of all plastics ever made. Sci. Adv. 3, e1700782. doi: 10.1126/sciadv.1700782
Gob F., Bravard J.-P., Petit F. (2010). The influence of sediment size, relative grain size and channel slope on initiation of sediment motion in boulder bed rivers. A lichenometric study. Earth Surf. Process Landf. 35, 1535–1547. doi: 10.1002/esp.1994
González-Hernández M., Hernández-Sánchez C., González-Sálamo J., López-Darias J., Hernández-Borges J. (2020). Monitoring of meso and microplastic debris in Playa Grande beach (Tenerife, Canary Islands, Spain) during a moon cycle. Mar. pollut. Bull. 150, 110757. doi: 10.1016/j.marpolbul.2019.110757
Goral K. D., Guler H. G., Larsen B. E., Carstensen S., Christensen E. D., Kerpen N. B., et al. (2023). Settling velocity of microplastic particles having regular and irregular shapes. Environ. Res. 228, 115783. doi: 10.1016/j.envres.2023.115783
Gyraite G., Haseler M., Balčiūnas A., Sabaliauskaitė V., Martin G., Reisalu G., et al. (2022). A new monitoring strategy of large micro-, meso- and macro-litter: A case study on sandy beaches of baltic lagoons and estuaries. Environ. Manage 72, 410–423. doi: 10.1007/s00267-022-01755-z
Harris P. T. (2020). The fate of microplastic in marine sedimentary environments: A review and synthesis. Mar. pollut. Bull. 158, 111398. doi: 10.1016/j.marpolbul.2020.111398
Haseler M., Balciunas A., Hauk R., Sabaliauskaite V., Chubarenko I., Ershova A., et al. (2020). Marine litter pollution in baltic sea beaches – application of the sand rake method. Front. Environ. Sci. 8. doi: 10.3389/fenvs.2020.599978
HELCOM (2009). Ensuring safe shipping in the Baltic (Helsinki, Finland: Helsinki Commission – HELCOM).
HELCOM (2022). HELCOM Guidelines for the annual and periodical compilation and reporting of waterborne pollution inputs to the Baltic Sea (PLC-Water) (Helsinki, Finland: Helsinki Commission – HELCOM).
Hidalgo-Ruz V., Thiel M. (2013). Distribution and abundance of small plastic debris on beaches in the SE Pacific (Chile): A study supported by a citizen science project. Mar. Environ. Res. 87–88, 12–18. doi: 10.1016/j.marenvres.2013.02.015
Jones J. S., Guézou A., Medor S., Nickson C., Savage G., Alarcón-Ruales D., et al. (2022). Microplastic distribution and composition on two Galápagos island beaches, Ecuador: Verifying the use of citizen science derived data in long-term monitoring. Environ. pollut. 311, 120011. doi: 10.1016/j.envpol.2022.120011
Kaiser H. F. (1958). The varimax criterion for analytic rotation in factor analysis | SpringerLink. Psychometrika 23, 187–200. doi: 10.1007/BF02289233
Klepers A., Mārdega I., Ulme J. (2020) 2. ziņojums. Baltijas jūras piekrastes apmeklējuma, tā radītās slodzes uz vidi un infrastruktūras izvērtējums pašvaldību teritoriālo vienību griezumā. Rīga, Valmiera, Latvijas jūras piekraste: Vides aizsardzības un reǵionālās attīstības ministrija. Available at: https://drive.google.com/file/d/1z8zdbUlVr9fVZt-aJ8EmV4TfAMv9gTzJ/view?usp=sharing.
Kovaleva O., Eelsalu M., Soomere T. (2017). Hot-spots of large wave energy resources in relatively sheltered sections of the Baltic Sea coast. Renewable Sustain. Energy Rev. 74, 424–437. doi: 10.1016/j.rser.2017.02.033
Kutralam-Muniasamy G., Pérez-Guevara F., Shruti V. C. (2022). (Micro)plastics: A possible criterion for beach certification with a focus on the Blue Flag Award. Sci. Total Environ. 803, 150051. doi: 10.1016/j.scitotenv.2021.150051
Leppäranta M., Myrberg K. (2009). Physical oceanography of the Baltic sea. 1st ed (Berlin, Heidelberg: Springer).
Liebezeit G., Dubaish F. (2012). Microplastics in beaches of the East Frisian islands spiekeroog and kachelotplate. Bull. Environ. Contam. Toxicol. 89, 213–217. doi: 10.1007/s00128-012-0642-7
Lilover M.-J., Lips U., Laanearu J., Liljebladh B. (1998). Flow regime in the irbe strait. Aquat. Sci. 60, 253–265. doi: 10.1007/s000270050040
Lips U., Lilover M.-J., Raudsepp U., Talpsepp L. (1995). “Water renewal processes and related hydrographic structures in the Gulf of Riga.” in Hydrographic studies within the Gulf of Riga project 1993-1994. Eds. Elken J., Toompuu A. (Tallinn: EMI Report Series). 1–34.
Lips U., Zhurbas V., Skudra M., Väli G. (2016a). A numerical study of circulation in the Gulf of Riga, Baltic Sea. Part I: Whole-basin gyres and mean currents. Cont. Shelf Res. 112, 1–13. doi: 10.1016/j.csr.2015.11.008
Lips U., Zhurbas V., Skudra M., Väli G. (2016b). A numerical study of circulation in the Gulf of Riga, Baltic Sea. Part II: Mesoscale features and freshwater transport pathways. Cont. Shelf Res. 115, 44–52. doi: 10.1016/j.csr.2015.12.018
Lots F. A. E., Behrens P., Vijver M. G., Horton A. A., Bosker T. (2017). A large-scale investigation of microplastic contamination: Abundance and characteristics of microplastics in European beach sediment. Mar. pollut. Bull. 123, 219–226. doi: 10.1016/j.marpolbul.2017.08.057
Lyu C., Paterson H. L., Fogarty J. (2022). The spatiotemporal dynamics, distribution, and characteristics of beached plastics along the remote south coast of Western Australia. Mar. pollut. Bull. 184, 114126. doi: 10.1016/j.marpolbul.2022.114126
Mälkki P., Perttilä M. (2012). “Baltic sea water exchange and oxygen balance,” in From the earth’s core to outer space lecture notes in earth sciences. Ed. Haapala I. (Berlin, Heidelberg: Springer), 151–161. doi: 10.1007/978-3-642-25550-2_10
McLaren P., Bowles D. (1985). The effects of sediment transport on grain-size distributions. J. Sediment. Res. 55, 457–470. doi: 10.1306/212F86FC-2B24-11D7-8648000102C1865D
Mendes M. A., Golden N., Bermejo R., Morrison L. (2021). Distribution and abundance of microplastics in coastal sediments depends on grain size and distance from sources. Mar. pollut. Bull. 172, 112802. doi: 10.1016/j.marpolbul.2021.112802
Mesquita Y. W., Mengatto M. F., Nagai R. H. (2022). Where and how? A systematic review of microplastic pollution on beaches in Latin America and the Caribbean (LAC). Environ. pollut. 314, 120231. doi: 10.1016/j.envpol.2022.120231
Mishra A., Buhhalko N., Lind K., Lips I., Liblik T., Väli G., et al. (2022). Spatiotemporal variability of microplastics in the Eastern Baltic sea. Front. Mar. Sci. 9. doi: 10.3389/fmars.2022.875984
Misic C., Covazzi Harriague A., Ferrari M. (2019). Hydrodynamic forcing and sand permeability influence the distribution of anthropogenic microparticles in beach sediment. Estuar. Coast. Shelf Sci. 230, 106429. doi: 10.1016/j.ecss.2019.106429
Nel H. A., Sambrook Smith G. H., Harmer R., Sykes R., Schneidewind U., Lynch I., et al. (2020). Citizen science reveals microplastic hotspots within tidal estuaries and the remote Scilly Islands, United Kingdom. Mar. pollut. Bull. 161, 111776. doi: 10.1016/j.marpolbul.2020.111776
Nelms S. E., Easman E., Anderson N., Berg M., Coates S., Crosby A., et al. (2022). The role of citizen science in addressing plastic pollution: Challenges and opportunities. Environ. Sci. Policy 128, 14–23. doi: 10.1016/j.envsci.2021.11.002
Nhon N. T. T., Nguyen N. T., Hai H. T. N., Hien T. T. (2022). Distribution of microplastics in beach sand on the can Gio Coast, Ho Chi Minh City, Vietnam. Water 14, 2779. doi: 10.3390/w14182779
Nikodemus O., Kļaviņš M., Zelčs V., Krišjāne Z. (2018). Monogrāfija Latvija. Zeme, daba, tauta, valsts. (Rīga, Latvia: LU Akadēmiskais apgāds).
Omstedt A., Elken J., Lehmann A., Leppäranta M., Meier H. E. M., Myrberg K., et al. (2014). Progress in physical oceanography of the Baltic Sea during the 2003–2014 period. Prog. Oceanogr. 128, 139–171. doi: 10.1016/j.pocean.2014.08.010
Paradinas L. M., James N. A., Quinn B., Dale A., Narayanaswamy B. E. (2021). A new collection tool-kit to sample microplastics from the marine environment (Sediment, seawater, and biota) using citizen science. Front. Mar. Sci. 8. doi: 10.3389/fmars.2021.657709
Petrov V. S. (1979). Water balance and water exchange between the Gulf of Riga and the Baltic Proper, Sbornik rabot rizhskoj gidrometeorologicheskoj observatorii (in Russian) (Riga: RGMO).
Pinheiro L. M., Monteiro R. C. P., Ivar do Sul J. A., Costa M. F. (2019). Do beachrocks affect microplastic deposition on the strandline of sandy beaches? Mar. pollut. Bull. 141, 569–572. doi: 10.1016/j.marpolbul.2019.03.010
Piperagkas O., Papageorgiou N. (2021). Changes in (micro and macro) plastic pollution in the sediment of three sandy beaches in the Eastern Mediterranean Sea, in relation to seasonality, beach use and granulometry. Mar. pollut. Bull. 173, 113014. doi: 10.1016/j.marpolbul.2021.113014
Plastic production worldwide 2021 (2023) Statista. Available at: https://www.statista.com/statistics/282732/global-production-of-plastics-since-1950/ (Accessed June 6, 2023).
Rey S. F., Franklin J., Rey S. J. (2021). Microplastic pollution on island beaches, Oahu, Hawai`i. PloS One 16, e0247224. doi: 10.1371/journal.pone.0247224
Ruskule A., Klepers A., Veidemane K. (2018). Mapping and assessment of cultural ecosystem services of Latvian coastal areas. One Ecosyst. 3, e25499. doi: 10.3897/oneeco.3.e25499
Schröder K., Kossel E., Lenz M. (2021). Microplastic abundance in beach sediments of the Kiel Fjord, Western Baltic Sea. Environ. Sci. pollut. Res. 28, 26515–26528. doi: 10.1007/s11356-020-12220-x
Soosaar E., Maljutenko I., Raudsepp U., Elken J. (2014). An investigation of anticyclonic circulation in the southern Gulf of Riga during the spring period. Continental Shelf Res. 78, 75–84. doi: 10.1016/j.csr.2014.02.009
Sørensen H. C., Chozas J. F. (2010). “The potential for wave energy in the North Sea,” in 3rd International Conference and Exhibition on Ocean Energy (ICOE 2010). (Bilbao, Spain: ICOE 2010), 6.
Thorpe T. (1999). An overview of wave energy technologies: status, performance and costs. Wave power: moving towards commercial viability 26, 50–120.
Urban-Malinga B., Zalewski M., Jakubowska A., Wodzinowski T., Malinga M., Pałys B., et al. (2020). Microplastics on sandy beaches of the southern Baltic Sea. Mar. pollut. Bull. 155, 111170. doi: 10.1016/j.marpolbul.2020.111170
US EPA (2021) EPA’s microplastic beach protocol. A community science protocol for sampling microplastic pollution. Available at: https://www.epa.gov/system/files/documents/2021-09/microplastic-beach-protocol_sept-2021.pdf.
Van Cauwenberghe L., Devriese L., Galgani F., Robbens J., Janssen C. R. (2015). Microplastics in sediments: A review of techniques, occurrence and effects. Mar. Environ. Res. 111, 5–17. doi: 10.1016/j.marenvres.2015.06.007
Vermeiren P., Lercari D., Muñoz C. C., Ikejima K., Celentano E., Jorge-Romero G., et al. (2021). Sediment grain size determines microplastic exposure landscapes for sandy beach macroinfauna. Environ. pollut. 286, 117308. doi: 10.1016/j.envpol.2021.117308
Vetrimurugan E., Jonathan M. P., Sarkar S. K., Rodríguez-González F., Roy P. D., Velumani S., et al. (2020). Occurrence, distribution and provenance of micro plastics: A large scale quantitative analysis of beach sediments from southeastern coast of South Africa. Sci. Total Environ. 746, 141103. doi: 10.1016/j.scitotenv.2020.141103
Vianello A., Boldrin A., Guerriero P., Moschino V., Rella R., Sturaro A., et al. (2013). Microplastic particles in sediments of Lagoon of Venice, Italy: First observations on occurrence, spatial patterns and identification. Estuar. Coast. Shelf Sci. 130, 54–61. doi: 10.1016/j.ecss.2013.03.022
Walker D. W., Smigaj M., Tani M. (2021). The benefits and negative impacts of citizen science applications to water as experienced by participants and communities. WIREs Water 8, e1488. doi: 10.1002/wat2.1488
Waters R., Engström J., Isberg J., Leijon M. (2009). Wave climate off the Swedish west coast. Renew Energ. 34, 1600–1606. doi: 10.1016/j.renene.2008.11.016
Webb N. P., Chappell A., Edwards B. L., McCord S. E., Van Zee J. W., Cooper B. F., et al. (2019). Reducing sampling uncertainty in aeolian research to improve change detection. J. Geophys. Res. Earth Surf. 124, 1366–1377. doi: 10.1029/2019JF005042
Wentworth C. K. (1922). A scale of grade and class terms for clastic sediments. J. Geol. 30, 377–392. doi: 10.1086/622910
Wessel C. C., Lockridge G. R., Battiste D., Cebrian J. (2016). Abundance and characteristics of microplastics in beach sediments: Insights into microplastic accumulation in northern Gulf of Mexico estuaries. Mar. pollut. Bull. 109, 178–183. doi: 10.1016/j.marpolbul.2016.06.002
Wilson D. R., Godley B. J., Haggar G. L., Santillo D., Sheen K. L. (2021). The influence of depositional environment on the abundance of microplastic pollution on beaches in the Bristol Channel, UK. Mar. pollut. Bull. 164, 111997. doi: 10.1016/j.marpolbul.2021.111997
Wu X., Zhong C., Wang T., Zou X., Zang Z., Li Q., et al. (2021). Occurrence and distribution of microplastics on recreational beaches of Haichow Bay, China. Environ. Sci. pollut. Res. 28, 6132–6145. doi: 10.1007/s11356-020-10987-7
Keywords: microplastic, mesoplastic, pollution, beach sand, Baltic Sea, citizen science, wave power, currents
Citation: Dimante-Deimantovica I, Bebrite A, Skudra M, Retike I, Viška M, Bikše J, Barone M, Prokopovica A, Svipsta S and Aigars J (2023) The baseline for micro- and mesoplastic pollution in open Baltic Sea and Gulf of Riga beach. Front. Mar. Sci. 10:1251068. doi: 10.3389/fmars.2023.1251068
Received: 30 June 2023; Accepted: 21 November 2023;
Published: 07 December 2023.
Edited by:
Jinping Cheng, The Education University of Hong Kong, Hong Kong SAR, ChinaReviewed by:
Duminda Senevirathna, Uva Wellassa University, Sri LankaCopyright © 2023 Dimante-Deimantovica, Bebrite, Skudra, Retike, Viška, Bikše, Barone, Prokopovica, Svipsta and Aigars. This is an open-access article distributed under the terms of the Creative Commons Attribution License (CC BY). The use, distribution or reproduction in other forums is permitted, provided the original author(s) and the copyright owner(s) are credited and that the original publication in this journal is cited, in accordance with accepted academic practice. No use, distribution or reproduction is permitted which does not comply with these terms.
*Correspondence: Inta Dimante-Deimantovica, aW50YS5kaW1hbnRlLWRlaW1hbnRvdmljYUBsaGVpLmx2
Disclaimer: All claims expressed in this article are solely those of the authors and do not necessarily represent those of their affiliated organizations, or those of the publisher, the editors and the reviewers. Any product that may be evaluated in this article or claim that may be made by its manufacturer is not guaranteed or endorsed by the publisher.
Research integrity at Frontiers
Learn more about the work of our research integrity team to safeguard the quality of each article we publish.