 Mohcine Charifi1,2,3
 Razan Khalifa4Bruno W. Giraldes4Mohamedou Sow1,2,3Zainab Hizam4Mathieu Carrara5Eric Maneux1,2Shafeeq Hamza4Anne Bassères6Philippe Blanc6
 Alexandra Leitão4*
 Jean-Charles Massabuau1,3,7*
- 1University of Bordeaux, Environnements et Paléoenvironnements Océaniques et Continentaux (EPOC), Unité Mixte de Recherche (UMR), Arcachon, France
- 2ADERA, Pessac, France
- 3molluSCAN-eye SAS, Bordeaux, France
- 4Environmental Science Center, Qatar University, Doha, Qatar
- 5TotalEnergies E&P QATAR - TotalEnergies Research Center Qatar (TRC-Q), Doha, Qatar
- 6Centre Scientifique et Technique Jean Féger (CSTJF), TotalEnergies, Pau, France
- 7Centre National de la Recherche Scientifique (CNRS), Environnements et Paléoenvironnements Océaniques et Continentaux (EPOC), Unité Mixte de Recherche (UMR), Talence, France
The pearl oyster Pinctada radiata is an iconic species in the Arabian Gulf, which is one of the ecosystems most at risk in the world because of the multiple sources of pollution it faces. Alongside chemical pollution, the Gulf is ranked first with regard to noise and light pollution, and pearl oyster populations are at risk. The impact of these latter types of pollution on marine invertebrates is still poorly known. We used the difference in noise and brightness that can exist between a very quiet room without artificial lighting and a standard laboratory room equipped with a standard aquarium as a testbed to explore the possible impact of noise and light pollution on the behavioral and biological traits of Pinctada radiata without added chemical exposure. During an experiment that lasted 2.5 months, we analyzed their grouping behavior, valve activity, biological rhythm, growth rate and spawning activity. In the standard aquarium kept in the laboratory room, the oysters dispersed instead of regrouping as in their natural environment, regrouping which was observed in the quiet room. They stayed closed longer, the opening amplitude of their valves was systematically lower, and in the closed position, they squeezed their valves more tightly when subjected to noise and light pollution. Their daily opening rhythm was strongly structured by switching the electric light on and off, and females showed significantly less egg-laying behavior. In conclusion, seemingly innocuous human activities can lead to very significant alterations in pearl oyster behavior. We propose that it could have significant effects on populations and ecosystems.
Introduction
The Arabian Gulf marine ecosystem is one of the most at risk in the world because of the multiple sources of pollution it faces. Its local climate, semi-enclosed nature and restricted water renewal (Sheppard et al., 2010) result in pollutant build-up over time. Compared to open marine systems, the added stress imposed by multisource pollution is likely to have severe adverse consequences on the Gulf marine environment. Currently, the Gulf is seasonally exposed to extreme water temperatures, up to 35-37°C, and salinity changes, with an average increase of 43 psu (Wabnitz et al., 2018) and some extreme values up to 70 psu (Sheppard et al., 2010; ROPME, 2013). Regarding pollution, the Gulf is also often cited as one of the most contaminated water bodies (Hosseini et al., 2021). It is in the world center of oil and gas activities; it faces a very large presence of oil rigs and huge tankers, and it has been a collateral victim over the years of Gulf Wars, which resulted in the spillage of a large amount of crude oil (Readman et al., 1992). Noise pollution (Duarte et al., 2021) and light pollution (Smyth et al., 2021) are also particularly present in the Arabian Gulf. Nevertheless, despite the difficult environmental conditions, the Gulf still hosts several crucial ecosystems, including coral reefs, mangroves, sea grasses, and oyster beds (Sheppard et al., 2010; Burt, 2014).
Today, one of the current main anthropogenic challenges to the marine environment is noise pollution, whose impact on biodiversity is still understudied, especially regarding invertebrates (Solé et al., 2023). The noise produced by anthropogenic activities in the marine environment is now clearly recognized as a major source of pollution requiring urgent studies. Several studies have shown that many biological processes and/or functions in different marine species are negatively impacted by underwater noise (Duarte et al., 2021; Solé et al., 2023 for reviews). For example, Simpson et al. (2016) showed a direct correlation between anthropogenic noise and fish predator−prey dynamics, with an evident lower prey survival. A clear detrimental effect on anti-predator behavior was observed in this study, which was hypothesized to be due to an increased stress level. As an increasing problem in the marine environment, especially in the coastal zone, sound pollution affects multiple if not all invertebrates. In the Gulf region, the pearl oyster Pinctada radiata (Leach, 1814) is still an iconic species, but the effects of anthropogenic noise on this species, as well as on most bivalves, have received very little attention (Wale et al., 2021; Ledoux et al., 2023).
Benthic organisms such as bivalve mollusks, like all sessile animals, have no or limited locomotion ability and are particularly vulnerable to local anthropogenic noise. Charifi et al., 2017 reported the most extensive analysis of sound perception ability in oysters (Magallana (Crassostrea) gigas). They showed that M. gigas is sensitive to sound in the range of 10 to <1000 Hz, with maximum sensitivity from 10 to 200 Hz. Charifi et al., 2018 in the Pacific oyster M. gigas and Shi et al., 2019 in the Blood Clam Tegillarca granosa demonstrated that anthropogenic noise can lead to reduced feeding and respiratory activities. Later, Zhao et al., 2021 found that noise significantly reduced the secretion of byssal threats in mussels Mytilus coruscus and weakened their mechanical performance. A decrease of up to 45% was reported in the mussel byssal attachment strength. They suggested that the weakened byssal attachment was linked to a noise-induced downregulation of the gene expression of several structural proteins of byssal threads. These depressant effects were also reported in sediment-dwelling invertebrates (Norway lobster Nephrops norvegicus; manila clam Ruditapes philippinarum; Solan et al., 2016). This is particularly important due to their contribution to fluid and particle transport, a key process in benthic nutrient cyclic and carbon sequestration, which could be deeply impaired with wide ecosystem productivity consequences. Importantly, all these experiments lasted maximum up to 14 days, the impact of longer exposures in marine invertebrates remains unknown. However, longer exposures are likely the most common case in anthropized environments. The aim of this work was first, to answer this question for the pearl oyster P. radiata and secondly to test the replicability of these previous works in a different context and assess whether the depressant effect was maintained or labile over time.
For that purpose, we studied the impact of anthropogenic noise, added to a light stress, on the behavior of P. radiata during a full 2.5-month experiment, an experimental long duration rarely discussed. We used the difference that exists between (i), a conventionally equipped aquarium installed in a laboratory frequented by researchers and students (110 dB) with artificial lighting, and (ii), a low-noise experimental tank (80 dB) placed on anti-vibration devices in an unoccupied office with only natural lighting as a testbed. We have identified airborne noise, direct vibrations transmitted by the structure and electric lighting as major constraints in this setup. In a calm situation at sea, present or past, the animals are not exposed to these noises and live in light dimmed by the water column. Locomotory activity and social behavior were studied by video tracking (Giraldes et al., 2019), and valve-opening activity, growth rate and spawning were recorded by HFNI valvometry (Andrade et al., 2016).
Materials and methods
Experiments were performed from 9 December 2020 to 21 February 2021 on 2 groups of 16 adult pearl oysters Pinctada radiata collected from the coastal site of Simaisma on the eastern coast of Qatar (N25.54981 E51.51010) on 8 December 2020. Animals were chosen a priori according to their shell length (≈ 55 x 50 mm). Two different experimental noise and light stress conditions were created at the Environmental Sciences Center of Qatar University, which is a one-story building. Hydrophones (Aquarian) were used to measure the noise soundscapes in both conditions during the whole experimental period.
Standard noise and light conditions
An experimental tank (standard glass aquarium, floor area 0.32 m2, water level 15 cm) was placed in a standard laboratory (surface area, 42 m2, 6 x 7 m, windows on the wall - and artificial lighting from 7:30 a.m. to 3-4 p.m.) with regular daily activities performed 5 days a week by 7 people. The tank was set on a standard wooden table installed on a tiled floor. It was equipped with a regular water pump (Penn-Plax Cascade 1000 Canister filer) and a single air stone connected to an air pump placed on the table. This was designated the experimental noise standard condition (Figures 1A1, 2).
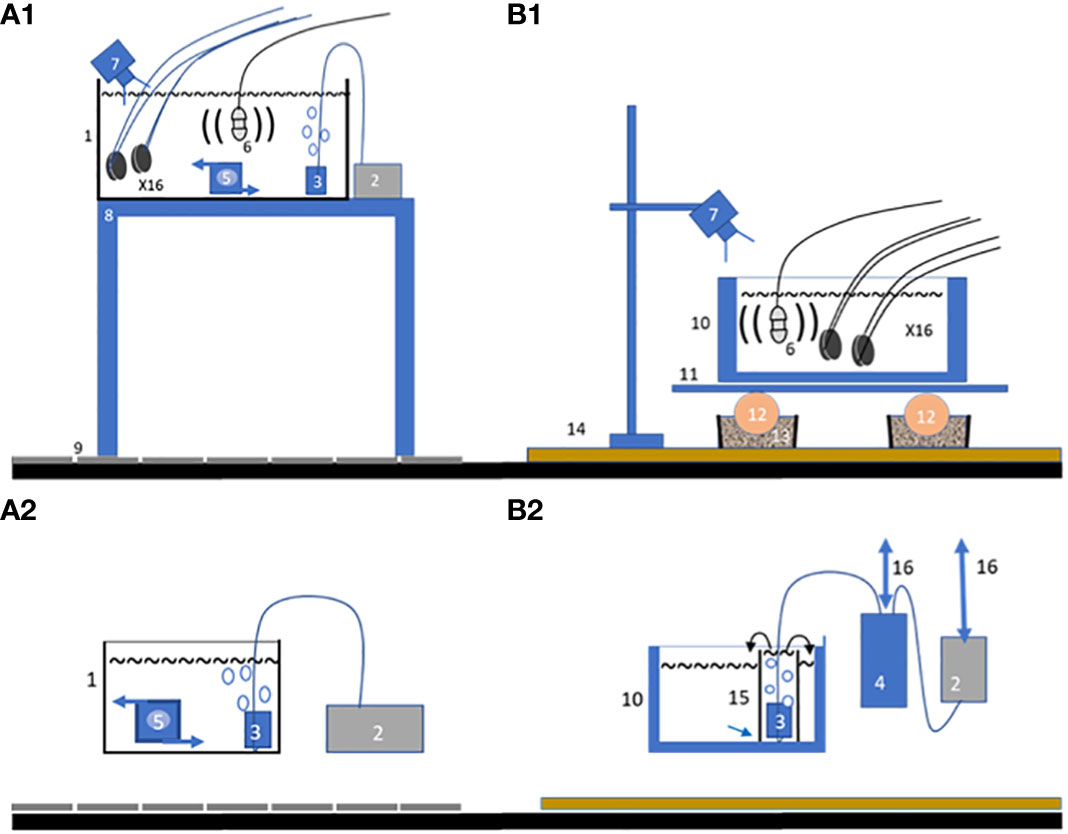
Figure 1 Schematic diagrams of the experimental setup and tanks, each tank containing 16 oysters equipped for HFNI valvometry. (A1-2) in the standard laboratory condition with human presence and running analysis devices; (B1-2), in an unoccupied and quiet room, without human presence around. In the diagrams, (A1, B1) provide an overview of the setups, while (A2, B2) offer detailed views of the respective water treatment systems. The numbered components are as follows: 1, standard glass aquarium; 2, aquarium bubbler; 3, air stone; 4, empty plastic bottle used to absorb the vibrations of the air pump; 5, water pump; 6, hydrophone; 7, camera; 8, tiled lab bench; 9, floor tiling; 10, coolbox; 11, wooden board; 12, tennis ball; 13, sand box; 14; thick carpet; 15, airlift; 16, rubber band.
Low noise and light conditions
A second experimental tank (made from a Coleman 100 Quart Xtreme Coolercooler box, water level 15 cm; walls made of molded plastic and foam) was placed in an unoccupied office room not exposed to human noise influence (including no daily cleaning). The size of the room was 30 m2, 5 x 6 m, with carpet on the floor. There were two roof windows providing indirect light, and the electric lighting was always off to maintain a natural light regime with dim light during the daytime. To further limit noise pollution potentially transferred through furniture and flooring, the tank (floor area 0.2 m2; water level 15 cm) was placed on an isolating setup made of, from bottom to top, 1 cm carpet, 2 plastic buckets (46 cm x 30 cm x 7 cm) filled with sand, 4 tennis balls and 4 wooden pieces. The 50 Hz and its harmonics generated by an aquarium bubbler were filtered by (i) suspending the aeration bubbler with an 8 mm wide rubber band to a stand independent of the experimental tank and (ii) adding an empty plastic 1 L bottle in serial order between the air pump and the air stone to absorb the vibration transmitted by the air column (Figures 1B1, 2). In the water, the air stone was inserted into a PVC tube to obtain an air lift able to aerate and circulate the entire water volume without an electric water pump.
Out of the 32 oysters, 16 individuals were placed in the experimental noise standard condition and 16 in the experimental low noise condition, evenly distributed in both tanks. The experiment lasted for 74 days, and every week, half of the volume of water in each tank was changed with unfiltered fresh seawater from the Simaisma sampling site. Great care was taken to reduce the associated noise when syphoning and adding fresh seawater in the low noise condition. No additional food was added to either tank for the entire duration of the experiment.
Environmental parameters
Temperature, salinity and dissolved oxygen were measured biweekly by a multiparameter probe YSI-Model 6050000. Sound was recorded in the tanks using a broadband hydrophone with an internal buffer amplifier (model: H2a-XLR, sensitivity -180 dB re 1 V/µPa, useful range: 10 Hz to 100 kHz, Aquarian Audio Product). We followed two protocols. First, the hydrophone was associated with a portable H4n zoom recorder to record the sound and characterize the ambient noise in the frequency range [10-100 kHz] at the beginning of the experiment for the two experimental conditions. The spectral level was calculated in 20-second segments using the Hann window. Second, during the whole experimental period, we used the same type of hydrophone mounted on the HFNI valvometer (molluSCAN-eye SAS) to record the ambient noise continuously in the frequency range [10-700 Hz] since oysters hear in this frequency range (Charifi et al., 2018). Calibration of the system was performed using a signal generator and using the sensitivity declared by the manufacturer. Acoustic data were automatically preprocessed in situ by the valvometer (electronic card) in the frequency range [10-700 Hz]. Data were processed in R (R core Team 2022) using custom scripts and the seewave library (Sueur, 2018). The sampling rate was 4096 Hz. A fast Fourier transform (fft) was applied every 500 ms during recording, resulting in a step size of 2 Hz. For the band between 10 Hz and 90 Hz, the valvometer adds 5 fft values to give a single output frequency, while for the bands between 100 Hz and 700 Hz, 50 fft values are added. Then, an hourly average of the sound level was calculated in the frequency range of 10-700 Hz to obtain the evolution of the hourly average sound level during the whole experiment.
The light intensity was measured by using Lux Lightmeter Pro software made for the iPad. The measurements were repeated for 9 days spread over the experimental period at two times, 07:40-10:40 and 01:45-02:40. On working days, in the laboratory room, the light was turned on at approximately 8 a.m. and turned off at approximately 3-4 p.m.
Grouping behavior by image analysis
Each experimental tank was equipped with a GoPro Hero 8 running 24/7. One picture was taken every hour, and image analysis at the end of the experimental period was performed with ImageJ (version 1.32j). The surface area covered by the whole group was measured in both conditions throughout the experimental period. All analyzed pictures were taken during the daytime (from 6 a.m. to 6 p.m.), as no artificial light was used.
Behavioral analysis by high-frequency noninvasive valvometry
Two HFNI valvometers were used to simultaneously record the valve activity of the two groups of 16 oysters. The method is based on the measurement of voltage variations associated with the electromagnetic field produced between two lightweight electromagnets designed to minimize bivalve disturbance. An electromagnetic current between the electrodes was generated, allowing measurement of the amplitude of the valve aperture or valve gap. The signal was recorded using a laboratory-made acquisition card every 0.1 s. The data were automatically and continuously transmitted daily to a data processing center in Bordeaux using an internet network (Andrade et al., 2016). They were processed automatically on a daily basis. Each collected value was associated with a valve opening amplitude, expressed as a percentage. The values of 0% and 100% were defined as the minimum and maximum of each bivalve opening over the previous 6 days (sliding windows). An animal was considered closed at less than 5% of the maximum valve aperture. In bivalve mollusks, calcification occurs all over the internal surface of the shells; when daily growth layers are produced, the minimal distance between electrodes also increases when valves close every day (Schwartzman et al., 2011). This allowed us to measure the daily growth index in shell thickness. The results, both raw valve-activity recordings and calculated graphics of physiological indices, were automatically available on the professional pages of the molluSCAN-eye website (http://molluskan-eye.epoc.u-bordeaux1.fr/index.php?rubrique5accueil&lang5en). Sow et al. (2011) showed how behavior patterns are mathematically constructed online at daily, weekly and monthly timescales. Other examples of application are reviewed in Andrade et al. (2016).
To study biological rhythms, double-plotted actograms were made, starting at 00:00 h. Each line is a barcode that summarizes the hourly activity of the groups of oysters studied for 2 days. By convention, each 2-day period was first represented from 00 h to 48 h (Day 1 + Day 2). Day 2 was then repeated on the next line from 0 to 24 h. The dark blue and pale blue sections of each line represent hourly behavioral values below and above the mean behavior of the day. Statistical chronobiological analyses were performed using R software and cosinor package. Daily valve-opening amplitude (expressed in %) was analyzed individually and then presented as box plots. The values of 0% and 100% correspond to the minimum and maximum opening amplitude recorded over the previous 6 rolling days, respectively.
Gametogenic stage analysis
Histological analysis of the gonads of 30 extra oysters collected at the same site was performed at the beginning of the experiment, and histological analysis of the gonads of the 32 oysters used in the experiment was performed at the end. A 3-mm transversal section of the visceral mass of each oyster was excised using a microtome cutter in front of the pericardiac region and immediately fixed in modified Davidson’s solution (Latendresse et al., 2002) at 4°C for 48 h. Then, the modified Davidson’s solution was discarded, and 70% ethanol was added and kept at 4°C. Sections were dehydrated in ascending ethanol concentrations, cleared with a xylene substitute and embedded in paraffin wax. Sections of 5 µm were cut, mounted on glass slides and stained with Harry’s hematoxylin-eosin. Slides were then examined under a light microscope, and sex and stages were determined according to a scale development based on Delgado and Pérez-Camacho (2005). When more than one developmental stage occurred simultaneously within a single individual, the assignment of a stage criteria decision was based upon the condition of the majority of the section.
Statistical analysis
Comparisons between the groups were investigated using nonparametric ANOVA (Kruskal−Wallis), following Dunn’s multiple comparisons tests whenever significant differences were found. Differences between distributions were assessed using a two-sample Kilmogorov-Smirnov test, and differences between variances were assessed using the Levene test.
Correlations between variables were analyzed using Pearson’s or Spearman’s test when appropriate. Linear and nonlinear regressions were performed between the total surface area occupied by the groups and days (time) for each considered group. For all statistical results, a probability of p < 0.05 was considered significant. Data were computed and analyzed using R software.
Results
No mortality was recorded during the 74-day exposure period. One day of recording was lost for technical reasons. The mean temperatures recorded in the low noise and standard noise conditions were 18.3 ± 0.1 and 19.9 ± 0.1°C, respectively (min-max, 17.3-19.8 and 18.9-20.7°C; p < 0.005), with mean salinity values of 36.92 ± 0.01 ppt or psu recorded in the low noise condition and 41.01 ± 0.06 ppt in the standard noise condition (min-max, 36.9-37.2 and 39.1-45.6; p < 0.005). The pH was 7.99 ± 0.01 in the low noise room tank and 8.04 ± 0.01 in the standard lab tank (min-max, 7.89-8.11 and 7.97-8.15; p = 0.22), and the percentage of oxygen saturation was 86.2 ± 0.1 and 86.7 ± 0.1%, respectively (p = 0.89). The light intensity was different in the two rooms. In the morning (07:40–10:40), it was 263 ± 6 Lux in the laboratory and 107 ± 6 Lux in the unoccupied office (n = 15; p < 0.0001), which represents a difference of a factor of 2.5. In the early afternoon (01:45–02:40), it was 308 ± 7 Lux in the laboratory and 133 ± 13 Lux in the unoccupied office (n = 15; p < 0.048), which is a similar factor of 2.3. The difference in brightness was the same between morning and afternoon (n = 15; p < 0.258).The ambient noise level differed significantly between the two conditions (Figure 2). Compared to the low noise condition, the sound pressure level in the standard noise condition was higher. The average sound pressure level in the standard noise condition was 111 ± 0.23 dB with maximum and minimum values of 127 dB and 86 dB, respectively; while in the low noise condition, the average sound pressure level was 87 ± 0.27 dB with maximum and minimum values of 101 dB and 65 dB, respectively. We also note, in the standard noise condition, the presence of sound pressure level peaks at 50 Hz (109 dB), 100 Hz (124 dB), 150 Hz (118 dB) and 200 Hz (127 dB), while in the low noise condition, there was a single sound pressure level peak at 50 Hz (95 dB). Furthermore, the sound level at 10 Hz in the low noise condition was 15 dB higher than that in the standard noise condition, and there was no daily rhythm of the sound pressure level.
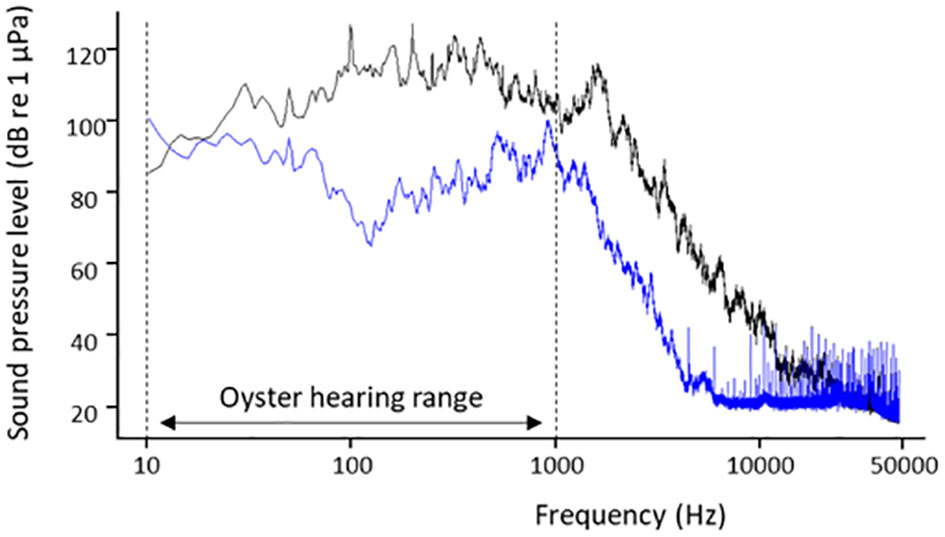
Figure 2 Sound pressure level comparison of the low noise condition (blue) and standard noise condition (black). The measurements represent the mean values over a 20-second interval. The most significant difference in sound pressure occurred within the 100-200 Hz frequency range, which aligns with the oysters’ optimal auditory sensitivity. (Charifi et al., 2017).
During the entire length of the experiment in the standard noise condition, the sound pressure level in the frequency range of 10-700 Hz varied between 109 dB and 97 dB. In the low noise condition, the sound pressure level varied between 92 dB and 77 dB. The sound pressure level difference between the two conditions was approximately 18 dB, with an average sound pressure level of 103.5 ± 0.15 dB in the standard noise condition and an average of 86 ± 0.14 dB in the low noise condition.
Social behavior: grouping or scattering
Figures 3A-C illustrates the grouping and contact behavior of P. radiata in the field (Figure 3A) and in experimental conditions (Figures 3B, C). Figure 3A shows their behavior in the sea, where they spontaneously combine in bundles. In the quiet room, Figures 3B1-4 show that they also tend to follow this natural grouping behavior. In contrast, the pictures in Figures 3C1-4 suggest a different behavior for the standard laboratory conditions characterized by human presence and running analysis devices. The oysters in the standard noise condition with artificial lighting scattered widely in the tank, whereas a grouping pattern was observed in the low noise condition with dim natural light exposure. To quantify this difference, the total surface areas recorded by video imaging were measured and plotted as a function of time. The result has been separated into periods numbered from 1 to 5 in Figure 4. This shows that there was first a period of 10 days during which the area occupied decreased in both cases in an undifferentiated way (period 1; Wilcoxon-Mann−Whitney test, p = 0.417). The situation changed dramatically after 10 days. While the dispersion area continued to decrease smoothly in the group inhabiting the unoccupied room (y = 1253/x0.155, R2 = 0.78, p < 3.7ˑ10-4), it increased rapidly and irregularly for the animals in the laboratory with human activity. The latter can be described by a series of linear regressions with different slopes. There was first, period 2, a rapid expansion period lasting 18 days (y = 21.7 x + 732; R2 = 0.92; p < 7.7ˑ10-6). A comparison of the increase or decrease in daily surface shows that the dispersion was significantly faster than the surface contraction (p < 0.0005). It was followed by a short transition period from day 28 to 32 (period 3) followed by stopping the expansion for 16 days (period 4; y = 0.45x + 1243; R2 = 0.038; p = 0.61). During period 4, the changes in surface area were not significantly different (p = 0.83). Then, in period 5, the dispersal of the oysters resumed until Day 74 (y = 9.8x + 845; R2 = 0.93; p < 5,1 ˑ 10-6), and the change in surface area was again significantly different (p < 5.1 ˑ 10-6). As a whole, the above dataset showed that, depending on the environment, activity levels were used for opposite objectives, scattering or grouping. We now switch to a behavioral analysis at the individual level by analyzing the data obtained by quantifying the valve activity. Displacements were observed to be more intense during nighttime demonstrating their nocturnal habits and the influence of light in their behavior.
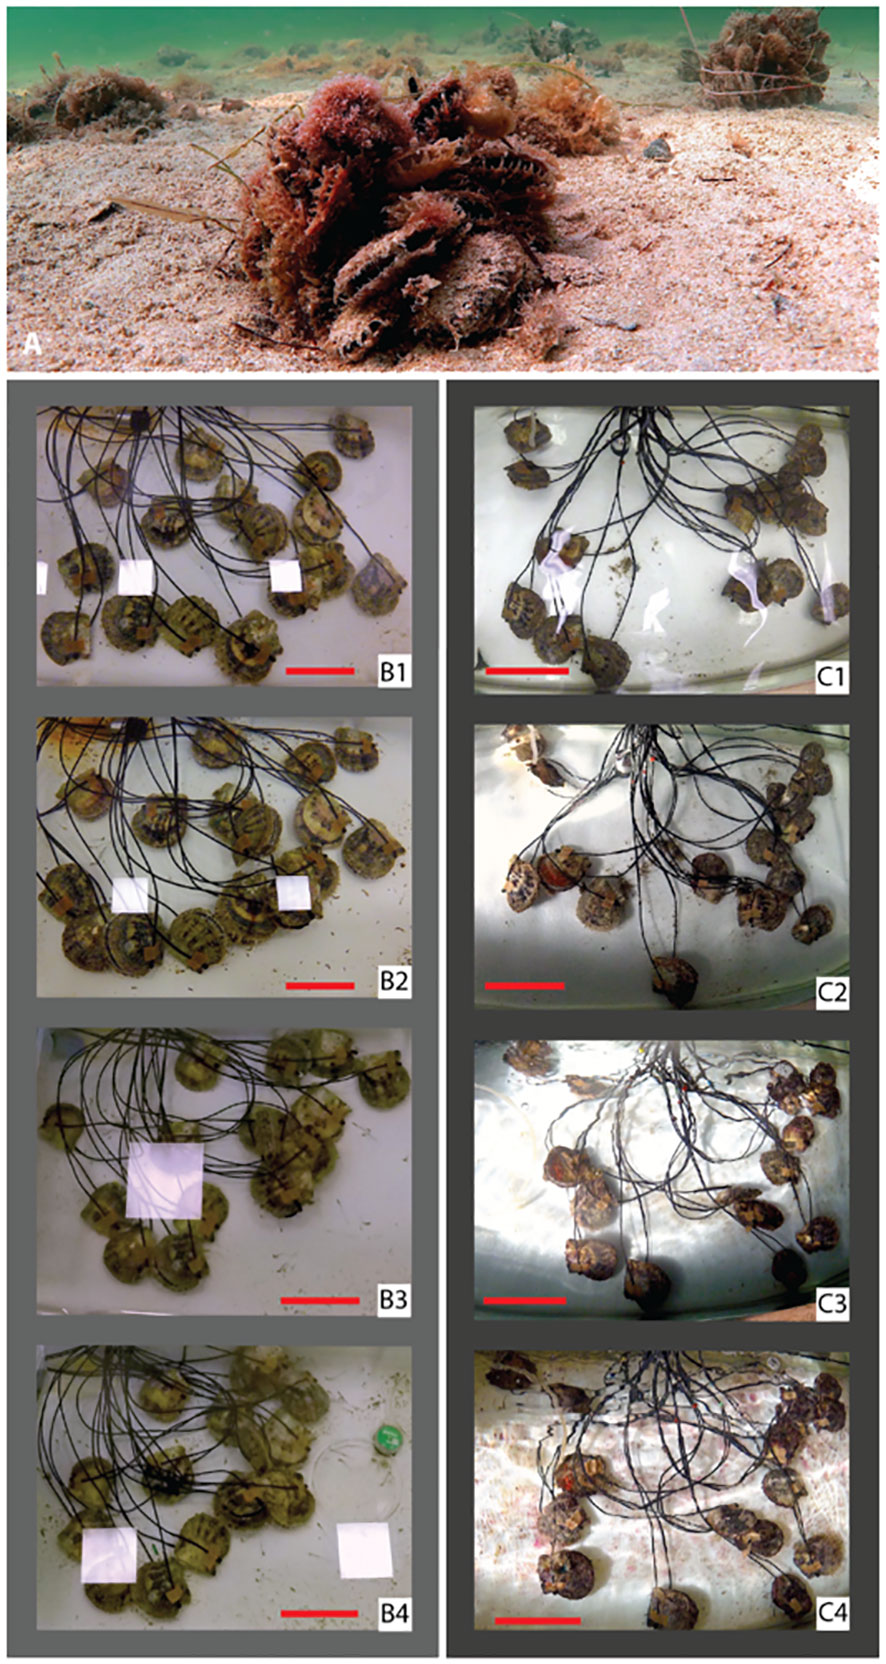
Figure 3 Group-level behavioral analysis using images of pearl oyster Pinctada radiata. (A) natural behavior of P. radiata in their sea habitat, at a depth of -4 meters, in the Arabo-Persian Gulf, where they spontaneously form clusters. (B, C) behavior at Qatar University under different conditions. (B1–4), in a low-noise room without human presence and artificial light during a74-day exposure period. (B1–4), pictures taken on days 1, 8, 30, and 68. The pale white squares are the ceiling windows reflections. The scale bars is 7 cm. (C1–4), observations in a standard laboratory setting with human presence, electrical lighting, and running analysis devices; same schedule labeled as (B1–4). The scale bar for (C1–4) images is 10 cm. In a quiet environment oysters tend to exhibit a natural behavior of grouping, while in a busy laboratory, oysters tend to disperse. Quantitative data can be found in Figure 4.
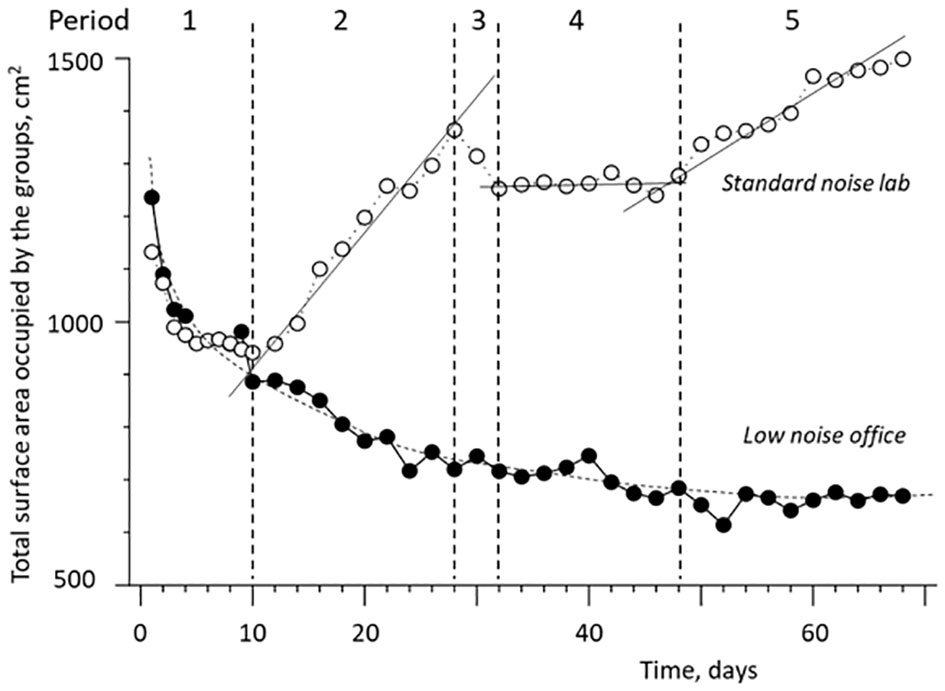
Figure 4 Behavioral analysis at group level. Sequential examination of images to track changes in the total surface area occupied by the two groups of oysters located at the bottom of their experimental tanks over time. Close symbols indicate observations made in the unoccupied office; open symbols represent observations in standard laboratory conditions. In the low noise office with natural light, oysters typically exhibited a natural behavior of grouping. In the standard laboratory setting, with standard aquarium and artificial lighting, oysters tend to disperse.
Valve movement analysis and individual behavior
Figure 5A presents the daily valve closure duration throughout the experimental period. The animals exposed to the standard laboratory environment were slightly but significantly closed longer than animals in calm conditions. This started from Day 1. On average, the daily valve closure duration was 174 ± 7 min/day under standard anthropogenic noise and 98 ± 4 min/day under low noise (12.1 and 6.8% of the time, respectively; p < 0.001). We then analyzed the valve-opening amplitude, which is a sign of concern and unease in bivalve mollusks, as it is their only way to protect their soft tissues. Figure 5B shows that starting on the first days, the valve-opening amplitude was slightly but systematically lower under standard noise conditions. The valve amplitude was 74.3 ± 0.01% of the maximum recorded amplitude in the room without human presence and 66.1 ± 0.01% in the standard lab environment (p < 0.001). The minimum daily distance between valves was also analyzed, as it is a stress and muscle tension index during closure periods. Figure 5C shows that in the standard lab condition, the valves were systematically more tightly closed than in the room without human activity. The valve amplitude was 4.88 ± 0.04 mm in low noise conditions and 3.85 ± 0.02 mm in standard lab conditions (p < 0.001). Finally, Figure 5D quantifies the higher levels of restlessness and instability under standard lab conditions. The number of times oysters closed their valves at more than 55% of their maximum valve-opening amplitude was greater in the standard lab than in the unoccupied office (p < 0.001). Since this whole dataset suggested that ventilatory activity could have been higher in the low noise condition, we analyzed the respective growth rates by comparing the mean distance between electrodes between the 1st and last week of the experiment. Despite the low food regime, the animals grew in both situations but less so in standard laboratory conditions. During the whole experimental period, the shell thickness increased by 1.1 ± 0.1 mm in the low noise conditions (14.4 µm/day) but only 0.6 ± 0.1 mm under standard noise (8.1 µm/day; significantly different, p < 0.001).
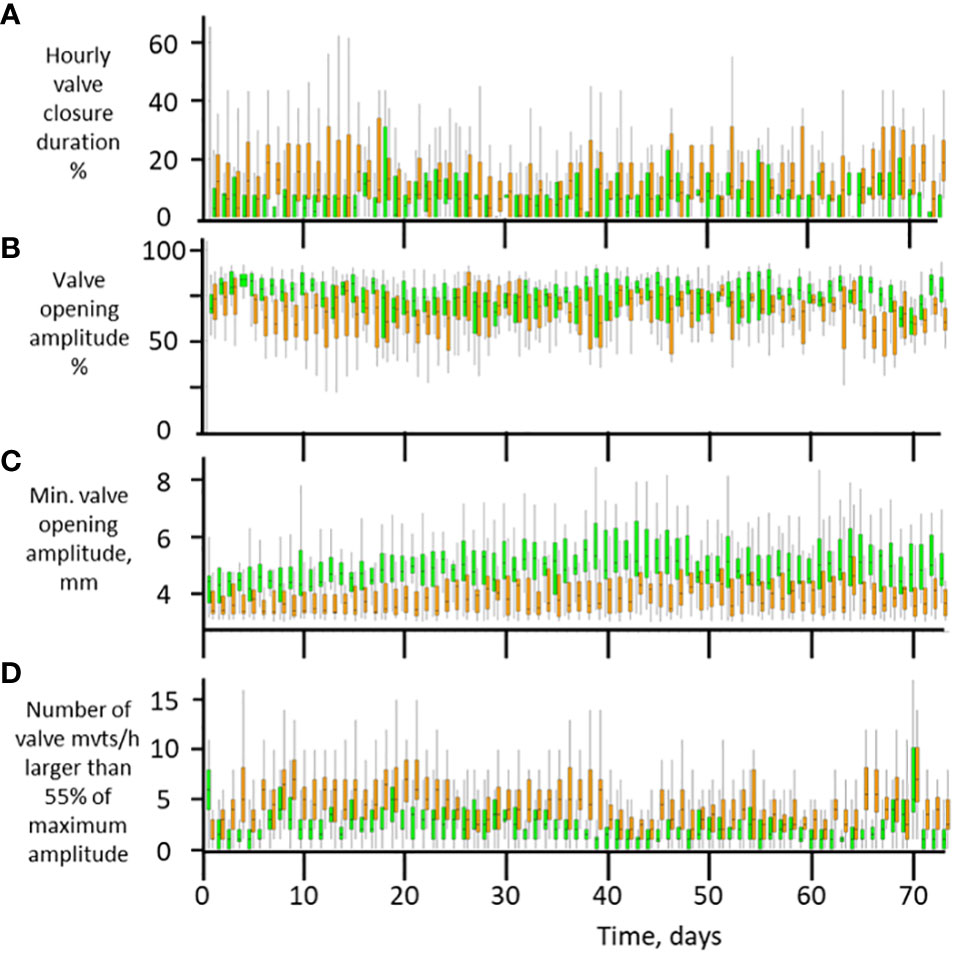
Figure 5 Behavioral analysis at the individual level. Daily analysis of valve movements as a function of time and experimental conditions. Orange plots represent observations conducted in standard laboratory conditions; green boxes represent observations in an unoccupied office with low noise and no electric lighting. The analysis encompasses four aspects, listed from top to bottom: (A) duration of valve closure; (B), valve opening amplitude; (C) minimum amplitude of valve opening recorded each day; (D) number of valve movements (partial closures) that exceeded 55% of the maximum opening amplitude. Daily box plots, n = 16 oysters.
Figures 6A, B present the biological rhythms of valve-opening amplitude followed by oysters. In both cases, it was not randomly distributed but followed a daily rhythm characterized by one single period per day of lower valve-opening amplitude during the daytime. Here also observing their nocturnal active behavior. Chronobiological analyses showed that the percentages of cyclic behaviors and percent rhythm (PR) explained this rhythm of 24 h for both conditions. However, it was stronger in the laboratory conditions: PR = 41.1% instead of 29.8% in the unoccupied office (R2 = 0.64 and 0.54, respectively).
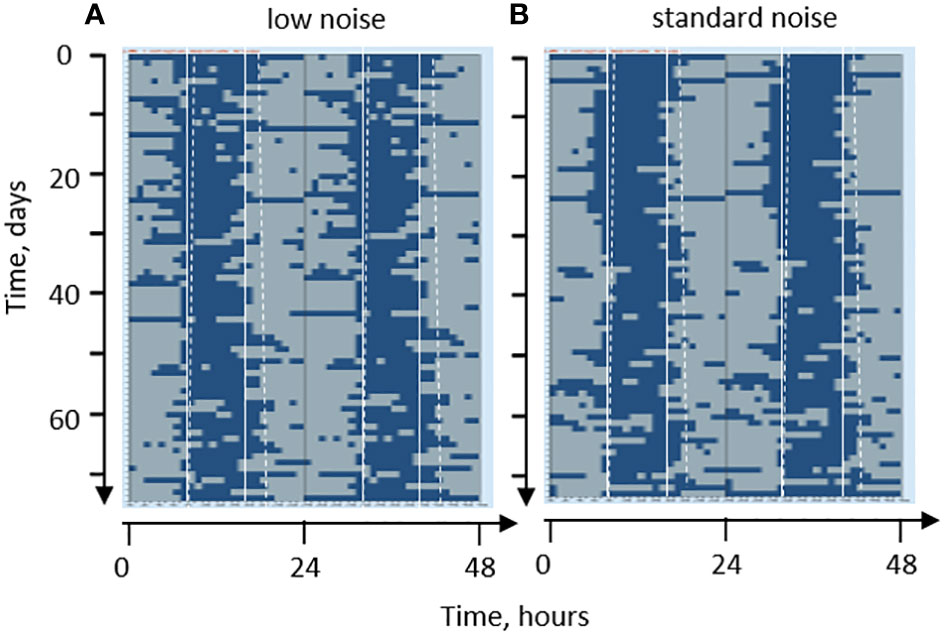
Figure 6 Daily rhythms in Pinctada radiata. Distribution of daily periods of activity (pale blue) and rest (dark blue) in two contrasting conditions, a low noise unoccupied room without artificial lighting (A) and a standard laboratory setting with standard noise levels plus artificial light regime (B). Behavior is structured by human activity under standard laboratory conditions.
Spawning
Under both conditions, spawning events were observable. A recording example is presented in Figure 7A, showing the characteristic pattern of valve contractions during egg expulsion. Two juveniles were also found at the end of the experimental period, further demonstrating the spawning’s success (Figure 7A, inserts). All spawning occurred at night, but they were grouped into two distinct periods. One at the beginning of the experiment, just after transportation from the sea to our facilities, and one close to the end of the experimental period, after approximately two months (Figure 7B). Again, anthropic pressure appeared to be harmful. Indeed, the number of typical recordings was higher in the low noise condition, with a total of 54 spawning events, versus only 20 spawning events in the standard noise condition (ratio, 2.7). This difference was particularly noticeable during the 2nd part of the experimental period.
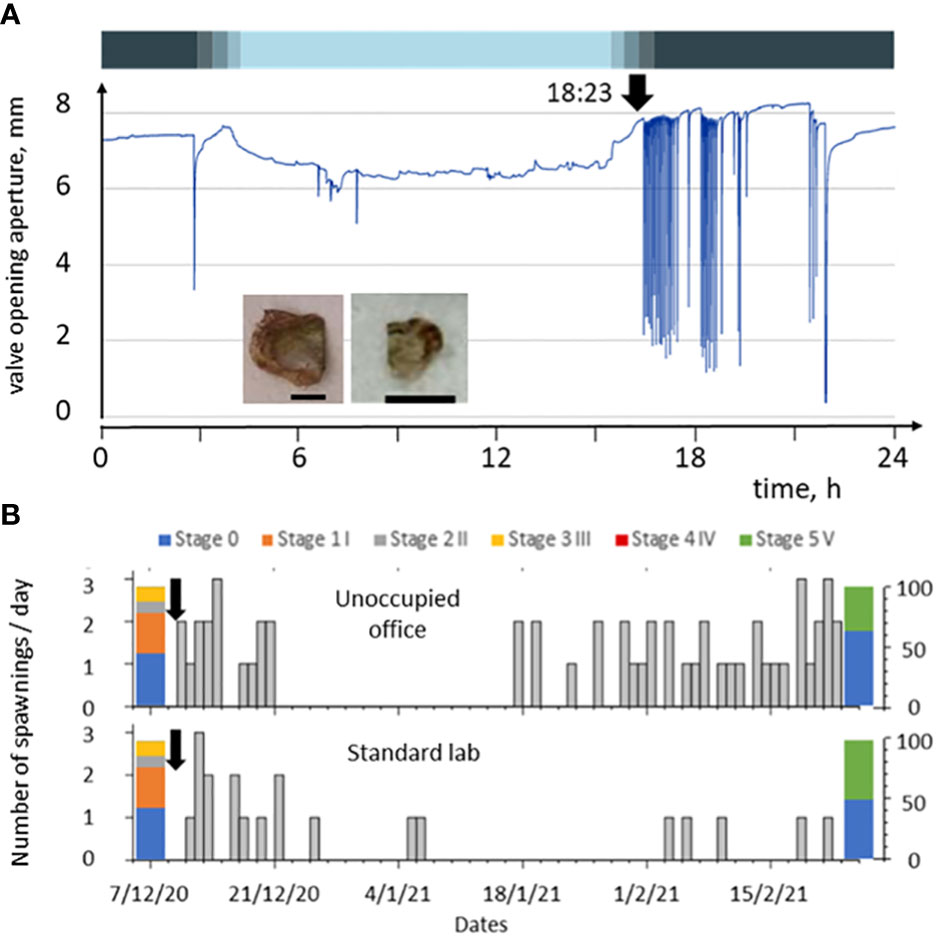
Figure 7 (A) Recording of a typical female spawning event in Pinctada radiata using HFNI valvometry. The recording illustrates a typical pattern of valve contraction that occurs during egg deposition. Insert, two juvenile oysters found in the experimental tanks. Scale bars, 5 mm. (B) Distribution of spawning events throughout the experimental period. There were more spawning events in the unoccupied office when compared to the standard laboratory conditions.
Histological analysis of the gonads of the 30 extra oysters collected at the beginning of the experiment specifically for evaluation of gonadal development showed four gonadal reproductive stages, stage 0 (inactive) and stages 1, 2 and 3 of gonadal development, with stage 0 and stage 1 representing almost 80% of the cases. Histological analysis was performed on all 32 oysters at the end of the experiment. After dissection, all individuals presented strong signs of a low diet regime with a depletion of their nutrient reserves.
The analysis of the gonadal reproductive stages (Figure 7B) showed that at the beginning of the experiment, most gonads were in either stage 0 (inactive) or stage 1 of gonadal development, with a lower percentage of gonads in developmental stages 2 and 3 (ripe). At the end of the experiment, only two gonadal developmental stages were observed in the oysters kept in both sound conditions, stage 0 (inactive) and stage 5 (spent). In the standard noise condition, both stages were present in very similar percentages, while in the low noise condition, a slightly higher percentage of stage 0 was observed.
Discussion
In the present report, we explored the impact of continuous anthropogenic pressure (74 days) on a marine invertebrate, the pearl oyster P. radiata. Our main objective was to test whether the depressant effect previously reported in various marine invertebrates was, on one hand, reproducible and reliable using the pearl oyster P. radiata and on the other hand, maintained or not during a long-term exposure, since previous studies were carried out over a maximum period of 14 days. To replicate these experiments and go further in the results we used the difference that exists between a conventionally equipped aquarium installed in a laboratory frequented by researchers and students (a commonly used experimental setup in multiple laboratories) and a low-noise experimental tank placed on anti-vibration devices in an unoccupied office as a testbed. Salinities were different between both conditions, however both values were within the comfort zone for P. radiata. For this species, physiological challenges occur only below or above this range (Moussa, 2018; Jahromi et al., 2020). In the frequency range heard by oysters, 10-1000 Hz, the average sound pressure was ≈ 110 dB in the laboratory and 87 dB in the unoccupied office. In the latter, there was no electric lighting, only indirect sunlight, which made a luminous intensity of 110-130 Lux instead of 260-310 Lux in the laboratory with electric lighting. In these contrasting conditions, we observed major behavioral differences in oysters.
Our results confirm the previously reported depressant effect of noise pollution in marine invertebrates. Moreover, we also showed that this effect does not appear labile over time, that there might not be any adaptation. At the individual level, P. radiata exposed to the noisy environment and artificial electric light, spent slightly more time closed, opened less widely during periods of activity and were more agitated. When closed, their valves were tighter. The difference between both conditions was observed from the very first days and lasted for the whole 74 days of the study. At the group level, under conditions of low anthropogenic pressure, the oysters tended to steadily group together, as they do in their natural environment, while under conditions of higher anthropogenic pressure, dispersion at a more chaotic pace was observed. The daily rhythm of activity was more strongly structured in the artificially lit room from 8 a.m. to 3-4 p.m. The growth in the noisy environment was also lower, which is consistent with a previous report by Charifi et al. (2018), who concluded that noise pollution has a depressant effect on the activity in oysters M. gigas, including on their ventilatory activity, clearance rate and food intake. Spawning events were recorded in both situations, but they were 2.7 times more numerous in the low noise situation.
Behavioral and physiological disturbances
The Qatari pearl oyster is usually present in clusters of 10-15 animals in the natural environment (Figure 3, top). This was the situation in the coastal collection site of Simaisma, which is located in an area subject to low anthropogenic noise. An experimental study on the displacement of this species already showed that individual oysters when placed apart in an aquarium had an initial displacement of moving toward the other individuals (Giraldes et al., 2019). The present report confirms this observation. We conclude that in low noise conditions, without an added stress, this species tends to mimic its typical clustering behavior that occurs in its natural environment.
Although several previous studies have shown that in predator-induced stress situations, clustering behavior is observed in fish (e.g. Hoare et al., 2004) and in the semisessile mussel Mytilus edulis subjected to European lobster predator-induced stress (Côté and Jelnikar, 1999), to our knowledge, none have evaluated the social behavior of semi-sessile lifestyle bivalves under anthropogenic noise stress. We suggest that clustering is a positive adaptation for reproduction since oysters are broadcast spawners. This is possibly critical, as males and females release their gametes into open waters where the hydrodynamic process leads to optimized encounter rates for mixing, fertilization and the dispersal of zygotes. Clustering could also provide benefits against predation, as in fish schooling (Robertson et al., 1976). When oysters are packed in a relatively small area, each individual oyster should be more protected from predation than if it were a lone oyster.
At the individual level, compared to P. radiata maintained under lower noise conditions, P. radiata under standard laboratory noise conditions were less widely open and with shorter valve opening duration. They were also less restless, and in the closed state, the valves were more pursed. As a decrease in valve opening is the major way to protect the soft body when bivalve mollusks detect a threat or whenever they are under special stress or pressure (Robson et al., 2010, blue mussel Mytilus edulis; Hubert et al., 2023, mussels Mytilus spp), we propose that this behavior is a mark of discomfort. However, this state was obviously more than discomfort. Indeed, it was physiologically associated with decreased growth and lower spawning events.
Recent results reported by Ledoux et al. (2023) suggest that noise pollution generated during short-term experiments (12 h) by pile driving but not boating and drilling can affect the behavior of the oyster Crassostrea virginica (reducing valve gaping). These observations are not contrary to the result obtained by Charifi et al. (2018), (Magallana gigas) or the present one performed on other oyster species because their study time is short, half a day. Charifi et al. (2018) studied the impact of simulated cargo passages for 14 days, and a clear growth retardation effect only emerged after 5-6 days. Here, on the other hand, we saw a very rapid installation of the difference in behavior, which had an impact for 2.5 months. The explanation for this difference is certainly to be sought at the level of the experimental conditions, including the timing, which differ between these studies. However, it seems clear, in terms of similarity or reproducibility of the effect, that the effects were the same which is a guarantee of reliability and confidence, since they can be replicated despite the use of different protocols and materials.
Noise pollution is certainly a major driver in the present observation, but light pollution, in terms of excess lighting during the daytime (the ratio is 2.3-2.5), should not be neglected, as pearl oysters Pinctada radiata are nocturnal animals and therefore naturally tend to avoid light. Indeed, in this study the oysters’ displacement, valves openings, and spawning occurred mainly in nighttime, an expected nocturnal active behavior also recorded for other invertebrates (Giraldes et al., 2017, several decapod species). By hypothesis, this difference in light intensity must be considered as contributing to the difference in behavior. The fact that they are less open in terms of duration and spacing of the valves allows for a luminous origin component alongside the need to protect the internal organs in a noisy environment. Another phenomenon clearly attributable to the difference in luminosity is the structuring effect on the daily rhythm. This is a phenomenon clearly known by chronobiologists who use it (Duffy and Dijk, 2002; Hancox et al., 2021) to limit interindividual variability.
What are the underlying physiological mechanisms?
The sense of hearing in oysters was firstly described by Charifi et al. (2017, Crassostrea gigas). The starting point is that the body of an oyster has approximately the same density as that of water. The consequence is that their entire body, including their sense organs, will move with the sound and all the surrounding vibrations. As in most fish, crustaceans and mollusks, they have statocysts, which can detect vibrations. They also possess hair cells, a second good candidate to detect water vibrations. Oysters are sensitive in the frequency range 10-1000 Hz. They were able to feel all the vibrations, sound or not, generated in the laboratory. Regarding light, the mantle and the syphons of bivalve mollusks contain photoreceptors which may mediate immediate mantle retraction and valve closing (Kennedy, 1960; Wu et al., 2018). Kobak and Nowacki (2007) in Dreissena polymorpha and Botté et al. (2023) in Crassostrea gigas showed that these animals detect even very dim illuminations as low as 0.1 lx, which demonstrate a very high sensitivity. Kobak and Nowacki (2007) showed that D. polymorpha avoid these lights by moving away from them. Pinctada radiata in our experimental conditions were unable to move away from light in our laboratory conditions with their only solution being to close more often and more tightly. To our best knowledge, the present work reports the first documented interaction of combined noise and light pollution on bivalve behavior.
Ecological consequences
The risks and consequences of what we have just described are that in the presence of an apparently benign anthropogenic pressure, an equivalent situation in the field could expose P. radiata more to predation and decrease their probability of success in terms of reproduction. Individuals will also be less efficient, as we reported a decrease in individual growth rate and in the number of spawning. This phenomenon confirms previous observations by Charifi et al. (2018), who reported a slowing of fat metabolism and growth in the Pacific oyster Crassostrea gigas exposed to cargo sound. Lagardère (1982) observed the same noise effect on the gray shrimp Crangon crangon. Shrimp reared in tanks exposed to noise at a frequency range of 80 to 400 Hz and noise level of 30 dB higher than controls decreased their growth rate. Light pollution has emerged as a focus for ecological research in the past few years, and people have mainly focused on ALAN, that is, artificial light at night (Davies et al., 2014). The Arabian Gulf has been ranked as one of the most light-polluted areas, as it experiences intensive offshore development and coastal urbanization (Smyth et al., 2021). Here, we worked on another type of light pollution, difference of light exposure between two experimental set-up. Although further studies should be developed, our data highlight the importance of taking light intensity into consideration in future studies.
Egg laying, corroborated by the presence of juveniles, was observed at two distinct periods, just after the transfer to the laboratory and after a month and a half of observation. On arrival at the laboratory, the clutches were tightly packed in the low noise condition and more spread out in the standard laboratory condition. We propose that noise and light pollution played a role in this change in behavior. This influence appears even greater after a month and a half. Egg-laying movements were five times less numerous in the standard laboratory condition with high anthropogenic pressure. Overall, the present work shows a set of processes that can play a major role in the productivity of an environment (Solan et al., 2016; Charifi et al., 2018).
Consequences for past and future laboratory experiments
The present work also confirms the influence of experimental conditions on the study of the behavior and physiology of aquatic animals by pinpointing specific effects. Anthropogenic pressure represented by the usual equipment of an aquarium, the presence of personnel working in a room, and the use of laboratory equipment can have a profound effect. These effects can modify and influence the results of observations. It is at least important to be aware of it. Noise pollution is certainly a major factor, but it is not the only one. An excess of electric light or a difference of lighting between experimental conditions, based on the present results, could impact multiple aspects of the physiology of aquatic organisms. In addition, sudden switching on and off lights is common in laboratories. This is obviously not natural, and it will have an influence on the animals’ behavior, since light parameters are a strong command well known in chronobiology studies (Davies et al., 2014; Gaston et al., 2017). Sound and light pollution are major components of the anthropogenic pressure that we impose on the natural environment.
In conclusion, the present dataset confirms the depressant effect of noise pollution added to a light pollution of discreet appearance. It makes it possible to highlight the difference in the level of disturbances, both discreet and profound, that can be observed in contrasting environments as simple as a laboratory room where activity is normal and an unoccupied office. We propose that this gives insight into the impact our seemingly innocuous human activities might have in the wild. It is a new form of silent pollution. There is no immediate dramatic and fatal impact, but a slow degradation that might lead to profound population and ecosystem effects.
Data availability statement
The original contributions presented in the study are included in the article/supplementary material. Further inquiries can be directed to the corresponding authors.
Ethics statement
Ethical review and approval was not required for the study on animals in accordance with the local legislation and institutional requirements.
Author contributions
MoC: Conceptualization, Data curation, Formal analysis, Investigation, Methodology, Validation, Visualization, Writing – original draft, Writing – review and editing. RK: Data curation, Formal analysis, Investigation, Methodology, Visualization, Writing – original draft, Writing – review and editing. BG: Data curation, Formal analysis, Investigation, Methodology, Validation, Visualization, Writing – review and editing. MS: Data curation, Formal analysis, Software, Supervision, Validation, Visualization, Writing – original draft. ZH: Investigation, Methodology, Visualization, review and editing. MaC: Investigation. Methodology, review and editing. EM: Investigation, Methodology, Validation, Visualization, review and editing. SH: Investigation, Methodology, Visualization, review and editing. AB: Project administration Conceptualization, Investigation, Methodology, Validation, review and editing. PB: Project administration Conceptualization, Methodology, Validation, review and editing. AL: Conceptualization, Data curation, Formal analysis, Funding acquisition, Investigation, Methodology, Project administration, Resources, Supervision, Validation, Visualization, Writing – original draft, Writing – review and editing. J-CM: Conceptualization, Data curation, Formal analysis, Funding acquisition, Investigation, Methodology, Project administration, Resources, Supervision, Validation, Visualization, Writing – original draft, Writing – review and editing. All authors contributed to the article and approved the submitted version.
Funding
This publication was made possible by the NPRP award [NPRP11S-0115-180308 “Innovative In situ Biotechnology for Continuous Water Quality Monitoring on the Qatari Marine Environment”] from the Qatar National Research Fund (a member of Qatar Foundation). The authors declare that this study also received funding from TotalEnergies E&P QATAR. The funder was not involved in the study design, collection, analysis, interpretation of data, the writing of this article. It was involved in the decision to submit it for publication.
Acknowledgments
The authors would like to thank Dr. Alexei Godina for constructive comments and support and Mr. Faisal Al-Quaiti and Mr. Reyneil Garstang for their support in the collection of the samples.
Conflict of interest
Author Mathieu Carrara is employed by company TotalEnergies E&P QATAR.
The remaining authors declare that the research was conducted in the absence of any commercial or financial relationships that could be construed as a potential conflict of interest.
Publisher’s note
All claims expressed in this article are solely those of the authors and do not necessarily represent those of their affiliated organizations, or those of the publisher, the editors and the reviewers. Any product that may be evaluated in this article, or claim that may be made by its manufacturer, is not guaranteed or endorsed by the publisher.
References
Andrade H., Massabuau J. C., Cochrane S., Ciret P., Tran D., Sow M., et al. (2016). High frequency non-invasive (HFNI) bio-sensors as a potential tool for marine monitoring and assessments. Front. Mar. Sci. 3. doi: 10.3389/fmars.2016.00187
Botté A., Payton L., Tran D. (2023). Artificial light at night at environmental intensities disrupts daily rhythm of the oyster Crassostrea gigas. Mar. pollut. Bull. 191, 114850. doi: 10.1016/j.marpolbul.2023.114850
Burt J. (2014). The environmental costs of coastal urbanization in the Arabian Gulf. City 18, 760–770. doi: 10.1080/13604813.2014.962889
Charifi M., Miserazzi A., Sow M., Perrigault M., Gonzalez P., Ciret P., et al. (2018). Noise pollution limits metal bioaccumulation and growth rate in a filter feeder, the Pacific oyster Magallana gigas. PLoS One 13 (4), e0194174. doi: 10.1371/journal.pone.0194174
Charifi M., Sow M., Ciret P., Benomar S., Massabuau J. C. (2017). The sense of hearing in the Pacific oyster, Magallana gigas. PLoS ONE 12 (10), e0185353. doi: 10.1371/journal.pone.0185353
Côté I. M., Jelnikar E. (1999). Predator-induced clumping behaviour in mussels (Mytilus edulis Linnaeus). J. Exp. Mar. Biol. Ecol. 235, 201–211. doi: 10.1016/S0022-0981(98)00155-5
Davies T. W., Duffy J., Bennie J., Gaston K. J. (2014). The nature, extent, and ecological implications of marine light pollution. Front. Ecol. Environ. 12, 347–355. doi: 10.1890/130281
Delgado M., Pérez-Camacho A. (2005). Histological study of the gonadal development of Ruditapes decussatus (L.) (Mollusca Bivalvia) and its relationship with available food. Scientia Marina. 69 (1), 87–97.
Duarte C. M., Chapuis L., Collin S. P., Costa D. P., Devassy R. P., Eguiluz V. M., et al. (2021). The soundscape of the Anthropocene ocean. Science 371, 6529. doi: 10.1126/science.aba4658
Duffy J. F., Dijk D. J. (2002). Getting through to circadian oscillators: why use constant routines? J. Biol. Rhythms. 17 (1), 4–13. doi: 10.1177/074873002129002294
Gaston K. J., Davies T. W., Nedelec S. L., Holt L. A. (2017). Impacts of artificial light at night on biological timings. Annu. Rev. Ecology Evolution Systematics 48, 49–68. doi: 10.1146/annurev-ecolsys-110316-022745
Giraldes B. W., Coelho-Filho P. A., Smyth D. M., Coelho P. A. (2017). The nocturnal zonation of decapods in the subtidal zone within the reef seascape—abiotic factors defining habitats. ICES J. Mar. Sci. 74, 2180–2190. doi: 10.1093/icesjms/fsx055
Giraldes B. W., Leitão A., Smyth D. (2019). The benthic sea-silk-thread displacement of a sessile bivalve, Pinctada imbricata radiata (Leach 1819) in the Arabian-Persian gulf. PLoS One 14. doi: 10.1371/journal.pone.0215865
Hancox T. P. M., Skene D. J., Dallmann R., Dunn W. B. (2021). Tick-tock consider the clock: the influence of circadian and external cycles on time of day variation in the human metabolome-A review. Metabolites 11 (5), 328. doi: 10.3390/metabo11050328
Hoare D. J., Couzin I. D., Godin G. J., Krause J. (2004). Context-dependent group size choice in fish. Anim. Behav. 67, 155–164. doi: 10.1016/j.anbehav.2003.04.004
Hosseini H., Saadaoui S., Moheimani N., Al Saidi M., Al Jamali F., Al Jabri H., et al. (2021). Marine health of the Arabian Gulf: Drivers of pollution and assessment approaches focusing on desalination activities. Mar. pollut. Bull. 164, 112085. doi: 10.1016/j.marpolbul.2021.112085
Hubert J., Daniëlle van der Burg A., Witbaard R., Slabbekoorn H. (2023). Separate and combined effects of boat noise and a live crab predator on mussel valve gape behavior. Behav. Ecol. 34 (3), 495–505. doi: 10.1093/beheco/arad012
Jahromi S. T., Pourmozaffar S., Rameshi H., Gozari M., Nahavandi R. (2020). Evaluation of hemolymph biochemical properties, clearance rate, bacterial microbiota and expression of HSP genes of gulf pearl oyster Pinctada radiata in response to salinity changes. Fish. Sci. 86, 1055–1065. doi: 10.1007/s12562-020-01459-5
Kennedy D. (1960). Neural photoreception in a lamellibranch mollusk. J. Gen. Physiol. 44 (2), 277–299. doi: 10.1085/jgp.44.2.277
Kobak J., Nowacki P. (2007). Light-related behaviour of the zebra mussel (Dreissena polymorpha, Bivalvia). Fund Appl. Limnol Arch. Hydrobiol 169 (4), 341–352. doi: 10.1127/1863-9135/2007/0169-0341
Lagardère J. P. (1982). Effects of noise on growth and reproduction of Crangon crangon in rearing tanks. Mar. Biol. 71, 177–185. doi: 10.1007/BF00394627
Latendresse J. R., Warbrittion A. R., Jonassen H., Creasy D. M. (2002). Fixation of testes and eyes using a modified Davidson’s fluid: comparison with Bouin’s fluid and conventional Davidson’s fluid. Toxicol. Pathol. 30, 524–533. doi: 10.1080/01926230290105721
Ledoux T., Clements J. C., Comeau L. A., Cervello G., Tremblay R., Olivier F., et al. (2023). Effects of anthropogenic sounds on the behavior and physiology of the Eastern oyster (Crassostrea virginica). Front. Mar. Sci. 10. doi: 10.3389/fmars.2023.1104526
Moussa R. M. (2018). The potential impacts of low and high salinities on salinity tolerance and condition index of the adult pearl oyster Pinctada imbricata radiata (Leach 1814). JoBAZ 79, 12. doi: 10.1186/s41936-018-0021-y
R Core Team. (2022) R: A Language and Environment for Statistical Computing. R Foundation for Statistical Computing, Vienna. https://www.R-project.org
Readman J. W., Fowler S. W., Villeneuve J. P., Cattini C., Oregioni B., Mee L. D. (1992). Oil and combustion-product contamination of the Gulf marine environment following the war. Nature 358, 662–665. doi: 10.1038/358662a0
Robertson D. R., Sweatman H. P. A., Fletcher E. A., Cleland and M. G. (1976). Schooling as a mechanism for circumventing the territoriality of competitors. Ecology 57 (6), 1208–1220. doi: 10.2307/1935045
Robson A. A., Garcia de Leaniz C., Wilson R. P., Halsey L. G. (2010). Behavioural adaptations of mussels to varying levels of food availability and predation risk. J. Molluscan Stud. 76, 348–353. doi: 10.1093/mollus/eyq025
ROPME (2013). State of Marine Environment Report- 2013 (Kuwait: ROPME/ GC-16 /1-ii regional organization for the protection of the marine environment).
Schwartzmann C., Durrieu G., Sow M., Ciret P., Lazareth C.E., Massabuau J.-C. (2011). In situ giant clam growth rate behaviour in relation to temperature: A one-year coupled study of high-frequency noninvasive valvometry and sclerochronology. Limnology and Oceanography 56, 1940–1951. doi: 10.4319/lo.2011.56.5.1940
Sheppard C., Al-Husiani M., Al-Jamali F., Al-Yamani F., Baldwin R., Bishop J., et al. (2010). The gulf: a young sea in decline. Mar. pollut. Bull. 60, 13–38. doi: 10.1016/j.marpolbul.2009.10.017
Shi W., Han Y., Guan X., Rong J., Du X., Zha S., et al. (2019). Anthropogenic noise aggravates the toxicity of cadmium on some physiological characteristics of the blood clam. Tegillarca granosa. Front. Physiol. 10. doi: 10.3389/fphys.2019.00377
Simpson S. D., Radford A. N., Nedelec S. L., Ferrari M. C. O., Chivers D. P., McCormick M. I., et al. (2016). Anthropogenic noise increases fish mortality by predation. Nat. Commun. 7, 10544. doi: 10.1038/ncomms10544
Smyth T. J., Wright A. E., McKee S., Tidau R., Tamir Z., Dubinsky D., et al. (2021). A global atlas of artificial light at night under the sea. Elem Sci. Anth 9, 1. doi: 10.1525/elementa.2021.00049
Solan M., Hauton C., Godbold J. A., Wood C. L., Leighton T. G., White P. (2016). Anthropogenic sources of underwater sound can modify how sediment-dwelling invertebrates mediate ecosystem properties. Sci. Rep. 6, 20540. doi: 10.1038/srep20540
Solé M., Kaifu K., Mooney T. A., Nedelec S. L., Olivier F., Radford A. N., et al. (2023). Marine invertebrates and noise. Front. Mar. Sci. 10. doi: 10.3389/fmars.2023.1129057
Sow M., Durrieu G., Briollais L., Ciret P., Massabuau J. C. (2011). Water quality assessment by means of valvometry and high-frequency data modeling. Env. Mon Assess. 182, 155–170. doi: 10.1007/s10661-010-1866-9
Sueur J. (2018). “Mel-frequency cepstral and linear predictive coefficients,” in Sound Analysis and Synthesis with R, 1 st ed (Cham, Switzerland: Springer International Publishing AG), 381–398.
Wabnitz C. C. C., Lam V. W. Y., Reygondeau G., Teh L. C. L., Al-Abdulrazzak D., Khalfallah M., et al. (2018). Climate change impacts on marine biodiversity, fisheries and society in the Arabian Gulf. PLoS One 13. doi: 10.1371/journal.pone.0194537
Wale M. A., Briers R. A., Diele K. (2021). Marine invertebrate anthropogenic noise research – Trends in methods and future directions. Mar. pollut. Bull. 173, 112958. doi: 10.1016/j.marpolbul.2021.112958
Wu C., Jiang Q., Wei L., Cai Z., Chen J., Yu W., et al. (2018). A rhodopsin-like gene may be associated with the light-sensitivity of adult pacific oyster Crassostrea gigas. Front. Physiol. 9. doi: 10.3389/fphys.2018.00221
Keywords: pearl oyster, Arabian Gulf, HFNI, spawning, reproductive behavior, light pollution, noise pollution
Citation: Charifi M, Khalifa R, Giraldes BW, Sow M, Hizam Z, Carrara M, Maneux E, Hamza S, Bassères A, Blanc P, Leitão A and Massabuau J-C (2023) Deep behavioral impairment in the pearl oyster Pinctada radiata exposed to anthropogenic noise and light stress. Front. Mar. Sci. 10:1251011. doi: 10.3389/fmars.2023.1251011
Received: 30 June 2023; Accepted: 13 October 2023;
Published: 02 November 2023.
Edited by:
Xiao Liang, Shanghai Ocean University, ChinaReviewed by:
Linda Adzigbli, University of Rostock, GermanyLiqiang Zhao, Guangdong Ocean University, China
Yuehuan Zhang, Chinese Academy of Sciences (CAS), China
Copyright © 2023 Charifi, Khalifa, Giraldes, Sow, Hizam, Carrara, Maneux, Hamza, Bassères, Blanc, Leitão and Massabuau. This is an open-access article distributed under the terms of the Creative Commons Attribution License (CC BY). The use, distribution or reproduction in other forums is permitted, provided the original author(s) and the copyright owner(s) are credited and that the original publication in this journal is cited, in accordance with accepted academic practice. No use, distribution or reproduction is permitted which does not comply with these terms.
*Correspondence: Alexandra Leitão, YWxleGFuZHJhLmhhbWFkb3VAcXUuZWR1LnFh; Jean-Charles Massabuau, amVhbi1jaGFybGVzLm1hc3NhYnVhdUBtb2xsdXNjYW4tZXllLmNvbQ==