
94% of researchers rate our articles as excellent or good
Learn more about the work of our research integrity team to safeguard the quality of each article we publish.
Find out more
ORIGINAL RESEARCH article
Front. Mar. Sci., 16 November 2023
Sec. Marine Ecosystem Ecology
Volume 10 - 2023 | https://doi.org/10.3389/fmars.2023.1249073
This article is part of the Research TopicChanges in Estuarine Fishery Ecosystems under Multiple StressorsView all 5 articles
 Jinxia Zhang1,2†
 Lei Xu2,3†
 Feiyan Du2,3
 Quehui Tang2,3Lianggen Wang2,3Jiajia Ning2,3
 Delian Huang2,3
 Yafang Li2,3Shuangshuang Liu2,3
 Xuehui Wang2,4,5*
Introduction: Hainan Island is encompassed within the shallow waters of the tropical continental shelf in China, which is recognized as a significant hotspot for fish biodiversity. Despite extensive research conducted on marine fish taxonomy surrounding Hainan Island, there remains a substantial gap between our current understanding and the actual fish diversity within this oceanic area.
Methods: In this study, we employed DNA barcoding and molecular identification approaches to explore the species diversity and distribution pattern of marine fish in both the northern and southern sea areas of Hainan Island in the northern South China Sea.
Results: A total of 186 sequences were obtained from the collected marine fish samples in the two sea areas surrounding Hainan Island. Through DNA identification, it was confirmed that all 186 sequences corresponded to typical fish species found in the northern South China Sea, all sequences represented a total of 56 species, 47 genera, 34 families, and 17 orders. The average Kimura 2-parameter (K2P) distances within species, genus, family, order and class were 0.15%, 6.53%, 13.17%, 16.95% and 24.81%, respectively.
Discussion: Our investigation in the northern sea areas of Hainan Islands identified a total of 33 distinct species, while the southern sea areas exhibited 29 distinct species, with only 5 species found to be shared between both regions. These findings clearly indicate a significant disparity in the species composition of fish communities between the northern and southern sea regions.
The ocean is believed to contain an astonishing 21,800 distinct species of fish, exhibiting an extraordinary assortment of dimensions, hues, and configurations. Astonishingly, approximately between one-third and two-thirds of marine species remain unidentified through traditional methods of identification, even new marine species are being described at a rate of about 100-150 per year (Mora et al., 2008; Eschmeyer et al., 2010; Appeltans et al., 2012). Traditional methods of fish identification, classification, and naming predominantly rely on observable morphological diagnostic traits and measurable biological characteristics. Although modern taxonomic work employs other features such as geography, anatomy, physiology, isoenzymes, and behavior, morphological diagnosis remains the cornerstone of taxonomic treatment. In the face of the amazing diversity of fish in terms of body size, color, pattern, scale size, number and type of fin rays, traditional morphological classification and identification present some limitations. The above-mentioned diversity is also present in different stages of fish development. Morphological diagnostic characters used to discern taxa cannot be suitable for all developmental stages (Victor et al., 2009; Ward et al., 2009; Huang et al., 2022). In addition, morphological traits of marine fish can sometimes exhibit either significant intraspecific differences or minor interspecific differences Identification of marine fish requires not only proficiency in specialized disciplines like taxonomy and morphological identification, but also in marine ecology, developmental biology, biogeography, anatomy, and fisheries resources. Proficiency in these domains is imperative in order to precisely recognize and categorize marine piscine taxa. Relying solely on morphological diagnostic characters for identification poses challenges such as inaccuracy, difficulty, and time-consumption, particularly for non-specialists involved in marine ecosystem research (Lima-Filho et al., 2016; Struck et al., 2018).
DNA sequencing-based approaches offer a dependable, swift, and cost-effective diagnostic system that utilizes specific gene sequences known as “DNA barcodes” for organism identification. The fundamental basis of DNA barcoding rests upon the comparison of sequence similarity between two distinct organisms, serving to establish the degree of relatedness between them. In their seminal publication, Hebert et al. (2003) presented the notion of leveraging a standardized mitochondrial cytochrome c oxidase subunit I (COI) gene sequence, spanning approximately 658 base pairs in length, as a potent instrument for the identification of organisms across the entire animal kingdom. The basis for this approach stemmed from the observed sequence diversity among various taxa. The COI gene possesses several characteristics that render it reliable and efficient tool for species identification across a wide range of animal groups. Notably, it exhibits a predominantly haploid pattern of inheritance, primarily passed down from the mother. Furthermore, it is abundantly present in multiple copies within the mitochondria, displays a high substitution rate, and lacks introns and recombination, enhancing its utility as a marker for species identification. (Ballard and Whitlock, 2004; Bernt et al., 2013). In the following years, Hebert’s research group successfully established a global platform encompassing standardized datasets, universal technical protocols, and taxonomic identification systems for animals. This comprehensive framework served as a foundation to facilitate consistent and harmonized approaches in DNA barcoding research worldwide (Ratnasingham and Hebert, 2007; Ratnasingham and Hebert, 2013). Over the course of the last two decades, subsequent to the preliminary proposition of DNA barcoding for the purpose of identifying specimens, a plethora of investigations have undeniably exhibited the cost-efficient nature of this approach in identifying species.
The implementation of DNA barcoding has garnered significant recognition among various taxonomic groups, including but not limited to crustaceans (Costa et al., 2007; Matzen da Silva et al., 2011; Xu et al., 2018), insects (Hebert et al., 2004b; Janzen et al., 2005; Hajibabaei et al., 2006; Shashank et al., 2022), fish (Hubert et al., 2008; Ward et al., 2009; Francisco et al., 2022), birds (Hebert et al., 2004a; Kerr et al., 2009; Dimitriou et al., 2017) and mammals (Clare et al., 2007; Borisenko et al., 2008; Silva et al., 2021). The majority of DNA barcoding data generated from these studies were diligently documented in public databases, accompanied by voucher specimens featuring comprehensive collection records, specimen identifiers, and specimen images. This invaluable repository of information serves as a fundamental resource for subsequent studies, providing crucial foundational data for further investigations (Ratnasingham and Hebert, 2013). DNA barcoding offers a significant advantage as it proves to be effective across various organisms at different developmental stages, ranging from eggs to adults. This remarkable feature enables the identification of organisms during their larval stage, even in the absence of distinct morphological characteristics. By comparing the sequences of unidentified larval specimens with those of previously documented adults stored in the reference sequence library, it becomes possible to accurately determine their identities (Barber and Boyce, 2006; Caterino and Tishechkin, 2006; Kusbiyanto et al., 2020; Huang et al., 2022; Xu et al., 2022). These endeavors have made substantial contributions to the detection of previously unknown species and accelerated the identification of sibling species or cryptic species. Notably, DNA barcoding research has witnessed a concentrated focus on studying the diversity of marine fish. Various regions have been subject to intensive investigations in this field, including the Arctic Ocean (Mecklenburg et al., 2011), the South Pacific (Ward et al., 2005; Zemlak et al., 2009), the Atlantic (Lima-Filho et al., 2016; Oliveira et al., 2016), the Mediterranean (Bariche et al., 2015; Francisco et al., 2022), the East Pacific Ocean (Steinke et al., 2009; Mabragaña et al., 2011), the Indian Ocean (Lakra et al., 2011; Ahmed et al., 2021), and the West Pacific (Zhang and Hanner, 2011).
The fish species composition and faunal attributes in each marine area reflect the historical evolutionary outcomes that have been gradually shaped over extensive periods within distinct marine environments. These outcomes provide insights into the long-term processes and dynamics that have influenced the diversity and distribution of fish species in these areas (Briggs and Bowen, 2012). The northern South China Sea plays a vital role as both spawning and feeding habitats for commercially valuable fish populations, making it a significant marine fishing zone. The spatial distribution of fish species is intricately influenced by various environmental factors, including salinity, temperature, and water depth. The northern South China Sea, due to the complex marine ecological environment created by the convergence of the South China Sea Warm Current and the Kuroshio South China Sea branches, harbors not only common tropical and subtropical fish species but also some oceanic species and coral reef fish (Shen and Heino, 2014; Gao et al., 2017). Based on a comprehensive review of literature and data amalgamation, the researchers inferred that the northern shelf region of the South China Sea is home to a diverse assemblage of 2025 fish species (Institute of Zoo and Chinese Academy of Sciences, 1962; Zhang and Hanner, 2012; Liu, 2013).
In this work, our aim was to examine the fish diversity and distribution in the two significant fisheries regions located in the northern South China Sea surrounding the Hainan Islands. To achieve this, we collected specimens from northern and southern areas on Hainan Island. We utilized DNA barcoding and DNA identification as practical and additional approaches to complement the traditional morphological method for identifying marine fish species in the northern South China Sea surrounding the Hainan Islands. Our study on species diversity in local fish faunas will have significant implications for the conservation and fish resource studies in the northern South China Sea.
Hainan Island, an expansive landmass, is located within the northwestern expanse of the northern South China Sea. It is encompassed within the shallow waters of the tropical continental shelf in China. To the north of Hainan Island lies the Qiongzhou Strait, a narrow strait spanning a mere 20 kilometers. This strait acts as a separation between the island and mainland China. To the west of Hainan Island is situated the Beibu Gulf, which is a naturally occurring semi-enclosed gulf, enveloping a water area of roughly 128,000 square kilometers. The mean water depth in this gulf is approximately 39 meters, while certain regions exhibit a maximum depth of 100 meters. The southeastern sea region of Hainan Island showcases a slender continental shelf, which is succeeded by a sharp continental slope (Hu et al., 2003; Ma et al., 2010; Zhu, 2016). Hainan Island, being the second largest island within the Chinese territory, commands a significant expanse of sea region within its administrative purview, spanning an estimated 2 million square kilometers, constituting 42.3% of the nation’s overall sea area. The coastline of Hainan Island extends for a total length of 1618 kilometers. Along this coastal expanse, a multifarious array of biotopes can be discerned, encompassing rock formations, coral formations, gravelly substrates, sandy substrates, and muddy substrates, contributing to the island’s prodigious ecological heterogeneity (Liu, 2013; Zhang et al., 2020).
The piscine specimens were procured by means of bottom trawler nets by the commercial fishing vessel “Beiyu60011” during the time span of April to May 2017. The areas of collection were located respectively in the northern (111°15′E to 111°45′E, 19°45′N to 20°15′N) and southern (109°30′E to 110°00′E, 17°30′N to 18°00′N) sea area of Hainan Island (Figure 1). The identification and naming of species were conducted by conforming to the diagnostic morphological characteristics for marine fish as explicated in FishBase (http://www.fishbase.org) and FAO Fish Identification Sheets. A quantity of several specimens of each species identified through morphology were meticulously chosen, and their dorsal fins were meticulously excised and conserved in absolute ethanol at a temperature of -20°C. The aforementioned specimens shall be utilized in the subsequent investigation of DNA barcoding.
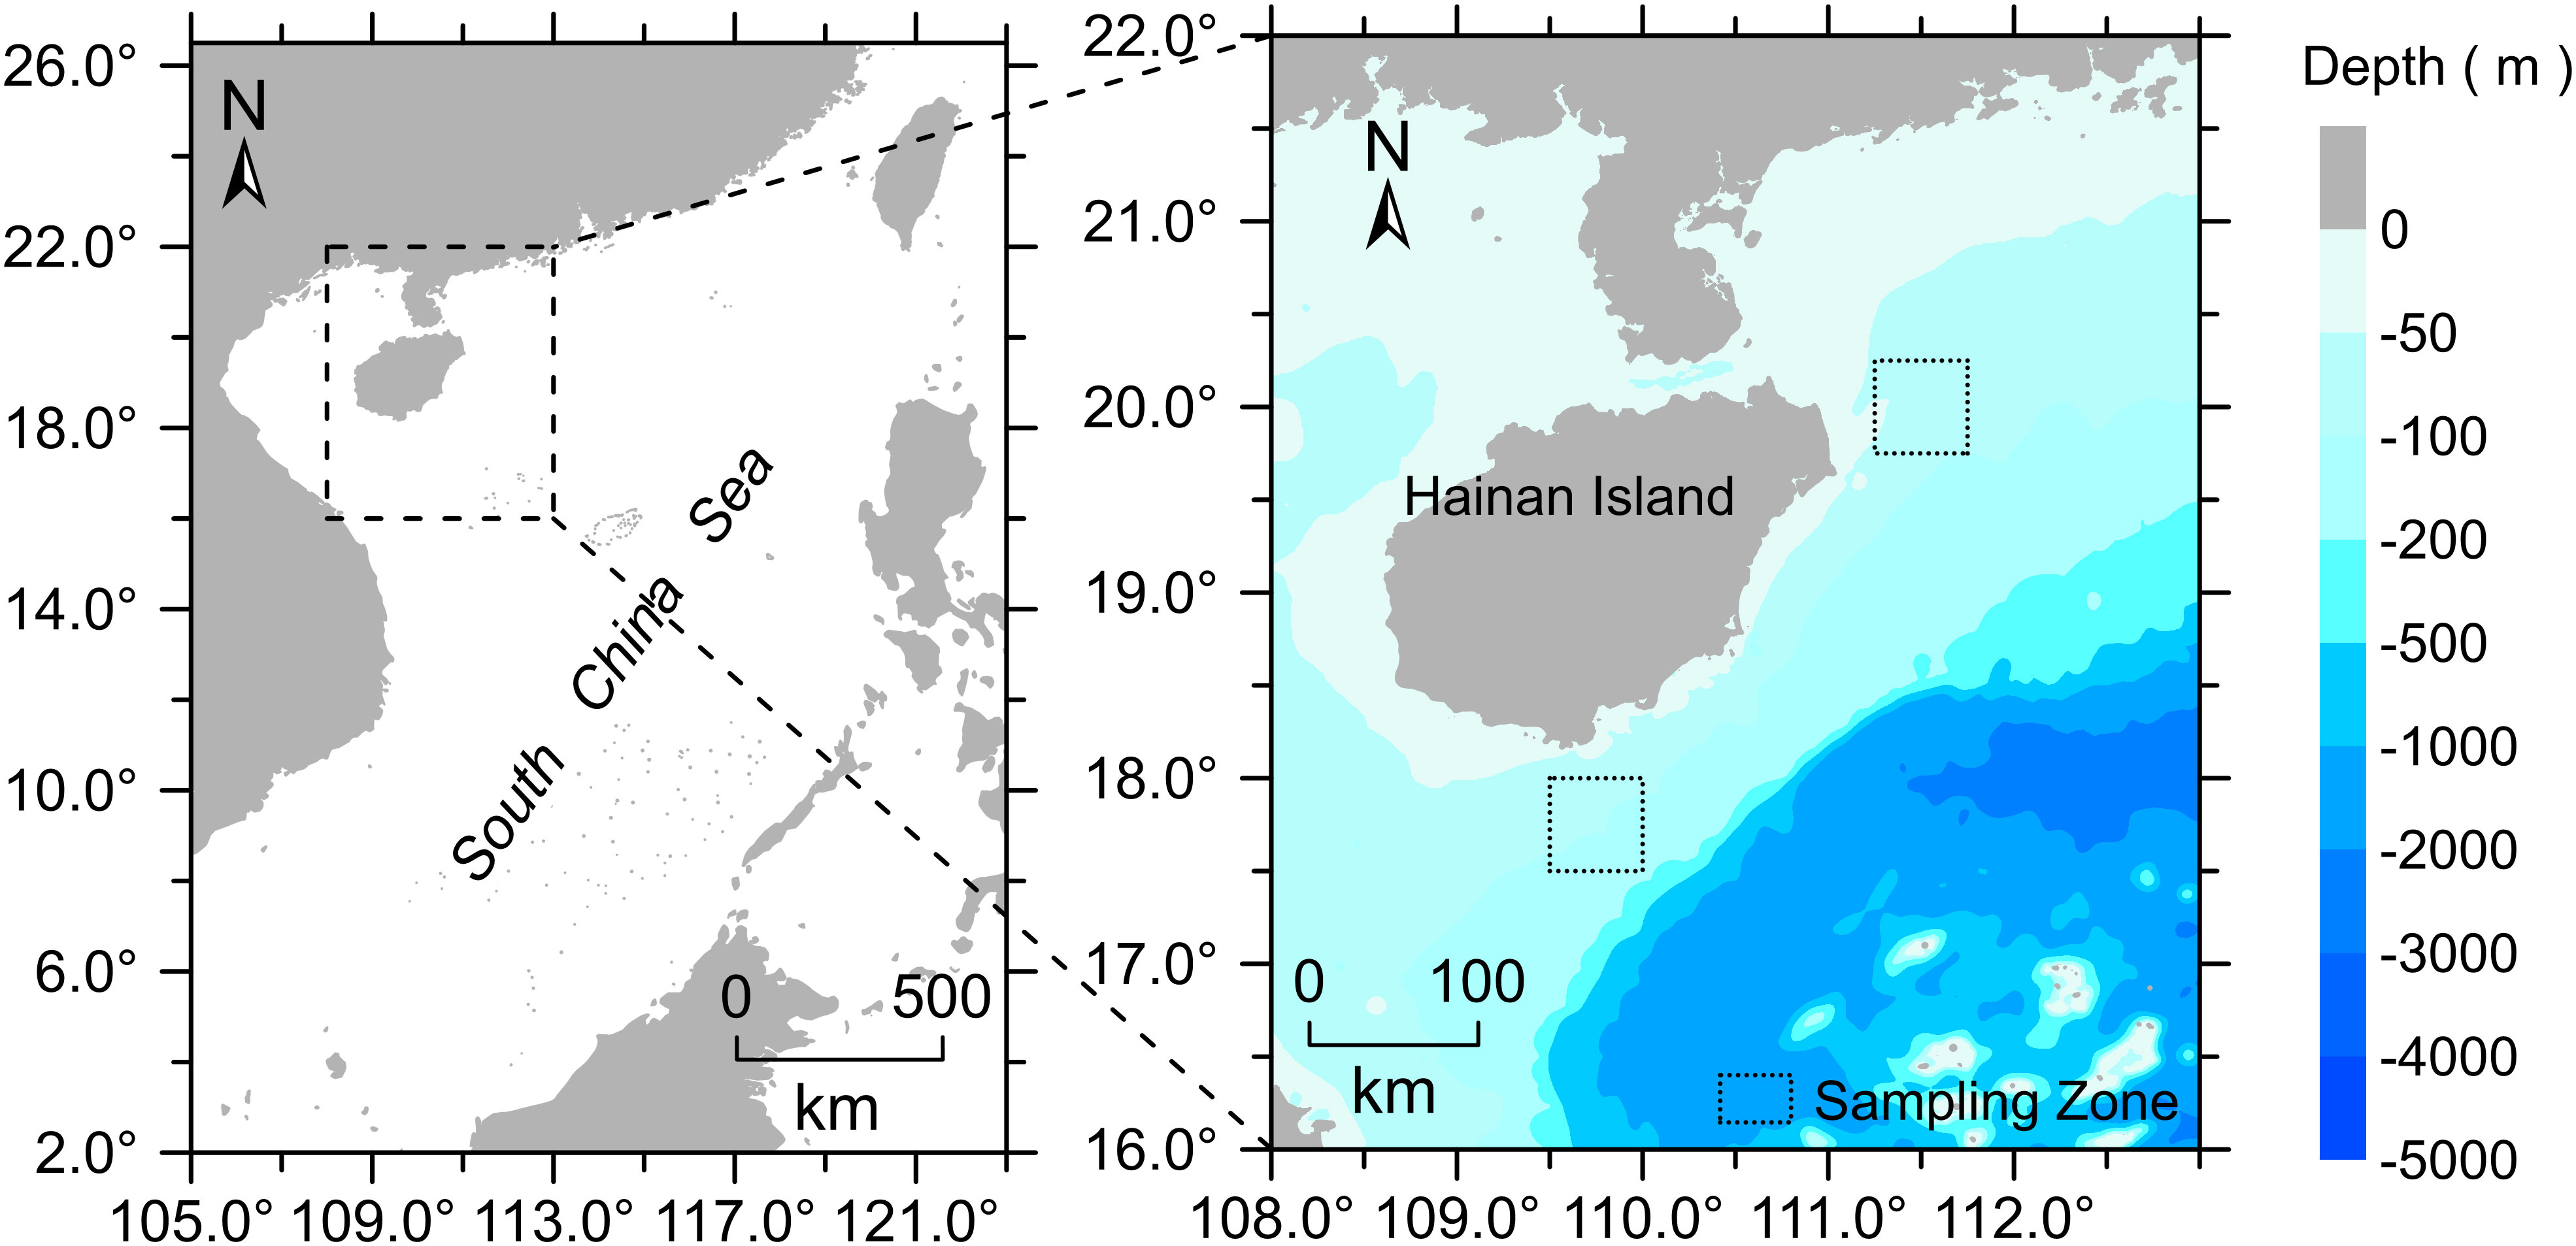
Figure 1 Map showing the two sampling areas in the sea area near Hainan Island.
Genomic DNA extraction, amplification and sequencing of the COI gene, we followed the methodologies outlined in our previously published work (Xu et al., 2019; Xu et al., 2021). Genomic DNA was extracted from dorsal fin tissue using the TIANamp Marine Animals DNA Kit (TIANGEN, China) according to the manufacturer’s protocol. The concentration of the DNA used as a template for PCR was adjusted to an A260 value of approximately 0.05 to 0.2. For PCR, we utilized the primers FishF1 and FishR1, which were specifically designed for fish analysis (Ward et al., 2005). Each 50µl PCR reaction consisted of the following components: 31.25µl dd H2O, 5µl PCR buffer, 5µl Coralload concentrate, 4µl of 25 µM MgCl2, 1µl of 10 µM dNTPs, 0.5µl of 25 µM solution of each primer, 2.5µl DNA template, and 0.25µl of TopTaq DNA polymerase (QIAGEN, Germany). The PCR amplification conditions were as follows: an initial denaturation step at 95°C for 2 minutes, followed by 35 cycles of denaturation at 95°C for 0.5 minutes, annealing at 54°C for 0.5 minutes, and extension at 72°C for 1 minute. The amplification process was concluded with a final extension step at 72°C for 7 minutes using a 2720 Thermal Cycler (Applied Biosystems, USA). The PCR products were visualized on 1% agarose gels, and the most intense bands were selected for sequencing. Bi-directional sequencing was performed on an ABI 3730XL automated sequencer, using both forward and reverse primers, in accordance with the manufacturer’s instructions. We conducted a thorough BLAST search in GenBank, utilizing the BLASTn algorithm with the mega blast option, for the purpose of verifying the accuracy of our COI sequences. We compared the obtained sequences to find the highest match, ensuring a similarity of 98% to 100%. The sequences were aligned and analyzed using BioEdit (Hall, 1999). A sequence alignment of multiple sequences was executed through the utilization of the CLUSTALW algorithm while taking into account the nonexistence of insertions or deletions, also known as indels. Nevertheless, the initial 20 base pairs and the terminal 10 base pairs were excluded from the analysis on account of their usually show high level of non-informative nucleotides or sequence background. In order to compare our nomenclature, which was derived from the literature, with the names obtained from GenBank for each species, we included the COI sequences sourced from public databases into our analysis (Table S1). We employed two distinct tools, the Automatic Barcode Gap Discovery (ABGD) (https://bioinfo.mnhn.fr/abi/public/abgd/abgdweb.html) and the Generalized Mixed Yule Coalescent (GMYC) model (The R Programming Language), to evaluate taxonomic units through DNA identification. These tools allowed us to estimate potential species boundaries using the COI dataset. The ABGD approach is designed to identify gaps in the DNA barcode data, which can be indicative of distinct species. It divides the sequences into putative species based on the magnitude of genetic divergence, utilizing a sliding window approach. By comparing intra- and inter-specific genetic distances, ABGD helps determine species boundaries (Puillandre et al., 2012). On the other hand, the GMYC model employs a different approach by utilizing the branching patterns of the genealogy. It assumes that gene trees within a single species follow a coalescent process, while between different species they diverge. The model estimates the transition point where the gene tree shifts from a coalescent to a divergent process, thus inferring species boundaries (Pons et al., 2006; Fujisawa and Barraclough, 2013). By utilizing both ABGD and the GMYC model, we aimed to enhance the accuracy and reliability of our taxonomic assessments. These tools provided complementary perspectives on species boundaries, allowing us to make more informed inferences based on the COI dataset. For detailed examination techniques and parameter configurations, we kindly refer the reader to our antecedently issued publications (Xu et al., 2019; Xu et al., 2022). The divergence of COI sequences was calculated using the Kimura 2-parameter (K2P) distance model in MEGA version 6 (Kumar et al., 2008; Tamura et al., 2013). We executed a phylogenetic analysis utilizing Bayesian Inference, incorporating all accessible sequences to demonstrate the interrelationships between pelagic and deep-sea species, as well as their distribution patterns surrounding Hainan Island. The full details of the analysis methods and parameters were described in our previously published papers (Xu et al., 2019; Xu et al., 2021). We also assessed the β-diversity of fish communities between northern and southern sea areas using Jaccard’s dissimilarity index. (Koleff et al., 2003):
where βjac is Jaccard’s dissimilarity index, a represents the number of species present in both sites, b indicates the number of species present in the first site but not in the second, and c represents the number of species present in the second site but not in the first. Further, we partition the β-diversity into turnover and nestedness components following equations (2) and (3), respectively.
where βjtu is the turnover component of Jaccard dissimilarity, βjne is the nestedness-resultant component of Jaccard dissimilarity. a, b and c are the same as in equation (1). The taxonomic β-diversity and its components were calculated through the ‘beta.pair’ function of the R package ‘betapart’ (Baselga and Orme, 2012; Baselga et al., 2021).
We performed an analysis on a dataset consisting of 242 sequences of the COI gene. Out of these sequences, 186 were obtained from 73 specimens collected in the southern sea areas of Hainan Island [available in Xu et al. (2021)], 113 specimens from the northern sea areas of Hainan Island (GenBank accession numbers: OR144930-OR145042). To ensure the accuracy of our nomenclature, we also incorporated 56 COI sequences from public databases, specifically selecting those sequences that showed the highest level of similarity to known species identities (see Table S1). The fragment’s total length after sequence alignment is 602 bp. The average base composition for the COI sequence was as follows: A = 23.8%, C = 29.1%, G = 18. 4%, T = 28.8%, the transition/transversion (ti/tv) ratio was 1.19. Based on morphological diagnostic characteristics, a total of 56 morphological species were identified. Out of the total, 4 species only could be identified to the genus level. Additionally, 2 species were misidentified as cryptic species or sibling species based solely on morphological diagnostic characteristics (Table 1). The DNA identification process has confirmed that all 186 sequences analyzed correspond to typical fish species found in the South China Sea, encompass a total of 56 distinct species, belonging to 47 genera, 34 families, and 17 orders. DNA identification using the Automatic Barcode Gap Discovery (ABGD) method successfully detected a clear and distinct barcode gap in the COI alignment. The analysis indicated that out of the 186 sequences, they potentially represented 56 taxonomic units. The estimated number of putative clusters ranged from 50 to 58. The COI phylogeny analysis using the Generalized Mixed Yule Coalescent (GMYC) approach supported the hypothesis that the examined individuals belonged to 56 distinct taxonomic units. The confidence interval for the estimated number of taxonomic units ranged from 55 to 59. The probability of the null hypothesis, which posited the existence of only a single species (likelihood = 1967.19, likelihood ratio test = 371.35, p =1.13×10⁻⁹), was significantly diminished in comparison to the probability of the model that permitted for multiple species (likelihood = 2152.86) (Figure 2).
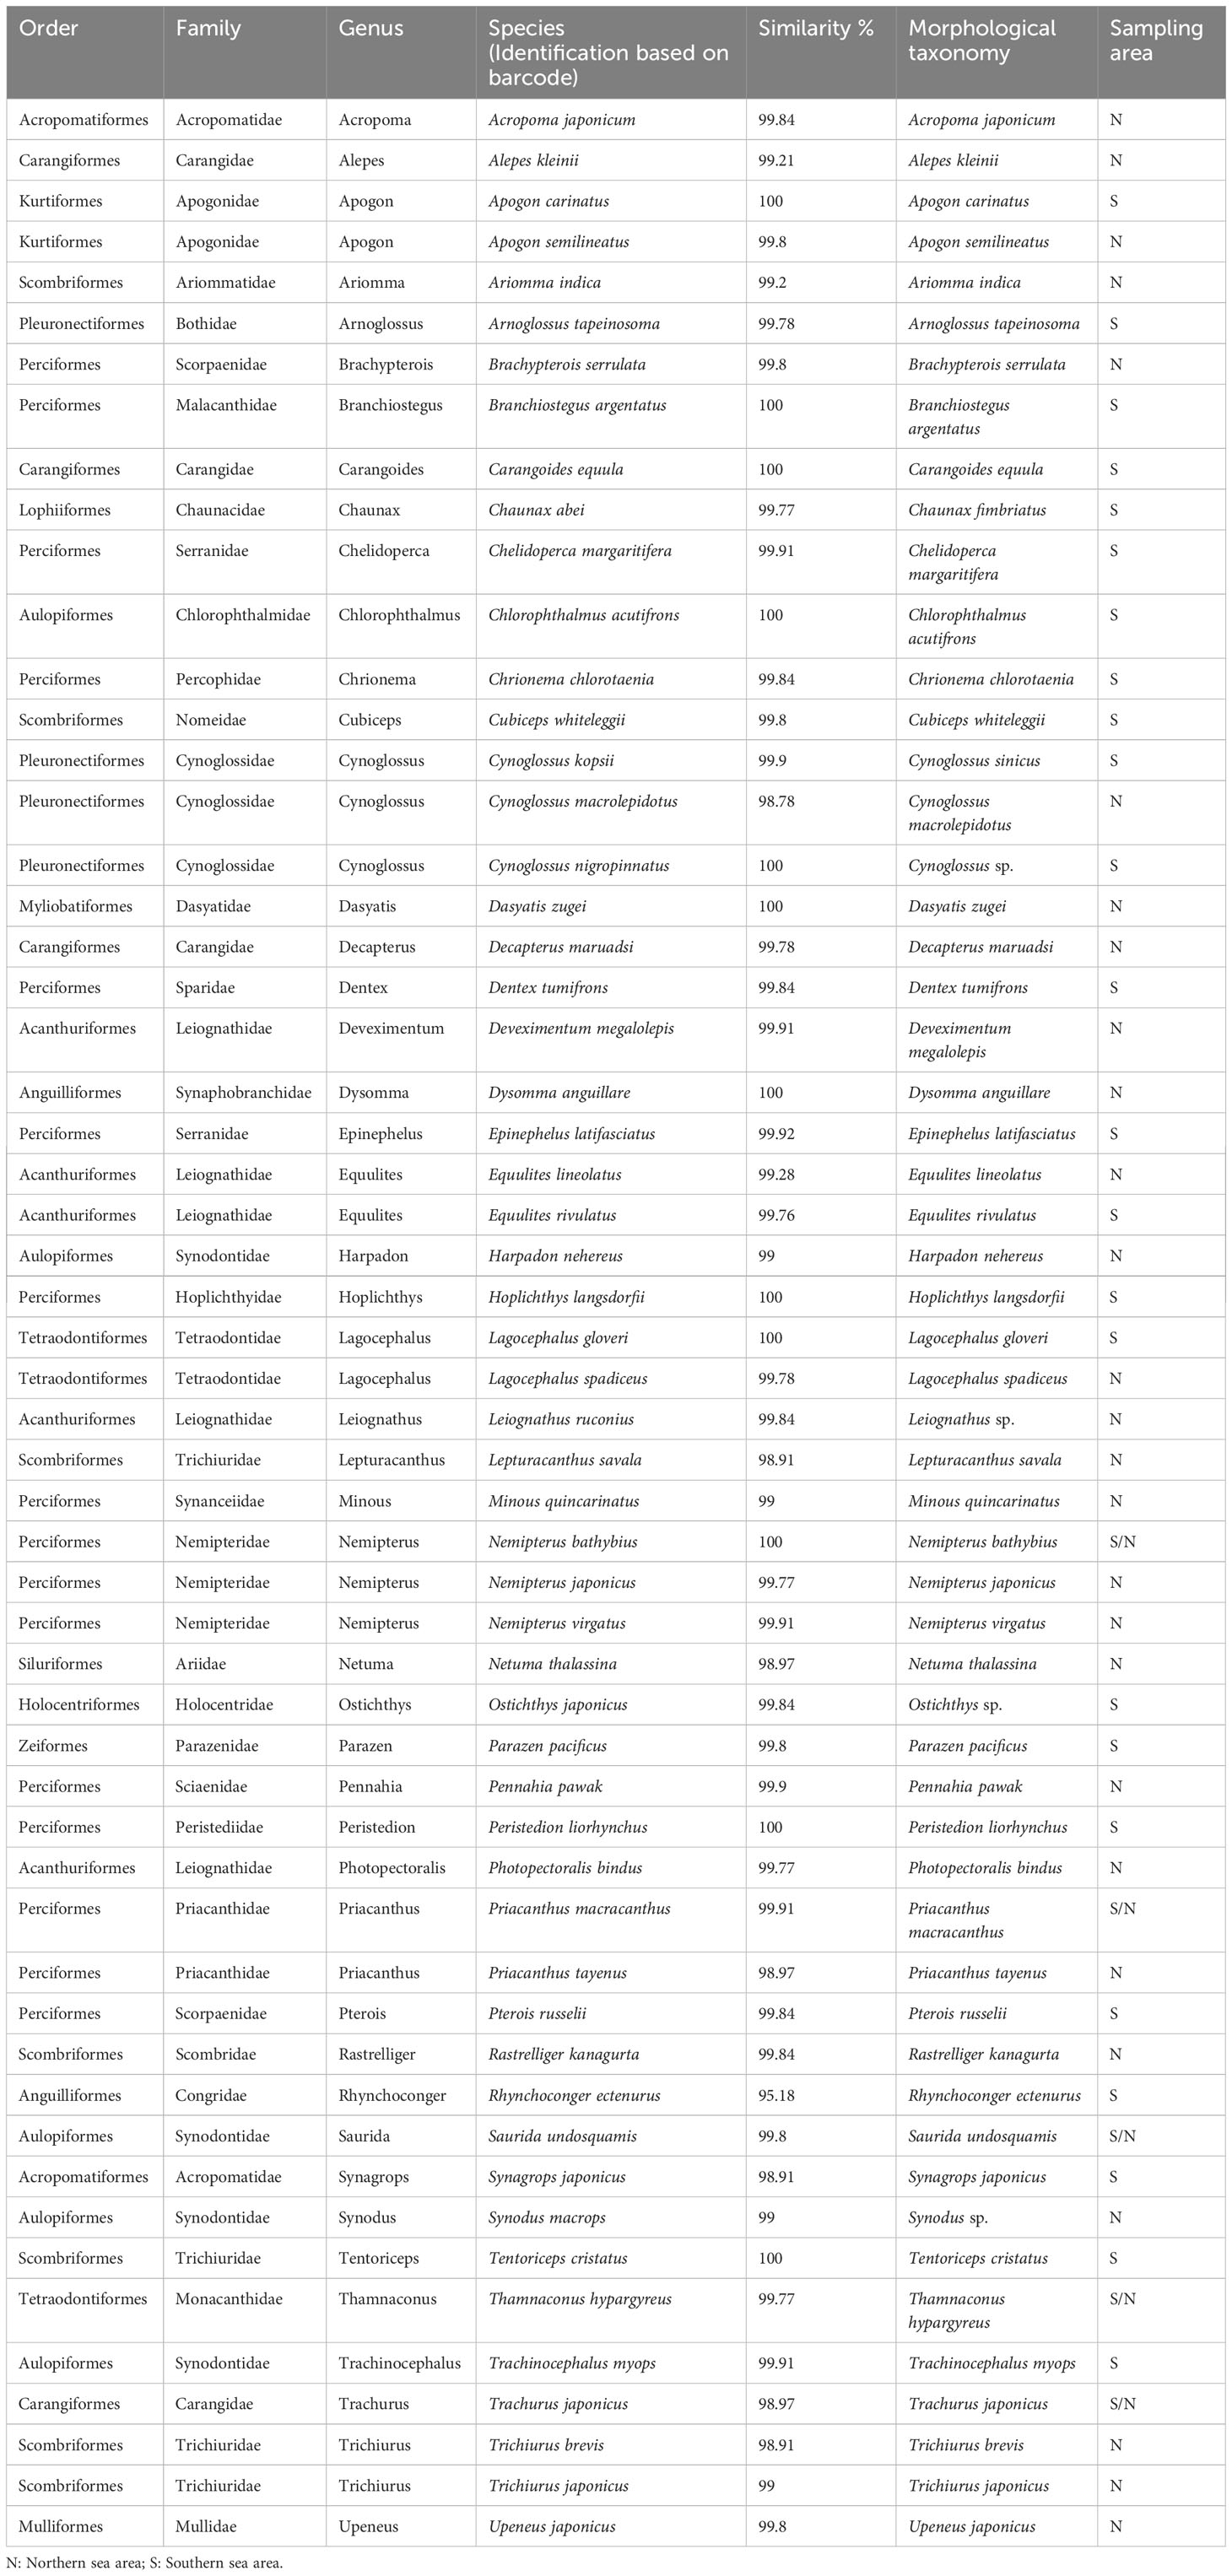
Table 1 Summary of identification based on morphological taxonomy and species barcode using the BOLD-IDS and BLASTN search from GenBank.
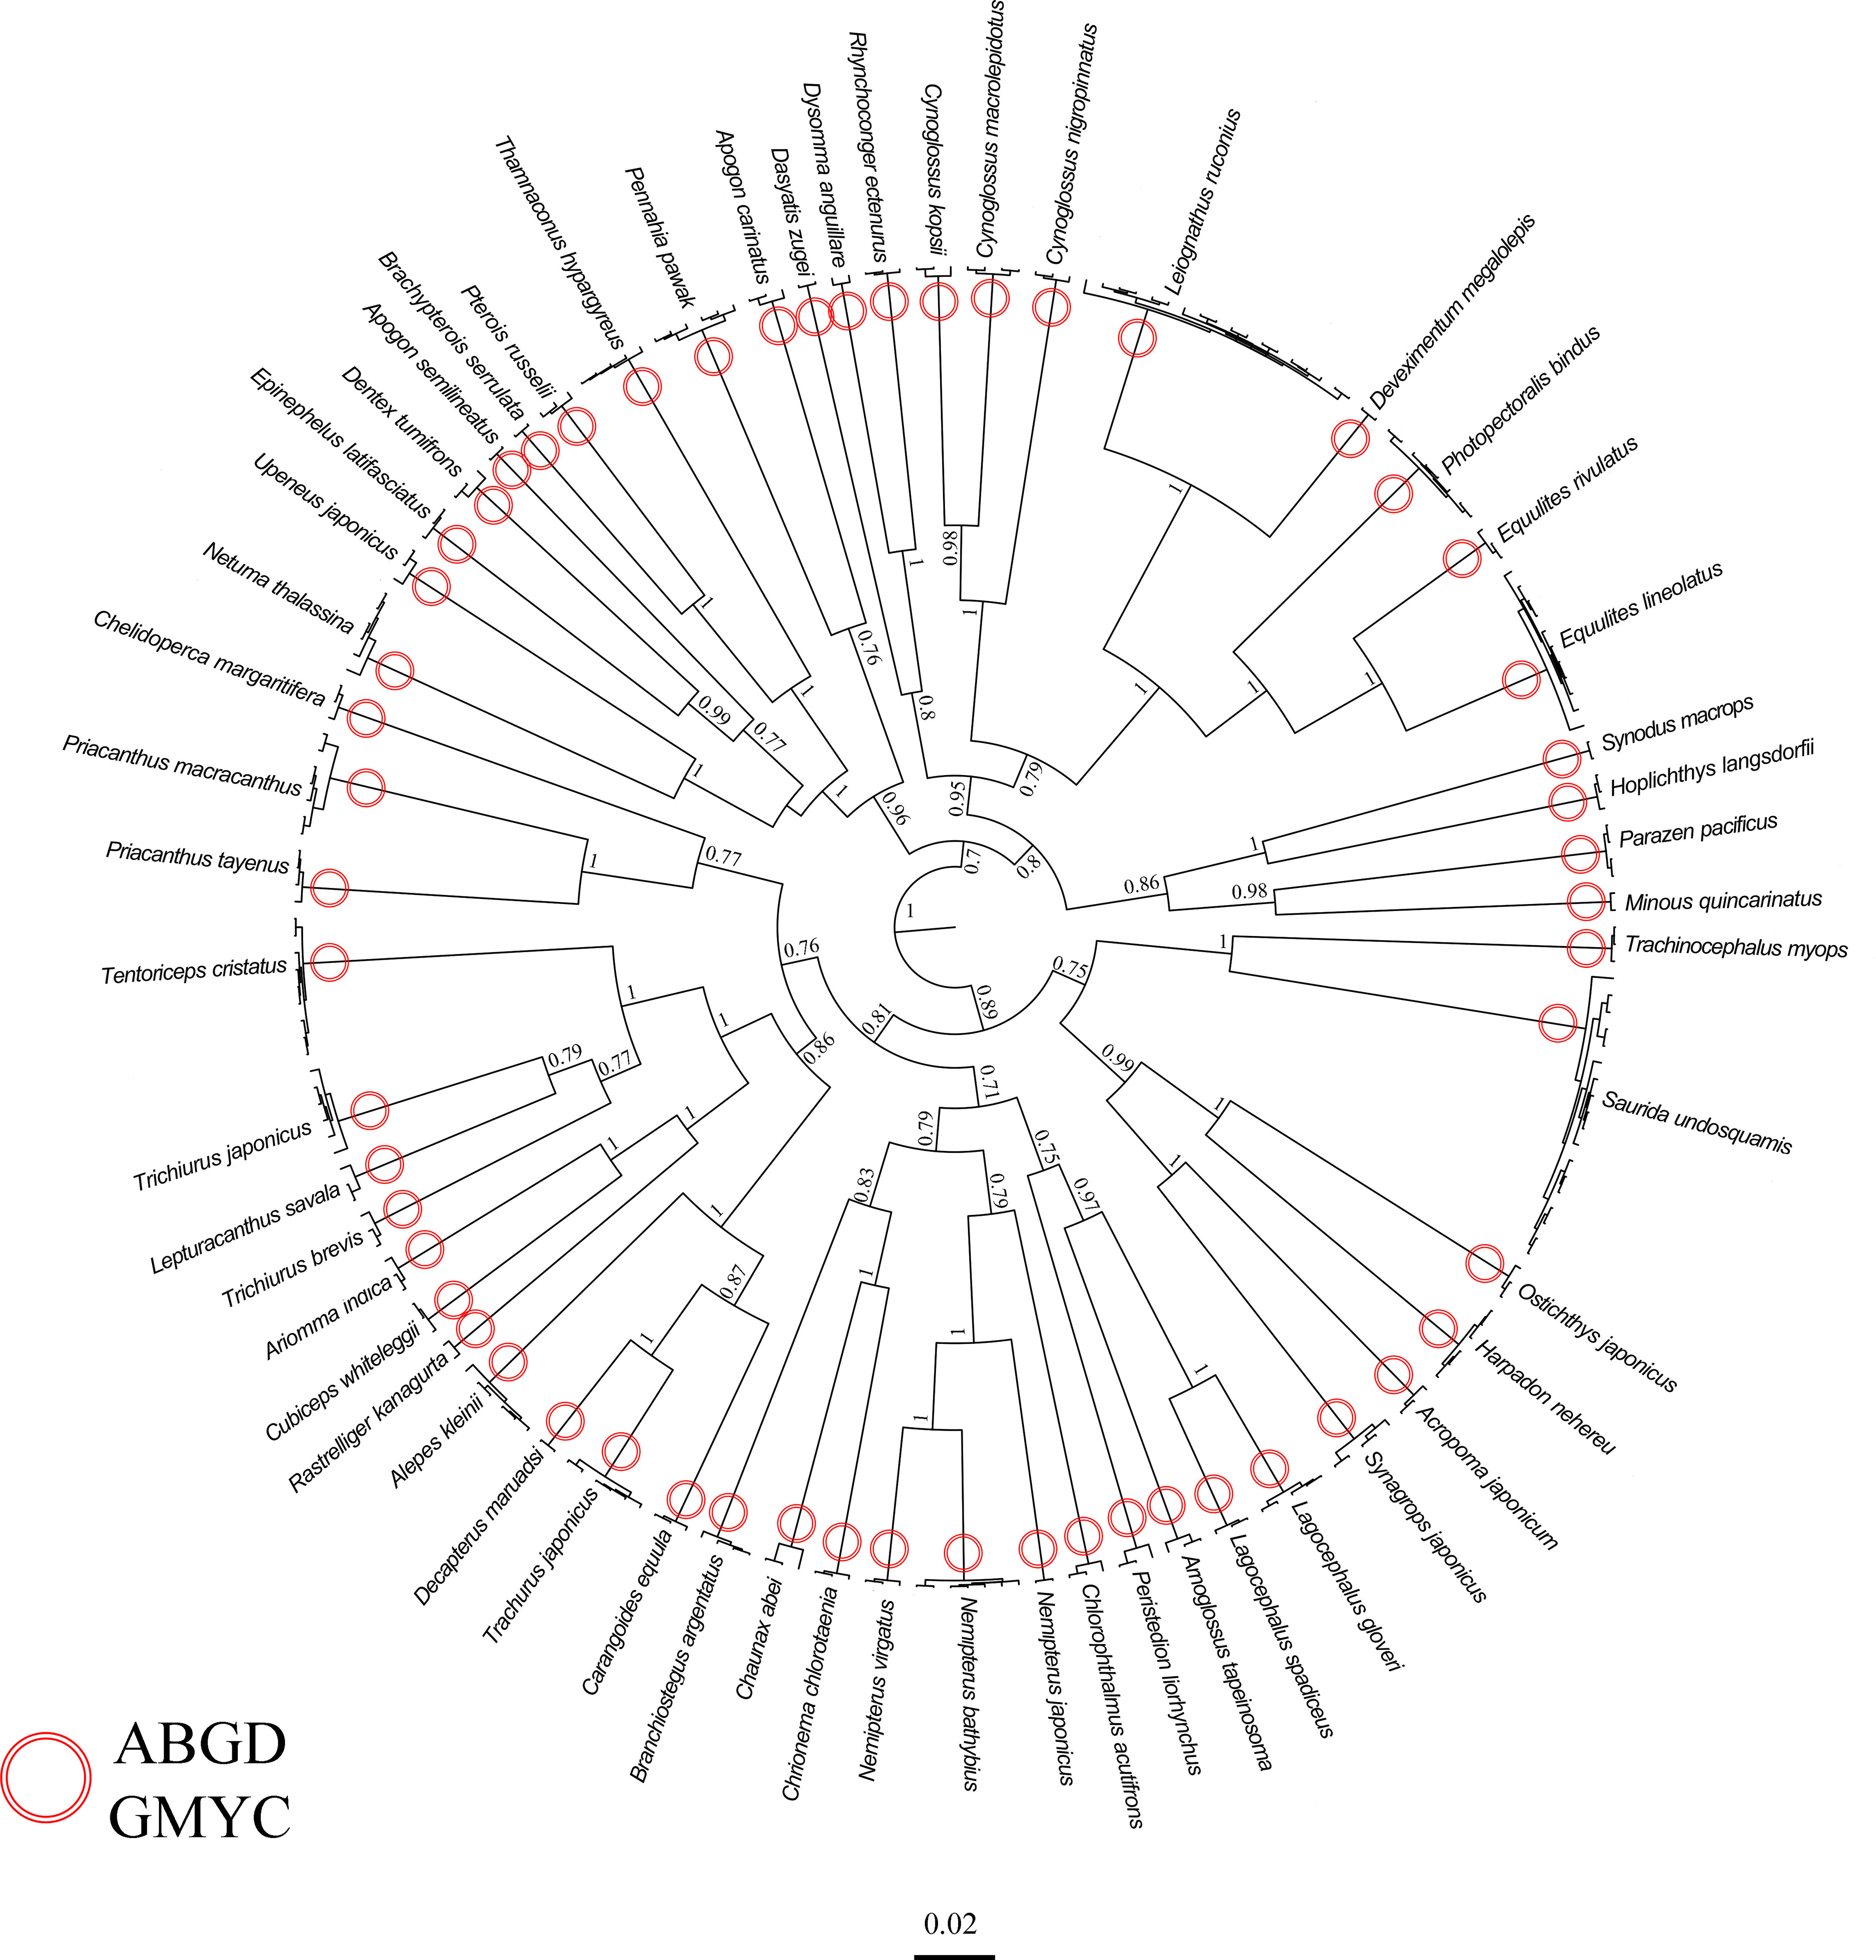
Figure 2 Results of DNA-based classification from ABGD and GMYC on COI data set. The phylogenies are the ultrametric trees obtained from BEAST, with the scale bars proportional to substitution rates; support values are Bayesian Posterior; support values below 0.7 and for short branches are not shown. DNA identification from ABGD and GMYC are shown on the branches.
When analyzing the Kimura 2-parameter (K2P) distances in our sequence dataset, we observed a significant discrepancy of 1.23% to 2.7% between intraspecific and interspecific distances (Figure 3). This divergence provides compelling evidence for the differentiation and distinguishability of species within our dataset. In our study, the uncorrected Kimura 2-parameter (K2P) pairwise distances within species were consistently below 1%, with an average of 0.15% and a range between 0 and 0.78%. The average divergence among congeners was recorded at 6.53%. These divergences varied across species, with Equulites exhibiting the lowest divergence of 1.65%, while Priacanthus displayed the highest divergence of 10.27%. The average confamilial divergence was 13.17%, ranging from a minimum of 10.16% in Scorpaenidae to a maximum of 15.53% in Serranidae. The average divergence within orders was calculated to be 16.95%, with Acanthuriformes having the lowest divergence of 12.12% and Perciformes exhibiting the highest divergence of 22.57% (Table 2). In the northern sea areas of Hainan Islands, a total of 33 distinct species were found. In contrast, the southern sea areas revealed 29 distinct species, while only 5 species were found to inhabit both regions (Figure S1). The Jaccard dissimilarity index was 0.9, which measured the β diversity of fish community between northern and southern sea areas. Taxonomic turnover component showed a value of 0.85, while taxonomic nestedness component presented a value of 0.05 (Figure 4). We observed a significant disparity between the taxonomic turnover and nestedness components, with the turnover component contributing significantly to taxonomic β-diversity.
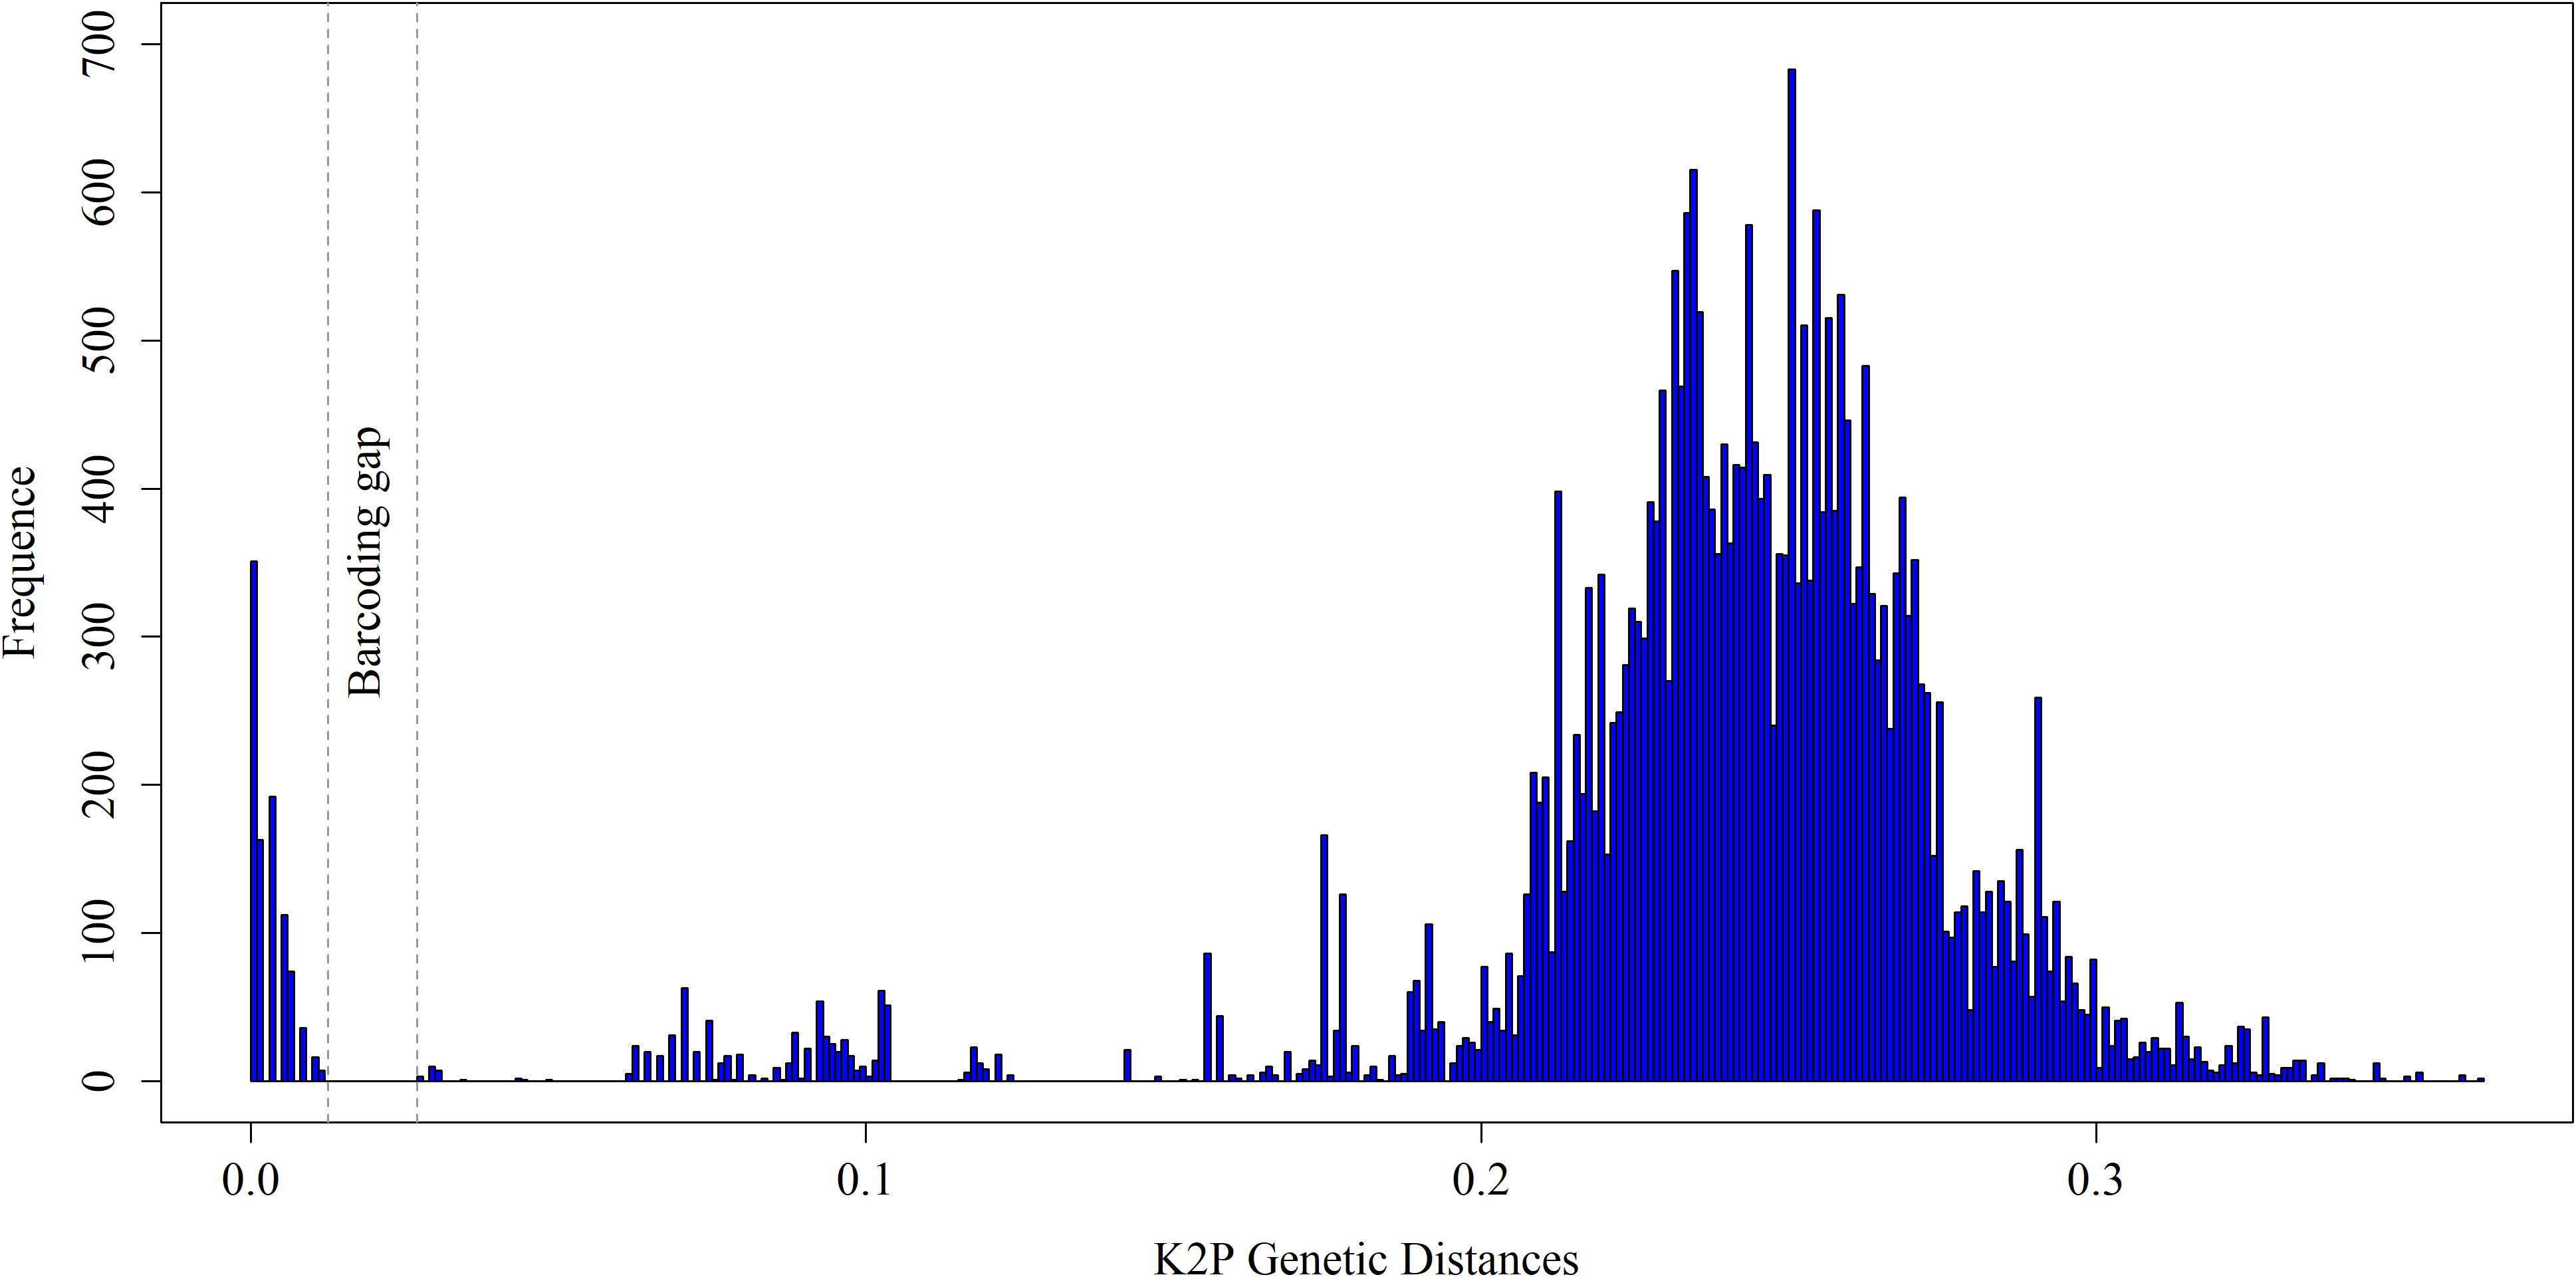
Figure 3 The frequency distributions of intraspecific and interspecific pairwise genetic K2P distance based on all samples. The area between dashed line display the ‘barcoding gap’ between the intra- and interspecific distance.
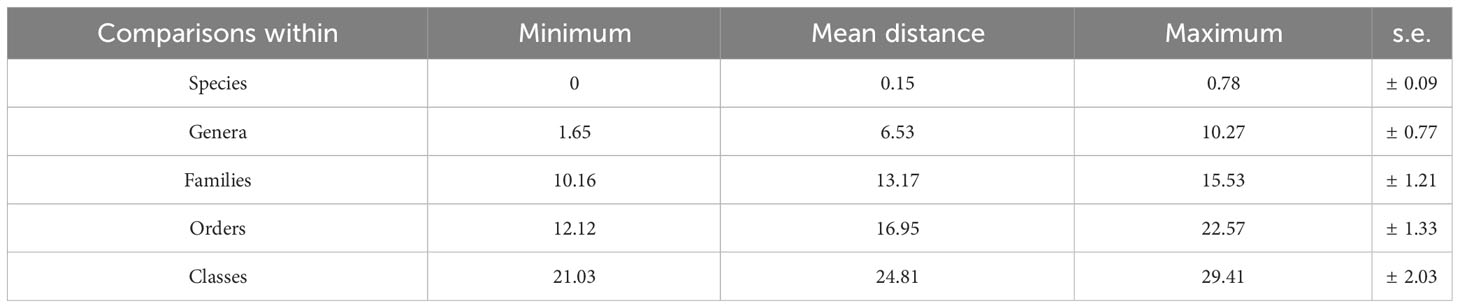
Table 2 Summary of pairwise mitochondrial cytochrome c oxidase I (COI) barcode nucleotide divergences within various taxonomic levels, using K2P distances (%).
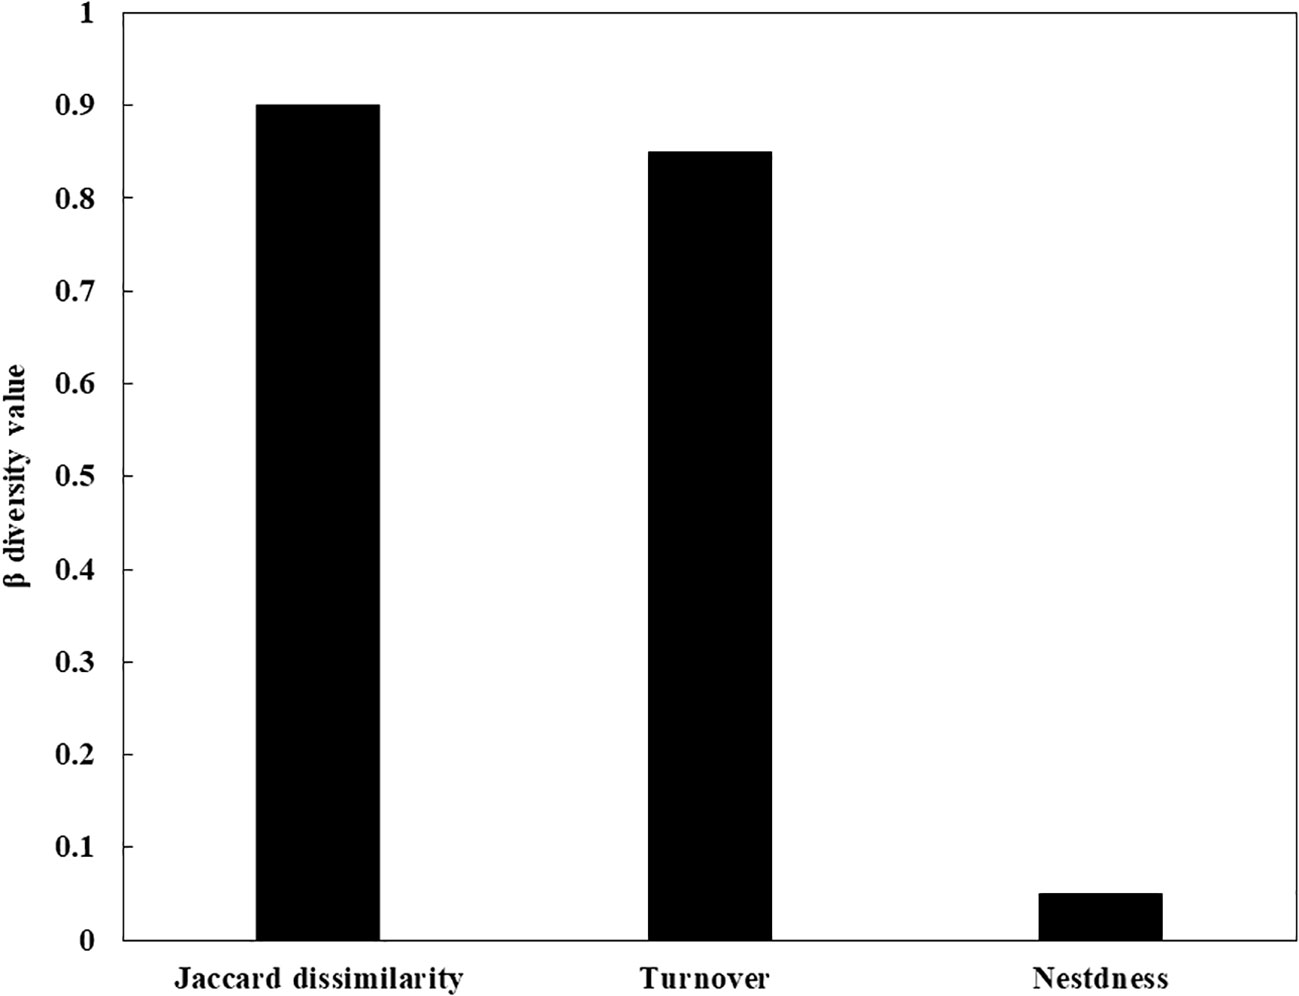
Figure 4 The Jaccard dissimilarity index of the two fish communities between southern and northern sea areas and its turnover and nestedness component.
the Indo-West Pacific Ocean context places paramount importance on the South China Sea (SCS) as a hub of marine biodiversity on a worldwide scale. The SCS is renowned for its remarkable and distinctive marine ecosystems that encompass a diverse range of species, a significant proportion of which are exclusive to this region (Barber et al., 2000). The copious amounts of biodiversity present within the South China Sea are ascribed to several factors, such as its geographical positioning, propitious environmental circumstances, and intricate oceanographic and ecological mechanisms. The SCS functions as a pivotal abode for a myriad of marine creatures, encompassing piscine, invertebrate, and marine mammal species, furnishing them with sustenance sources, propagation locales, and asylum (Institute of Zoo and Chinese Academy of Sciences, 1962; Morton and Blackmore, 2001; Ma et al., 2008). In recent times, there has been a notable surge in research efforts aimed at assessing fish diversity in the South China Sea using COI barcodes. Wang et al. (2012b) carried out a meticulous scientific investigation, wherein they meticulously scrutinized 222 DNA barcode sequences, with each of them denoting 95 distinct fish species. Their research focused on two significant fisheries regions within the South China Sea, namely the Nansha Islands and the Beibu Gulf. Similarly, Zhang and Hanner (2012) conducted a study with the aim of identifying fish species in the South China Sea through the use of DNA barcoding. They were able to analyze a more extensive dataset, which consisted of 1336 DNA barcode sequences. This allowed them to identify as many as 242 different fish species in the region. The aforementioned investigations have illuminated the efficacy of COI barcodes as a sturdy instrument for appraising piscine diversity in the expanse of the South China Sea. By scrutinizing genetic data conserved within the COI gene, scholars have successfully differentiated among multiple species of fish with precision. This category of inquiry may manifest as incomparable in endowing discernment into the manifoldness and ecological fluctuations of the maritime milieu in the South China Sea.
In the present study, a total of 56 morphospecies were identified from the southern and northern sea areas surrounding Hainan Island in northern South China Sea. Additionally, we achieved successful amplification of the COI barcoding gene for all 56 marine fish species included in our study. However, due to taxonomic ambiguity within certain genera and species, four taxa could only be identified at the genus level while two others were misidentified as sibling species. The outcomes of two distinct methodologies employed to deduce putative species boundaries based on our COI dataset were congruent. Both Automatic Barcode Gap Discovery (ABGD) and Generalized Mixed Yule Coalescent (GMYC) model indicated the presence of 56 taxonomic units in our COI dataset. Most of the sequences we obtained were identified through molecular analysis using public databases such as BOLD and Genbank. The DNA barcoding technique successfully distinguished all fish species examined, providing a more accurate representation of species diversity in the South China Sea compared to relying solely on morphological characteristics. When utilizing the COI gene as a DNA barcode for animal species, the intraspecific Kimura 2-parameter (K2P) distances typically fall below 1% and seldom exceed 2% (Hebert et al., 2003). However, it is worth noting that certain arthropod groups, such as crustaceans, may exhibit comparatively higher distances (Costa et al., 2007; Xu et al., 2022). In our fish dataset, the average intraspecific Kimura 2-parameter (K2P) pairwise distance was calculated to be 0.15%, with a range spanning from 0% to 0.78%. On the other hand, the average divergences among congeneric species were 6.53%, ranging from 1.65% to 10.27%. Indicating varying levels of genetic divergence among different taxa. Some taxa exhibited deeper divergences than others. The average intraspecific divergence observed in this study was lower compared to previous studies conducted in other areas of the South China Sea, such as the Nansha Islands (0.25%) and Dongsha Islands (0.33%). However, the average divergence among congeneric species in this study was slightly higher than that of the two aforementioned areas (4.56% and 3.43%) (Xu et al., 2019; Xu et al., 2021). The average intraspecific and congeneric distances observed in fishes from the northern South China Sea surrounding the Hainan Islands are slightly lower compared to the distances recorded in other geographical regions in previous studies. For instance, previous studies have reported average intraspecific distances of 0.52% and average congeneric distances of 6.86% in Mediterranean marine fishes (Francisco et al., 2022), 0.30% and 6.60% in the Indian Ocean marine fishes (Lakra et al., 2011), 0.39% and 9.93% in Pacific Ocean marine fishes (Ward et al., 2005), and 1.06% and 15.34% in Indo-Pacific coral-reef fishes (Hubert et al., 2012). In our study, the average congeneric divergence in Priacanthus was 10.27%, considerably larger than 1.65% in the genus Equulites. Higher congeneric divergence was reported in Platycephalus, reaching up to 15.55%, and in Caracanthus, reaching 12.1% (Ward et al., 2005; Hubert et al., 2012). These differences between genera may reflect variations in the average age of species divergence within congeneric groups. Within a genus, some species may be older than others, and certain genera may have diverged earlier compared to others. Biological mechanisms, dispersal capacity, water dynamics (including ocean currents), geographic distance, and historical events are all factors that can play important roles in shaping the population genetic structures of marine species (Elliott and Ward, 1995; Nelson et al., 2000; Monaghan et al., 2009).
Our findings indicate a significant disparity in the species composition of fish communities between the northern and southern sea regions. Within the northern sea areas of the Hainan Islands, we observed a total of 33 distinct species. Conversely, the southern sea areas exhibited 29 distinct species, with only 5 species found to inhabit both regions. The northern sea areas of the Hainan Islands are situated on the northern continental slope of the South China Sea. The topography of this region exhibits a distinct pattern of alternating steep and gradual slopes, which descend in a stair-like manner from northwest to southeast. Both depth and temperature exert significant influences on the species composition of demersal fish in the northern continental slope of the South China Sea. Acropoma japonicum, Trachurus japonicas, Leiognathus ruconius were recognized as common species in the northern continental slope of South China Sea, occupied a very higher proportion of fish community. The northern continental slope of the South China Sea is characterized by the direct influence of coastal currents and runoff from the Hanjiang River and Pearl River, particularly along the northern margin of the continental shelf. This area serves as a noteworthy fishing ground due to its remarkable primary productivity. Additionally, the eastern portion of the slope is influenced by a branch of the north-flowing, warm Kuroshio Current Complex. These oceanographic conditions, along with the unique habitats present on the northern continental slope of the South China Sea, contribute to the abundance and diversity of living resources. Moreover, this region serves as an important hunting, spawning, and breeding ground for fish (Qiu et al., 2010; Wang et al., 2012a). Recent study on benthic fish diversity and community structure in the northern South China Sea have revealed that there were significant differences in species composition based on depths, but no significant differences were found between seasons and temperatures, as well as in the composition at the genus and family levels (Zhang et al., 2022).
The topography of the continental shelf in the northern sea areas of the Hainan Islands, particularly the eastern part of the Leizhou Peninsula, is relatively flat, with depths shallower than 200 meters. The isobaths in this region run parallel to the coastline. In contrast, the southeast coasts of Hainan Island run alongside the continental slope, which reaches a maximum depth of 1900 meters (Li et al., 2014). The fish community in the southern sea areas of the Hainan Islands is dominated by demersal fish and reef fish. The waters adjacent to the southernmost part of Hainan Island and the southern and eastern coasts of Taiwan have experienced an increase in tropical species of scleractinian coral and reef communities. This expansion has provided favorable conditions for the livelihood and reproduction of reef fish species (Liu, 2013; Du et al., 2020). The differentiation in fish community and distribution between the northern and southern sea areas of Hainan Island can be traced back to the historical process of separation between Hainan Island and the mainland. According to a prevailing theory, it is believed that Hainan Island was once connected to Guangdong province on the mainland of China. However, during the middle Holocene period, a significant geological event occurred, resulting in the formation of the Qiongzhou Strait. This event took place approximately 8.5 thousand calendar years ago before the present (cal. ka BP). During this period, there was a rise in sea levels, which led to the inundation of the low-lying land that previously connected Hainan Island and Guangdong. As the sea levels continued to rise, the water eventually breached the land bridge, and the Qiongzhou Strait began to open up gradually from west to east. This geological process was a result of natural environmental changes and had a significant impact on the separation of Hainan Island from the mainland (Yao et al., 2009). The diverse habitats and historical events in the northern and southern waters of Hainan Island have led to distinct fish community structures.
In summary, our study demonstrates the reliability, speed, and efficiency of DNA barcoding as a precise tool for species identification of marine fish. In comparison to traditional taxonomical methods, DNA barcoding proves particularly valuable for rapid surveys of marine fish in the northern and southern sea areas of Hainan Island in the northern South China Sea. Morphological classification alone often resulted in misidentifications, with some species being identified only at the genus level or incorrectly identified as different species or closely related sibling species. Both ABGD and GMYC model indicated the presence of 56 taxonomic units in our COI dataset. A significant disparity exists in the species composition of fish communities between the northern and southern sea areas of Hainan Island in the northern South China Sea. The dominant process shaping the β diversity pattern of the marine fish community is species turnover/replacement. Such fundamental diversity datasets play a crucial role in ongoing and future monitoring programs aimed at evaluating fisheries resources and biodiversity in the sea areas surrounding Hainan Island in the northern South China Sea. They provide essential information for understanding and managing the marine ecosystem in the region.
The original contributions presented in the study are publicly available. This data can be found here: National Center for Biotechnology Information (NCBI) BioProject database under accession numbers: OR144930- OR145042. The original contributions presented in the study are included in the article/Supplementary Material. Further inquiries can be directed to the corresponding author.
The animal study was approved by South China Sea Fisheries Research Institute, Chinese Academy of Fishery Sciences. The study was conducted in accordance with the local legislation and institutional requirements.
JZ: Formal analysis, Data curation, Writing - original draft. LX: Conceptualization, Methodology, Formal analysis, Data curation, Writing - original draft, Writing - review & editing. QT, LW, JN, DH, YL and SL: Methodology, Formal analysis. XW and FD: Funding acquisition, Project administration, Resources. All authors contributed to the article and approved the submitted version.
This study was funded by Hainan Provincial Natural Science Foundation of China (422MS156), Science and Technology Basic Resources Investigation Program of China (2018FY100105, 2017FY201405).
We thank Mr. Xin Liang, Dr. Yuezhong Wang for helping in fish identification. We thank all colleagues and students for their help with sampling.
The authors declare that the research was conducted in the absence of any commercial or financial relationships that could be construed as a potential conflict of interest.
All claims expressed in this article are solely those of the authors and do not necessarily represent those of their affiliated organizations, or those of the publisher, the editors and the reviewers. Any product that may be evaluated in this article, or claim that may be made by its manufacturer, is not guaranteed or endorsed by the publisher.
The Supplementary Material for this article can be found online at: https://www.frontiersin.org/articles/10.3389/fmars.2023.1249073/full#supplementary-material
Ahmed M. S., Datta S. K., Saha T., Hossain Z. (2021). Molecular characterization of marine and coastal fishes of Bangladesh through DNA barcodes. Ecol. Evol. 11 (9), 3696–3709. doi: 10.1002/ece3.7355
Appeltans W., Ahyong S. T., Anderson G., Martin A. V., Artois T., Bailly N., et al. (2012). The magnitude of global marine species diversity. Curr. Biol. 22 (23), 2189–2202. doi: 10.1016/j.cub.2012.09.036
Ballard J. W. O., Whitlock M. C. (2004). The incomplete natural history of mitochondria. Mol. Ecol. 13 (4), 729–744. doi: 10.1046/j.1365-294X.2003.02063.x
Barber P., Boyce S. L. (2006). Estimating diversity of Indo-Pacific coral reef stomatopods through DNA barcoding of stomatopod larvae. Proc. R. Soc B 273 (1597), 2053–2061. doi: 10.1098/rspb.2006.3540
Barber P. H., Palumbi S. R., Erdmann M. V., Moosa M. K. (2000). A marine Wallace's line? Nature 406 (6797), 692–693. doi: 10.1038/35021135
Bariche M., Torres M., Smith C., Sayar N., Azzurro E., Baker R., et al. (2015). Red Sea fishes in the Mediterranean Sea: a preliminary investigation of a biological invasion using DNA barcoding. J. Biogeogr. 42 (12), 2363–2373. doi: 10.1111/jbi.12595
Baselga A., Orme C. D. L. (2012). betapart: an R package for the study of beta diversity. Methods Ecol. Evol. 3 (5), 808–812. doi: 10.1111/j.2041-210X.2012.00224.x
Baselga A., Orme D., Villeger S., de Bortoli J., Leprieur F., Logez M. (2021). betapart: partitioning beta diversity into turnover and nestedness components.
Bernt M., Braband A., Schierwater B., Stadler P. F. (2013). Genetic aspects of mitochondrial genome evolution. Mol. Phylogen. Evol. 69 (2), 328–338. doi: 10.1016/j.ympev.2012.10.020
Borisenko A. V., Lim B. K., Ivanova N. V., Hanner R. H., Hebert P. D. N. (2008). DNA barcoding in surveys of small mammal communities: a field study in Suriname. Mol. Ecol. Resour. 8 (3), 471–479. doi: 10.1111/j.1471-8286.2007.01998.x
Briggs J. C., Bowen B. W. (2012). A realignment of marine biogeographic provinces with particular reference to fish distributions. J. Biogeogr. 39 (1), 12–30. doi: 10.1111/j.1365-2699.2011.02613.x
Caterino M. S., Tishechkin A. K. (2006). DNA identification and morphological description of the first confirmed larvae of Hetaeriinae (Coleoptera: Histeridae). Syst. Entomol. 31 (3), 405–418. doi: 10.1111/j.1365-3113.2006.00338.x
Clare E. L., Lim B. K., Engstrom M. D., Eger J. L., Hebert P. D. N. (2007). DNA barcoding of Neotropical bats: species identification and discovery within Guyana. Mol. Ecol. Notes 7 (2), 184–190. doi: 10.1111/j.1471-8286.2006.01657.x
Costa F. O., deWaard J. R., Boutillier J., Ratnasingham S., Dooh R. T., Hajibabaei M., et al. (2007). Biological identifications through DNA barcodes: the case of the Crustacea. Can. J. Fish. Aquat. Sci. 64 (2), 272–295. doi: 10.1139/f07-008
Dimitriou A. C., Forcina G., Papazoglou C., Panayides P., Guerrini M., Crabtree A., et al. (2017). DNA barcoding of bird species in Cyprus: a tool for conservation purposes. Bird Conserv. Int. 27 (4), 483–494. doi: 10.1017/S0959270916000472
Du J., Xie M., Wang Y., Chen Z., Liu W., Liao J., et al. (2020). Connectivity of fish assemblages along the mangrove-seagrass-coral reef continuum in Wenchang, China. Acta Oceanologica Sin. 39 (8), 43–52. doi: 10.1007/s13131-019-1490-7
Elliott N. G., Ward R. D. (1995). Genetic relationships of eight species of Pacific tunas (Teleostei: Scombridae) inferred from allozyme analysis. Mar. Freshwat. Res. 46 (7), 1021–1032. doi: 10.1071/MF9951021
Eschmeyer W. N., Fricke R., Fong J. D., Polack D. A. (2010). Marine fish diversity: history of knowledge and discovery (Pisces). Zootaxa 2525, 19–50. doi: 10.11646/zootaxa.2525.1.2
Francisco S. M., Lima C. S., Moreira I., Shahin A. A. B., Ben Faleh A. (2022). DNA barcoding of commercially relevant marine fish species in Tunisian waters. J. Mar. Biol. Assoc. U.K 102 (3-4), 178–185. doi: 10.1017/S0025315422000352
Fujisawa T., Barraclough T. G. (2013). Delimiting species using single-locus data and the Generalized Mixed Yule Coalescent approach: a revised method and evaluation on simulated data sets. Syst. Biol. 62 (5), 707–724. doi: 10.1093/sysbio/syt033
Gao J., Wu G., Ya H. (2017). Review of the circulation in the beibu gulf, south China sea. Cont. Shelf Res. 138, 106–119. doi: 10.1016/j.csr.2017.02.009
Hajibabaei M., Janzen Daniel H., Burns John M., Hallwachs W., Hebert Paul D. N. (2006). DNA barcodes distinguish species of tropical Lepidoptera. Proc. Natl. Acad. Sci. U.S.A. 103 (4), 968–971. doi: 10.1073/pnas.0510466103
Hall T. A. (1999). BioEdit: a user-friendly biological sequence algnment editor and analysis program for windows 95/98/NT. Nucl. Acids Symp. Ser. 41, 95–98.
Hebert P. D., Cywinska A., Ball S. L., deWaard J. R. (2003). Biological identifications through DNA barcodes. Proc. R. Soc B 270 (1512), 313–321. doi: 10.1098/rspb.2002.2218
Hebert P. D., Stoeckle M. Y., Zemlak T. S., Francis C. M. (2004a). Identification of birds through DNA barcodes. PloS Biol. 2 (10), e312. doi: 10.1371/journal.pbio.0020312
Hebert P. D. N., Penton E. H., Burns J. M., Janzen D. H., Hallwachs W. (2004b). Ten species in one: DNA barcoding reveals cryptic species in the neotropical skipper butterfly Astraptes fulgerator. Proc. Natl. Acad. Sci. 101 (41), 14812–14817. doi: 10.1073/pnas.0406166101
Hu J. Y., Kawamura H., Tang D. L. (2003). Tidal front around the Hainan Island, northwest of the South China Sea. J. Geophys. Res. 108 (C11), 3342. doi: 10.1029/2003JC001883
Huang D., Chen J., Xu L., Wang X., Ning J., Li Y., et al. (2022). Larval fish assemblages and distribution patterns in the Zhongsha Atoll (Macclesfield Bank, South China Sea). Front. Mar. Sci. 8. doi: 10.3389/fmars.2021.787765
Hubert N., Hanner R., Holm E., Mandrak N. E., Taylor E., Burridge M., et al. (2008). Identifying Canadian freshwater fishes through DNA barcodes. PloS One 3 (6), e2490. doi: 10.1371/journal.pone.0002490
Hubert N., Meyer C. P., Bruggemann H. J., Guérin F., Komeno R. J. L., Espiau B., et al. (2012). Cryptic diversity in indo-pacific coral-reef fishes revealed by DNA-barcoding provides new support to the centre-of-overlap hypothesis. PloS One 7 (3), e28987. doi: 10.1371/journal.pone.0028987
Institute of Zoo and Chinese Academy of Sciences (1962). The fishes of the south China sea (Beijing: China Science Press).
Janzen D. H., Hajibabaei M., Burns J. M., Hallwachs W., Remigio E., Hebert P. D. (2005). Wedding biodiversity inventory of a large and complex Lepidoptera fauna with DNA barcoding. Philos. Trans. R. Soc Lond. B Biol. Sci. 360 (1462), 1835–1845. doi: 10.1098/rstb.2005.1715
Kerr K. C., Birks S. M., Kalyakin M. V., Red'kin Y. A., Koblik E. A., Hebert P. D. (2009). Filling the gap - COI barcode resolution in eastern Palearctic birds. Front. Zool 6, 29. doi: 10.1186/1742-9994-6-29
Koleff P., Gaston K. J., Lennon J. J. (2003). Measuring beta diversity for presence–absence data. J. Anim. Ecol. 72 (3), 367–382. doi: 10.1046/j.1365-2656.2003.00710.x
Kumar S., Nei M., Dudley J., Tamura K. (2008). MEGA: a biologist-centric software for evolutionary analysis of DNA and protein sequences. Brief Bioinform. 9 (4), 299–306. doi: 10.1093/bib/bbn017
Kusbiyanto K., Bhagawati D., Nuryanto A. (2020). DNA barcoding of Crustacean larvae in the eastern areas of Segara Anakan Cilacap, Central Java Indonesia. Biodiversitas 21 (10), 4878–4887. doi: 10.13057/biodiv/d211054
Lakra W. S., Verma M. S., Goswami M., Lal K. K., Mohindra V., Punia P., et al. (2011). DNA barcoding Indian marine fishes. Mol. Ecol. Resour. 11 (1), 60–71. doi: 10.1111/j.1755-0998.2010.02894.x
Li K., Yin J., Huang L., Lin Z. (2014). Seasonal variations in diversity and abundance of surface ichthyoplankton in the northern South China Sea. Acta Oceanologica Sin. 33 (12), 145–154. doi: 10.1007/s13131-014-0533-3
Lima-Filho P. A., Rosa R., Souza A., da Costa G. W. W. F., de Oliveira C., Molina W. F. (2016). Evolutionary diversification of Western Atlantic Bathygobius species based on cytogenetic, morphologic and DNA barcode data. Rev. Fish Biol. Fish 26 (1), 109–121. doi: 10.1007/s11160-015-9411-0
Liu J. Y. (2013). Status of marine biodiversity of the China seas. PloS One 8 (1), e50719. doi: 10.1371/journal.pone.0050719
Ma F., Wang Y., Li Y., Ye C., Xu Z., Zhang F. (2010). The application of geostatistics in grain size trend analysis: A case study of eastern Beibu Gulf. J. Geographical Sci. 20 (1), 77–90. doi: 10.1007/s11442-010-0077-1
Ma C., You K., Zhang M., Li F., Chen D. (2008). A preliminary study on the diversity of fish species and marine fish faunas of the South China Sea. J. Ocean Univ. China 7 (2), 210–214. doi: 10.1007/s11802-008-0210-2
Mabragaña E., Díaz de Astarloa J. M., Hanner R., Zhang J., González Castro M. (2011). DNA barcoding identifies argentine fishes from marine and brackish waters. PloS One 6 (12), e28655. doi: 10.1371/journal.pone.0028655
Matzen da Silva J., Creer S., dos Santos A., Costa A. C., Cunha M. R., Costa F. O., et al. (2011). Systematic and evolutionary insights derived from mtDNA COI barcode diversity in the Decapoda (Crustacea: Malacostraca). PloS One 6 (5), e19449. doi: 10.1371/journal.pone.0019449
Mecklenburg C. W., Møller P. R., Steinke D. (2011). Biodiversity of arctic marine fishes: taxonomy and zoogeography. Mar. Biodivers. 41 (1), 109–140. doi: 10.1007/s12526-010-0070-z
Monaghan M. T., Wild R., Elliot M., Fujisawa T., Balke M., Inward D. J. G., et al. (2009). Accelerated species inventory on Madagascar using coalescent-based models of species delineation. Syst. Biol. 58 (3), 298–311. doi: 10.1093/sysbio/syp027
Mora C., Tittensor D. P., Myers R. A. (2008). The completeness of taxonomic inventories for describing the global diversity and distribution of marine fishes. Proc. R. Soc B 275 (1631), 149–155. doi: 10.1098/rspb.2007.1315
Morton B., Blackmore G. (2001). South China sea. Mar. pollut. Bull. 42 (12), 1236–1263. doi: 10.1016/s0025-326x(01)00240-5
Nelson J. S., Hoddell R. J., Chou L. M., Chan W. K., Phang V. P. E. (2000). Phylogeographic structure of false clownfish, Amphiprion ocellaris, explained by sea level changes on the Sunda shelf. Mar. Biol. 137 (4), 727–736. doi: 10.1007/s002270000379
Oliveira L. M., Knebelsberger T., Landi M., Soares P., Raupach M. J., Costa F. O. (2016). Assembling and auditing a comprehensive DNA barcode reference library for European marine fishes. J. Fish Biol. 89 (6), 2741–2754. doi: 10.1111/jfb.13169
Pons J., Barraclough T. G., Gomez-Zurita J., Cardoso A., Duran D. P., Hazell S., et al. (2006). Sequence-based species delimitation for the DNA taxonomy of undescribed insects. Syst. Biol. 55 (4), 595–609. doi: 10.1080/10635150600852011
Puillandre N., Lambert A., Brouillet S., Achaz G. (2012). ABGD, Automatic Barcode Gap Discovery for primary species delimitation. Mol. Ecol. 21 (8), 1864–1877. doi: 10.1111/j.1365-294X.2011.05239.x
Qiu Y., Lin Z., Wang Y. (2010). Responses of fish production to fishing and climate variability in the northern South China Sea. Prog. Oceanogr. 85 (3), 197–212. doi: 10.1016/j.pocean.2010.02.011
Ratnasingham S., Hebert P. D. N. (2007). BOLD: the barcode of life data system. Mol. Ecol. Notes 7 (3), 355–364. doi: 10.1111/j.1471-8286.2007.01678.x
Ratnasingham S., Hebert P. D. N. (2013). A DNA-based registry for all animal species: the barcode index number (BIN) system. PloS One 8 (7), e66213. doi: 10.1371/journal.pone.0066213
Shashank P. R., Naveena N. L., Rajgopal N. N., Elliott T. A., Sreedevi K., Sunil S., et al. (2022). DNA barcoding of insects from India: Current status and future perspectives. Mol. Biol. Rep. 49 (11), 10617–10626. doi: 10.1007/s11033-022-07628-2
Shen G., Heino M. (2014). An overview of marine fisheries management in China. Mar. Policy 44, 265–272. doi: 10.1016/j.marpol.2013.09.012
Silva V. S., Skueresky N., Lopes F., Koch T. K., Ott P. H., Siciliano S., et al. (2021). Integrating morphology and DNA barcoding to assess cetacean diversity in Brazil. Mammal Res. 66 (2), 349–369. doi: 10.1007/s13364-021-00555-w
Steinke D., Zemlak T. S., Boutillier J. A., Hebert P. D. N. (2009). DNA barcoding of Pacific Canada’s fishes. Mar. Biol. 156 (12), 2641–2647. doi: 10.1007/s00227-009-1284-0
Struck T. H., Feder J. L., Bendiksby M., Birkeland S., Cerca J., Gusarov V. I., et al. (2018). Finding evolutionary processes hidden in cryptic species. Trends Ecol. Evol. 33 (3), 153–163. doi: 10.1016/j.tree.2017.11.007
Tamura K., Stecher G., Peterson D., Filipski A., Kumar S. (2013). MEGA6: molecular evolutionary genetics analysis version 6.0. Mol. Biol. Evol. 30 (12), 2725–2729. doi: 10.1093/molbev/mst197
Victor B., Hanner R., Shivji M., Hyde J., Caldow C. (2009). Identification of the larval and juvenile stages of the Cubera Snapper, Lutjanus cyanoptems, using DNA barcoding. Zootaxa 2215, 24–36. doi: 10.11646/ZOOTAXA.2215.1.2
Wang Z.-D., Guo Y.-S., Liu X.-M., Fan Y.-B., Liu C.-W. (2012b). DNA barcoding South China Sea fishes. Mitochondrial DNA 23 (5), 405–410. doi: 10.3109/19401736.2012.710204
Wang X., Qiu Y., Du F., Lin Z., Sun D., Huang S. (2012a). Population parameters and dynamic pool models of commercial fishes in the Beibu Gulf, northern South China Sea. Chin. J. Oceanol. Limnol. 30 (1), 105–117. doi: 10.1007/s00343-012-1017-y
Ward R. D., Hanner R., Hebert P. D. (2009). The campaign to DNA barcode all fishes, FISH-BOL. J. Fish Biol. 74 (2), 329–356. doi: 10.1111/j.1095-8649.2008.02080.x
Ward R. D., Zemlak T. S., Innes B. H., Last P. R., Hebert P. D. (2005). DNA barcoding Australia's fish species. Phil. Trans. R. Soc B 360 (1462), 1847–1857. doi: 10.1098/rstb.2005.1716
Xu L., Lin Q., Xu S., Gu Y., Hou J., Liu Y., et al. (2018). Daphnia diversity on the Tibetan Plateau measured by DNA taxonomy. Ecol. Evol. 8 (10), 5069–5078. doi: 10.1002/ece3.4071
Xu L., Van Damme K., Li H., Ji Y., Wang X., Du F. (2019). A molecular approach to the identification of marine fish of the Dongsha Islands (South China Sea). Fish. Res. 213, 105–112. doi: 10.1016/j.fishres.2019.01.011
Xu L., Wang X., Huang D., Wang L., Ning J., Li Y., et al. (2022). The application of DNA barcoding in crustacean larvae identification from the zhongsha islands, south China sea. Front. Mar. Sci. 9. doi: 10.3389/fmars.2022.932678
Xu L., Wang X., Van Damme K., Huang D., Li Y., Wang L., et al. (2021). Assessment of fish diversity in the South China Sea using DNA taxonomy. Fish. Res. 233, 105771. doi: 10.1016/j.fishres.2020.105771
Yao Y., Harff J., Meyer M., Zhan W. (2009). Reconstruction of paleocoastlines for the northwestern South China Sea since the Last Glacial Maximum. Sci. China Ser. D: Earth Sci. 52 (8), 1127–1136. doi: 10.1007/s11430-009-0098-8
Zemlak T. S., Ward R. D., Connell A. D., Holmes B. H., Hebert P. D. N. (2009). DNA barcoding reveals overlooked marine fishes. Mol. Ecol. Resour. 9 (s1), 237–242. doi: 10.1111/j.1755-0998.2009.02649.x
Zhang P., Chen Y., Peng C., Dai P., Lai J., Zhao L., et al. (2020). Spatiotemporal variation, composition of DIN and its contribution to eutrophication in coastal waters adjacent to Hainan Island, China. Regional Stud. Mar. Sci. 37, 101332. doi: 10.1016/j.rsma.2020.101332
Zhang J., Hanner R. (2011). DNA barcoding is a useful tool for the identification of marine fishes from Japan. Biochem. Syst. Ecol. 39 (1), 31–42. doi: 10.1016/j.bse.2010.12.017
Zhang J., Hanner R. (2012). Molecular approach to the identification of fish in the South China Sea. PloS One 7 (2), e30621. doi: 10.1371/journal.pone.0030621
Zhang J., Zhang K., Jiang Y.-E., Li Y.-J., Fan J.-T., Yu W.-M., et al. (2022). Diversity and structure of demersal fish community over the northern slope in the south China sea. Front. Mar. Sci. 9. doi: 10.3389/fmars.2022.809636
Keywords: DNA barcode, COI, ABGD, GMYC, fish diversity
Citation: Zhang J, Xu L, Du F, Tang Q, Wang L, Ning J, Huang D, Li Y, Liu S and Wang X (2023) DNA barcoding of marine fish species in the waters surrounding Hainan Island, northern South China Sea. Front. Mar. Sci. 10:1249073. doi: 10.3389/fmars.2023.1249073
Received: 28 June 2023; Accepted: 09 October 2023;
Published: 16 November 2023.
Edited by:
Cui Liang, Chinese Academy of Sciences (CAS), ChinaReviewed by:
Khaled Mohammed Geba, Menoufia University, EgyptCopyright © 2023 Zhang, Xu, Du, Tang, Wang, Ning, Huang, Li, Liu and Wang. This is an open-access article distributed under the terms of the Creative Commons Attribution License (CC BY). The use, distribution or reproduction in other forums is permitted, provided the original author(s) and the copyright owner(s) are credited and that the original publication in this journal is cited, in accordance with accepted academic practice. No use, distribution or reproduction is permitted which does not comply with these terms.
*Correspondence: Xuehui Wang, d3hoc2NzQDE2My5jb20=
†These authors have contributed equally to this work
Disclaimer: All claims expressed in this article are solely those of the authors and do not necessarily represent those of their affiliated organizations, or those of the publisher, the editors and the reviewers. Any product that may be evaluated in this article or claim that may be made by its manufacturer is not guaranteed or endorsed by the publisher.
Research integrity at Frontiers
Learn more about the work of our research integrity team to safeguard the quality of each article we publish.