 Māris Skudra
 Germo Väli
 Anda Ikauniece
 Miks Papirtis1
- 1Department of Marine Monitoring, Latvian Institute of Aquatic Ecology, Riga, Latvia
- 2Department of Marine Systems, Tallinn University of Technology, Tallinn, Estonia
Upwellings are characteristic for the Baltic Sea region including the Gulf of Riga, although the current knowledge is rather limited with only few research conducted in the Gulf itself. Upwelling events in the Gulf of Riga in 2010–2022 were studied by analyzing sea surface temperature time series from coastal stations and SmartBuoy, together with satellite data, model data, and CTD (conductivity, temperature, and depth) surveys. The starting/end point, active, and relaxation phases were defined in each event to describe the characteristics and length of each phase. Upwellings were less frequent (41%) on the eastern coast but lasted longer and had higher temperature drops than on the western coast. On the western coast, a variety of upwelling characteristics between stations only 30 km apart were found with the likely reason being the different orientations of the coastline with respect to the wind direction. Satellite data revealed that on the western coast of the Gulf, rather small upwelling events form along specific sections of the coastline. Of all upwelling events, 30% were characterized by an immediate temperature increase after reaching the minimum temperature, and we suggest that this is related to a distinct change in wind direction. The results from the simulations indicated smaller lateral density and salinity gradients in the sea surface than in larger Baltic Sea gulfs. It signals that conditions for the occurrence of baroclinic instabilities are rather small; thus, we suggest that weaker gradients could explain quite fast upwelling relaxation in the basin if compared to, e.g., the Gulf of Finland.
1 Introduction
Upwelling is a globally vital process, which is governed by Ekman’s theory that describes the rotation of the flow direction over horizontal layers with depth and explains the relation between offshore currents initiated by alongshore winds with perpendicular surface water motion (Ekman, 1905). Coastal wind-driven upwelling mainly occurs when the wind is blowing alongshore with the coast on its left/right side in the Northern/Southern Hemisphere (e.g., Lehmann and Myrberg, 2008; Lehmann et al., 2012). Considering that winds in the Baltic Sea (BS) region blow from all directions and, at some point, parallel to the coast, upwelling can occur everywhere.
The Gulf of Riga (GoR) is a semi-enclosed basin located in the eastern part of the BS. The GoR covers an area of approximately 17,913 km2 with a volume of 405 km3 (Leppäranta and Myrberg, 2009). The average depth of the GoR is 26 m, which is approximately two times smaller than that of the Baltic Sea. It is connected to the BS via two shallow straits—Irbe Strait in the west (with a sill depth of 25 m and cross-section of 0.4 km2) and Suur Strait in the north (with a sill depth of 5 m and cross-section of 0.04 km2). The majority (70%–80%) of water exchange occurs via the Irbe Strait (Petrov, 1979).
The catchment area of the GoR is 134,000 km2. Five major rivers (Daugava, Gauja, Lielupe, Salaca, and Pärnu) bring freshwater to the GoR, with the majority of the freshwater (86%) discharging in the southern part of the gulf (Berzinsh, 1995), mostly due to the contribution of Daugava river, which gives approximately 70% of the overall river input in the GoR (Yurkovskis et al., 1993). Due to the excessive river runoff to the gulf (henceforth GoR or the gulf) and limited water exchange with the open BS, a salinity gradient can be observed from the Irbe Strait to the south and southeast of the GoR.
As the GoR is often perceived as an estuary-type water basin, the common understanding of the gulf is that the outflow/inflow occurs through surface/bottom layers via the Irbe Strait with cyclonic (anti-clockwise) mean surface circulation within the gulf (e.g., Elken et al., 2003; Leppäranta and Myrberg, 2009). Nevertheless, research from historical surveys (e.g., Berzinsh, 1980; Lips et al., 1995) and model analysis (e.g., Soosaar et al., 2014; Lips et al., 2016a; Lips et al., 2016b) have revealed that variations exist to this “common understanding” showing that a cyclonic and anticyclonic circulation pattern can be persistent in the GoR depending on the seasonality and forcing factors.
The water temperature in the GoR has a seasonal pattern. Cooling of the whole water column occurs during October/November–February. March/April marks the start of the water column warming. The temperature reaches its maximum in August, which is again followed by a steady cooling during September–October. Seasonal changes in thermal stratification are consistent with the annual cycle of air–sea heat exchange (Raudsepp, 2001). Further details on stratification in the GoR can be obtained in the research by, e.g., Stipa et al. (1999) and Skudra and Lips (2017).
In the summer, upwellings are usually associated with lower temperatures as well as nutrient abundance (necessary for biological productivity) at surface layers, which is a direct result of vertical mixing where bottom layer waters are shifted to the surface layers (e.g., Lehmann et al., 2012; Omstedt et al., 2014; Krek et al., 2021).
Bychkova et al. (1988) identified 22 typical areas of upwelling in the BS based on corresponding general weather conditions, out of which two were identified in the GoR, namely, the eastern and western coasts of the GoR. Previous investigations regarding upwelling in the GoR have been considered mainly in the context of the whole BS region based on satellite data (e.g., Uiboupin and Laanemets, 2015; Dabuleviciene et al., 2018; Zhang et al., 2022), model data (e.g., Myrberg and Andrejev, 2003; Wu et al., 2019), or a combination of both (e.g., Lehmann et al., 2012; Gurova et al., 2013; Kowalewska-Kalkowska and Kowalewski, 2019). In addition to that, more detailed investigations have been performed concentrating on specific gulfs (e.g., Kikas and Lips, 2016—the Gulf of Finland), parts, or regions (Bednorz et al., 2018 and Bednorz et al., 2019—South-Eastern Baltic Sea) of the Baltic Sea and explore various aspects of upwelling-related topics, e.g., atmospheric forcing (Bednorz et al., 2021), submesoscale structures (Väli et al., 2017), surface transport (Delpeche-Ellmann et al., 2017 and Delpeche-Ellmann and Soomere, 2018), excess of phosphorus in surface layer (e.g., Laanemets et al., 2011; Väli et al., 2011), chlorophyll a variability (Dabuleviciene et al., 2020), and heat waves (Suursaar, 2020). Previous studies of the GoR region have been general and descriptive (e.g., Bychkova et al., 1988; Lehmann et al., 2012; Bednorz et al., 2021), focused on identifying the main upwelling areas and giving frequency estimates.
This research aims to provide more detail and focus specifically on the GoR upwelling events, their characteristics, and dynamics, as within the BS region many papers about upwellings mostly consider other regions (e.g., Gulf of Finland, Gdansk Bay, and Baltic Proper). The main goal of the present study is to detect upwelling events in the GoR in 2010–2022 and describe their characteristics (e.g., length and frequency). To achieve this, multiple in-situ data acquisition methods—historical monitoring and coastal measurement data, SmartBuoy data, satellite data, model data, and in-situ measurement campaigns—are combined. Motivation also included the targeted approach to capture coastal upwelling events with in-situ CTD (conductivity, temperature, and depth) measurements (biological and chemical samples were also taken), and two events in current research were described more in detail as case studies.
Such research furthers the current understanding of upwelling events in the GoR. It reveals their types, phases and lengths, and typical locations within the basin, which subsequently sets the basis to explore how upwellings influence regional/local biogeochemical processes. This study concentrates on in-situ data, which makes it the first such analysis in the GoR and will be relevant for other, rather shallow, semi-enclosed water basins.
2 Material and methods
We applied a wide range of data sources, and each one is described in detail in this section. Surface water temperature measurements from four coastal monitoring stations (Salacgriva, Skulte, Mersrags, and Roja; see Figure 1) collected in May–September 2010–2022 were analyzed using a freely available online database by the Institute of Food Safety, Animal Health and Environment. Data from Salacgriva were used only for quantitative analysis due to the large variability. All data had a temporal resolution of 1 h, and the dataset was smoothed (5 h moving average) before further analysis. An event qualified as upwelling if the following conditions were observed: a temperature drop of ≥5.0°C. It was possible to empirically define the start/end, relaxation phase (RP), and/or the active upwelling phase (AUP) of each event. The start of the upwelling event was defined as a point (with the highest temperature) from which temperature decreased consecutively by ≥0.05°C, reaching a temperature drop of at least 5.0°C. The point where consecutive temperature decrease criteria were not met was defined as the start of the AUP. Consequently, the AUP endpoint corresponds to the start of the RP, which was defined as the point from which the temperature increased consecutively by ≥0.02°C. The end of the RP corresponds to the end of the upwelling event itself and was defined as a point with the maximum temperature value during the increase (please, refer to Figure 2 for a more schematic view regarding the defined upwelling phases). Due to the high temperature variability in some events (even with data smoothing), the parameterization criteria had to be adjusted—every event where the overall temperature dropped by at least 5.0°C during the event was used for quantitative analysis. If during the temperature drop there was an alternate, short (≤5 h) temperature increase, the start of the AUP was defined manually. Likewise, if during the RP there was an alternate, short temperature decrease, the end of the event was also defined manually. In very rare cases, we neglected the temperature variability if it was obvious from the overall time series where exactly the specific phase starts/ends. As we further analyzed purely the length of defined phases and fixed the temperature values at phase start/end points, temperature variability itself had no direct impact on our results (which would be the case if we analyzed the temperature within the respective phase) with the only exception of calculated average temperature in AUP. Those events where temperature variability did not allow to define the respective phase start/end points were excluded from further data analysis.
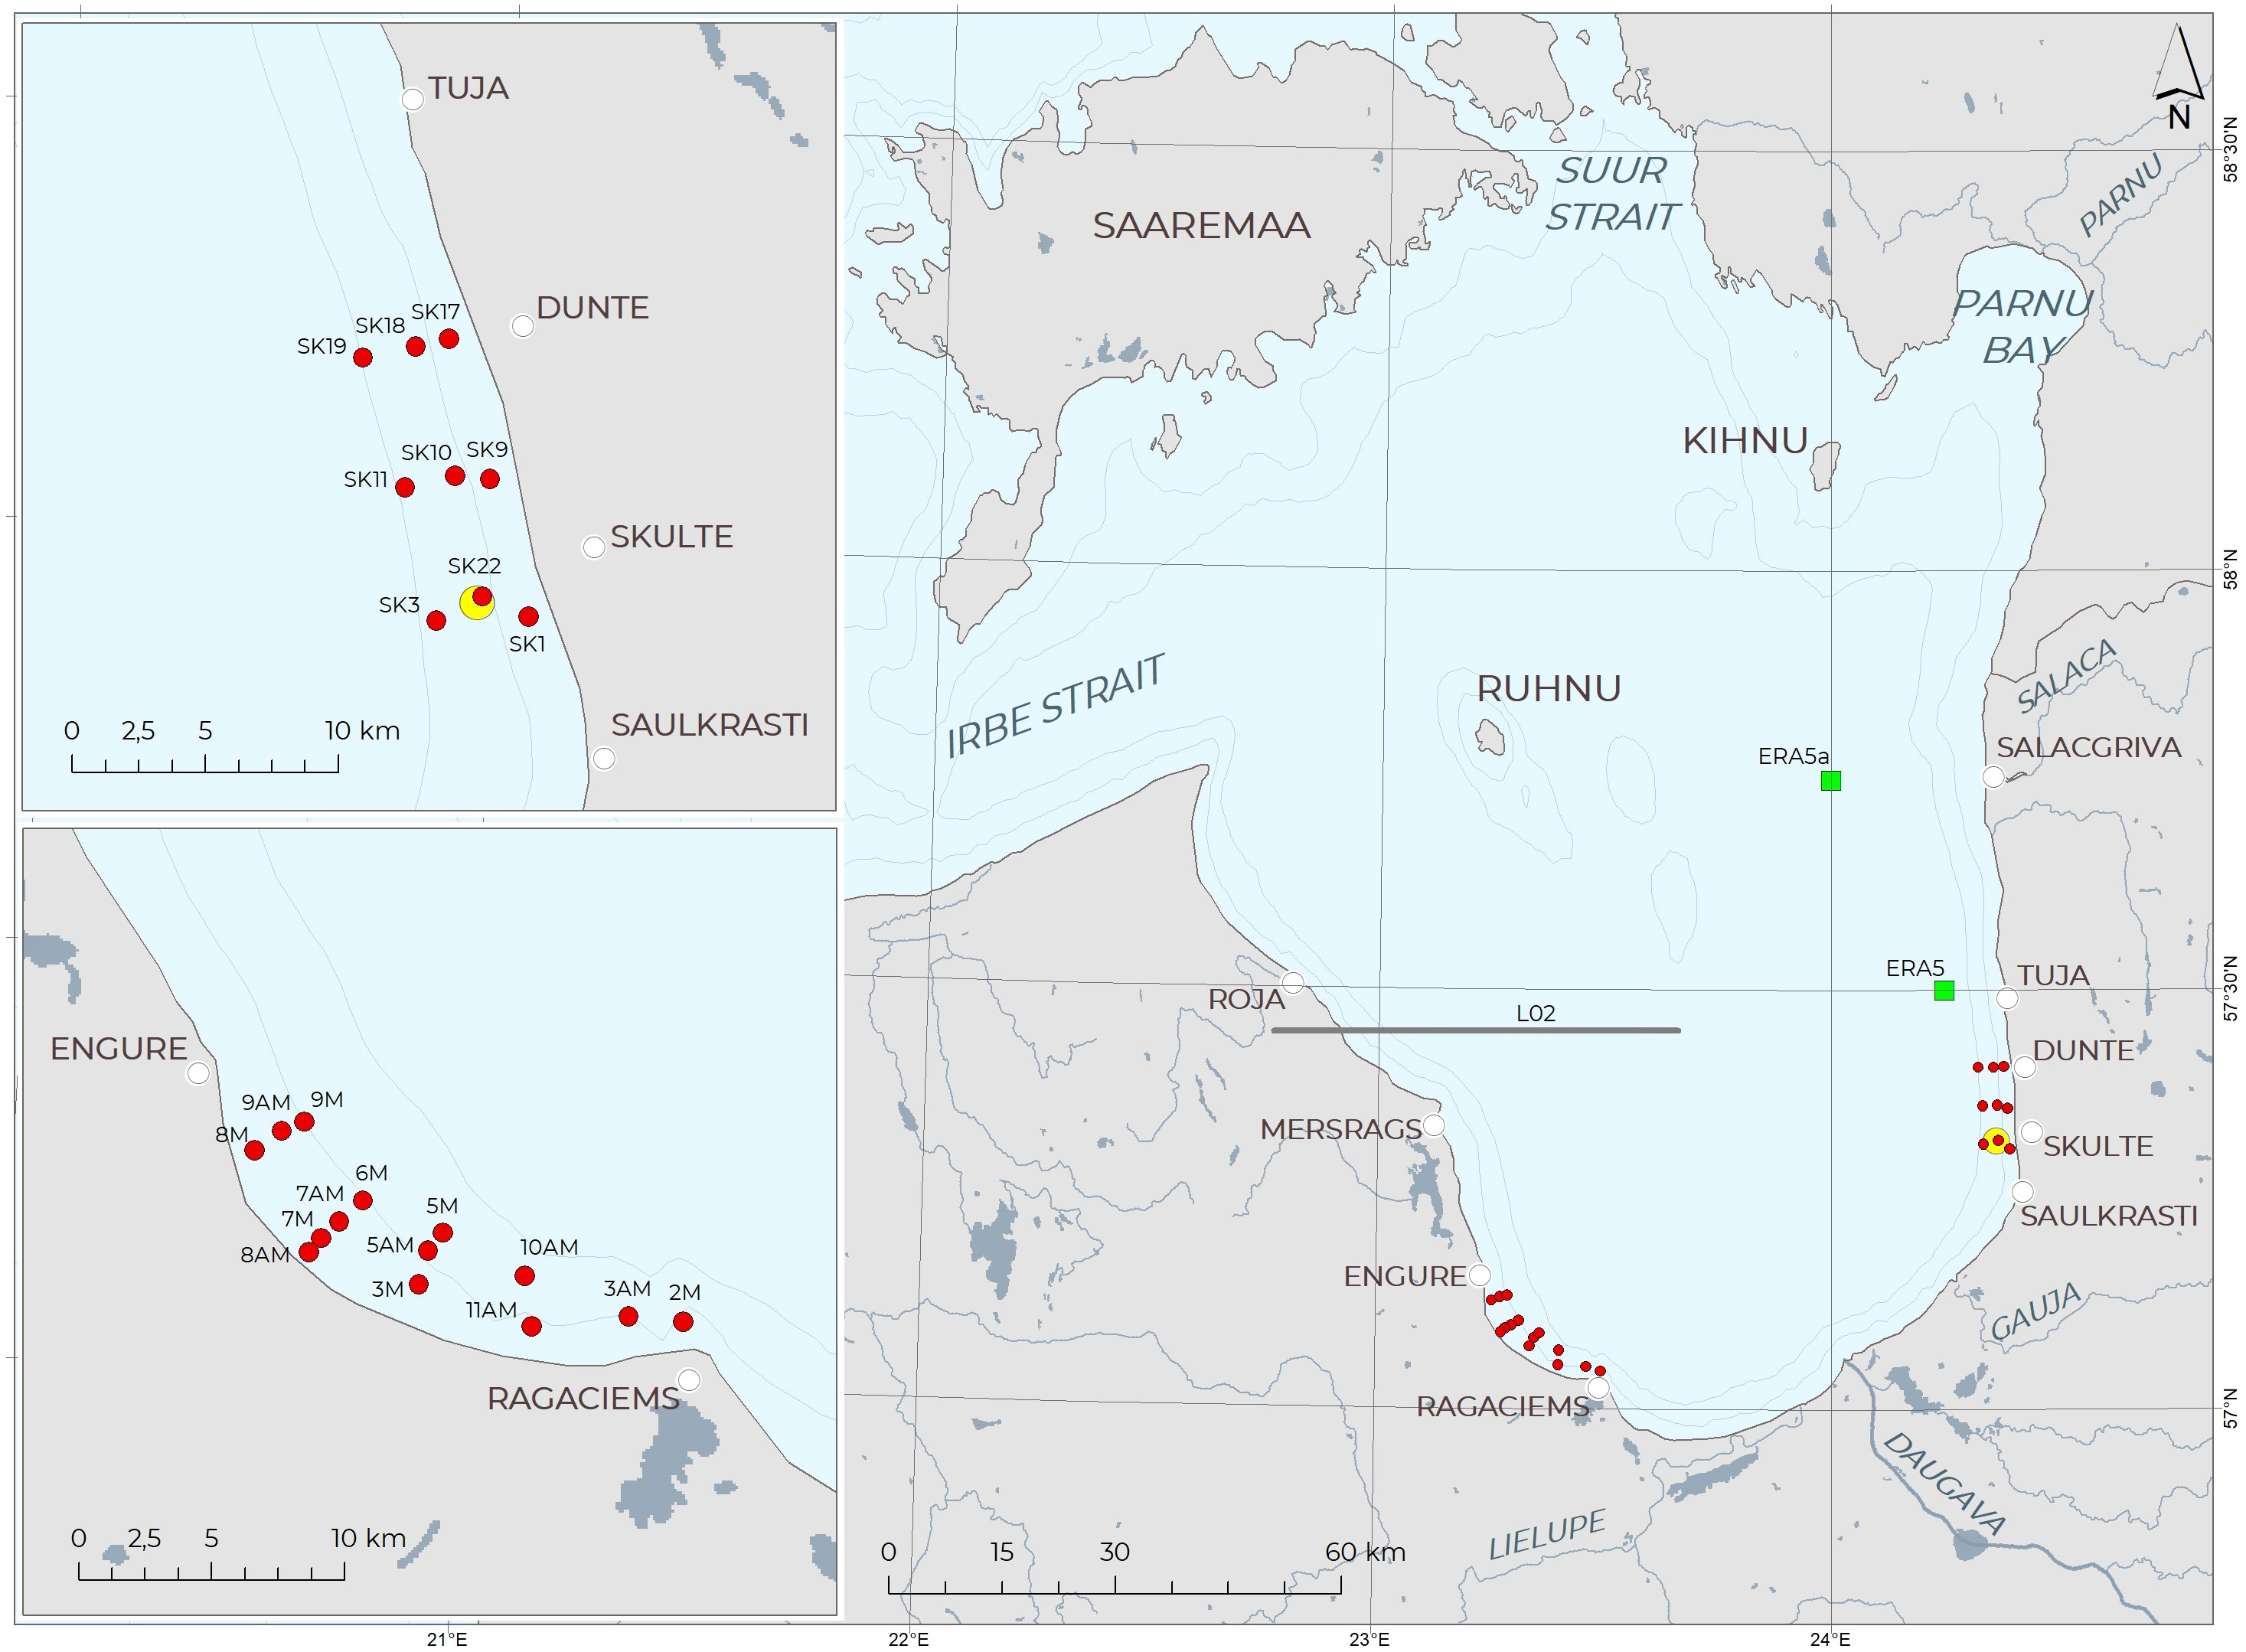
Figure 1 Map of the Gulf of Riga with red dots representing the performed CTD (conductivity, temperature, and depth) casts on July 13 (eastern coast) and August 17 (western coast), 2021. Yellow circle shows the location of SmartBuoy. Coastal temperature measurements were available from Roja, Mersrags (wind data as well), Skulte (wind data as well), and Salacgriva. ERA5 and ERA5a denote the location of wind data. Gray line marked with L02 represents the model transect presented in Figure 13.
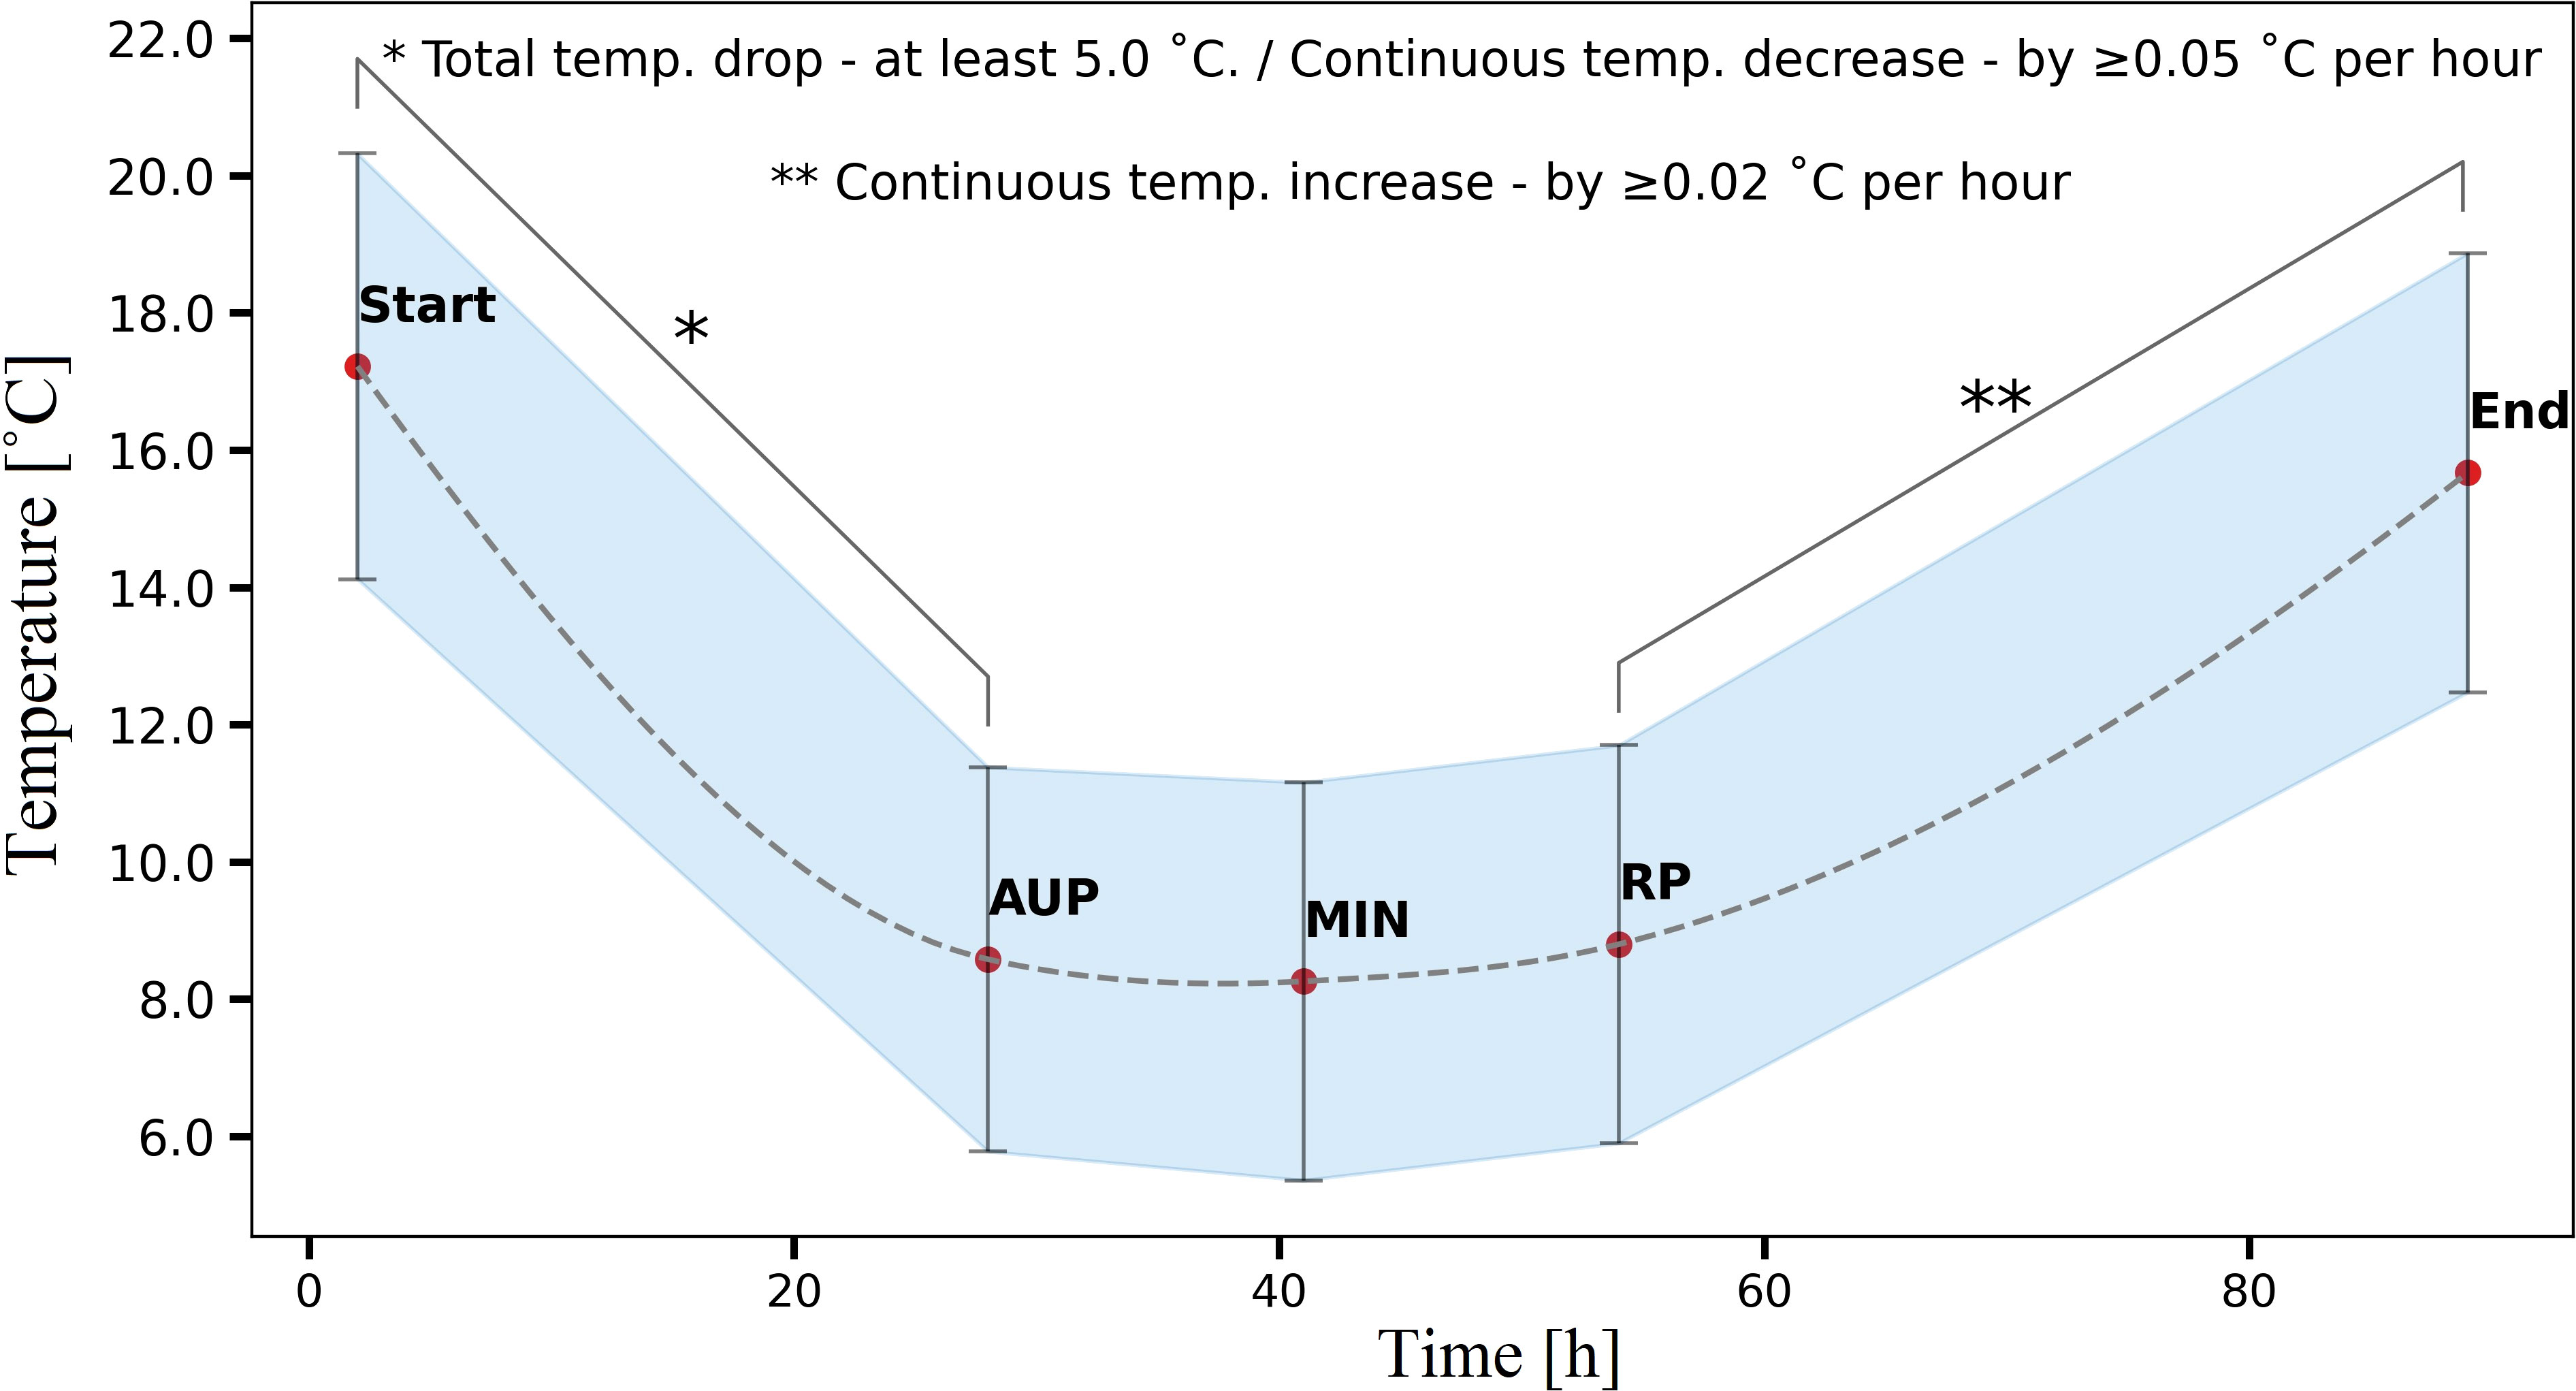
Figure 2 Mean upwelling event features derived from detected and parameterized upwelling events in 2010–2022.
To sum up, each upwelling event was characterized by the length (days/hours) of the whole event, the RP, the AUP, and how rapidly the upwelling evolved together with the average temperature in the AUP (as simple mean), and the maximum temperature drop during the event.
Targeted CTD measurement surveys using an SBE 19plus V2 SeaCAT CTD probe (Sea-Bird Electronics, Bellevue, WA, USA) were performed on the southern (S), southeastern (SE), and southwestern (SW) coasts of the GoR in July and August of 2021 and 2022 inside and outside of the area affected by the upwelling. After data processing, all CTD profiles were stored with a vertical resolution of 0.5 m. In addition, during the surveys, water samples were taken with a horizontal water sampler (Van Dorn) from the surface and bottom layers inside and outside of upwelling areas for nutrient analysis. Phytoplankton (5-m and 10-m integral tubes; Van Dorn water sampler) and zooplankton (WP-2 net; mesh size 100 µm) samples from surface and bottom layers were also taken in some of these locations.
The historical sea surface temperature (CTD) data collected by the Latvian Institute of Aquatic Ecology (2010–2022) and the Institute of Food Safety, Animal Health and Environment (2010–2012) during the summer monitoring cruises from the long-term CTD dataset (Skudra and Lips, 2017) were also analyzed for upwelling events.
SmartBuoy data were obtained in 2021–2022 from the SmartBuoy system deployed on the eastern coast of the GoR near the Skulte port, approx. 2.5 km offshore with coordinates of 57.31998 N latitude and 24.36355 E longitude (see Figure 1). The dataset consisted of surface water temperature measurements (temperature sensor mounted on Wave and Tide Sensor 5218, Aanderaa, Norway) primarily used in this research during May–September. All data from SmartBuoy had a temporal resolution of 1 h, and the temperature dataset was smoothed (5 h moving average) before further analysis similarly as with coastal measurements.
Satellite data (The BACC II Author Team, 2015) were analyzed during May–September using Landsat 7 (2010–2012) and Landsat 8 (2013–2022) with resolutions of 60 m and 100 m per pixel, respectively, and Sentinel-3 Level-2 data (2017–2022) with a resolution of 1 km per pixel data. To manage data volume, only data with a cloud cover of less than 40% over the GoR area were used. Landsat 7 and Landsat 8 data were extracted from https://earthexplorer.usgs.gov/; for Sentinel-3, data were extracted from archive.eumetsat.int, and subsequent conversion from Kelvin to degree Celsius for sea surface temperature (SST) was performed using ESA SNAP API for Python. The satellite data were further analyzed in Quantum GIS to visualize and select the datasets where the upwelling signal was evident with emphasis on those events, which were confirmed from in-situ measurements in order to analyze the spatial distribution.
The General Estuarine Transport Model (GETM; Burchard and Bolding, 2002) was applied to simulate the physical conditions in the GoR from 2010 until 2021 in order to find out how well the model is capable of simulating the coastal upwelling events compared to in-situ and satellite data. The horizontal resolution of the model grid is 0.5 nautical miles (approximately 926 m) with 60 adaptive layers (e.g., Gräwe et al., 2015; Klingbeil et al., 2018) in the vertical direction. Initial conditions for temperature and salinity for April 1, 2010, were taken from Copernicus Marine Service re-analysis for the period 1989–2015, with meteorology input from atmospheric re-analysis dataset ERA5 (Hersbach et al., 2020) with hourly resolution in time and 0.28 × 0.28 degrees (31 km) in space. Climatological T/S values in Kattegat and observed sea-level elevation from Gothenburg station were used for the open boundary condition in the Kattegat region. More information about the model setup can be found in Liblik et al. (2020) and Liblik et al. (2022) and Zhurbas et al. (2018). The output parameters included snapshots of surface parameters in the GoR along with the daily mean 3D thermohaline and current fields.
Wind data (direction and speed) were collected from Mersrags and Skulte coastal stations (see Figure 1) as background data from a freely available online database hosted by the Latvian Institute of Food Safety, Animal Health and Environment. In addition, wind series from selected locations (see Figure 1, green rectangles) from ERA5 were used for additional analysis of wind conditions. Sea surface temperature and vertical temperature distribution was analyzed using freely available software "Ocean Data View" (Schlitzer, 2018).
3 Results
3.1 Detected upwelling events
Quantitative results of detected upwelling events from in-situ data and satellite data are presented in Table 1. A total of 116 separate upwelling events were determined from the time series of water temperature in four coastal monitoring stations—Mersrags, Roja, Skulte, and Salacgriva. In five cases, an upwelling signal was observed from historical monitoring surveys performed in August. SmartBuoy (Skulte) measurements performed in 2021 and 2022 revealed three and two upwelling events, respectively. As for the satellite data, a total number of 562 satellite images were processed with an upwelling signal detected in 28 (Sentinel-3) and 10 (Landsat) cases, which yielded a total number of 164 upwelling events detected by all methods. As there were cases when one individual upwelling event was detected by multiple data acquisition methods, it was afterward determined that the total number of separate individual upwelling events was 131.
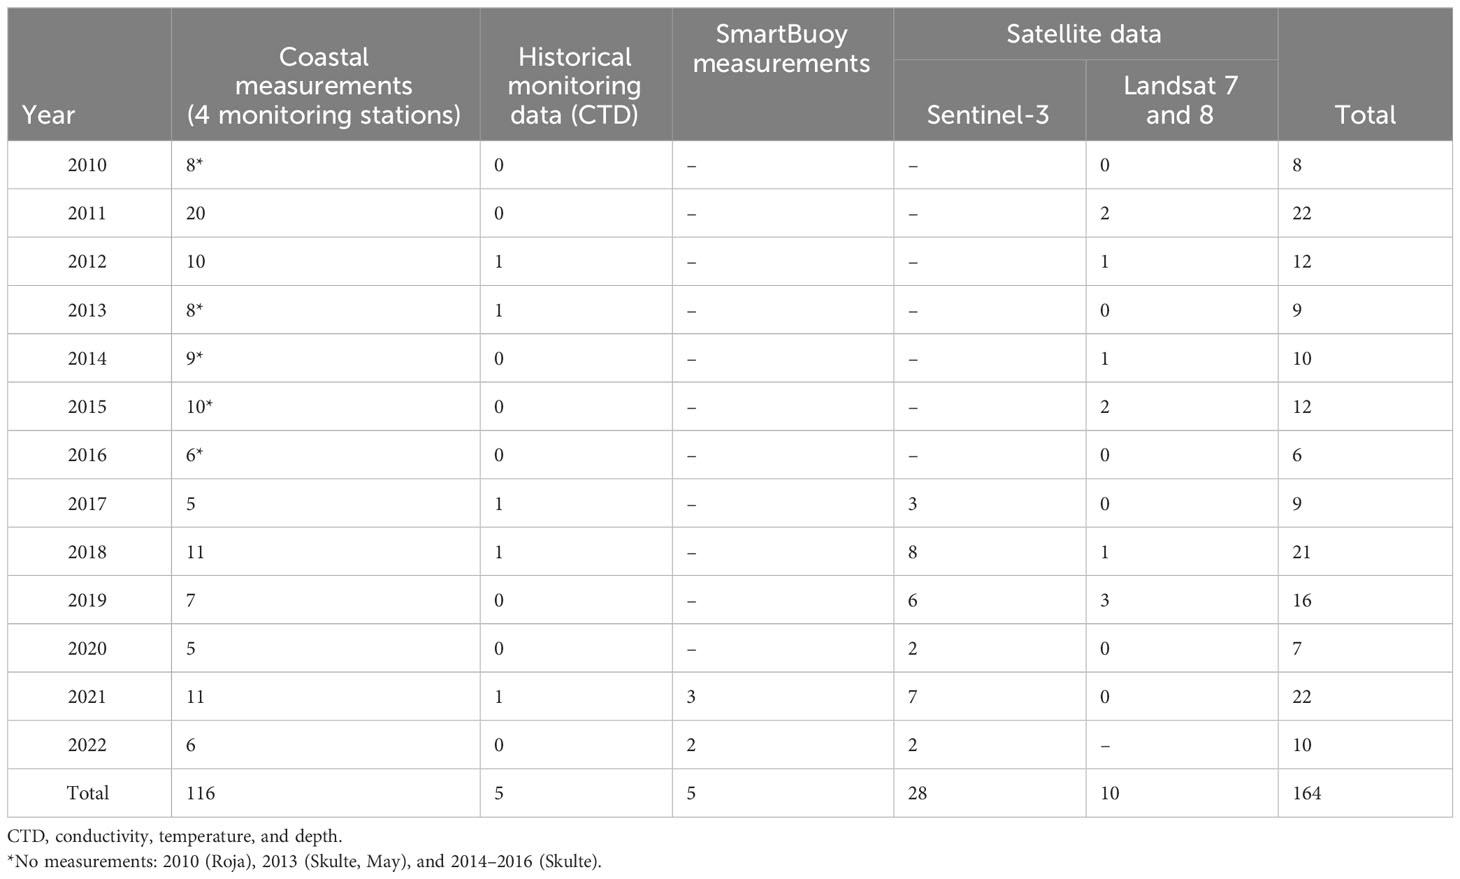
Table 1 Detected upwelling events in May–September 2010–2022 in the Gulf of Riga.
Regarding coastal measurements in each monitoring station, 52, 37, 30, and 24 upwelling events were observed in Mersrags, Roja, Skulte, and Salacgriva, respectively, which represent a frequency of 4.0, 2.8, 2.3, and 1.8 events/per year on average, respectively. In 20 cases, upwelling events overlapped between Mersrags and Roja; in seven cases, between Skulte and Salacgriva, there was a total of 116 (from 143) separate events. It has to be noted that measurements were not performed in 2010 (Roja), 2013 (Skulte, May), and 2014–2016 (Skulte).
Between the years 2010 to 2022, upwelling events varied between 5 and 20 events/per year (Table 2). There was an average of 9 events/per year with 59% of all events detected on the western (W) coast as opposed to the eastern (E) coast. On a monthly basis, the total count of upwelling events was roughly two times scarcer in May and September than in June, July, and August. No upwelling events were detected in 6 out of the 13 years for May and in 4 out of the 13 years for September. The total number of upwelling events during June–August was distributed evenly, and only in June 2017, July 2019, and August 2013 was no upwelling event detected.
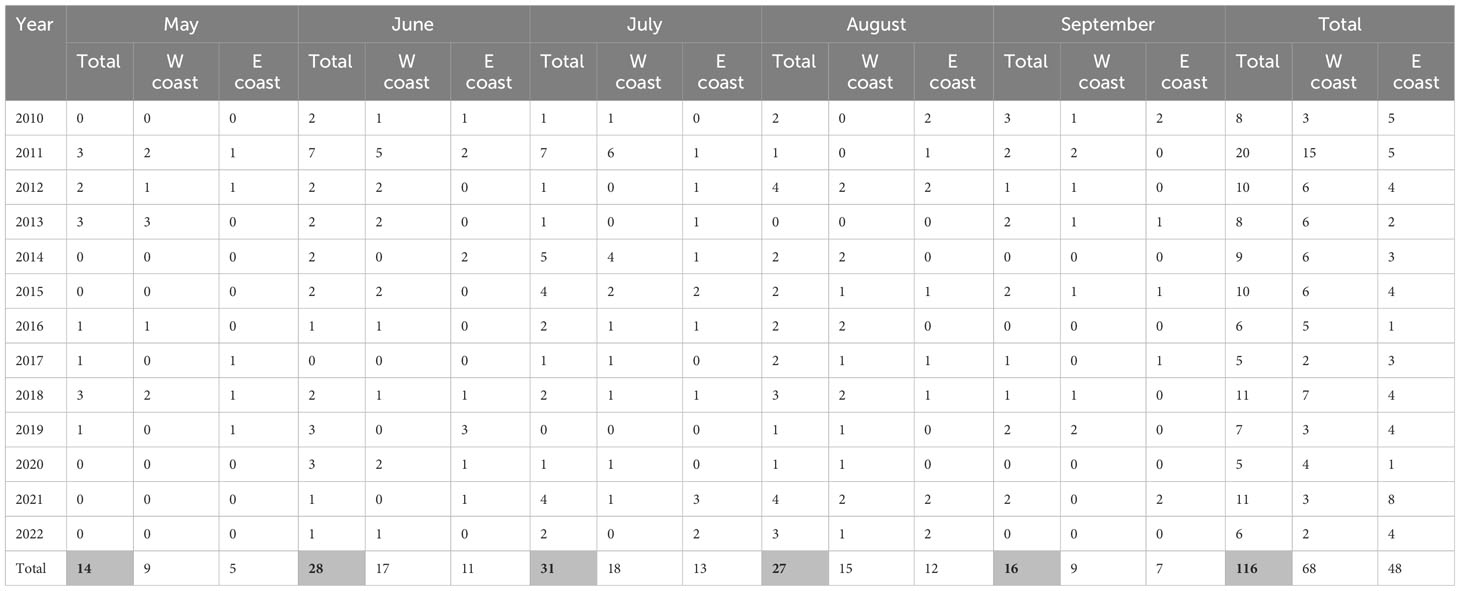
Table 2 Distribution of upwelling events by year, month, and location from coastal measurements.
3.2 Characteristics of upwelling events (from coastal data)
From defined main points or phases in upwelling events in 2010–2022 (May–September), we derived that the mean length of evolvement (from Start to AUP), active upwelling phase (from AUP to RP), relaxation phase (from RP to End), and total upwelling length for the GoR was 26 h, 26 h, 36 h, and 88 h, respectively (Figure 2). The mean temperature at the start of an upwelling was 17.2°C, the mean minimum value during the upwellings was 8.2°C, and the mean maximum temperature drop was 9.0°C. At the end of the upwelling events, the mean temperature was 15.7°C. On a monthly basis, the length of the whole event and the RP length gradually increased during May–September by between 74–101 h and 17–48 h, respectively. The length of the AUP and the length of the evolvement were variable between the months ranging between 20 h and 33 h for the AUP and 21 h and 31 h for the time it took for the upwelling to form/reach the start of the AUP.
The characteristics of upwelling events in the western (Mersrags and Roja) and eastern (Skulte) coasts had both similarities and differences (only upwelling events from June to August were used). The mean AUP and evolvement time of the upwellings were similar between these three locations, with AUP ranging between 21 h and 24 h and upwelling evolved between 24 h and 30 h in all locations. The mean RP in Mersrags (28 h) was shorter if compared to that in Roja and Skulte where the mean RP was 41 h and 44 h, respectively (Figure 3A). The whole upwelling event length was slightly longer in Skulte, the eastern coast of the GoR, where the mean value was 98 h as opposed to the western coast where it was 81 h and 88 h for Mersrags and Roja, respectively. Together with the longer upwellings on the eastern coast, the average temperature in the AUP was slightly lower (approx. 0.3°C) than on the western coast. Moreover, the mean maximum temperature drop during the upwelling was also higher on the eastern coast (10.2°C) than on the western coast—8.9°C (Mersrags) and 8.5°C (Roja). Thus, there is a tendency for the eastern coast (Figure 3B, red slope) maximum temperature drop during the upwelling events to increase with increasing total length of the event itself, which can be observed in Mersrags (blue slope) and the western coast as well but is not evident in Roja (yellow slope).
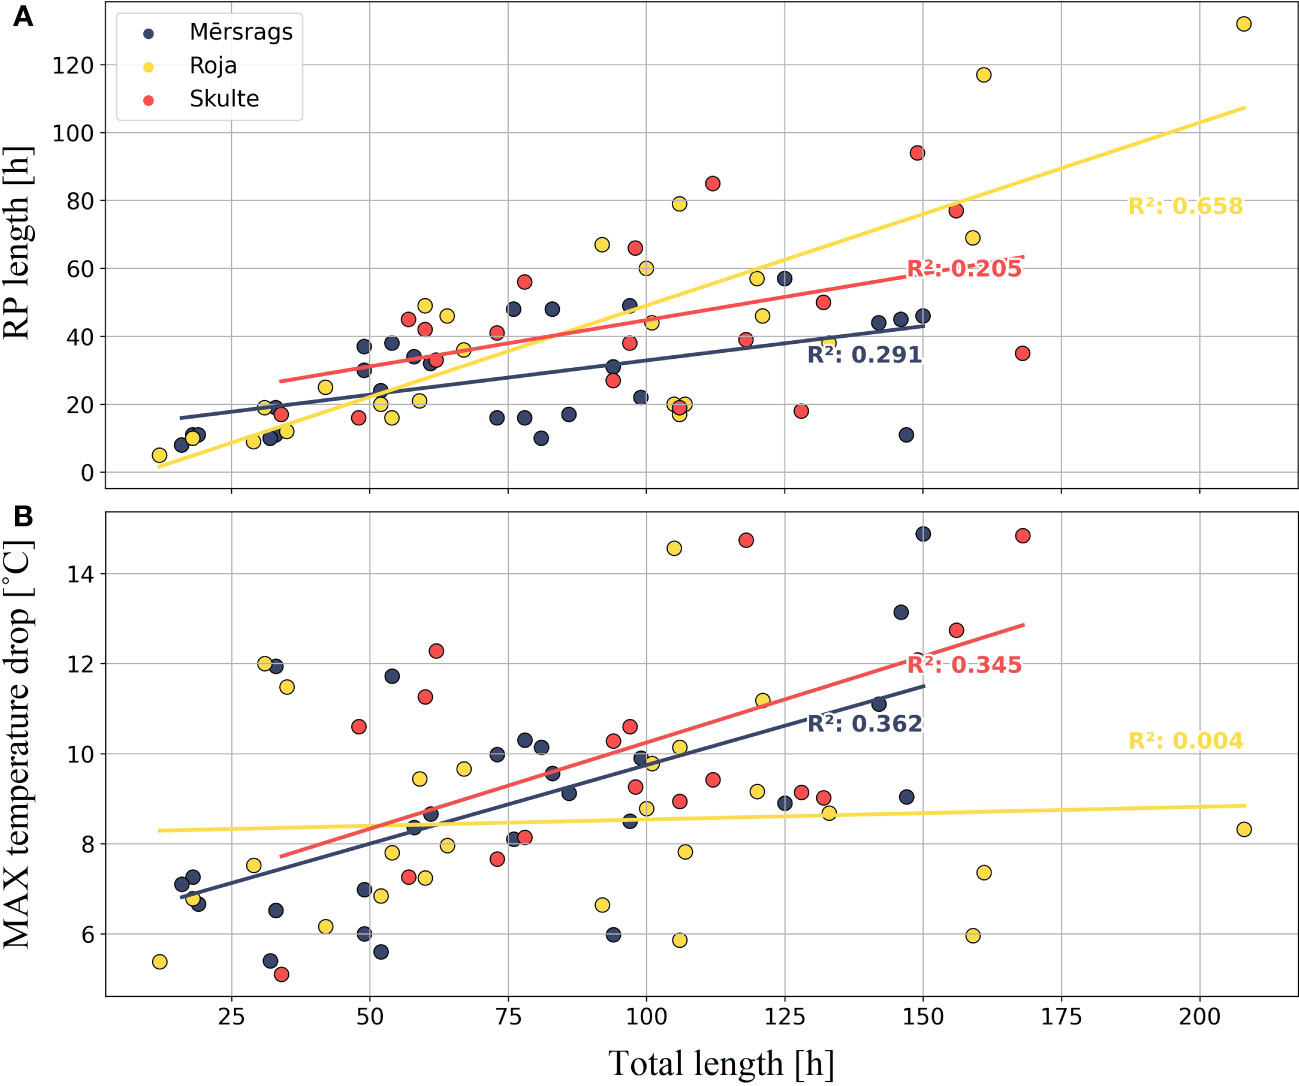
Figure 3 Total length and relaxation phase length (A) and maximum temperature drop and total length (B) of detected upwelling events in June–August 2010–2022 in western (Mersrags and Roja) and eastern (Skulte) coasts.
The nature, structure, and type of detected upwelling events varied greatly between different months and years. The longest event was detected in Mersrags in July 2020 (Figure 4, black line). It lasted for 328 h or 13 days and 16 h with temperatures below 12.0°C evident for more than 10 days. Another long event, which was also characterized by a rapid development and relaxation phase (Figure 4, green line), was detected in Skulte in July 2021, and it lasted for 7 days (described more in detail in Section 3.3.1). Nevertheless, most of the detected events were considerably shorter but with significant temperature drops at the same time. In July 2022 (Skulte) and June 2018 (Roja), the temperatures during an upwelling dropped by more than 10.0°C, but the events lasted for only 62 h and 31 h, respectively (Figure 4, blue and brown lines). The upwelling event in Roja (June 2018) evolved and reached the minimum temperature within 19 h, which was succeeded by an immediate temperature increase or relaxation phase; thus, no AUP was defined in this case. A similar type of upwelling event was also observed in Mersrags in September 2019 (Figure 4, violet line). Altogether, 29 out of 93 events were without a defined AUP. The majority (90%) of the upwelling events evolved within 40 h, but some events were also characterized by rather long evolvement with consequent rapid RP (Figure 4, orange and red lines). During an upwelling event in July 2018 (Skulte), temperature gradually decreased from roughly 16.0°C to 7.0°C within 65 h, whereas later, temperature increased from roughly 7.0°C to 14.0°C within 19 h.
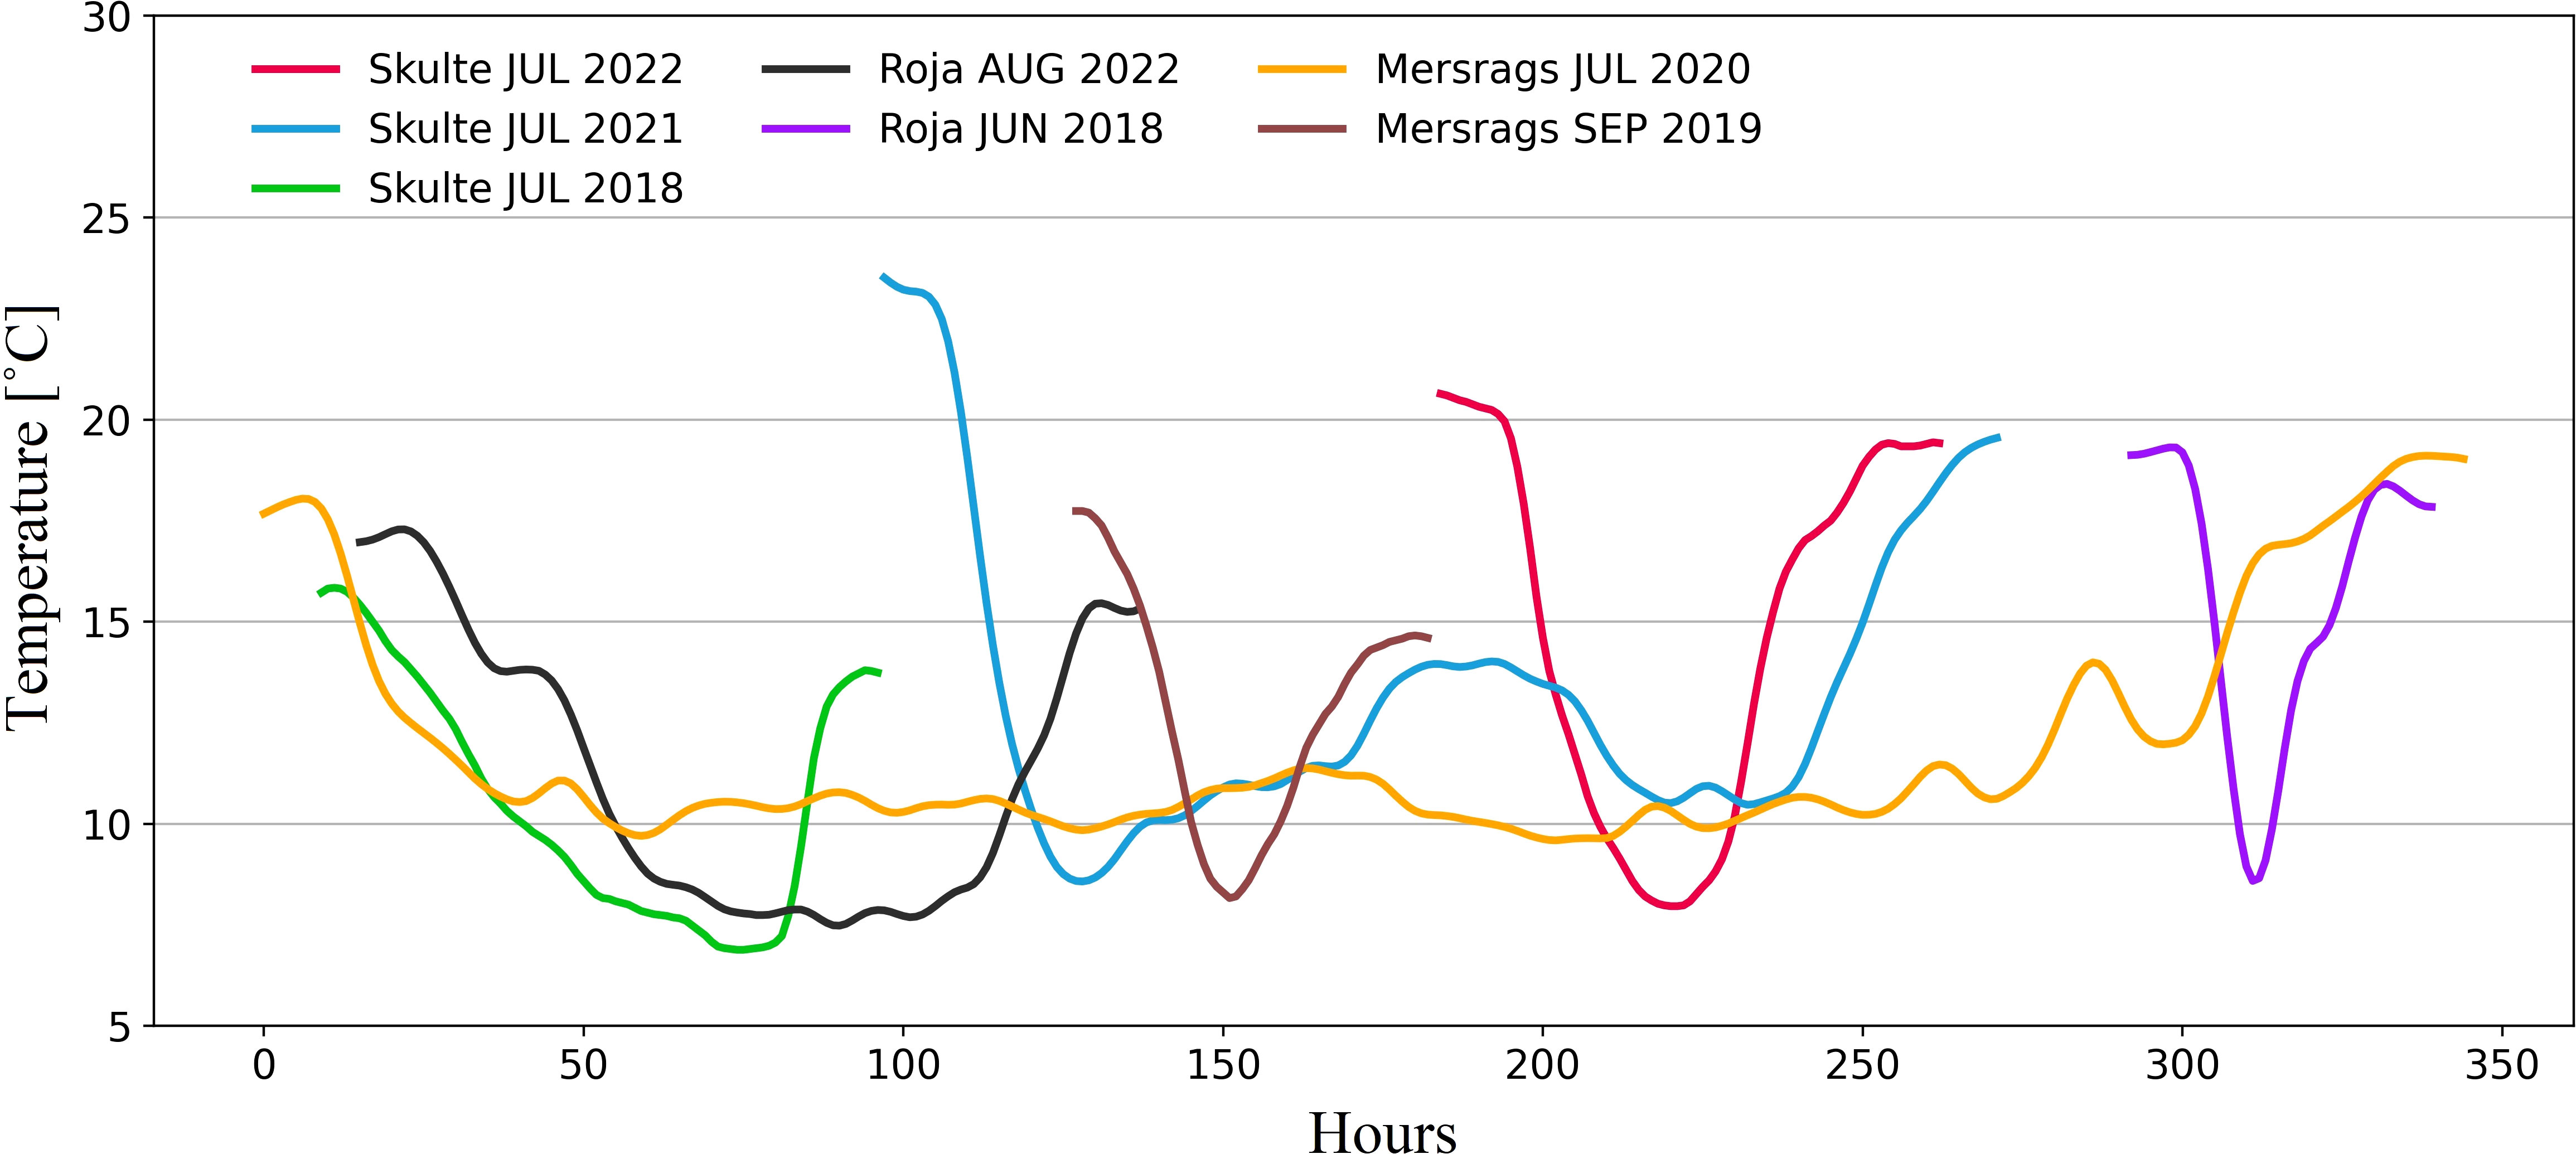
Figure 4 Different types and characteristics of upwelling events from coastal measurements. Lines are scattered along x-axis for pure visualization purposes.
3.3 Upwelling case studies
3.3.1 July 2021 (east coast)
The upwelling event along the eastern coast on July 13–19 was described using available satellite data, coastal and SmartBuoy SST time series, measurements from CTD survey, model data, and wind data from Skulte and ERA5 data source, whereas the upwelling event on July 22 was described using available satellite data, model data, and wind data from Skulte and ERA5a.
Available satellite data from Sentinel-3 (July 16 and 17, 2021) revealed the appearance of an upwelling event along the E coast of the GoR. Despite the fact that the two snapshots had roughly 24 h between them, a notable change in SST can be observed (Figures 5A, B).
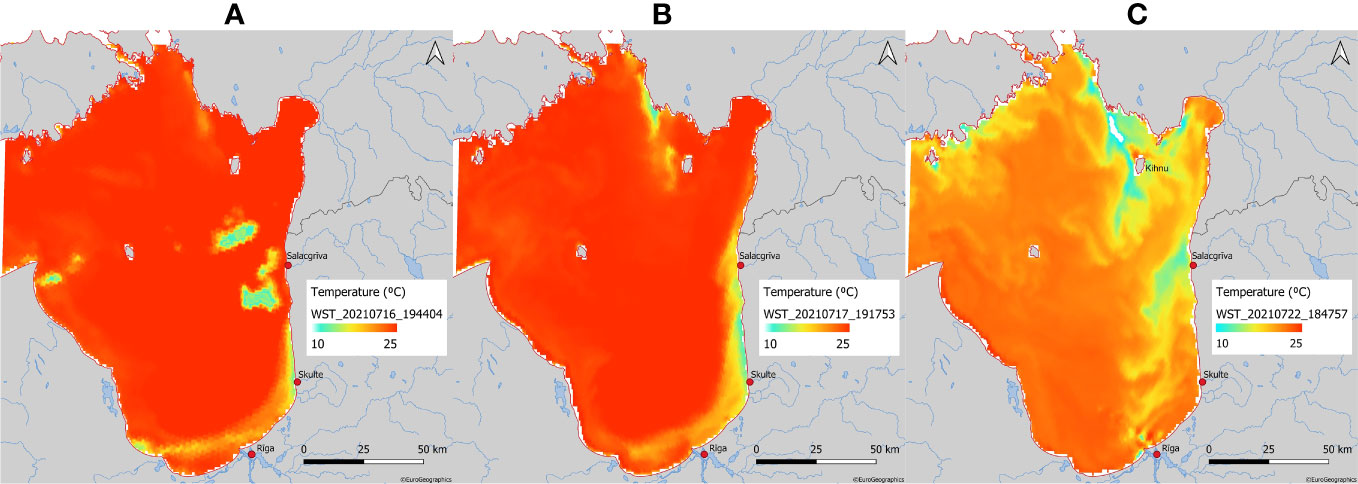
Figure 5 Sea surface temperature from Sentinel-3 satellite data on July 16 (A), 17 (B), and 22 (C), 2021.
On July 16, a lower SST signal can be seen in a narrow band between Saulkrasti and Tuja (see Figure 1), approximately 30 km along the coast. Despite the fact that the SST in this area was 6°C–7°C lower than in the open gulf (23.0°C–24.0°C), SST remained relatively high at between 17.0°C and 18.0°C, comprising an area of approximately 13 km2 (approx. 11 km in length and 1.5 km offshore at widest place). On the contrary, July 17 was characterized by a significantly larger area with lower SST evident along the whole E coast of Latvia The area with SST below 18.0°C reached approximately 269 km2 (approx. 70 km in length and 6 km offshore at the widest place), whereas the area with SST below 13.0°C, which could be regarded as the center of the upwelling event, reached approximately 22 km2 (approx. 18 km in length and 2 km offshore at the widest place).
On July 22, another signal of an upwelling event was visible from the satellite data on the east coast (Figure 5C), but this time, it was not along the whole E coast. The signal was seen in the vicinity of Salacgriva and the N part of the GoR, in an area offshore of the Estonian mainland and around Kihnu Island. The area most affected by reduced SST (<16.0°C) consisted of roughly 275 km2 near Salacgriva with temperatures as low as 14.0°C still detected 13 km offshore. In the N part, SST of roughly 13.0°C was still observed 7.5 km to the south of Kihnu Island. The total area affected by the upwelling (<16.0°C) in the N part of the GoR was roughly 655 km2. Wind from ERA5a location (see location in Figure 1) showed N, NW winds with a speed of approximately 8 m/s on July 22.
From the SST time series of the coastal monitoring station in Skulte Port and SmartBuoy near Skulte Port, it can be seen that the first upwelling event took place between July 13 and 19 (Figure 6). On the evening of July 12, a sharp decrease in temperature was observed simultaneously in the SmartBuoy and coastal SST measurements. Within 21 h, SST in the coastal station dropped from 23.3°C to a minimum value of 8.5°C on midday of July 13. Further, the temperature was mostly below 12.0°C (except for July 15–16 when the temperature was between 12.0°C and 14.0°C), and finally, on the morning of July 18, it started to constantly increase, marking the start of the relaxation phase, which ended within 35 h when SST rose back to 19.6°C. Wind data from Skulte and ERA5 on July 12–19 showed upwelling favorable winds from N, NE, NW, and E (not shown here) with wind speeds of 1–4 m/s in Skulte and 1–6 m/s from ERA5, respectively.
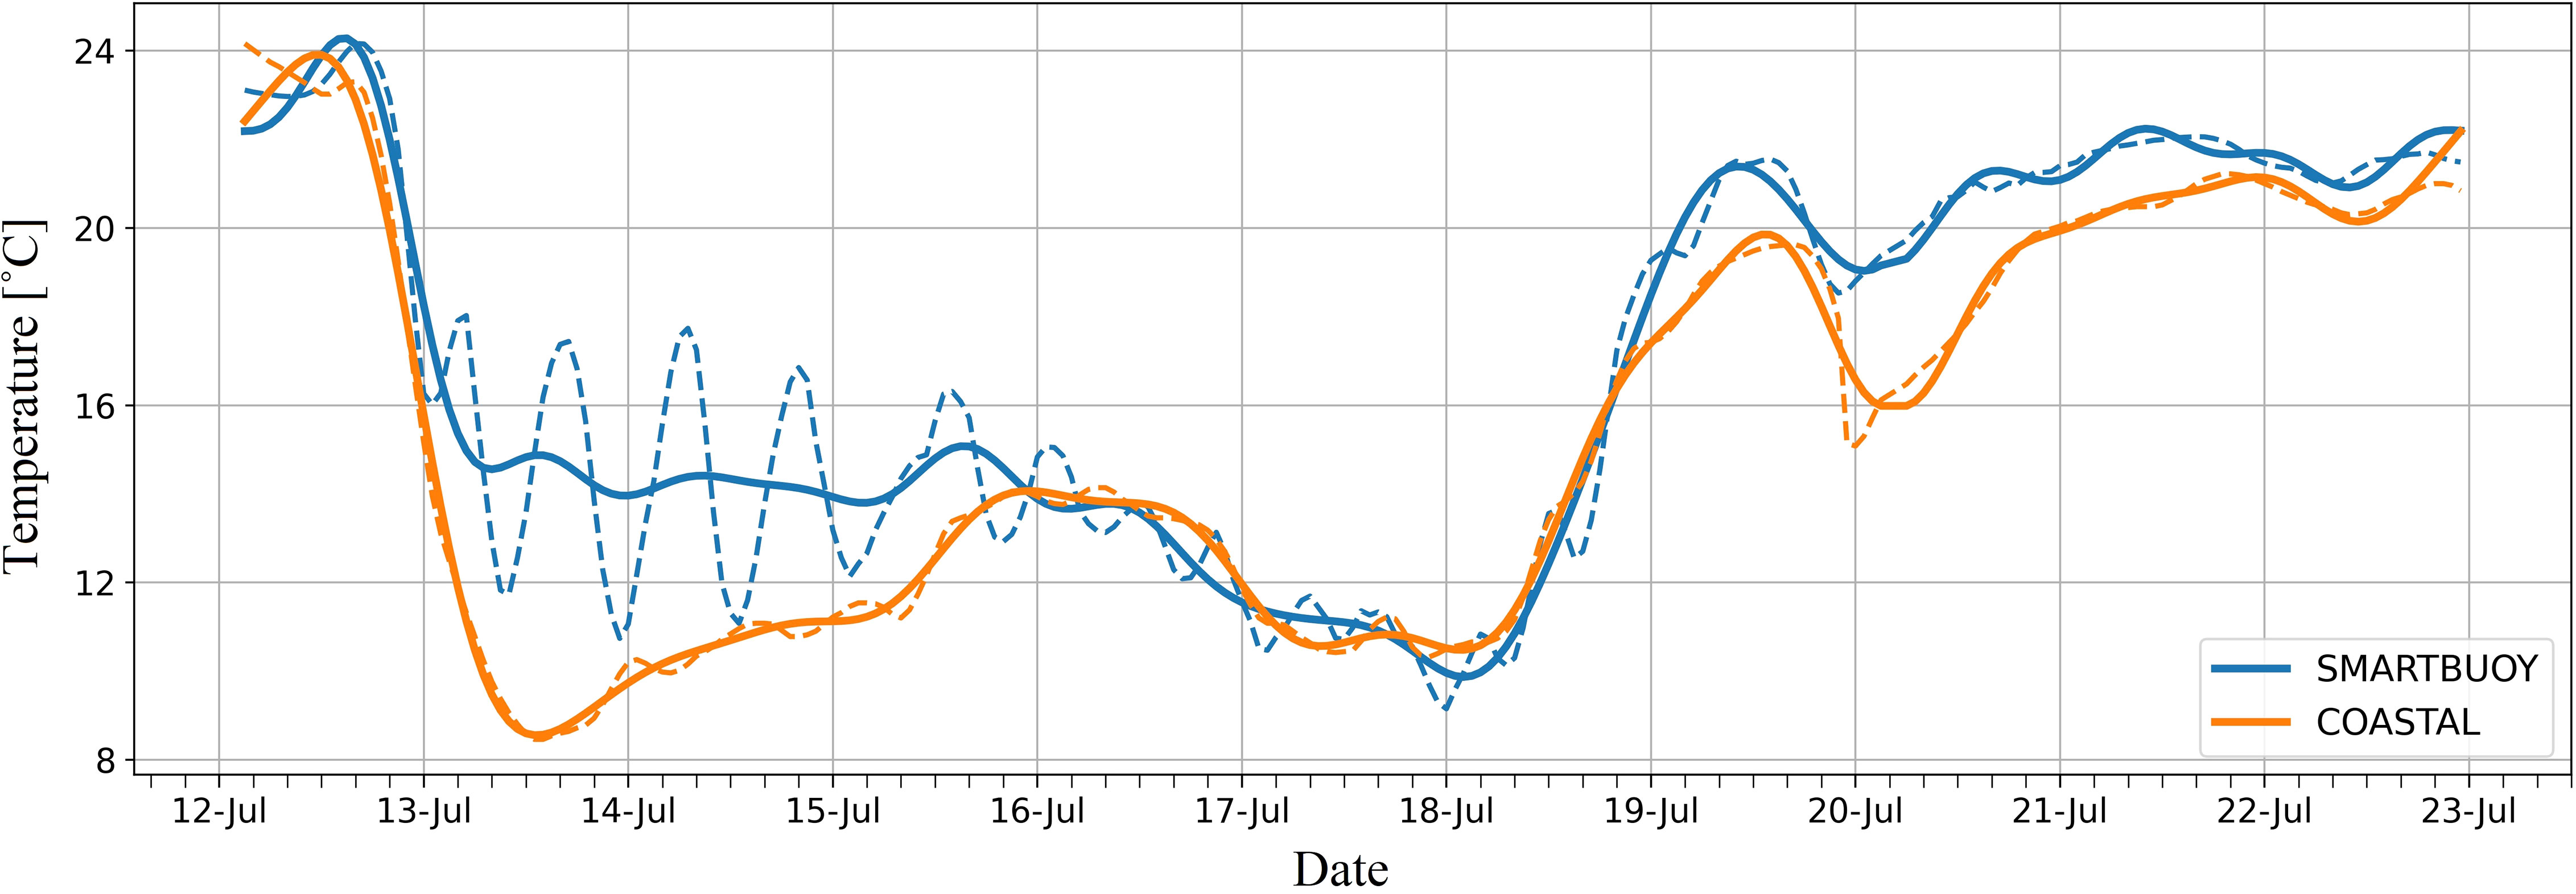
Figure 6 Time series of sea surface temperature from SmartBuoy and coastal monitoring station in Skulte on July 12–22, 2021. Dashed lines represent the original data, and solid lines are the fast Fourier transform low-pass filtered series with cutoff period of 16.6 h.
The time series of SST from SmartBuoy (2.5 km offshore) revealed different dynamics in comparison to the coastal monitoring station. Despite similarities of SST decrease starting from July 12, a strong temperature variability was observed between July 13 and 15 with at least four rather distinct cycles where temperature alternately decreased and increased by approximately 5.0°C–7.0°C (Figure 6, dashed blue line). Only starting from July 16 was temperature variability less pronounced and followed the temperature curve from the coastal monitoring station with temperature at the end of the relaxation phase/end of upwelling being roughly 2.0°C higher than in the coastal monitoring station. By applying a low-pass filter, the variability of the SST from SmartBuoy considerably decreased (solid blue line).
Nevertheless, the upwelling event on July 22 was not evident in the SST time series of coastal measurements from Skulte or Skulte SmartBuoy, and temperature in the surface layer remained at approximately 21.0°C in this region. It was possible to quantitatively detect this event from the Salacgriva coastal monitoring station, which showed a minimum temperature (8.3°C) at midnight between July 21 and 22.
A targeted CTD measurement survey performed on July 13 at nine stations near Skulte port (area from port entrance to 10 km north) showed that a strong upwelling signal (8.8°C) was evident in the station closest to the port (Figure 7). However, there was an increasing temperature gradient not only offshore but along the coast to the north as well (see sections in Figures 8 and 1 for station labels). Roughly 5 km to the north along the coast the SST was 15.2°C, and another 5 km further the temperature was already 18.5°C, although it has to be mentioned that those stations were taken approximately 100–200 m further away from the coastline. This north–south SST gradient was also visible 2 km and 4 km offshore as well where SST in the northern part (in the context of the sampling area) was 21.6°C and 24.2°C, respectively, but in the southern part—18.8°C and 21.7°C. The closest station to the Skulte SmartBuoy measured SST as 17.8°C, whereas the closest reading to this measurement from the SmartBuoy registered 17.0°C, and it coincided with the temperature increase in one of the SmartBuoy “variability cycles” mentioned before. In addition, the coastal monitoring station registered an SST of 8.5°C as the nearest value to the recorded CTD profile (SST of 8.8°C) just outside the port entrance.
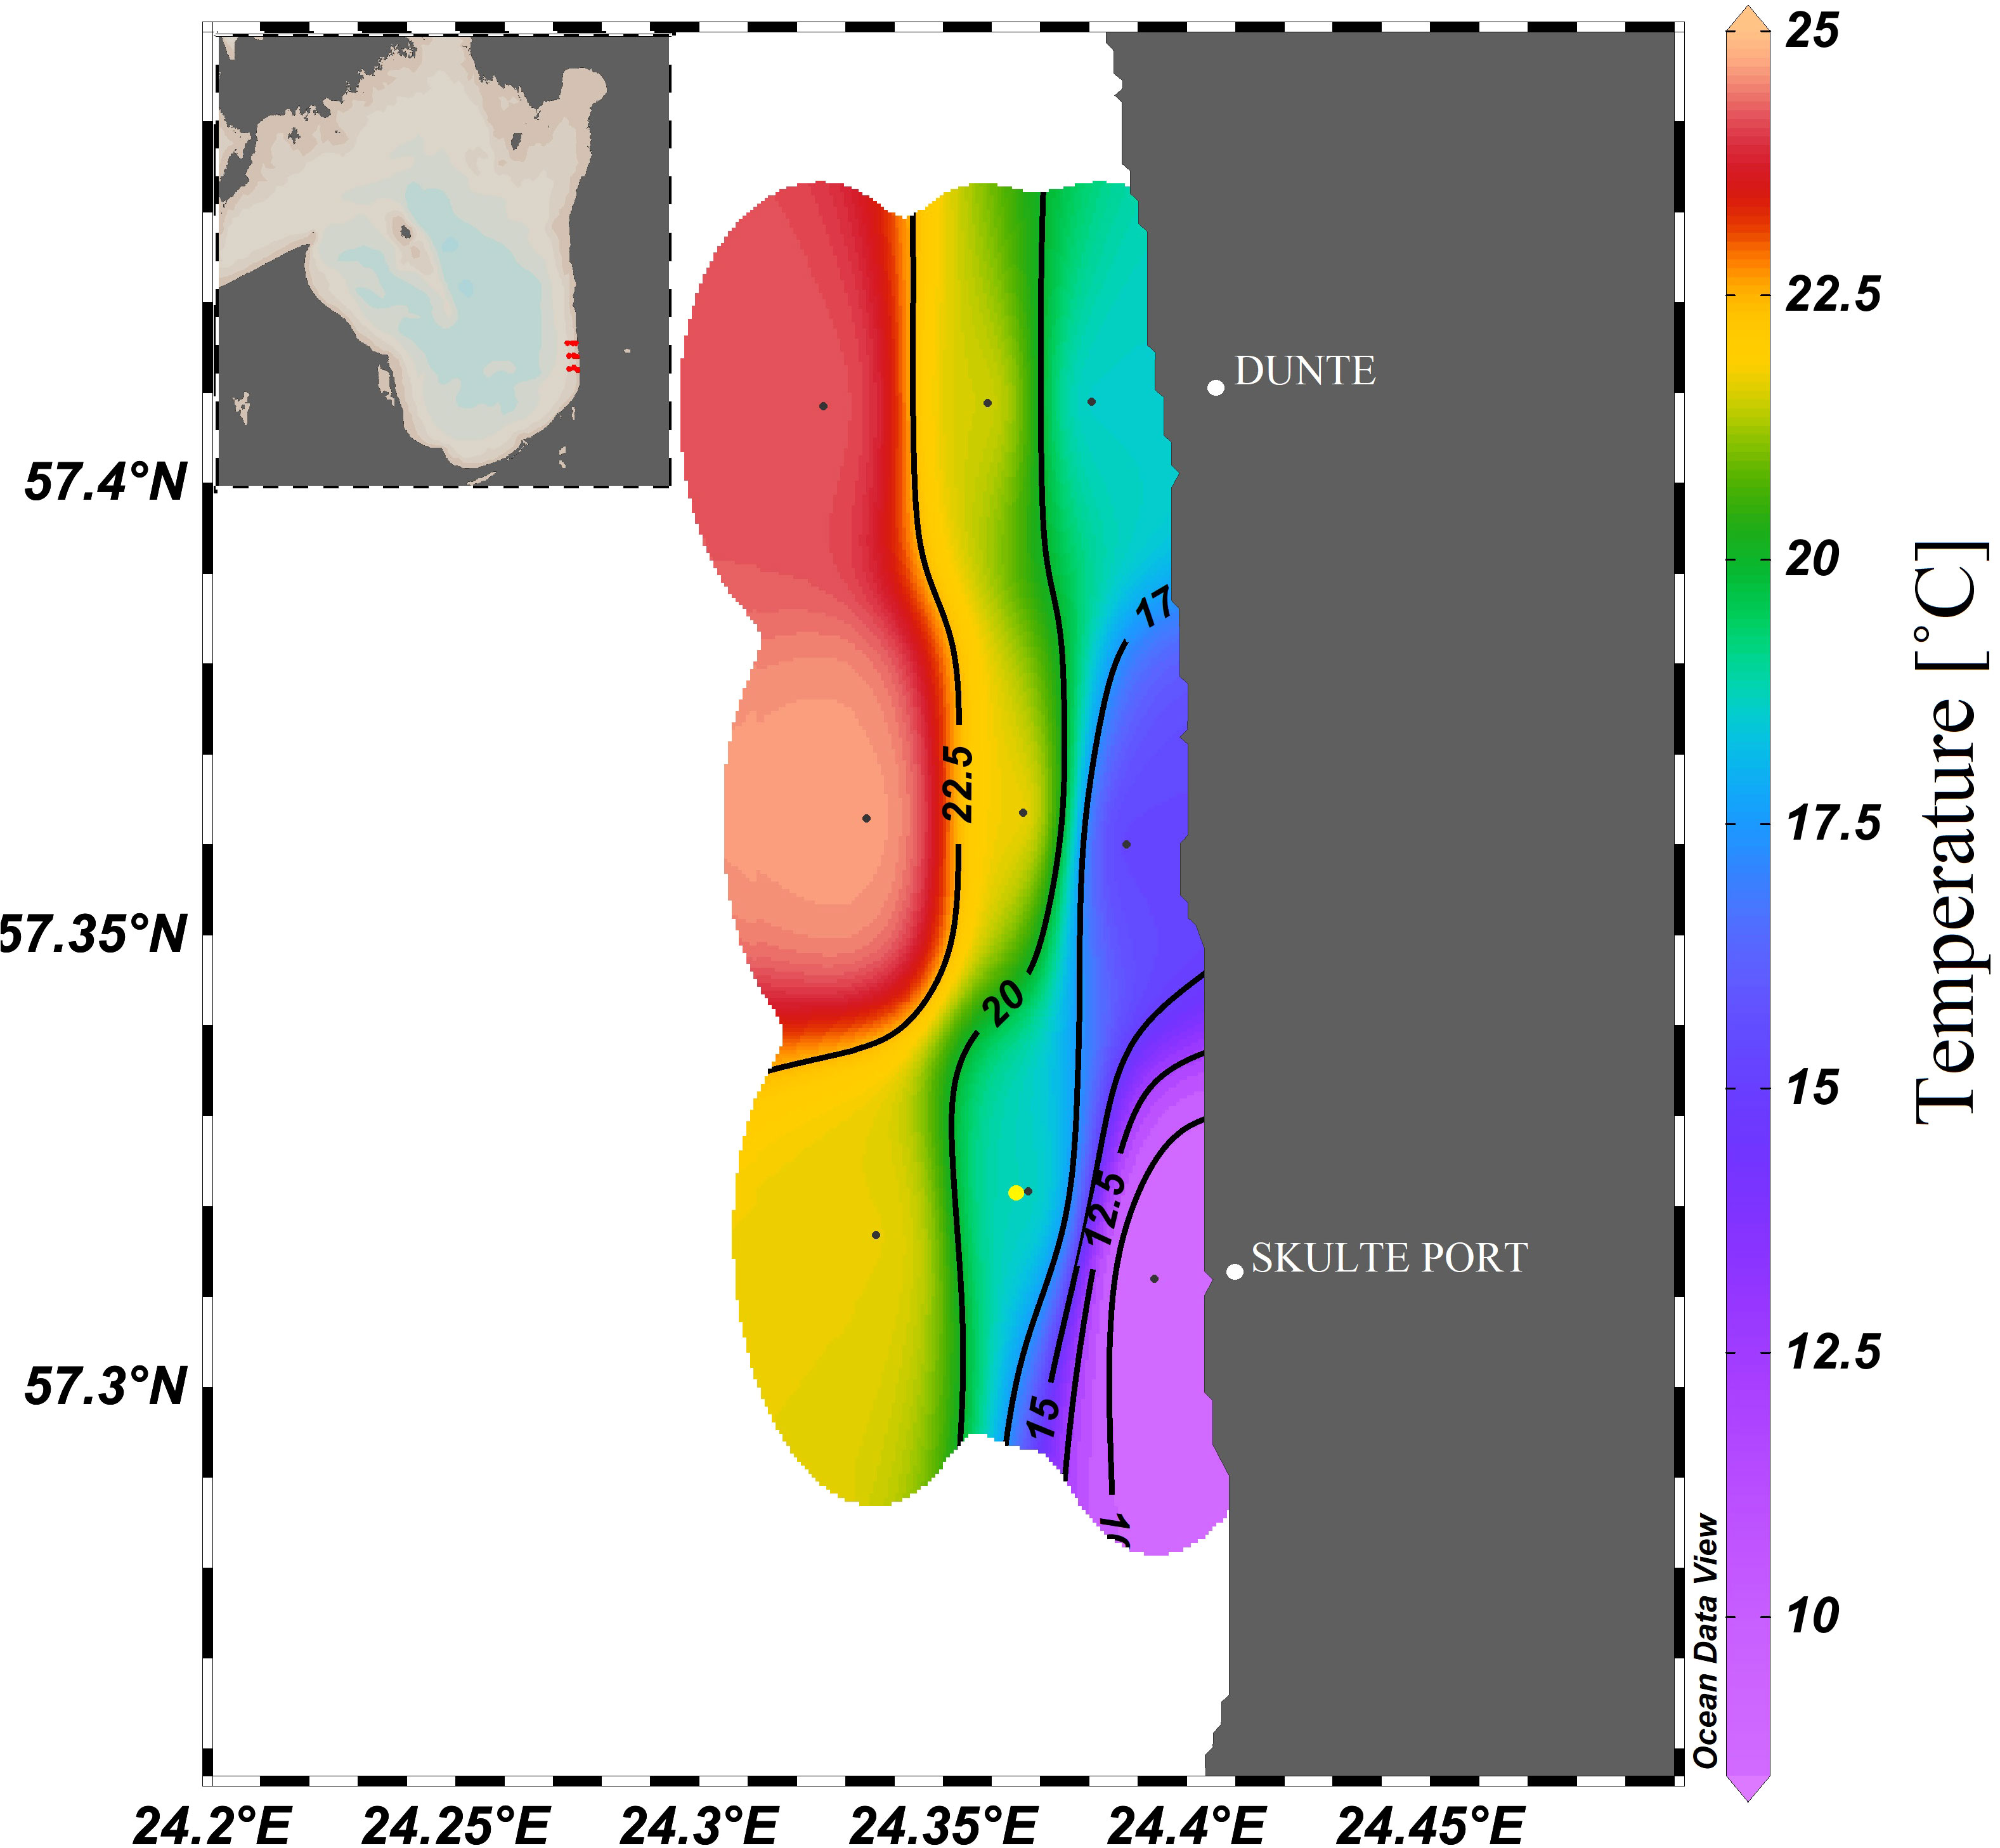
Figure 7 Sea surface temperature from CTD (conductivity, temperature, and depth) during the upwelling on E coast of the Gulf of Riga (GoR) on July 13, 2021. Yellow dot represents the location of Skulte SmartBuoy.
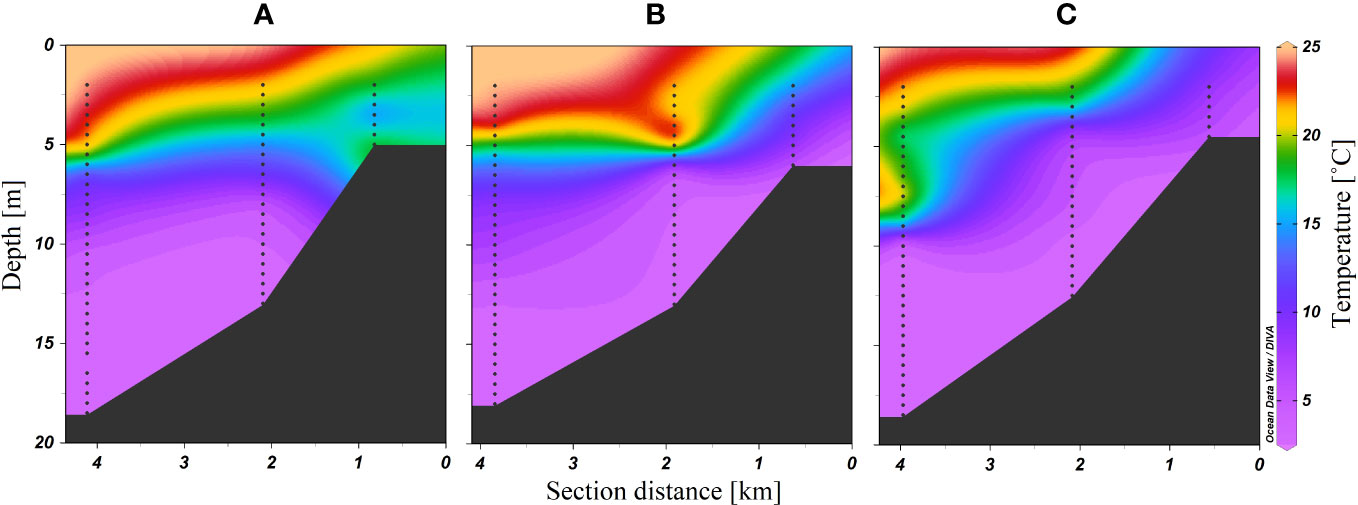
Figure 8 Vertical temperature distribution from CTD (conductivity, temperature, and depth) transects during the upwelling on E coast of the Gulf of Riga (GoR) on July 13, 2021. Station SK17-SK19 (A), SK9-SK11 (B), and SK1-SK3 (C). See station labels in Figure 1.
The simulated SST maps (Figure 9) coincide with the satellite observations reasonably well. The first upwelling event on July 13–19 is not as strong as in the observations; hence, the narrow strip of cold water along the eastern coast is visible only by July 17. As the upwelling develops, the simulated SST continues to decrease, and by July 18, the event is clearly visible in the spatial maps. Interestingly, the event is small, and only less than 3–4 km along the coast is affected by the model output. The second upwelling event along the eastern coast occurred only a couple of days later (July 22) with the rise of northerly winds. Compared to the first event, the area affected during the second event was much larger, and the cold-water batch (temperatures less than 16°C) exceeded more than 10 km to the west and more than 30 km in the south–north direction along the Latvian coast. In addition, the second batch of cold water was located in the west of Pärnu Bay with similar dimensions as the southern batch. Slightly decreased coastal temperatures are seen also along the Saaremaa coast (the northern boundary for the GoR), although the decrease is much smaller compared to the eastern and northeastern coasts.
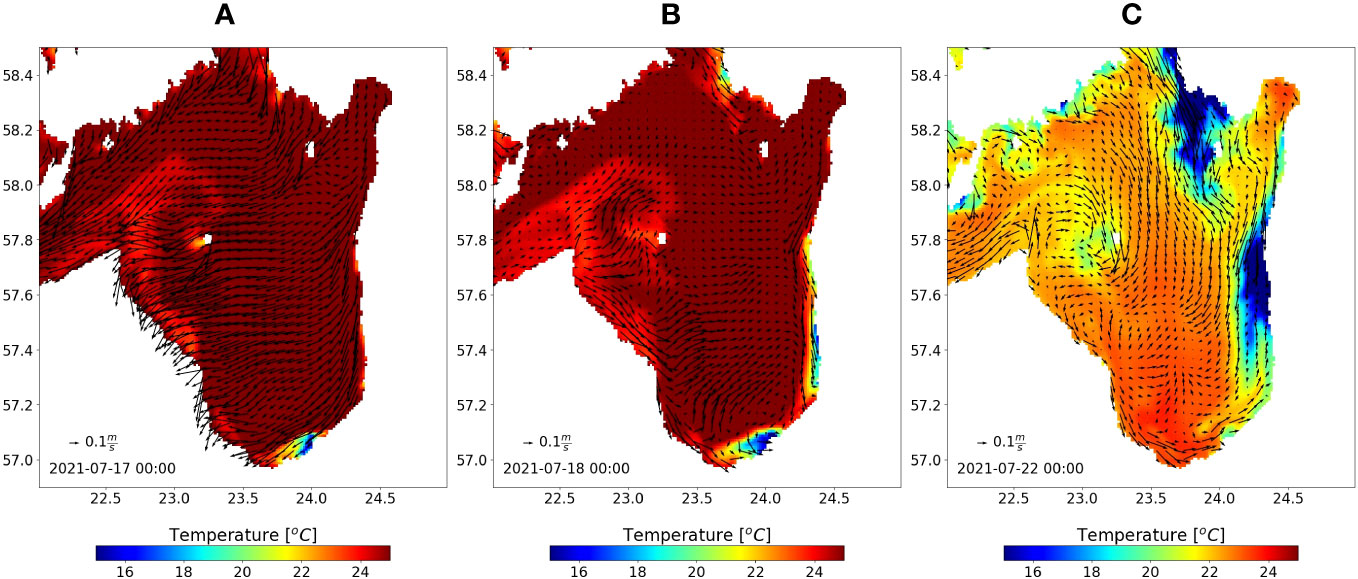
Figure 9 Simulated sea surface temperature from the GETM for July 17 (A), 18 (B), and 22 (C). Arrows indicate the surface currents in the Gulf of Riga (GoR).
3.3.2 August 2021 (SW coast)
This upwelling event was characterized using available measurements from the CTD survey, available satellite data, and model data.
As opposed to July 2021, on August 17, 2021, a rather local upwelling was observed along the SW coast of the GoR spanning for approx. 25 km between Ragaciems and Engure (see Figure 1) with observed SST below 10.0°C. The upwelling-affected area reached approximately 1.5–2.0 km offshore (Figure 10) with higher surface salinity (by at least 0.1 g/kg) as well.
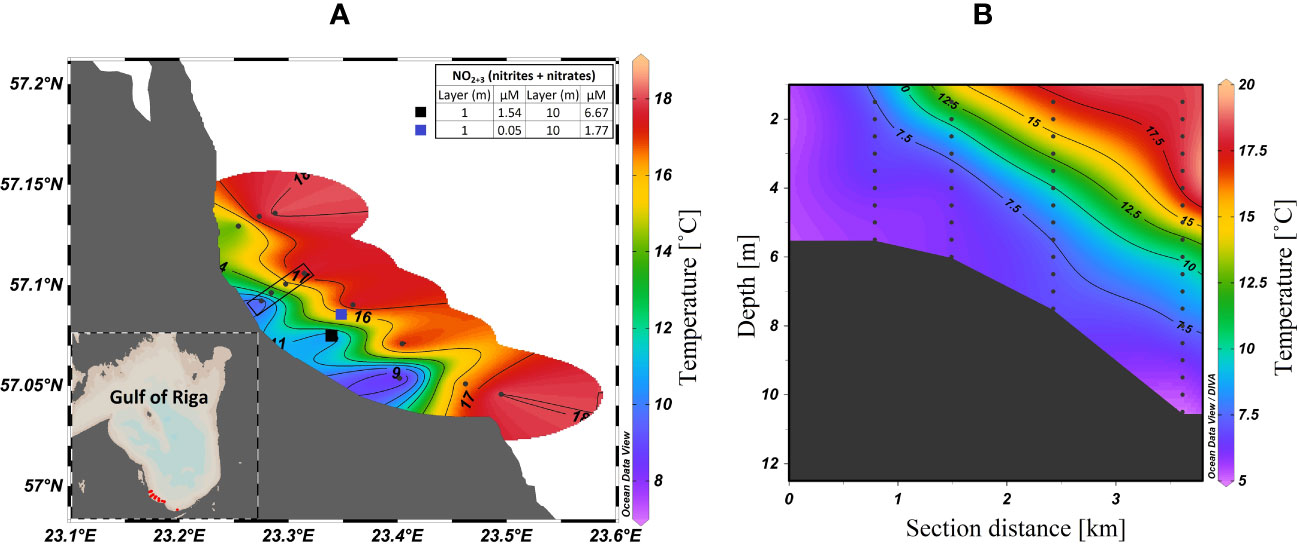
Figure 10 Sea surface temperature (A) and vertical distribution (B) of temperature within CTD (conductivity, temperature, and depth) section (marked as black rectangle) from CTD measurement survey during the upwelling on SW coast of the Gulf of Riga (GoR) on August 17, 2021. Black/blue squares represent the water samples taken inside/outside of the upwelling-affected area.
Satellite data from this specific, local event in August were not available, but collected historical satellite maps revealed that such local upwelling events have occurred in this particular place several times before (Figure 11). In the given examples, the area affected by upwelling (defined as the area with temperature <13.0°C) ranged from approximately 24.0 to 72.0 km2 with offshore distance ranging from 2.5 to 5.0 km at its widest point.
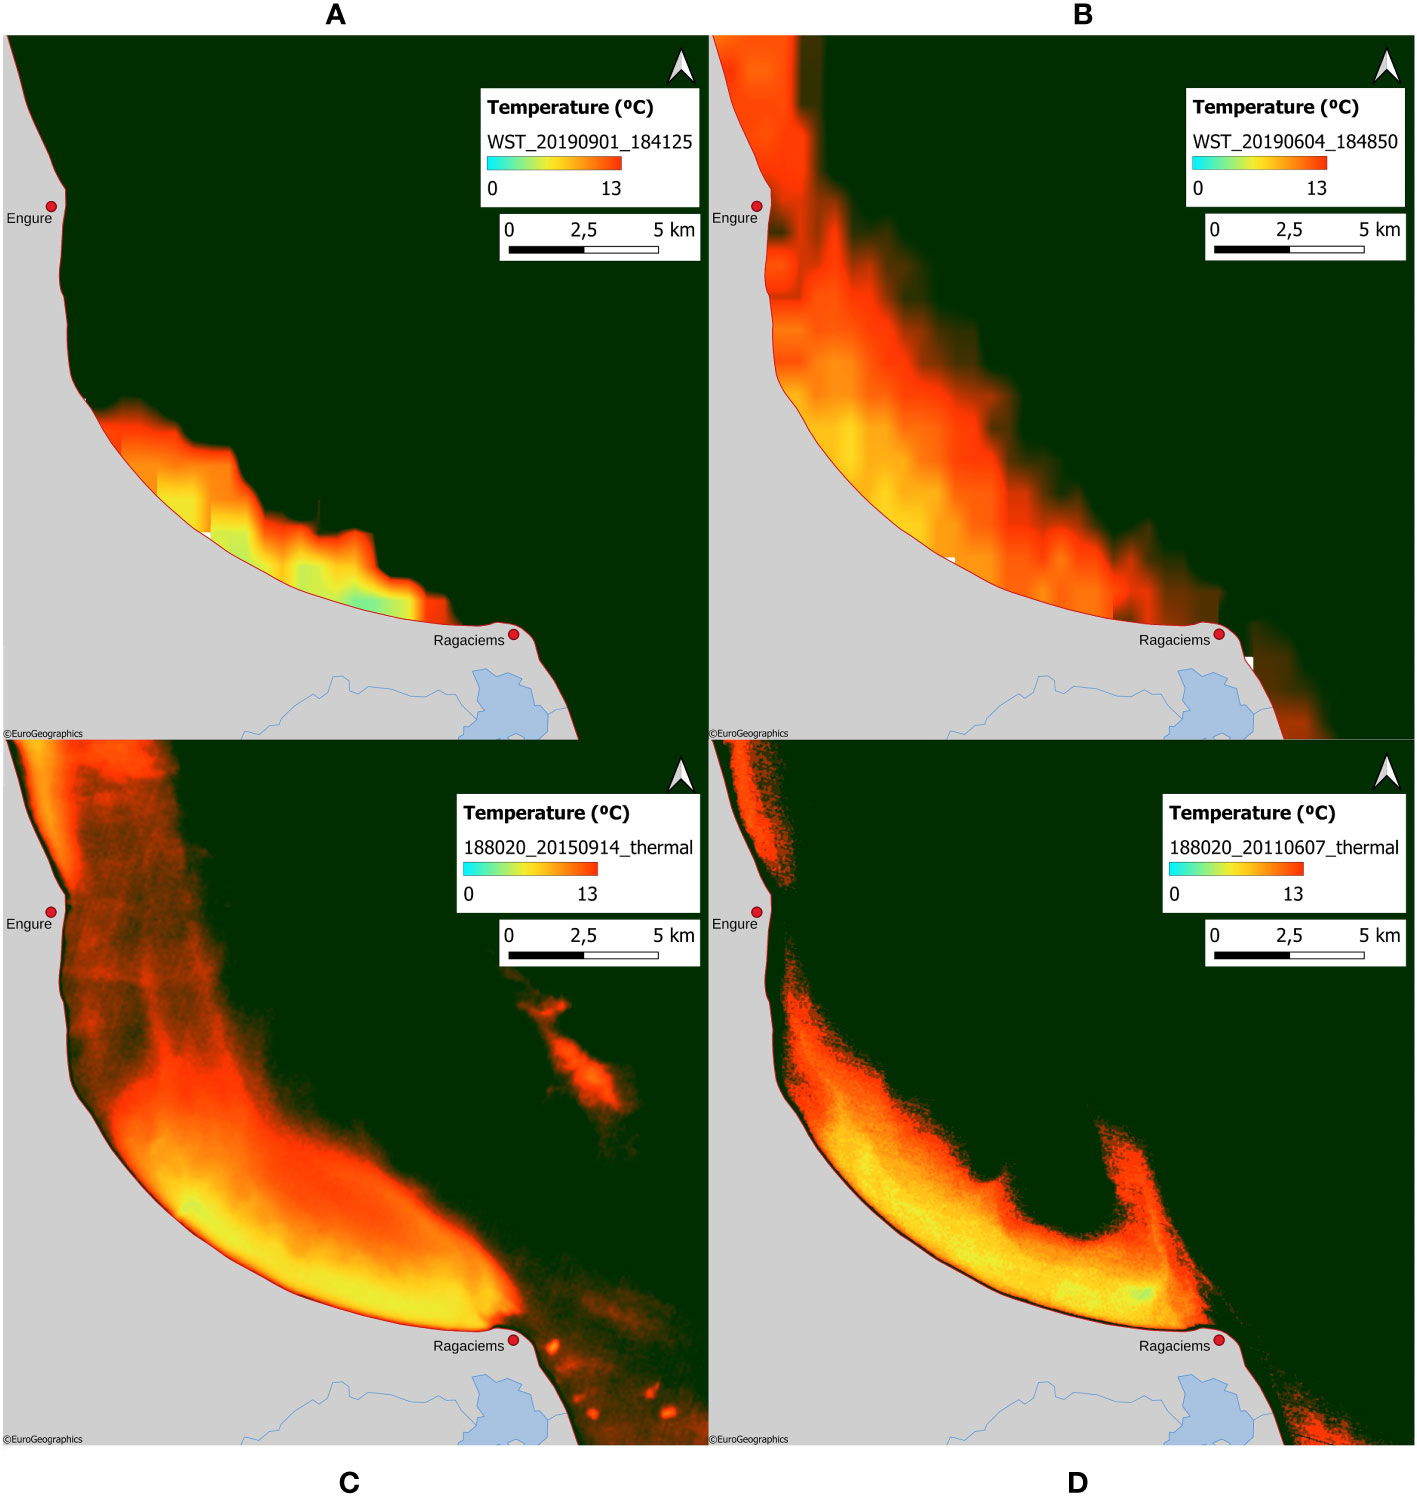
Figure 11 Sea surface temperature from Sentinel-3 (A, B) and Landsat 8 (C, D) satellite data on September 1, 2019 (A), June 4, 2019 (B), September 14, 2015 (C), and June 7, 2011 (D).
The simulated SST maps during different phases of upwelling along the SW part of the GoR are shown in Figure 12. On August 17 (starting phase), cold water emerged only along a narrow coastal zone on the Latvian coast, and somewhat larger upwelling is visible at the northern boundary (southern part of Saaremaa). By August 19 (active phase), the cold water had surfaced along the whole western coastline of the GoR, and also along the northern boundary, the temperatures had reduced further, and the area affected by the upwelling increased. Relaxation of the upwelling is ongoing by August 21 with some filaments of cold water extending toward the center of the basin. Interestingly, both the relaxation and duration of the upwelling were much larger along the Saaremaa coast compared to the Latvian coastline.
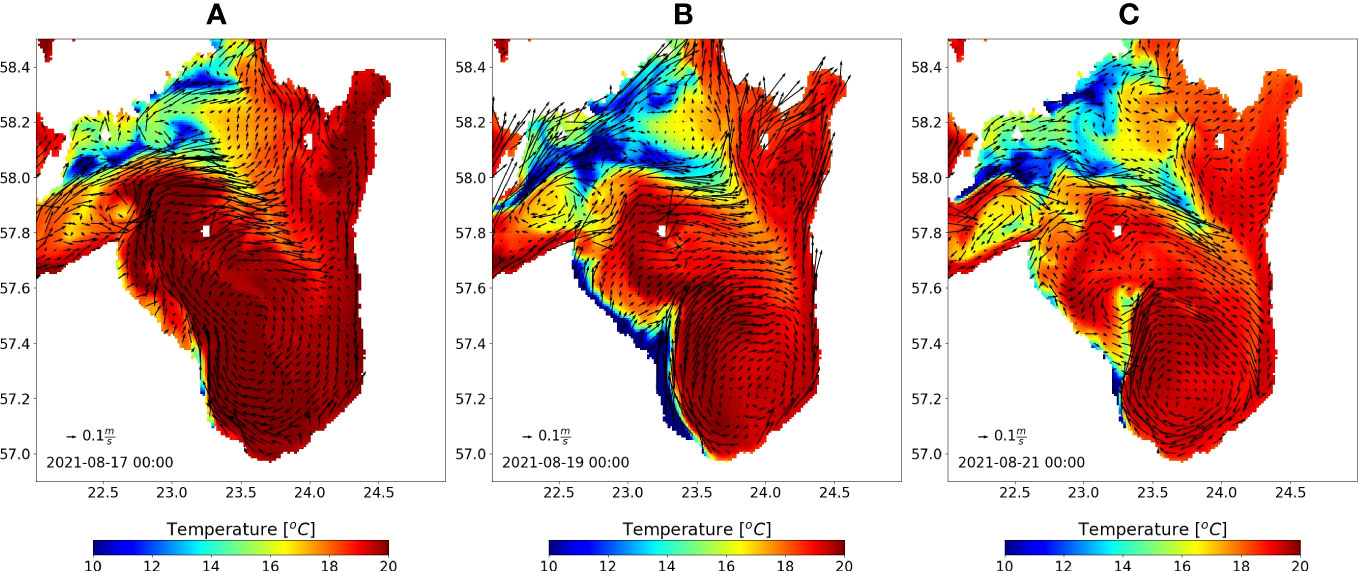
Figure 12 Simulated sea surface temperature (SST) during different phases of upwelling along the western part of the Gulf of Riga (GoR) together with the surface currents (black arrows) for August 17 (A), 19 (B), and 21 (C), 2021.
The vertical distributions of temperature, salinity, and density during different phases of upwelling are shown in Figure 13. During the starting phase, one can observe the tilting of the clines below the surface layer toward the coast and cold-salty-dense water surfacing at the coast. During the active phase, the tilting of the clines remained the same, and a detaching filament with a width of less than 4 km formed. During the relaxation phase, the areas affected by the upwelling have much smaller mixed layer depth—less than 10 m—compared to the open sea areas, where the mixed layer depth is close to 20 m.
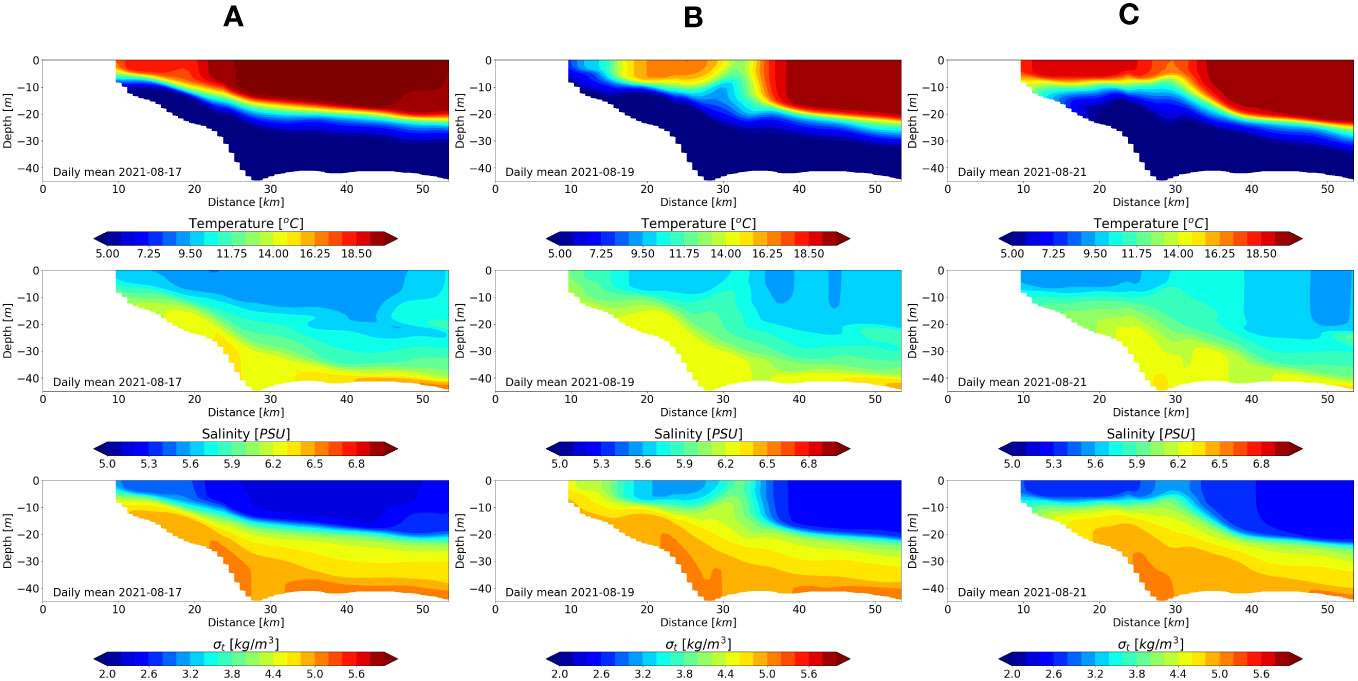
Figure 13 Vertical distributions of temperature, salinity and density from longitudinal transect 22.77-23.66 E and 57.45 N during different phases of upwelling along the western coast of GoR (GoR) for August 17 (A), 19 (B), and 21 (C), 2021.
4 Discussion
Based on the main upwelling regions in the Baltic Sea derived by Bychkova et al. (1988) in relation to weather conditions, the previous studies have shown that upwelling frequency (%) in the GoR is lower (e.g., Lehmann et al., 2012; Bednorz et al., 2021). Our study adds that a quantitative measure for the number of upwelling events in the GoR in 2010–2022 is 9 events/per year on average. Previous results obtained via satellite data (e.g., Bednorz et al., 2021) and model data (e.g., Myrberg and Andrejev, 2003) suggest that upwellings are more frequent on the W coast of the GoR rather than the E coast, which is in accordance with our acquired results based on coastal measurements. Even if we consider the previously mentioned no measurement data from Skulte and Roja and apply the correction based on the average number of events/per year, the total amount of upwelling events in the W coast would yield 71 events as opposed to 55 events in the E coast, with a ratio of 56%:44% in 2010–2022.
It is noteworthy to mention that detected upwelling events along the W coast differed between Mersrags and Roja despite the fact that these locations are only roughly 30 km apart. While in 20 cases upwelling events overlapped between Mersrags and Roja, 32 and 17 events, respectively, were unique in each location. The respective coastal morphology can provide a possible explanation—Mersrags is located in the coastal section whose direction is very close to S–N, whereas Roja is located in the coastal section whose direction is closer to SE–NW (see Figure 1). As an example, upwelling was evident in Roja but absent in Mersrags when the SE winds were blowing. The winds from Mersrags coastal station (results not shown here) revealed more frequent winds from the S direction than SE in 2010–2022, thus providing a plausible explanation of more frequent upwelling events detected in Mersrags than Roja. In conclusion, the W coast of the GoR has a more complex structure than the E coast, and we suggest that together with the prevailing winds in the region (SW, W, see also Supplementary Material, Figure S02), coastal structure and its orientation itself are also reasons why upwelling events are more frequently observed in the W coast than the E coast. In general, Lehmann et al. (2012) concluded the same governing principles on a bigger scale when describing the whole BS region—they showed that upwelling events occurred most frequently along the Swedish east coast and the Finnish coast of the Gulf of Finland (GoF), and upwelling frequencies were related to prevailing wind conditions and the orientation of the coastline with respect to the wind direction. An earlier study by Soomere and Keevallik (2001) of prevailing winds in the Baltic Proper supports this. Furthermore, Uiboupin and Laanemets (2015) concluded that upwellings are more extensive on the N coast than on the S coast of the GoF, which is according to the prevailing wind regime as well. Spatial wind analysis over the GoR in 2010–2022 revealed that directional change is relatively small—the dominant wind direction is SW, which tends to shift to more westerly during the summer time (see Supplementary Material, Figure S01). Thus, it complements the obtained results with more upwelling events on the W coast than the E coast.
On a monthly basis, fewer upwelling events in May can be explained by seasonal variations of temperature in the GoR (e.g., Raudsepp, 2001) when the temperature starts to gradually increase from spring, but the upper mixed layer is still shallow and not so warm; thus, only partially stratified conditions prevail (e.g., Skudra and Lips, 2017). During summer when water masses are well-stratified, the frequency of detected upwelling events in the GoR increased, which is in accordance with other studies from different areas of the Baltic Sea (e.g., Lehmann et al., 2012). In September, detected upwelling events were again scarcer if compared to summer months, which is mostly related to the gradual decrease of temperatures starting from the surface layers. Similar dynamics were described by Dabuleviciene et al. (2018) in a study of the overall number of upwelling events from the water temperature measurements at the Klaipeda monitoring station in the SE Baltic Sea from April to September 2000–2015.
Usually, coastal upwelling is divided into two phases—the active phase when upwelling favorable winds are blowing and cold water reaches the surface layers, and the relaxation phase when winds are reduced but strong temperature gradients in the sea exist. During the second phase, it is common that due to the baroclinic instability in the coastal upwelling jet filaments, squirts and eddies are formed (e.g., Zhurbas et al., 2008; Laanemets et al., 2011; Väli et al., 2017). The present study defined the Start/End, AUP (active upwelling phase), MIN (minimum temperature during upwelling), and RP (relaxation phase) points of each upwelling event based on coastal in-situ measurements. This approach allowed also us to judge how fast the upwelling evolves and for how long each of the phases lasts, something which has not been performed in the GoR and, to our knowledge, not published in the BS region as well.
The general warming of water masses and consistency with the annual cycle of air–sea heat exchange explains also the whole length of the upwelling events—in May and June, upwelling events were almost 20 h shorter than in July–September (e.g., Skudra and Lips, 2017). The mean RP length also gradually increased in May–September and in that sense was similar (R2 = 0.74) to what was observed regarding the whole length of the upwelling events. We suggest that the longer an upwelling event lasts, the more the colder water masses reach the surface layers, and it takes more time for the system to return to the initial conditions during the relaxation phase. Unlike the length of the whole upwelling event and RP length, we observed that the AUP and the evolvement (how rapidly upwelling formed) length were variable between different months, which suggests that these parameters are more dependent on specific/local conditions like coastal morphology and respective wind conditions.
Summer upwelling events in the W (Mersrags, Roja) and E (Skulte) coasts had similarities regarding the mean length of AUP and evolvement length, whereas upwelling events themselves lasted longer in the E coast and were accompanied by at least 1.3°C higher maximum temperature drop than in the W coast upwellings. Higher maximum temperature drop amplifies the previously mentioned explanation, and we suggest that this is due to longer upwellings in the E coast. It is noteworthy to mention that in specific cases, Mersrags (W coast) was more comparable to Skulte (E coast) than to Roja (W coast). For example, an increase of maximum temperature drop during the upwelling events with increasing total length of the event itself was persistent in Skulte and Mersrags but was absent in Roja. Similarly, Skulte and Mersrags were more similar when looking at the RP length and total event length relation mentioned before. Thus, this demonstrates how locally different upwelling characteristics might be despite the fact that Roja and Mersrags are only roughly 30 km apart. Similarities between Mersrags and Skulte might hint that the orientation of the coastline could explain these differences between Roja and Mersrags—Roja is oriented in the SE–NW direction, whereas Mersrags and Skulte are oriented in the S–N direction. Spatial analysis of wind patterns over the GoR (see Supplementary Material, Figure S01) did not reveal substantial differences between the cells where Mersrags and Roja are located. Thus, we suggest that the orientation of the coastline is the most probable reason for the differences between Mersrags and Roja. Nevertheless, the upwelling favorable wind direction is different for each of these three stations. More detailed statistical analysis not performed within this research (e.g., multivariate analysis) would be welcome in order to address this question thoroughly. In addition, the dynamics of water mass offshore transport would be another factor, which might highlight the possible differences between both coasts during the upwelling events, although this was not explored in detail within the scope of this research.
The length of different upwelling phases indicated on presence of various types of upwelling events—from 12 to 328 h for whole upwelling length to almost all possible combinations regarding RP and evolvement length. There were upwelling events with rapid evolvement and rapid RP (with and without AUP), rapid evolvement but steady or gradual/slow RP, and, finally, with steady/slow evolvement but rapid RP. The slow evolvement of the upwelling event was the rarest case, and only in seven out of 93 events, the time it took for the upwelling to evolve exceeded 48 h (average 26 h). We suggest that such conditions would develop in case of rather slow winds (3–4 m/s) blowing for several days with upwelling favorable wind direction, which was evident, for example, in Skulte on May 23–26, 2012 (N–NE winds, 3–4 m/s), in Roja on August 3–7, 2014 (E–SE winds, 3 m/s), and in Mersrags on August 17–21, 2021 (S–SW winds, 3–4 m/s). An interesting feature was that in roughly 30% of all upwelling events, there was no defined AUP as temperature immediately increased after it reached the minimum value. Only in three cases out of 22 from Roja and Mersrags (W coast) was an event with no observed AUP also detected in other locations, but all other events without AUP are unique only for Roja/Mersrags. Further analysis of wind data from Mersrags showed that almost all of these upwelling events without AUP are coupled with distinct wind direction changes. In the case of Roja, the wind direction changed from SW to SE and back to SW after the upwelling event. Thus, SE wind direction created the most favorable conditions (parallel to the coast) for upwelling in Roja, but the event relaxed after the subsequent changes in wind direction, whereas in Mersrags, more southerly winds were evident prior to and during the evolvement of upwelling before further relaxation. We suggest that upwelling events with no AUP are mostly characteristic of a specific location or section of the coastline (example of Roja and Mersrags) and are mainly governed by the induced change of wind direction.
Coastal sea surface temperature measurements from Skulte allowed us to determine that upwelling from the case study on the E coast of the GoR lasted from July 13 to 19, 2021. Measurements from the Skulte SmartBuoy revealed that temperature dynamics during this upwelling event were different than those observed at the coast. Based on the findings presented in this paper, it could be argued that pronounced temperature variability at the beginning of the upwelling event is caused by the lateral movement of colder water masses (in the form of filaments or squirts) from coastal areas amid regular, warm water masses in the respective SmartBuoy location at 2.5 km offshore. This type of mechanism is shown to be typical for the BS region (see references further below regarding baroclinic instability and filaments/squirts). The filtered time series with a cutoff period of 14.6 h filtered the SmartBuoy SST fluctuations only partially, whereas with a cutoff period of 16.6, the filtered time series filtered the SmartBuoy SST fluctuations thoroughly. Thus, it confirms that these fluctuations are not only related to inertial oscillations (as the period is higher) but are strongly affected by the lateral movement of water masses as well. CTD casts collected near the SmartBuoy and Skulte port entrance seem to confirm this, as temperature values obtained were similar to SmartBuoy and coastal station results. When the event became stronger (July 16), the temperature variability also decreased offshore at the location of the SmartBuoy. CTD profiling performed on July 13 suggests that upwelling was just starting to develop, as low temperatures (8.8°C) were observed only in the vicinity of Skulte port, but the 2-km offshore temperature was still rather high. More importantly, temperatures were significantly higher also 5 km and 10 km alongshore to the N from Skulte port, indicating that upwelling was not developed there yet or was evident only in a very narrow band (a few hundred meters) along the coastline. These observations suggest that there was also an alongshore gradient with the epicenter of upwelling close to Skulte port or the S along the coastline. Available satellite data on the evening of July 16 and 17 depicting the middle of the upwelling event revealed that during roughly 24 h, the affected area size increased by approximately 250 km2 and by approximately 50 km alongshore.
On July 22, 2021, the upwelling signal was not evident from the Skulte coastal measurements, and one would assume that it should not be anticipated throughout the whole E coast of the GoR, as the coastline here is not so complex as in the W part of the gulf. Following this path, the observations at first sight may be misleading, as a rather distinct upwelling was visible from satellite data near and offshore of Salacgriva, as well as in the area around Kihnu Island, N part of the gulf. This time satellite data matched reasonably well with the model output, and, indeed, in both outputs, there was no upwelling signal in the Skulte region. Although we used the temperature data from Salacgriva coastal station only for quantitative analysis due to the station’s location rather deep inside the river mouth, the upwelling signal was detected, and it confirmed the results from the model and satellite data from July 22. Considering the preceding upwelling event along the E coast on July 13–19 (which was detected from Salacgriva measurements as well), we speculated that July 22 marked the second upwelling event or even the continuation of the preceding event. That would explain why we saw lower temperatures from satellite data more offshore (part of which might be from the preceding event) of Salacgriva on July 22 if compared to July 17. In addition, on July 22, the wind speed was 7–9 m/s, approximately 3–4 m/s higher than on July 13–19, which would amplify the offshore transport of previously upwelled water. Moreover, yellowish-orange formations in the satellite data can be seen further offshore from Skulte on July 22, which resemble the possible structure of filaments, which, in turn, are a common offshore feature related to upwelling events in the Baltic Sea region (e.g., Zhurbas et al., 2008; Laanemets et al., 2011) as well as globally (Hösen et al., 2016; Zaba et al., 2021). Judging by the distance from the coast, these formations would be associated with the upwelling event on July 13–19 and would vividly demonstrate the transport of water masses (with lower temperatures than the ambient area) induced by the upwelling event.
The upwelling event on August 17, 2021, represents a more local event in the small gulf-like curve of the coastline in the SW part of the GoR. Performed CTD casts allowed to capture the whole area of this rather small upwelling event with lower chlorophyll a concentrations (approx. 0.5 mg/m3) and considerably higher total nitrogen concentration (30-fold) in the surface layers than in surface layers outside of the upwelling. Unfortunately, no temperature time series from coastal measurements or satellite data were available for this place/time, but model output provided insights regarding the length of the event and the size of the potentially affected area. In addition, historical satellite data revealed that these rather local upwelling events are quite strong and typical for this location. Three historical upwelling events shown here were characterized by predominant E–SE wind direction resembling the orientation of the coastline. On June 4, 2019, the predominant wind direction was SE–S, which explains why the upwelling signal was evident further N alongshore till the Mersrags (not shown here but visible from the full domain map).
Regarding the model output, the upwelling case studies from 2021 indicate the importance of simulating the vertical thermal stratification correctly in order to capture the upwelling with the simulations correctly. Obviously, the model captured the second upwelling along the eastern coast in July and the August upwelling along the western coast well, but it did not really capture the first eastern coast upwelling very well. Most likely, the reason is the too-deep thermocline in the model; i.e., the cold water that emerged during upwelling never reached the surface, and also during the first upwelling, the wind speeds were the smallest.
Another interesting feature revealed by the case studies is the small impact of upwelling in the GoR on salinity distribution. Namely, in Väli et al. (2017), it was shown that the upwellings in the GoF can either produce strong or weak lateral density gradients in the surface layer depending on the contribution of the salinity to the density. If the upwelling had produced only temperature gradients and no or weak salinity gradient (no density gradient), then the emergence of submesoscale features was missing, and as soon as there were also density gradients, submesoscale features emerged also in the surface layers during the relaxation phase of the upwelling. The results from the simulations indicate a rather small lateral density and salinity gradients in the sea surface, meaning that the conditions for the occurrence of baroclinic instabilities (e.g., Zhurbas et al., 2006), i.e., formation of the eddies, are rather small, and this could explain rather fast upwelling relaxation in the basin. From model results, it was possible to see filaments; nevertheless, we have to bear in mind that the GoR is a much shallower water basin if compared to the GoF and also shaped like a bowl. The number of eddies that could fit in this bowl is definitely smaller, and, therefore, we suggest that the mesoscale features occurring in the GoR are different compared to the GoF and even more in locations outside the BS where different atmospheric forcing and climate modes prevail (e.g., Mandal et al., 2021).
Climate change predictions regarding the BS region have a possible impact on the GoR as well. Although there is no direct linkage between climate change and possible changes in the upwelling dynamics, climate change research projects further air/water temperature increase, shallower mixed layer, sharper thermocline during summer, changing seasonality in river runoff, milder winters with less snow, etc. (Meier et al., 2022a; Meier et al., 2022b). Considering all the mentioned factors, we suggest that stratification will form earlier in the GoR; thus, upwelling events might occur earlier increasing the total amount observed during the warm season. Because of large internal variability, it is unclear whether there is an overall trend in mean wind speed. There has been an increase in the number of deep cyclones over central and northern Europe but no evidence of a long-term trend (Meier et al., 2022b).
The North Atlantic Oscillation (NAO) is the dominant mode of near-surface pressure variability over the North Atlantic. During the positive (negative) phase of the NAO, the Icelandic Low and Azores High pressure systems are stronger (weaker), leading to a stronger (weaker) than normal westerly flow (Hurrell, 1995). According to the review by Meier et al. (2022b) about the future climate change regarding large-scale atmospheric circulation, the NAO is very likely to continue to exhibit large natural variations similar to those observed in the past. In response to global warming, it is likely to become slightly more positive (associated with mild temperatures and increased precipitation and storminess) on average, which complements earlier studies about climate variability in the BS region (e.g., Lehmann et al., 2011). If we assume that the positive phase of the NAO will increase, we suggest the change of existing upwelling ratio between the two coasts favoring even more upwelling events on the W coast.
For future considerations, zooplankton, phytoplankton, and nutrient data, collected in and outside of the upwelling-affected area within this study (through targeted sampling surveys in 2021 and 2022, not described here in detail), will allow us to analyze the mutual relationships between upwelling and biogeochemistry and implications for ecosystem itself. Because their size upwellings are not so decisive for ecosystem productivity in the GoR as in the world’s most known upwelling areas (García-Reyes et al., 2015), still, coastal areas show certain distinctions with more offshore areas of the Gulf for both phytoplankton and zooplankton communities (Jurgensone et al., 2011; Labuce et al., 2021), and the role of upwelling has never been assessed for these discrepancies. Other studies of upwellings in the GoF have highlighted the importance of phosphate transport from deeper layers to the nutrient-depleted surface during upwelling for cyanobacterial blooms (e.g., Zhurbas et al., 2008; Laanemets et al., 2009 and Laanemets et al., 2011; Väli et al., 2011). Offshore transport (Ekman transport) and/or cross-shore (using model data) transport calculations could be applied to demonstrate the dynamic processes during upwellings, especially in those events where in-situ or remote measurements allow the analysis of all areas affected by the upwellings. Regarding the more local upwelling events described also within this study, we can suggest that model resolution should be higher (at least 250 m) in order to obtain more detailed and relevant results. The same approach applies to the satellite data. Finally, predicted water temperature increase and seasonal changes in the river runoff due to climate change (BACC, 2015) will potentially result in a stronger and earlier stratification in the GoR region—a precondition for possibly more frequent, stronger, and earlier upwelling events, which would only increase the role and significance of this process. The latest review on oceanographic regional climate projections for the Baltic Sea until 2100 (Meier et al., 2022a) indicates an increase in the occurrence of marine heat waves in the GoR. With longer and stronger upwellings, this heat wave tendency in the GoR could be disrupted, only strengthening the need to follow upwelling events for better local and regional projections.
In conclusion, we described and characterized the upwelling events in the GoR in 2010–2022 based on historical data and performed measurements in 2021 and 2022 with emphasis on the in-situ data, including the SmartBuoy data series, which has not been widely used in the Baltic Sea region in relevance to the scientific research. We showed that upwellings occur more often on the W coast than the E coast, whereas on the E coast, they tend to be longer and with higher temperature drops. Wind patterns showed prevailing W–SW winds over the GoR for the study period. For the first time in the GoR studies, we parametrized and analyzed specific phases of the upwelling events from coastal measurements to ascertain the dynamic nature and different types of upwelling events, even along the same sections or parts of the coastline. This approach has been limited also in other studies regarding the Baltic Sea region, as the majority of upwelling-related studies concentrate more on remote sensing data, model data, or a combination of both. Nevertheless, through case studies, we showed that using multiple data acquisition methods or maximum available data increases the quality of analysis (as each method has its own shortcomings), especially regarding such dynamic phenomena as upwelling, which has the potential to substantially influence the local ecosystem. Thus, we suggest that this study could serve as a basis for further upwelling-related ecosystem studies in the GoR and similar water bodies.
Data availability statement
The raw data supporting the conclusions of this article will be made available by the authors, without undue reservation.
Author contributions
MS, GV, AI and MP contributed to conception and design of the study. MS organized the database. MS, GV, MP performed the data analysis. MS wrote the first draft of the manuscript. MS, GV, AI, and MP wrote sections of the manuscript. All authors contributed to manuscript revision, read, and approved the submitted version.
Funding
The author(s) declare financial support was received for the research, authorship, and/or publication of this article. This work was funded by the European Regional Development Fund, 1.1.1.2/16/l/001 Post-doctoral project No.1.1.1.2/VIAA/4/20/733. GV was supported by the Estonian Science Council (grant number PRG602). Computational resources from the HPC centers of Tallinn University of Technology and Tartu University are gratefully acknowledged.
Conflict of interest
The authors declare that the research was conducted in the absence of any commercial or financial relationships that could be construed as a potential conflict of interest.
Publisher’s note
All claims expressed in this article are solely those of the authors and do not necessarily represent those of their affiliated organizations, or those of the publisher, the editors and the reviewers. Any product that may be evaluated in this article, or claim that may be made by its manufacturer, is not guaranteed or endorsed by the publisher.
Supplementary material
The Supplementary Material for this article can be found online at: https://www.frontiersin.org/articles/10.3389/fmars.2023.1244643/full#supplementary-material
References
BACC (2015). Second assessment of climate change for the baltic sea basin (Geesthacht: SpringerOpen), 69–263.
Bednorz E., Czernecki B., Półrolniczak M., Tomczyk A. M. (2018). Atmospheric forcing of upwelling along the south-eastern Baltic coast. Baltica 31 (1), 73–85. doi: 10.5200/baltica.2018.31.07
Bednorz E., Półrolniczak M., Czernecki B., Tomczyk A. M. (2019). Atmospheric forcing of coastal upwelling in the southern baltic sea basin. Atmosphere 10 (6), 327. doi: 10.3390/atmos10060327
Bednorz E., Półrolniczak M., Tomczyk A. M. (2021). Regional circulation patterns inducing coastal upwelling in the Baltic Sea. Theor. Appl. Climatology 144, 905–916. doi: 10.1007/s00704-021-03539-7
Berzinsh V. (1980). Interannual and seasonal changes of water salinity in the Gulf of Riga. Rybokhozyaistvennye issledovaniya (Balt-NIIRKH) 15Avots. (Riga: Avots) 3–12, in Russian.
Berzinsh V. (1995). “Hydrology,” in Ecosystem of the gulf of riga between 1920 and 1990, vol. 7-32 . Ed. Ojaveer O. (Tallinn: Estonian Acad. Publ.).
Burchard H., Bolding K. (2002). GETM, A general estuarine transport model: scientific documentation. (Ispra: Joint Research Centre).
Bychkova I., Viktorov S., Shumakher D. A. (1988). A relationship between the large-scale atmospheric circulation and the origin of coastal upwelling in the Baltic Sea. Meteorol. Gidrol 10, 91–98.
Dabuleviciene T., Kozlov I., Vaiciute D., Dailidiene I. (2018). Remote sensing of coastal upwelling in the south-eastern baltic sea: statistical properties and implications for the coastal environment. Remote Sensing 11, 1752. doi: 10.3390/rs10111752
Dabuleviciene T., Vaiciute D., Kozlov I. (2020). Chlorophyll-a variability during upwelling events in the south-eastern baltic sea and in the curonian lagoon from satellite observations. Remote Sensing 21, 3661. doi: 10.3390/rs12213661
Delpeche-Ellmann N., Dabuleviciene T., Soomere T. (2017). Examining Lagrangian surface transport during a coastal upwelling in the Gulf of Finland, Baltic Sea. J. Mar. Syst. 171, 21–30. doi: 10.1016/j.jmarsys.2016.10.007
Delpeche-Ellmann N., Soomere T. (2018). Possible Presence of Shear Instabilities at Steep Slopes during an Upwelling Event in the Gulf of Finland, Baltic Sea. J. Coast. Res. 85, 481–485. doi: 10.2112/SI85-097.1
Ekman V. (1905). On the influence of the earth’s rotation on ocean currents. Ark. Mat. Astron. Fys. 2, 1–53.
Elken J., Raudsepp U., Lips U. (2003). On the estuarine transport reversal in deep layers of the Gulf of Finland. J. Sea Res. 49 (4), 267–274. doi: 10.1016/S1385-1101(03)00018-2
García-Reyes M., Sydeman W. J., Schoeman D. S., Rykaczewski R. R., Black B. A., Smit A. J., et al. (2015). Under pressure: climate change, upwelling, and eastern boundary upwelling ecosystems. Front. Mar. Sci. 2. doi: 10.3389/fmars.2015.00109
Gräwe U., Holtermann P., Klingbeil K., Burchard H. (2015). Advantages of vertically adaptive coordinates in numerical models of stratified shelf seas. Ocean Model. 92, 56–68. doi: 10.1016/j.ocemod.2015.05.008
Gurova E., Lehmann A., Ivanov A. (2013). Upwelling dynamics in the Baltic Sea studied by a combined SAR/infrared satellite data and circulation model analysis. Oceanologia 55 (3), 687–707. doi: 10.5697/oc.55-3.687
Hersbach H., Bell B., Berrisford P., Hirahara S., Horányi A., Muñoz-Sabater J., et al. (2020). The ERA5 global reanalysis. Q. J. R. Meteorological Soc. 146, 1999–2049. doi: 10.1002/qj.3803
Hösen E., Möller J., Jochumsen K., Quadfasel D. (2016). Scales and properties of cold filaments in the Benguela upwelling system off Lüderitz. J. Geophysical Research: Oceans 121 (3), 1896–1913. doi: 10.1002/2015JC011411
Hurrell J. W. (1995). Decadal trends in the North Atlantic Oscillation: regional temperatures and precipitation. Science-AAAS-Weekly Paper Edition 269 (5224), 676–679. doi: 10.1126/science.269.5224.676
Jurgensone I., Carstensen J., Ikauniece A., Kalveka B. (2011). Long-term changes and controlling factors of phytoplankton community in the gulf of riga (Baltic sea). Estuaries Coasts 34 (6), 1205–1219. doi: 10.1007/s12237-011-9402-x
Kikas V., Lips U. (2016). Upwelling characteristics in the Gulf of Finland (Baltic Sea) as revealed by Ferrybox measurements in 2007–2013. Ocean Sci. 12 (3), 843–859. doi: 10.5194/os-12-843-2016
Klingbeil K., Lemarié F., Debreu L., Burchard H. (2018). The numerics of hydrostatic structured-grid coastal ocean models: State of the art and future perspectives. Ocean Model. 125, 80–105. doi: 10.1016/j.ocemod.2018.01.007
Kowalewska-Kalkowska H., Kowalewski M. (2019). Combining satellite imagery and numerical modelling to study the occurrence of warm upwellings in the southern baltic sea in winter. Remote Sens. 11 (24), 2982. doi: 10.3390/rs11242982
Krek A. V., Krek E. V., Danchenkov A. R., Krechik V. A., Kapustina M. V. (2021). The role of upwellings in the coastal ecosystem of the Southeastern Baltic Sea. Regional Stud. Mar. Sci. 44 (1), 101707. doi: 10.1016/j.rsma.2021.101707
Laanemets J., Väli G., Zhurbas V., Elken J., Lips I., Lips U. (2011). Simulation of mesoscale structures and nutrient transport during summer upwelling events in the Gulf of Finland in 2006. Boreal Environ. Res. 16 (A), 15–26.
Laanemets J., Zhurbas V., Elken J., Nyman E. (2009). Dependence of upwelling-mediated nutrient transport on wind forcing, bottom topography and stratification in the Gulf of Finland: Model experiments. Boreal Environ. Res. 14 (1), 213–225.
Labuce A., Ikauniece A., Jurgensone I., Aigars J. (2021). Environmental impacts on zooplankton functional diversity in brackish semi-enclosed gulf. Water 13 (14), 1881. doi: 10.3390/w13141881
Lehmann A., Getzlaff K., Harlaβ J. (2011). Detailed assessment of climate variability in the Baltic Sea area for the period 1958 to 2009. Climate Res. 46 (2), 185–196. doi: 10.3354/cr00876
Lehmann A., Myrberg K. (2008). Upwelling in the baltic sea — A review. J. Mar. Syst. 74 (Supplement), s3–s12. doi: 10.1016/j.jmarsys.2008.02.010
Lehmann A., Myrberg K., Höflich K. (2012). A statistical approach to coastal upwelling in the Baltic Sea based on the analysis of satellite data for 1990–2009. Oceanologia 54 (3), 369–393. doi: 10.5697/oc.54-3.369
Leppäranta M., Myrberg K. (2009). Physical oceanography of the baltic sea (Chichester: Praxis Publishing Ltd). doi: 10.1007/978-3-540-79703-6
Liblik T., Väli G., Lips I., Lilover M.-J., Kikas V., Laanemets J. (2020). The winter stratification phenomenon and its consequences in the Gulf of Finland, Baltic Sea. Ocean Sci. 16 (6), 1475–1490. doi: 10.5194/os-16-1475-2020
Liblik T., Väli G., Salm K., Laanemets J., Lilover M.-J., Lips U. (2022). Quasi-steady circulation regimes in the Baltic Sea. Ocean Sci. 18 (3), 857–879. doi: 10.5194/os-18-857-2022
Lips U., Lilover M.-J., Raudsepp U., Talpsepp L. (1995). “Water renewal processes and related hydrographic structures in the Gulf of Riga,” in Hydrographic studies within the Gulf of Riga project 1993-1994. Eds. Elken J., Toompuu A. (Tallinn: EMI Report Series), 1–34.
Lips U., Zhurbas V., Skudra M., Väli G. (2016a). A numerical study of circulation in the Gulf of Riga, Baltic Sea. Part I: Whole-basin gyres and mean currents. Continental Shelf Res. 112, 1–13. doi: 10.1016/j.csr.2015.11.008
Lips U., Zhurbas V., Skudra M., Väli G. (2016b). A numerical study of circulation in the Gulf of Riga, Baltic Sea. Part II: Mesoscale features and freshwater transport pathways. Continental Shelf Res. 115, 44–52. doi: 10.1016/j.csr.2015.12.018
Mandal S., Behera N., Gangopadhyay A., Susanto R. D., Pandey P. C. (2021). Evidence of a chlorophyll “tongue” in the Malacca Strait from satellite observations. J. Mar. Syst. 223, 103610. doi: 10.1016/j.jmarsys.2021.103610
Meier H. E. M., Dieterich C., Gröger M., Dutheil C., Börgel F., Safonova K., et al. (2022a). Oceanographic regional climate projections for the Baltic Sea until 2100. Earth System Dynamics 13 (1), 159–199. doi: 10.5194/esd-13-159-2022
Meier H. E. M., Kniebusch M., Dieterich C., Gröger M., Zorita E. (2022b). Climate change in the Baltic Sea region: a summary. Earth System Dynamics 13 (1), 457–593. doi: 10.5194/esd-13-457-2022
Myrberg K., Andrejev O. (2003). Main upwelling regions in the Baltic Sea – a statistical analysis based on three-dimensional modelling. Boreal Environ. Res. 8, 97–112.
Omstedt A., Elken J., Lehmann A., Leppäranta M., Meier H. E. M., Myrberg K., et al. (2014). Progress in physical oceanography of the Baltic Sea during the 2003–2014 period. Prog. In Oceanography 128, 139–171. doi: 10.1016/j.pocean.2014.08.010
Petrov V. S. (1979). “Water balance and water exchange between the Gulf of Riga and the Baltic Proper,” in Sbornik rabot rizhskoj gidrometeorologicheskoj observatorii, 20–40. in Russian. (Riga: RGMO).
Raudsepp U. (2001). Interannual and seasonal temperature and salinity variations in the gulf of riga and corresponding saline water inflow from the baltic proper. Hydrology Res. 32 (2), 135–160. doi: 10.2166/nh.2001.0009
Schlitzer R. (2018). Ocean data view. Available at: https://odv.awi.de.
Skudra M., Lips U. (2017). Characteristics and inter-annual changes in temperature, salinity and density distribution in the Gulf of Riga. Oceanologia 59 (1), 37–48. doi: 10.1016/j.oceano.2016.07.001
Soomere T., Keevallik S. (2001). Anisotropy of moderate and strong winds in the Baltic Proper. Proc. Estonian Acad. Sci. Eng. 7 (1), 35–49. doi: 10.3176/eng.2001.1.04
Soosaar E., Maljutenko I., Raudsepp U., Elken J. (2014). An investigation of anticyclonic circulation in the southern Gulf of Riga during the spring period. Continental Shelf Res. 78, 75–84. doi: 10.1016/j.csr.2014.02.009
Stipa T., Tamminen T., Seppälä J. (1999). On the creation and maintenance of stratification in the Gulf of Riga. J. Mar. Syst. 23 (1-3), 27–49. doi: 10.1016/S0924-7963(99)00049-4
Suursaar Ü. (2020). Combined impact of summer heat waves and coastal upwelling in the Baltic Sea. Oceanologia 62 (4A), 511–524. doi: 10.1016/j.oceano.2020.08.003
The BACC II Author Team (2015). Second assessment of climate change for the Baltic Sea Basin. (Springer Cham) 501 pp. doi: 10.1007/978-3-319-16006-1
Uiboupin R., Laanemets J. (2015). Upwelling parameters from bias-corrected composite satellite SST maps in the gulf of Finland (Baltic sea). IEEE Geosci. Remote Sens. Lett. 12 (3), 592–596. doi: 10.1109/LGRS.2014.2352397
Väli G., Zhurbas V., Lips U., Laanemets J. (2017). Submesoscale structures related to upwelling events in the Gulf of Finland, Baltic Sea (numerical experiments). J. Mar. Syst. 171, 31–42. doi: 10.1016/j.jmarsys.2016.06.010
Väli G., Zhurbas V., Lips U., Laanemets J., Elken J. (2011). Simulation of nutrient transport from different depths during an upwelling event in the Gulf of Finland. Oceanologia 53 (1), 431–448. doi: 10.5697/oc.53-1-TI.431
Wu L., Staneva J., Breivik Ø., Rutgersson A., Nurser G., Clementi E., et al. (2019). Wave effects on coastal upwelling and water level. Ocean Model. 140, 101405. doi: 10.1016/j.ocemod.2019.101405
Yurkovskis A., Wulff F., Rahm L., Andruzaitis A., Rodriguez-Medina M. (1993). A nutrient budget of the gulf of riga; baltic sea. Estuarine Coast. Shelf Sci. 37 (2), 113–127. doi: 10.1006/ecss.1993.1046
Zaba K. D., Franks P. J. S., Ohman M. D. (2021). The california undercurrent as a source of upwelled waters in a coastal filament. J. Geophysical Research: Oceans 126 (2). doi: 10.1029/2020JC016602
Zhang S., Wu L., Arnqvist J., Hallgren C., Rutgersson A. (2022). Mapping coastal upwelling in the Baltic Sea from 2002 to 2020 using remote sensing data. Int. J. Appl. Earth Observation Geoinformation 114 (12), 103061. doi: 10.1016/j.jag.2022.103061
Zhurbas V., Laanemets J., Vahtera E. (2008). Modeling of the mesoscale structure of coupled upwelling/downwelling events and the related input of nutrients to the upper mixed layer in the Gulf of Finland, Baltic Sea. J. Geophysical Res. Atmospheres 113 (C5). doi: 10.1029/2007JC004280
Zhurbas V., Oh I. S., Park T. (2006). Formation and decay of a longshore baroclinic jet associated with transient coastal upwelling and downwelling: A numerical study with applications to the Baltic Sea. J. Geophysical Res. Atmospheres 111 (4). doi: 10.1029/2005JC003079
Keywords: upwelling, SST, Gulf of Riga, SmartBuoy, GETM, Baltic Sea, mesoscale
Citation: Skudra M, Väli G, Ikauniece A and Papirtis M (2023) Upwelling characteristics in the Gulf of Riga (Baltic Sea): multiple data source approach. Front. Mar. Sci. 10:1244643. doi: 10.3389/fmars.2023.1244643
Received: 22 June 2023; Accepted: 05 October 2023;
Published: 23 October 2023.
Edited by:
Francisco Machín, University of Las Palmas de Gran Canaria, SpainReviewed by:
Samiran Mandal, Indian Institute of Technology Delhi, IndiaSadegh Yari, Niedersächsische Landesbetrieb für Wasserwirtschaft, Küsten- und Naturschutz (NLWKN), Germany
Copyright © 2023 Skudra, Väli, Ikauniece and Papirtis. This is an open-access article distributed under the terms of the Creative Commons Attribution License (CC BY). The use, distribution or reproduction in other forums is permitted, provided the original author(s) and the copyright owner(s) are credited and that the original publication in this journal is cited, in accordance with accepted academic practice. No use, distribution or reproduction is permitted which does not comply with these terms.
*Correspondence: Māris Skudra, bWFyaXMuc2t1ZHJhQGxoZWkubHY=