
95% of researchers rate our articles as excellent or good
Learn more about the work of our research integrity team to safeguard the quality of each article we publish.
Find out more
ORIGINAL RESEARCH article
Front. Mar. Sci. , 19 October 2023
Sec. Global Change and the Future Ocean
Volume 10 - 2023 | https://doi.org/10.3389/fmars.2023.1244434
This article is part of the Research Topic Ecological Consequences of Climate Change in Boreal Marginal Seas View all 11 articles
 Åsa M. M. Berglund1*
 Christine Gallampois2
 Matyas Ripszam2,3Henrik Larsson4Daniela A. Figueroa1Evelina Grinienė5Pär Byström1
 Elena Gorokhova6Peter Haglund2
 Agneta Andersson1,4
 Mats Tysklind2
Climate change is expected to alter global temperature and precipitation patterns resulting in complex environmental impacts. The proposed higher precipitation in northern Scandinavia would increase runoff from land, hence increase the inflow of terrestrial dissolved organic matter (tDOM) in coastal regions. This could promote heterotrophic bacterial production and shift the food web structure, by favoring the microbial food web. The altered climate is also expected to affect transport and availability of organic micropollutants (MPs), with downstream effects on exposure and accumulation in biota. This study aimed to assess climate-induced changes in a Bothnian Sea food web structure as well as bioaccumulation patterns of MPs. We performed a mesocosms-study, focusing on aquatic food webs with fish as top predator. Alongside increased temperature, mesocosm treatments included tDOM and MP addition. The tDOM addition affected nutrient availability and boosted both phytoplankton and heterotrophic bacteria in our fairly shallow mesocosms. The increased tDOM further benefitted flagellates, ciliates and mesozooplankton, while the temperature increase and MP addition had minor effect on those organism groups. Temperature, on the other hand, had a negative impact on fish growth and survival, whereas tDOM and MP addition only had minor impact on fish. Moreover, there were indications that bioaccumulation of MPs in fish either increased with tDOM addition or decreased at higher temperatures. If there was an impact on bioaccumulation, moderately lipophilic MPs (log Kow 3.6 – 4.6) were generally affected by tDOM addition and more lipophilic MPs (log Kow 3.8 to 6.4) were generally affected by increased temperature. This study suggest that both increased temperatures and addition of tDOM likely will affect bioaccumulation patterns of MPs in shallow coastal regions, albeit with counteracting effects.
The expected consequences of climate change are not uniform around the globe. While some areas are predicted to have dryer and warmer climates, others will receive more precipitation (IPCC, 2022). Climate change is further expected to affect the global distribution patterns and effects of organic micropollutants (MPs), including persistent organic pollutants (POPs), with a risk of increased redistribution of and exposure to pollutants in different ecosystems (Kallenborn et al., 2012; Borgå et al., 2022). In Scandinavia, increased temperature and precipitation are expected due to a changing climate (Meier et al., 2022), with increased land runoff to rivers and streams (Bergström et al., 2001). This would enhance the load of terrestrial dissolved organic matter (tDOM) into freshwater systems and coastal areas with both changes in the food web structure (Andersson et al., 2015; Creed et al., 2018) as well as changes in the distribution and partitioning of pollutants (Noyes et al., 2009; Kallenborn et al., 2012; Gilbreath and McKee, 2015; Ripszam et al., 2015; Borgå et al., 2022). During recent years the Swedish monitoring of rivers and streams also confirms increasing trends of the water color (browning) and total organic carbon in the majority of investigated areas connected to the Baltic Sea (Swedish Institute for the Marine Environment, 2023).
The Baltic Sea is a semi-enclosed sea with limited water exchange from the high-saline Atlantic Ocean in the south. As a result, the Sea is highly influenced by river runoff, especially in the northern basins (Bothnian Sea and Bothnian Bay). Due to the restricted exchange of water in the Bothnian Sea, the relatively large catchment area, and the occurrence of industries such as pulp and paper mills, the environment has been severely contaminated over the last decades (Sundqvist et al., 2009; Miller et al., 2013; Assefa et al., 2014; Lester and van Riper, 2014). Although concentrations of several POPs have declined, they remain high in sediment and biota (Miller et al., 2013; Assefa et al., 2014; Assefa et al., 2019). With the ongoing climate changes, we expect an increased discharge of both tDOM and MPs into the Baltic Sea with complex direct and indirect effects on the transport, availability and toxicity of POPs (reviewed in Noyes et al., 2009; Kallenborn et al., 2012; Borgå et al., 2022). Climate change also increase water temperatures, influencing MP partitioning, leading to increased bioavailability, but also higher evaporation rates of volatile compounds (Noyes et al., 2009). High temperatures generally speed up the metabolism in biota; thus, the uptake but also elimination of compounds are expected to increase (Noyes and Lema, 2015). In addition, the sensitivity to MPs with increased temperatures, may be species specific (Borgå et al., 2022). As increased temperature may have multiple impacts on MPs, their bioavailability has been proposed to increase, decrease or have no net effect in the warmer climate (Borgå et al., 2010; Carrie et al., 2010; Borgå et al., 2022).
Availability of tDOM may have multiple effects on MP availability and accumulation. Hydrophobic contaminants will adsorb to particles and tDOM (Ripszam et al., 2015), thus decreasing their bioavailability via direct uptake from the water (Haitzer et al., 1998). However, organic material can also serve as a source of nutrients for heterotrophic bacteria (Stepanauskas et al., 2002) favoring heterotrophic bacteria over phytoplankton at the base of the food chain (Andersson et al., 2015; Figueroa et al., 2016). Furthermore, increased tDOM often result in browning of waters, and phytoplankton will have a disadvantage over heterotrophic bacteria due to shading (Creed et al., 2018). The decrease in phytoplankton production may lead to a shift in the food web, favoring the microbial food web (heterotrophic bacteria, flagellates, ciliates and mesozooplankton) over the phototrophic food web constituted of phytoplankton and mesozooplankton (Berglund et al., 2007; Lefebure et al., 2013; Andersson et al., 2015). Many of the legacy POPs (e.g., DDT and PCBs) are known to biomagnify in the food web (Gobas et al., 1999; Borgå et al., 2004). Thus, the shift towards a heterotrophic bacteria-based system would increase the number of trophic levels and potentially increase the accumulation of POPs at the top of the food web. Although the interest in climate-driven pollutant impacts has increased, especially in the Arctic (Noyes et al., 2009; Kallenborn et al., 2012; Su et al., 2018), only a few studies have focused on the climate-driven ecological processes that may impact the availability and transfer of MPs (Alava et al., 2017; Borgå et al., 2022).
In this mesocosm study, we exposed a pelagic food web from the Bothnian Sea to a cocktail of MPs under different climate scenarios, including the future climate conditions represented by increased temperature and tDOM levels as well as present-day conditions. The aim was to evaluate how bioaccumulation patterns of legacy and currently used MPs respond to the future climate scenario considering direct and indirect effects, including ecological shifts in the food web. The hypothesis was that top consumers accumulate more MPs under future climate conditions due to increased heterotrophy of the food web. In addition, we expect that the effects on the bioaccumulation of compounds with high persistence and lipophilicity will be more pronounced, due to their tendency to biomagnify in the food web.
The outdoor mesocosm experiment took place during 34 days between May and July 2013, at the Umeå Marine Science Centre (UMF), Sweden (63' 33’N, 19' 49’E). Three experimental treatments were applied, alone or in combination (three replicates each), with tDOM addition, temperature increase and MP addition as treatment factors (Figure 1A). We used the maximum predicted increase in temperature and tDOM (an increase of 3°C and 30% tDOM, respectively), as suggested earlier (Meier, 2006; Neumann, 2010), and the present day conditions in the region during summer, resulting in experimental settings of 15 and 18°C and 4mg/L and 6mg/L DOC (dissolved organic carbon) for the present-day and climate-altered conditions, respectively. In total 24, mesocosms were established in clean 1 m3 cubic shaped (1×1×1m) polypropylene tanks (Allembalage AB, Jordbo, Sweden), sheltered by a semi-transparent roof. All tanks were simultaneously filled with 947 L sea water (3‰ salinity) collected 1 km offshore in the northern Bothnian sea (63° 34’N, 19°54’E) using the large pumps of the UMF field station Flygt 3152.181 (Xylem Sundbyberg Sweden). The water was filtered (1 mm slit filter, Bernoulli System Lund, Sweden) to remove fish and allow natural communities of bacteria, phytoplankton, protozoa and mesozooplankton to populate the mesocosms. The mesocosms were completely immersed in four swimming pools (Ultra Frame Pool 7”, Intex, Long Beach; Ca, USA) filled with seawater and connected to a temperature-control system, that maintain the target water temperatures. A block design included six mesocosms per swimming pool, and the position of each mesocosm was randomized to avoid systematic errors (Figure 1A). The temperatures in the pools were recorded daily, yielding an average of 18.0 ± 0.01, 15.2 ± 0.02, 18.0 ± 0.01, and 14.9 ± 0.01°C, for pool 1 – 4 respectively. Individual temperature measurements in each mesocosm was not conducted as each mesocosm was fully immersed in the pools, and hence unlikely would deviate from the temperature in the pools. The mesocosm were aeriated via a compressed air-valve system and to prevent insect colonization mosquito nets were mounted on the top of the mesocosms.
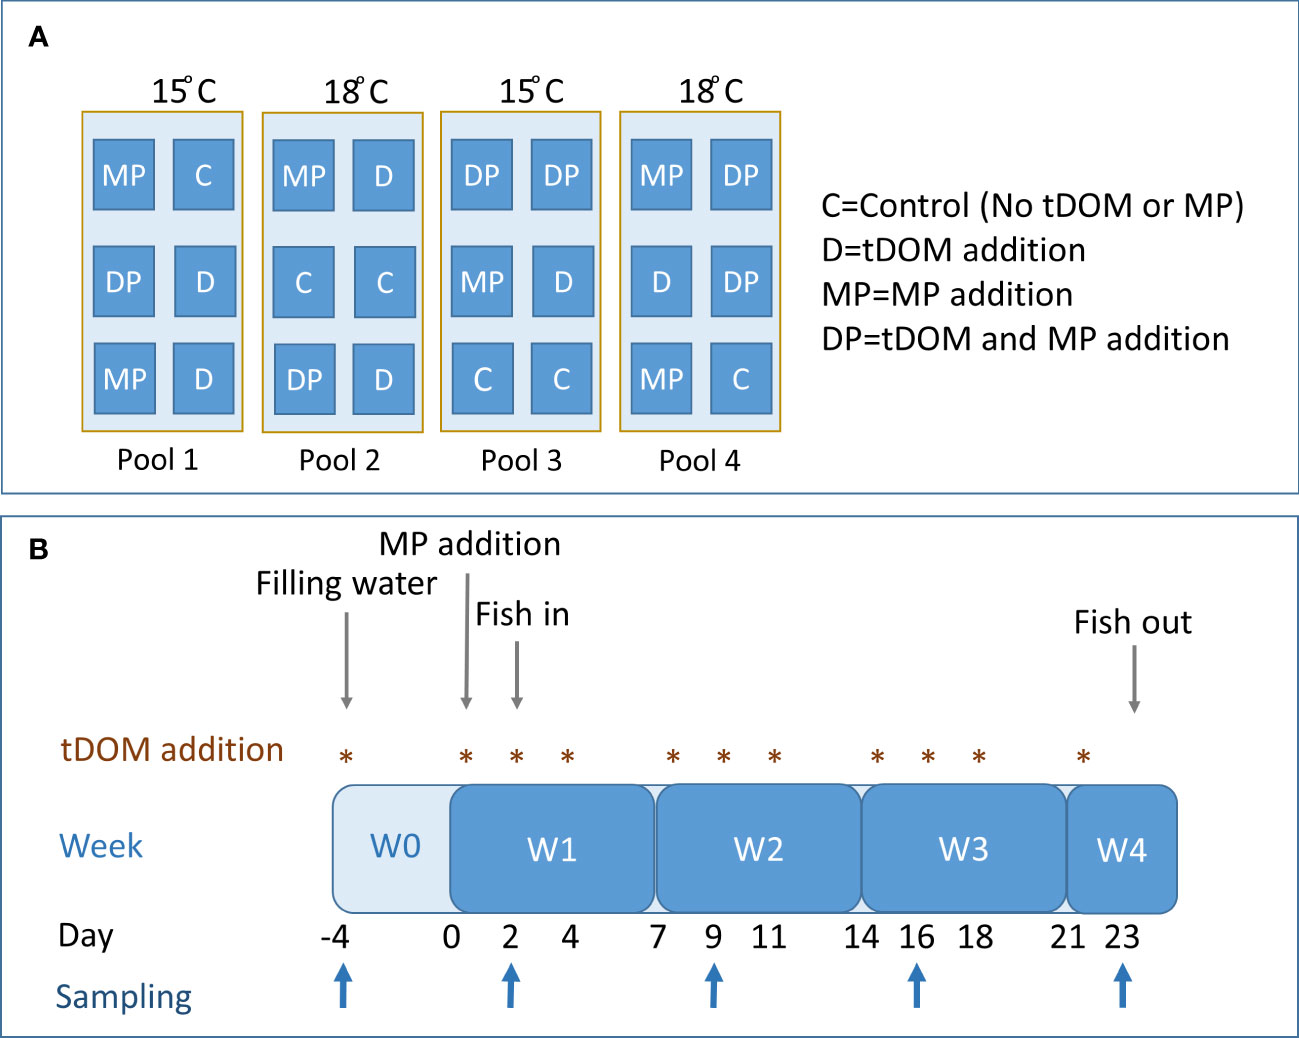
Figure 1 Design and layout of the mesocosm experiment (A), and the treatment and sampling scheme over the experiment duration (B).
To mimic the increased runoff of organic material, tDOM was prepared using natural humic soil from a typical forest of the area (mix of deciduous and coniferous trees) as described by Ripszam et al. (2015). The humic soil extract was analyzed for DOC, DIN (dissolved inorganic nitrogen, i.e. nitrate, nitrite and ammonium), DIP (dissolved inorganic phosphorous), total N and total P, to calculate the appropriate soil extract volume and nutrient amount for addition. The tDOM-treated mesocosms were pre-treated with 0.5mg/L DOC; after that, tDOM was added weekly (0.14 mg C/L 3 times a week) in concert with water replacement (see below and Figure 1B). To account for the nutrient addition in the tDOM-treated mesocosms, a corresponding amount of dissolved nitrogen and phosphorous (initial boost: 0.95 µg PO4-P/L, 4.43 µg NO3/L and 0.72 µg NH4/L, followed by 0.20 µg PO4-P/L, 0.94 µg NO3/L and 0.15 NH4/L 3 times a week) was added in control mesocosms (Stepanauskas et al., 2002; Lignell et al., 2008).
The mesocosms were left to equilibrate, and 4 days after the initial tDOM treatment (hereafter referred to time = 0), 2.5 mL of a methanol spiking solution containing a mixture of 33 MPs was added to half of the mesocosms. For a complete list of compounds and the initial concentrations as well as final concentrations, see Ripszam et al. (2015, Table 1 and Figure 3). The MPs were selected based on the hazardous substance list provided by the European Commission (Directive 2008/105/EC, 2008) and spanned four orders of magnitude of lipophilicity, viz. log octanol-water partition coefficients (log Kow) between 2.1 and 6.4 (Table S1). The mixture included legacy POPs, recently and currently used pesticides, high-volume production compounds and some benchmark compounds for modelling (Ripszam et al., 2015).
Two days after the MP addition, fish was introduced to the mesocosms and kept in the system for 21 days. In total, 10 perch (Perca fluviatilis) larvae (6.3 ± 0.1mm, 0.8 ± 0.05mg) were added as top predators in each mesocosm. Perch was hatched from egg strands, collected from a coastal spawning bay (63°45’14” N, 20°32’18” E) and kept at 16°C until the start of the experiment. During the initial stage (pre-exposure), they were fed a mixture of live zooplankton. One week before the planned experiment termination (day 30), the fish were removed due to low zooplankton abundance and risk of starvation. Thus, on day 23, all surviving perch were collected with a large 3-mm net and killed by overdosing of M222 (Ethyl 3-aminobenzoate methanesulfonate, Fluka; Ethical approval No. A28-13, Umeå University). Samples were kept frozen at –20°C until chemical analysis was performed.
Twenty liters of water were replaced three times a week with an equal volume of filtered (20 µm) seawater (see Figure 1B for the sampling scheme). At the same time, nutrients or tDOM (depending on treatment) were added to mesocosms to gradually reach the target of 6 mg/L DOC in the tDOM-treated mesocosms. Once a week, an aliquot of water was sampled, filtered (90 µm), and used to analyze pH, DOC, total nitrogen (Ntot), DIN, total phosphorous (Ptot), DIP, particulate organic phosphorous (PO4-P), primary production (PP), Chlorophyll α (Chl α), bacterial production (BP), and bacterial abundance (BA), phytoplankton, flagellate and ciliates. Mesozooplankton was collected weekly from each mesocosm by three bottom-to-surface hauls with a 65 µm net (14 cm diameter); 40.16 L/sample were filtered. Phytoplankton, flagellates and PO4-P were only counted/analyzed at the start (day -4), mid-point (day 16) and after fish was sampled (day 30, not included in this paper). Light (photosynthetically active radiation, PAR) was measured weekly during mid-day using a PAR Licor sensor (LICOR -193SA) at three depths (top, middle and bottom) and five positions and calculated as an average value for each mesocosm.
All parameters for water chemistry (DOC, pH, DIN, DIP, Ntot, Ptot, PO4-P) were determined on the day of sampling. DOC was measured in a high-temperature carbon analyzer (Shimadzu TOC-5000, Shimadzu Corporation) with platinum-coated Al2O3 granulate as a catalyst, according to Berglund et al. (2007). A benchtop pH meter (pHenomenal, VWR International AB, Spånga Sweden) with a combined glass electrode (PHENOMENAL 221, avantor, VWR Spånga Sweden), calibrated with three (4.00, 7.00 and 10.01) buffers, AVS Titronorm traceable to SRM from NIST (BDH Chemicals) was used for pH measurements. Concentrations of inorganic nutrients (DIN and DIP) and total nutrient content (Ntot and P tot) were analyzed using a 4-channel auto-analyzer (Quaatro Marine, Braan and Luebbe) according to the Swedish Standards Institute (Grasshoff et al., 1999). The detection limit for DIN and DIP were 1.5 µg DIN/L N and 0.7 µg DIP/L P, respectively. Particulate organic phosphorous (PO4-P) was quantified using the ash-hydrolysis method, with a lower range of measurement from 0.08 µM (Solórzano and Sharp, 1980).
Primary production, BP and Chl α were analyzed at the day of sampling; all other analyses/counts (BA, phytoplankton, flagellates, ciliates and mesozooplankton) were performed later. Samples for analysis of biomasses and abundances of phytoplankton, heterotrophic flagellates, ciliates and mesozooplankton were fixed with 2% acidic Lugol’s solution according to Utermöhl (1958) and stored at 4°C until analysis. Ten µL of glutaraldehyde was added to samples used for BA analyses, and samples were kept for 15 min in the dark followed by storage at -80°C until analysis.
Bacterial production was measured using the [3H-methyl]-thymidine technique (Fuhrman and Azam, 1982). In short, 1 mL of mesocosms water was added to Eppendorf tubes (one control and triplicate samples). In the controls, bacteria were pre-killed by adding 100 µl ice-cold 50% trichloroacetic acid (TCA) and incubated at -20°C for 5 minutes. Then, 2 µL of [3H]-thymidine (84 Ci mmol-1; Perkin Elmer, Massachusetts, USA) were added to each tube to a final concentration 24 nM. Samples were incubated for 1h in the dark, during the early afternoon, at the respective temperature treatment (15 or 18°C). The incubation was terminated by adding 100 µL ice-cold 50% TCA and centrifuging at 13,000 rpm for 10 min. After washing the pellet with 5% TCA, 1 mL scintillation cocktail was added before analyses in a scintillator counter (Beckman Coulter LS 6500/Packard Tri-Carb 1600 TR). The incorporated thymidine was converted to cell production using the conversion factor of 1.4x10¹⁸ cells mol-1 (Wikner and Hagström, 1999). Carbon biomass production was estimated from cell production and average cell carbon biomass according to Fuhrman and Azam (1982), using a bacterial carbon content of 1.7x10⁻⁹ µmol C cell-1.
Bacterial abundance was analyzed using a BD FACSVerseTM flow cytometer (BD Biosciences) fitted with a 488-nm laser (20 mW output). Samples were stained with SYBR Green I (Invitrogen) to a final concentration of 1: 10 000 (Marie et al., 2005) and diluted with filtered (0.2 µm) seawater. Samples were run for 1 min at a flow rate of 30 mL min-1 and 1 µm microspheres (Fluoresbrite plain YG, Polysciences) served as an internal standard in each sample. Forward light scatter (FSC), side light scatter (SSC), and green fluorescence from SYBR Green I (527 ± 15) were measured to estimate bacteria abundance. Bacterial biomass was then calculated using a conversion factor of 20 fg C cell-1 (Lee and Fuhrman, 1987).
Primary production (PP) was measured in situ using the 14C method according to Gargas (1975). Five mL of sample were added to 20 mL transparent polycarbonate tubes in triplicate and one dark tube as control. 14C was added to each tube (7.2 µL, 14C Centralen Denmark, activity 100 µCi mL-1), and incubation of samples was carried out at 80 cm depth inside the pools, during early afternoon, for about 3 hours. Controls were incubated in the dark, at the respective temperature treatment (15 or 18°C). The activity was stopped by the addition of 150 µL 6M HCl. The samples were analyzed in a scintillation counter (Beckman Coulter LS 6500/Packard Tri-Carb 1600 TR) following addition of 15 mL scintillation cocktail (Optiphase HiSafe 3). Daily PP was calculated as described in Andersson et al. (1996) using factor F according to Gargas (1975).
Samples for Chl α (100 mL) were filtered onto 25 mm GF/F filters, extracted in 10 mL 96% ethanol overnight and measured with a Perkin Elmer LS 30 fluorometer (433/674 nm excitation/emission wavelengths; Waltham®, Middlesex, MA, USA). The protocol was based on US EPA (1997), protocol 446, with the following modifications: a) Ethanol 96% was used in place of 90% acetone and b) glass fiber filters were crushed using ball milling with 5 mm steel beads instead of a mechanical tissue grinder.
Phytoplankton and nanoflagellates were only counted at the start (day -4), mid-point (day 16) and after fish was removed (day 30). Hence, only data for the first two sampling occasions, with relevance for fish, are presented in this paper. Using sedimentation chambers, 10-50 mL of a Lugol-fixed sample were settled for 12-48 hours. The cells were counted using an inverted microscope (Nikon Eclipse Ti) at 100-400x magnification with phase contrast settings (Utermöhl, 1958). Cell biovolume was calculated according to Olenina et al. (2006). Chl α was used as a proxy for phytoplankton stock, as phytoplankton counts (data not shown) were performed on a limited number of samples, and Chl α and phytoplankton biomass correlated well (R2 = 0.66, p<0.0001).
For ciliate analysis, 25–50 mL of the fixed sample were settled for at least 24-48 h in Utermöhl’s chambers and counted with an inverted microscope at 200× magnification, as described in Andersson et al. (2023). The entire bottom of each chamber was surveyed, and an additional subsample was counted if the total number of organisms was below 150. Ciliate biomass was based on their biovolume, which was calculated by their geometric shape using measurements of the cell length and width of at least 20 cells of each species/taxa per sample. Cell carbon content for flagellates and ciliates was calculated according to Menden-Deuer and Lessard (2000).
For mesozooplankton analysis, each sample (entire volume) was counted using a counting chamber and an inverted microscope (Leitz fluovert FS, Leica) at 80× magnification. Copepods were classified according to species and developmental stage (nauplii, copepodites CI–III, CIV–V and adults), whereas cladocerans (Bosmina coregoni) were classified according to species, maturity (adults and juveniles) and sex. Biomass (wet weight) was calculated using abundance data, species- and stage-specific individual weights (Hernroth, 1985). Three mesozooplankton groups were considered for the abundance and biomass aggregation: copepods, cladocerans and rotifers. To account for potential differences in ciliate and mesozooplankton abundances, due to the variations in the communities of the root sample (day -4), the relative change in ciliate and mesozooplankton biomass and abundance were calculated:
where tx is the biomass/abundance at the time of interest and t-4 is the biomasss/abundance at the start of the experiment (day -4).
Organic contaminants were extracted from whole fish using 1.5 mL cyclohexane: etylacetate (3:1v/v). Internal standard, 20 µL (Ripszam et al., 2015), was added, and the fish samples were homogenized with zirconium beads in a Mini Beadbeater (Biospec. Bartlesville, USA) for 4 min at 3500 oscillations/min. The homogenate was centrifuged at 14 000 rpm for 10 min and the supernatant was collected. The procedure was repeated thrice, and the combined supernatants were evaporated to 500 µL. Lipid removal was accomplished by gel permeation chromatography (GPC) cleanup (Sundkvist et al., 2010). Organic micropollutant concentrations were analyzed by gas chromatography – high-resolution mass spectrometry (GC-HRMS) using an Agilent 6890 GC (Agilent, Santa Clara, CA USA) equipped with an ultra-inert J&W DB-5MS GC column (30m*0.25mm*0.25µm, Agilent, Santa Clara, CA, USA) and a Waters Micromass AutoSpec Ultima HRMS (Waters Corp., Milford, MA, USA) (Sundkvist et al., 2010). The HRMS was operated in electron ionization (EI) mode at >8,000 resolution, utilizing selected ion monitoring (SIM) of two abundant ions of each target compound and internal standard.
Dissolved MPs in water were determined in the sub-0.7µm fraction by liquid-liquid extraction of 300mL water, passed through GF/F filters. Internal standard (20 µL) was added, and extraction occurred in 100 mL dichloromethane (50 mL once and 25 mL twice). Chemical analysis was performed by GC-MS using an Agilent 7890N GC coupled to an HRT-TOF-MS instrument (Leco, St. Joseph, MI), equipped with an ultra-inert J&W DB-5MS GC column (30m*0.25mm*0.25µm, Agilent, Santa Clara, Ca, USA), as described in Ripszam et al. (2015). One sample (MP15 treatment) was lost during the analysis. If concentrations of any contaminants (in fish or water) exceeded 10% of the highest concentration measured in blanks, compounds were omitted from further analysis.
One control mesocosm (18°C) showed low phytoplankton abundance (measured as Chl α), throughout the experiment and only one fish survived. This mesocosm was regarded as an outlier and thus not included in the statistical analyses, nor figures. Data are shown as mean ± SD and all statistical analyses were performed with R 3.6.1 (R Core Team, 2019). Data points below detection limit (i.e. DIP) were not substituted with a constant value.
Multifactorial analysis (MFA; package: FactoMineR) was used on the combined data on water chemistry and biological variables to explore variability within and between treatments. The MFA uses weighed principal axis methods applied on a mixture of quantitative, categorical and frequency variables, and the basis of MFA can be viewed as a weighted PCA applied to a multiple table in which different sets of quantitative variables are juxtaposed (Bécue-Bertaut and Pagès, 2008). The data (DOC, Ptot, Ntot, pH, PP, BP, BA, Chl α, ciliate and mesozooplankton abundances and biomasses) was scaled and grouped by five sampling occasions, and the treatment factors were used as supplementary qualitative variables. Dissolved inorganic nutrients (DIN and DIP) were not included in the MFA due to the low frequency of detection (up to 65% of samples were below the detection limit), and flagellates and PO4-P were excluded due to low sampling resolution (two of the five sampling occasions). One data point for Ptot was missing due to analytical errors and thus replaced using data imputation (package: missMDA-package).
Changes in water chemistry (pH, DOC and nutrients) and food web structure (primary, heterotrophic bacteria and total basal production, flagellates, ciliates and mesozooplankton) were assessed using linear mixed models (package: nlme), with normal distribution. To provide linear fit of models, all dependent variables except Ntot, Δ flagellate biomass, proportions of copepods and rotifer abundance, fish biomass and FWE were log-transformed, adding a constant (+1) when necessary to prevent infinite values. Visual interpretation of residuals of the fitted model (QQ-plots) were used to assess the need to transform the data. The following treatments were included as independent fixed categorical factors: temperature, MPs, tDOM, and time and three-way interactions were considered in the most complex model. Mesocosm was included as a random factor to account for repeated measures over time. Due to many samples below the detection limit (65%), statistical analyses of DIP did not include time as a factor. Relationships between DOC concentration and nutrient availability (DIN, DIP, PO4-P, Ntot and Ptot) was assessed using the Spearman correlation test.
Food web efficiency (FWE), defined as the cumulative annual production rate of fish over the pelagic primary and heterotrophic bacterial production was determined as the ratio between fish production (Fishp) and total basal production (PP + BP) (Rand and Stewart, 1998):
where fish production, PP and BP estimates were expressed as mg C L-1 d-1. Fish production was estimated as the total mass change of all surviving individuals assuming carbon content to be 20% of the wet weight (Jobling, 1995), and basal production was estimated as the average BP + PP production during the time when fish was present in the mesocosms.
Differences in total fish biomass and FWE were also assessed with the linear mixed models, and fish survival was analyzed using a generalized linear model with binomial distribution and logit-function (package: stats). All fish models included MPs, temperature and tDOM, and their three-way interactions as independent fixed categorical effects. The correlation between total mesozooplankton biomass and fish survival or total biomass was estimated using the Spearman correlation test.
Bioaccumulation factors (BAF) were calculated using lipid normalized (BAFl) and wet weight (BAFww) concentrations in fish and soluble MPs in the sub-0.7 µm fraction:
Due to small individual mass (10-19 mg fish, ww), the lipid content was determined for a bulk sample of control fish, yielding 1.4% lipid in the wet mass, and used for all fish samples. This does not allow exact calculation of BAFl as lipid content may be affected by the treatments, but it provides a crude estimate of BAFl. The soluble MP fraction was calculated as an average based on weekly water analyses; these results have been reported elsewhere (Ripszam et al., 2015). Treatment effects on the fish MPs concentrations and BAF values (log-transformed) were also analyzed using linear mixed models with normal distribution using temperature, MPs, and tDOM as independent fixed factors (including interactions) and mesocosm as a random factor.
The variable selection in the mixed models was applied using a likelihood ratio test, with stepwise selection (package: MuMIn). The best-fit model was selected based on the corrected Akaike information criterion (AICc), and the simplest model with the lowest AICc was chosen, provided that the ΔAICc > 2 (Burnham et al., 2011). If ΔAICc ≤ 2, the models in question were compared and simplified, if possible, using backward elimination, starting with omitting the interaction effects, and comparing models using ANOVA.
The multifactorial analysis (MFA) revealed that the water chemistry (pH, DOC, Ntot and Ptot) and biological variables (Chl α, PP, BP, BA, ciliate and mesozooplankton abundance, and ciliate and mesozooplankton biomass) shared similarities within treatments. The 1st dimension, explaining 33.7% of the variance, was strongly driven by tDOM, and mesocosms with tDOM addition had positive scores whereas mesocosms without tDOM addition had negative scores on dimension 1 (Supplementary Figure S1A). The 2nd dimension (13.9%) was driven by MP addition, with generally positive scores for treatments without MP addition and negative scores for mesocosms with MP addition. The third dimension (Supplementary Figure S1B) explained 12.7% of the variance and was mainly driven by temperature, with generally positive scores for 18°C treatments and negative loadings for 15°C treatments.
The general trends in water chemistry data are summarized in the text and available in Table 1, whereas detailed statistical outcome for all the variables included in the final global models can be found in Supplementary Table S2. pH was on average 7.8 ± 0.061, fluctuated over time (7.8 – 7.9, p< 0.0001), and was higher in 18 than 15°C mesocosms (7.9 ± 0.069 vs. 7.8 ± 0.046, p< 0.001). DOC concentrations were on average 5.6 ± 0.53 mg/L in mesocosms without soil addition, whereas in mesocosms with tDOM addition, DOC reached 7.4 ± 0.73 mg/L by the end of the experiment (2-way interaction time × tDOM: p< 0.0001), and addition of MP also increased the DOC concentrations (p< 0.0001). Moreover, tDOM increased the shading, with reduced light availability by approximately 30% (p< 0.0001) in tDOM-treated mesocosms, although the average PAR generally exceeded 100 µmol Quanta m-2 s-1 (Table 1).

Table 1 Summary (average ± SD) of water chemistry (pH, dissolved organic carbon (DOC), photosynthetically active radiation (PAR), total nitrogen (Ntot) and phosphorous (Ptot), dissolved inorganic nitrogen (DIN) and phosphorous (DIP), particulate organic phosphorous (PO-4P)) for the following treatments: Control (C), tDOM addition (D), organic micropollutant addition (MP) and tDOM + micropollutant addition (DP) at different temperatures (15 or 18°), during the duration of the experiment (MP addition at time=0).
tDOM had a positive effect on total N, total P, DIN and PO4-P, although this was insignificant for DIN (p = 0.051; Supplementary Table S2). Nutrients were generally consumed over time in the mesocosms (p< 0.0001 for Ntot, Ptot, DIN and PO-4P) and DIP was below detection limit in 65% of the analyzed samples, however, tDOM also had an interactive effect on the temporal patterns. tDOM addition increased Ntot as the experiment progressed, and Ptot and PO-4P were more stable in tDOM-treatments, whereas they decreased in mesocosms without tDOM (2-way interactions time × tDOM; p< 0.0001). Temperature had minor effects on nutrient availability, but the highest Ntot concentrations were found in 15°C treatments with tDOM addition and the lowest Ntot concentrations were found in 15°C treatments without tDOM (2-way interactions tDOM × temp, p< 0.05). If any, MP addition showed interactive effects with tDOM and time, revealing the highest Ntot and Ptot availability in tDOM treatments followed by tDOM × MP, MP and control treatments (2-way interactions tDOM × MP; p< 0.0001). Ntot increased over time in mesocosms without MP addition, but remained stable when MPs were added and PO-4P decreased more between the two sampling occasions if MPs were added (2-way interactions time × MP; p< 0.01).Total N, Ptot and DIN, but not DIP and PO4-P, correlated positively with DOC concentration (Ntot: Rs = 0.86, p< 0.0001; Ptot: Rs = 0.80, p< 0.0001; DIN: Rs = 0.21, p< 0.05).
The general trends of the food web components are presented in the text, whereas detailed statistical outcome for all the variables included in the final global models can be found in Supplementary Table S2. The experiment started during the spring bloom, reflected by high Chl α and PP concentration at the start of the experiment (Figure 2). Both Chl α and PP were slightly boosted in tDOM treatments, although most mesocosms showed a temporal decline after the initial bloom conditions (p< 0.01 for both). The temporal decrease in Chl α and PP was greater in mesocosms without tDOM (2-way interaction: time × tDOM; p< 0.01 for both). In addition, there was an increase in Chl α by the end of the experiments in mesocosms without MP, but with tDOM, suggesting inhibition of algal growth in MP treated mesocosms (2-way interactions: time × MP; time × tDOM and tDOM × MP). The trends of BP converged with that of Chl α and PP, except for the initial peak in production during the spring bloom (Figure 2). BP was more stable over time with tDOM addition, especially in MP treated mesocosms (3-way interaction: time × tDOM × MP; p< 0.05). Total basal production (PP + BP), were strongly influenced by the PP and followed the same patterns as PP (Figure 2).
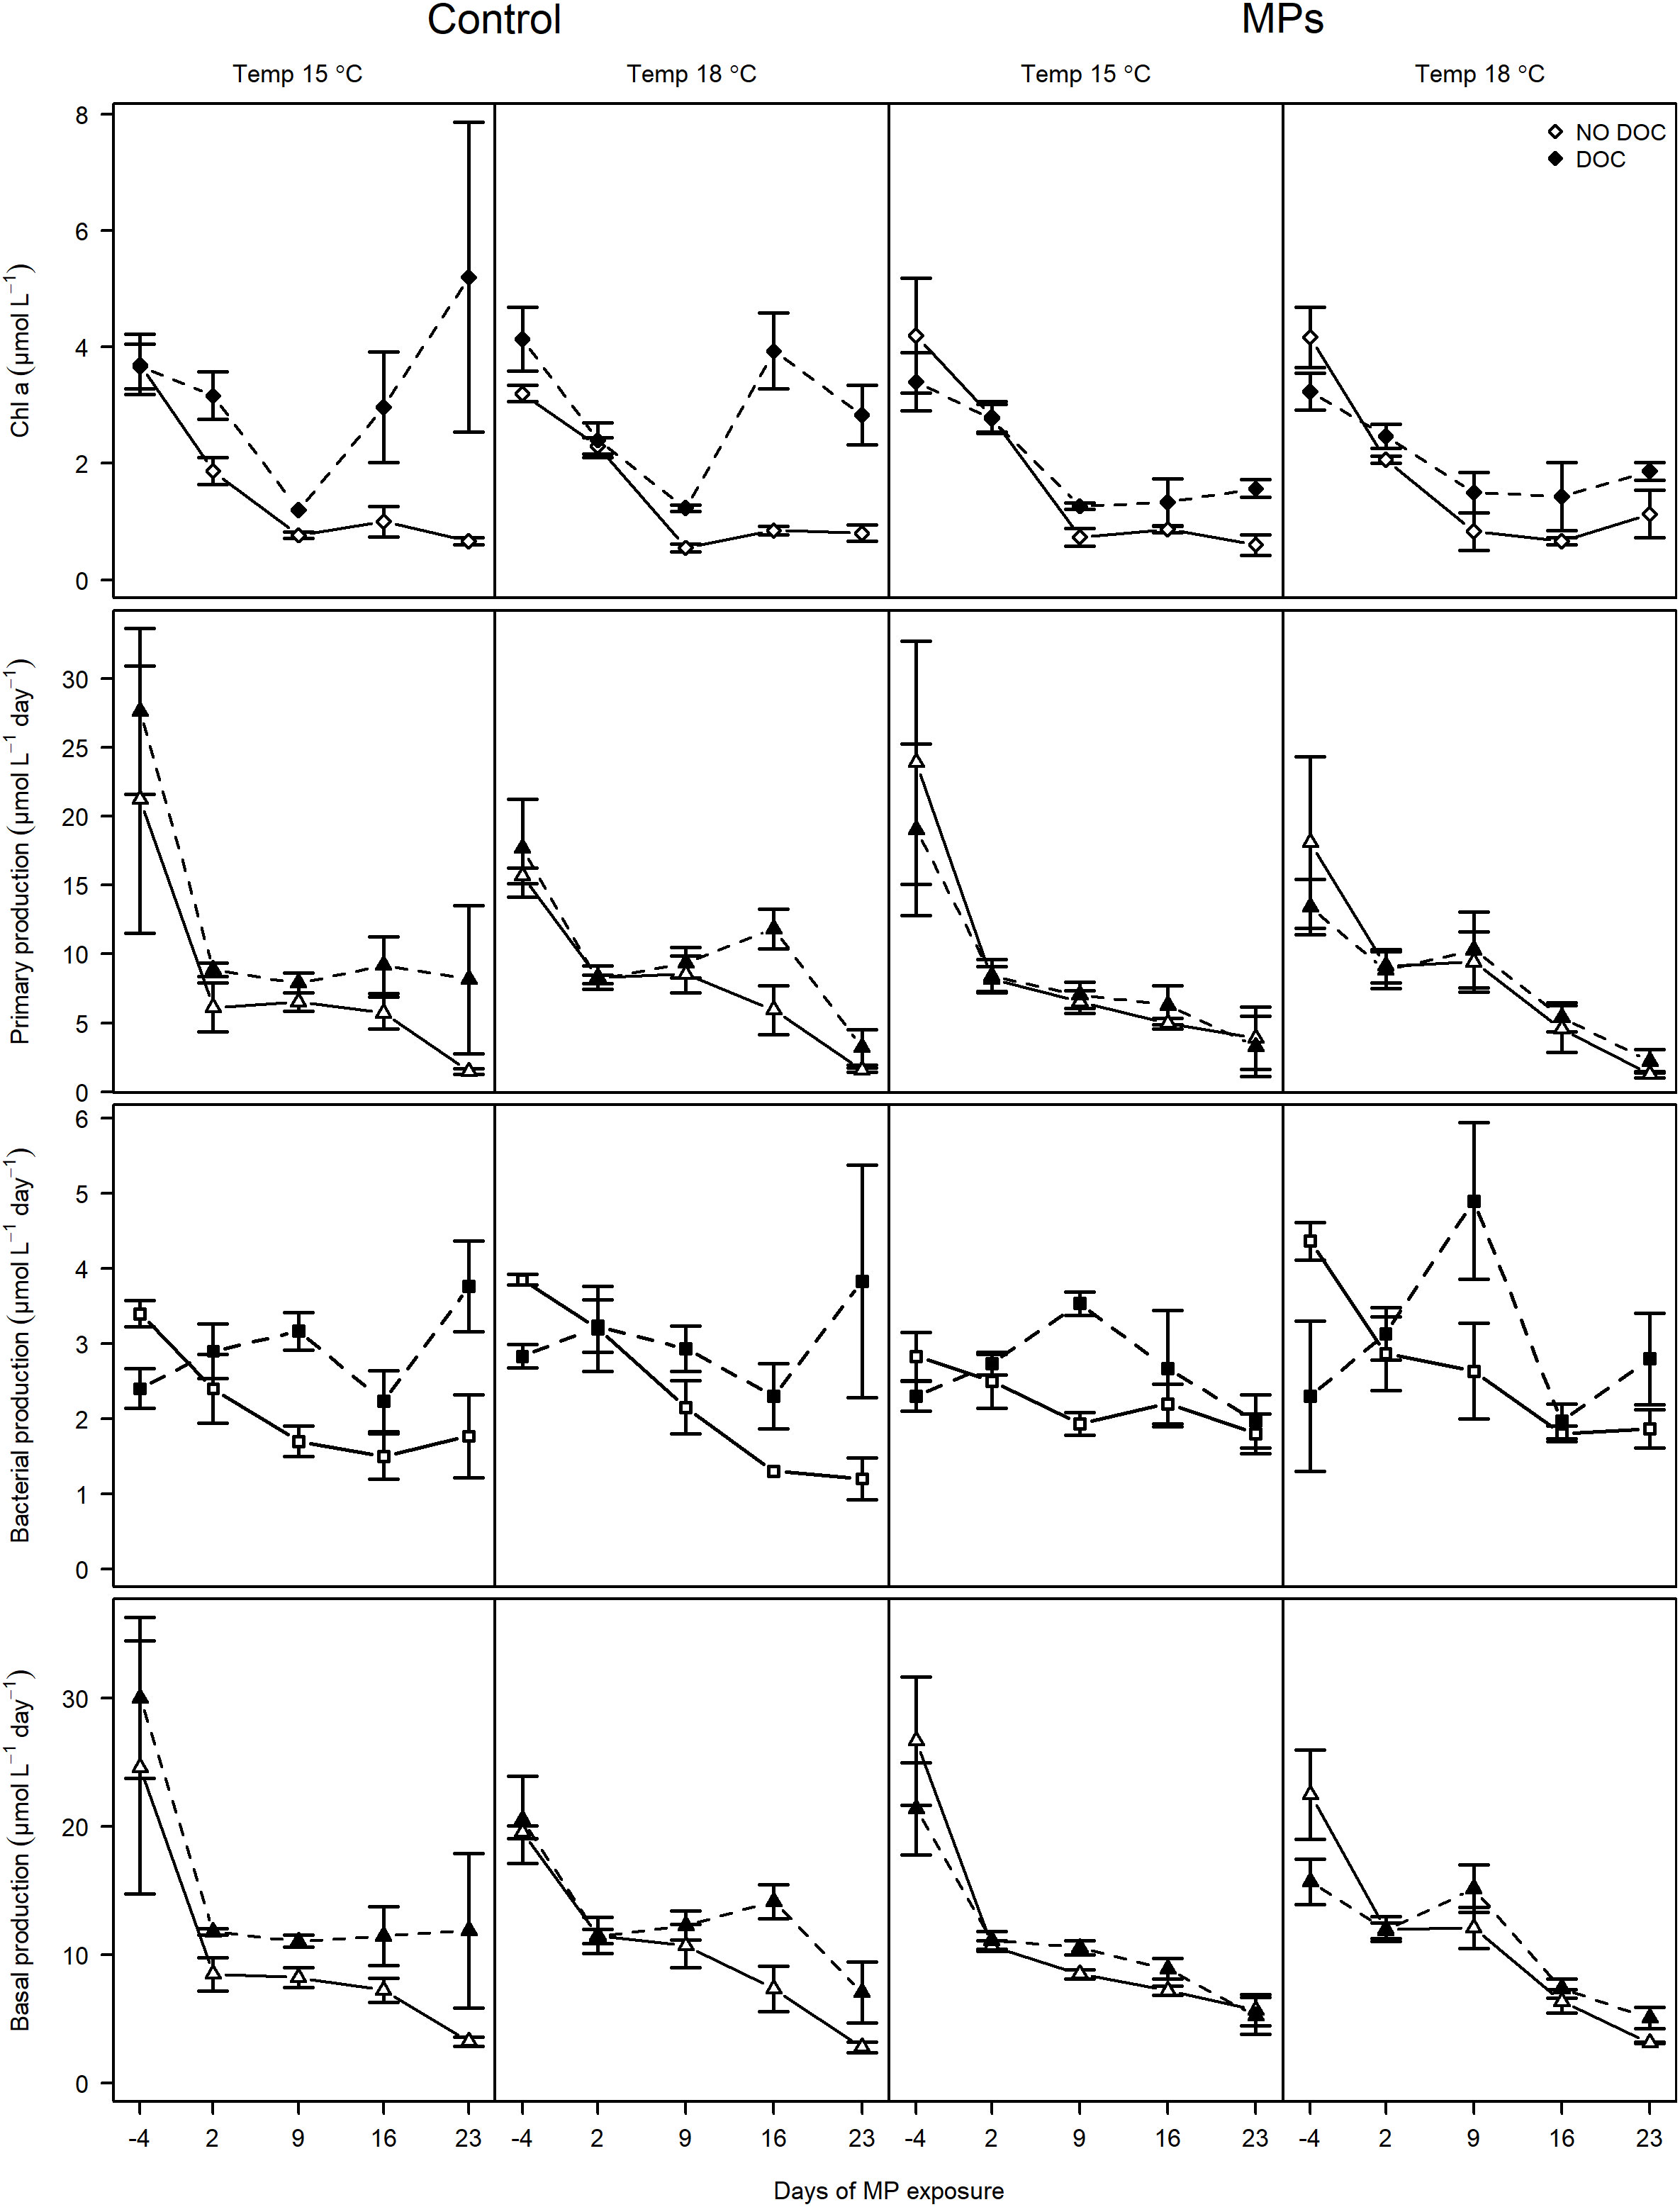
Figure 2 Temporal changes in Chlorophyll α, primary production, bacterial production and total basal production in different MP, tDOM and temperature factor combinations. The two columns to the left represent control mesocosms at 15 and 18°C and the two columns to the right represent MP exposed mesocosms at 15 and 18°C. Filled symbols and dashed lines are treatments with tDOM addition and open symbols with solid lines represent treatments without tDOM.
Abundances of bacteria, flagellates and mesozooplankton (but not ciliates) were stimulated by tDOM addition (p< 0.05 for all but ciliates; Figure 3). The temperature effect on the abundance was minor and the temporal trends differed between these four plankton groups (Supplementary Table S2). Bacterial abundance peaked in the middle of the experiment, with no significant unidirectional time effect, although it appeared to decline most in 18°C mesocosms (Figure 3). Flagellate communities were only sampled twice over the experiment (start and mid-time), and abundances were lower in mesocosms without tDOM at the last sampling occasion but also lower in 18°C treatments at the last sampling occasion (Figure 3; 2-way interactions time × tDOM and time × temp: p< 0.01 for both). Although the general pattern indicated that there was a peak in ciliate abundance at the later stage of the experiment, the timing of the peak differed between treatments (Figure 3; 2-way interactions time × tDOM and time × temp: p< 0.05 for both). These temporal patterns in ciliate abundance was, however, not significant (p > 0.06) when the relative change from the start of the experiment (Δ abundance) was assessed (Supplementary Figure S2, and Table S2).

Figure 3 Temporal change in the abundance of bacteria (top panels), flagellates (upper middle panels), ciliates (lower middle panels) and mesozooplankton (bottom panels) in different MP, tDOM and temperature factor combinations. The two columns to the left represent control mesocosms at 15 and 18°C and the two columns to the right represent MP exposed mesocosms at 15 and 18°C. Filled symbols and dashed lines are treatments with tDOM addition and open symbols with solid lines represent treatments without tDOM.
After an early peak in mesozooplankton abundance (Figure 3), mesozooplankton were strongly reduced throughout the experiment (p< 0.0001). The only MP effect on abundance was found for mesozooplankton, with lower abundances when MP was added (p< 0.05). However, the abundance of mesomesozooplankton was higher in control mesocosms, even prior to MP addition (day -4), and this MP–effect disappeared when the relative (Δ) mesozooplankton abundance was taken into account (Supplementary Figure S2). Early in the experiment, copepods were generally the most common zooplankton group based on abundances (52 ± 12%), followed by rotifers (41 ± 12%) and cladocerans (6.5 ± 4.0%). However, copepod contribution decreased with time to 34 ± 12% (Supplementary Figure S3), and by the end of the experiment, rotifers (59 ± 13%) were the most abundant mesozooplankton. The temporal decline in the percentage of copepods was more pronounced in mesocosms without tDOM (2-way interaction, time × tDOM: p< 0.05), especially at the lower temperature (15°C) (3-way interaction, time × tDOM × temp: p< 0.05). There were no significant treatment effect on the contribution of the older copepodite stages (stage 5 and adults; p > 0.05 for all treatments, data not shown) and they remained stable, albeit low (0.91 ± 0.61 ind L-1). Cladocera abundance fluctuated over the duration of the experiment, with a slight decrease toward the end (Supplementary Figure S3).
The absolute and Δ biomasses of flagellates, ciliates and mesozooplankton generally followed similar patterns as the absolute and Δ abundances. The biomass of flagellate and mesozooplankton decreased with time (Figure 4; p< 0.0001 for both), however Δ biomass of ciliates increased with time (Supplementary Figure S2; p< 0.05). There was a positive tDOM effect on flagellate and ciliate biomass, especially as the experiment progressed (p< 0.001 for all), but no such effect was observed for mesozooplankton. As observed for the abundance of mesozooplankton, MP addition decreased the biomass of mesozooplankton, although again, no such affect was observed for the Δ biomass of mesozooplankton. Due to their larger body sizes, and occurrence of older copepodite stages, the biomass of copepods (0.63 ± 0.48 µg L-1) was still higher than that of rotifers (0.29 ± 0.17 µg L-1) by the end of the experiment, despite the numerical dominance of the rotifers (Supplementary Figure S4). Still, the biomass of copepod, rotifer and cladocera were strongly reduced (from 1.85 ± 0.46 at day 2 to 0.63 ± 0.48 µg L-1, from 0.69 ± 0.20 at day 2 to 0.29 ± 0.174 µg L-1, and from 0.78 ± 0.23 µg L-1 at day 2 to 0.17 ± 0.11 µg L-1 by the end of the experiment, respectively; p< 0.001 for all). Although there was no effect of tDOM on absolute biomass of mesozooplankton (Figure 4), both rotifer and cladocera biomasses were higher in tDOM treated mesocosms (Supplementary Figure S4, p< 0.05 for both). Concurring with absolute biomass of mesozooplankton, all three mesozooplankton groups had higher biomasses in mesocosms without MP addition (p< 0.05 for all).
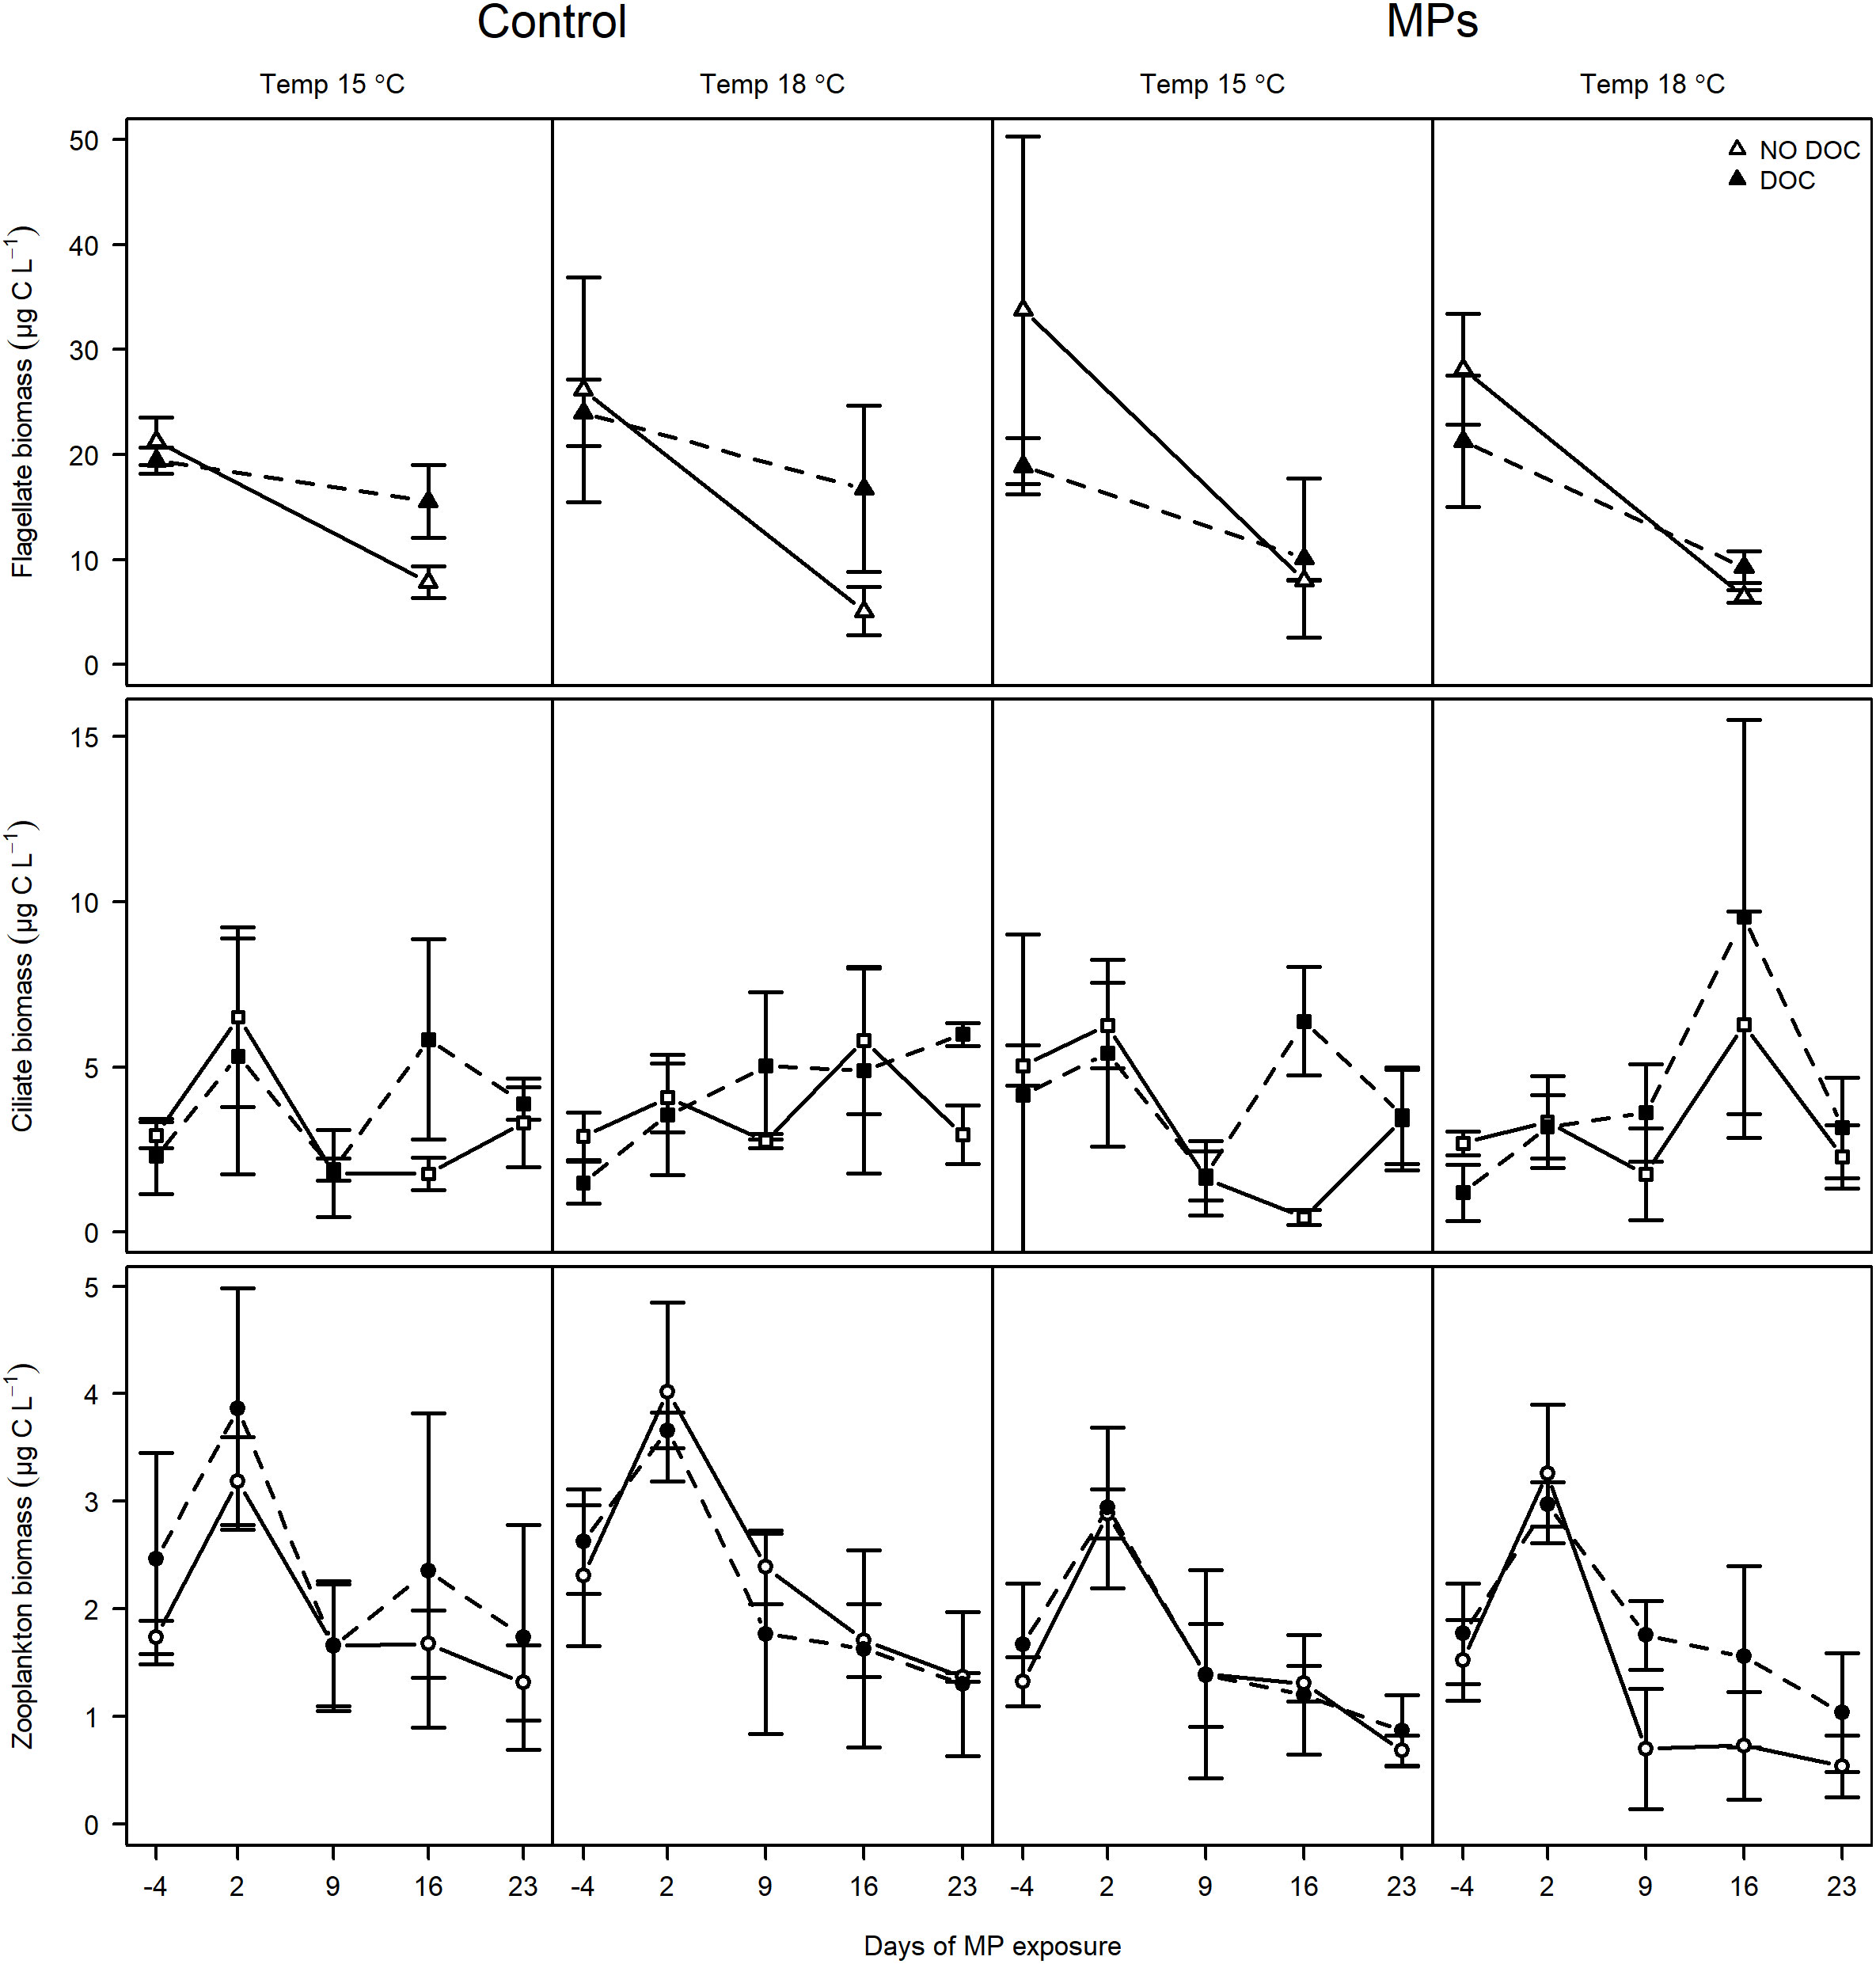
Figure 4 Temporal change in biomass of flagellates (top panels), ciliates (middle panels) and mesozooplankton (bottom panels) in different MP, tDOM and temperature factor combinations. The two columns to the left represent control mesocosms at 15 and 18°C and the two columns to the right represent MP exposed mesocosms at 15 and 18°C. Filled symbols and dashed lines are treatments with tDOM addition and open symbols with solid lines represent treatments without tDOM.
Fish biomass and survival were generally higher in 15°C mesocosms (Figures 5A, B). However, there was a three-way interaction between tDOM, MP and temperature, revealing a more complex temperature effect on fish survival, with the highest survival found in both 15 and 18°C mesocosms without MP and tDOM addition, and the lowest survival in 18°C mesocosms with tDOM addition or MP addition (Figure 5B). There was no correlation between mesozooplankton biomass and fish survival (p > 0.39 for all), but there was a positive correlation between mesozooplankton biomass and fish biomass (R = 0.45, p = 0.03). The FWE was lower in tDOM-treated mesocosms and at 18°, at least in mesocosms without MP addition (Figure 5C; 2-way interaction tDOM × MP; p< 0.05). In MP treated mesocosms, only temperature affected the FWE.
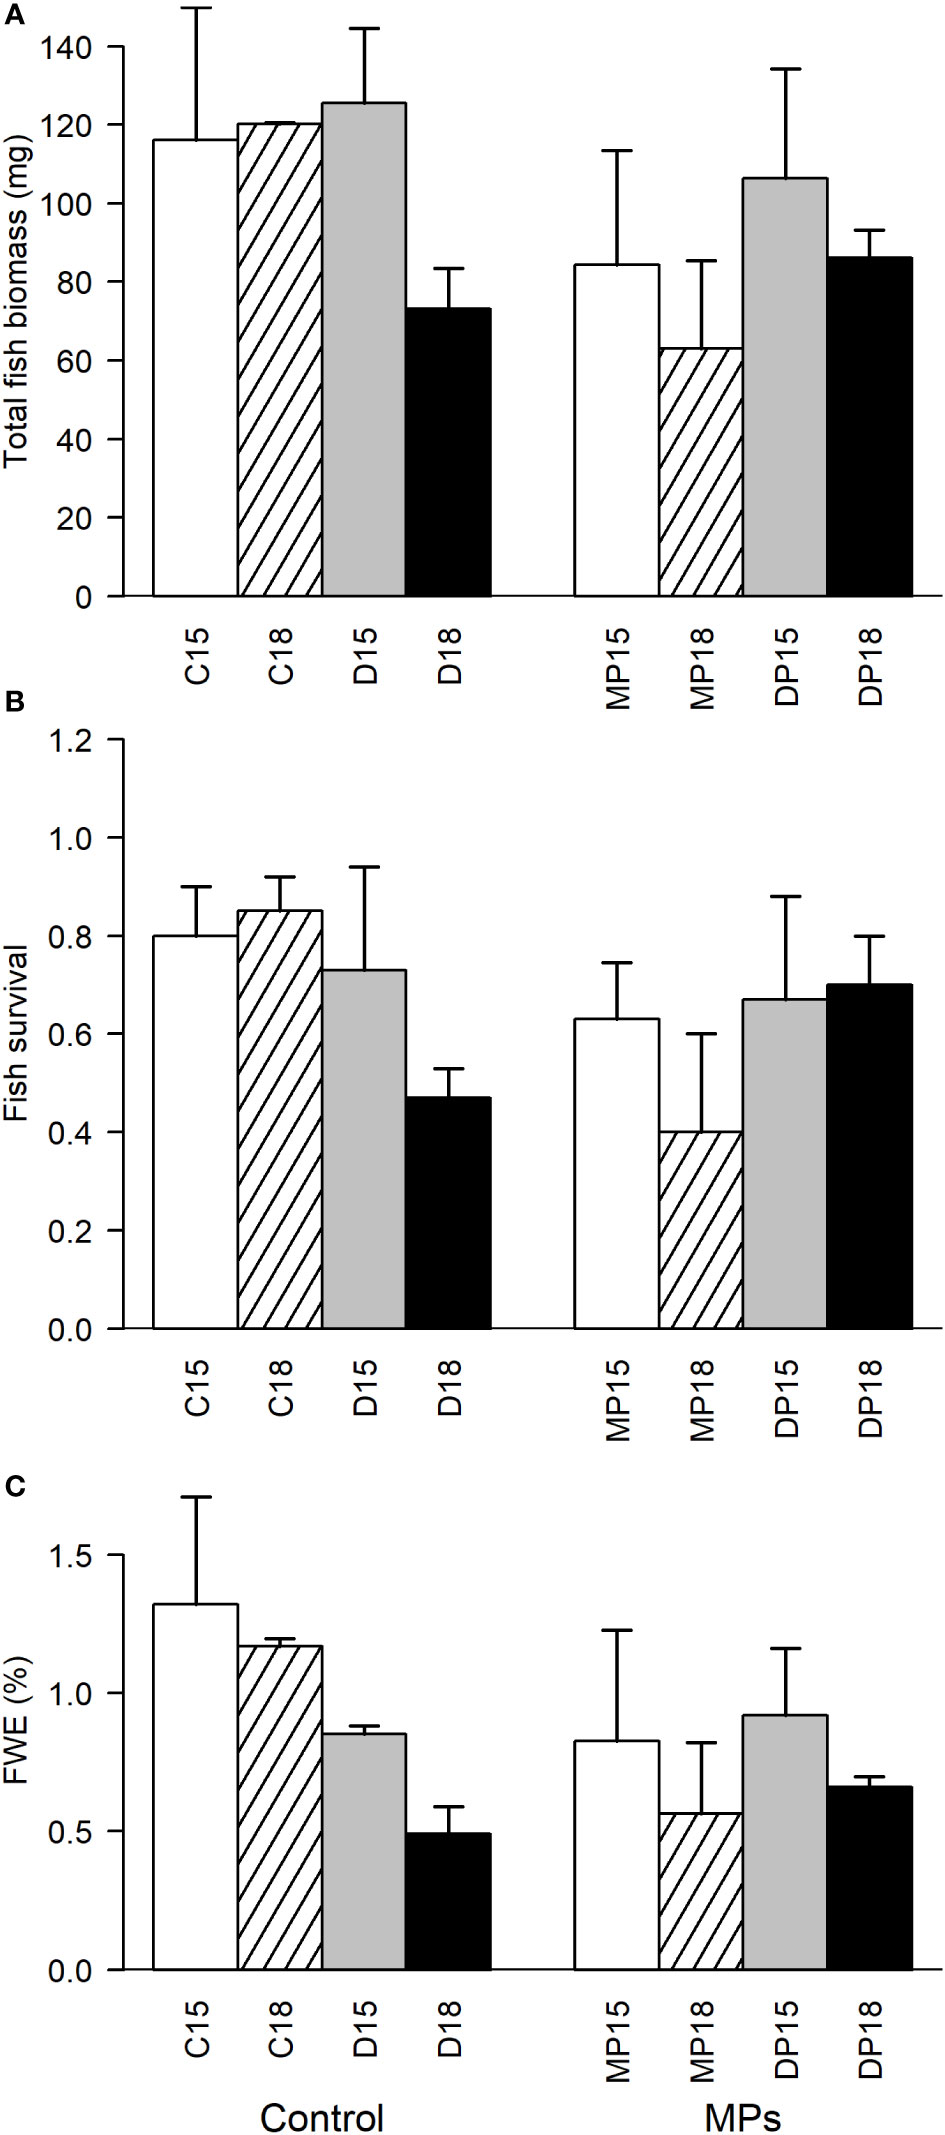
Figure 5 Total fish biomass (A), fish survival (B), and food web efficiency (FWE; C) at the final sampling of fish (day 23), in different MP, tDOM and temperature factor combinations. Left panel (Control) correspond to treatments without organic micropollutant addition, and right panel treatments with organic micropollutants. 15 and 18 correspond to the two temperature treatments (15 and 18°C), C is controls without tDOM or MP addition, D with tDOM addition, MP with micropollutants, and DP with both tDOM and micropollutants.
Twenty-four organic MPs were detected in fish (excluding 9 of the 33 spiked compounds with blank concentrations >10%), and 19 of these compounds were detected in the water after taking blanks into account (Ripszam et al., 2015). In fish, there was a general trend of higher MP concentrations at 15°C compared to 18°C treatments for most compounds (Supplementary Table S1). However, this was only significant for 10 compounds, viz. trifluralin, γ-HCH, 2,4,6-tribromoaniline, PCB28, chlorthal dimethyl, endosulfan I and II, mitotane, TPP and diflufenican and marginally non-significant for two additional compounds, viz. hexachlorobutadiene and α-HCH (p = 0.07 – 0.09, Supplementary Table S3). 2,4,6-tribromoaniline concentrations were also higher in fish from tDOM treated mesocosms (39 ± 10 vs. 94 ± 28 pg g-1), however no other compound showed an effect of tDOM.
The median BAFww ranged between 0.87 (ethoprophos) and 1.1×10⁴ (phenanthrene) (for lipid normalized BAF, see Supplementary Table S1). Overall, BAFs were generally slightly higher either at lower temperatures or in tDOM-treated mesocosms (Figure 6, Table S1). However, large within-treatment variability occurred due to the small sample size (n= 2-3 per treatment). In general, the variation in BAFww was especially pronounced in tDOM-treated mesocosms at lower temperature (15°C). Within the 15°C tDOM treatment, there was one mesocosm where fish accumulated considerably less MPs than the other mesocosms of the same treatment, but that mesocosm did not diverge from the other 15°C and tDOM-treated mesocosms with regard to the biological responses (e.g. survival, growth or biomass of fish). Despite of a large within-treatment variation, there were significantly higher BAFww for fish from 15°C than 18°C treatments with respect to chlorthal dimethyl and mitotane (Supplementary Table S4), and marginally higher BAFww for PCB28 and γHCH (p< 0.08). BAFww in fish was significantly higher in tDOM-treated mesocosms than mesocosms without tDOM for ethoprophos (Supplementary Table S4), and marginally higher for 2,4,6-tribromoaniline, TPP and TDCIPP (p< 0.09). The log Kow and Henry’s law constant for the compounds that showed a temperature-effect ranged between 3.8 and 6.4, and 0.22 and 27 Pa*m3/mol, respectively, and the log Kow and Henry’s law constant for compounds that showed a tDOM-effect ranged between 3.6 and 4.6, and 0.00026 and 0.21 Pa*m3/mol, respectively (Supplementary Table S1). However, the majority of the compounds within the same range of Kow and Henry’s law constant was not significantly affected by either temperature or tDOM.
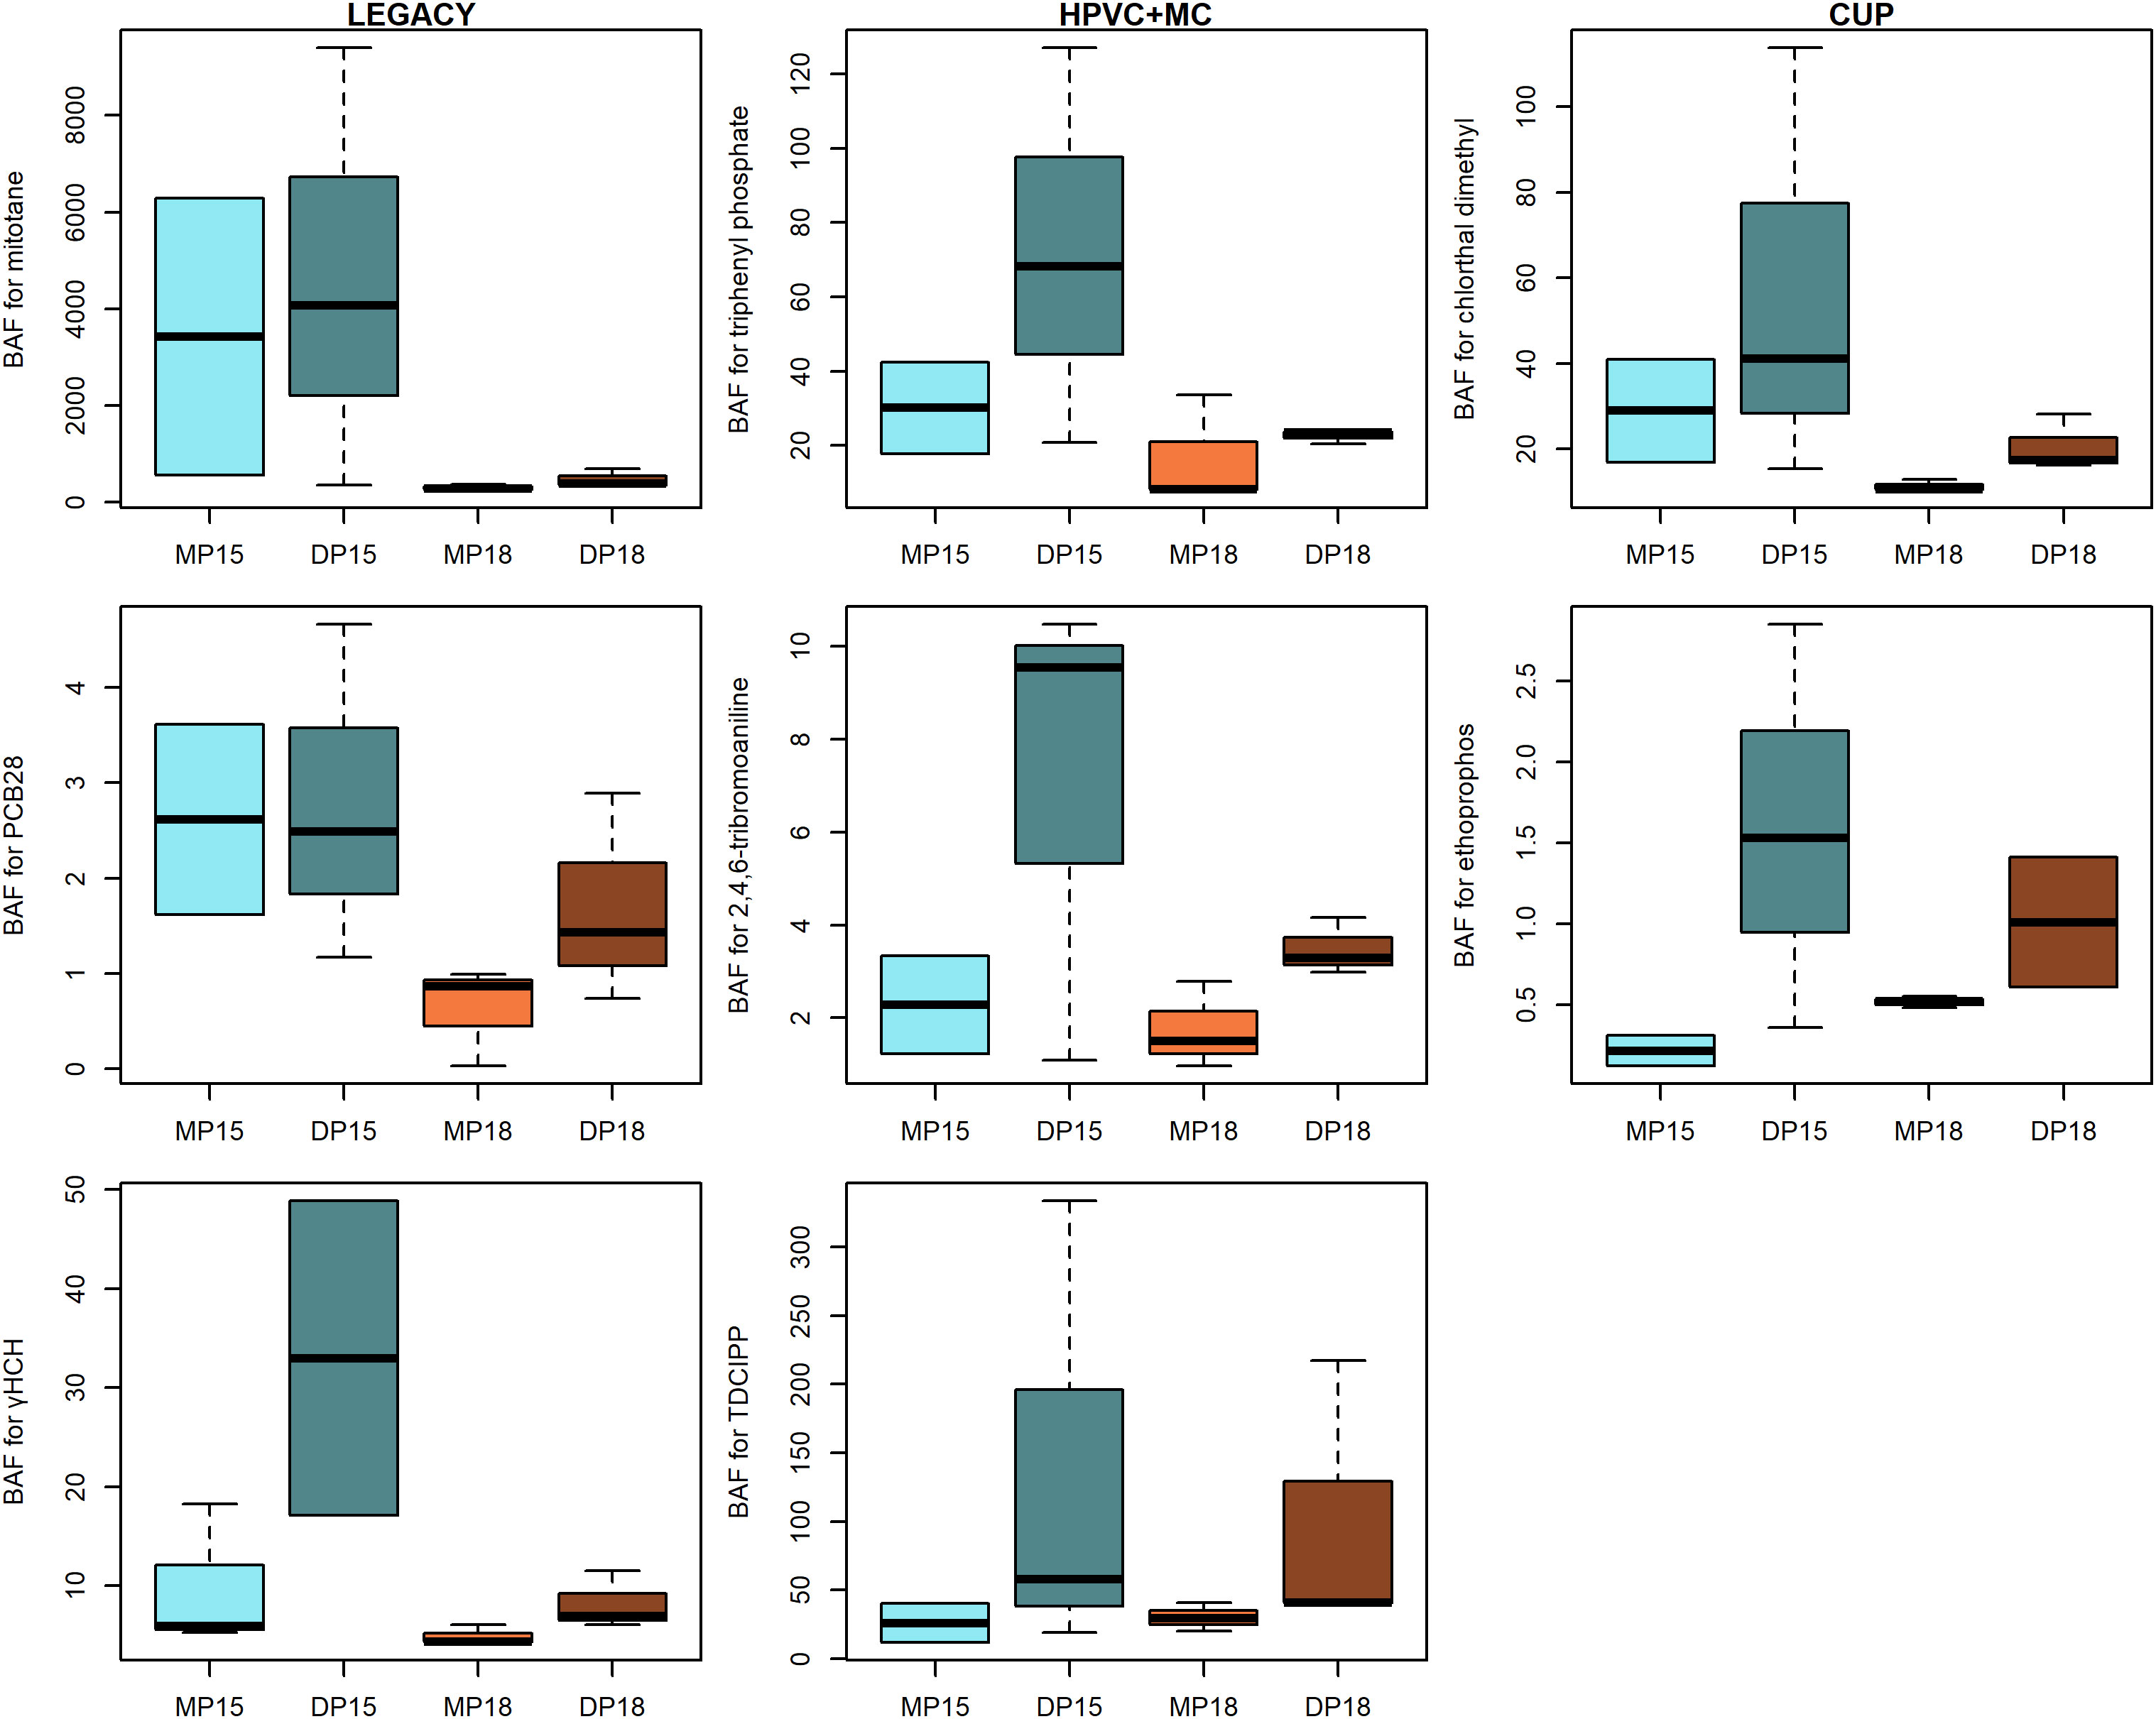
Figure 6 Bioaccumulation factors (based on wet weight) for organic micropollutants grouped into legacy pests/POPs (left panels), high production volume compounds as well as model compounds (HPVC + MC, middle panels) and currently and recently used pesticides (CUP, right panels). Pollutants are ordered based on their lipophilicity, with highest logKow at the top and lowest at the bottom. Blue boxes represent 15°C mesocosms and brown 18°C mesocosms. MP denotes mesocosms amended with organic micropollutants only, and DP represent mesocosms with organic MPs and tDOM. The boxes illustrate the interquartile range and the median, while whiskers represent the upper and lower quartile.
As expected, our results indicate that ecosystems in Baltic coastal regions, receiving high river discharge with future climate changes, can be influenced by foremost the nutrient enrichment due to the tDOM addition and, to a minor extent, by the elevated temperature at the bottom of the food web (Berglund et al., 2007; Lefebure et al., 2013; Andersson et al., 2015; Liess et al., 2015). If any, MP addition had a minor effect at the base of the food web. MP addition resulted in slightly higher nutrient and DOC concentrations than control mesocosms, and at the applied levels, phytoplankton was negatively affected by the MP addition, while heterotrophic bacteria was slightly benefitted. Although care was taken not to exceed toxic thresholds in the spiking mixture, the negative effect on PP and Chl α might indicate a toxic effect of the herbicides in the MP mixture. As such, the higher nutrient concentrations in MP treated mesocosms might be a consequence of the lower phytoplankton growth. The higher DOC concentration with MP-addition could be caused by the solvent for MPs, i.e. methanol (Rodriguez et al., 2018) and higher DOC concentrations may partly explain the positive MP-effect on bacteria, although bacteria probably also benefitted from a relaxed competition with phytoplankton. Terrestrial DOM-addition stimulated both heterotrophic bacteria and phytoplankton at the base of the food web. That tDOM stimulated phytoplankton was unexpected as shading of phytoplankton and thus reduced photosynthetic activity is expected when tDOM inflow increases in lakes and estuaries (Ask et al., 2012; McGovern et al., 2019). Although tDOM resulted in reduced PAR, the light was still intense enough to saturate photosynthesis (Andersson et al., 1994), which may be attributed to our relatively shallow (0.8 m) mesocosms. Our study thus suggest that an increase in tDOM inflow is unlikely to limit photosynthesis in the shallowest coastal areas. Although tDOM addition stimulated the food web from heterotrophic bacteria and phytoplankton to mesozooplankton, the temperature was generally more influential for fish survival and biomass. Increased temperature generally results in increased fish metabolism (Brown et al., 2004), and with limited food availability, as seen in our experiment, less resources can be allocated to growth. A higher metabolism with increasing temperature (18°C) could explain the lower FWE and total fish biomass in 18°C mesocosms, in line with previous studies (Berglund et al., 2007). Lower FWE in climate-altered food webs may indicate a food chain elongation, with more energy allocated via the heterotrophic microbial food web (Andersson et al., 2015). However, as both primary and heterotrophic bacterial production was benefitted in climate altered mesocosms, especially when MPs were absent, this needs to be interpreted with caution. In addition, MP treated mesocosms had slightly lower PP and Chl α, and MP treated mesocosms only showed marginal effects on FWE. Further, a more detailed study pinpointing the microbial food web in mesocosms without MP addition indicated that the systems tended to be net-autotrophic (Andersson et al., 2023). As such, it is less likely that the reduced FWE in climate-altered food web is an indication of an increase in trophic levels.
In addition to efficiently decreasing total mesozooplankton biomass, perch predation also shifted mesozooplankton community structure from more preferred copepods and cladocerans to the smaller and less preferred rotifers (Byström and García-Berthou, 1999). Higher growth rates in the latter and the temperature effect have most likely also contributed to the observed community shift. As such, fish suffered from strong resource limitation, and by the end of the experiment, mesozooplankton densities were approximately ten times lower than in coastal areas in the Bothnian Bay (Lefebure et al., 2014). The number of reproducing copepoids remained relatively low throughout the experiment, which may have contributed to limited mesozooplankton densities. Hence, it is likely that the observed low lipid content of fish (1.4%) and high mortality rates were caused by the food limitation. The predation pressure on mesozooplankton also released ciliates from mesozooplankton grazing, with cascading effects in the microbial food web. The more detailed study pinpointing the microbial food web in mesocosms without MP addition showed that tDOM addition increased the abundance of larger ciliates (> 60µm, dominated by Stylonychia sp.) (Andersson et al., 2023). A shift toward cilates of larger size could explain the higher Δ ciliate biomass in tDOM treated mesocosms in the present study (also including MP treatments).
There are many studies on the potential effects of climate change on contaminant distribution and fate, focusing on Arctic ecosystems, but they have mostly been based on modeling approaches (Borgå et al., 2010; Wang et al., 2016; Alava et al., 2018). According to the present study, bioaccumulation of MPs could either decrease or increase with a changing climate, depending on the compound and main driving factor (temperature or tDOM). The risk of bioaccumulation in fish would decrease for compounds that seem to be more temperature sensitive (e.g., mitotane, chlorthal dimethyl, PCB28 and γHCH), whereas for others (e.g., ethoprophos, TDCIPP, TPP, and 2,4,6-tribromoaniline) it would increase if tDOM increases. There were no obvious common denominators such as logKow, Henry’s law constant, group, or type of compounds, which could help foresee how MPs would be affected by temperature or tDOM. Although there was an overlap in log Kow between compounds that was affected by temperature and tDOM, compounds that bioaccumulated less when temperatures increased tended to have a higher log Kow (> 3.8) and compounds that bioaccumulated to a higher extent in tDOM treated mesocosms tended to have a slightly lower log Kow (< 4.6). However, this was not unanimous for all compounds. For example, trifluralin, with log Kow 5.07 showed no tendency of temperature-dependent bioaccumulation, even though chlorthal dimethyl and PCB28 with Kow 4.4 and 5.8, respectively, accumulated significantly less in fish from 18°C than 15°C treatments. In agreement, bioconcentration factors (BCF) in fish for a diverse set of pharmaceutical compounds showed deviating mechanisms for fish uptake, not following a lipophilicity-driven manner (Fick et al., 2010). These factors alone or in combination might explain the lack of consistent pattern between logKow and BAF, which are usually expected to be affected by the lipophilicity of a compound (Fisk et al., 1998). Also, assessing biomagnification factor (BMF) or trophic magnification factors (TMF) would have been useful in determining the biomagnification patterns and impact of food web changes (Borgå et al., 2012). However, limited amount of prey material prevented such studies.
Terrestrial DOM is expected to decrease the bioavailability of MPs due to increased partitioning to organic matter (Noyes et al., 2009). Micropollutants tended to partition to tDOM in the present study (Ripszam et al., 2015), which may have reduced the bioavailability for direct (diffusive) uptake in fish (Larsson et al., 1992). This would contrast our results, where tDOM increased the bioaccumulation, if a tDOM affect occurred. Increased biomagnification in fish, due to an increase in trophic levels with a more dominant microbial food web, could have explained the observed tDOM effect. However, we found limited support for a food chain elongation in MP treated mesocosms and the compounds that was affected by tDOM was intermediate, in terms of lipophilicity, i.e. not the compounds where biomagnification was primarily expected. Compound with log Kow > 5 are expected to be associated with tDOM and be largely absorbed via the diet (Gobas, 2001). As such, contrary to what was observed, we expected more lipophilic compounds to bioaccumulated with tDOM addition. An optional explanation for increased bioaccumulation in fish from tDOM treated mesocosms for intermediately lipophilic compounds may be that MPs could be transferred by bacteria up the food chain, when bacteria consume tDOM (Wallberg et al., 2001). As such, reduced bioavailability and diminished passive uptake in fish, due to MP-tDOM complexation (Ripszam et al., 2015), would be counteracted by the increased availability via contaminated diet, due to heterotrophic bacteria consuming contaminant-rich tDOM. However, the pathways for an increased bioaccumulation with increased tDOM, needs to be explored further. In addition, variation in BAF was considerable for tDOM treatments at 15°C due to one mesocosm with consistently lower MP concentrations in fish and a high variability may have prevented us from identifying additional compounds that were influenced by tDOM. There was no apparent biological explanation for the low MP concentrations in fish from this particular mesocosms, such as fish growth, survival and various food web responses. Data on individual lipid content may have helped understand this variation and generate more accurate BAFl estimates; unfortunately, mesocosm-specific lipid measurements were impossible due to the low amount of the sample material. However, the usefulness of BAFww and BAFl varies, depending on a compound’s lipophilicity and absorption route (Mackay et al., 2018). In addition, as the food availability was low and fish were close to starvation, the calculated BAF values may rather represent BCF.
The reduced bioaccumulation of MPs in warmer climates has been suggested previously (Noyes et al., 2009; Borgå et al., 2010; Kong et al., 2014), although both increased and decreased bioconcentration have been observed in mussels, depending on compound (Serra-Compte et al., 2018). However, the variability in temperature adaptation among species, and, more specifically, their growth response to the temperature increase, may affect MP accumulation. In particular, cold-water species are expected to have lower bioaccumulation than warm- or temperate species in a warmer climate (Gewurtz et al., 2006; Borgå et al., 2022). The limited growth response in our boreal perch probably explains the lack of corresponding bioaccumulation responses. Also, we found higher losses and lower partitioning of MPs to tDOM at higher temperatures (Ripszam et al., 2015). Thus, increased temperatures may promote MP evaporation and thus reduce the risk of accumulation in biota. However, at the regional scale, higher temperatures may also increase the runoff of MPs from secondary sources (Noyes et al., 2009; Wang et al., 2016; Borgå et al., 2022), which could counteract the effect of increased evaporation in coastal regions.
Higher temperatures not only directly affect MPs but also increase the physiological rates of fish, such as their metabolism (Brown et al., 2004). Thus, MP elimination and depuration are expected to increase in warmer conditions (Paterson et al., 2007; Alava et al., 2017). As such, reduced MP bioaccumulation at the higher temperature (Figure 6) was most likely a combination of the increased contaminant losses through evaporation (Ripszam et al., 2015) and increased fish metabolism. The generally lower biomass of fish in warmer mesocosms could also reflect an increased metabolism and energy expenditure, a response that agrees with previous studies (Gardner et al., 2011; Alava et al., 2017). It has also been suggested that adaptation to climate warming may reduce fish metabolic costs (Moffett et al., 2018). If this holds, and MPs are subsequently eliminated in fish at a slower pace, with a changing climate, the observed positive effects of increasing temperatures (i.e., reduced bioaccumulation of contaminants) may be diminished.
This study indicates that the projected climate change in northern Baltic Sea will promote the base of the food chain in shallow coastal areas. An efficient basal production, due to increased tDOM input, also affected the rest of the food web (from flagellates to mesozooplankton) and resulted in increased FWE in mesocosms without MPs. The temperature increase had little impact on lower trophic levels, but resulted in generally reduced growth and survival of the top consumer (fish). The climate-related conditions had differential effects on MP bioaccumulation: temperature increase led to lower bioaccumulation, potentially due to increased evaporation and fish metabolism, whereas tDOM addition increased bioaccumulation, potentially due to a food chain elongation or efficient contaminant transfer from heterotrophic bacteria. The mechanisms behind the temperature and tDOM-dependent bioaccumulation and their interactions need further exploration.
The datasets presented in this study can be found in online repositories. The names of the repository/repositories and accession number(s) can be found below: Swedish national data service, https://doi.org/10.5878/p8sx-n445.
The animal study was approved by the Swedish Ethical Review Authority (No. A28-13). The study was conducted in accordance with the local legislation and institutional requirements.
ÅB, CG, MR, HL, PB, PH, AA and MT designed the mesocosm experiment. ÅB, CG, MR, and HL conducted the experiment, and ÅB, CG, MR, HL, DF, EvG, PB, ElG, PH and AA performed analyzes. ÅB performed statistical analyzes and wrote the first draft of the manuscript with support from MT. All authors contributed to manuscript revision, read and approved the submitted version.
This work was financed by the EcoChange project (Dnr 2009-149) and the Kempe Foundation.
We would also like to acknowledge Jonas Forsberg for counting phytoplankton and the staff at Umeå Marine Sciences Centre (UMSC) for assistance and facilitation of the experiment.
The authors declare that the research was conducted in the absence of any commercial or financial relationships that could be construed as a potential conflict of interest.
All claims expressed in this article are solely those of the authors and do not necessarily represent those of their affiliated organizations, or those of the publisher, the editors and the reviewers. Any product that may be evaluated in this article, or claim that may be made by its manufacturer, is not guaranteed or endorsed by the publisher.
The Supplementary Material for this article can be found online at: https://www.frontiersin.org/articles/10.3389/fmars.2023.1244434/full#supplementary-material
Alava J. J., Cheung W. W. L., Ross P. S., Sumaila U. R. (2017). Climate change-contaminant interactions in marine food webs: Toward a conceptual framework. Global Change Biol. 23, 3984–4001. doi: 10.1111/gcb.13667
Alava J. J., Cisneros-Montemayor A. M., Sumaila U. R., Cheung W. W. L. (2018). Projected amplification of food web bioaccumulation of MeHg and PCBs under climate change in the Northeastern Pacific. Sci. Rep. 8:13460. doi: 10.1038/s41598-018-31824-5
Andersson A., Grinienė E., Berglund Å. M. M., Brugel S., Gorokhova E., Figueroa D., et al. (2023). Microbial food web changes induced by terrestrial organic matter and elevated temperature in the coastal northern Baltic Sea. Front. Mar. Sci. 10. doi: 10.3389/fmars.2023.1170054
Andersson A., Haecky P., Hagström Å. (1994). Effect of temperature and light on the growth of micro-plankton, nano-plankton and pico-plankton - impact on algal succession. Mar. Biol. 120, 511–520. doi: 10.1007/BF00350071
Andersson A., Hajdu S., Haecky P., Kuparinen J., Wikner J. (1996). Succession and growth limitation of phytoplankton in the Gulf of Bothnia (Baltic Sea). Mar. Biol. 126, 791–801. doi: 10.1007/BF00351346
Andersson A., Meier H. E. M., Ripszam M., Rowe O., Wikner J., Haglund P., et al. (2015). Projected future climate change and Baltic Sea ecosystem management. Ambio 44, S345–S356. doi: 10.1007/s13280-015-0654-8
Ask J., Karlsson J., Jansson M. (2012). Net ecosystem production in clear-water and brown-water lakes. Global Biogeochemical Cycles 26:GB1017. doi: 10.1029/2010gb003951
Assefa A. T., Sobek A., Sundqvist K. L., Cato I., Jonsson P., Tysklind M., et al. (2014). Temporal trends of PCDD/fs in baltic sea sediment cores covering the 20th century. Environ. Sci. Technol. 48, 947–953. doi: 10.1021/es404599z
Assefa A., Tysklind M., Bignert A., Josefsson S., Wiberg K. (2019). Sources of polychlorinated dibenzo-p-dioxins and dibenzofurans to Baltic Sea herring. Chemosphere 218, 493–500. doi: 10.1016/j.chemosphere.2018.11.051
Bécue-Bertaut M., Pagès J. (2008). Multiple factor analysis and clustering of a mixture of quantitative, categorical and frequency data. Comput. Stat Data Anal. 52, 3255–3268. doi: 10.1016/j.csda.2007.09.023
Berglund J., Müren U., Båmstedt U., Andersson A. (2007). Efficiency of a phytoplankton-based and a bacteria-based food web in a pelagic marine system. Limnology Oceanography 52, 121–131. doi: 10.4319/lo.2007.52.1.0121
Bergström S., Carlsson B., Gardelin M., Lindström G., Pettersson A., Rummukainen M. (2001). Climate change impacts on runoff in Sweden‘ assessments by global climate models, dynamical downscaling and hydrological modelling. Climate Res. 16, 101–112. doi: 10.3354/cr016101
Borgå K., Fisk A. T., Hoekstra P. F., Muir D. C. G. (2004). Biological and chemical factors of importance in the bioaccumulation and trophic transfer of persistent organochlorine contaminants in arctic marine food webs. Environ. Toxicol. Chem. 23, 2367–2385. doi: 10.1897/03-518
Borgå K., Kidd K. A., Muir D. C. G., Berglund O., Conder J. M., Gobas F. A. P. C., et al. (2012). Trophic magnification factors: Considerations of ecology, ecosystems, and study design. Integrated Environ. Assess. Manage. 8, 64–84. doi: 10.1002/ieam.244
Borgå K., McKinney M. A., Routti H., Fernie K. J., Giebichenstein J., Hallanger I., et al. (2022). The influence of global climate change on accumulation and toxicity of persistent organic pollutants and chemicals of emerging concern in Arctic food webs. Environ. Science-Processes Impacts 24, 1544–1576. doi: 10.1039/d1em00469g
Borgå K., Saloranta T. M., Ruus A. (2010). Simulating climate change-induced alterations in bioaccumulation of organic contaminants in an Arctic marine food web. Environ. Toxicol. Chem. 29, 1349–1357. doi: 10.1002/etc.159
Brown J. H., Gillooly J. F., Allen A. P., Savage V. M., West G. B. (2004). Toward a metabolic theory of ecology. Ecology 85, 1771–1789. doi: 10.1890/03-9000
Burnham K. P., Anderson D. R., Huyvaert K. P. (2011). AIC model selection and multimodel inference in behavioral ecology: some background, observations, and comparisons. Behav. Ecol. Sociobiology 65, 23–35. doi: 10.1007/s00265-010-1029-6
Byström P., García-Berthou E. (1999). Density dependent growth and size specific competitive interactions in young fish. Oikos 86, 217–232. doi: 10.2307/3546440
Carrie J., Wang F., Sanei H., Macdonald R. W., Outridge P. M., Stern G. A. (2010). Increasing contaminant burdens in an arctic fish, burbot (Lota lota), in a warming climate. Environ. Sci. Technol. 44, 316–322. doi: 10.1021/es902582y
Creed I. F., Bergström A.-K., Trick C. G., Grimm N. B., Hessen D. O., Karlsson J., et al. (2018). Global change-driven effects on dissolved organic matter composition: Implications for food webs of northern lakes. Global Change Biol. 24, 3692–3714. doi: 10.1111/gcb.14129
Directive 2008/105/EC (2008). Directive 2008/105/EC. (Brussels: THE EUROPEAN PARLIAMENT AND THE COUNCIL OF THE EUROPEAN UNION).
Fick J., Lindberg R. H., Parkkonen J., Arvidsson B., Tysklind M., Larsson D. G. J. (2010). Therapeutic levels of levonorgestrel detected in blood plasma of fish: results from screening rainbow trout exposed to treated sewage effluents. Environ. Sci. Technol. 44, 2661–2666. doi: 10.1021/es903440m
Figueroa D., Rowe O. F., Paczkowska J., Legrand C., Andersson A. (2016). Allochthonous carbon—a major driver of bacterioplankton production in the subarctic northern baltic sea. Microbial Ecol. 71, 789–801. doi: 10.1007/s00248-015-0714-4
Fisk A. T., Norstrom R. J., Cymbalisty C. D., Muir D. C. G. (1998). Dietary accumulation and depuration of hydrophobic organochlorines: Bioaccumulation parameters and their relationship with the octanol/water partition coefficient. Environ. Toxicol. Chem. 17, 951–961. doi: 10.1002/etc.5620170526
Fuhrman J. A., Azam F. (1982). Thymidine incorporation as a measure of heterotrophic bacterioplankton production in marine surface waters - evaluation and field results. Mar. Biol. 66, 109–120. doi: 10.1007/bf00397184
Gardner J. L., Peters A., Kearney M. R., Joseph L., Heinsohn R. (2011). Declining body size: a third universal response to warming? Trends Ecol. Evol. 26, 285–291. doi: 10.1016/j.tree.2011.03.005
Gargas E. (1975). A manual for Phytoplankton Production Studies in the Baltic (Horsholm, Denmark: Water Quality Institute).
Gewurtz S. B., Laposa R., Gandhi N., Christensen G. N., Evenset A., Gregor D., et al. (2006). A comparison of contaminant dynamics in arctic and temperate fish: A modeling approach. Chemosphere 63, 1328–1341. doi: 10.1016/j.chemosphere.2005.09.031
Gilbreath A. N., McKee L. J. (2015). Concentrations and loads of PCBs, dioxins, PAHs, PBDEs, OC pesticides and pyrethroids during storm and low flow conditions in a small urban semi-arid watershed. Sci. Total Environ. 526, 251–261. doi: 10.1016/j.scitotenv.2015.04.052
Gobas F. A. P. C. (2001). “Assessing bioaccumulation factors of persistent Organic Pollutants in Aquatic Food-Chains,” in Persistent Organic Pollutants: Environmental Behaviour and Pathways of Human Exposure. Ed. Harrad S. (US, Boston, MA: Springer), 145–165.
Gobas F. A. P. C., Wilcockson J. B., Russell R. W., Haffner G. D. (1999). Mechanism of biomagnification in fish under laboratory and field conditions. Environ. Sci. Technol. 33, 133–141. doi: 10.1021/es980681m
Haitzer M., Hoss S., Traunspurger W., Steinberg C. (1998). Effects of dissolved organic matter (DOM) on the bioconcentration of organic chemicals in aquatic organisms - A review. Chemosphere 37, 1335–1362. doi: 10.1016/s0045-6535(98)00117-9
Hernroth L. (1985). Recommendations on Methods for Marine Biological Studies in the Baltic Sea: Mesozooplankton Biomass Assessment; Individual Volume Technique (Lysekil: Institute of Marine Research).
Kallenborn R., Halsall C., Dellong M., Carlsson P. (2012). The influence of climate change on the global distribution and fate processes of anthropogenic persistent organic pollutants. J. Environ. Monit. 14, 2854–2869. doi: 10.1039/C2EM30519D
Kong D. G., MacLeod M., Cousins I. T. (2014). Modelling the influence of climate change on the chemical concentrations in the Baltic Sea region with the POPCYCLING-Baltic model. Chemosphere 110, 31–40. doi: 10.1016/j.chemosphere.2014.02.044
Larsson P., Collvin L., Okla L., Meyer G. (1992). Lake productivity and water chemistry as govenors of the uptake of persistent pollutants in fish. Environ. Sci. Technol. 26, 346–352. doi: 10.1021/es00026a016
Lee S., Fuhrman J. A. (1987). Relationships between biovolume and biomass of naturally dervied marine bacterioplankton. Appl. Environ. Microbiol. 53, 1298–1303. doi: 10.1128/aem.53.6.1298-1303.1987
Lefebure R., Degerman R., Andersson A., Larsson S., Eriksson L. O., Bamstedt U., et al. (2013). Impacts of elevated terrestrial nutrient loads and temperature on pelagic food-web efficiency and fish production. Glob Chang Biol. 19, 1358–1372. doi: 10.1111/gcb.12134
Lefebure R., Larsson S., Bystrom P. (2014). Temperature and size-dependent attack rates of the three-spined stickleback (Gasterosteus aculeatus); are sticklebacks in the Baltic Sea resource-limited? J. Exp. Mar. Biol. Ecol. 451, 82–90. doi: 10.1016/j.jembe.2013.11.008
Lester M. B., van Riper C. (2014). The distribution and extent of heavy metal accumulation in song sparrows along Arizona’s upper Santa Cruz River. Environ. Monit. Assess. 186, 4779–4791. doi: 10.1007/s10661-014-3737-2
Liess A., Rowe O., Francoeur S. N., Guo J., Lange K., Schröder A., et al. (2015). Terrestrial runoff boosts phytoplankton in a Mediterranean coastal lagoon, but these effects do not propagate to higher trophic levels. Hydrobiologia 766, 275–291. doi: 10.1007/s10750-015-2461-4
Lignell R., Hoikkala L., Lahtinen T. (2008). Effects of inorganic nutrients, glucose and solar radiation on bacterial growth and exploitation of dissolved organic carbon and nitrogen in the northern Baltic Sea. Aquat. Microbial Ecol. 51, 209–221. doi: 10.3354/ame01202
Mackay D., Celsie A. K. D., Powell D. E., Parnis J. M. (2018). Bioconcentration, bioaccumulation, biomagnification and trophic magnification: a modelling perspective. Environ. Science-Processes Impacts 20, 72–85. doi: 10.1039/c7em00485k
Marie D., Simon N., Vaulot D. (2005). “Phytoplankton cell counting by flow cytometry,” in Algal Culturing Techniques. Ed. Andersen R. A. (San Diego, CA: Academic Press), 253–267.
McGovern M., Evenset A., Borgå K., de Wit H. A., Braaten H. F. V., Hessen D. O., et al. (2019). Implications of coastal darkening for contaminant transport, bioavailability, and trophic transfer in northern coastal waters. Environ. Sci. Technol. 53, 7180–7182. doi: 10.1021/acs.est.9b03093
Meier H. E. M. (2006). Baltic Sea climate in the late twenty-first century: a dynamical downscaling approach using two global models and two emission scenarios. Climate Dynamics 27, 39–68. doi: 10.1007/s00382-006-0124-x
Meier H. E. M., Kniebusch M., Dieterich C., Gröger M., Zorita E., Elmgren R., et al. (2022). Climate change in the Baltic Sea region: a summary. Earth Syst. Dynam 13, 457–593. doi: 10.5194/esd-13-457-2022
Menden-Deuer S., Lessard E. J. (2000). Carbon to volume relationships for dinoflagellates, diatoms, and other protist plankton. Limnology Oceanography 45, 569–579. doi: 10.4319/lo.2000.45.3.0569
Miller A., Hedman J. E., Nyberg E., Haglund P., Cousins I. T., Wiberg K., et al. (2013). Temporal trends in dioxins (polychlorinated dibenzo-p-dioxin and dibenzofurans) and dioxin-like polychlorinated biphenyls in Baltic herring (Clupea harengus). Mar. pollut. Bull. 73, 220–230. doi: 10.1016/j.marpolbul.2013.05.015
Moffett E. R., Fryxell D. C., Palkovacs E. P., Kinnison M. T., Simon K. S. (2018). Local adaptation reduces the metabolic cost of environmental warming. Ecology 99, 2318–2326. doi: 10.1002/ecy.2463
Neumann T. (2010). Climate-change effects on the Baltic Sea ecosystem: A model study. J. Mar. Syst. 81, 213–224. doi: 10.1016/j.jmarsys.2009.12.001
Noyes P. D., Lema S. C. (2015). Forecasting the impacts of chemical pollution and climate change interactions on the health of wildlife. Curr. Zoology 61, 669–689. doi: 10.1093/czoolo/61.4.669
Noyes P. D., McElwee M. K., Miller H. D., Clark B. W., Van Tiem L. A., Walcott K. C., et al. (2009). The toxicology of climate change: Environmental contaminants in a warming world. Environ. Int. 35, 971–986. doi: 10.1016/j.envint.2009.02.006
Olenina I., Hajdu S., Edler L., Andersson A., Wasmund N., Busch S., et al. (2006). Biovolumes and size-classes of phytoplankton in the Baltic Sea. HELCOM Balt. Sea Environ. Proc. 106, 1–144.
Paterson G., Drouillard K. G., Haffner G. D. (2007). PCB elimination by yellow perch (Perca flavescens) during an annual temperature cycle. Environ. Sci. Technol. 41, 824–829. doi: 10.1021/es060266r
Rand P. S., Stewart D. J. (1998). Prey fish exploitation, salmonine production, and pelagic food web efficiency in Lake Ontario. Can. J. Fisheries Aquat. Sci. 55, 318–327. doi: 10.1139/f97-254
Ripszam M., Gallampois C. M. J., Berglund Å, Larsson H., Andersson A., Tysklind M., et al. (2015). Effects of predicted climatic changes on distribution of organic contaminants in brackish water mesocosms. Sci. Total Environ. 517, 10–21. doi: 10.1016/j.scitotenv.2015.02.051
Rodriguez J., Gallampois C. M. J., Timonen S., Andersson A., Sinkko H., Haglund P., et al. (2018). Effects of organic pollutants on bacterial communities under future climate change scenarios. Front. Microbiol. 9. doi: 10.3389/fmicb.2018.02926
R Core Team (2019). R: A language and Environment for Statistical Computing R Foundation for Statistical Computing (Austria: Vienna).
Serra-Compte A., Maulvault A. L., Camacho C., Alvarez-Munoz D., Barcelo D., Rodriguez-Mozaz S., et al. (2018). Effects of water warming and acidification on bioconcentration, metabolization and depuration of pharmaceuticals and endocrine disrupting compounds in marine mussels (&ITMytilus galloprovincialis&IT). Environ. pollut. 236, 824–834. doi: 10.1016/j.envpol.2018.02.018
Solórzano L., Sharp J. H. (1980). Determination of total dissolved phosphorus and particulate phosphorus in natural waters1. Limnology Oceanography 25, 754–758. doi: 10.4319/lo.1980.25.4.0754
Stepanauskas R., Jorgensen N. O. G., Eigaard O. R., Zvikas A., Tranvik L. J., Leonardson L. (2002). Summer inputs of riverine nutrients to the Baltic Sea: Bioavailability and eutrophication relevance. Ecol. Monogr. 72, 579–597. doi: 10.2307/3100058
Su C., Song S., Lu Y. L., Liu S. J., Giesy J. P., Chen D. L., et al. (2018). Potential effects of changes in climate and emissions on distribution and fate of perfluorooctane sulfonate in the Bohai Rim, China. Sci. Total Environ. 613, 352–360. doi: 10.1016/j.scitotenv.2017.09.021
Sundkvist A. M., Olofsson U., Haglund P. (2010). Organophosphorus flame retardants and plasticizers in marine and fresh water biota and in human milk. J. Environ. Monit. 12, 943–951. doi: 10.1039/B921910B
Sundqvist K. L., Tysklind M., Cato I., Bignert A., Wiberg K. (2009). Levels and homologue profiles of PCDD/Fs in sediments along the Swedish coast of the Baltic Sea. Environ. Sci. pollut. Res. 16, 396–409. doi: 10.1007/s11356-009-0110-z
Swedish Institute for the Marine Environment (2023) Swedish Water Environment. Available at: https://www.sverigesvattenmiljo.se/.
Utermöhl H. (1958). Zur vervollkommnung der quantitativen phytoplankton-methodik. Internationale Vereinigung für theoretische und angewandte Limnologie. Mitteilungen 9, 1–38. doi: 10.1080/05384680.1958.11904091
US EPA (1997). “Method 446.0: In Vitro Determination of Chlorophylls a, b, c + c and Pheopigments in Marine And Freshwater Algae by Visible Spectrophotometry,” in National Exposure Research Laboratory Office of Research and Development. U.S. Environmental protection Agency C, Ohio 45268 (Cincinnati, Ohio: U.S. Environmental Protection Agency).
Wallberg P., Jonsson P. R., Andersson A. (2001). Trophic transfer and passive uptake of a polychlorinated biphenyl in experimental marine microbial communities. Environ. Toxicol. Chem. 20, 2158–2164. doi: 10.1897/1551-5028(2001)020<2158:ttapuo>2.0.co;2
Wang X. P., Sun D. C., Yao T. D. (2016). Climate change and global cycling of persistent organic pollutants: A critical review. Sci. China-Earth Sci. 59, 1899–1911. doi: 10.1007/s11430-016-5073-0
Keywords: organic contaminants, climate impact, food web, bioaccumulation, ecology, Bothnian Sea
Citation: Berglund ÅMM, Gallampois C, Ripszam M, Larsson H, Figueroa DA, Grinienė E, Byström P, Gorokhova E, Haglund P, Andersson A and Tysklind M (2023) Effects on the food-web structure and bioaccumulation patterns of organic contaminants in a climate-altered Bothnian Sea mesocosms. Front. Mar. Sci. 10:1244434. doi: 10.3389/fmars.2023.1244434
Received: 22 June 2023; Accepted: 27 September 2023;
Published: 19 October 2023.
Edited by:
Xin Lin, Xiamen University, ChinaCopyright © 2023 Berglund, Gallampois, Ripszam, Larsson, Figueroa, Grinienė, Byström, Gorokhova, Haglund, Andersson and Tysklind. This is an open-access article distributed under the terms of the Creative Commons Attribution License (CC BY). The use, distribution or reproduction in other forums is permitted, provided the original author(s) and the copyright owner(s) are credited and that the original publication in this journal is cited, in accordance with accepted academic practice. No use, distribution or reproduction is permitted which does not comply with these terms.
*Correspondence: Åsa M. M. Berglund, YXNhLmJlcmdsdW5kQHVtdS5zZQ==
Disclaimer: All claims expressed in this article are solely those of the authors and do not necessarily represent those of their affiliated organizations, or those of the publisher, the editors and the reviewers. Any product that may be evaluated in this article or claim that may be made by its manufacturer is not guaranteed or endorsed by the publisher.
Research integrity at Frontiers
Learn more about the work of our research integrity team to safeguard the quality of each article we publish.