 Ayumi Maeda
 Miyuki Nishijima1
 Akira Iguchi
 Yuki Ota
 Masahiro Suzumura
 Atsushi Suzuki
95% of researchers rate our articles as excellent or good
Learn more about the work of our research integrity team to safeguard the quality of each article we publish.
Find out more
ORIGINAL RESEARCH article
Front. Mar. Sci. , 31 January 2024
Sec. Deep-Sea Environments and Ecology
Volume 10 - 2023 | https://doi.org/10.3389/fmars.2023.1243713
Foraminifera are adapted to a wide range of environments, and environmental DNA (eDNA) metabarcoding of foraminifera should facilitate development of new environmental indicators. In this study, we used eDNA metabarcoding to evaluate the discrepancy between planktic and benthic foraminifera molecular communities identified in bottom water and short sediment cores. The molecular community was compared to foraminiferal shells in sediment traps set on the seafloor. Samples were collected in June and August around the Takuyo-Daigo Seamount in the western subtropical Pacific Ocean. Approximately 40% of amplicon sequence variants (ASVs) pertained to unknown foraminiferal lineages in sediment samples, compared with only 22% in bottom water. Bottom water contained benthic foraminifera and taxonomically unassigned lineages, which were attributed to resuspended particles. In bottom water, 100 ASVs were assigned to planktic foraminifera. ASVs assigned to Candeina nitida were most abundant and accounted for 36%–86% of planktic foraminiferal ASVs. In sedimentary DNA, Globigerinita glutinata was the most abundant among 33 ASVs of planktic foraminifera. However, transparent shells in sediment traps contained more spinose species, such as Globigerinoides ruber, whereas C. nitida was not found and few G. glutinata were detected. This discrepancy between the three samples may be due to the species-specific preservation, to polymerase chain reaction biases, and/or to low abundance of planktic foraminifers. In sedimentary DNA, 893 ASVs were assigned to high-level foraminiferal taxa. Among benthic foraminiferal lineages, monothalamids were most abundant, as reported in other deep-sea regions. Molecular communities formed one cluster above the boundary at which ASVs sharply decrease across the three cores. Our results suggest that depth within the sediment core can affect foraminiferal ASVs, but the distance between sites up to 200 m did not strongly affect ASVs of sedimentary DNA at least above the boundary at which ASVs sharply decrease. Sequences of foraminiferal DNA in sediment decreased linearly in core PC02-A1, but exponentially in core PC03-B3. The decline of foraminiferal ASVs may reflect both the decreases in numbers of living foraminifera and degradation of DNA in sediment, related to the particle mixing depth.
Deep-sea biological communities support fundamental biogeochemical cycles contributing to ocean stability. With increased interest in commercial mining of deep-sea mineral resources such as polymetallic nodules, polymetallic massive sulfide deposits, and cobalt-rich ferromanganese crusts, deep-sea ecosystems are being investigated to evaluate potential environmental impacts from mineral mining (Gollner et al., 2017; Orcutt et al., 2020). Benthic foraminifera contribute significantly to carbon cycling in the deep sea and are estimated to account for more than 50% of meiofaunal and macrofaunal abundance and biomass on abyssal plains (Gooday et al., 1992; Moodley et al., 2002; Enge et al., 2011). Because benthic foraminiferal assemblages are susceptible to environmental changes, such as food supplies and dissolved oxygen concentrations, in addition to anthropogenic pollutants (Jorissen et al., 1995; Geslin et al., 2004; Duffield et al., 2014), they are used to monitor benthic environmental health (Dimiza et al., 2016; Bouchet et al., 2018). In addition to conventional shell-counting and chemical composition measurements of calcareous tests, high-throughput sequencing (HTS) metabarcoding of environmental DNA (eDNA) for foraminifera has been recently applied to bioassessment and biomonitoring associated with fish farming, oil drilling, and gas platforms (Pawlowski et al., 2014; Laroche et al., 2016; Frontalini et al., 2020). eDNA metabarcoding revealed the dominance of agglutinated and thecate foraminifera (Laroche et al., 2018; Lejzerowicz et al., 2021), expanding morpho-taxonomic data (Cordier et al., 2017). Moreover, benthic foraminifera have been identified as a target to evaluate meiofaunal community structure, using morphological and molecular biological methods recommended by the International Seabed Authority (ISA), the regulating body for deep-sea mining (ISA, 2020). The foraminiferal community has been historically investigated in the Clarion-Clipperton Zone (CCZ), a target region for commercial mining of seabed deposits of polymetallic nodules (Gooday et al., 2021).
On the other hand, planktic foraminifera, which live at the ocean surface are important for monitoring surface physico-chemical properties. Changes in test assemblages are related to seasonal fluctuations in sea surface temperature, primary production, and plankton community structure (Storz et al., 2009; Jonkers and Kučera, 2015; Schiebel and Hemleben, 2017; Maeda et al., 2022). Furthermore, because fluxes of planktic foraminiferal tests account for 23%–56% of the global open-ocean carbonate flux (Schiebel, 2002), their population fluctuations help to reveal the global oceanic carbon flux. Although planktic foraminifera have been used to understand biological and physico-chemical conditions, modern studies of assemblages using sediment traps and plankton nets are laborious and ineffective. HTS metabarcoding of eDNA targeting planktic foraminifera in seawater may effectively and comprehensively describe community structure using only seawater samples. Seawater samples with eDNA metabarcoding analyses were used to detect microbial and meio- and macro-faunal communities in a previous study (Laroche et al., 2020). However, to the best of our knowledge, there have been no such studies for foraminifera in seawater to date. In addition, the taphonomy of DNA of planktic foraminifera is important to trace assemblages of planktic foraminifera using eDNA. To compare test assemblages, eDNA of bottom water and of sediments help us to understand the potential of eDNA preservation of planktic foraminifera, which can be species specific.
Seamounts have heterogeneous, vulnerable ecosystems (Watling and Auster, 2021), and information about their biological connectivity and biodiversity is still limited (Kvile et al., 2014; Shi et al., 2020). Meanwhile, seamounts attract substantial interest for commercial mining of seabed mineral resources (Nozaki et al., 2016; Toro et al., 2022). Baseline studies, which are necessary for deep-sea mineral mining, are useful for evaluating natural fluctuations of biological communities (Gooday et al., 2017; Jones et al., 2017; Iguchi et al., 2020). In areas covered by solid substrata in the deep sea, such as the summit of the Takuyo-Daigo Seamount (Usui et al., 2017), eDNA metabarcoding using sediment is the first step to understanding existing benthic biological communities containing tiny and rare species (Pawlowski et al., 2022). The aims of this study were (1) to document differences in planktic foraminiferal assemblages between bottom water, sediments, and sediment traps at the seafloor using eDNA metabarcoding analyses, and (2) to identify factors affecting foraminiferal community composition in sediments and bottom water. Variation between shells in sediment traps and molecular communities in bottom water and sediments allow us to understand limitations of detecting DNA of descending foraminiferal tests. We conducted HTS metabarcoding analyses targeting planktic and benthic foraminifers of bottom water and sediment samples collected in June and August at about 940-m depth. Then, molecular community composition was compared in relation to the collection site, timing, and sediment layer depth.
Sediment and bottom water samples were collected repeatedly around a station (water depth ~940 m) on the summit of Takuyo-Daigo Seamount (23°23′N, 153°04′E) in the northwestern Pacific Ocean during cruises of R/V Shinsei-maru in June (cruise JS20-1) and August (JS20-2) 2020 and August 2021 (JS21) (Figure 1). All sediment cores were collected using a push-corer and a remotely operated vehicle (ROV) (Table 1). In June 2020, a sediment core, PC02-A1 was collected from the summit of the seamount (station [St.] PC02, 941-m depth). In August 2020, two sediment cores were collected. One sediment core, PC02-B1 was collected at St. PC02-2 (941-m depth), approximately 5 m from the location of St. PC02. The other sediment core, PC03-B3 was collected at St. PC03 (940-m depth), approximately 200 m from St. PC02. Cores PC02-A1 and PC03-B3 were respectively collected at the same locations as cores TK05-PC02 and TK05-PC03, for age dating, as reported by Ota et al. (2022). Sediment cores were cut horizontally to yield two 0.5-cm slices at the top and then seven 1-cm slices below. These were preserved at −80°C. Bottom water samples were collected using Niskin bottle samplers manipulated by the ROV approximately 3 m above the seafloor in June and August 2020 and August 2021 (Table 2). St. WS-02 and St. WS-03 were collected approximately 200 m from St. WS-01 and St. SW was approximately 600 m from St. WS-01. 1–3-L bottom water samples were filtered onboard using Sterivex filters (0.22-μm mesh, Merck KGaA, Darmstadt, Germany) and the filters were kept at −20°C until DNA extraction. Negative controls with Milli-Q water were prepared in the same way as the bottom water samples. Two sediment traps (SMD13S 6000, NiGK corporation, Kawagoe, Japan) were set on the seafloor at stations St. 3 (938-m depth) and St. 7 (937-m depth). Horizontal distances between St. 3 and PC02 and between St. 7 and PC03 were within 100 m. To prevent degradation of organic materials, cups were preserved with formaldehyde. Time intervals between collections from the two sediment traps are given in Table 3. We used two samples (1 and 13 from ST3 and ST7) to collect sinking particles for 14 days. All sampling sites in this study were within an area 300 m × 300 m square.
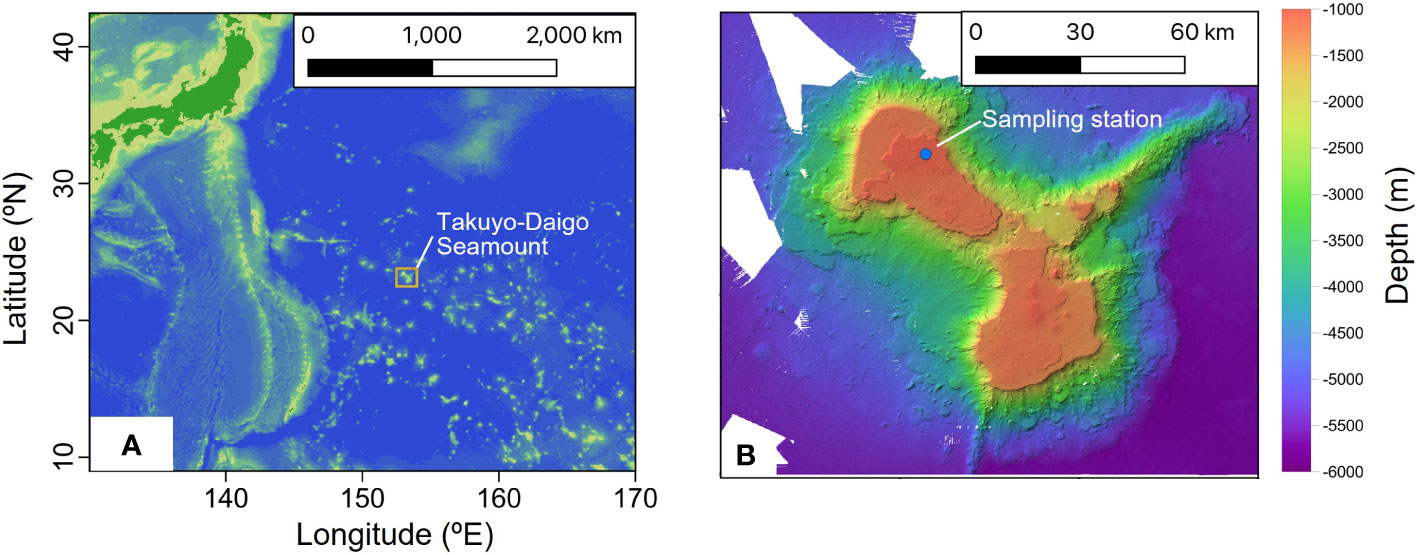
Figure 1 (A) Location of Takuyo-Daigo Seamount in the northwestern Pacific and (B) sampling station for bottom water, sediment, and sediment trap samples.
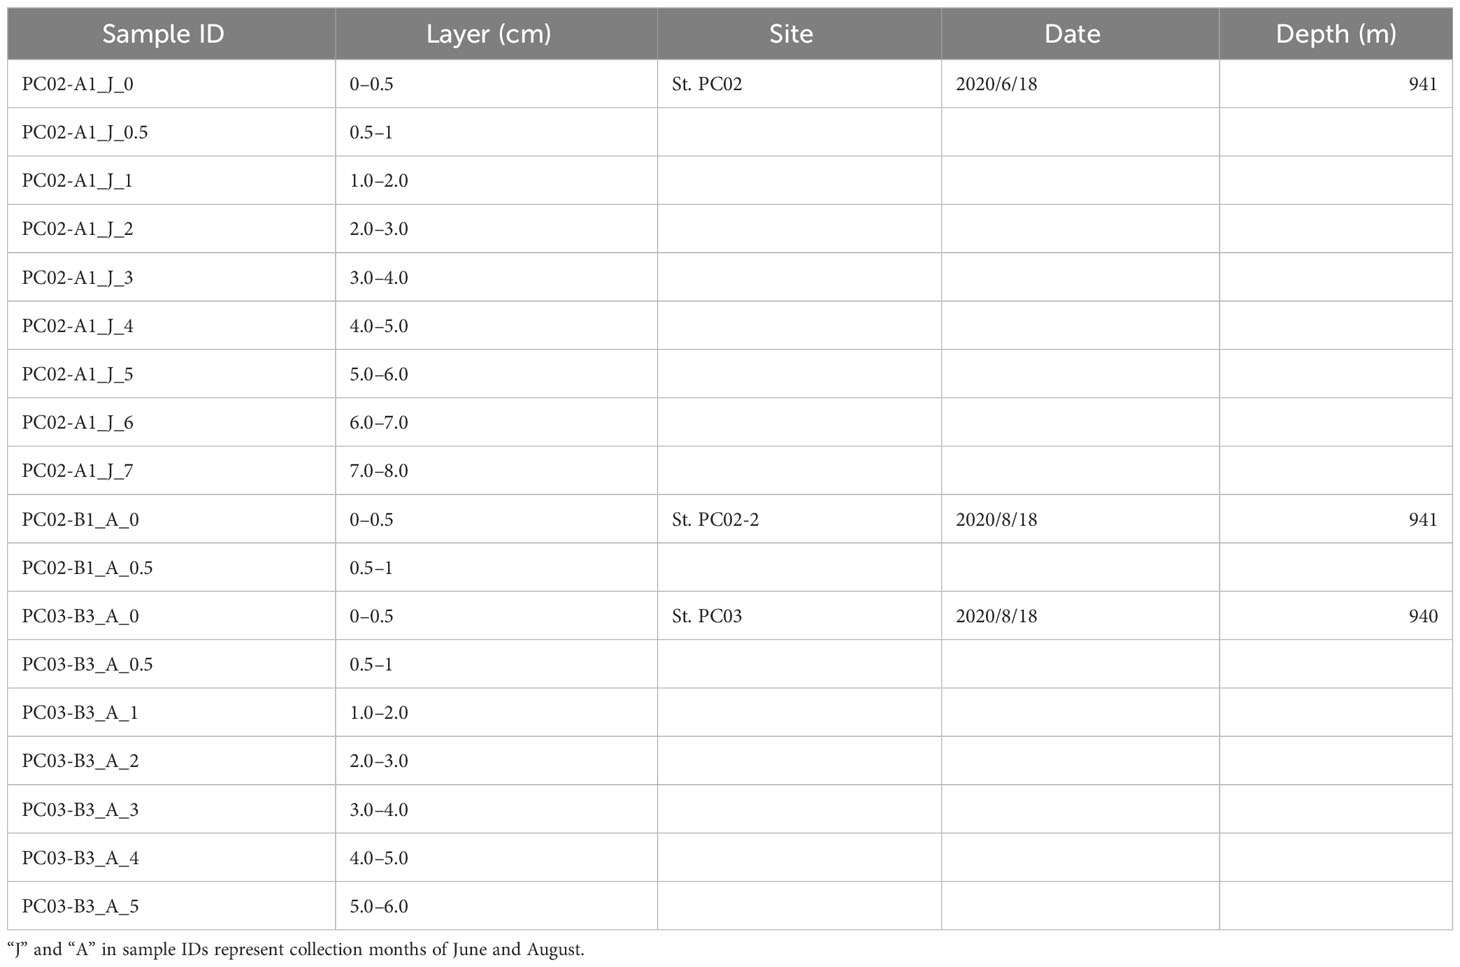
Table 1 Information about sediment samples used in this study.
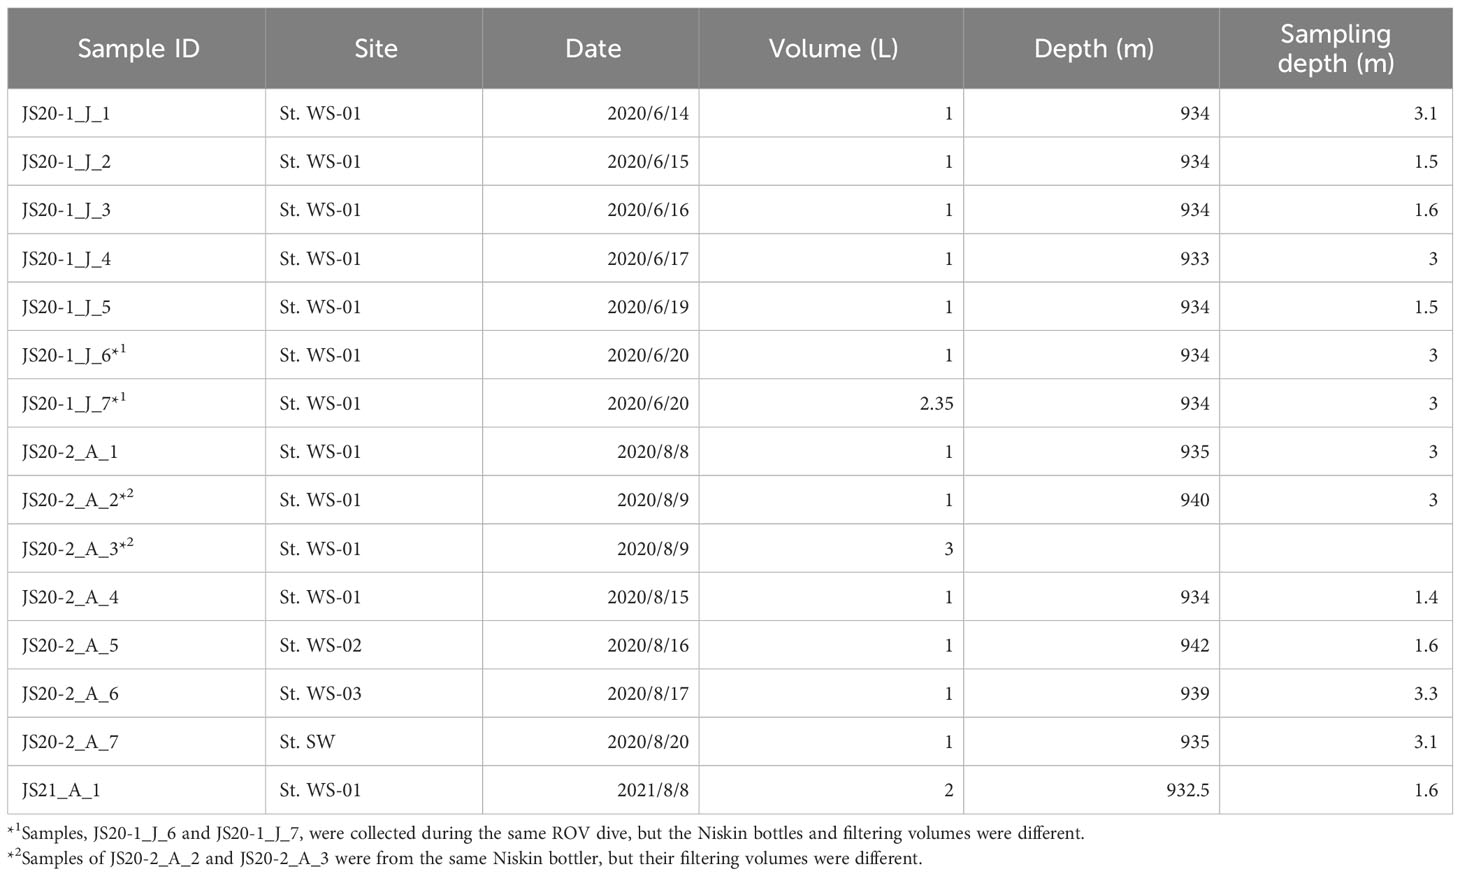
Table 2 Information about bottom water samples used in this study.
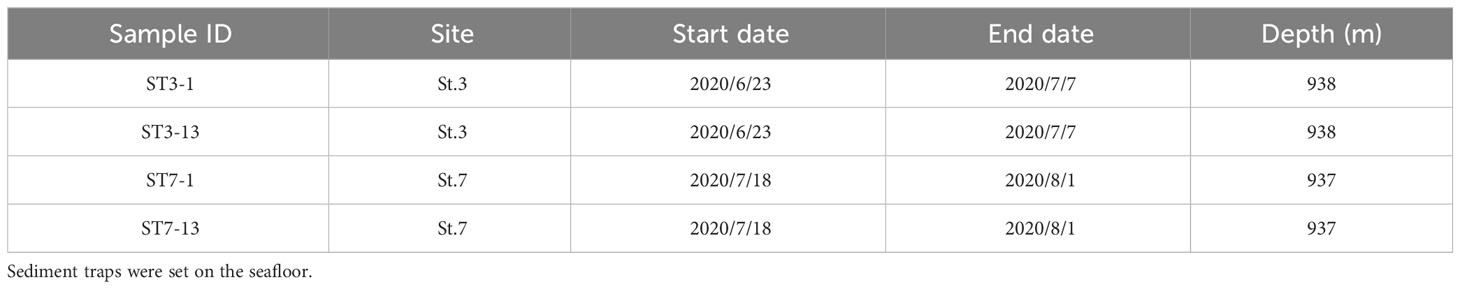
Table 3 Information about sediment trap samples used in this study.
For sedimentary DNA, we used the 0- to 0.5-cm and 0.5- to 1-cm layers in core PC02-B1 in addition to other 1-cm slices down to a maximum of 8 cm in core PC02-A1 and to 6 cm in core PC03-B3 (Table 1). eDNA was extracted from sediment samples of approximately 5 g from each layer using a Power Max Soil DNA Isolation kit (Qiagen, Hilden, Germany) following the manufacturer’s instructions with minor modifications. eDNA was extracted from bottom water samples on Sterivex filters using a DNeasy PowerWater Sterivex kit (Qiagen, Hilden, Germany) according to the manufacturer’s instructions. The foraminifer-specific hyper-variable region in the small subunit ribosomal RNA gene (18S rRNA gene) was amplified using forward primer s14F3 (ACGCAMGTGTGAAACTTG; Holzmann et al., 2001) and reverse primer s17 (CGGTCACGTTCGTTGC) with adaptor sequences. polymerase chain reaction (PCR) amplification was performed using 1 μL of template DNA (1 ng μL–1) in a 20-μL reaction volume with Ex Taq polymerase (TaKaRa Bio, Kusatsu, Japan). The first PCR amplification was carried out with the following conditions: a denaturation step at 94°C for 1.5 min; 25 thermal cycles of 1 min at 94°C, 1 min at 50°C, and 1 min at 72°C; 15 cycles of 30 s at 94°C and 30 s at 50°C; and a final extension step at 72°C for 5 min. Triplicates of the first PCR amplicons were mixed to minimize intra-sample variance. All PCR reactions included negative controls with ultrapure water. PCR products were qualitatively checked using a 2% agarose gel, and the target fragment was purified using an Agencourt AMPure XP Kit (Beckman Coulter, Brea, USA) following the manufacturer’s protocol. The second PCR was conducted using 1 μL of PCR product in a 20-μL reaction volume with the following conditions: initial denaturation for 1 min at 96°C; 15 cycles of 30 s at 96°C, 45 s at 65°C, and 1 min at 72°C; and final extension for 7 min at 72°C. After purification with AMPure XP beads, products from the second PCR were quantified using a Qubit dsDNA HS assay kit with a Qubit 4.0 Fluorometer (Thermo Fisher Scientific, Waltham, USA). We then diluted all quantified index PCR products to the same concentration and prepared one metabarcoding library. We subsequently performed paired-end sequencing (2 × 300 bp) using a MiSeq sequencer (Illumina, San Diego, CA, USA) using a MiSeq Reagent Kit V3 (Illumina) according to the manufacturer’s protocol. Raw data from these assays were submitted to the DNA database of Japan (DDBJ) and are available under accession number DRA016254.
Raw FASTQ files were analyzed using the QIIME2 platform (version 2022-02; Bolyen et al., 2019). Low-quality reads (QV < 20) were filtered out, and chimeric reads were identified using “dada2” and removed. Reads were clustered into amplicon sequence variants (ASVs) at complete similarity against the reference database SILVA 138 (https://www.arb-silva.de/documentation/release-138/) and sequences that were not assigned to foraminifera, for example, Archaea, Bacteria, and other Eukaryota were removed for downstream analysis. Although SILVA 138 is a quality-controlled database of small-subunit rRNA genes for bacteria, Archaea, and eukaryotes (Quast et al., 2013), the foraminiferal 18S rRNA data it contains are of insufficient quality and quantity. For this reason, representative sequences of each ASV were then aligned against the National Center for Biotechnology Information (NCBI) nucleotide database according to BLAST+ (Camacho et al., 2009). Only sequences that were assigned to foraminifera (identity rate >92%) and longer alignment length (>200 bp) with more than 10 reads were used for later statistical analysis.
Sediment trap samples ranging from 0.45 μm to 1 mm were filtered and separated into 10 aliquots using a rotary splitter. Total fluxes of sinking particles were calculated by weighing dry samples using five aliquots. For counting shells of foraminifera, we used one aliquot of 1 and 13 of ST3 and ST7, respectively (Table 3). Sinking particles were wet-sieved to 63 μm and foraminiferal shells in >125-μm fractions were picked and counted. We treated (1) broken shells, (2) pigmented, opaque, or dirty shells as resuspended shells. We recorded transparent shells as newly sinking shells at collection intervals and identified the species following Schiebel and Hemleben (2017).
Coverage-based rarefaction was applied to raw read numbers per ASV (Chao and Jost, 2012) using the “vegan” package (v. 2.6-4; Oksanen et al., 2022) in R (R Core Team, 2021). Subsequently, data were converted to presence/absence data, because foraminifera show various gene copy numbers among and within taxa (Weber and Pawlowski, 2013; Milivojević et al., 2021).
We conducted non-metric multidimensional scaling (nMDS) for the binary eDNA dataset based on Chao distances (Chao et al., 2014) using “vegan” (v. 2.6-4; Oksanen et al., 2022) with the K-medoids clustering method (“cluster” v. 2.1.3; Maechler et al., 2022) to evaluate the similarity of molecular foraminiferal communities between samples of sediment and bottom water. For rarefied abundance data of sediment samples, nMDS was performed based on the Horn-Morisita index. nMDS results were described using “ggplot2” package (Wickham, 2016). Indicator species in each sample based on indicator values were calculated using the “labdsv” package (v. 2.0-1; Roberts, 2019). To evaluate differences in the proportion of the dominant planktic species in bottom water samples, the Wilcoxon rank sum test was conducted between JS20-1 and JS20-2 samples using “exactRankTests” package (v. 0.8-35; Hothorn and Hornik, 2022). We performed permutational multivariate analysis of variance (PERMANOVA) with Chao distances and permutation = 9999 to identify factors affecting differences in molecular community composition for sediment and bottom water samples, respectively. We selected collection month, year, site, depth, and filtered volume as fixed factors for bottom water samples and layer depth, collection site, and month for sediment samples. The layer depth of sediment samples divided into seven groups combining sediment layers deeper than 5 cm into one group as previous molecular studies for foraminifera analyzed up to 5 cm and the ISA guideline recommends that even test assemblages should be studied up to 5 cm (ISA, 2020; Laroche et al., 2020). Best fit models for changes in number of foraminiferal ASVs detected in sediment samples were determined using Akaike’s information criterion (AIC). We selected the exponential model in addition to the linear model because DNA decay rates were often estimated using the exponential model (Jo et al., 2019; Saito and Doi, 2021).
After quality filtering and removal of the ASVs (<200bp, <92% identity rate) and low-read sequences (≦10), taxonomic assignments were made (Table 4). Bottom water samples yielded a total of 400,616 reads. These contained unidentified foraminifera including sequences obtained from previous environmental foraminiferal metabarcoding analyses (71,437 reads, 83 ASVs) and other sequences (329,179 reads, 258 ASVs) classified to higher taxonomic levels. Globothalamea sequences, including planktic foraminifera, dominated bottom water eDNA samples (Figure 2A). ASVs assigned to benthic and taxonomically unknown lineages showed 17–48 in JS20-1, 9–21 in JS20-2, and 3 in JS21 (Figure 2B). On the other hand, the number of ASVs assigned to planktic foraminifera in each bottom water sample ranged between 6 and 14 in June, 9 and 15 in August, and 100 in total (Table 4; Figure 3). Sequences assigned to Candeina nitida dominated planktic foraminifera in bottom water samples (Figure 4). Although C. nitida comprised 57%–86% of ASVs in bottom water samples in JS20-1, the proportion of C. nitida decreased to 36%–75% in samples from JS20-2 (Supplementary Figure S1, Wilcoxon rank sum test: p < 0.05). In bottom water samples from JS21-1, C. nitida accounted for 86% and Globorotalia menardii accounted for 14% of ASVs. Molecular community datasets between JS20-1, JS20-2, and JS21-1 shared 19,036 reads and 2 ASVs of planktic foraminifera assigned to C. nitida and G. menardii (Supplementary Figure S2).
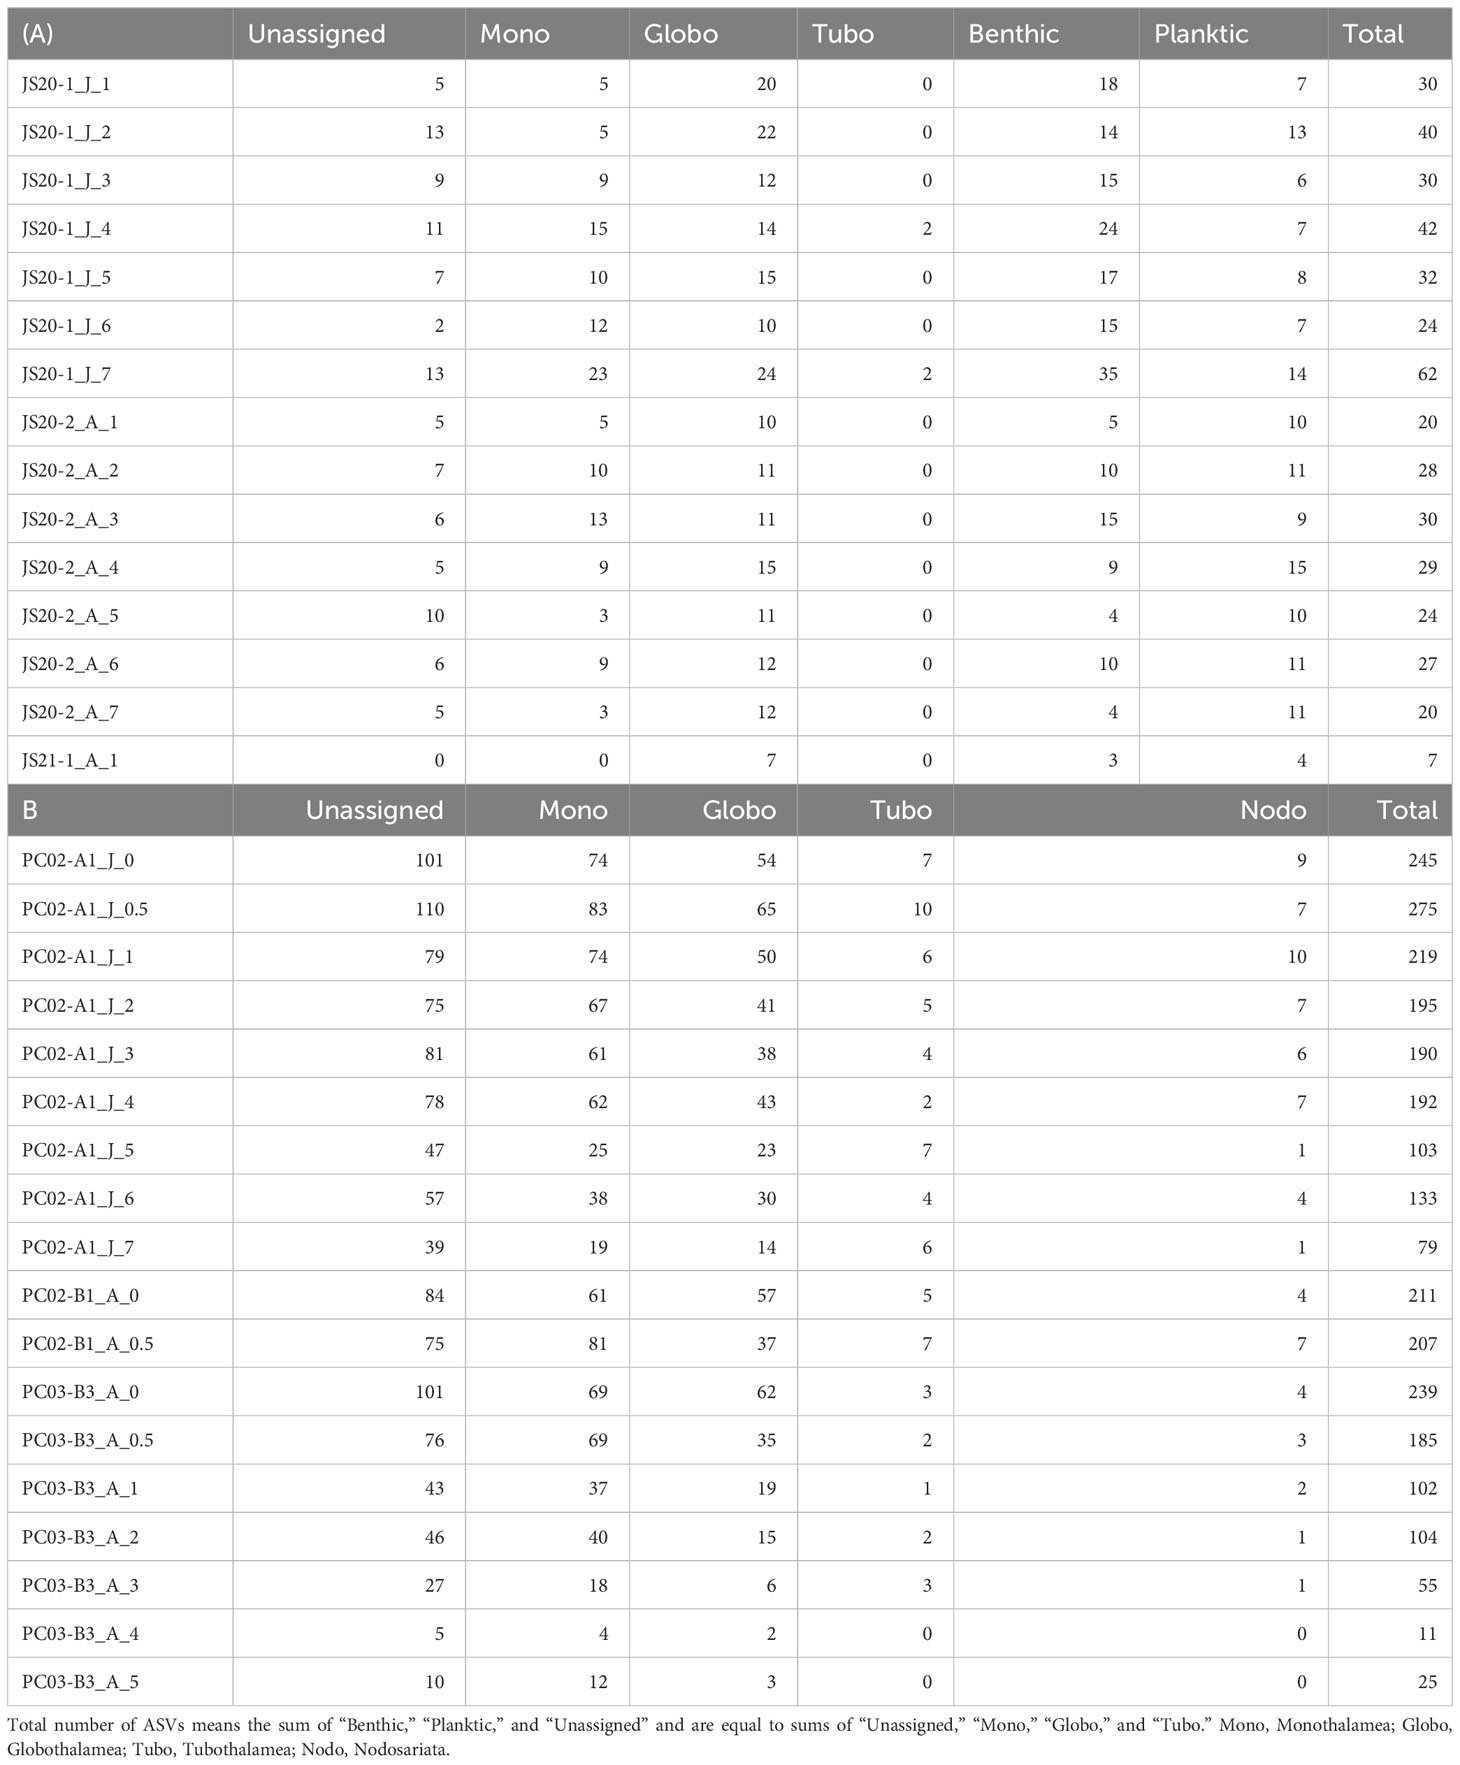
Table 4 Summary of taxonomic assignments for (A) bottom water and (B) sediment samples based on amplicon sequence variances.
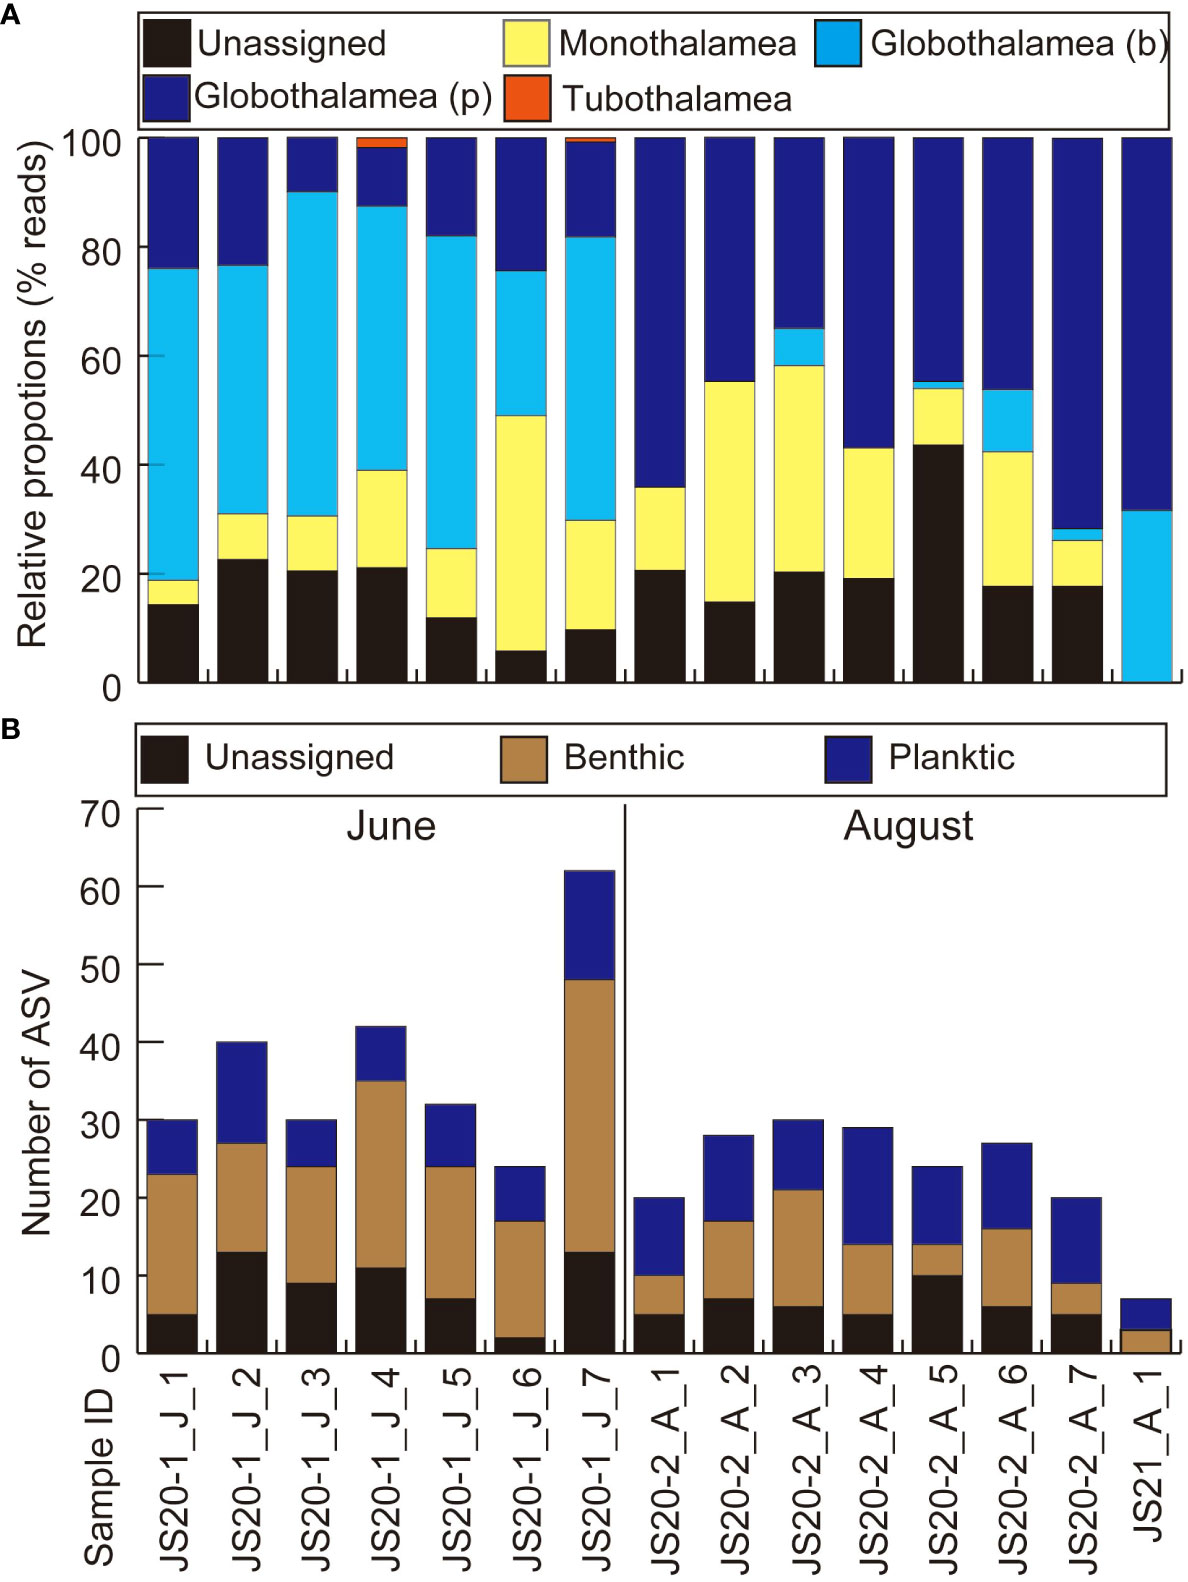
Figure 2 Results of eDNA metabarcoding analyses of bottom water (A) based on numbers of reads and (B) based on numbers of ASVs. (A) Globothalamea (b) represents benthic foraminifera belonging to the Class Globothalamea. Globothalamea (p) represents planktic foraminifera belonging to the Class Globothalamea. “J” and “A” in sample IDs represent collection months of June and August.
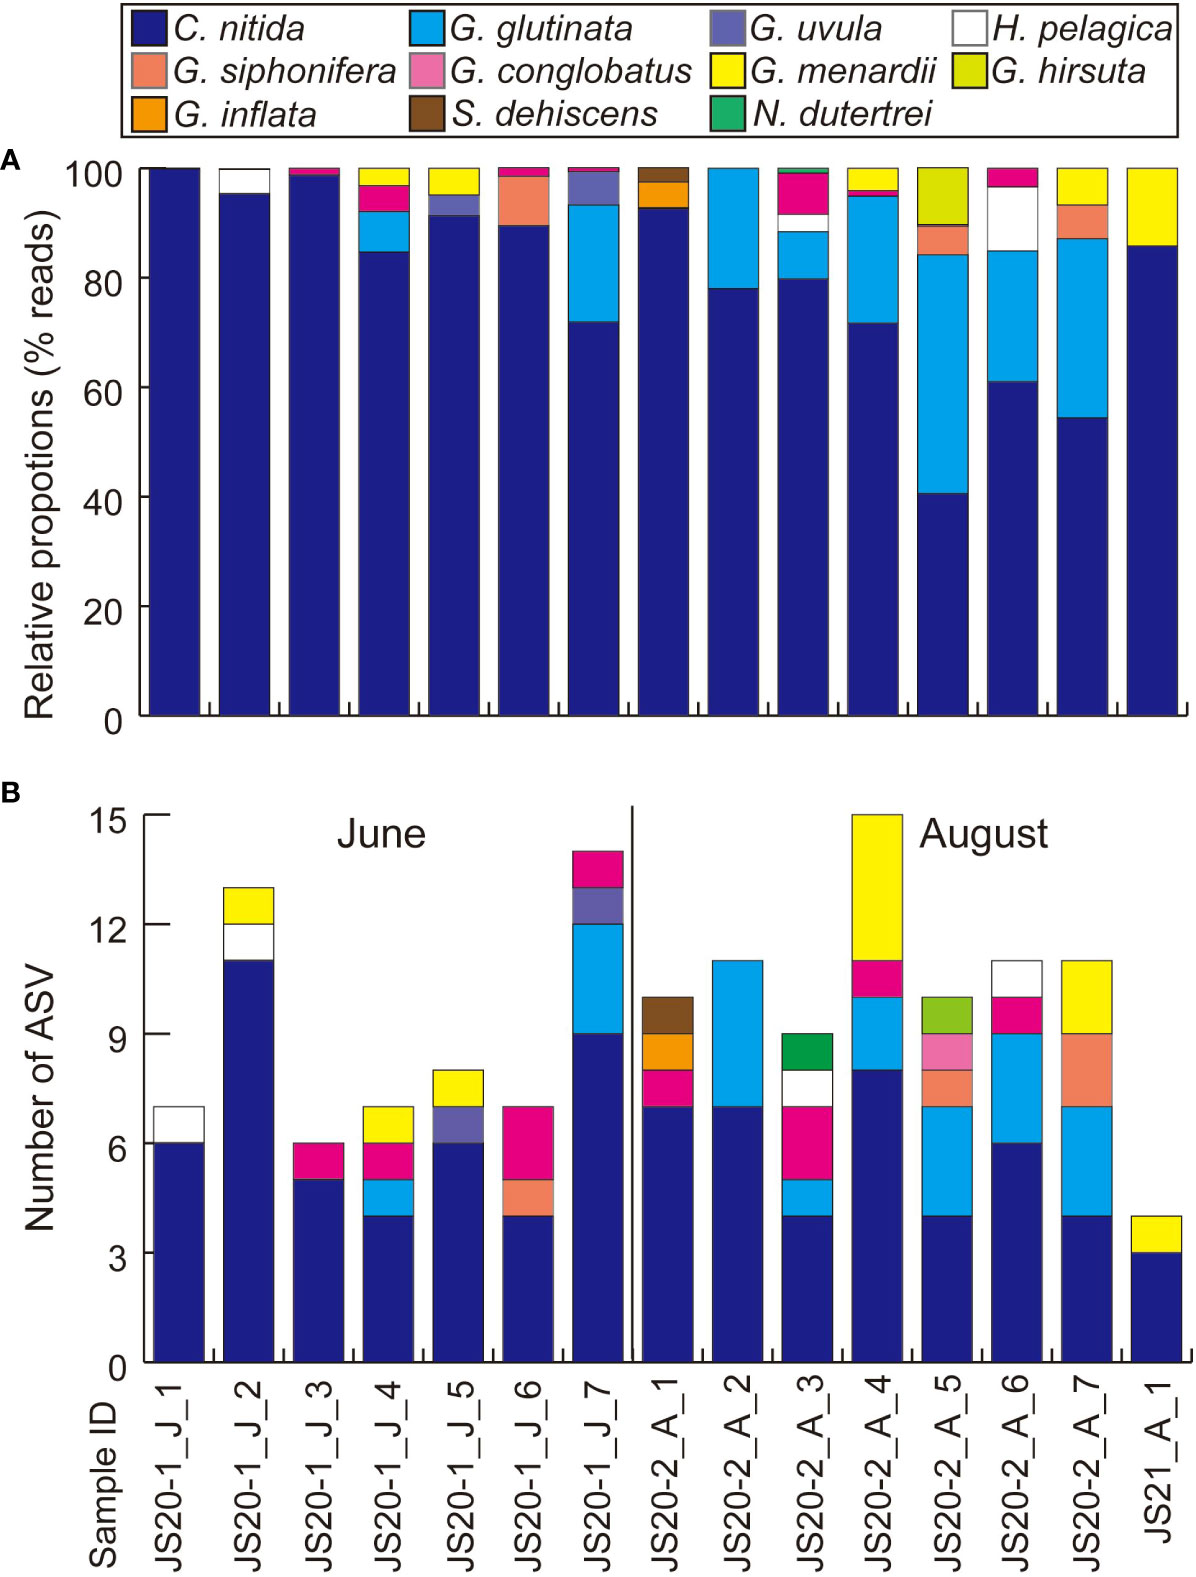
Figure 3 Results of eDNA metabarcoding analyses of bottom water focusing on planktic foraminifera (A) based on numbers of reads and (B) based on numbers of ASVs. “J” and “A” in sample IDs represent collection months of June and August.
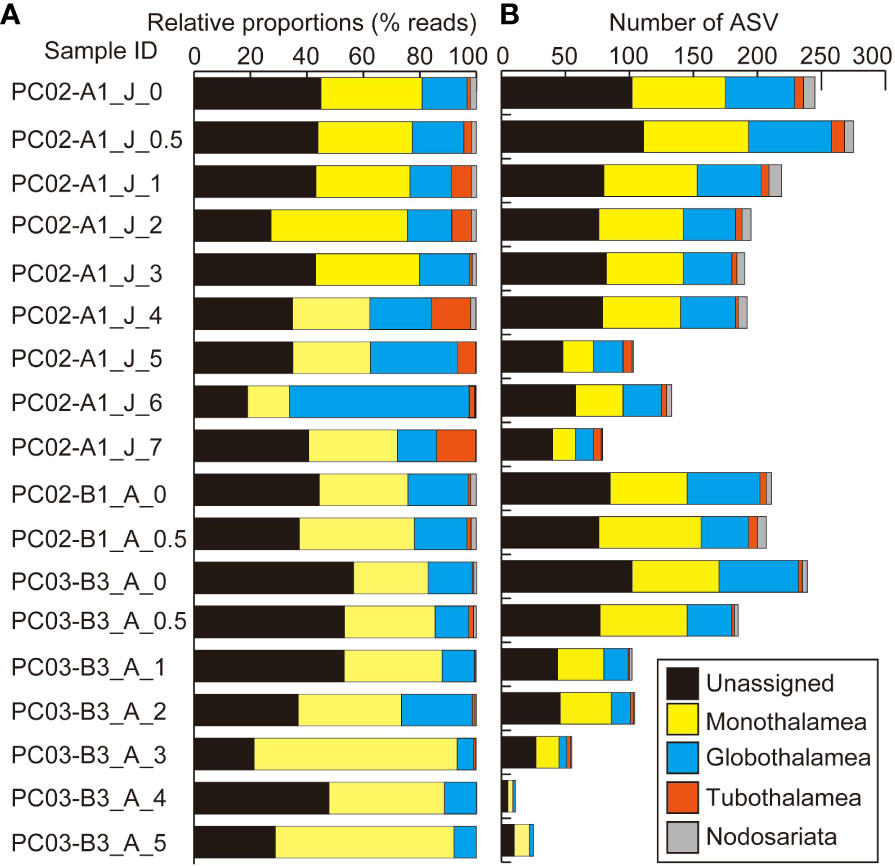
Figure 4 Results of eDNA metabarcoding analyses of sediments (A) based on numbers of reads and (B) based on numbers of ASVs at the level of foraminiferal classes. “J” and “A” in sample IDs represent collection months of June and August.
In sediment samples, 230,079 reads and 893 ASVs of foraminifera were assigned to taxa above the class level. A total of 151,978 reads constructed 563 ASVs as unidentified foraminiferal sequences in sediment samples. The dominant class-level taxon in almost all sediment samples was Monothalamea (Figure 4A). The number of ASVs in sedimentary DNA clearly decreased with increasing depth in the sediment, from a maximum of 275 at 0.5 cm to 1.0 cm to a minimum of 79 at 7 cm to 8 cm in core PC02-A1, and from a maximum of 239 at 0 cm to 0.5 cm to a minimum of 11 at 4 cm to 5 cm in core PC03-B3 (Table 4; Figure 4B). Four thousand three hundred twenty-nine reads and 33 ASVs were identified as planktic foraminifera in sediment samples, comprising between 0% and 18% of total ASVs in sediment samples. ASVs assigned to Globigerinita glutinata were the most abundant in sediment samples.
Sediment traps set on the seafloor were the only means for us to count foraminiferal shells to directly compare with molecular data. Faunal counts of sediment trap samples are shown in Supplementary Table S1. Both ST3-1 and ST7-1 (June–July) exhibited lower total fluxes (47.1 and 23.3 mg m−2 d−1) than ST3-13 and ST7-13 (July–August; 107.6 and 39.6 mg m−2 d−1). Globigerinoides ruber, Globoturborotalita rubescens, Globigerinella siphonifera, and G. glutinata were the abundant species in shell assemblages (Supplementary Table S1). Proportions of resuspended shells and transparent shells of ST3-1 and ST7-1are relatively lower than those of ST3-13 and ST7-13 (Supplementary Table S1). Total transparent shells of sediment trap samples are fewer in number than 50, and no species reached 50% of the assemblages, which is insufficient for statistical analyses of abundance data based on Patterson and Fishbein (1989). Therefore, we converted numbers of shells to presence/absence data to compare the results of planktic foraminifers detected in the molecular community of bottom water and sediments (Table 5).
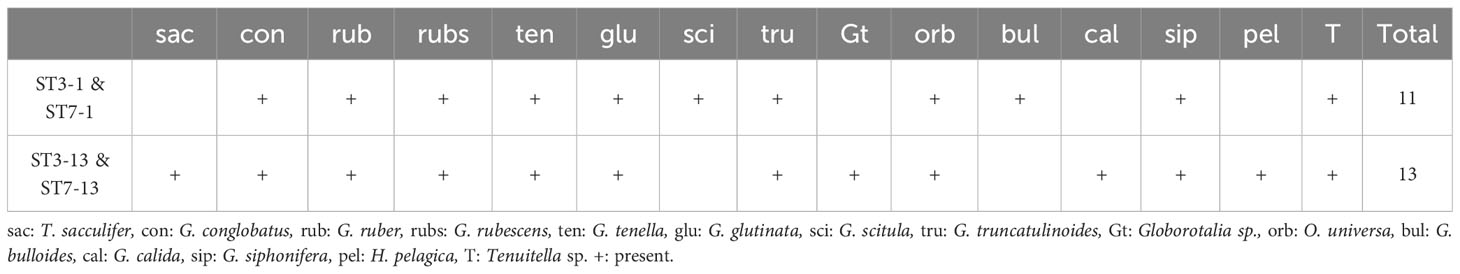
Table 5 Presence and absence of transparent shells of planktic foraminifers in sediment trap samples set on the seafloor.
In bottom water eDNA, cluster analysis visualized with nMDS based on the Chao index showed that molecular communities in JS20-1 separated samples collected at JS20-2 and JS21-1 (Figure 5). Therefore, clusters of bottom water molecular communities may be distinguished by collection month and site. In bottom water samples, indicator sequences were benthic foraminifera for JS20-1 samples, whereas planktic foraminifera sequences were dominant in JS20-2 and JS21 samples (Table 6).
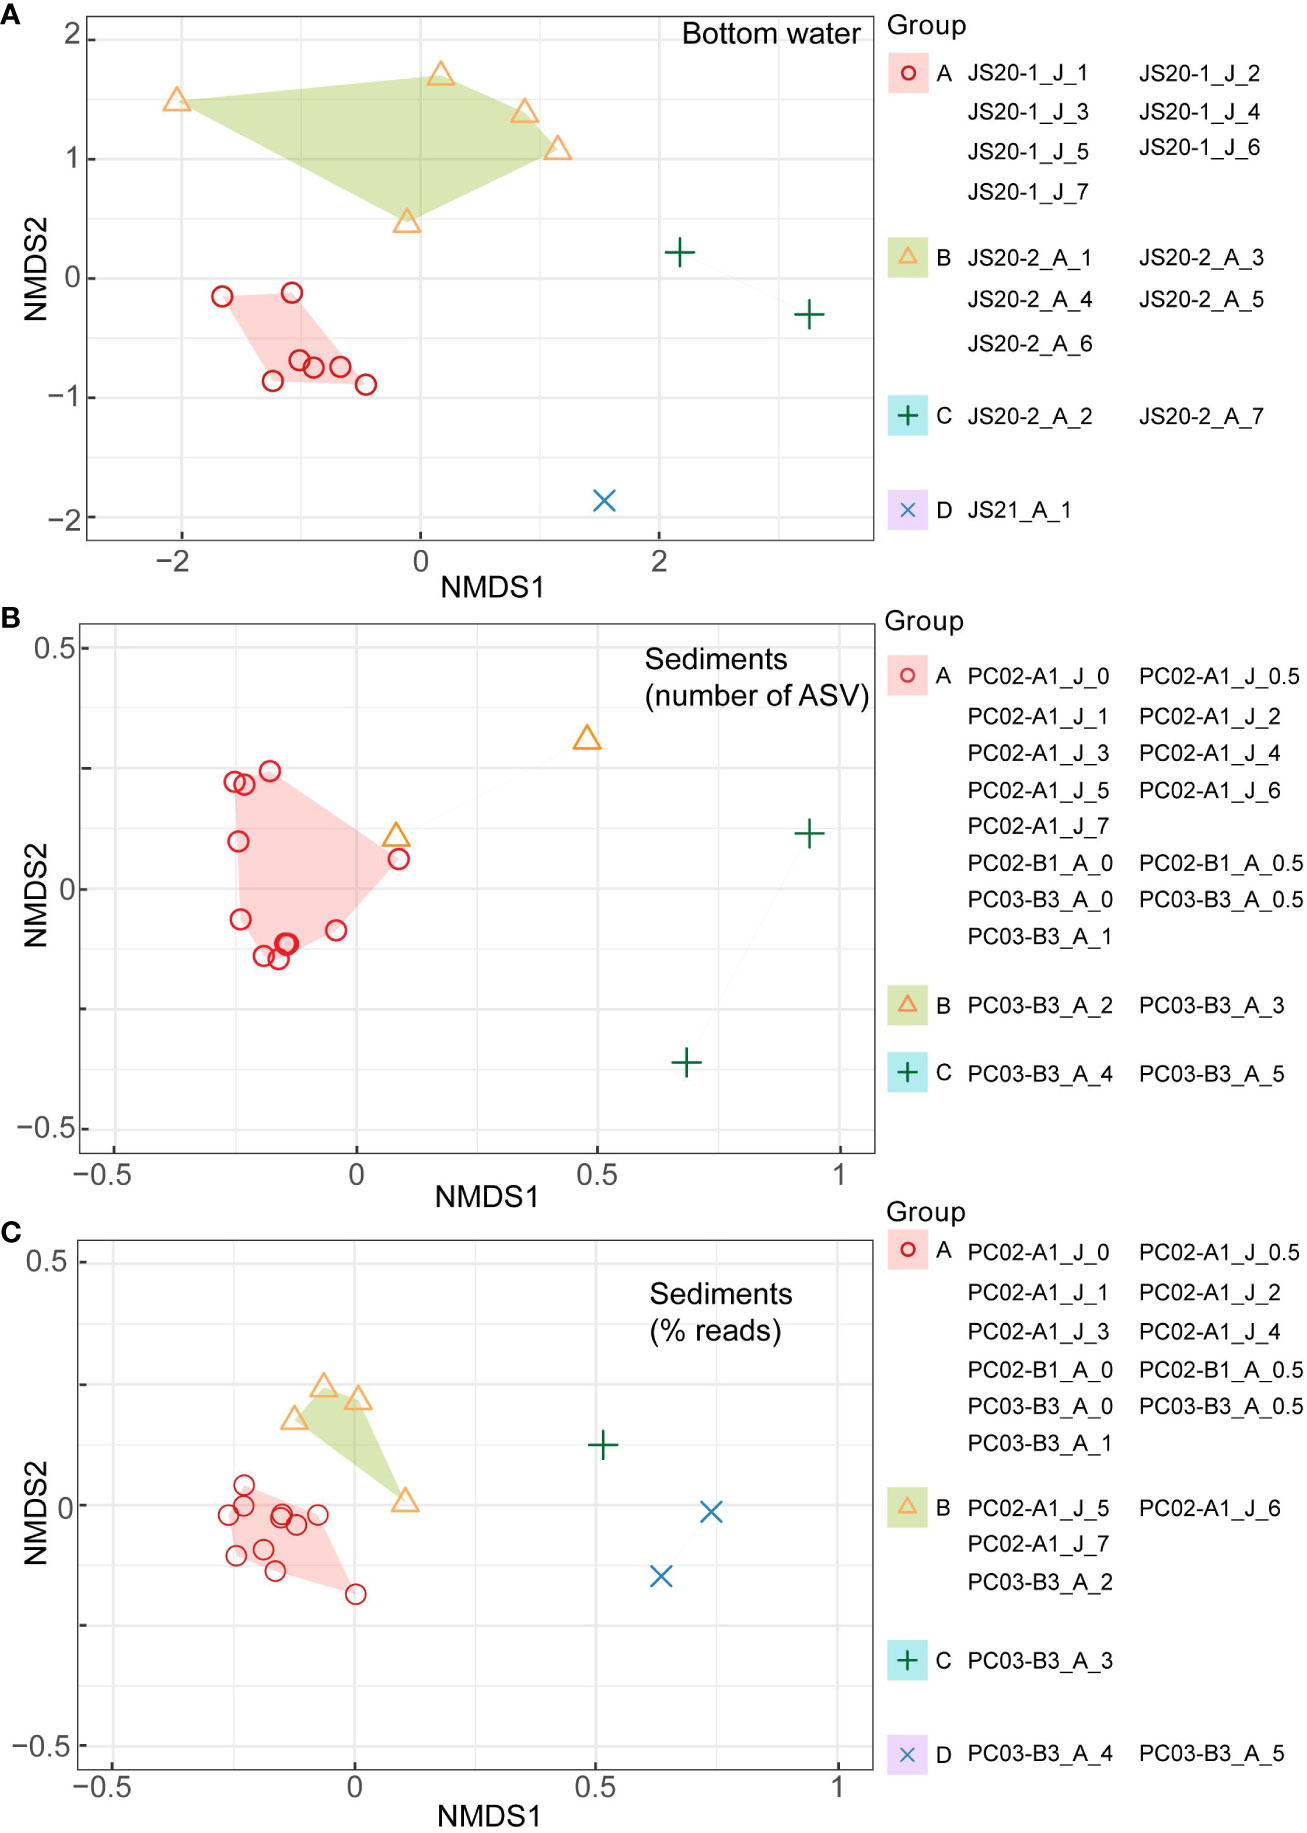
Figure 5 Results of cluster analyses of (A) bottom water, (B) sediment samples based on numbers of ASVs (middle), and (C) sediment samples based on rarefied abundance data (lower) visualized in non-metric multidimensional scaling (nMDS) for the binary eDNA dataset based on Chao distances (Chao et al., 2014) and the Horn-Morisita index with K-medoids clustering methods. “J” and “A” in sample IDs represent collection months of June and August. The packages, “vegan,” “cluster,” and “ggplot2” in R were used.
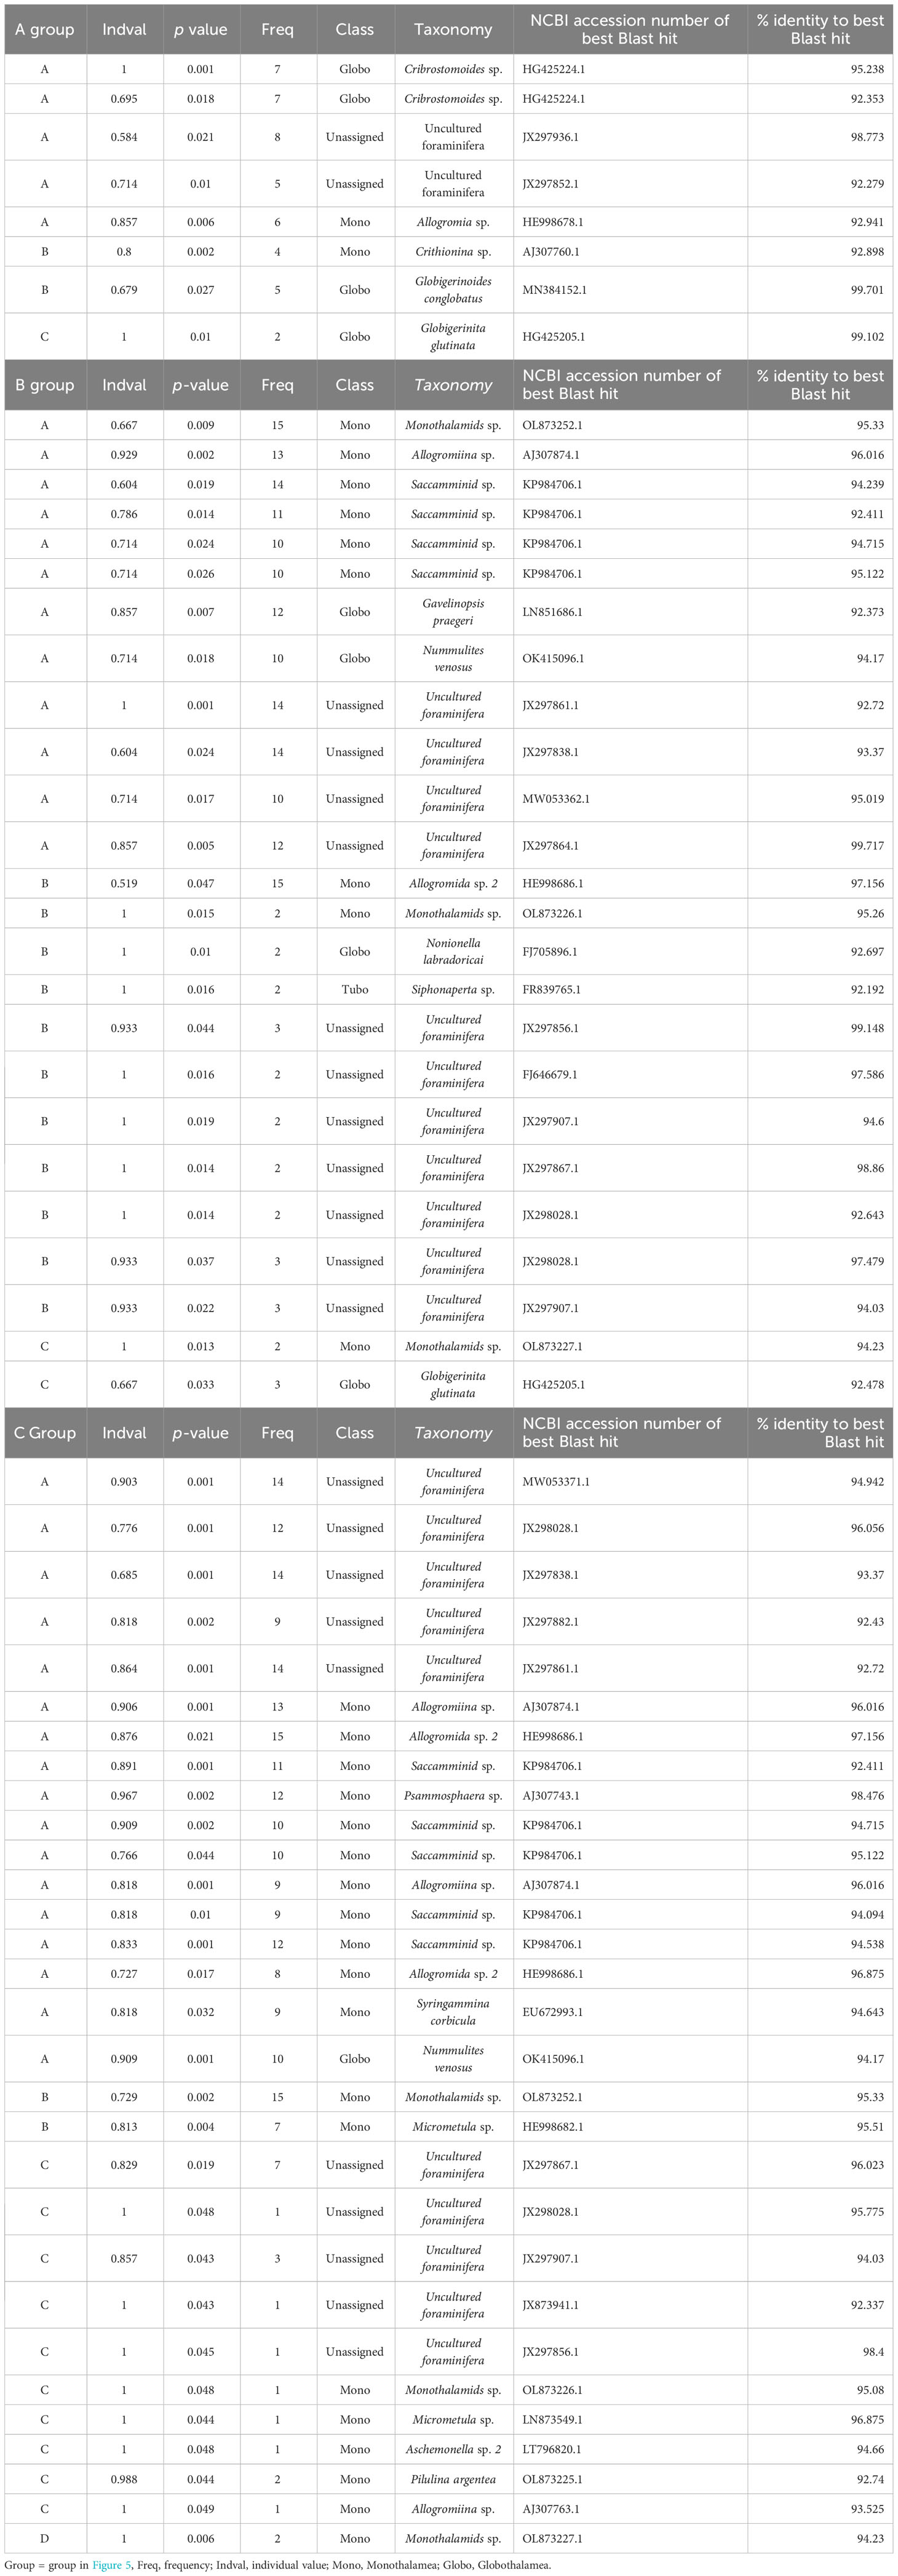
Table 6 Summary of indicator species for (A) bottom water, (B) sediment samples based on amplicon sequence variances, and (C) sediment samples based on abundance data.
In sediment samples, cluster analysis based on numbers of ASVs indicated that molecular communities in all layers of PC02-A1 and PC02-B1 comprised one cluster with layers <1 cm in PC03-B3. On the other hand, based on abundance data, layers <5 cm in PC02-A1, PC02-B1, and the layers <1 cm in PC03-B3 formed one cluster. Layers >5 cm in PC02-A1 and 1 cm to 2 cm in PC03-B3 comprised another cluster. The rest of PC03-B3 was divided into two clusters. Indicator sequences in sediment samples showed that soft-shelled monothalamids were shared among sites and represented the surface cluster, based on both of the number of ASVs and their abundance (Table 6).
The results of PERMANOVA showed that collection month (R2 =0.30, P < 0.05), sampling site (R2 = 0.27, P < 0.001) and sampling year (R2 = 0.10, P < 0.05) had effects on foraminiferal molecular communities in bottom water samples (Supplementary Table S2). Depth and filtering volume did not significantly influence foraminiferal molecular communities. In sediment samples, foraminiferal molecular communities were influenced by collection month (R2 = 0.25, P < 0.01) based on the number of ASVs, whereas layer depth (R2 = 0.43, P < 0.05) and collection month (R2 = 0.12, P < 0.05) affected molecular communities based on abundance data.
Results of best fit models for changes in numbers of foraminiferal ASVs detected in sediment samples are given in Supplementary Table S3 and in Figure 6. Based on AIC, the best fit model for changes in number of foraminiferal ASVs was a linear model for the core PC02-A1, whereas an exponential decline was described for PC03-B3.
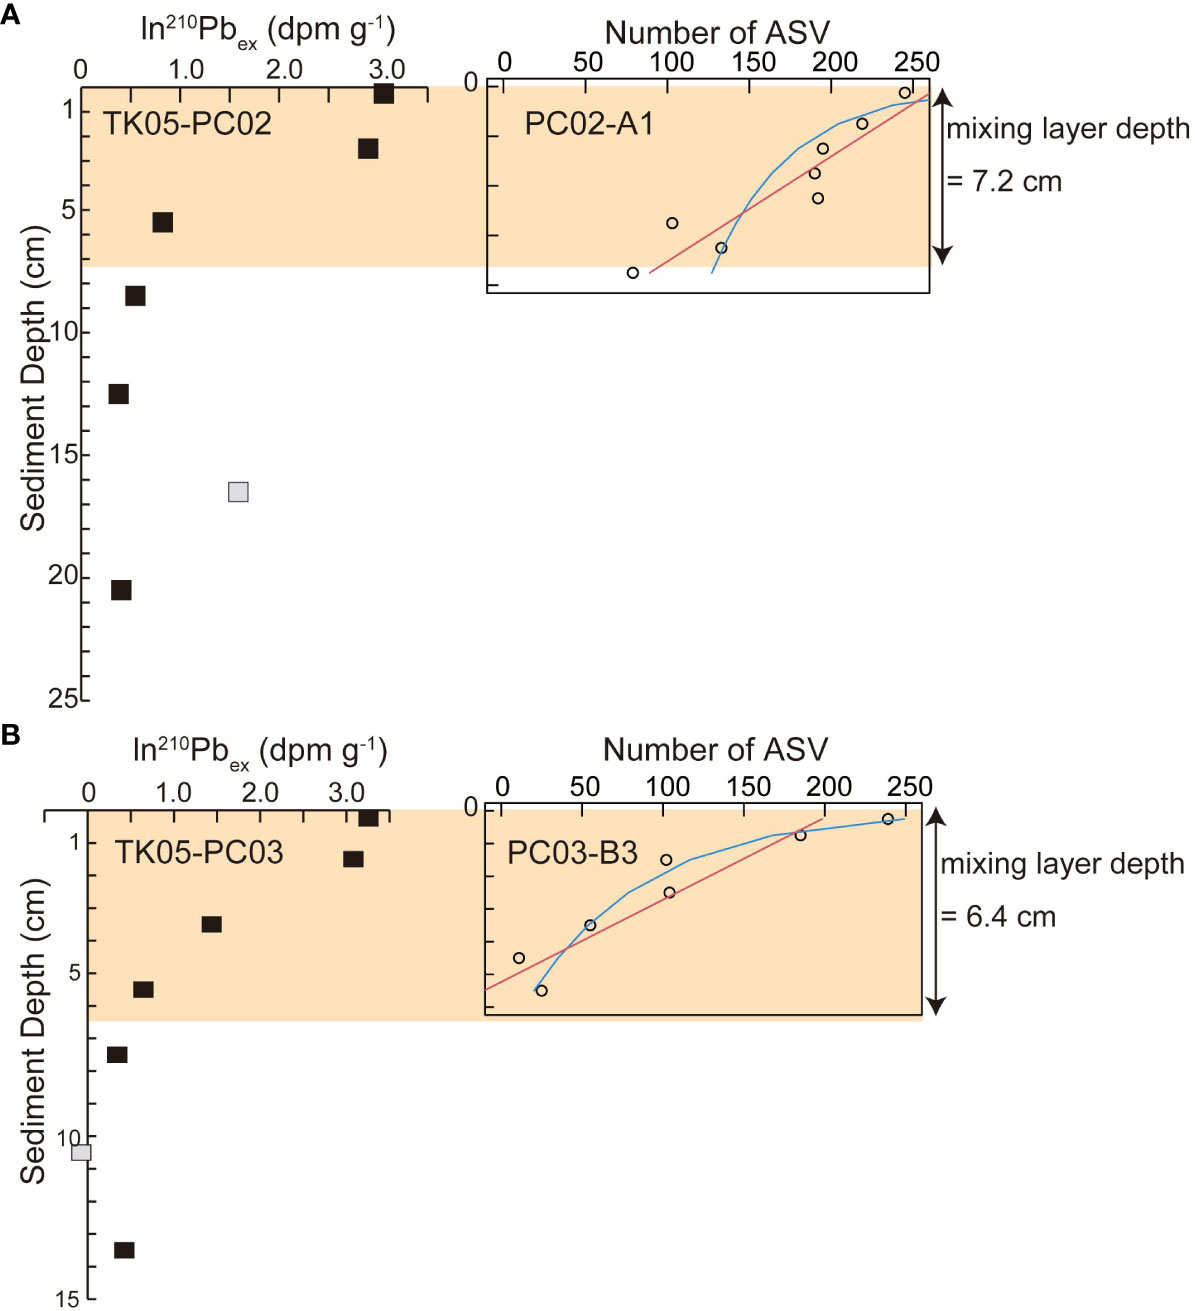
Figure 6 Comparison between particle mixing depth estimated based on ln(210Pb) (Ota et al., 2022) and depth profiles of ASVs of foraminifera in (A) St. PC02 and (B) St. PC03. Red lines represent linear models for decreasing numbers of ASVs of foraminifera, and blue lines represent exponential models for decreasing numbers of ASVs. Gray squares represent eliminated data of ln(210Pb) in Ota et al. (2022).
In bottom water eDNA, ASVs of planktic foraminifera accounted for more than 50% of most samples in August, whereas benthic ASVs were more abundant than planktic ASVs in June samples (Figure 2). Planktic foraminifera generally dwell between 0-m and 300-m depth, according to previous studies using vertically separated plankton tows (Schiebel, 2002; An et al., 2018; Davis et al., 2021). In this study, in seawater collected within 3 m of the seafloor, planktic foraminiferal sequences would be derived from tests descending from the surface. The settling velocity of planktic foraminiferal tests varies among species (0.03 m s–1 to 0.04 m s–1 on average; Caromel et al., 2014; Walker et al., 2021), and tests can descend to ~1000 m below the surface within a few days. Because eDNA degradation can be accelerated by enzyme concentrations and microbial activity, and indirectly by high temperature and UV irradiation, and it is difficult to accurately estimate eDNA decay time (Strickler et al., 2015; Seymour et al., 2018; Jo et al., 2019; Saito and Doi, 2021; Joseph et al., 2022). Although eDNA in water decays more rapidly than in sediment, it persists from several days to several weeks, according to previous studies reporting DNA decay rates of 0.0097–0.101 (Sassoubre et al., 2016; Sansom and Sassoubre, 2017). Therefore, DNA in individual tests could remain in bottom water for at least several days before being completely degraded.
Furthermore, only 17 of 335 total ASVs and 10 in 100 planktic foraminiferal ASVs were shared between bottom water samples collected in the JS20-1 and JS20-2 (Supplementary Figure S2). It is possible that most eDNA detected in bottom water in June could have decayed in August, even though addition of DNA from the same planktic foraminifers still living in August was taken into account. Unlike eDNA in bottom water samples, eDNA adsorbed to sediment persists longer at year scale, and the fine sediments such as clay more efficiently bind DNA than coarse sands (Joseph et al., 2022). Although we cannot reject the possibility that ancient planktic foraminiferal eDNA was resuspended from sediment by bottom currents or from disturbance by the ROV landing on the bottom, it is unlikely that poorly preserved planktic foraminiferal eDNA (approximately 700 reads at the maximum in a sample) in allochthonous foraminiferal ooze could contribute much to the total eDNA of planktic foraminifera. The influence of contamination of benthic foraminiferal DNA can be high (up to 77% in the number of ASVs) in bottom water samples because of the collection height of ~3 m above the seafloor. Even though sequences of benthic foraminifera influence molecular communities to a certain extent, only ASVs assigned to planktic species showed substantial differences between samples collected in June and August.
ASVs assigned to C. nitida dominated the planktic foraminiferal community derived from eDNA in all bottom water samples: 57%–86% in June and 36%–75% in August (Figure 3). The dominance of C. nitida contradicts its rarity in previous sediment-trap and plankton-tow studies worldwide (Bé and Tolderlund, 1971; Lessa et al., 2020; Meilland et al., 2022). Furthermore, C. nitida was not found in sediment traps on the seafloor. In spite of the relatively low similarity of sequences assigned to C. nitida (less than 95% of 49 ASVs in total 66 ASVs, ≧10 reads), the dendrogram of C. nitida ASVs showed that these ASVs belonged to one cluster including C. nitida reference sequences and differed from Tenuitellita fleisheri, and T. iota, belonging to the family Candeinidae (Supplementary Figure S3).
The dominance of C. nitida sequences can be caused by (1) reproduction, (2) PCR biases, (3) preservation biases, and (4) the low abundance of planktic foraminifera. Because foraminifera are single-celled organisms, gametogenic individuals (Darling et al., 1996), gametes from sexual reproduction (Weinkauf et al., 2022), and asexually reproduced offspring could be included in eDNA metabarcoding using 18S rDNA. Although gametogenesis releasing gametes in planktic foraminifera has only been rarely observed (Bé and Anderson, 1976), and that of C. nitida has never been seen, monthly or semi-monthly cyclic reproduction with large numbers of gametes and offspring as observed for other planktic species could partially explain the excessive reads of C. nitida (Jonkers et al., 2015). However, the low abundance of C. nitida even in the often “ignored” 63 µm to125 µm fraction in a previous sediment trap survey (Chernihovsky et al., 2018) suggest that C. nitida releases small numbers of gametes and asexually reproduced offspring, or the rate of maturation would be low. Although lack of knowledge hinders understanding of the reproductive process of C. nitida, gametes and offspring cannot account for their dominance in eDNA.
In addition, gene copy numbers vary widely between species of planktic foraminifera (~4000–50,000) and among individuals of the same species (~300–350,000) (Milivojević et al., 2021). Although the gene copy number of C. nitida is still undetermined, various orders of gene copy numbers among foraminifera imply that C. nitida sequences are likely overestimated by a vast number of gene copies. As reported in Morard et al. (2017), preferential PCR amplification for microperforate species, including Candeinidae and Globigerinitidae in addition to PCR biases that impair dominant Globigerinidae, such as Trilobatus sacculifer and G. ruber, could skew molecular communities (Barrenechea Angeles et al., 2020). Although sediment traps at the seafloor did not fully reflect surface planktic foraminiferal assemblages, globigerinids, such as G. ruber and G. rubescens, are major components (Table 5; Supplementary Table S1). However, globigerinids, except for G. siphonifera and Globigerinoides conglobatus, could not be detected in bottom water.
Although species-specific DNA preservation might affect molecular community structure, it is hard to assess resistance to DNA degradation due to negative PCR biases for Globigerinidae. Barrenechea Angeles et al. (2020) reported no systematic biases caused by different shell sizes, shapes, and thickness in their sedimentary DNA study in the northwestern Atlantic. In our sedimentary DNA, the dominant planktic sequences originated from G. glutinata, whereas C. nitida sequences were the second most abundant. In addition, seven ASVs of C. nitida were detected in the upper 3 cm of sediment layers, whereas G. glutinata was detected down to 6 cm (Supplementary Figure S4). The number of ASVs and the detection limits of sediment layer depth imply that DNA of C. nitida does not persist much longer than DNA of G. glutinata.
On the other hand, the high proportion of C. nitida in June, the presence of planktic indicator species except for C. nitida in August samples, and less diverse sequences of planktic foraminifera from bottom water eDNA in June (Figure 3; Supplementary Figure S1; Table 6A) suggest that a minimum in the total flux of planktic foraminifera reinforces the apparent dominance of C. nitida. Tropical planktic foraminiferal assemblages show clear seasonal variation of abundance and the interval of minimum abundances depends on the area (e.g., Kawahata et al., 2002; Yamasaki et al., 2008; Chernihovsky et al., 2018; Maeda et al., 2022). The North Pacific Subtropical Gyre is a data-poor region of temporal planktic foraminiferal assemblage (Chaabane et al., 2023). Nevertheless, G. ruber and T. sacculifer are major components in that assemblage, especially during low abundance from June to August in the tropical equatorial Pacific (Kawahata et al., 2002; Yamasaki et al., 2008). Therefore, the low abundance of planktic foraminifera and low detection of the dominant Globigerinidae using metabarcoding analyses may contribute to biased bottom water molecular communities, rich in C. nitida (Figure 3).
Briefly, C. nitida was most abundant in aqueous DNA of bottom water and G. glutinata was most widely detected in sedimentary DNA, whereas spinose species were plentiful in shells. The discrepancy in dominant planktic foraminifers between the three samples could be caused by preservation biases, species-specific success of PCR, or low abundances of planktic foraminifers. The two clusters of bottom water molecular communities could be distinguished by collection month (PERMANOVA: R2 = 0.30, P < 0.05). However, we cannot determine whether seasonality of planktic foraminifera can be investigated using aqueous DNA metabarcoding analyses without a comparison with surface test assemblage of planktic foraminifera. Further studies are required to evaluate biases between foraminiferal molecular and test assemblages and to detect more species (Globigerinidae) effectively.
Unassigned foraminiferal sequences accounted for 37%–51% of sediment samples based on number of ASVs and predominant unassigned foraminiferal sequences were also reported by previous studies in abyssal sediments in CCZ (Lejzerowicz et al., 2021). Abundant unassigned foraminiferal sequences suggest numerically important new taxa, although poor coverage of the reference database can cause taxonomic assignment failures reported by previous studies (Pawlowski et al., 2014; Lejzerowicz et al., 2021). Monothalamids accounted for 23%–48% of foraminiferal ASVs in sedimentary eDNA, and Globothalamea ASVs were the second most abundant (11%–27%) in this study, comparable to the dominance of monothalamids in sedimentary eDNA reported by previous surveys using deep-sea sediments (Shi et al., 2020; Gooday et al., 2021; Shi et al., 2021).
The result of nMDS based on numbers of ASVs differed from that based on abundance data (Figure 5). Based on the number of ASVs, nMDS included all layers of PC02-A1 in one cluster. However, nMDS based on abundance data indicated that the boundary layer in which ASVs rapidly decreased in PC02-A1 (5 cm to 6 cm) and PC03-B3 (1 cm to 2 cm) was comparable to cluster boundary layers. Almost all layers above the ASV threshold formed one cluster due to particle mixing (see Section 4.4). Collection sites of cores influenced sedimentary molecular communities of foraminifera less (PERMANOVA: R2 = 0.034, P > 0.1). As molecular analyses of benthic foraminifera showed a low proportion of identical sequences over replicates from the cores (Lejzerowicz et al., 2014), benthic foraminifera are patchily distributed (Li et al., 2022). However, based on cluster analyses, indicator sequences of the surface cluster, such as Allogromidae and Saccamminidae, occurred throughout cores and depths (Tables 6B, C). Therefore, a horizontal distance of 200 m has little effect on the benthic foraminifera community, at least in layers above the ASV threshold.
Several ASVs assigned to planktic species (0%–18%) may have been derived from settling tests of planktic foraminifera (Morard et al., 2017; Shi et al., 2021; Cao et al., 2022; Li et al., 2022). Planktic foraminiferal sequences accounted for less than 10% of total sedimentary sequences, which is consistent with previous studies, except for Li et al. (2022), targeting mainly the Rotaliida and Textulariida, (Table S4; Morard et al., 2017; Shi et al., 2021; Cao et al., 2022; Li et al., 2022). Planktic molecular communities in each oceanic area varied, but contained microperforate species including C. nitida and G. glutinata (Supplementary Table S2), which reflects the cosmopolitan distribution of both species detected using metabarcoding methods targeting planktic foraminifera (Morard et al., 2019).
The total number of ASVs diminished sharply with depth in the sediment (Figure 4B). Even though several infaunal species can live at sediment depths exceeding 10 cm (Corliss, 1985; Gooday, 1986), previous morphological studies have reported that the abundance and number of species of living benthic foraminifera, especially plano-convex and bi-convex species, rapidly decrease at sediment depths greater than 2 cm to 3 cm, due to the decrease in dissolved oxygen (Corliss, 1985; Geslin et al., 2004). Also, because preserved foraminiferal DNA is increasingly degraded as depth increases (Barrenechea Angeles et al., 2020), the number of ASVs detected declines in deeper layers. Thus, the decrease of ASVs of benthic foraminifera reflects both the decrease in numbers of living individuals and degradation of DNA in sediment.
Deng et al. (2020) noted that bacterial, eukaryotic, and archaean community shifts based on molecular analyses are regulated by dissolved O2 introduced by bioturbation and organic matter transported by reworking in the mixing layer. Estimated particle mixing depths at St. PC02 (7.2 cm; Ota et al., 2022) and St. PC03 (6.4 cm; Ota et al., 2022) were within the global mean mixing depth of 5.75 cm ± 5.67 cm ( ± SD, Teal et al., 2008), and heterogenous surface mixing could be attributed to a rise between St. PC02 and St. PC03. Even though the best fit models for foraminiferal ASVs differ between PC02-A1 and PC03-B3 (Figure 6; Supplementary Table S3), the declining trend of foraminiferal ASVs is related to the particle mixing depth (Figure 6). The sampling resolution of eDNA analyses (by 0.5 cm or 1 cm) and radioisotopes (by 2 cm or 3 cm) differ. However, the linear decline of ASVs is comparable to the decline of 210Pb and stable 14C up to 5.5 cm at St. PC02 (Ota et al., 2022), which imply year-scale particle mixing, and gradual decay of DNA and decrease of living foraminifera. The shallow ASV threshold of around 1 cm in PC03-B3 indicated by exponential decline could be consistent with a well-mixed surface layer indicated by nearly stable ln(210Pbex) and 14C ages of TK05-PC03 (Ota et al., 2022), which imply high potential for physical mixing and living foraminifera around 1 cm. Decay processes of foraminiferal DNA and radioisotopes do not yield exactly the same picture. Both datasets exhibit comparable particle mixing conditions, because sedimentary particles are substrates and particle behavior strongly affects both DNA and radioisotopes. Direct correlation of ASV numbers and mixed-layer depth using geochemical signals are not appropriate because estimation processes of ASVs and mixed-layer depth include biases. Nevertheless, Petro et al. (2019) reported that biomasses of bacteria and archaea show consistent trends and thresholds with radioisotopes in the bioturbation zone. Similarly, eDNA metabarcoding data of foraminifera may provide Supplementary Information for particle mixing determined by geochemical tracer data. To confirm the relationship between the molecular community of foraminifera and particle mixing conditions based on geochemical signals, further investigation of processes of degradation for sedimentary DNA and radioisotopes is needed.
We investigated planktic and benthic foraminiferal assemblages using eDNA metabarcoding methods in the area covered by allochthonous foraminiferal ooze on the summit of the Takuyo-Daigo Seamount. In bottom water samples, contamination of benthic foraminiferal DNA was attributed to resuspension, as observed in resuspended shells of sediment trap samples. C. nitida was most abundant in aqueous DNA of bottom water and G. glutinata was most widely detected in sedimentary DNA, while spinose species were plentiful in shells. The discrepancy in dominant planktic foraminifers between the three samples can be caused by preservation biases, species-specific success rate of PCR, and low abundances of planktic foraminifers. Collection timing and sites contributed to differences among samples.
On the other hand, communities of foraminifera identified in eDNA from sediment samples were affected by sediment-layer depth in cores and sampling months. Unassigned foraminiferal and monothalamid sequences were dominant. ASVs of sedimentary DNA decreased linearly as depth increased at St. PC02, whereas ASVs decreased exponentially at St. PC03. Thresholds of numbers of foraminiferal ASVs in sediments were comparable to particle mixing depths determined using radioisotopes.
The datasets presented in this study can be found in online repositories. The names of the repository/repositories and accession number(s) can be found in the article/Supplementary Material.
AI, AS, and MS designed the study. AS conducted field work and sampling at sea. MN conducted experiments and MN and AM performed analyses. AM wrote the manuscript with contributions from all co-authors. AM, AI, and AS provided grant and equipment support. All authors contributed to the article and approved the submitted version.
The author(s) declare financial support was received for the research, authorship, and/or publication of this article. This research was partly supported by a Grant-in-Aid for JSPS Fellows to AM (JP22KJ3176). This work was also supported by the Research Laboratory on Environmentally-conscious Developments and Technologies (E-code) at the National Institute of Advanced Industrial Science and Technology (AIST).
This study was commissioned by the Agency for Natural Resources and Energy of the Japanese Ministry of Economy, Trade and Industry. We thank J. Minatoya, supervisor of the JS20-2 and JS21 cruises of JOGMEC (now at Marine Biological Research Institute of Japan Co.,Ltd), and the captain and crew of R/V Shinsei-Maru of Fukada Salvage & Marin Works Co.,Ltd. Shipboard observation and sampling were conducted by S. Kondo, Y. Yamamoto and T. Sugiyama of KANSO TECHNOS Co. Ltd., and S. Kato, K. Tsutsumi and H. Yokooka of IDEA Consultants, Inc. We thank A. Tsukasaki of AIST for the custom-made filtration apparatus used in the offshore laboratory. We express their appreciation to everyone concerned with this program.
The authors declare that the research was conducted in the absence of any commercial or financial relationships that could be construed as a potential conflict of interest.
All claims expressed in this article are solely those of the authors and do not necessarily represent those of their affiliated organizations, or those of the publisher, the editors and the reviewers. Any product that may be evaluated in this article, or claim that may be made by its manufacturer, is not guaranteed or endorsed by the publisher.
The Supplementary Material for this article can be found online at: https://www.frontiersin.org/articles/10.3389/fmars.2023.1243713/full#supplementary-material
An B., Li T., Liu J., Sun H., Chang F. (2018). Spatial distribution and controlling factors of planktonic foraminifera in the modern western Pacific. Quaternary Int. 468, 14–23. doi: 10.1016/j.quaint.2018.01.003
Barrenechea Angeles I., Lejzerowicz F., Cordier T., Scheplitz J., Kucera M., Ariztegui D., et al. (2020). Planktonic foraminifera eDNA signature deposited on the seafloor remains preserved after burial in marine sediments. Sci. Rep. 10 (1), 1–12. doi: 10.1038/s41598-020-77179-8
Bé A. W., Anderson O. R. (1976). Gametogenesis in planktonic foraminifera. Science 192 (4242), 890–892. doi: 10.1126/science.946914
Bé A. W. H., Tolderlund D. S. (1971). “Distribution and ecology of living planktonic foraminifera in surface waters of the Atlantic and Indian oceans”, in The Micropaleontology of Oceans, (Eds.) Funnel B. M., Riedel W. R. (Cambridge: Cambridge University Press), pp. 105-149.
Bolyen E., Rideout J. R., Dillon M. R., Bokulich N. A., Abnet C. C., Al-Ghalith G. A., et al. (2019). Reproducible, interactive, scalable and extensible microbiome data science using QIIME 2. Nat. Biotechnol. 37, 852–857. doi: 10.1038/s41587-019-0209-9
Bouchet V. M., Telford R. J., Rygg B., Oug E., Alve E. (2018). Can benthic foraminifera serve as proxies for changes in benthic macrofaunal community structure? Implications for the definition of reference conditions. Mar. Environ. Res. 137, 24–36. doi: 10.1016/j.marenvres.2018.02.023
Camacho C., Coulouris G., Avagyan V., Ma N., Papadopoulos J., Bealer K., et al. (2009). BLAST+: architecture and applications. BMC Bioinf. 10, 1–9. doi: 10.1186/1471-2105-10-421
Cao Y., Lei Y., Fang J. K. H., Li T. (2022). Molecular diversity of foraminiferal eDNA in sediments and their correlations with environmental factors from the Yellow Sea. Ecol. Indic. 142, 109294. doi: 10.1016/j.ecolind.2022.109294
Caromel A. G., Schmidt D. N., Phillips J. C., Rayfield E. J. (2014). Hydrodynamic constraints on the evolution and ecology of planktic foraminifera. Mar. Micropaleontol. 106, 69–78. doi: 10.1016/j.marmicro.2014.01.002
Chaabane S., de Garidel-Thoron T., Giraud X., Schiebel R., Beaugrand G., Brummer G.-J., et al. (2023). The FORCIS database: A global census of planktonic Foraminifera from ocean waters. Sci. Data 10 (1), 354. doi: 10.1038/s41597-023-02264-2
Chao A., Chiu C.-H., Jost. L. (2014). Unifying species diversity, phylogenetic diversity, functional diversity, and related similarity/differentiation measures through Hill numbers. Annu. Rev. Ecol. Evol. System. 45, 297–324. doi: 10.1146/annurev-ecolsys-120213-091540
Chao A., Jost L. (2012). Coverage-based rarefaction and extrapolation: standardizing samples by completeness rather than size. Ecology 93 (12), 2533–2547. doi: 10.1890/11-1952.1
Chernihovsky N., Torfstein A., Almogi-Labin A. (2018). Seasonal flux patterns of planktonic foraminifera in a deep, oligotrophic, marginal sea: Sediment trap time series from the Gulf of Aqaba, northern Red Sea. Deep Sea Res. Part I: Oceanogr. Res. Pap. 140, 78–94. doi: 10.1016/j.dsr.2018.08.003
Cordier T., Esling P., Lejzerowicz F., Visco J., Ouadahi A., Martins C., et al. (2017). Predicting the ecological quality status of marine environments from eDNA metabarcoding data using supervised machine learning. Environ. Sci. Technol. 51 (16), 9118–9126. doi: 10.1021/acs.est.7b01518
Corliss B. H. (1985). Microhabitats of benthic foraminifera within deep-sea sediments. Nature 314 (6010), 435–438. doi: 10.1038/314435a0
Darling K. E., Kroon D., Wade C. M., Leigh Brown A. J. (1996). Molecular phylogeny of the foraminifera. J. Foraminiferal Res. 26 (4), 324–330. doi: 10.2113/gsjfr.26.4.324
Davis C. V., Wishner K., Renema W., Hull P. M. (2021). Vertical distribution of planktic foraminifera through an oxygen minimum zone: how assemblages and test morphology reflect oxygen concentrations. Biogeosciences 18 (3), 977–992. doi: 10.5194/bg-18-977-2021
Deng L., Bölsterli D., Kristensen E., Meile C., Su C. C., Bernasconi S. M., et al. (2020). Macrofaunal control of microbial community structure in continental margin sediments. Proc. Natl. Acad. Sci. 117 (27), 15911–15922. doi: 10.1073/pnas.1917494117
Dimiza M. D., Triantaphyllou M. V., Koukousioura O., Hallock P., Simboura N., Karageorgis A. P., et al. (2016). The Foram Stress Index: A new tool for environmental assessment of soft-bottom environments using benthic foraminifera. A case study from the Saronikos Gulf, Greece, Eastern Mediterranean. Ecol. Indic. 60, 611–621. doi: 10.1016/j.ecolind.2015.07.030
Duffield C. J., Edvardsen B., Eikrem W., Alve E. (2014). Effects of different potential food sources on upper-bathyal benthic foraminifera: an experiment with propagules. J. Foraminiferal Res. 44 (4), 416–433. doi: 10.2113/gsjfr.44.4.416
Enge A. J., Nomaki H., Ogawa N. O., Witte U., Moeseneder M. M., Lavik G., et al. (2011). Response of the benthic foraminiferal community to a simulated short-term phytodetritus pulse in the abyssal North Pacific. Mar. Ecol. Prog. Ser. 438, 129–142. doi: 10.3354/meps09298
Frontalini F., Cordier T., Balassi E., du Chatelet E. A., Cermakova K., Apothéloz-Perret-Gentil L., et al. (2020). Benthic foraminiferal metabarcoding and morphology-based assessment around three offshore gas platforms: Congruence and complementarity. Environ. Int. 144, 106049. doi: 10.1016/j.envint.2020.106049
Geslin E., Heinz P., Jorissen F., Hemleben C. (2004). Migratory responses of deep-sea benthic foraminifera to variable oxygen conditions: laboratory investigations. Mar. Micropaleontol. 53 (3-4), 227–243. doi: 10.1016/j.marmicro.2004.05.010
Gollner S., Kaiser S., Menzel L., Jones D. O., Brown A., Mestre N. C., et al. (2017). Resilience of benthic deep-sea fauna to mining activities. Mar. Environ. Res. 129, 76–101. doi: 10.1016/j.marenvres.2017.04.010
Gooday A. J. (1986). Meiofaunal foraminiferans from the bathyal Porcupine Seabight (northeast Atlantic): size structure, standing stock, taxonomic composition, species diversity and vertical distribution in the sediment. Deep Sea Res. Part A. Oceanogr. Res. Pap. 33 (10), 1345–1373. doi: 10.1016/0198-0149(86)90040-3
Gooday A. J., Lejzerowicz F., Goineau A., Holzmann M., Kamenskaya O., Kitazato H., et al. (2021). The biodiversity and distribution of abyssal benthic foraminifera and their possible ecological roles: A synthesis across the clarion-clipperton zone. Front. Mar. Sci. 8. doi: 10.3389/fmars.2021.634726
Gooday A. J., Levin L. A., Linke P., Heeger T. (1992). “The Role of Benthic Foraminifera in Deep-Sea Food Webs and Carbon Cycling”, in Deep-Sea Food Chains and the Global Carbon Cycle. NATO ASI Series, (eds) Rowe G. T., Pariente V. (Dordrecht: Springer), vol 360. doi: 10.1007/978-94-011-2452-2_5
Holzmann M., Hohenegger J., Hallock P., Piller W. E., Pawlowski J. (2001). Molecular phylogeny of large miliolid foraminifera (Soritacea Ehrenberg 1839). Mar. Micropaleontol. 43 (1-2), 57–74. doi: 10.1016/S0377-8398(01)00021-4
Hothorn T., Hornik K. (2022) exactRankTests: Exact Distributions for Rank and Permutation Tests. R package version 0.8-35. Available at: https://CRAN.R-project.org/package=exactRankTests.
Iguchi A., Nishijima M., Yoshioka Y., Miyagi A., Miwa R., Tanaka Y., et al. (2020). Deep-sea amphipods around cobalt-rich ferromanganese crusts: taxonomic diversity and selection of candidate species for connectivity analysis. PloS One 15, 1–11. doi: 10.1371/journal.pone.0228483
ISA. (2020). ISA, International Seabed Authority Recommendations for the Guidance of Contractors for the Assessment of the Possible Environmental Impacts Arising from Exploration for Marine Minerals in the Area, ISBA/25/LTC/6/Rev.1.
Jo T., Murakami H., Yamamoto S., Masuda R., Minamoto T. (2019). Effect of water temperature and fish biomass on environmental DNA shedding, degradation, and size distribution. Ecol. Evol. 9 (3), 1135–1146. doi: 10.1002/ece3.4802
Jones D. O., Kaiser S., Sweetman A. K., Smith C. R., Menot L., Vink A., et al. (2017). Biological responses to disturbance from simulated deep-sea polymetallic nodule mining. PloS One 12 (2), e0171750. doi: 10.1371/journal.pone.0171750
Jonkers L., Kučera M. (2015). Global analysis of seasonality in the shell flux of extant planktonic Foraminifera. Biogeosciences 12 (7), 2207–2226. doi: 10.5194/bg-12-2207-2015
Jonkers L., Reynolds C. E., Richey J., Hall I. R. (2015). Lunar periodicity in the shell flux of planktonic foraminifera in the Gulf of Mexico. Biogeosciences 12 (10), 3061–3070. doi: 10.5194/bg-12-3061-2015
Jorissen F. J., de Stigter H. C., Widmark J. G. (1995). A conceptual model explaining benthic foraminiferal microhabitats. Mar. micropaleontol. 26 (1-4), 3–15. doi: 10.1016/0377-8398(95)00047-X
Joseph C., Faiq M. E., Li Z., Chen G. (2022). Persistence and degradation dynamics of eDNA affected by environmental factors in aquatic ecosystems. Hydrobiologia 849 (19), 4119–4133. doi: 10.1007/s10750-022-04959-w
Kawahata H., Nishimura A., Gagan M. K. (2002). Seasonal change in foraminiferal production in the western equatorial Pacific warm pool: evidence from sediment trap experiments. Deep Sea Res. Part II: Topical Stud. Oceanogr. 49 (13-14), 2783–2800. doi: 10.1016/S0967-0645(02)00058-9
Kvile K. Ø., Taranto G. H., Pitcher T. J., Morato T. (2014). A global assessment of seamount ecosystems knowledge using an ecosystem evaluation framework. Biol. Conserv. 173, 108–120. doi: 10.1016/j.biocon.2013.10.002
Laroche O., Kersten O., Smith C. R., Goetze E. (2020). Environmental DNA surveys detect distinct metazoan communities across abyssal plains and seamounts in the western Clarion Clipperton Zone. Mol. Ecol. 29 (23), 4588–4604. doi: 10.1111/mec.15484
Laroche O., Wood S. A., Tremblay L. A., Ellis J. I., Lear G., Pochon X. (2018). A cross-taxa study using environmental DNA/RNA metabarcoding to measure biological impacts of offshore oil and gas drilling and production operations. Mar. pollut. Bull. 127, 97–107. doi: 10.1016/j.marpolbul.2017.11.042
Laroche O., Wood S. A., Tremblay L. A., Ellis J. I., Lejzerowicz F., Pawlowski J., et al. (2016). First evaluation of foraminiferal metabarcoding for monitoring environmental impact from an offshore oil drilling site. Mar. Environ. Res. 120, 225–235. doi: 10.1016/j.marenvres.2016.08.009
Lejzerowicz F., Esling P., Pawlowski J. (2014). Patchiness of deep-sea benthic Foraminifera across the Southern Ocean: Insights from high-throughput DNA sequencing. Deep Sea Res. Part II: Topical Stud. Oceanogr. 108, 17–26. doi: 10.1016/j.dsr2.2014.07.018
Lejzerowicz F., Gooday A. J., Barrenechea Angeles I., Cordier T., Morard R., Apothéloz-Perret-Gentil L., et al. (2021). Eukaryotic biodiversity and spatial patterns in the Clarion-Clipperton Zone and other abyssal regions: insights from sediment DNA and RNA metabarcoding. Front. Mar. Sci. 8, 671033. doi: 10.3389/fmars.2021.671033
Lessa D., Morard R., Jonkers L., Venancio I. M., Reuter R., Baumeister A., et al. (2020). Distribution of planktonic foraminifera in the subtropical South Atlantic: depth hierarchy of controlling factors. Biogeosciences 17 (16), 4313–4342. doi: 10.5194/bg-17-4313-2020
Li Q., Lei Y., Liu J., Shen Y., Huang H., Wang C., et al. (2022). Characteristics of foraminiferal communities in the western Clarion–Clipperton Zone revealed by eDNA metabarcoding. J. Sea Res. 189, 102286. doi: 10.1016/j.seares.2022.102286
Maechler M., Rousseeuw P., Struyf A., Hubert M., Hornik K. (2022). cluster: Cluster Analysis Basics and Extensions. R package version 2.1.3. Available at: https://CRAN.R-project.org/package=cluster.
Maeda A., Kuroyanagi A., Iguchi A., Gaye B., Rixen T., Nishi H., et al. (2022). Seasonal variation of fluxes of planktic foraminiferal tests collected by a time-series sediment trap in the central Bay of Bengal during three different years. Deep Sea Res. Part I: Oceanogr. Res. Pap. 183, 103718. doi: 10.1016/j.dsr.2022.103718
Meilland M., Cornuault P., Morard R., Brummer G.-J. A., Kucera M. (2022). Identification guide to extant planktonic foraminifera. Part 1: Family Candeinidae and genera Berggrenia, Bolivina, Dentigloborotalia, and Neogallitellia. ICES Identification Leaflets Plankton 196, 22. doi: 10.17895/ices.pub.7643
Milivojević T., Rahman S. N., Raposo D., Siccha M., Kucera M., Morard R. (2021). High variability in SSU rDNA gene copy number among planktonic foraminifera revealed by single-cell qPCR. ISME Commun. 1 (1), 1–8. doi: 10.1038/s43705-021-00067-3
Moodley L., Middelburg J. J., Boschker H. T., Duineveld G. C., Pel R., Herman P. M., et al. (2002). Bacteria and Foraminifera: key players in a short term deep-sea benthic response to phytodetritus. Mar. Ecol. Prog. Ser. 236, 23–29. doi: 10.3354/meps236023
Morard R., Lejzerowicz F., Darling K. F., Lecroq-Bennet B., Winther Pedersen M., Orlando L., et al. (2017). Planktonic foraminifera-derived environmental DNA extracted from abyssal sediments preserves patterns of plankton macroecology. Biogeosciences 14 (11), 2741–2754. doi: 10.5194/bg-14-2741-2017
Morard R., Vollmar N. M., Greco M., Kucera M. (2019). Unassigned diversity of planktonic foraminifera from environmental sequencing revealed as known but neglected species. PloS One 14 (3), e0213936. doi: 10.1371/journal.pone.0213936
Nozaki T., Tokumaru A., Takaya Y., Kato Y., Suzuki K., Urabe T. (2016). Major and trace element compositions and resource potential of ferromanganese crust at Takuyo Daigo Seamount, northwestern Pacific Ocean. Geochem. J. 50 (6), 527–537. doi: 10.2343/geochemj.2.0430
Oksanen J., Simpson G. L., Blanchet F. G., Kindt R., Legendre P., Minchin P. R., et al. (2022). vegan: Community Ecology Package. R package version 2.6-4. Available at: https://github.com/vegandevs/vegan.
Orcutt B. N., Bradley J. A., Brazelton W. J., Estes E. R., Goordial J. M., Huber J. A., et al. (2020). Impacts of deep-sea mining on microbial ecosystem services. Limnol. Oceanogr. 65 (7), 1489–1510. doi: 10.1002/lno.11403
Ota Y., Suzumura M., Tsukasaki A., Suzuki A., Seike K., Minatoya J. (2022). Sediment accumulation rates and particle mixing at northwestern Pacific seamounts. J. Mar. Syst. 229, 103719. doi: 10.1016/j.jmarsys.2022.103719
Patterson R. T., Fishbein E. (1989). Re-examination of the statistical methods used to determine the number of point counts needed for micropaleontological quantitative research. J. Paleontol. 63 (2), 245–248. doi: 10.1017/S0022336000019272
Pawlowski J., Bruce K., Panksep K., Aguirre F. I., Amalfitano S., Apothéloz-Perret-Gentil L., et al. (2022). Environmental DNA metabarcoding for benthic monitoring: A review of sediment sampling and DNA extraction methods. Sci. Total Environ. 818, 151783. doi: 10.1016/j.scitotenv.2021.151783
Pawlowski J., Esling P., Lejzerowicz F., Cedhagen T., Wilding T. A. (2014). Environmental monitoring through protist next-generation sequencing metabarcoding: assessing the impact of fish farming on benthic foraminifera communities. Mol. Ecol. Resour. 14 (6), 1129–1140. doi: 10.1111/1755-0998.12261
Petro C., Zäncker B., Starnawski P., Jochum L. M., Ferdelman T. G., Jørgensen B. B., et al. (2019). Marine deep biosphere microbial communities assemble in near-surface sediments in Aarhus Bay. Front. Microbiol. 10, 758. doi: 10.3389/fmicb.2019.00758
Quast C., Pruesse E., Yilmaz P., Gerken J., Schweer T., Yarza P., et al. (2013). The SILVA ribosomal RNA gene database project: improved data processing and web-based tools. Opens external link in new window. Nucl. Acids Res. 41 (D1), D590–D596. doi: 10.1093/nar/gks1219
R Core Team (2021). R: A language and environment for statistical computing (Vienna, Austria: R Foundation for Statistical Computing). Available at: https://www.R-project.org/.
Roberts D. W. (2019) labdsv: Ordination and Multivariate Analysis for Ecology. R package version 2.0-1. Available at: https://CRAN.R-project.org/package=labdsv.
Saito T., Doi H. (2021). Degradation modeling of water environmental DNA: experiments on multiple DNA sources in pond and seawater. Environ. DNA 3 (4), 850–860. doi: 10.1002/edn3.192
Sansom B. J., Sassoubre L. M. (2017). Environmental DNA (eDNA) shedding and decay rates to model freshwater mussel eDNA transport in a river. Environ. Sci. Technol. 51 (24), 14244–14253. doi: 10.1021/acs.est.7b05199
Sassoubre L. M., Yamahara K. M., Gardner L. D., Block B. A., Boehm A. B. (2016). Quantification of environmental DNA (eDNA) shedding and decay rates for three marine fish. Environ. Sci. Technol. 50 (19), 10456–10464. doi: 10.1021/acs.est.6b03114
Schiebel R. (2002). Planktic foraminiferal sedimentation and the marine calcite budget. Global Biogeochem. Cycles 16 (4), 3–1. doi: 10.1029/2001GB001459
Schiebel R., Hemleben C. (2017). Planktic foraminifers in the modern ocean. (Berlin, Heidelberg: Springer), 358. doi: 10.1007/978-3-662-50297-6
Seymour M., Durance I., Cosby B. J., Ransom-Jones E., Deiner K., Ormerod S. J., et al. (2018). Acidity promotes degradation of multi-species environmental DNA in lotic mesocosms. Commun. Biol. 1 (1), 4. doi: 10.1038/s42003-017-0005-3
Shi J., Lei Y., Li H., Li T. (2021). NGS-metabarcoding revealing novel foraminiferal diversity in the Western Pacific Magellan Seamount sediments. J. Oceanol. Limnol. 39 (5), 1718–1729. doi: 10.1007/s00343-021-0427-0
Shi J., Lei Y., Li Q., Lyu M., Li T. (2020). Molecular diversity and spatial distribution of benthic foraminifera of the seamounts and adjacent abyssal plains in the tropical Western Pacific Ocean. Mar. Micropaleontol. 156, 101850. doi: 10.1016/j.marmicro.2020.101850
Storz D., Schulz H., Waniek J. J., Schulz-Bull D. E., Kučera M. (2009). Seasonal and interannual variability of the planktic foraminiferal flux in the vicinity of the Azores Current. Deep Sea Res. Part I: Oceanogr. Res. Pap. 56 (1), 107–124. doi: 10.1016/j.dsr.2008.08.009
Strickler K. M., Fremier A. K., Goldberg C. S. (2015). Quantifying effects of UV-B, temperature, and pH on eDNA degradation in aquatic microcosms. Biol. Conserv. 183, 85–92. doi: 10.1016/j.biocon.2014.11.038
Teal L. R., Bulling M. T., Parker E. R., Solan M. (2008). Global patterns of bioturbation intensity and mixed depth of marine soft sediments. Aquat. Biol. 2 (3), 207–218. doi: 10.3354/ab00052
Toro N., Galvez E., Saldana M., Jeldres R. I. (2022). Submarine mineral resources: A potential solution to political conflicts and global warming. Minerals Eng. 179, 107441. doi: 10.1016/j.mineng.2022.107441
Usui A., Nishi K., Sato H., Nakasato Y., Thornton B., Kashiwabara T., et al. (2017). Continuous growth of hydrogenetic ferromanganese crusts since 17 Myr ago on Takuyo-Daigo Seamount, NW Pacific, at water depths of 800–5500 m. Ore Geol. Rev. 87, 71–87. doi: 10.1016/j.oregeorev.2016.09.032
Walker M., Hammel J. U., Wilde F., Hoehfurtner T., Humphries S., Schuech R. (2021). Estimation of sinking velocity using free-falling dynamically scaled models: Foraminifera as a test case. J. Exp. Biol. 224 (2), jeb230961. doi: 10.1242/jeb.230961
Watling L., Auster P. J. (2021). Vulnerable marine ecosystems, communities, and indicator species: Confusing concepts for conservation of seamounts. Front. Mar. Sci. 8, 622586. doi: 10.3389/fmars.2021.622586
Weber A. A., Pawlowski J. (2013). Can abundance of protists be inferred from sequence data: a case study of Foraminifera. PloS One 8 (2), e56739. doi: 10.1371/journal.pone.0056739
Weinkauf M. F., Siccha M., Weiner A. K. (2022). Reproduction dynamics of planktonic microbial eukaryotes in the open ocean. J. R. Soc. Interface 19 (187), 2021. doi: 10.1098/rsif.2021.0860
Keywords: foraminifera, environmental DNA, metabarcoding analyses, seamount, deep-sea sediment
Citation: Maeda A, Nishijima M, Iguchi A, Ota Y, Suzumura M and Suzuki A (2024) Environmental DNA metabarcoding of foraminifera for biological monitoring of bottom water and sediments on the Takuyo-Daigo Seamount in the northwestern Pacific. Front. Mar. Sci. 10:1243713. doi: 10.3389/fmars.2023.1243713
Received: 21 June 2023; Accepted: 20 November 2023;
Published: 31 January 2024.
Edited by:
Cristina Gambi, Marche Polytechnic University, ItalyReviewed by:
Yubo Hou, Skidmore College, United StatesCopyright © 2024 Maeda, Nishijima, Iguchi, Ota, Suzumura and Suzuki. This is an open-access article distributed under the terms of the Creative Commons Attribution License (CC BY). The use, distribution or reproduction in other forums is permitted, provided the original author(s) and the copyright owner(s) are credited and that the original publication in this journal is cited, in accordance with accepted academic practice. No use, distribution or reproduction is permitted which does not comply with these terms.
*Correspondence: Ayumi Maeda, YXktbWFlZGFAYWlzdC5nby5qcA==
Disclaimer: All claims expressed in this article are solely those of the authors and do not necessarily represent those of their affiliated organizations, or those of the publisher, the editors and the reviewers. Any product that may be evaluated in this article or claim that may be made by its manufacturer is not guaranteed or endorsed by the publisher.
Research integrity at Frontiers
Learn more about the work of our research integrity team to safeguard the quality of each article we publish.