 Clara Navarro
 Anais Janc
 Géraldine Lassalle
 Patrick Lambert
 Chloé Dambrine
- 1INRAE, UR EABX, Cestas, France
- 2The common unit Management of Diadromous Fish in their Environment OFB-INRAE-Institut Agro-UPPA, Rennes, France
Introduction: Many diadromous fish species are currently facing the threat of generalized population extirpations across their range, and conservation efforts implemented primarily within the continental domain may not be sufficient to ensure their viability. In consequence, better understanding the use of the marine environment by these species turned out to be critical.
Material and method: We developed marine species distribution models for two species, Allis shad (Alosa alosa) and the European flounder (Platichthys flesus), and proposed a way to interpret the habitat suitability from a more functional perspective. Our approach defined marine habitats as highly suitable environments that remained with a high potential through the species life stage duration at sea. First, a species-specific probabilistic threshold was applied to select for highly suitable environments each year of the simulations. Then, annual maps of high suitability were combined into recurrence maps showing areas were the environmental conditions remained the most suitable across the life at sea of the given species, these areas being called ‘marine habitats’. We applied this approach to study the current and future marine habitats of Allis shad and European flounder under climate change scenarios.
Results: The main current marine habitats of these species were coastal, primarily in the Bay of Biscay for Allis shad and in the English Channel-North Sea for European flounder. These habitats are expected to experience minimal changes by mid-century, and the species may even benefit from new habitats at higher latitudes. However, the European flounder is likely to face greater challenges in the central part of its range by the end of the century, as potential spawning grounds may be threatened.
Discussion: This study provided a way to rethink ‘traditional’ suitability maps by integrating basic knowledge on the diadromous species life at sea. Our findings were part of a larger effort to link continental and marine habitats in improving management of diadromous species.
1 Introduction
Migrations are regular or seasonal movements of animals between functionally distinct habitats that are mandatory to complete their life cycle (Dingle and Drake, 2007). Migration strategies vary between species, populations, individuals with migratory fishes expressing a large diversity of strategies (Tamario et al., 2019). Among them, diadromous species migrate between sea and fresh waters for growth and reproduction needs (McDowall, 1988). Three main strategies occur: fish spend most of their lives in ocean and migrate to a river to reproduce (anadromous species) or the other way around (catadromous species) with the return migrations operated by mature individuals. Amphidromous fish migrate from one environment to another with a return migration at an earlier life stage first for feeding and then maturing and reproducing (Potter et al., 2015). Diadromous species are recognized as operating a crucial link between fresh waters and marine environments through nutrient flows (Poulet et al., 2022). Despite their ecological and socio-economical values, most of them are threatened or even close to extinction. Indeed, as their complex life cycle requires active migrations between waters of different salinity, they are particularly vulnerable to external pressures along their journeys (Costa-Dias et al., 2009).
Anthropogenic pressures in fresh waters were assumed to be the main causes of this decline with, among others stressors, the construction of dams and weirs as barriers to fish migration, pollution, alteration of spawning habitats and over-exploitation (Limburg and Waldman, 2009). Climate change has also contributed to the decline of diadromous populations because spawning and ontogenetic habitats in freshwater (rivers and lakes), estuarine and oceanic ecosystems are impacted by climate change at varying degrees (Mota et al., 2016; Terui and Miyazaki, 2017). The consequences of climate change have already been observed or predicted for fish populations (Walther et al., 2002) with, principally, impacts on the species phenology (Legrand et al., 2021) and shifts of their distribution areas (Lassalle and Rochard, 2009). There is therefore an increasing need to predict these climate-driven changes in order to improve conservation strategies and ensure population sustainability (Brook et al., 2008). Restoration of diadromous fish populations in fresh waters has been implemented since the beginning of the 20st century in Europe (Arthington et al., 2016). Unfortunately, measures have been insufficient to stop diadromous fish decline, which can be partially explained by poor understanding of their life at sea (e.g., Verhelst et al., 2021). Identifying marine areas where the environment is suitable for the diadromous life cycle is required to implement efficient conservation policies at sea (Velazco et al., 2020; Elliott et al., 2021).
Species habitat suitability modeling in the marine environment is an important part of the management strategies as they contribute to the identification of critical fish habitats and delineation of marine protected areas (Di Marco et al., 2017; Muscatello et al., 2021). Over past years, increased use of Species Distribution Models (SDMs) provided practical information on the potential species ranges (Robinson et al., 2017). A significant portion of these studies has adopted statistical correlative approaches due to their ability to yield informative results without necessitating an exhaustive understanding of the species’ intricate demographic and physiological processes, which can often be challenging to acquire (Guisan and Zimmermann, 2000). Statistical correlative approaches involve the correlation of geo-localized species occurrences (presence-only, presence-absence or abundance) with environmental variables, enabling the explanation and prediction of species distributions (Elith et al., 2006). Some studies have questioned the choice of a single statistical approach to predict species responses to climate variations and suggested the use of ensemble modeling (i.e., the combination of the predictions of several models fitted with different algorithms) (Hao et al., 2019).
Melo-Merino et al. (2020) revealed an increase in the number of publications applying SDMs (i) to explain and predict the potential distribution patterns of marine species in recent years and (ii) to understand the impact of climate change on habitat suitability distribution in the century. Studies of diadromous species have been mainly conducted in the freshwater environment (not only with SDMs), without regard to marine habitats considered as non-limiting. Thus, management measures resulting from these studies were principally based upon catchments (Maes et al., 2007; Le Pichon et al., 2014). As such, they do not seem sufficient to help population recovery, so identifying where diadromous species are at sea to better protect their essential marine habitats is mandatory. Trancart et al. (2014) and Elliott et al. (2023) have investigated the distribution at sea of some diadromous species along the European Atlantic coasts using SDMs. They demonstrated the suitability of the continental shelves of the Bay of Biscay and more northerly seas for lampreys and shads. Even though their marine distribution is better understood, their preferential use of the marine environment requires finer and more precise identification of the highest and most stable suitable habitats, later referred to as marine habitats.
The objective of the present study was: (i) to determine the marine habitats of two diadromous species with contrasting life cycles by considering their marine phase characteristics, and (ii) then, to identify changes in these marine habitats under the effects of climate change. To this end, we proposed and used an original definition of marine habitats. A marine habitat was defined as one that is highly suitable across the entire time spent at sea for spawning or growing and feeding. This approach can be adapted to any diadromous species according to its life cycle and time spent in the marine environment. Here, we applied this approach to two species: the anadromous Allis shad (Alosa alosa, L.) and the catadromous European flounder (Platichthys flesus, L.). Once current marine habitats were identified following this definition, we evaluated their evolution in the future for the middle and the end of the 21st century according to two climatic scenarios (Representative Concentration Pathways i.e., RCP 4.5 and RCP 8.5). We used a large and recent occurrences dataset (2006 to 2021) that combined different sources (i.e., the MigrenMer and ObsMer program, DATRAS, OBIS, GBIF), environmental data at a relatively fine resolution (i.e., 11 km) and an ensemble modeling approach. Our results can serve as a basis for designing targeted conservation measures for Allis shad and European flounder, and can also be applied to other diadromous species worldwide. The information gathered through our approach can contribute to the development of sustainable management strategies for diadromous fish populations, ultimately helping to ensure their long-term survival and conservation.
2 Material and methods
2.1 Species of interest and study area
Allis shad and European flounder were selected as representative of two distinct functional uses of the marine environment. Allis shad belongs to the Clupeidae family and is distributed along the northeastern Atlantic coast (Baglinière et al., 2003). It is an anadromous species with an average life expectancy of 4-6 years. Eggs are spawned in rivers and larvae/young juveniles migrate downstream to the sea where they grow for 3 to 6 years in the pelagic environment . When sexual maturity occurs (between 4 and 6 years), adults return to spawn and most of them die in their birth river (Thorrold et al., 2001).
European flounder belongs to the Pleuronectidae family and is a demersal species particularly common along the southern and eastern coasts of the North Sea (Cabral et al., 2007). European flounder typically lives for around ten years and makes regular migrations between estuarine and marine environments as part of its life cycle, except during its first 2-3 years when it remains in the estuarine environment. Eggs are spawned at sea in winter and early spring, and larvae enter estuaries after a few days of passive migration (Campos et al., 1994). Then, juveniles settle on the seafloor to feed and grow until their sexual maturity (i.e., about 3 years for females and 2 for males - Ramos et al., 2010). European flounder is often described as having an estuarine or semi-catadromous resident life stage (Elliott et al., 2007). As it may not fully align with the conventional catadromous definition according to Potter et al. (2015), it’s important to note that its life cycle also involves the use of the non-estuarine part of the river.
The study area extends from the Portuguese coasts to southern Scandinavia (from 36 to 62°N and from -12 to 10.2°E) to cover a large part of the species’ distribution ranges (Figure 1). The Mediterranean and Baltic seas were excluded from the analysis because of their narrow mouths to connect with the Atlantic Ocean that likely prevent large-scale dispersal and favor local adaptations (Hemmer-Hansen et al., 2007). In order to enhance the accuracy of our models, we established a maximum depth of 150 m and 100 m for Allis shad and European flounder, respectively, in accordance with their known preferences for shallower habitats (Taverny and Elie, 2001b).
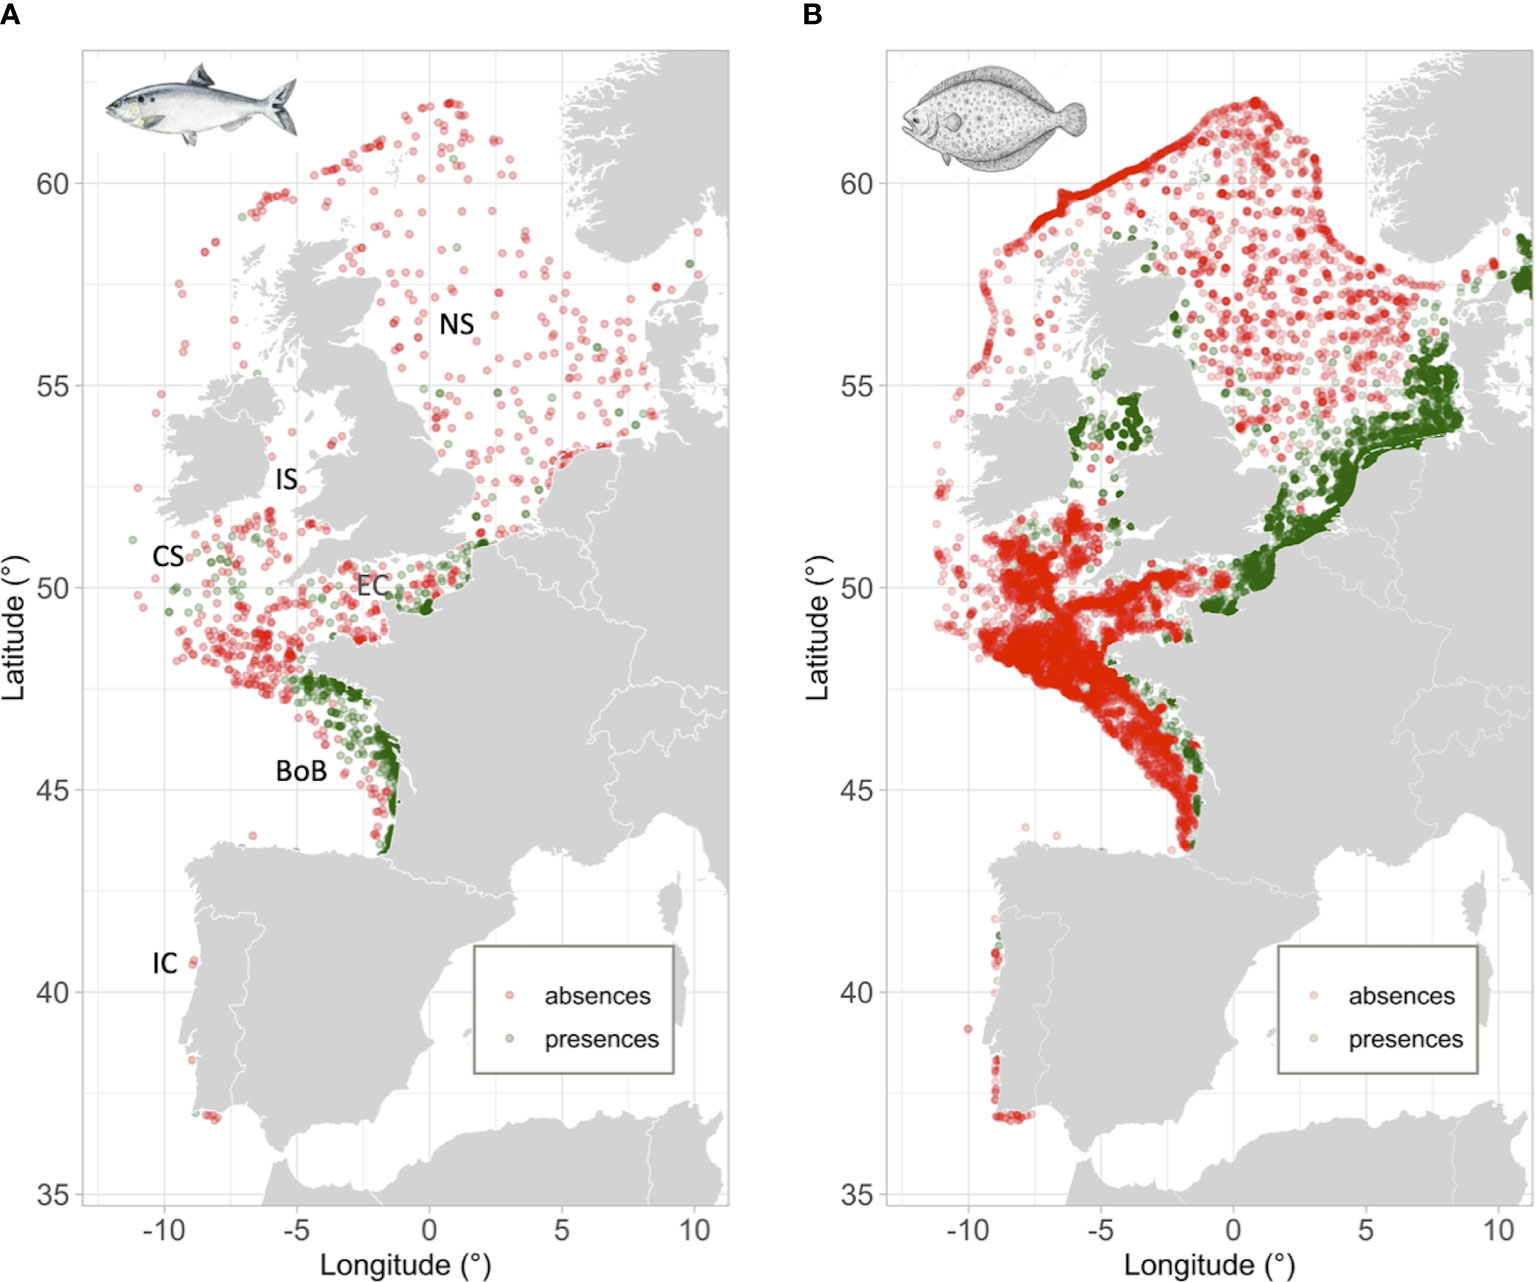
Figure 1 Map illustrating the distribution of presences/absences dataset for Allis shad (A) and European flounder (B). A comprehensive dataset comprising 710 and 7322 presences for Allis shad and European flounder, respectively. The number of absences selected was the same as the number of presences for both species. One of the three distinct absence datasets used in model calibration was depicted while maintaining the prevalence of the occurrence dataset. To mitigate over-plotting, an additive transparency approach was adopted, resulting in areas darkening due to overlapping points. The marine sub-regions referred to in the text were categorized as follows: Iberian Coast - IC, Bay of Biscay - BoB, Celtic Sea - CS, Irish Sea - IS, English Channel - EC, and North Sea - NS.
2.2 General modeling approach description
2.2.1 Input data
The method utilized in this study is rooted in distribution models, and necessitates either presence-only, presence-absence, or abundance data, coupled with various environmental variables. Furthermore, all environmental variables must be characterized at an identical spatial and temporal resolution. The chosen time step for model calibration and application is a critical determinant and can help answer various scientific questions. To investigate climate change, the environmental variables are projected into the future via diverse Global or Regional climatic models and emission scenarios, resulting in a range of potential pathways. The user is afforded the opportunity to select the time step and pathways that aligns most closely with their objectives. The ensuing sections elaborate upon the methodological selections made in this work (Figure 2A).
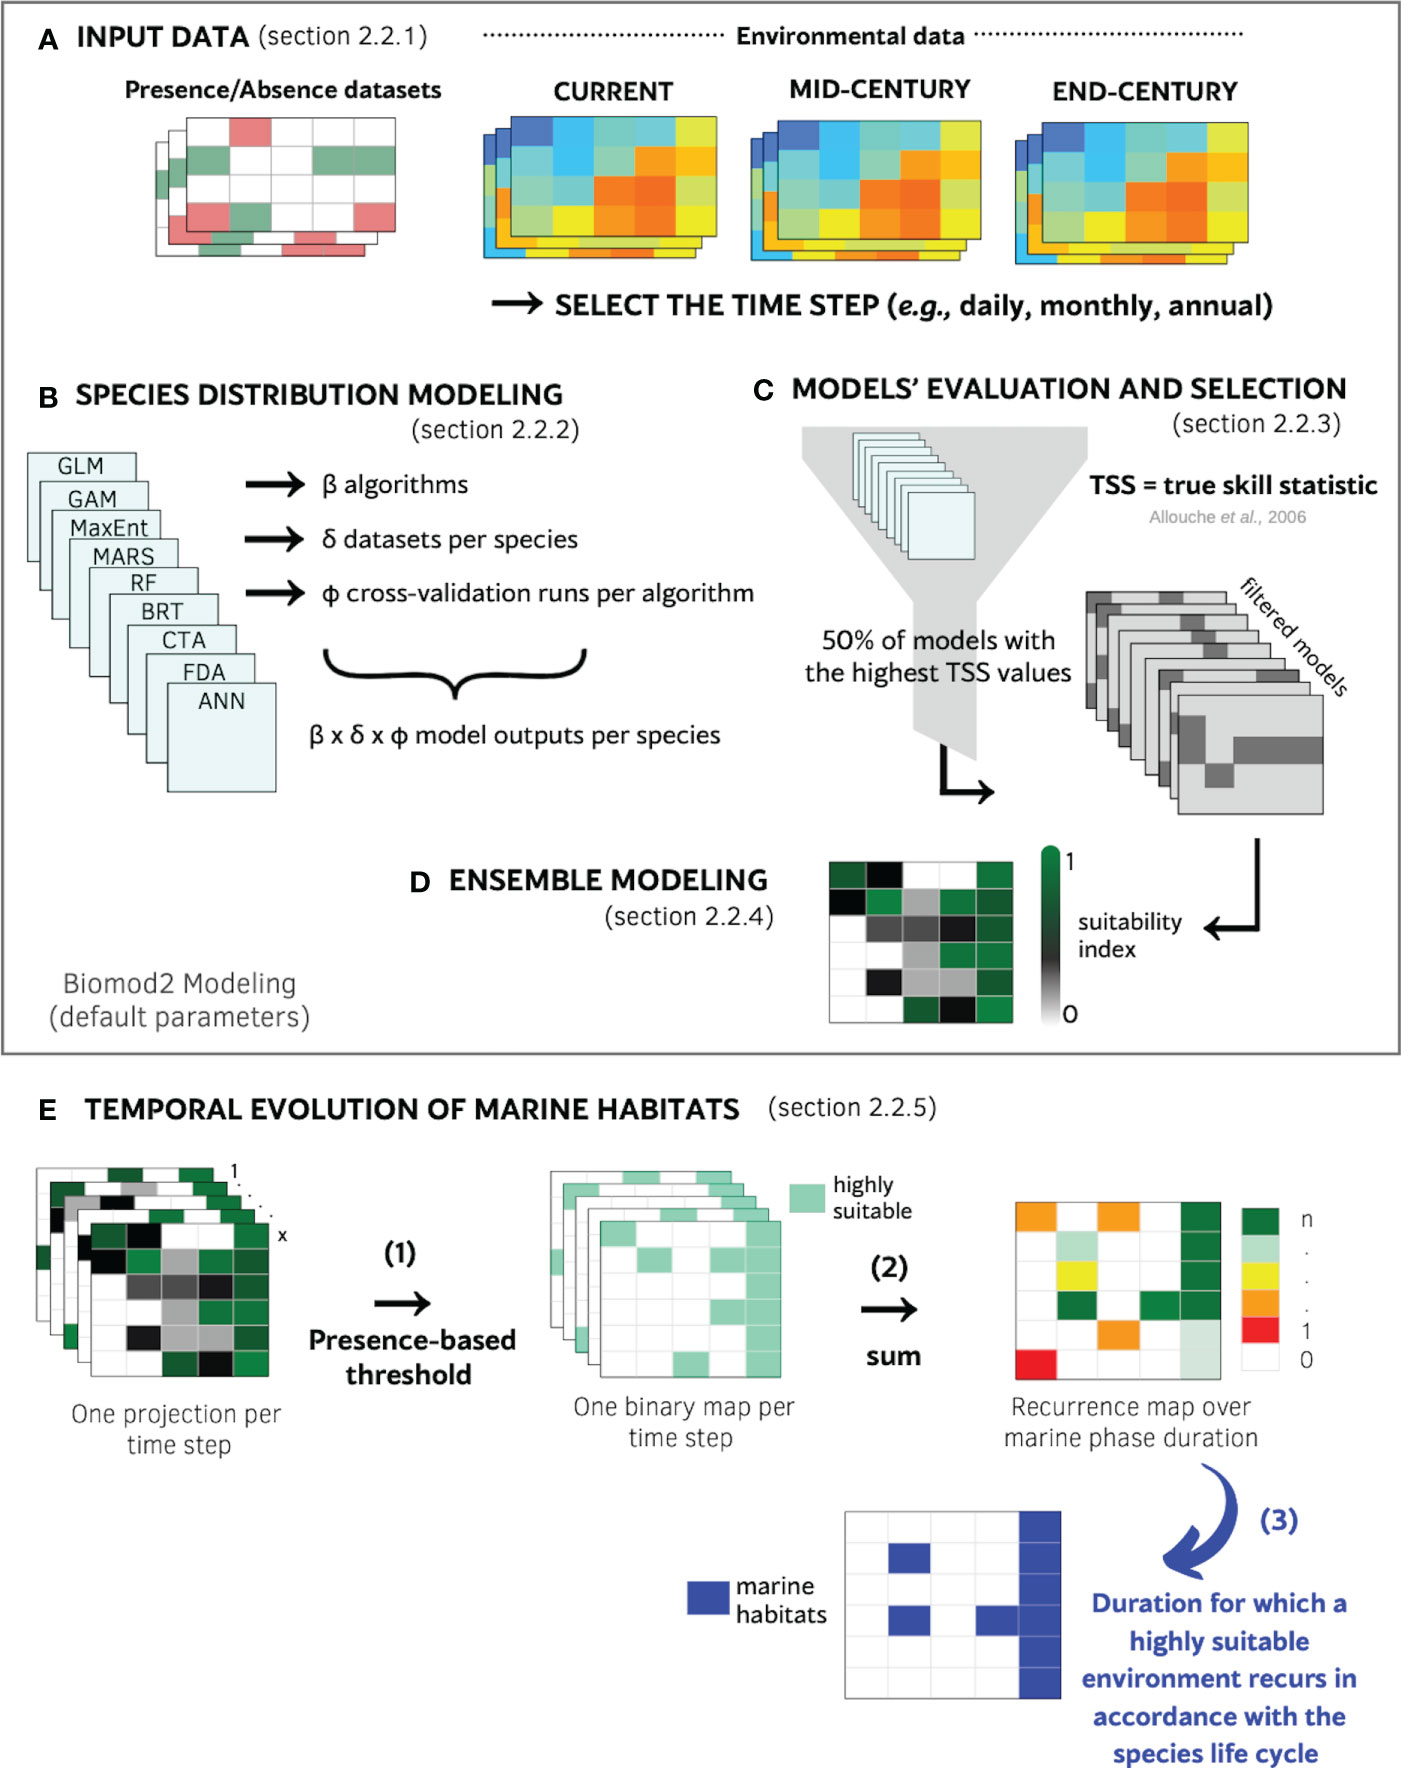
Figure 2 Scheme of the species distribution modeling approach used in this study. (A) Input data were species occurrences and environmental data (three time periods: current, mid-century and end-century). (B) Choices concerning the calibration of species distribution models. (C) Resulting models were filtered based on their abilities to predict known presences and absences by selecting models with True Skill Statistic (TSS) values greater than the median of all models. (D) Selected models were combined to create an ensemble probabilistic density depicting environment suitability probabilities. (E) Creation of a marine habitat map from the criteria of high and stable suitability. (E.1) Probabilistic environment suitability maps predicted for each time step were transformed into binary maps using a presence-based threshold in order to identify the highly suitable environments. (E.2) The binary maps were then combined to create a recurrence map by counting the number of times the cell was classified as highly suitable over the species-specific marine phase duration. (E.3) The highly suitable and recurrent areas were selected to create a single marine habitat map with marine habitats and non-marine habitats.
2.2.1.1 Presence/absence dataset
Species occurrences were collected from three datasets: (i) the MigrenMer database (Elliott et al., 2023) that contained declarations of diadromous species collected by French fishery observers (i.e., the ObsMer program) and some scientific surveys (i.e., DATRAS – ICES), (ii) additional scientific surveys from DATRAS – ICES, and (iii) participatory observations from the Ocean Biodiversity Information System (OBIS) and the Global Biodiversity Information Facility (GBIF). The dataset includes 710 presence and 710 absence records for Allis shad, spanning the period from 2006 to 2019, along with 7322 records for European flounder, covering the time span from 2006 to 2021 (see Figure 1; Tables S1, S2 for more details on the temporal and spatial distribution of species dataset).
The absence data were obtained from the ObsMer database (as it is the only one that contains data for the entire study area) on fishing gears that caught, at least once, the species. For both species, absence data from a particular year were retained if they were located more than 20 km away from presence data recorded in the same year. The prevalence (i.e., proportion of presences in the dataset) was set to 0.5 which gives as much weight to presences as to absences (Jimenez-Valverde and Lobo, 2006). To ascertain the independence of the random selection method from the outcomes, three different absence datasets were used for the calibration of the models, while the occurrences dataset remained unchanged.
2.2.1.2 Current and future environmental data
Environmental variables for the studied region were obtained using a model that combines a hydrodynamic/ocean circulation model (i.e., POLCOMS - Proudman Oceanographic Laboratory Coastal Ocean Modeling System; Holt and James, 2001) with a biogeochemical model (i.e., ERSEM - European Regional Seas Ecosystem Model; Butenschön et al., 2016, Tables S1, S2). This model meets two essential criteria: i) spatial resolution, characterized by horizontal and vertical dimensions of 0.1° x 0.1° (approximately 11 km) and 43 layers from surface to seabed, and (ii) the availability of numerous environmental variables that could be influenced by climate change, with projections extending to the conclusion of the current century. The model provided monthly values for 20 environmental variables from 2006 to 2100 following two climate change scenarios: (i) the intermediate scenario in which greenhouse gas emissions peak around 2040 before declining (RCP4.5: +1.1–2.6°C by the year 2100 compared to the reference period 1986-2005), and (ii) the most pessimistic scenario in which greenhouse gas emissions continue to rise throughout the century (RCP8.5: +2.6–4.8°C by the year 2100 when compared to the same reference period) (Meinshausen et al., 2011). Seven environmental variables deemed to have potential influence on the distribution of the target species were extracted from the model, with all variables obtained at the surface for Allis Shad and at the bottom for European Flounder, with the exception of primary production (g C/m²/year). The selected environmental variables, namely temperature (°C), salinity (‰), dissolved oxygen (mmol/m3), and pH, were chosen due to their direct physiological effects, influencing growth, survival, and reproductive success (Maes et al., 2007). Net primary production was also included as an environmental variable, serving as a food proxy for the selected species, given that they primarily consume zooplankton, with small fish making up a minor portion of their diet (Summers, 1980; Taverny and Elie, 2001a). In order to recognize the impact that oceanic currents can exert on the dispersion of marine populations, affecting both the movement of adult fish and the exchange of larvae (Caldwell and Gergel, 2013), we used the current velocity (m/s). These environmental variables have been demonstrated to be vulnerable to the effects of climate change, and were anticipated to undergo modifications in response to such changes, with the potential to impact the future distribution of shad and flounder (Terui and Miyazaki, 2017). Bathymetry, a constant environmental factor recognized for its significant influence on the distribution of marine species, was also obtained as part of our data extraction process (Bradie and Leung, 2017). A bathymetry map was retrieved from the EMODnet site (i.e., The European Marine Observation and Data Network) and its spatial resolution was of 0.001° x 0.001.
2.2.1.3 Time step selected
Although the environmental variables could be obtained at a monthly basis, we opted for an annual time step for both model construction and application (henceforth, the time step is referred to as a year). This choice, was driven by our research focus on species that inhabit the marine phase for extended periods, spanning multiple years. Thus, we extracted the annual average of each environmental variable based on the geographic coordinates and the corresponding year for both the presence and absence data of each species. As an example, a fish caught in 2006 was assigned the temperature value of the grid cell of capture for the year 2006. Consequently, the model calibration used environmental conditions spanning the years of presence/absence data availability: 2006-2019 and 2006-2021 for Allis shad and European flounder, respectively (Table S2). Then, the distribution of environmental suitability predictions was projected annually over three species-specific duration periods for Allis Shad (2006-2010, 2055-2059, 2095-2099) and for European flounder (2006-2013, 2052-2059, 2092-2099). It is important to note that using the same number of years within the duration periods enables meaningful comparisons to assess potential marine habitat changes.
2.2.2 Species distribution modeling
To ensure optimal model performances, the calibration process involved multiple presence/absence datasets, as well as the use of multiple cross-validations. In this study, we used the typical cross-validation approach, based on 80% of the original dataset, with models evaluated using the remaining 20% (Roberts et al., 2017). Additionally, the biomod2 platform employed in this study enabled us to test nine algorithm classes using their default settings: generalized linear models (GLM), generalized additive models (GAM), Maximum Entropy (MaxEnt), multivariate adaptive regression splines (MARS), random forest (RF), boosted regression tree (BRT), classification tree analysis (CTA), flexible discriminant analysis (FDA) and artificial neural networks (ANN) (Figure 2B) (Thuiller et al., 2009). To serve our modeling objectives, we created a total of 108 models for each species (9 algorithms x 3 absence datasets x 4 cross-validation runs).
Statistical models must be developed with uncorrelated explanatory variables. To this end, we calculated the pairwise Pearson correlation coefficients between all environmental variables, and only included variables with a coefficient value of less than 0.7 in the same model (Dormann et al., 2013). Then, to ensure that only relevant environmental variables were included in the model, we employed a performance criterion that provides an importance value for each variable involved in the model. The principle was to compute the Pearson correlation coefficient between the reference predictions and the predictions obtained from a shuffled dataset for each variable. The higher the score obtained, the more influential the variable was in the model. We selected only the variables with a score greater than 0.1 for at least three algorithm classes to ensure that only the most relevant variables were included in the model. Then, we re-ran the 108 models using only primary production, temperature, bathymetry, and salinity to model the marine habitats of Allis shad; and temperature, bathymetry, and salinity for European flounder.
2.2.3 Models evaluation and selection
The models’ predictive accuracy was evaluated using the True Skill Statistic (TSS), particularly useful as it captures both presences and absences (Allouche et al., 2006; Guisan et al., 2017), which is consistent with the aims of identifying suitable environments for the species of interest (Figure 2C). It is calculated from a confusion matrix that contains the number of true positives, false positives, false negatives and true negatives predicted by the model (Liu et al., 2005). It is calculated as the sum of sensitivity (i.e., the probability of correct presence classification) and specificity (i.e., the probability of correct absence classification), minus 1. This index ranges from -1 to +1, with +1 indicating perfect agreement and values of zero or less indicating performance no better than random chance (Parra et al., 2004). Model efficiency is usually summarized into this scale: excellent (TSS > 0.8), good (0.8 > TSS > 0.6), correct (0.6 > TSS > 0.4), and bad (TSS < 0.4). Therefore, we ranked the selected models based on their TSS values, and chose those that had a TSS higher than the median value of all models’ TSS scores, across all algorithms, datasets, and cross-validation runs. This allowed us to choose models that had a better performance than at least half of all models tested. In total, 54 model outputs for each of the two species were obtained.
2.2.4 Ensemble modeling
The 54 selected models based on TSS were used to create the ensemble modeling using the R package biomod2, which takes into account the variability within each model and across different modeling methods (Thuiller et al., 2009; Figure 2D). Ensemble maps of the suitable environment for both species were generated for each time step (i.e., year). We also constructed response curves for each environmental variable in the ensemble model by setting the other variables to their mean values using the evaluation strip method Elith et al., 2005; Guisan et al., 2017; Figures S1, S2).
2.2.5 Temporal evolution of marine habitats
For assessing the temporal evolution of marine habitats, it was used a novel methodology that combined high suitability with recurrent suitability. High suitability was defined as being above a threshold established using model-fitted probabilities of presence, while recurrent suitability was determined by the number of years with suitability above the threshold according to the life span at sea of the species being studied (Figure 2E). At first, the threshold to determine highly suitable areas was calculated as the average of the fitted probabilities from the ensemble modeling for the observed presences (Cramer, 2003). Here, these thresholds were of 0.87 and 0.95 for Allis shad and European flounder, respectively (Figure 2E – arrow 1). Using this threshold, we transform ensemble predictions into binary maps. Predictions with probabilities above the threshold are classified as environment highly suitable, while those below the threshold are classified as “others”.
Secondly, the “ recurrent suitability”, was operationalized by creating a recurrence map to examine the frequency of environment deemed highly suitable over the multiple year corresponding to the life span at sea (Figure 2E – arrow 2). The recurrence map was generated by summing the binary values for each cell from annual binary maps. The resulting values in the recurrence map ranged from 0 (i.e., the environment was never considered highly suitable over the species’ marine phase duration) to the maximum number of years (i.e., the environment was always deemed highly suitable over the species’ marine phase duration). Based on the marine phase duration of the two species (as described in Section 2.1), we selected an appropriate recurrence rate for Allis shad and European flounder.
2.2.5.1 Representing current marine habitats
In the final step of our methodology (Figure 2E – arrow 3), we identified marine habitats as cells that demonstrated high suitability for Allis shad (during its growing phase at sea) for at least four out of five years, and for European flounder (during at least one successful reproduction) for at least one out of eight years. Our rationale for determining appropriate recurrence rates is based on species-specific ecological characteristics. For Allis shad, which relies on the marine environment for growth over a period of 4 to 5 years, we analyzed consecutive five-year periods from 2006 to 2010. In these periods, we counted instances where a cell was deemed highly suitable. Cells with a count of at least four out of five years with high suitability were considered marine habitats for Allis shad. In contrast, European flounder uses the marine habitat ad hoc irregularly for reproduction, occurring once-a-year without consistent location. Therefore, we examined eight-year periods from 2006 to 2013, determining whether a cell was classified as highly suitable for reproduction in at least one of those years. This adaptation acknowledges the species’ intermittent use of the marine environment for reproduction, where suitability might not consistently occur across all eight years. As a result, the projected marine habitats derived from the final ensemble modeling (see section 2.2.4) performed over the periods 2006-2010 (5 years) and 2006-2013 (8 years) for Allis shad and European flounder, respectively. Finally, we transformed the recurrence maps with values ranging from 0 to 8 into binary maps distinguishing marine habitats from non-marine habitats.
2.2.5.2 Effects of climate change on marine habitats
The mid-century (2055-2059 and 2052-2059) and end-century (2095-2099 and 2092-2099) periods were chosen to represent the respective future marine habitats for Allis shad and European flounder under the two RCP scenarios, respectively. The monthly values of environmental variables from POLCOM-ERSEM were averaged over the species-specific periods of 5 and 8 years, and ensemble models were run using these variables. Annual suitability index maps were created using the same thresholds as the calibration phase, and these maps were then converted into recurrence maps and marine habitat maps for the future time periods. The evaluation of climate change impacts on marine habitats were evaluated by comparing the number of spatial cells (0.1° x 0.1°) identified as marine habitats in the current and future maps, as well as the number of new marine habitats in the future or those that were no longer considered marine habitats.
3 Results
According to the efficiency scale, the ensemble models for Allis shad showed a good fit with median TSS values between 0.6 and 0.8 (equal to 0.73). Moreover, the models for European flounder exhibited excellent fit with median TSS values above 0.8 (equal to 0.92). Analysis of response curves revealed that primary production has a slight positive impact on the habitat suitability for Allis shad, whereas other variables such as temperature, salinity, and bathymetry had more pronounced effects (Figure S1). For European flounder, habitat suitability was decreased with increasing salinity beyond 34‰, while the optimal temperature range was 10-13°C, with suitability remaining relatively high for other temperature ranges (Figure A-S2). Bathymetry was found to have a significant impact on European flounder habitat suitability, with the species preferring low bathymetry (<50m) (Figure B-S2).
Current marine habitats for Allis shad were mostly present in the Bay of Biscay, some areas along the Portuguese coasts and in the southern English Channel (Figure 3A). Current marine habitats for the European flounder were mainly close to the coast and located in the eastern English Channel, the southern and eastern North Sea, along the Irish and British coasts surrounding the Irish Sea, and in some areas in the northern Bay of Biscay (Figure 3B).
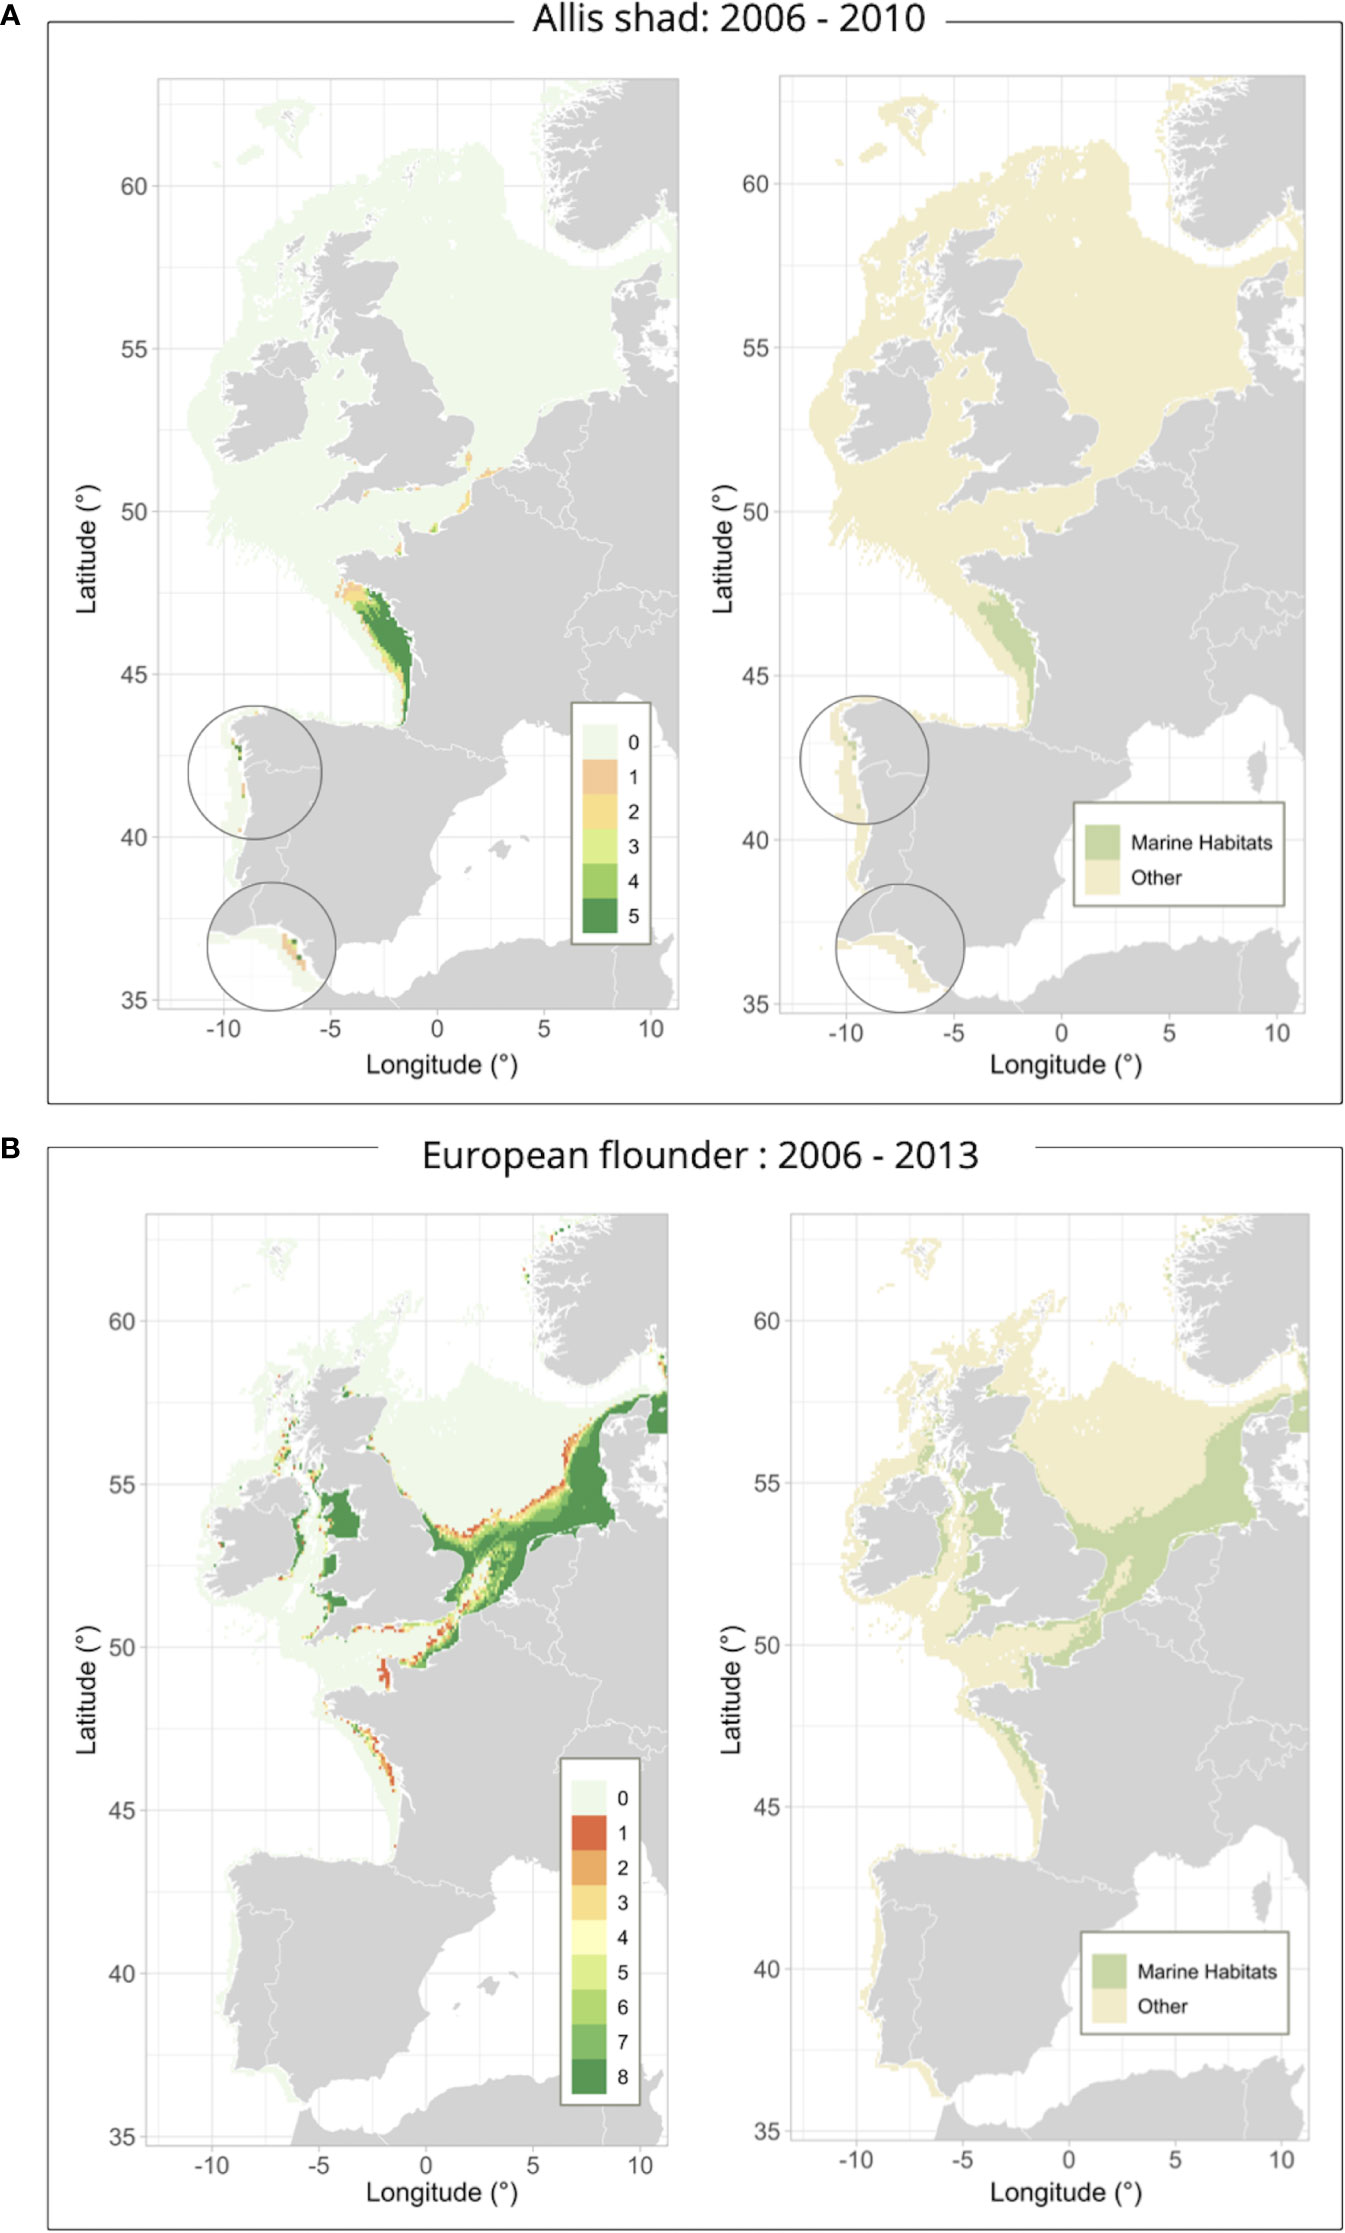
Figure 3 Temporal recurrence maps of highly suitable environments and binary marine habitat maps for the current period and for: Allis shad [2006-2010 – (A)] and European flounder [2006-2013 – (B)]. Allis shad and the European flounder had a temporal recurrence scale varying from 0 (i.e., the environment has never been considered highly suitable over the marine phase duration – light blue) to 5 and 8 (i.e., the environment has always been considered highly suitable over the marine phase duration – dark green), respectively. Marine habitats were the highly suitable and recurrent areas over the marine phase duration (light green) [i.e., at least 4 out of 5 years for Allis shad (A) and at least 1 out of 8 years for European flounder (B)]. Cells not belonging to this category were considered not highly suitable and/or enough recurrent environments over the marine phase duration (light brown).
Allis shad projection maps under climate change scenarios would show potential losses of marine habitats in the Bay of Biscay continental shelf during the mid-century under the scenario RCP8.5, these losses becoming more intense by the end of the century under both climate change scenarios (Figure 4). Furthermore, the marine habitats lost in the Bay of Biscay are projected to have an average temperature of 20.1°C by the end of the century under the RCP8.5 scenario, in contrast to the current period’s average of 15.6°C (Table 1). Regarding primary production, a decrease is expected in the range of 46-53 g C/m²/year in the future projections, compared to the current period’s approximately 62 g C/m²/year. Marine habitats would be nonetheless projected to expand in the English Channel, the Strait of Dover (i.e., strait at the narrowest part of the English Channel) and along the border of the southern North Sea in the mid-century (Figure 4A). They would achieve a more widespread distribution by the end of the century, especially under the RCP8.5 scenario since the range size of marine habitats would significantly increase to cover the entire English Channel (Figure 4B).
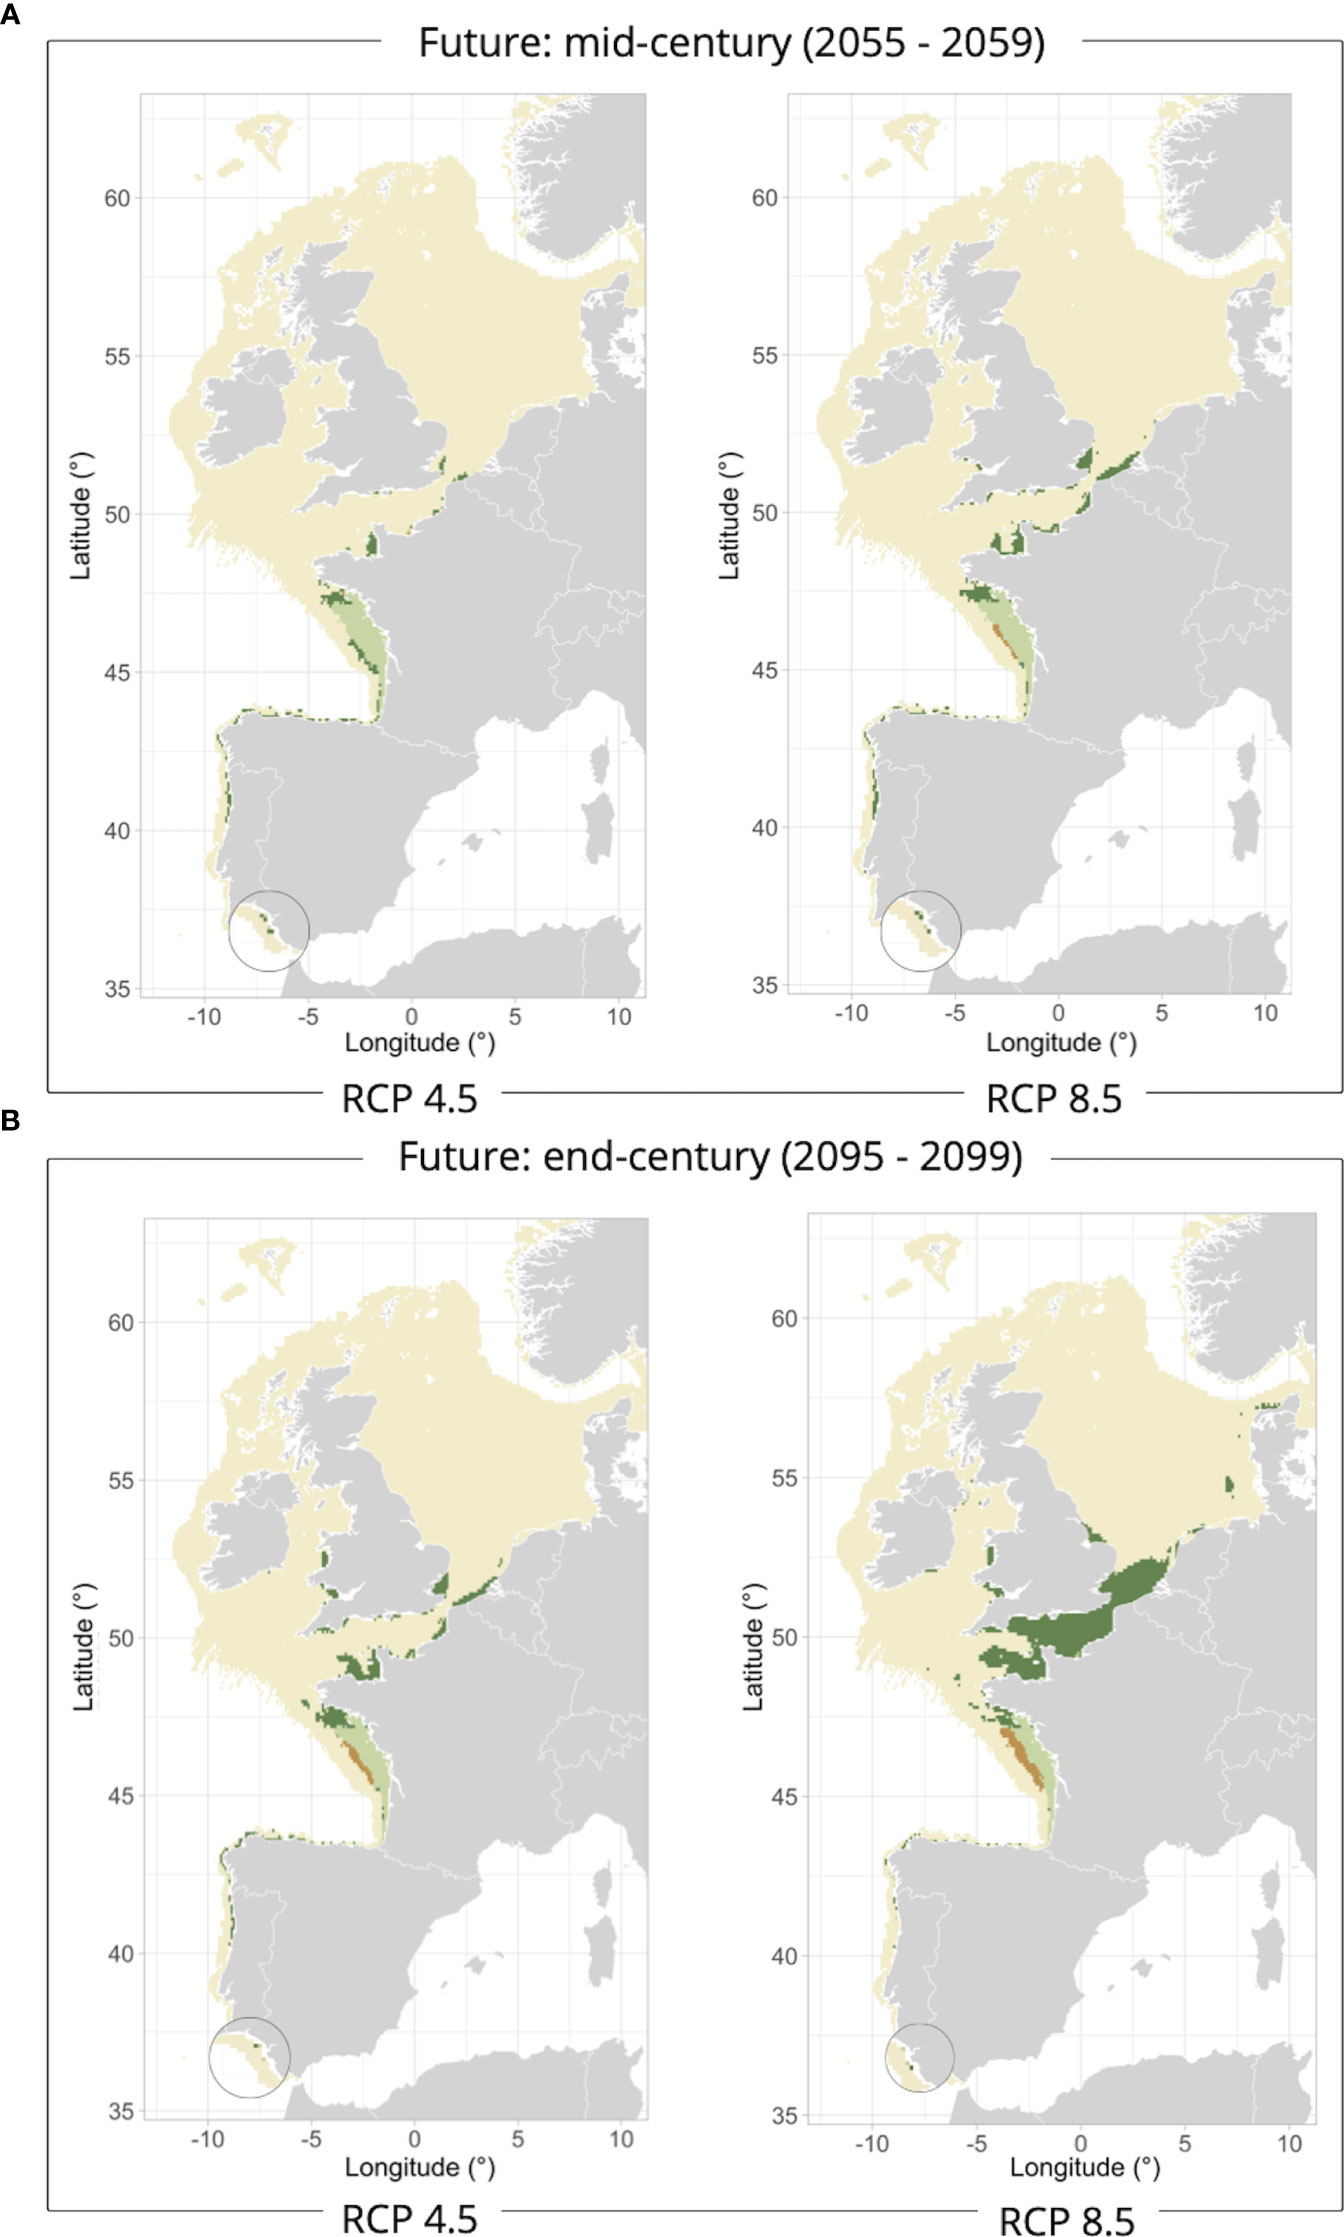
Figure 4 Allis shad marine habitats classified as stable (light green), gained (dark green) or lost (orange) at the middle [2055-2059 – (A)] and end [2095-2099 – (B)] of the century under the RCP4.5 and RCP8.5 climate scenarios compared to the reference period 2006-2010.
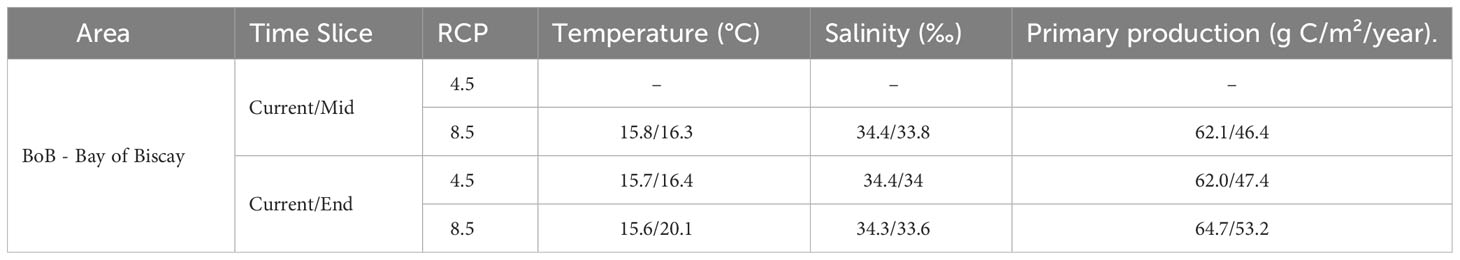
Table 1 Mean environmental variables’ values for Allis shad marine habitat classified as lost (orange, Figure 4) at the middle and end of the century under the RCP 4.5 and RCP 8.5 climate scenarios in the Bay of Biscay, as all lost habitat is found in this area.
In mid-century, European flounder would show marine habitat gains mainly in the English Channel under the RCP4.5 scenario, and the core of the North Sea under the RCP8.5 scenario (Figure 5A). This marine habitat extension in the North Sea would be even more pronounced by the end of the century under both scenarios whereas a potential loss of marine habitats would be projected to occur in the northern Bay of Biscay, the English Channel, and the southern North Sea coastal strip (Figure 5B). Whereas the range size of marine habitat would increase at the end of the century by 33-35% under both climate scenarios, the potential loss of marine habitats would substantially increase by 14% under the RCP4.5 scenario and 32% under RCP8.5. Moreover, an increase in temperature is projected for the Bay of Biscay, the English Channel, the Celtic, the Irish and the North Seas, with temperature reaching up to 3-4°C by the end of the century, when the mean temperature values calculated for the habitats lost in the future projections were compared with current conditions (Table 2).
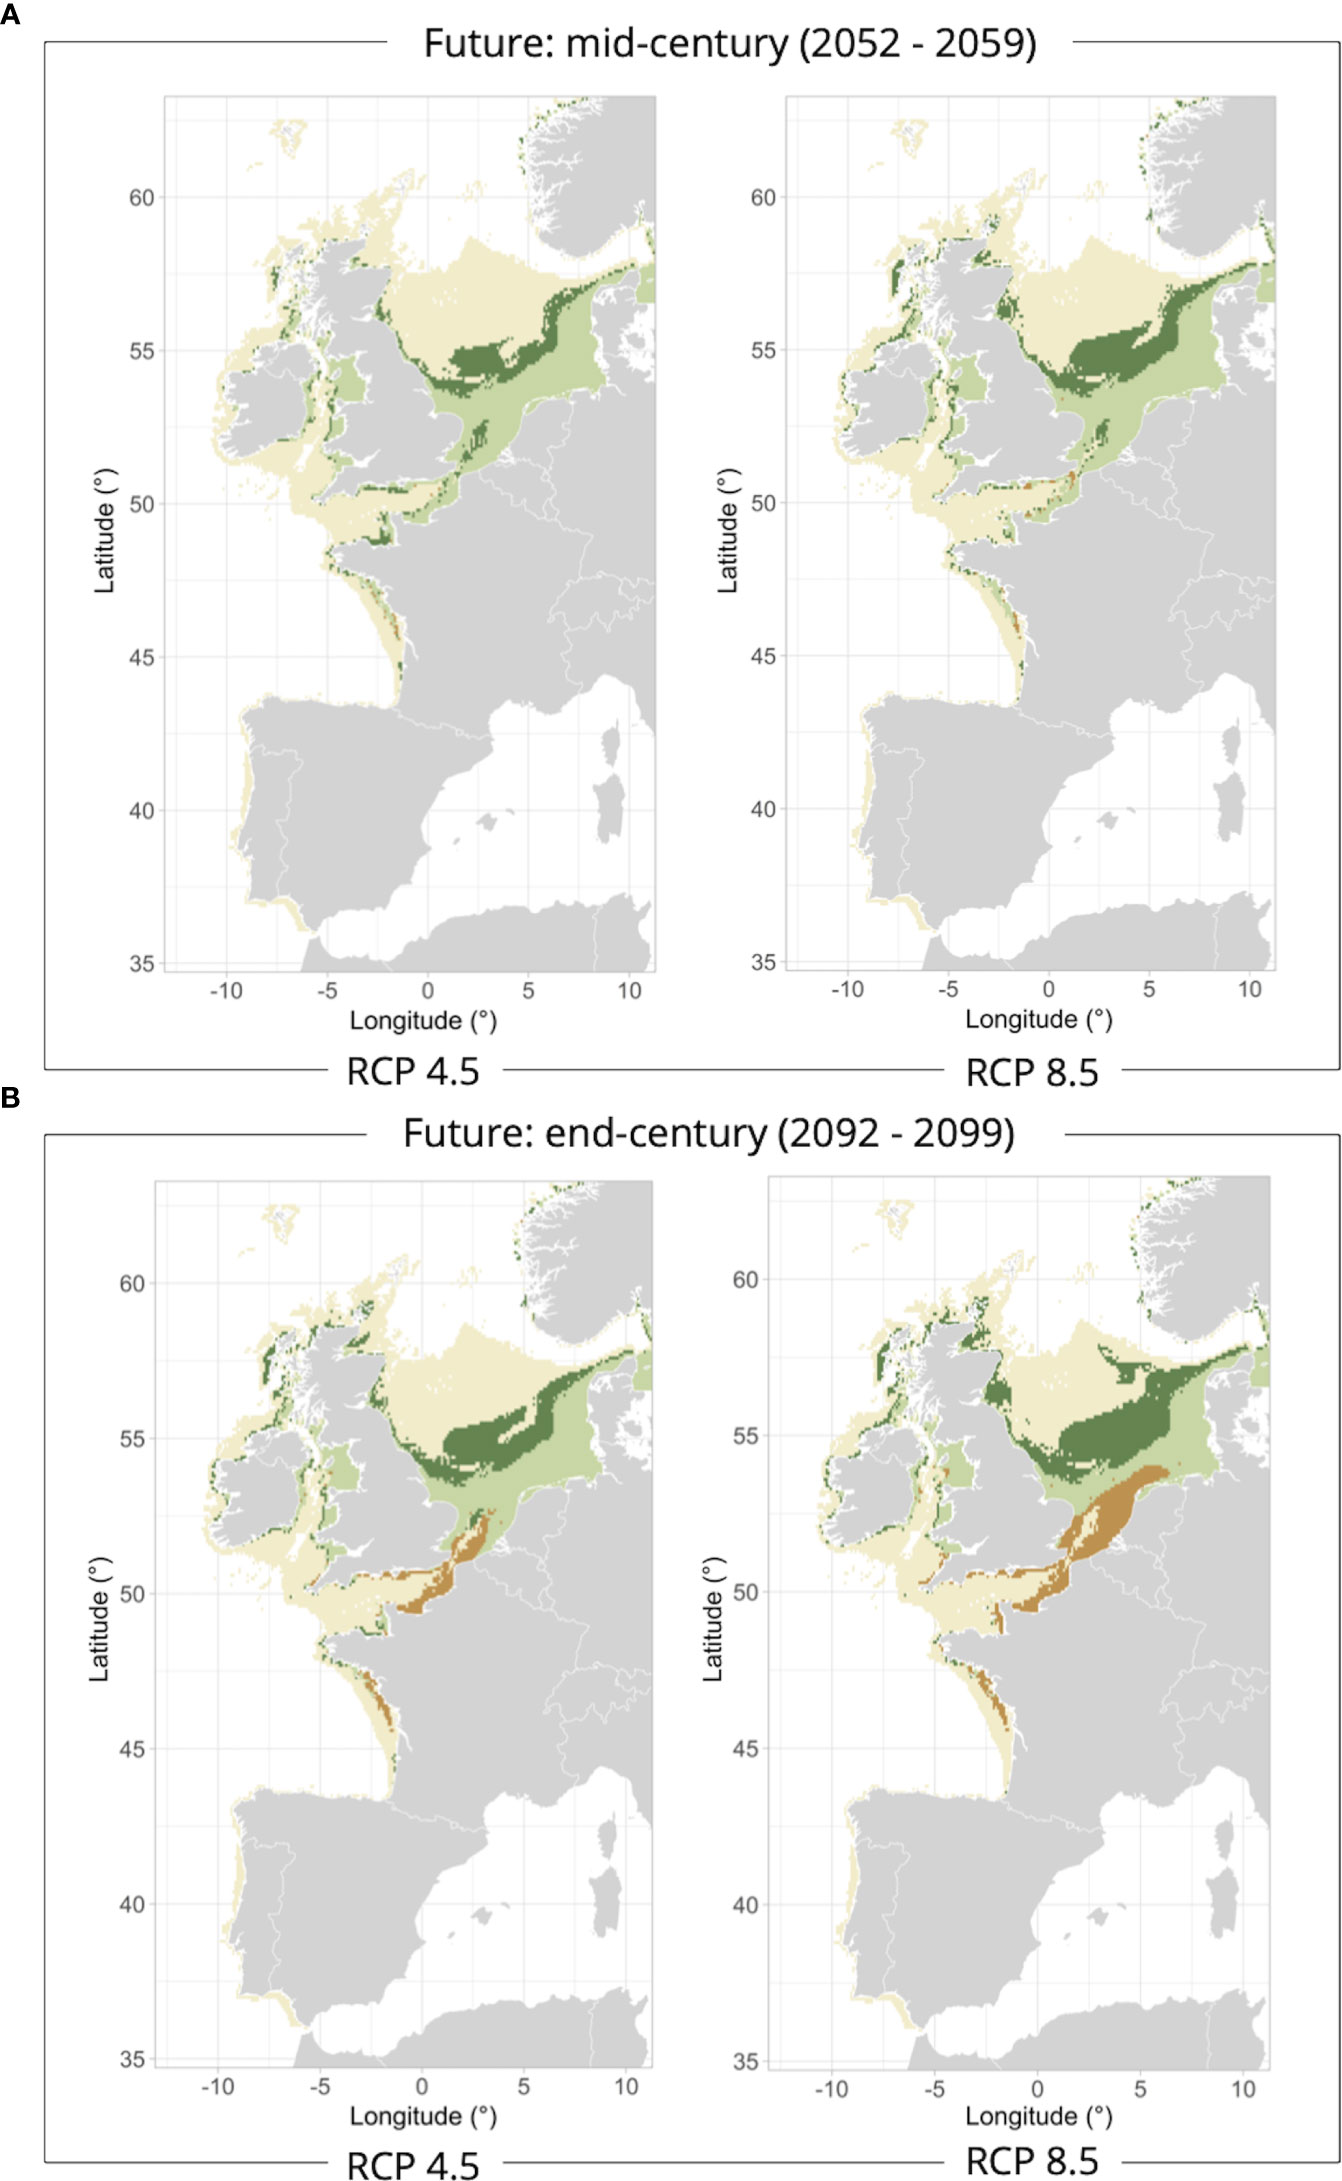
Figure 5 European flounder marine habitats classified as stable (light green), gained (dark green) or lost (orange) at the middle [2052-2059 – (A)] and end [2092-2099 – (B)] of the century under the RCP4.5 and RCP8.5 climate scenarios compared to the reference period 2006-2013.
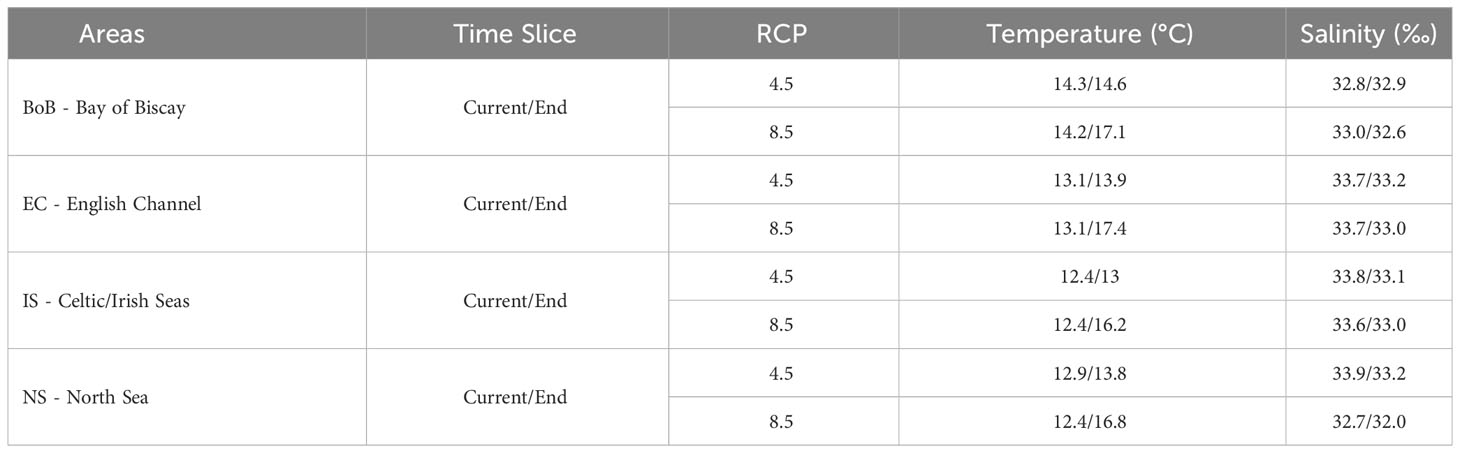
Table 2 Mean environmental variables’ values for European flounder marine habitat classified as lost (orange, Figure 5) at the end of the century under the RCP 4.5 and RCP 8.5 climate scenarios in four major marine sub-regions.
4 Discussion
4.1 Contribution and limits of the approach
The marine habitats of Allis shad identified in this study are consistent with previous observations of the species being present in the Bay of Biscay, but sparsely abundant in the catchments of the North Sea, and possibly absent from northern Europe (De Groot, 2002; Baglinière et al., 2003). Our findings are also in agreement with previous species distribution models for Allis shad which identified the northern Bay of Biscay as highly suitable throughout the seasons (Trancart et al., 2014; Elliott et al., 2023). Nonetheless, our findings for the Iberian coast sub-region are in contrast with the common perception that Allis shad is abundant there (Nachón et al., 2016).
The results obtained for the European flounder are in line with previous studies that indicated the species as abundant in the southern and eastern coastal North Sea (Campos et al., 1994; Skerritt, 2010). Marine habitats can also be found, in a smaller proportion, along the coast of the Bay of Biscay but are absent along the Iberian coast although several studies mentioned the species’ presence in adjacent Iberian rivers (e.g., Minho, Lima, Vouga and Mondego - Cabral et al., 2007; Mota et al., 2016; Nachón et al., 2016). Portugal is currently reported as the southern limit of the species’ distribution (Pédron et al., 2017).
The present study acknowledges that the model’s predictive ability for European flounder and Allis shad along the Iberian coast may be inaccurate due to the scarcity of occurrence data in that area among the input dataset (0.1% and 0.4% of presence data, respectively, Table S1). Although the model’s performance was not evaluated based on the proportion of absence, we recognize the importance of achieving a balanced representation of absence data (0.9% for European flounder and 0.8% for Allis shad, Table S1). It is well known that cold and saline bottom waters rise to the surface (i.e., upwelling) in summer along the Iberian coast (Nykjær and Van Camp, 1994).These specific thermal and salinity conditions may not have be “included” in the species response curve, preventing the model from predicting marine habitats in this sub-region of the study area. Given the scarcity of occurrence data for the Portuguese and Cantabrian coasts, it would be valuable to employ a temporally more precise modeling approach, such as a monthly time-scale, to capture the environmental conditions associated with upwelling and more accurately predict species’ distributions along the Iberian coast sub-region. The environmental variables in this region differ considerably from those in other parts of our study area, and thus, a higher number of occurrence records is necessary for their full integration into the model and more reliable prediction of the species distribution in the area. Furthermore, the classification of highly suitable habitat might be stringent, as it relies on the predicted probability across the entire geographical range. Such an approach could be deemed justifiable under the assumption that the sampling strategy and techniques are entirely comparable throughout the geographical range.
The pelagic or benthic behavior of the two species makes them vulnerable as by-catch to fisheries of the main commercial species such as mackerel, herring or sole operating in the area (Trancart et al., 2014). Thus, occurrences are mainly from by-catches among commercial fishing data. Fishery data are potentially biased because fishermen select areas where the targeted species is likely to be present with the aim of maximizing yields and minimizing costs by finding hotspots (Dell et al., 2011). Despite this limitation, we used these data to develop our models, as they provided the richest source of information on the distribution and abundance of bycatch species. Additionally, we compared our results to those of previous studies that incorporated observation modeling (i.e., taking into account for the imperfect detection and its variability among gears or other factors) into their models (Elliott et al., 2023) and found them to be largely consistent, which indicates the robustness of our modeling approach.
Professional fishing in the Northern Atlantic is typically focused on coastal areas, which could result in an underestimation of the suitability of offshore environments from modeling approaches based on fisheries-related data (Moustakas et al., 2006). However, this bias may not significantly affect our results given that the two species studied are known to primarily inhabit depths shallower than 200 meters (Summers, 1979; Taverny and Elie, 2001b). Misidentification of species is a common source of errors in studies using fishery data. For instance, Allis shad and Twaite shad (Alosa fallax), as well as European flounder and European plaice (Pleuronectes platessa), share similarities in morphology, and may be misidentified. Nevertheless, the MigrenMer database was carefully curated to reduce the risk of confusion, such as by renaming Twaite shads larger than 50 cm as Allis shad (Elliott et al., 2023).
As our approach adheres to conventional frequentist statistical analysis, we were compelled to omit certain environmental variables due to their relatively weak associations. Nevertheless, it is imperative to recognize that high correlation does not necessarily imply strong causation. There are potential remedies to take into account the dynamic nature of variable correlations, with one such option being the adoption of Empirical Dynamic Modeling (EDM), accessible through the rEDM package in R (Sugihara et al., 2012; Sugihara et al., 2020). EDM has demonstrated its efficacy in numerous fish stock assessments, presenting an innovative standpoint worthy of contemplation (Sguotti et al., 2020). While it may not serve as a universally applicable solution, its suitability hinges on considerations such as species life history and data availability. In this study, we have made the most of the limited occurrence data at our disposal. Additionally, the algorithms we employed for ensemble modeling necessitate non-correlated variables to converge, further compounded by our access to environmental variables over a relatively abbreviated time frame.
4.2 Essential fish habitats for Allis shad and European flounder
Characterizing diadromous species’ habitats functionality is essential to improve their management and maintain population sustainability. Habitats comprise waters and substrates essential for fish to spawn, feed and/or grow to sexual maturity (Dambrine et al., 2021). The ability to identify diadromous species’ habitat functionality depends upon knowledge of the habitats used by fish. European flounder and Allis shad have different Essential Fish Habitats (EFHs) due to their distinct life-history traits. Whereas Allis shad spends the majority of its life at sea for growth and maturation, European flounder migrates to sea once a year to reproduce (Baglinière et al., 2003; Skerritt, 2010). Hence, the marine habitats identified for flounder and shad could be assumed to be potential nurseries and spawning grounds, respectively. However, it would be simplistic to assume that our approach only highlights these specific potential habitats. For instance, it is still unclear whether Allis shad remains in the same marine habitats for successive years or moves between different growth habitats. Here, we assumed the simplest postulate that shad remains in the same marine habitats for five years. Valdimarsson et al. (2012) have identified the presence of Allis shad in Icelandic marine waters, located several hundred kilometers away from the closest known spawning grounds in the British Isles and the European mainland. These catches far from catchments with functional populations suggest a larger dispersion than expected. In addition, the findings of Nachón et al. (2020) suggest that European eel from the Garonne population exhibited a lack of homing behavior during their oceanic phase, as indicated by telemetry data and subsequent capture at sea. The individuals appeared to exhibit a more random wandering rather than a targeted migration pattern to specific areas. These results contrast with previous studies suggesting homing behavior in diadromous fish populations, highlighting the importance of studying population-specific behaviors to understand the ecology of these species.
Furthermore, the European flounder data used for calibration were probably not solely collected during the species’ spawning migration period. Due to limited winter data it was not possible to select winter occurrence only. Additional information on the behavior of both species at sea would help refining the methodology to more accurately identify and highlight marine habitats. It would be possible to construct a model to identify spawning areas by considering only the winter and spring months of a year during the marine phase.
This definition of marine habitats can be adapted to the ecology of other diadromous species. For example, the Atlantic salmon is an anadromous species that lives from 9 to 11 years with several reproduction events during its life cycle, except during their first 2-5 years when they remain in the rivers (McCormick et al., 1998). We could extend our study by investigating recurrence of the highly suitable environments over a decade for this species. In addition, growing areas of this species are known (i.e., Greenland and Norwegian Sea) so it would be possible to refine the projection area for marine habitats. However, salmon migration is of long duration, so characterization of corridors will remain important.
4.3 Allis shad and European flounder marine habitats shifts in response to climate change
At the end of this century, Allis shad and European flounder are predicted to gain new marine habitats north of their current distribution range. These results are consistent with the literature that has shown that marine or marine-affiliated species may move northward in response to climate change (Lassalle et al., 2008; Hastings et al., 2020). Diadromous fish displacements have already been observed, for example, in the eastern United States, American shad have been observed to move their spawning distribution northwards in response to warming waters and striped bass is being caught further north than previously in Newfoundland and Labrador (Hare and Able, 2007; Andrews et al., 2019). In addition, Lassalle and Rochard (2009) demonstrated an expansion of the distribution range of three diadromous species, which gained suitable basins predominantly in a northerly direction.
The Bay of Biscay coastal band would contain most of the current Allis shad marine habitats that would remain suitable in the future, while habitats further offshore would be reduced. The expected reduction in deeper habitat suitability should not have a substantial impact on the species. Indeed, although the Allis shad is able to explore up to 150 m depth in summer, this species is predominantly concentrated in shallow coastal areas (<70 m depth; Taverny and Elie, 2001b) and is mostly found at depths less than 50 m depth according to a previous distribution modeling study (Trancart et al., 2014).
The potential reduction in offshore habitats for Allis shad in the Bay of Biscay in the future can be attributed to warming trend of waters (Table 1). Projections indicate that, by the end of the century (under RCP 8.5), the means temperature for the lost marine habitats in the Bay of Biscay could reach 20.1°C, which is higher than the current period’s average of 15.6°C. This rise in temperature is a critical driver of change and is expected to have cascading effects on various ecological processes. Although primary production is projected to decrease in future scenarios, it would not seem to have a pronounced impact on habitat suitability for Allis shad (Figures S1-D). However, the decline in primary production in interaction with the rising temperature could potentially offer an alternative explanation for this habitat loss.
Our results indicate that, by the end of the century, the marine habitats of European flounder in the English Channel and North Sea are expected to become less suitable. This projected decrease in suitability of European flounder marine habitats in the North Sea and Channel regions is likely to result from increasing water temperatures, as indicated by a comparison of mean temperature values calculated for lost habitats in future projections versus current conditions (Table 2). These analyses reveal a substantial temperature increase of up to 3-4°C at the end of the century, with a projected mean temperature of 16.8°C in marine habitats that will be lost in the North Sea under RCP 8.5, compared to 12.4°C in the current period.
This loss of marine habitats is expected to be primarily caused by rising temperatures. Nonetheless, climate change can also have indirect effects on diadromous species by influencing catchment flows that can impact larval entrance into estuaries and various demographic parameters, such as reproductive rates, recruitment, survival, and growth (Waldman and Quinn, 2022). Of particular concern is the potential mismatch created by warming seas if “external” conditions induce fish to spawn at inappropriate times or affect their offspring (Boisneau et al., 2008). According to Mendes et al. (2020), eggs and larvae are tolerant of a wide range of temperatures and can hatch regardless of temperature, but changes in currents associated with temperature modifications may potentially impede their arrival at the appropriate location.
The findings related to the impact of climate change on marine habitats for the species are quite similar, with either more highly suitable or stable environments in the northern range. However, a comparison of the potential implications of these findings for anadromous versus catadromous species may differ depending on the level of connectivity to the continental phase of their respective life cycles. For Allis shad and European flounder, the use of migratory corridors is critical for accessing high-quality spawning areas and delivering juveniles to those areas for successful recruitment of adult populations (Drouineau et al., 2018). Impeded connectivity poses a significant threat to Allis shad, as it can restrict access to the species’ spawning grounds, hindering their reproduction. This is particularly concerning as Allis shad have a homing behavior to their natal rivers (Baglinière et al., 2003). In contrast, European flounder migrate to the sea for reproduction but spend the majority of their time in fresh waters. Baden et al. (2022) suggest that European flounder exhibits a diverse range of spawning areas, including both brackish and marine waters. This adaptability implies that the species may possess greater flexibility in response to the anticipated northward shift of marine habitats resulting from climate change. In contrast, Allis shad, which has a stronger association with the continent for reproduction, may face greater challenges in accessing suitable spawning areas in the new habitats, potentially exacerbating the already observed decline in abundance of this species. Furthermore, the observed decline in the abundance of Allis shad compared to European flounder (Rougier et al., 2012) may be attributed to its more maladaptive responses to environmental changes.
Finally, one potential avenue for further analysis is to explore the differential impact of changing marine habitats on anadromous and catadromous species, with a particular focus on the importance of connectivity to the continental phase of their life cycles. By examining how reductions in connectivity might affect spawning areas and the delivery of juveniles to these areas, it may be possible to gain a more nuanced understanding of how the changing marine environment is likely to affect recruitment success in adult populations of these species. We anticipate that our method could be applied to other diadromous species worldwide, thereby highlighting new challenges for the sustainability of diadromous species populations and promoting the linkage of marine and continental habitats throughout their life cycle.
Data availability statement
The raw data supporting the conclusions of this article will be made available by the authors, without undue reservation.
Author contributions
DC, PL, GL and JA conceived the research idea. NC participated to the acquisition of data along with DC and JA. NC ran the data analyses and wrote the manuscript. DC, JA, PL and GL participated in discussions on the results and critically reviewed the manuscript. All authors contributed to the article and approved the submitted version.
Funding
This work is part of the FutureMARES (Climate Change and Future Marine Ecosystem Services and Biodiversity) project funded by the European Union’s Horizon 2020 research and innovation program under grant agreement No 869300 and the Atlantic Area Interreg Project DiadES.
Acknowledgments
We would like to thank Ana Queirós and Susan Kay from the Plymouth Marine Laboratory for their support and guidance throughout the environmental data extraction process. We also thank the common unit Management of Diadromous Fish in their Environment OFB-INRAE-Institut Agro- UPPA (Pole MIAME), and especially Sophie Elliott, for generously sharing the MigrenMer database. We are thankful to the reviewers for their relevant comments to improve the paper.
Conflict of interest
The authors declare that the research was conducted in the absence of any commercial or financial relationships that could be construed as a potential conflict of interest.
Publisher’s note
All claims expressed in this article are solely those of the authors and do not necessarily represent those of their affiliated organizations, or those of the publisher, the editors and the reviewers. Any product that may be evaluated in this article, or claim that may be made by its manufacturer, is not guaranteed or endorsed by the publisher.
Supplementary material
The Supplementary Material for this article can be found online at: https://www.frontiersin.org/articles/10.3389/fmars.2023.1241969/full#supplementary-material
References
Allouche O., Tsoar A., Kadmon R. (2006). Assessing the accuracy of species distribution models : Prevalence, kappa and the true skill statistic (TSS): Assessing the accuracy of distribution models. J. Appl. Ecol. 43 (6), 1223−1232. doi: 10.1111/j.1365-2664.2006.01214.x
Andrews S. N., Dadswell M. J., Buhariwalla C. F., Linnansaari T., Curry R. A. (2019). Looking for striped bass in Atlantic Canada : the reconciliation of local, scientific, and historical knowledge. Northeast. Nat. 26 (1), 1. doi: 10.1656/045.026.0105
Arthington A. H., Dulvy N. K., Gladstone W., Winfield I. J. (2016). Fish conservation in freshwater and marine realms : Status, threats and management: Fish Conservation in Freshwater and Marine Realms. Aquat. Conserv.: Mar. Freshw. Ecosyst. 26 (5), 838−857. doi: 10.1002/aqc.2712
Baden C., Christoffersen M., Flávio H., Brown E., Aarestrup K., Svendsen J. C. (2022). Using acoustic telemetry to locate flatfish spawning areas : Estuarine migrations of turbot Scophthalmus maximus and European flounder Platichthys flesus. J. Sea Res. 183, 102187. doi: 10.1016/j.seares.2022.102187
Baglinière J.-L., Sabatié M. R., Rochard E., Alexandrino P., Aprahamian M. W. (2003). The allis shad alosa alosa : biology, ecology, range, and status of populations. In Am. Fish. Soc. Symp. 35, 85−102.
Boisneau C., Moatar F., Bodin M., Boisneau Ph. (2008). Does global warming impact on migration patterns and recruitment of Allis shad (Alosa L.) young of the year in the Loire River, France? Hydrobiologia 602 (1), 179−186. doi: 10.1007/s10750-008-9291-6
Bradie J., Leung B. (2017). A quantitative synthesis of the importance of variables used in MaxEnt species distribution models. J. Biogeogr. 44 (6), 1344−1361. doi: 10.1111/jbi.12894
Brook B., Sodhi N., Bradshaw C. (2008). Synergies among extinction drivers under global change. Trends Ecol. Evol. 23 (8), 453−460. doi: 10.1016/j.tree.2008.03.011
Butenschön M., Clark J., Aldridge J. N., Allen J. I., Artioli Y., Blackford J., et al. (2016). ERSEM 15.06 : A generic model for marine biogeochemistry and the ecosystem dynamics of the lower trophic levels. Geosci. Model. Dev. 9 (4), 1293−1339. doi: 10.5194/gmd-9-1293-2016
Cabral H. N., Vasconcelos R., Vinagre C., França S., Fonseca V., Maia A., et al. (2007). Relative importance of estuarine flatfish nurseries along the Portuguese coast. J. Sea Res. 57 (2−3), 209−217. doi: 10.1016/j.seares.2006.08.007
Caldwell I. R., Gergel S. E. (2013). Thresholds in seascape connectivity : Influence of mobility, habitat distribution, and current strength on fish movement. Landscape Ecol. 28 (10), 1937−1948. doi: 10.1007/s10980-013-9930-9
Campos W. L., Kloppmann M., von Westernhagen H. (1994). Inferences from the horizontal distribution of dab Limanda limanda (L.) and flounder Platichthys flesus (L.) larvae in the southeastern North Sea. Netherlands J. Sea Res. 32 (3−4), 277−286. doi: 10.1016/0077-7579(94)90005-1
Costa-Dias S., Lobón-Cerviá J., Laffaille P. (2009). “The decline of diadromous fish in Western Europe inland waters : Mains causes and consequence.” in Fisheries: Management, economics and perspectives, vol. 67−92 . Eds. McManus N. F., Bellinghouse D. S. (New York: Nova Science Publishers).
Dambrine C., Woillez M., Huret M., de Pontual H. (2021). Characterizing Essential Fish Habitat using spatio-temporal analysis of fishery data : A case study of the European seabass spawning areas. Fish. Oceanogr. 30 (4), 413−428. doi: 10.1111/fog.12527
De Groot S. J. (2002). A review of the past and present status of anadromous fish species in the Netherlands : Is restocking the Rhine feasible? Ecol. Restor. Aquat. Semi-Aquatic Ecosyst. Netherlands (NW Europe) 166, 205−218. doi: 10.1007/978-94-017-1335-1_11
Dell J., Wilcox C., Hobday A. J. (2011). Estimation of yellowfin tuna (Thunnus albacares) habitat in waters adjacent to Australia’s East Coast : Making the most of commercial catch data : Yellowfin habitat derived from catch data. Fish. Oceanogr. 20 (5), 383−396. doi: 10.1111/j.1365-2419.2011.00591.x
Di Marco M., Watson J. E. M., Possingham H. P., Venter O. (2017). Limitations and trade-offs in the use of species distribution maps for protected area planning. J. Appl. Ecol. 54 (2), 402−411. doi: 10.1111/1365-2664.12771
Dormann C. F., Elith J., Bacher S., Buchmann C., Carl G., Carré G., et al. (2013). Collinearity : A review of methods to deal with it and a simulation study evaluating their performance. Ecography 36 (1), 27−46. doi: 10.1111/j.1600-0587.2012.07348.x
Drouineau H., Carter C., Rambonilaza M., Beaufaron G., Bouleau G., Gassiat A., et al. (2018). River continuity restoration and diadromous fishes : much more than an ecological issue. Environ. Manage. 61 (4), 671−686. doi: 10.1007/s00267-017-0992-3
Elith J., Ferrier S., Huettmann F., Leathwick J. (2005). The evaluation strip : A new and robust method for plotting predicted responses from species distribution models. Ecol. Model. 186 (3), 280−289. doi: 10.1016/j.ecolmodel.2004.12.007
Elith J., Graham C. H., Anderson R. P., Dudík M., Ferrier S., Guisan A., et al. (2006). Novel methods improve prediction of species’ distributions from occurrence data. Ecography 29 (2), 129−151. doi: 10.1111/j.2006.0906-7590.04596.x
Elliott S. A. M., Acou A., Beaulaton L., Guitton J., Réveillac E., Rivot E. (2023). Modeling the distribution of rare and data-poor diadromous fish at sea for protected area management. Prog. Oceanogr. 210, 102924. doi: 10.1016/j.pocean.2022.102924
Elliott S. A. M., Deleys N., Rivot E., Acou A., Réveillac E., Beaulaton L. (2021). Shedding light on the river and sea lamprey in western European marine waters. Endangered Species Res. 44, 409−419. doi: 10.3354/esr01113
Elliott M., Whitfield A. K., Potter I. C., Blaber S. J. M., Cyrus D. P., Nordlie F. G., et al. (2007). The guild approach to categorizing estuarine fish assemblages : A global review. Fish Fish. 8 (3), 241−268. doi: 10.1111/j.1467-2679.2007.00253.x
Guisan A., Thuiller W., Zimmermann N. E. (2017). Habitat Suitability and Distribution Models : With Applications in R (Cambridge University Press). doi: 10.1017/9781139028271
Guisan A., Zimmermann N. E. (2000). Predictive habitat distribution models in ecology. Ecol. Model. 135 (2−3), 147−186. doi: 10.1016/S0304-3800(00)00354-9
Hao T., Elith J., Guillera-Arroita G., Lahoz-Monfort J. J. (2019). A review of evidence about use and performance of species distribution modeling ensembles like BIOMOD. Diversity Distrib. 25 (5), 839−852. doi: 10.1111/ddi.12892
Hare J. A., Able K. W. (2007). Mechanistic links between climate and fisheries along the east coast of the United States : Explaining population outbursts of Atlantic croaker (Micropogonias undulatus). Fish. Oceanogr. 16 (1), 31−45. doi: 10.1111/j.1365-2419.2006.00407.x
Hastings R. A., Rutterford L. A., Freer J. J., Collins R. A., Simpson S. D., Genner M. J. (2020). Climate change drives poleward increases and equatorward declines in marine species. Curr. Biol. 30 (8), 1572–1577.e2. doi: 10.1016/j.cub.2020.02.043
Hemmer-Hansen J., Nielsen E. E., Grønkjaer P., Loeschcke V. (2007). Evolutionary mechanisms shaping the genetic population structure of marine fishes; lessons from the European flounder (Platichthys flesus L.). Mol. Ecol. 16 (15), 3104−3118. doi: 10.1111/j.1365-294X.2007.03367.x
Holt J. T., James I. D. (2001). An s coordinate density evolving model of the northwest European continental shelf : 1. Model description and density structure. J. Geophys. Res.: Oceans 106 (C7), 14015−14034. doi: 10.1029/2000JC000304
Jimenez-Valverde A., Lobo J. M. (2006). The ghost of unbalanced species distribution data in geographical model predictions. Diversity Distrib. 12 (5), 521−524. doi: 10.1111/j.1366-9516.2006.00267.x
Lassalle G., Béguer M., Beaulaton L., Rochard E. (2008). Diadromous fish conservation plans need to consider global warming issues : An approach using biogeographical models. Biol. Conserv. 141 (4), 1105−1118. doi: 10.1016/j.biocon.2008.02.010
Lassalle G., Rochard E. (2009). Impact of twenty-first century climate change on diadromous fish spread over Europe, North Africa and the Middle East. Global Change Biol. 15 (5), 1072−1089. doi: 10.1111/j.1365-2486.2008.01794.x
Legrand M., Briand C., Buisson L., Besse T., Artur G., Azam D., et al. (2021). Diadromous fish modified timing of upstream migration over the last 30 years in France. Freshw. Biol. 66 (2), 286−302. doi: 10.1111/fwb.13638
Le Pichon C., Trancart T., Lambert P., Daverat F., Rochard E. (2014). Summer habitat use and movements of late juvenile European flounder (Platichthys flesus) in tidal freshwaters : Results from an acoustic telemetry study. J. Exp. Mar. Biol. Ecol. 461, 441−448. doi: 10.1016/j.jembe.2014.09.015
Limburg K. E., Waldman J. R. (2009). Dramatic declines in North Atlantic diadromous fishes. BioScience 59 (11), 955−965. doi: 10.1525/bio.2009.59.11.7
Liu C., Berry P. M., Dawson T. P., Pearson R. G. (2005). Selecting thresholds of occurrence in the prediction of species distributions. Ecography 28 (3), 385−393. doi: 10.1111/j.0906-7590.2005.03957.x
Maes J., Stevens M., Breine J. (2007). Modeling the migration opportunities of diadromous fish species along a gradient of dissolved oxygen concentration in a European tidal watershed. Estuarine Coast. Shelf Sci. 75 (1−2), 151−162. doi: 10.1016/j.ecss.2007.03.036
McCormick S. D., Hansen L. P., Quinn T. P., Saunders R. L. (1998). Movement, migration, and smolting of Atlantic salmon (Salmo salar). Can. J. Fish. Aquat. Sci. 55 (S1), 77−92. doi: 10.1139/d98-011
McDowall R. M. (1988). Diadromy in fishes : Migrations between freshwater and marine environments. (Croom Helm).
Meinshausen M., Smith S. J., Calvin K., Daniel J. S., Kainuma M. L. T., Lamarque J.-F., et al. (2011). The RCP greenhouse gas concentrations and their extensions from 1765 to 2300. Climatic Change 109 (1−2), 213−241. doi: 10.1007/s10584-011-0156-z
Melo-Merino S. M., Reyes-Bonilla H., Lira-Noriega A. (2020). Ecological niche models and species distribution models in marine environments : A literature review and spatial analysis of evidence. Ecol. Model. 415, 108837. doi: 10.1016/j.ecolmodel.2019.108837
Mendes C., Ramos S., Elliott M., Bordalo A. A. (2020). Feeding strategies and body condition of juvenile European flounder Platichthys flesus in a nursery habitat. J. Mar. Biol. Assoc. United Kingdom 100 (5), 795−806. doi: 10.1017/S0025315420000600
Mota M., Rochard E., Antunes C. (2016). Status of the diadromous fish of the iberian peninsula : past, present and trends. Limnetica 35 (1), 1−18. doi: 10.23818/limn.35.01
Moustakas A., Silvert W., Dimitromanolakis A. (2006). A spatially explicit learning model of migratory fish and fishers for evaluating closed areas. Ecol. Model. 192 (1−2), 245−258. doi: 10.1016/j.ecolmodel.2005.07.007
Muscatello A., Elith J., Kujala H. (2021). How decisions about fitting species distribution models affect conservation outcomes. Conserv. Biol. 35 (4), 1309−1320. doi: 10.1111/cobi.13669
Nachón D. J., Bareille G., Drouineau H., Tabouret H., Taverny C., Boisneau C., et al. (2020). 1980s population-specific compositions of two related anadromous shad species during the oceanic phase determined by microchemistry of archived otoliths. Can. J. Fish. Aquat. Sci. 77 (1), 164−176. doi: 10.1139/cjfas-2018-0444
Nachón D. J., Mota M., Antunes C., Servia M. J., Cobo F. (2016). Marine and continental distribution and dynamic of the early spawning migration of twaite shad (Alosa fallax (Lacépède 1803)) and allis shad (Alosa alosa (Linnaeus 1758)) in the north-west of the Iberian Peninsula. Mar. Freshw. Res. 67 (8), 1229. doi: 10.1071/MF14243
Nykjær L., Van Camp L. (1994). Seasonal and interannual variability of coastal upwelling along northwest Africa and Portugal from 1981 to 1991. J. Geophys. Res. 99 (C7), 14197. doi: 10.1029/94JC00814
Parra J. L., Graham C. C., Freile J. F. (2004). Evaluating alternative data sets for ecological niche models of birds in the Andes. Ecography 27 (3), 350−360. doi: 10.1111/j.0906-7590.2004.03822.x
Pédron N., Le Du J., Charrier G., Zambonino-Infante J.-L., Le Bayon N., Vasconcelos R. P., et al. (2017). Contrasting patterns of energy metabolism in northern vs southern peripheral European flounder populations exposed to temperature rising and hypoxia. Mar. Environ. Res. 129, 258−267. doi: 10.1016/j.marenvres.2017.06.010
Potter I. C., Tweedley J. R., Elliott M., Whitfield A. K. (2015). The ways in which fish use estuaries : A refinement and expansion of the guild approach. Fish Fish. 16 (2), 230−239. doi: 10.1111/faf.12050
Poulet C., Barber-O’Malley B. L., Lassalle G., Lambert P. (2022). Quantification of land–sea nutrient fluxes supplied by allis shad across the species’ range. Can. J. Fish. Aquat. Sci. 79 (3), 395−409. doi: 10.1139/cjfas-2021-0012
Ramos S., Ré P., Bordalo A. A. (2010). Recruitment of flatfish species to an estuarine nursery habitat (Lima estuary, NW Iberian Peninsula). J. Sea Res. 64 (4), 473−486. doi: 10.1016/j.seares.2010.01.010
Roberts D. R., Bahn V., Ciuti S., Boyce M. S., Elith J., Guillera-Arroita G., et al. (2017). Cross-validation strategies for data with temporal, spatial, hierarchical, or phylogenetic structure. Ecography 40 (8), 913−929. doi: 10.1111/ecog.02881
Robinson N. M., Nelson W. A., Costello M. J., Sutherland J. E., Lundquist C. J. (2017). A systematic review of marine-based species distribution models (SDMs) with recommendations for best practice. Front. Mar. Sci. 4. doi: 10.3389/fmars.2017.00421
Rougier T., Lambert P., Drouineau H., Girardin M., Castelnaud G., Carry L., et al. (2012). Collapse of allis shad, Alosa alosa, in the Gironde system (southwest France) : Environmental change, fishing mortality, or Allee effect? ICES J. Mar. Sci. 69 (10), 1802−1811. doi: 10.1093/icesjms/fss149
Sguotti C., Otto S. A., Cormon X., Werner K. M., Deyle E., Sugihara G., et al. (2020). Non-linearity in stock–recruitment relationships of Atlantic cod : Insights from a multi-model approach. ICES J. Mar. Sci. 77, 1492−1502. doi: 10.1093/icesjms/fsz113
Skerritt D. J. (2010). A review of the European flounder Platichthys flesus. – biology, life history and trends in population. Eastern Sea Fisheries Joint Committee Report. Newcastle University, p. 13.
Sugihara G., May R., Ye H., Hsieh C., Deyle E., Fogarty M., et al. (2012). Detecting causality in complex ecosystems. Science 338 (6106), 496−500. doi: 10.1126/science.1227079
Sugihara G., Park J., Deyle E., Saberski E., Smith C., Ye H. (2020). REDM: an R package for empirical dynamic modeling and convergent cross mapping 21.
Summers R. W. (1979). Life cycle and population ecology of the flounder Platichthys flesus (L.) in the Ythan estuary, Scotland. J. Natural History 13 (6), 703−723. doi: 10.1080/00222937900770531
Summers R. W. (1980). The diet and feeding behavior of the flounder Platichthys flesus (L.) in the Ythan estuary, Aberdeenshire, Scotland. Estuar. Coast. Mar. Sci. 11 (2), 217−232. doi: 10.1016/S0302-3524(80)80042-9
Tamario C., Sunde J., Petersson E., Tibblin P., Forsman A. (2019). Ecological and evolutionary consequences of environmental change and management actions for migrating fish. Front. Ecol. Evol. 7. doi: 10.3389/fevo.2019.00271
Taverny C., Elie P. (2001a). Régime alimentaire de la grande alose Alosa alosa (Linné, 1766) et de l’alose feinte Alosa fallax (Lacépède 1803) dans le Golfe de Gascogne. Bull. Français la Pêche la Piscicult. 362−363, 837−852. doi: 10.1051/kmae:2001022
Taverny C., Elie P. (2001b). Répartition spatio-temporelle de la grande alose Alosa alosa(Linné, 1766) et de l’alose feinte Alosa fallax (Lacépède 1803) dans le Golfe de Gascogne. Bull. Français la Pêche la Piscicult. 362−363, 803−821. doi: 10.1051/kmae:2001020
Terui A., Miyazaki Y. (2017). Combined effects of immigration potential and habitat quality on diadromous fishes. Limnology 18 (1), 121−129. doi: 10.1007/s10201-016-0495-6
Thorrold S. R., Latkoczy C., Swart P. K., Jones C. M. (2001). Natal homing in a marine fish metapopulation. Science 291 (5502), 297−299. doi: 10.1126/science.291.5502.297
Thuiller W., Lafourcade B., Engler R., Araújo M. B. (2009). BIOMOD - a platform for ensemble forecasting of species distributions. Ecography 32 (3), 369−373. doi: 10.1111/j.1600-0587.2008.05742.x
Trancart T., Rochette S., Acou A., Lasne E., Feunteun E. (2014). Modeling marine shad distribution using data from French bycatch fishery surveys. Mar. Ecol. Prog. Ser. 511, 181−192. doi: 10.3354/meps10907
Valdimarsson H., Astthorsson O. S., Palsson J. (2012). Hydrographic variability in Icelandic waters during recent decades and related changes in distribution of some fish species. ICES J. Mar. Sci. 69 (5), 816−825. doi: 10.1093/icesjms/fss027
Velazco S. J. E., Ribeiro B. R., Laureto L. M. O., De Marco Júnior P. (2020). Overprediction of species distribution models in conservation planning : A still neglected issue with strong effects. Biol. Conserv. 252, 108822. doi: 10.1016/j.biocon.2020.108822
Verhelst P., Reubens J., Buysse D., Goethals P., Van Wichelen J., Moens T. (2021). Toward a roadmap for diadromous fish conservation : The Big Five considerations. Front. Ecol. Environ. 19 (7), 396−403. doi: 10.1002/fee.2361
Waldman J. R., Quinn T. P. (2022). North American diadromous fishes : Drivers of decline and potential for recovery in the Anthropocene. Sci. Adv. 8 (4), eabl5486. doi: 10.1126/sciadv.abl5486
Keywords: climate change, functional habitats, life at sea, species distribution models, Allis shad, European flounder, Northeast Atlantic
Citation: Navarro C, Janc A, Lassalle G, Lambert P and Dambrine C (2023) From the modeling of diadromous species’ marine distributions to the characterization of their current and future marine habitats. Front. Mar. Sci. 10:1241969. doi: 10.3389/fmars.2023.1241969
Received: 18 June 2023; Accepted: 05 September 2023;
Published: 25 September 2023.
Edited by:
Nova Mieszkowska, University of Liverpool, United KingdomReviewed by:
Harry Gorfine, Victorian Fisheries Authority, AustraliaMatteo Zucchetta, National Research Council (CNR), Italy
Copyright © 2023 Navarro, Janc, Lassalle, Lambert and Dambrine. This is an open-access article distributed under the terms of the Creative Commons Attribution License (CC BY). The use, distribution or reproduction in other forums is permitted, provided the original author(s) and the copyright owner(s) are credited and that the original publication in this journal is cited, in accordance with accepted academic practice. No use, distribution or reproduction is permitted which does not comply with these terms.
*Correspondence: Clara Navarro, Y2xhcmFfbmF2YXJyb0BpY2xvdWQuY29t