 Lin Deng
 Shuibo Hu
 Siyu Chen1
 Xiyuan Zeng
- 1School of Marine Sciences, Sun Yat-sen University, Zhuhai, Guangdong, China
- 2Southern Marine Science and Engineering Guangdong Laboratory (Zhuhai), Zhuhai, Guangdong, China
- 3Guangdong Provincial Key Laboratory of Marine Resources and Coastal Engineering, Guangzhou, Guangdong, China
- 4Pearl River Estuary Marine Ecosystem Research Station, Ministry of Education, Zhuhai, China
- 5Ministry of Natural Resources (MNR) Key Laboratory for Geo-Environmental Monitoring of Great Bay Area & Guangdong Key Laboratory of Urban Informatics & Guangdong–Hong Kong-Macau Joint Laboratory for Smart Cities & Shenzhen Key Laboratory of Spatial Smart Sensing and Services, Shenzhen University, Shenzhen, China
- 6Navigation College, Dalian Maritime University, Dalian, China
- 7State Key Laboratory of Tropical Oceanography (LTO), South China Sea Institute of Oceanology, Chinese Academy of Sciences, Guangzhou, China
The vertical distribution of suspended particulate matter (SPM) in the Pearl River Estuary (PRE) during winter has not been widely reported. The aim of this paper is to describe the high-resolution vertical distribution of SPM along the transect based on the in-situ observations (including SPM, attenuation coefficient, and particle backscattering coefficient) from three transects of the winter cruise in the northern South China Sea in 2020. The empirical relationship between SPM and bio-optical parameters with correlation coefficients greater than 0.7 is also established and combined with model data to further discuss the mechanism of river discharge and seawater intrusion effects on the vertical distribution of SPM. In the horizontal distribution, the mass concentration of SPM was high in the nearshore region and was low in the offshore region. In the vertical direction, the mass concentration of SPM in the offshore region was more homogeneous, while the mass concentration of SPM in the nearshore region varied greatly, showing a pattern of high bottom and middle layer or high bottom and surface layer. The difference in the vertical distribution of SPM in the nearshore area is the combined effect of river discharge and seawater intrusion on the resuspension of sediment and the inhibition of the spread of high SPM.
1 Introduction
Suspended particulate matter (SPM) plays a significant role as an ecological parameter in coastal waters, providing valuable insights into the water quality status of these areas. Coastal waters are characterized by relatively high concentrations of SPM, primarily influenced by inputs from land-based rivers and the resuspension of sediments. The presence of SPM in coastal waters exhibits pronounced vertical dynamics, resulting from the interactions between seawater and freshwater. These elevated SPM concentrations can have substantial impacts on the distribution of the sub-surface light field, water quality, and the occurrence of phytoplankton blooms (Cloern, 1987; Mayer et al., 1998; Miller and McKee, 2004; Burford et al., 2012). Consequently, accurate understanding of the abundance, distribution, and composition of particles is crucial for comprehending how ecosystems respond to environmental changes and anthropogenic disturbances in estuarine-coastal waters (Ni et al., 2008).
The measurement of SPM concentration in the field involves both direct and indirect methods. The direct method, widely used for in-situ determination of SPM concentration in water, relies on gravimetric measurements of filters before and after filtration in discrete samples (Wren et al., 2000). However, the collection of particles in discrete samples can introduce biases in the interpretation of results due to an incomplete representation of the particle field. Besides of the direct method, long-term and high frequency data series of SPM can also be measured indirectly using optical and acoustical sensors. Among these techniques, optical methods are more practical, cost-effective, and amenable to fast, continuous, and vertical estimation of SPM concentration (Davies-Colley et al., 2014). The basis for relating optical properties to SPM is that inherent optical properties (IOPs) such as beam attenuation coefficient (cp(λ)), particle backscatter coefficient (bbp(λ)) and absorption coefficient vary with particle concentration in water and are related to the size, shape, internal structure and packing of the particles in water (Boss et al., 2015). The single optical properties, such as cp(λ) (Bishop and Wood, 2008; Hill et al., 2011; Neukermans et al., 2012) and bbp(λ) (Boss, Taylor et al., 2009; Cetinić et al., 2012), have been used as a common proxy in relation to the SPM concentration. In addition, combinations of multiple optical properties have also been investigated, for example, the backscattering ratio (the ratio of particulate backscattering to total scattering) and the cp(λ), which have been observed in relation to SPM in previous studies (Loisel et al., 2007; Boss, Taylor et al., 2009; Slade et al., 2011). Although SPM algorithms have been applied to study the spatial-temporal variation of SPM concentration in oceans and estuaries worldwide, developing a common IOPs-based method applicable to different coastal regions remains a challenge. Therefore, it is still an important scientific task to improve the understanding of the relationship between IOPs and the biogeochemical, physical, and morphological properties characterizing SPM populations.
The vertical distribution and control mechanisms of SPM have been extensively studied in estuaries worldwide. In the Severn Estuary, flocculation has a significant influence on the behaviour of SPM, increasing their potential through the addition of sticky organic matter and influencing their transport throughout the estuary (Manning et al., 2010). In the Yangtze estuary, the surface sedimentary organic matter that constitutes the bulk of SPM is mainly derived from the rapid deposition of large amounts of sediment transported by the Yangtze, with minor contributions from swamp vegetation (Zhou et al., 2007). Salinity influences the vertical distribution and trapping of SPM, with the pycnocline controlling the vertical distribution of SPM in the Rotterdam waterway and the Maasmond area (de Nijs and Pietrzak, 2012). The pearl river is the largest river system flowing into the South China Sea (SCS) which carries nearly 3.13 * 1011 m3 of fresh water rushing to the Pearl River Estuary (PRE) annually (Dai et al., 2008). The PRE is located at the junction of fresh and marine water, river plumes play an important role in the cross-margin transport of particles and nutrients. During the summer season, the prevailing southwesterly monsoon leads to strong coastal upwelling in the northern SCS. The associated offshore Ekman transport and northeastward boundary current drive the eastward movement of the plume. The large inputs of SPM from coastal upwelling and the river plume result in a highly stratified particle distribution during the wet summer season. In contrast, during the winter, weak river discharge and seawater intrusion dominate the hydrography and the PRE is partially mixed or vertically well mixed. Most of the current studies on SPM around the PRE focus on its spatiotemporal variation and its driving factors in the wet seasons (Li et al., 2019), based on the analysis of model simulation (Lin et al., 2019), surface remote sensing’s SPM concentration (Cai et al., 2022), and low depth resolution of in-situ discrete water samples (Huang et al., 2020). The satellite study showed that SPM concentrations ranged from 3.37 g m-3 to 469.5 g m-3 in the Pearl River estuary (Wang et al., 2018). However, closely related to the interaction between rivers and seawater, there are clear differences in the vertical and spatial distribution of SPM in the dry and wet seasons. In winter, high SPM occurs throughout the water column due to well mixing. In summer, high SPM is confined to the bottom water due to stronger stratification. In addition, higher river discharge in the wet season would likely deliver more coarse sediment, whereas weaker flows in the dry season would preferentially deposit coarser material, leaving fine material in suspension. Thus, the higher salinity and SPM during this period would promote flocculation/aggregation to form larger, more readily suspended particle assemblages of these fine-grained particles (Liu et al., 2016). However, the vertical distribution of SPM and its response to seawater intrusion and freshwater discharge in the PRE during the dry winter season have not been extensively investigated.
Thus, in this paper, based on the field observations and the simulation results of the hydrological model, we aim to establish an empirical and practicable method to display the horizontal and vertical distribution of SPM in winter, and we further discuss the influence mechanism. The paper is arranged as follows: in situ measurements and SPM retrieval methods are detailed in section 2. Results and discussion about the vertical SPM distribution and its driving factors are presented in sections 3 and sections 4, respectively. Finally, conclusions about this study are described in section 5.
2 Data and method
2.1 Study region
The PRE is a typical subtropical estuary located in the continental shelf of the northern South China Sea (NSCS). It discharges into the NSCS through eight outlets with approximately 20% of the total flow occurring in dry season (October to March), which is around 3600 m3/s (Zhang et al., 2008; Li et al., 2023). In order to investigate the temporal and spatial distribution characteristics of SPM in winter, optical and ecological environmental field measurements were conducted with three transects across the PRE in January 2020. The three transects, namely A, B and C, were located in the Lingdingyang Estuary, Daya Bay and Huangmao Sea Estuary respectively (Figure 1).
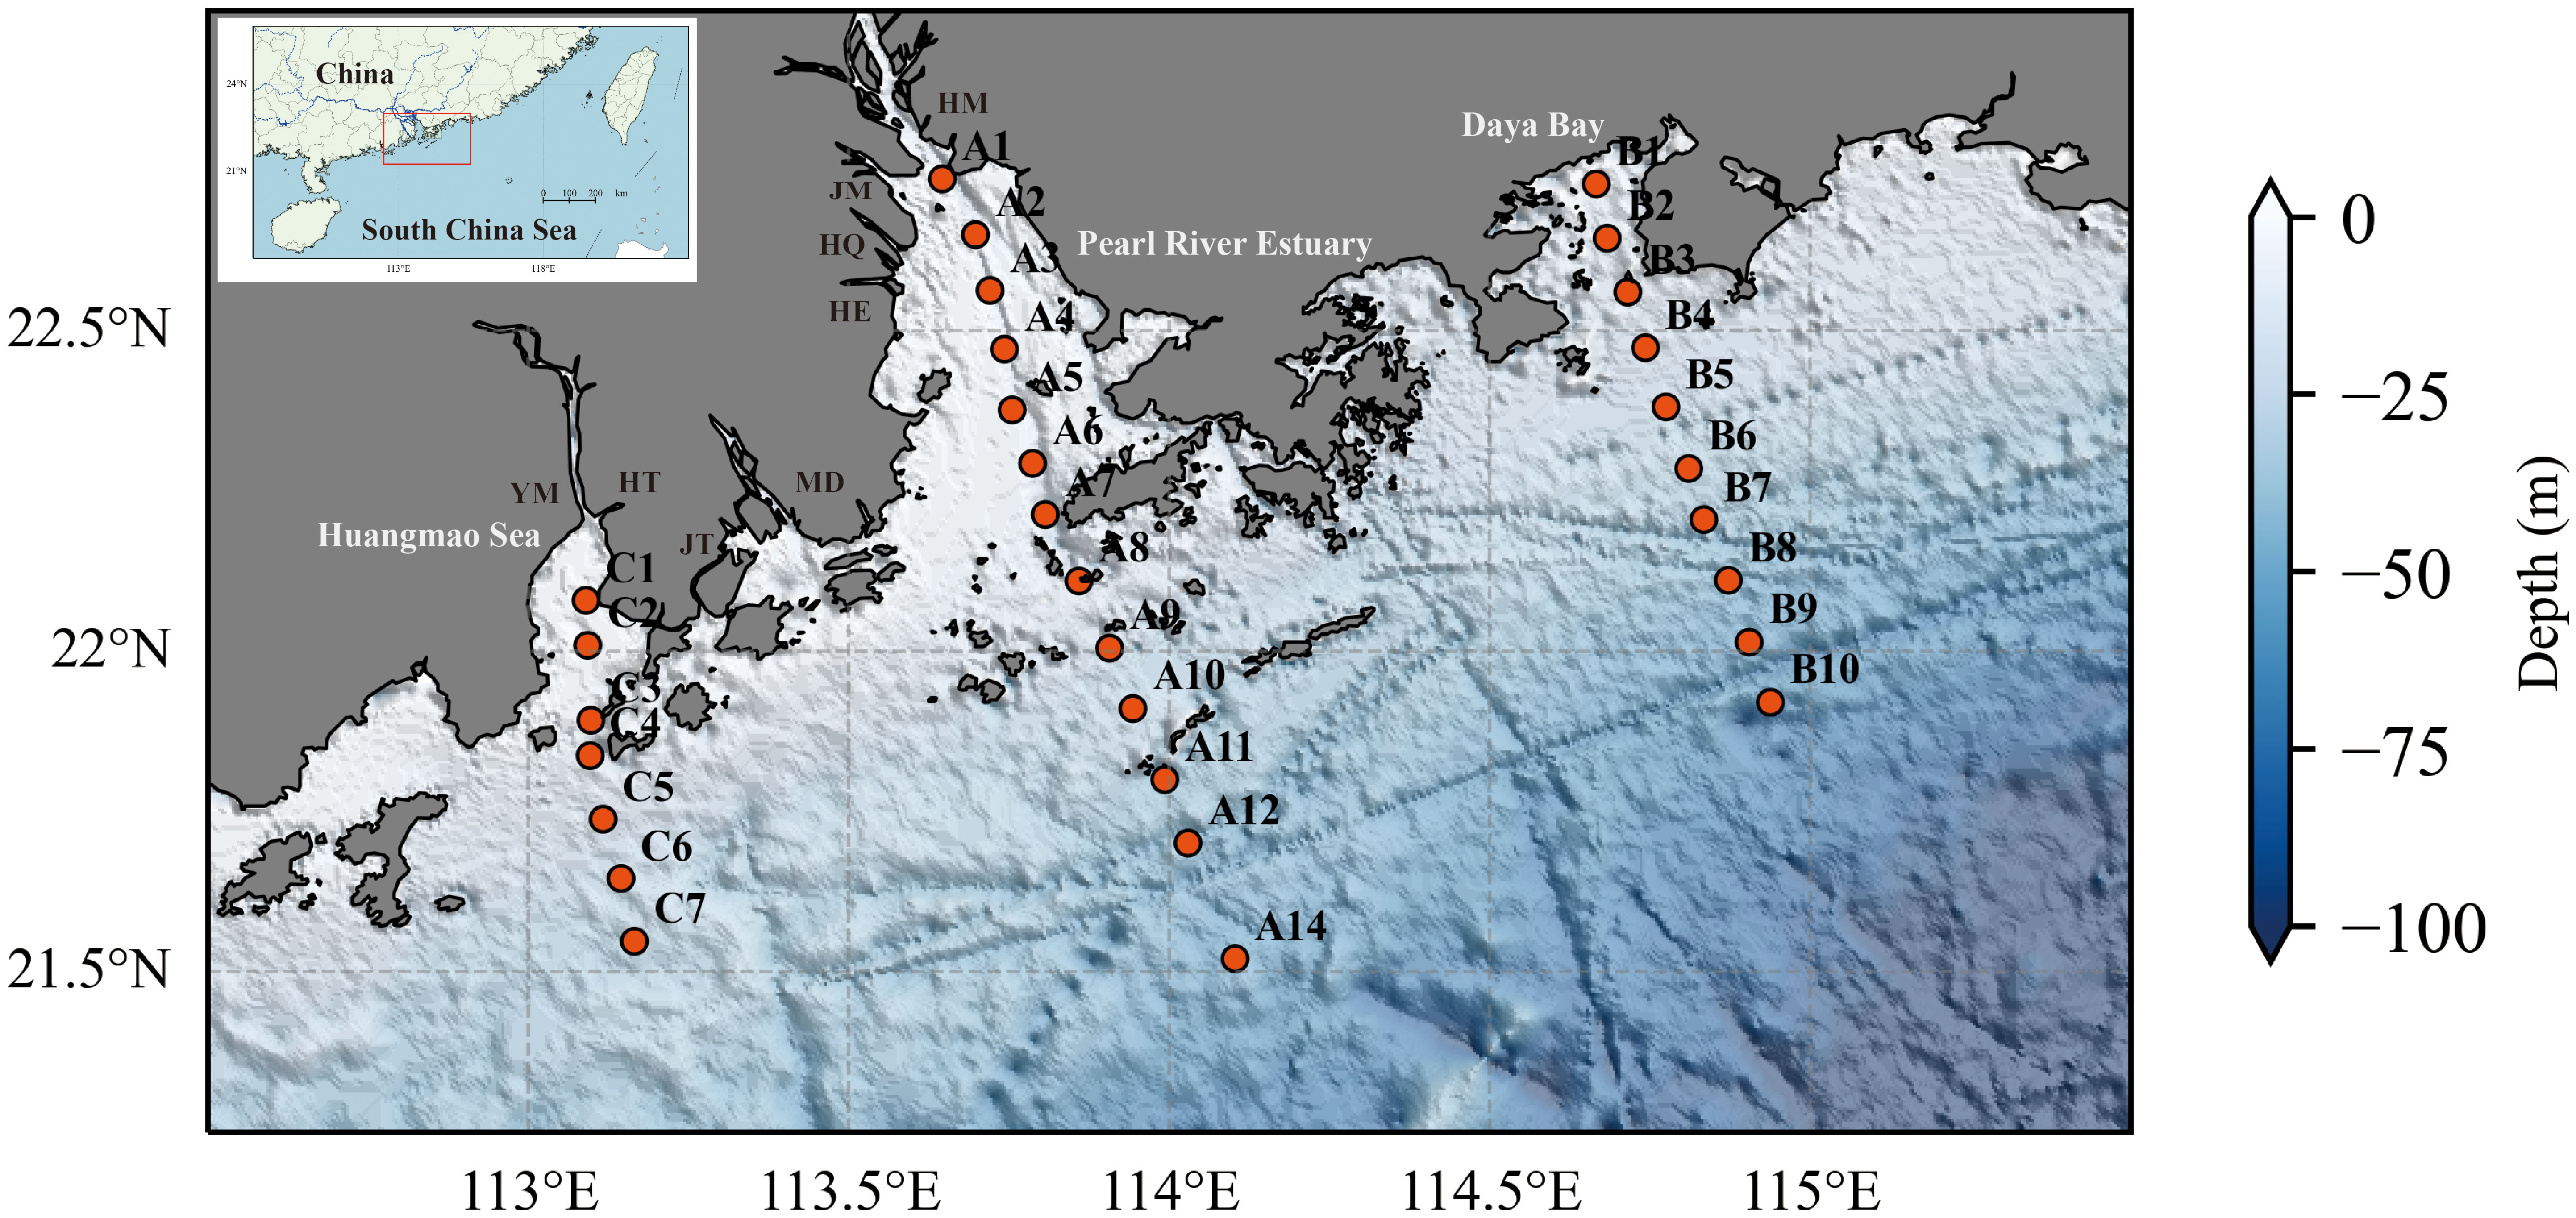
Figure 1 Schematic showing the geographical locality of the Pearl River Estuary in China and map of the general study area and sampling stations (Orange circle). The eight major runoff outlets are labeled as HM (Humen), JM (Jiaomen), HQ (Honqilimen), HE (Heng- men), MD (Modaomen), JT (Jitimen), HT (Hutiaomen), and YM (Yamen).
2.2 Suspended particle matter measurements
Prior to the cruise, 47 mm diameter Whatman GF/F filters with 0.7 μm pore size were first burned at 450°C for 4.5 h to remove organic matter and washed with 0.5 L of Milli-Q water. The GF/F filters were then dried at 60°C for 24 h and preweighed on a balance to an accuracy of 0.01 g. At each station, the discrete seawater samples in water column (0m, 5m, 10m, 15m, and 20m) were collected using Niskin bottles mounted on the CTD. Seawater volumes of 0.5-1L, depending on the particle content of the samples, were filtered at low vacuum on GF/F filters. At the end of this procedure, approximately 250 mL of Milli-Q water was used to wash the filters to remove salt. The filters were then stored in liquid nitrogen at -80°C prior to analysis. In the land laboratory, the filters were dried at 60°C for 24 hours before being weighted. The SPM were determined gravimetrically from the differences in the weight of each filter before and after seawater filtration. The differences in the weight before and after combustion gave POM, and PIM was calculated as the difference between SPM and POM. The histogram and the statistics of the in-situ SPM data are shown in Figure 2A and Table 1. The range of in-situ SPM in our study is from 4.28 to 50.20 g m-3. The probability density function (PDF) of SPM indicates that most of the SPM is concentrated between 10 and 25 g m-3 with a mean value of 20.62 g m-3 and a median value of 18.13 g m-3. The SPM of different transects are significantly different, and the SPM of transects A and B have similar characteristics with mean values of 19.55 and 16.25, respectively, while the mean SPM of transect C is 33.52 g m-3 which is higher than that of transects A and and B. In addition, the composition of SPIM is always higher than that of SPOM in the in-situ measurement of SPM (Figure 2E).
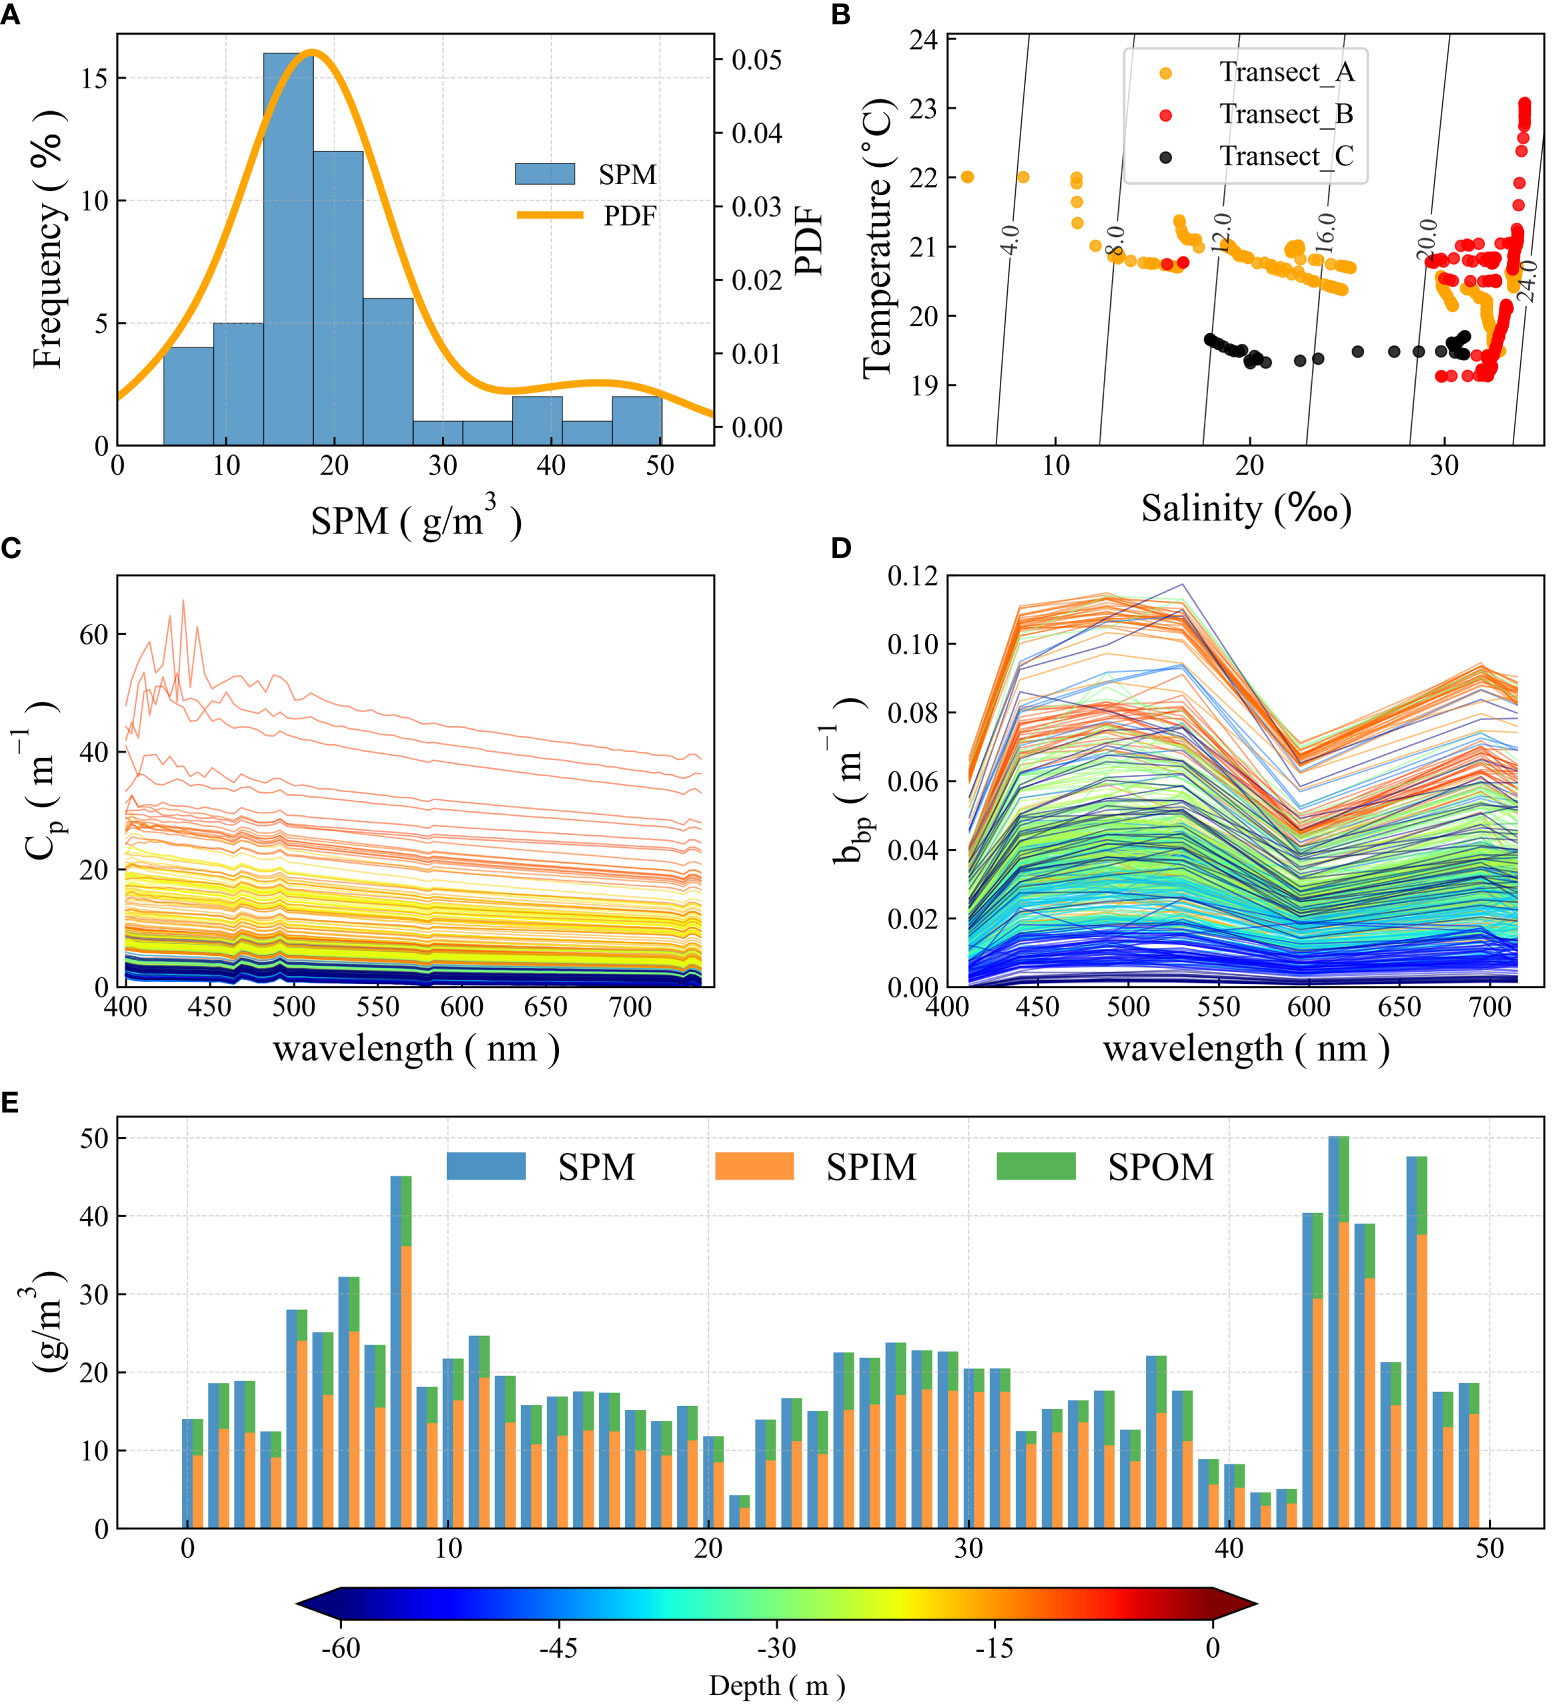
Figure 2 Histogram of SPM and its probability density function line (Yellow) (A); Temperature-salinity diagram of three transects (yellow, red, and black point represents the transect A, transect B, transect C for thePRE, the Daya bay, and the Huangmao Sea, respectively) (B); Spectrum of Cp,and the colors represent the depths (C); Spectrum of bp, and the colors represent the depths (D); Concentration of in-situ measurements of SPIM and SPOM (E).
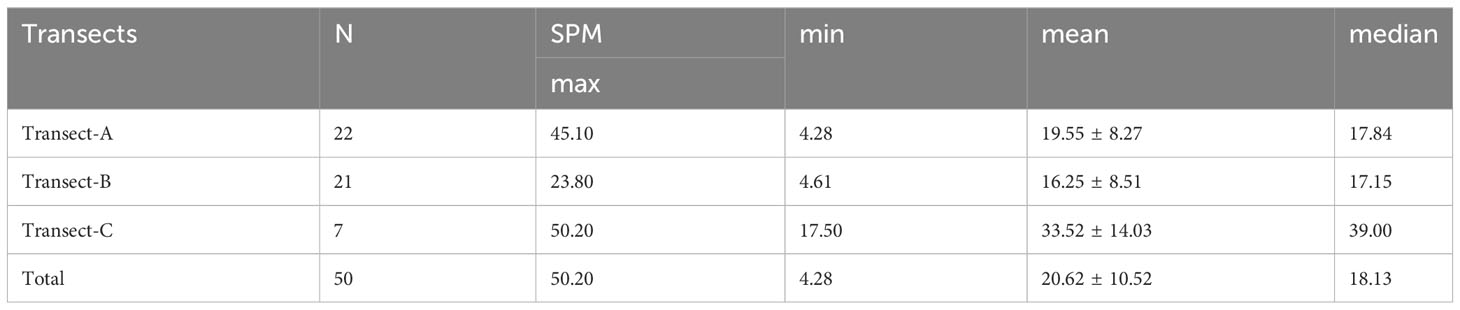
Table 1 Statistic of in-situ measurement of SPM.
2.3 Optical properties measurements
At each station, an optical profiling system was deployed from the surface to the bottom across the whole water column. The optical profiling system was formed using an AC-S spectral absorption and attenuation meter (WET Labs, Philomath, OR, USA), a BB9 backscattering instrument (WET Labs, USA), and SBE37 CTD profiler (Sea-Bird Electronics, Bellevue,WA, USA). The AC-S was equipped with a Sea Bird pump with a coarse mesh steel filter head to isolate large particles matter and pumping the water into the reflection and absorption tube. For the absorption and attenuation coefficients of the constituents in seawater, the raw data were first corrected for temperature and salinity according to the AC-S protocol, and then corrected for the effect of tube scattering according to Sullivan et al. (2006). After calibration, the AC-S gives cp660, assuming that colored dissolved organic matter does not absorb at 660 nm. Backscattering measurements were conducted using the BB9 instrument with nine bands, and the particle backscattering coefficient (bp) was obtained after the correction to the raw BB9 data according to the BB9 protocol. The spectrum of Cp and bp were shown in Figures 2C, D.
2.4 Estimation of SPM profiles from attenuation coefficient
It is generally observed that the inherent optical properties (IOPs) of particles suspended in seawater (e.g., phytoplankton, detritus, heterotrophic bacteria, viruses, and mineral particles) are driven to first order by their concentration. Second-order effects are caused by variations in particle size and composition. In the case of optically complex waters, strong relationships have been found between IOPs and SPM (Babin et al., 2003; Boss, Slade et al., 2009), and different algorithms have been developed to retrieve SPM from the IOPs. However, the existing empirical algorithms were mostly developed based on the regional dataset and are not suitable for general applications in the PRE, where the particle concentration and bulk particle characteristics may be very different from those in other regions.
Scatter plots of cp(660), bbp(440) as a function of SPM for available data collected in the PRE are shown in Figure 3. Linear regression prediction models for SPM were established (N=50), 90% prediction bounds, equation, and statistics are also shown. cp(660) and bbp(440) both have a good relationship with SPM, with correlation coefficients above 0.70. In terms of correlation coefficient, Cp-based regression model is higher than bbp-based model, which is 0.76, and in highly turbid water, the signal from the bbp measurement may be saturated, so less data can be used in the model established. Leave-one-out cross validation was also performed. The mean square error and R2 of cp(660) and SPM are 0.0205 and 0.58 higher than those of bbp(440) and SPM of 0.0182 and 0.50. Although the MSE of the bbp-based regression model is lower than that of the Cp-based regression model, considering that the R2 of the Cp-based regression model is significantly higher than that of the bbp-based regression model. Thus, cp-based regression model was used to estimate the vertical distribution of SPM from the attenuation profiles. According to the cp(660) collected over 48 profiles (1 m interval) in the PRE, our estimated SPM generally varies from 7.7 to 48.4 g m-3, with an average value of 17.75 g m-3.
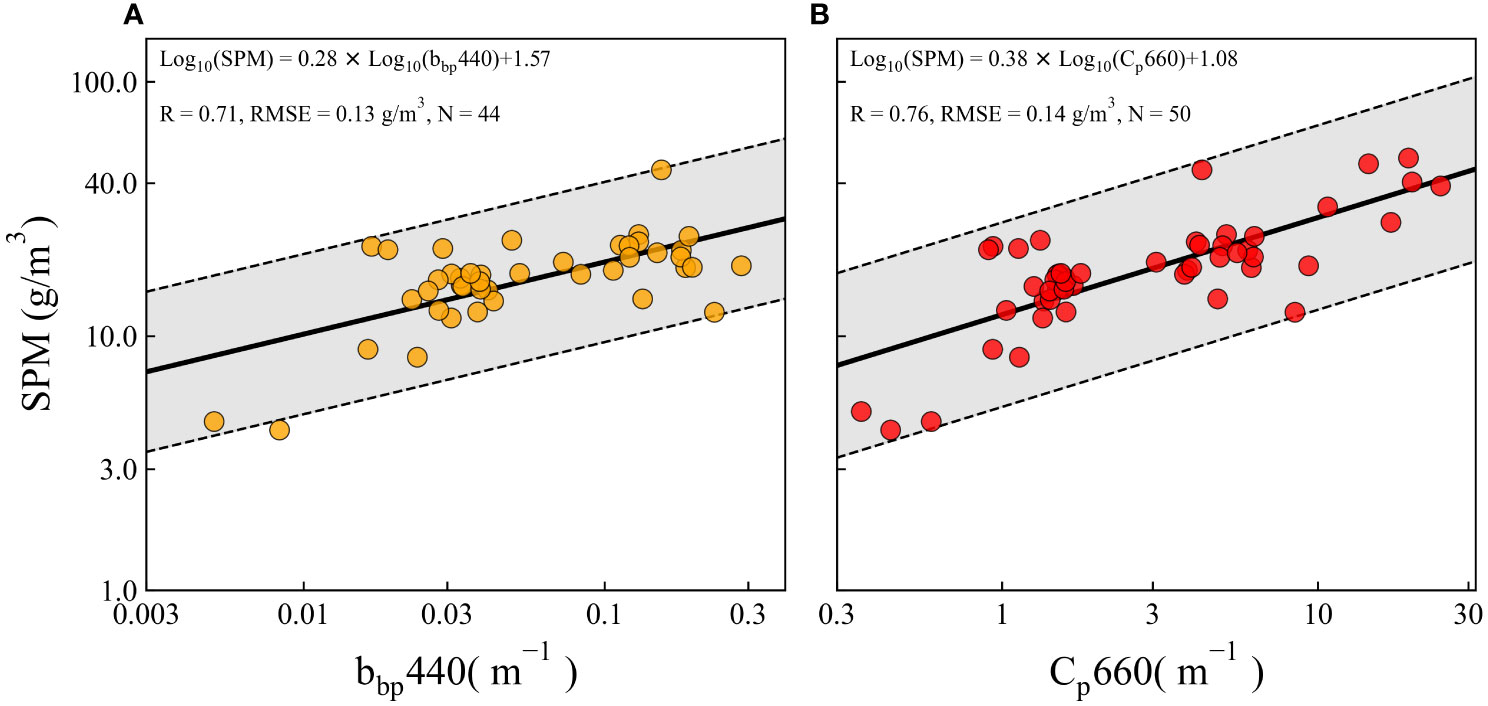
Figure 3 Scatter plots of SPM versus bbp(440) (A), Cp(660) (B) in log10 scale. The dot line represents the 90% prediction bounds, the black solid line represents the linear regression line.
2.5 Hydrodynamic numerical simulation
In this study, the modelled eastward and northward water velocity (m/s), temperature (°C), and salinity (psu) during the cruise sampling (from 7-Jan 2020 to 14-Jan 2020) were obtained from the Global Ocean Forecasting System (GOFS Version 3.1) at the website https://tds.hycom.org/thredds/catalogs/GLBv0.08/expt_93.0.html. The GOFS 3.1 analysis dataset provides a gridded analysis production with 1/12° horizontal resolution between 40°S and 40°N and 41 levels in the vertical layers from July 2014 to the present based on the HYbrid Coordinate Ocean Model (HYCOM) and the Navy Coupled Ocean Data Assimilation (NCODA) (Chassignet et al., 2007). HYCOM has already been used to analyse the dispersion of the Pearl River plume(Chen et al., 2017).
3 Results
3.1 Vertical profile of temperature and salinity along transection
Transects of the PRE, the Daya Bay, and the Huangmao Sea were selected to show the vertical profile of temperature and salinity from nearshore to offshore in the northern South China Sea (Figure 4). The salinity of the three transects shows the trend of high salinity in offshore waters and low salinity in nearshore waters. However, the salinity profiles of the three transects are different. The salinity of the Daya bay transect is generally higher than that of the PRE and the Huangmao Sea transects (Figure 4E), which is also reflected in the T-S diagram, where the red scatter points were kept relatively vertical (Figure 2B). The outermost station on the PRE transect shows the high salinity water (35 psu) in the profile, and then the high salinity tongue rises and extends to the near shore. Similarly, the Huangmao Sea transect is similar to that of the PRE transect. The salinity profiles at the offshore stations are all at high values, but the surface layer is slightly lower than the bottom layer. The high-salinity tongue also extends towards the nearshore. However, the high salinity tongue of PRE transect is halted by topography at around 22.3° N, whereas there is no similar blockage by topography in the Huangmao Sea transect. The transect of Daya Bay on the eastern side of the PRE did not show the trend of the offshore high salinity tongue towards the near shore. Regarding the temperature distribution of the three transects, the distribution of the PRE and Daya Bay transects is similar, showing high temperature from the surface to the bottom at the offshore station, low temperature in the middle of the transect, and high temperature at the nearshore station. However, the distribution of the Huangmao Sea transect shows that there is high temperature in the bottom layer of the offshore station, and a relatively warm tongue extending toward the coast in the middle transect. Temperature and salinity inside the estuarine plume in the dry season are weakly stratified in the vertical, with large vertical gradients near the mixing zone of fresh and salt water.
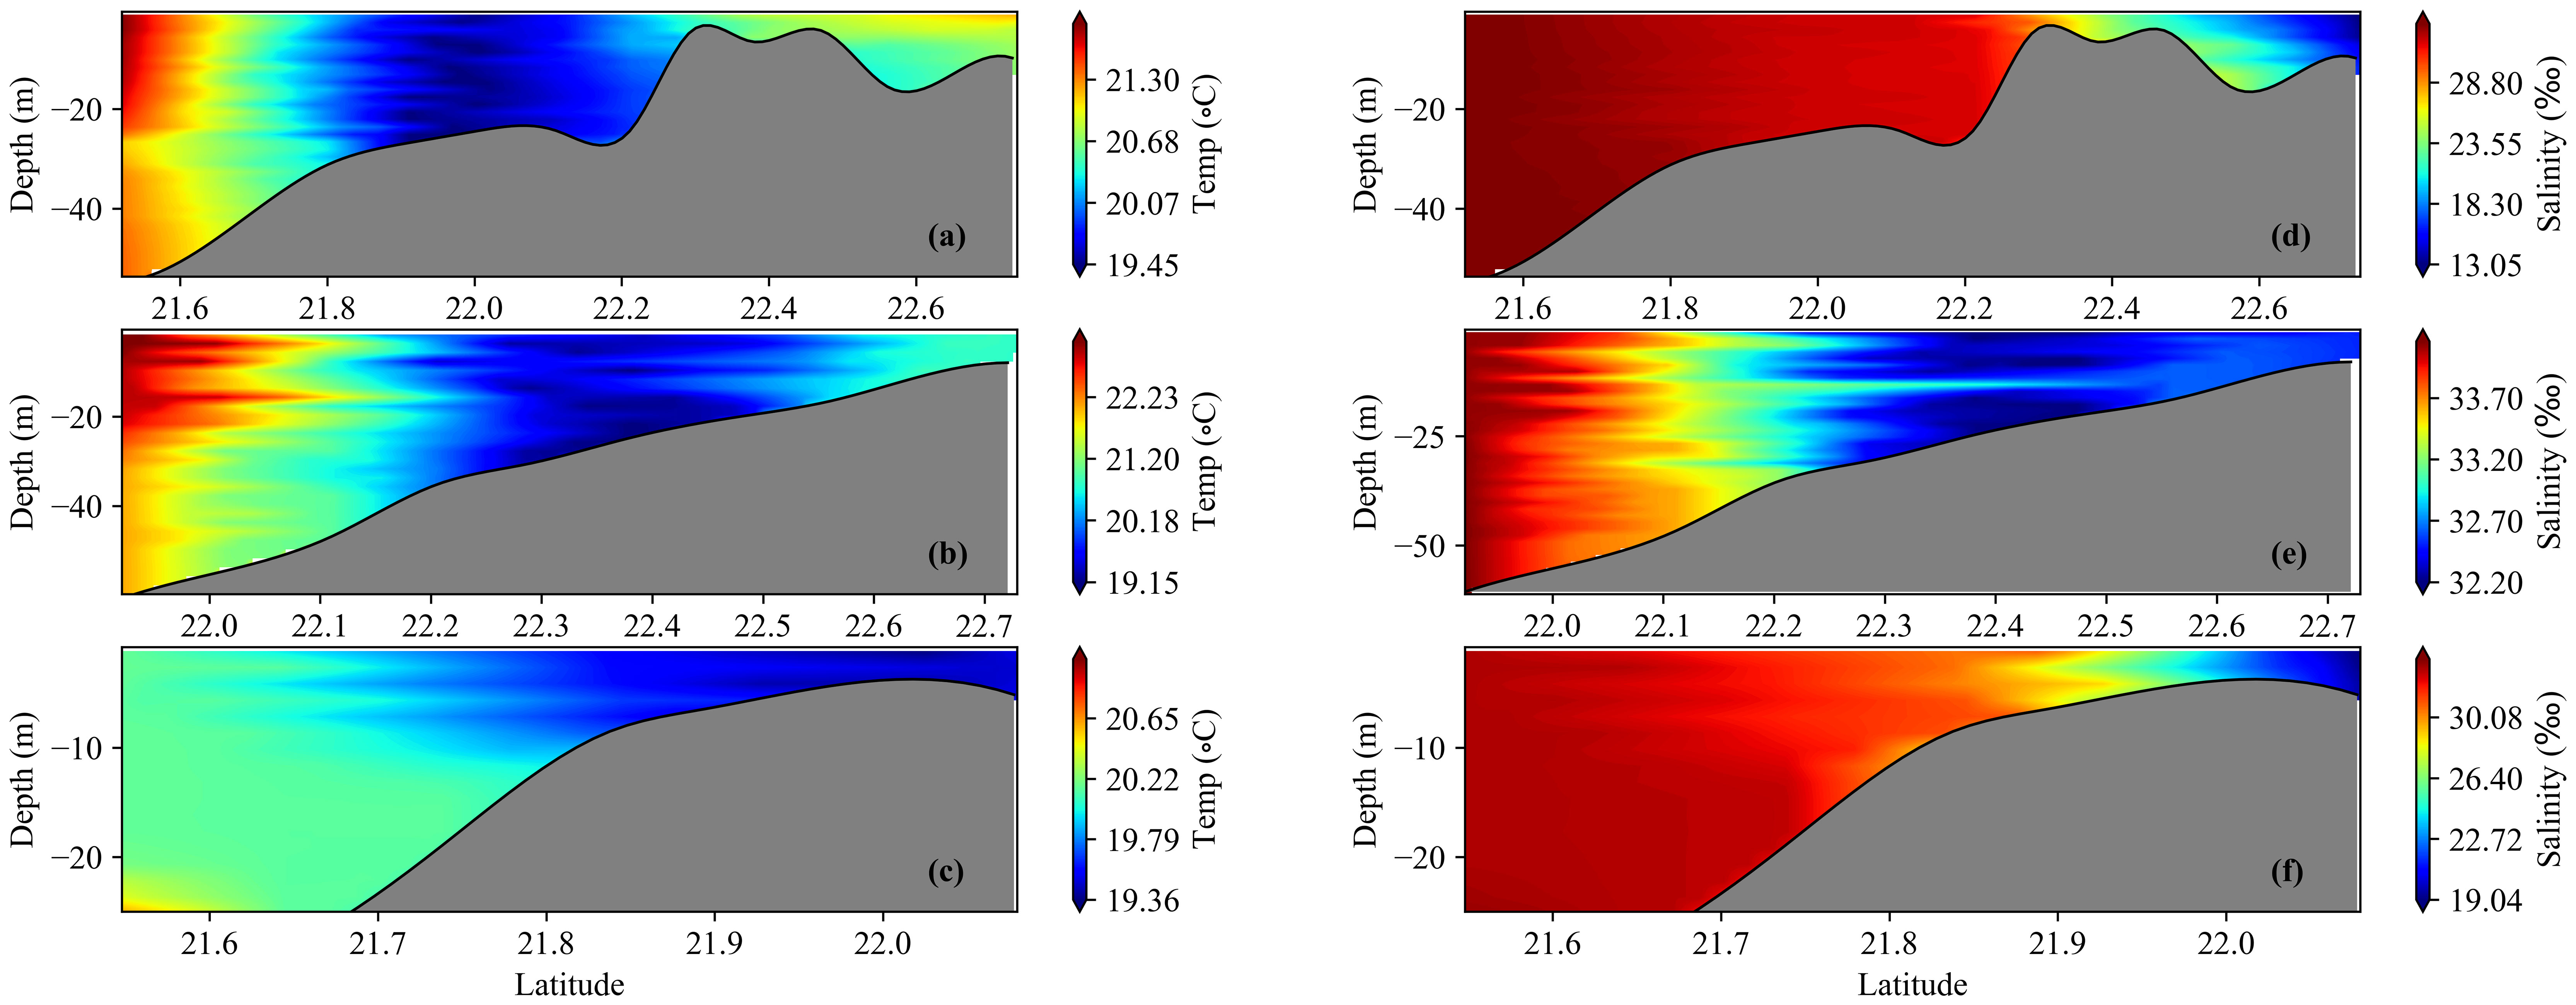
Figure 4 The vertical distribution of temperature and salinity along the transects of the pearl river estuary (A, D), the Daya bay (B, E), and the Huangmao Sea(C, F). The gray areas represents the topography along the transects.
3.2 Results of modeled temperature and current
Figure 5 shows the hydrodynamic numerical simulation results of temperature and current velocity during the cruise sampling (7-Jan 2020 to 8-Jan 2020 for the PRE transect; 9-Jan 2020 to 12-Jan 2020 for the Daya Bay transect; 12-Jan 2020 to 14-Jan 2020 for the Huangmao Sea transect). The general pattern of the modelled surface temperature is low near the coast and is high in the continental region and open sea. A colder water mass from the north invaded the outer PRE from northeast to southwest along the shoreline, resulting in a temperature of about 20°C inside the PRE and a colder 18-20°C outside the PRE, while the continental shelf area was warmer than 23°C. However, the distribution of surface temperature during the sampling period of the three transects is slightly different. For example, on the day of 14 January 2020, with the strengthening of the southwest current, the cold-water mass along the coast was strengthened, resulting in the surface seawater temperature along the coast being higher than that of the previous few days. In terms of current direction, the Huangmao Sea transect was dominated by southwesterly currents during the sampling period. In the PRE transect, northward currents were predominant in the interior of the estuary, westward currents were predominant in the middle, and westward and southwestward currents predominated in the exterior of the transect. The nearshore of the Daya Bay transect is dominated by westward and southwestward currents, while the outer part of the transect shows a northwest-southwest cyclonic flow.
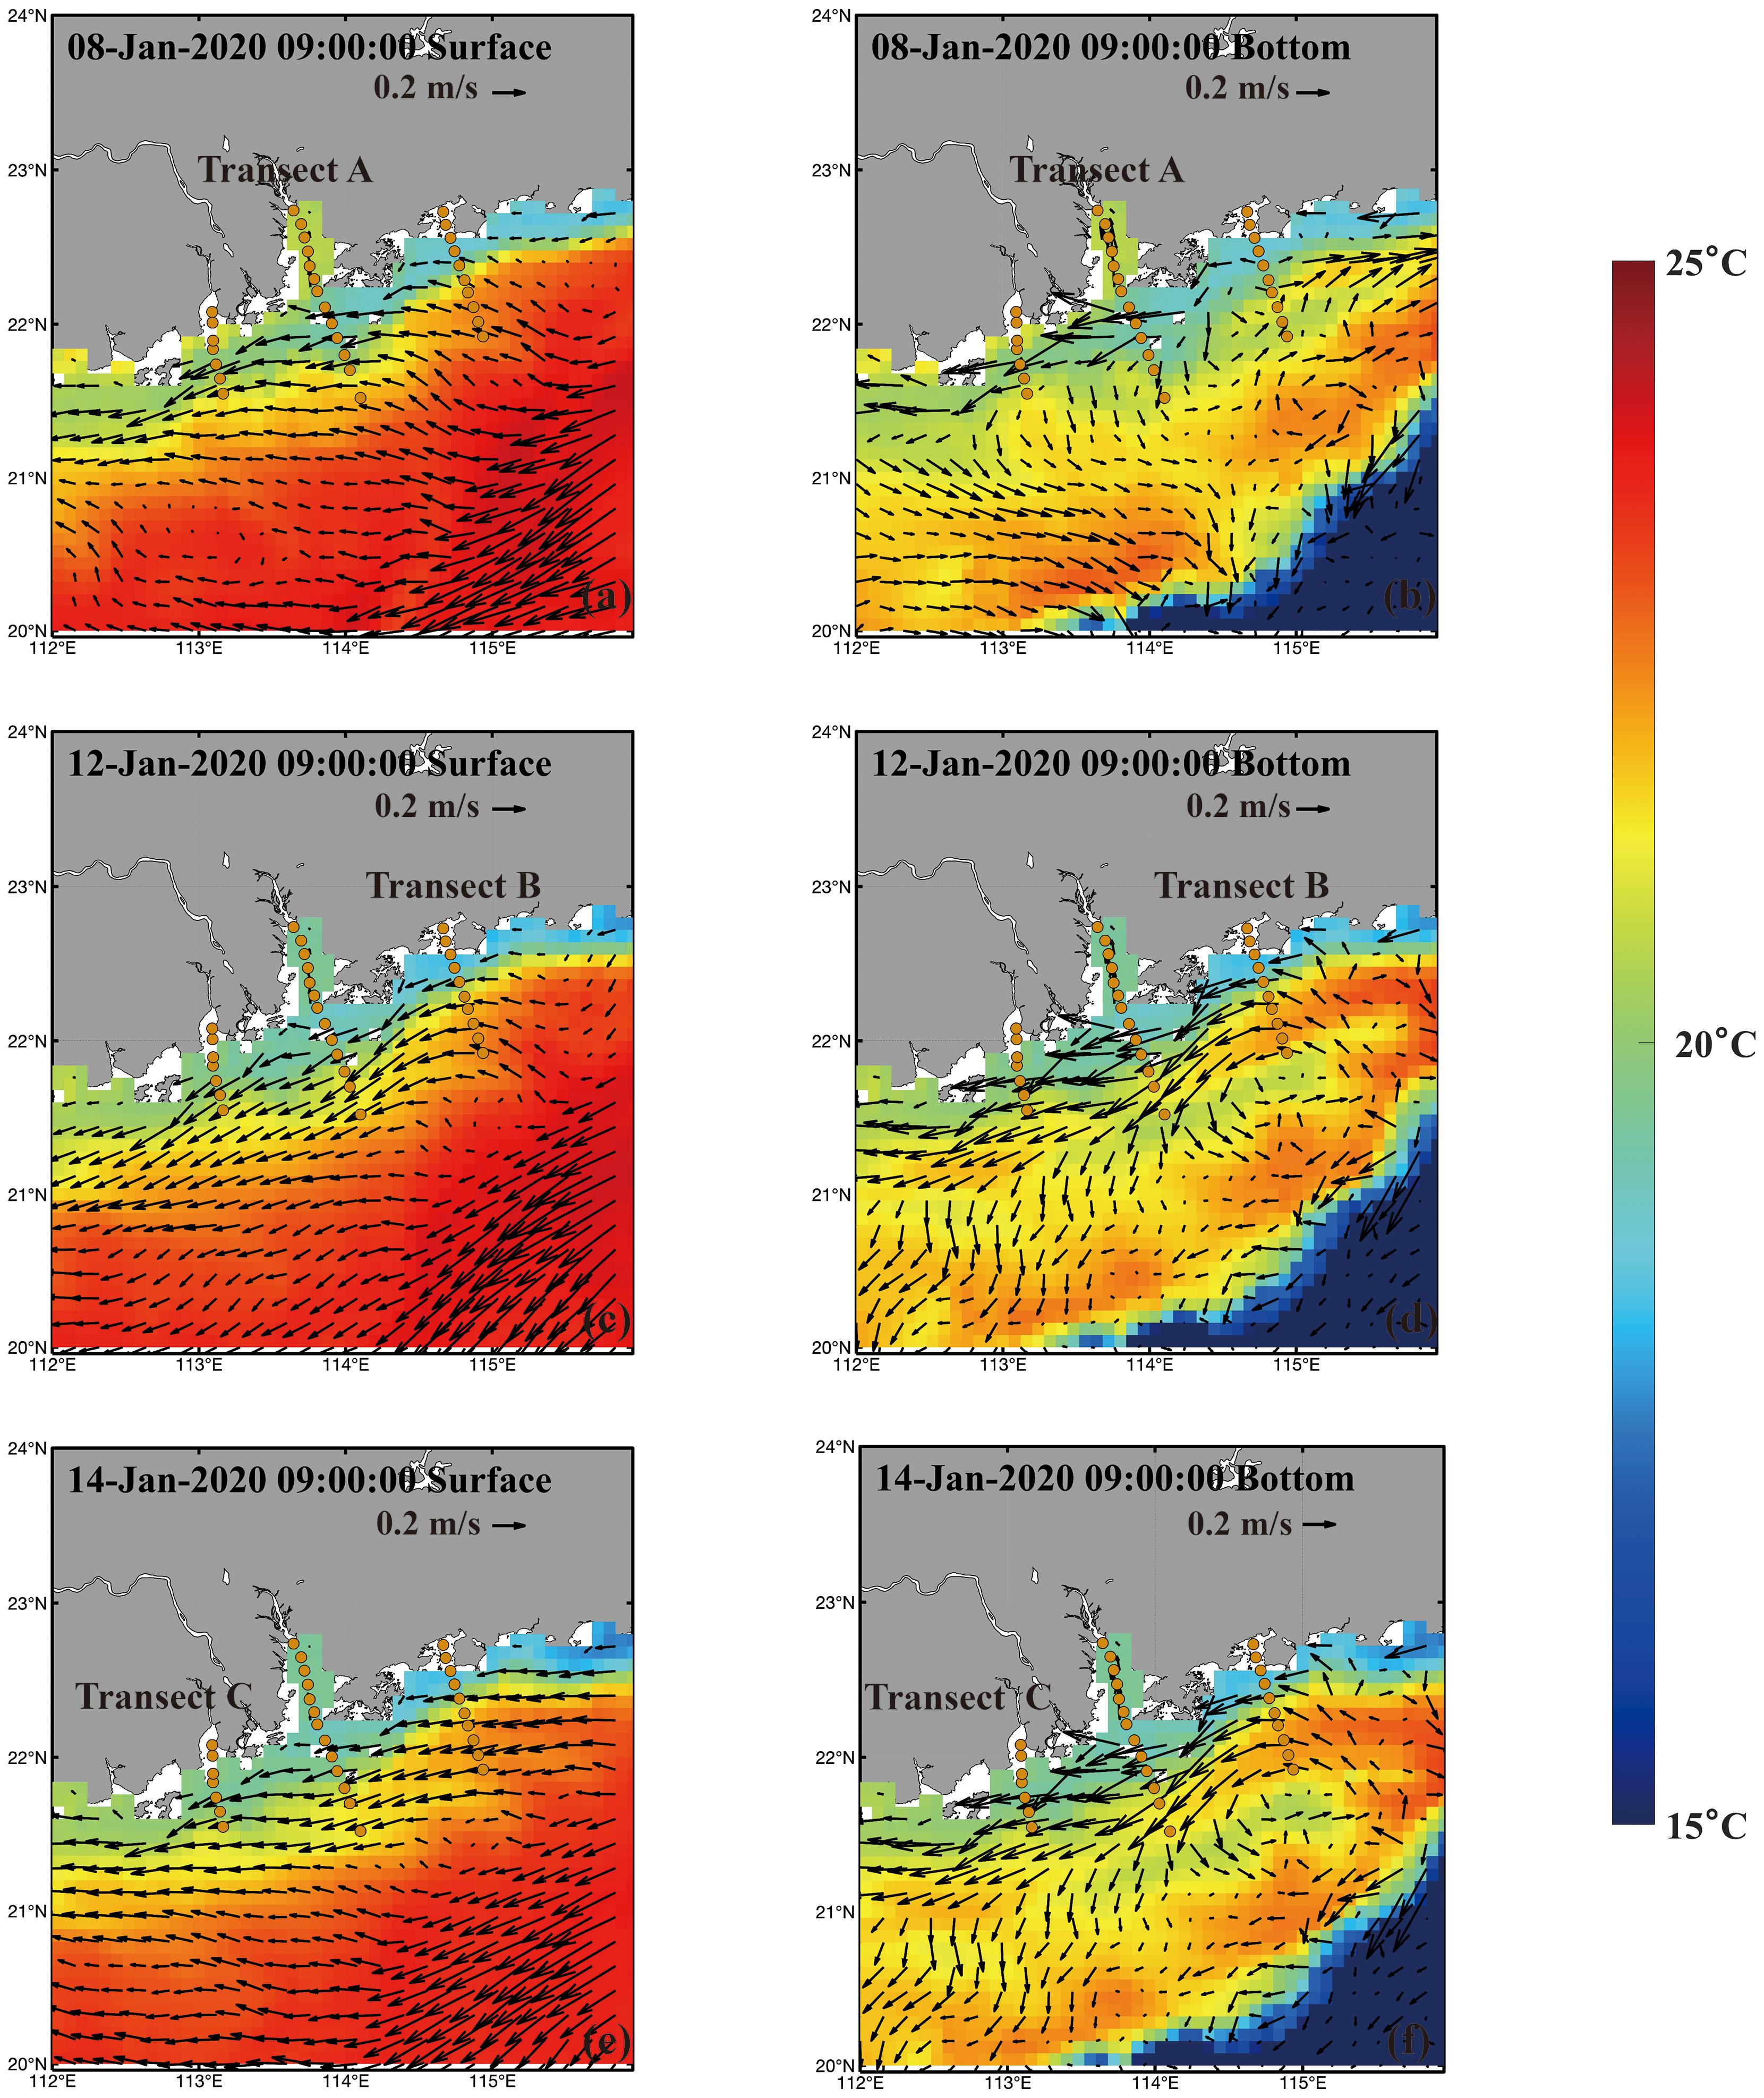
Figure 5 The hydrodynamic numerical simulation results of temperature and current velocity in the surface and bottom during cruise sampling. (A, B) for the PRE transect; (C, D) for Daya bay transect; (E, F) for Huangmao sea transect.
For the bottom, this is expressed as a temperature of about 20°C inside the PRE and a cold-water mass of about 18°C outside the estuary (similar to the surface cold water). South of the cold water mass is a high temperature zone greater than 20°C, with temperatures dropping rapidly to 15°C further south in the high temperature zone. The large differences in the spatial distribution of bottom and surface temperatures indicate the inhomogeneous distribution of temperature profiles in this area. Temporally, however, there is no significant spatial variation in bottom temperature, but a strengthening of the warm water can be seen. In terms of the direction of the bottom currents, the interior of the PRE transect has a northward flow, while near the Wanshan Islands there is a constant westward flow, and the exterior of the transect is dominated by a strong southwestward flow. The Huangmao Sea transect is controlled by westward and southwestward currents, and a weak cyclonic current appears off the Huangmao Sea transect on 8-Jan 2020. The currents at the Daya Bay transect are more complex, with very mixed currents around the transect on 8-Jan 2020, with eastward and northeastward currents occurring to its east. However, on 12-Jan 2020, cyclonic currents were present near the transect, with westward and southwestward currents, prevailing and intensifying on 14-Jan 2020. The area of strong currents is accompanied by the appearance of a high-temperature tongue, extending from the eastern waters of the Daya Bay transect to the outer waters of the PRE. For salinity, no significant variation in vertical and spatial distribution was observed (not shown), with overall values of 20-25 psu in the inner PRE, and a water column of 28-30 psu water column in the nearshore area near the Wanshan Islands in the PRE and in the Yellow Spear Sea transect, and 30-35 psu in the shelf sea area outside the transect.
3.3 Vertical distribution of SPM
The vertical distribution of SPM along the transects was estimated from the attenuation data as shown in Figure 6. The SPM of all transects showed a general trend of being higher near the coast and lower in the open sea. For the PRE transect, the high SPM values appear in the nearshore area (>25 g m-3), and part of the high SPM values extend to the middle of the transect, while the outermost part of the transect maintains a relatively uniform distribution from the surface to the bottom layer and the SPM is lower than 10 g m-3. However, the high value of SPM in the nearshore area of the Daya Bay transect appears in the bottom layer, and its value is higher than 20 g m-3. In the open sea area of the transect, SPM showed a vertically uniform shape lower than 10 g m-3. For the Huangmao Sea transect, a high SPM value appeared in the bottom layer of the nearshore area and extended to the middle water layer in the open sea direction. Its value was higher than 30 g m-3, and it was surrounded by a layer of water body with SPM higher than 20 g m-3, but this part of high SPM water body is blocked in the middle of the transect, and the SPM in open sea is 12 g m-3. When comparing between transects, it can be found that the SPM of the Huangmaohai transect is the highest, and the SPM value of some bottom and middle water bodies is higher than 40 g m-3, followed by the PRE transect, which has SPM higher 20 g m-3 in the near-shore bottom water. Finally, the SPM is lowest in the Daya Bay transect, which has only a small amount of water with SPM greater than 20 g m-3 in the nearshore and bottom water in the middle of the transect. In addition, the overlaid isopycnals in Figure 6 indicate that the nepheloid layers generally correspond to greater density stratification near the shelf, suggesting an influence of density on cross-shelf SPM dispersal. The lateral extent of the nepheloid layers appears to extend from the coast to offshore and also from the surface layer to the bottom layer, indicating that the SPM in our study is not only the vertical distribution but also the horizontal distribution of SPM.
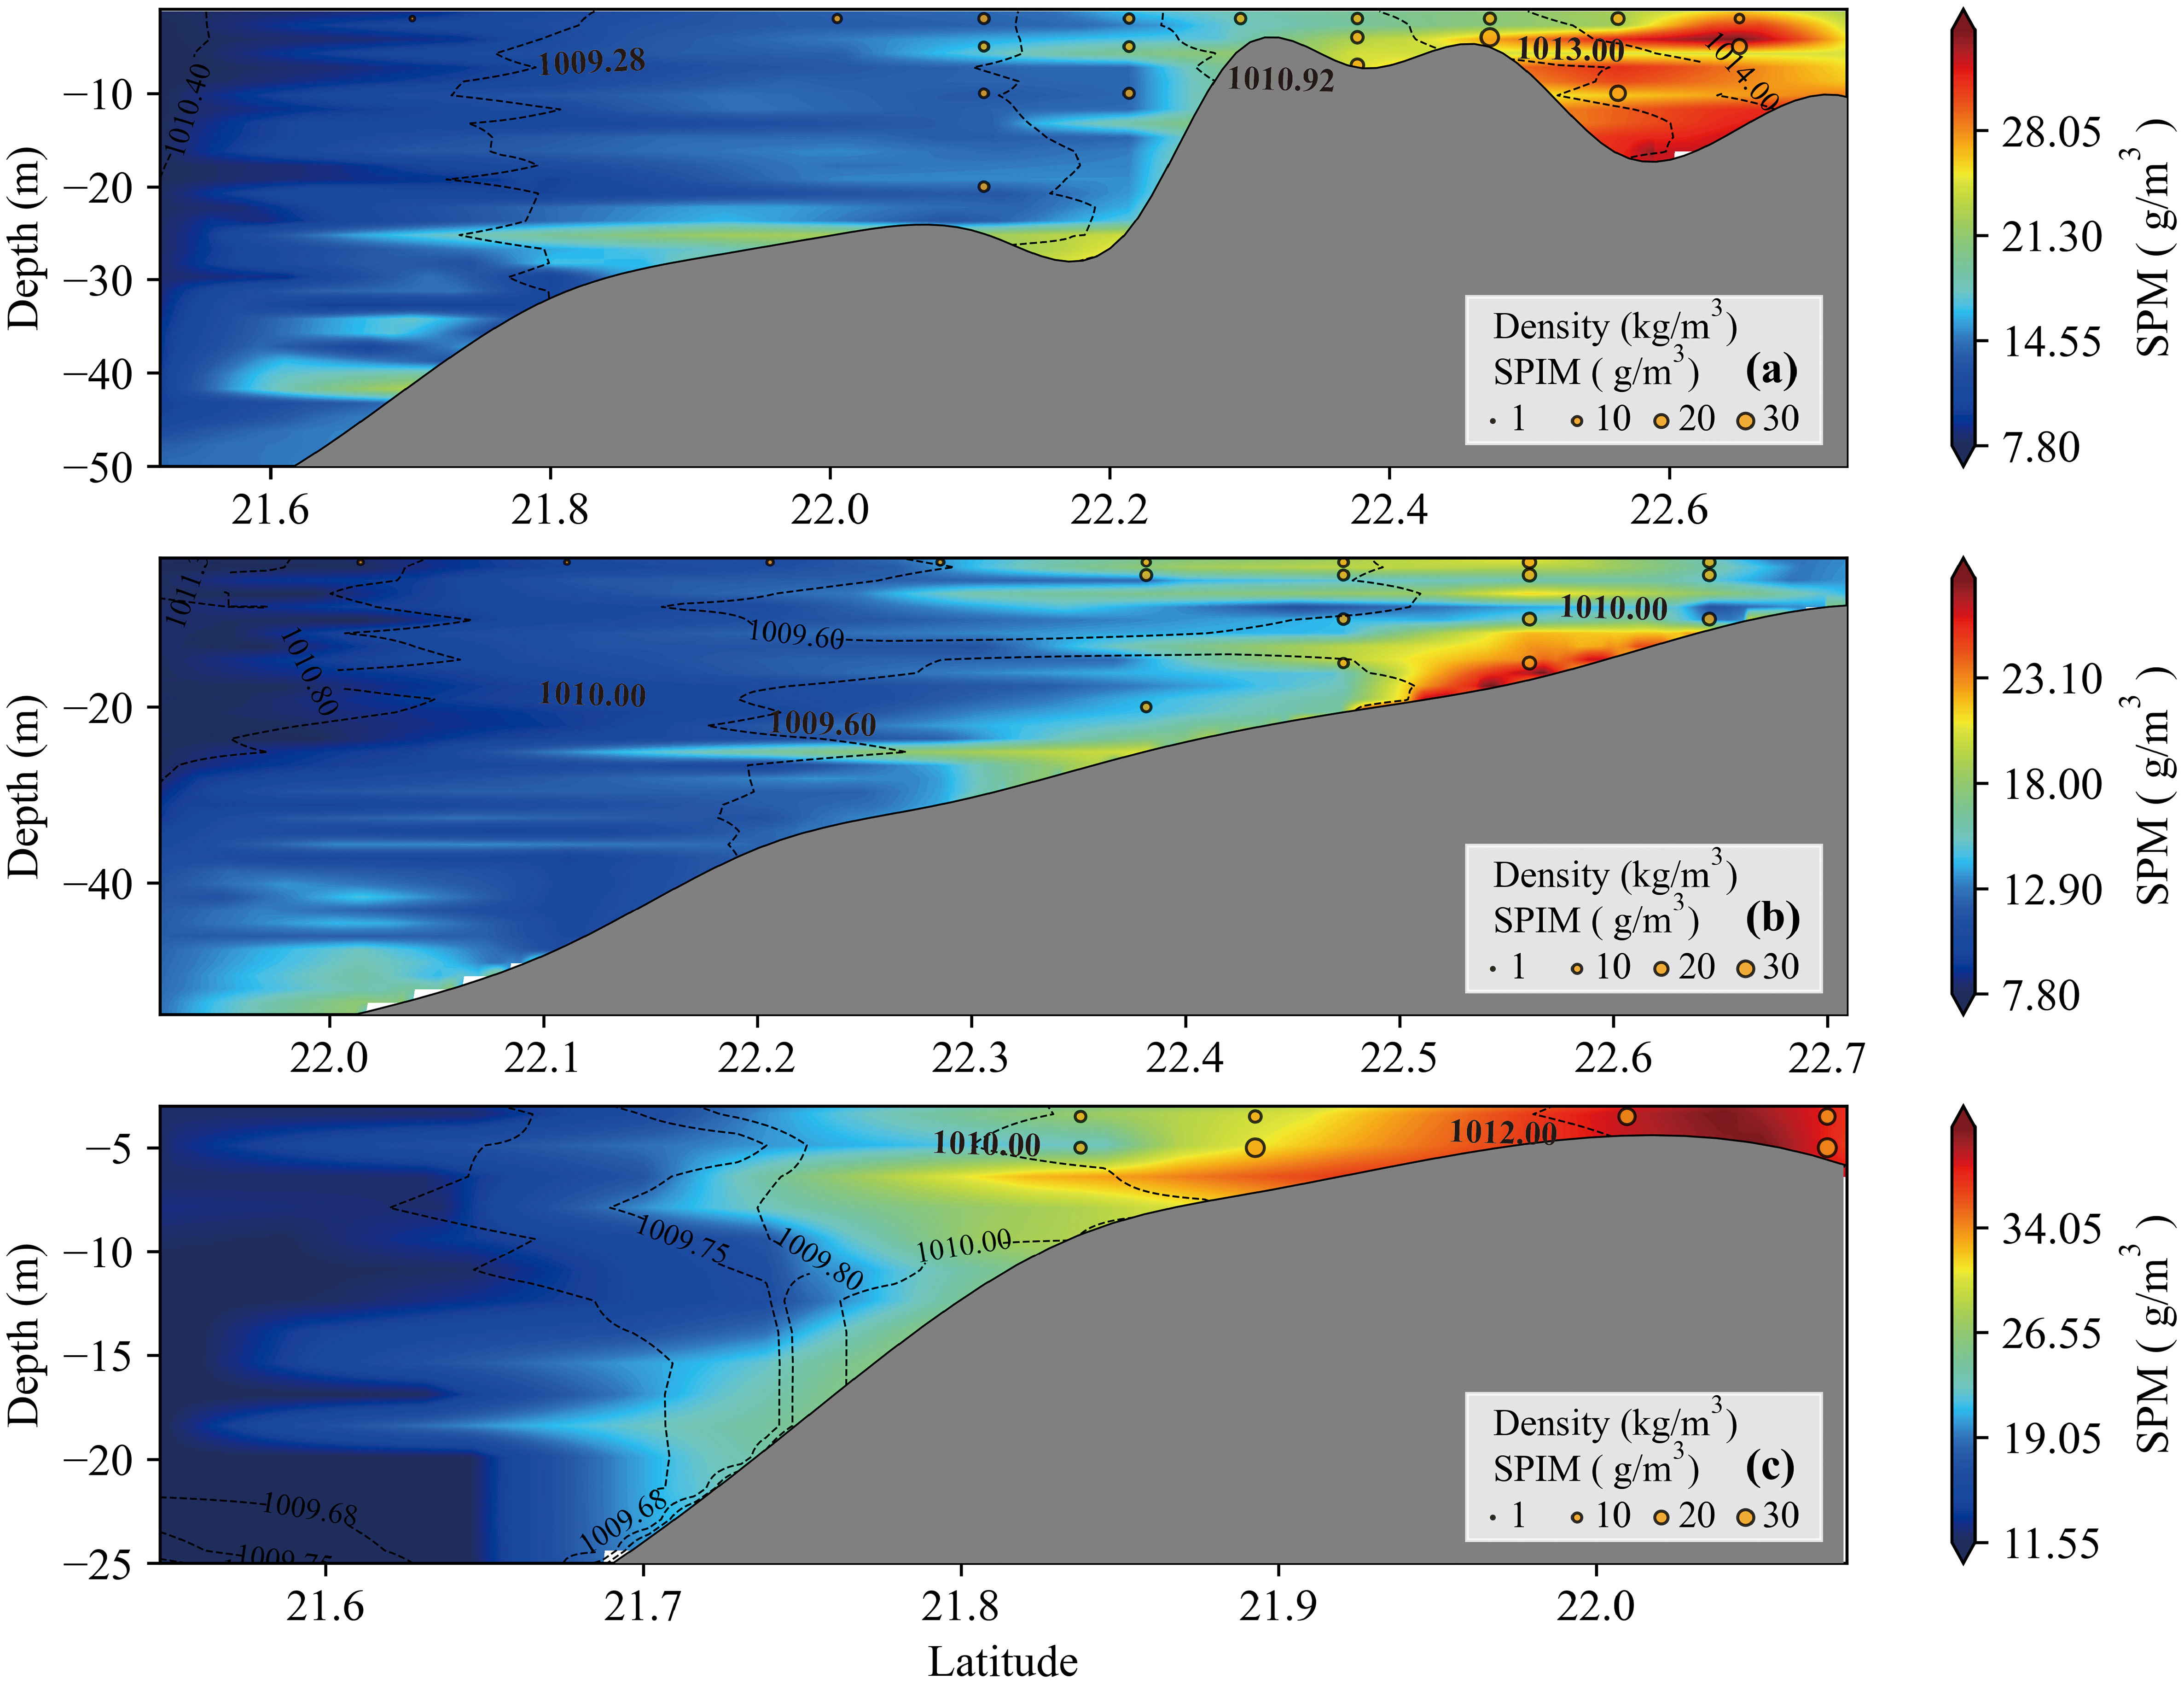
Figure 6 The vertical distribution of SPM estimated from the attenuation data along the transects of the pearl river estuary (A), the Daya bay (B), and the Huangmao Sea (C). The orange circle represents the concentration of suspended particulate inorganic matter (SPIM) from in-situ measurement and the size represents its content. The gray areas represent the topography along the transects. The dot lines represent the isopycnals.
4 Discussions
4.1 Effects of river discharge and seawater intrusion on the distribution of SPM in dry season
For the estuarine portion of the PRE transect (north of 22.3° N), the vertical distribution of SPM shows a pattern of low SPM in the surface and high SPM at the middle and bottom (Figure 6A). From the perspective of ocean currents, during the sampling period in this transect, there was a northward ocean current in both the surface and bottom, but the northward current in the surface was weak, while the northward current in the bottom was strong (Figure 5). The low SPM in the surface of the estuarine area of the PRE transect may not be caused by the intrusion of relatively clear surface water from the open sea (no apparent intrusion of cold surface water in Figure 5A), but the SPM of the middle and bottom is higher than that of the surface, which is caused by the strong currents at the bottom disturbing the sediment at the bottom. The SPIM also showed that the SPM near the bottom is mainly the inorganic matter (range from 65% to 85%) caused by re-suspension (Figure 6). Based on remote sensing studies of SPM in the PRE, it is shown that the distribution of surface SPM in the PRE shows seasonal variations, mainly influenced by monsoons (southwest in spring and summer, northeast in autumn and winter) and tidal currents. Sediment resuspension in the PRE in winter causes high surface SPM and propagates eastwards across the PRE. The present study also shows that higher SPM can exist below the high surface SPM and that the main contribution is not due to the deposition of high surface SPM, but rather to the resuspension of sediment caused by the northward-flowing bottom currents. In the middle of the PRE transect (21.9° N to 22.3° N, near the Wangshan Islands), the high SPM appeared in the bottom. The combination of the in-situ measured temperature profiles (Figure 4) and the modelled currents (Figures 5A, B) shows that the water in this area has a lower temperature than the inner and outer estuaries, which is consistent with the high SPM. Therefore, we speculate that the main reason for the absence of high SPM in the middle layer of this area is the intrusion of a clearer north-east to south-west coastal current into the PRE, which suppresses the upwelling of suspended sediment in the bottom layer. In the outer area of the PRE transect (21.6° N to 21.9° N), the SPM shows no obvious vertical variation and is lower than in other parts of the PRE transect. The results of the in-situ temperature show that this area is occupied by high temperature water and, combined with the model results, it is possible that this part of the area has crossed over the colder coastal currents and is mainly controlled by open ocean waters which are clearer than estuarine waters.
For the Daya Bay transect, the vertical distribution of the SPM is characterized by low values and no significant variation in profile in the outer part of the transect (22°N to 22.2°N), while the middle and inner part of the transect (22.2° N to 22.7°N) is characterized by higher values at the surface, lower values in the middle and highest values at the bottom. The ocean currents and temperature of the model show that the middle and inner part of this transect is controlled by cold coastal currents and that there is a cyclonic current that transports the water column from the nearshore to the southwest, so we conclude that the high surface SPM in the central part of the transect is due to the outward transport of the near shore water with high SPM water by these southwest-oriented currents. The high SPM in the bottom is due to strong bottom currents disturbing the bottom sediment. The low and uniform vertical SPM in the outer part of the transect is consistent with that in the outer part of the PRE transect and is mainly controlled by the high temperature clear water from the open ocean. For the Huangmao Sea transect, the vertical distribution of the SPM exhibits a pattern of high SPM in the nearshore area and low SPM in the outer transect, and the high SPM of the nearshore water does not extend significantly outward to the middle of the transect. The modelled results of the current and temperature shows that the outer part of this transect is not controlled by the offshore waters, unlike the first two transects, where the outermost part of this transect is controlled by the cold coastal currents. And in both the middle and inner parts of the transect are mainly controlled by westward currents, so that nearshore water with high SPM waters may propagate westward along the currents, limiting their dispersion out to open sea along the transect.
4.2 The complexity sources of SPM from seawater and freshwater
The three transects studied in this paper are located in the PRE, Huangmao Sea and Daya Bay, respectively. The PRE transect and the Huangmao Sea transect are located in the major sub-estuaries of the Pearl River system outflow, while the Daya Bay transect is not affected by freshwater inflow from major rivers. Therefore, the study in this paper can further explore how the SPM profile distribution is affected by freshwater and seawater. The Pearl River is the second largest river in China and the thirteenth largest in the world, with a discharge of about 350×109 m3 yr-1 and a sediment load of about 85×106 t yr-1 (Hu et al., 2006). In addition, the Pearl River has three major tributaries, Xijiang (West River), Dongjiang (East River) and Beijiang (North River), with eight outlets (also called “gates” in Chinese) discharging freshwater into the sea (Yamen and Hutiaomen outlets are located in the Huangmao Sea, while Humen, Jiaomen, Hengmen, and Hongqimen outlets are located in the PRE). Since the Pearl River Basin is located in the area affected by the monsoon, there are significant differences in the freshwater delivered by the Pearl River between the dry (December to March) and the wet (May to August) seasons, and the sediment content carried by the freshwater also changes accordingly. Wong et al. (2003) demonstrated that the freshwater of the wet season is five times greater than during that of the dry season, and the profile of temperature and salinity are more uniform during the dry season. In addition, since the Pearl River drainage area has multiple estuarine branches, there are spatial differences in the flow of freshwater by the Pearl River. For example, the West River is the largest branch, carrying 77% of the total freshwater and 86% of the sediment load of the entire Pearl River drainage (Harrison et al., 2008). It is precisely because of the seasonal variation in freshwater flow by the Pearl River and the seawater intrusion (Lin et al., 2019) that the competition between freshwater and seawater ultimately leads to the complexity of SPM distribution in the PRE.
The influence of freshwater and seawater on the SPM distribution can be found in Figure 6. The SPM distribution is similar for the PRE transect and the Huangmao Sea transect, which are influenced by freshwater discharged from the Pearl River, and is significantly different from that of the Daya Bay transect, which is not influenced by freshwater from the Pearl River. In the Pearl River transect and Huangmao Sea transect, the SPM is higher in the bottom and middle near the shore area and lower in the surface, while in the Daya Bay transect, the high SPM in the surface is different from the above two transects and extends to the middle of the transect, and the SPM in the middle is the lowest and the bottom layer is the largest. The analysis in the previous chapter shows that the high SPM in the inner part of the Pearl River transect and the Huangmao Sea transect is restricted from spreading outwards by the influx of seawater from the open sea, whereas the spreading of the high SPM in the surface of the Daya Bay transect to the middle part of the transect clearly demonstrates the situation when there is no freshwater input. The SPM distribution in the Pearl River transect and the Huangmao Sea transect is more vertically uniform than that in Daya Bay transect due to the mixing of freshwater and seawater. The SPIM at the bottom of these two transects was also higher than at the surface (Figure 6). Although the SPM distribution in this study is only in winter, it is possible to predict from this short winter research that this balance is likely to be broken and high SPM may spread out to the open sea if the seawater invasion weakened in winter or the freshwater flushing in the Pearl River is strengthened in summer. Satellite-derived SPM also proves that the SPM front in the wet season is more southward than for the dry season, and the SPM is higher (Zhao et al., 2018). Besides, SPM in the PRE presents a clear trend of high in the west and low in the east (Ji et al., 2011). The most recent satellite-derived SPM shows that there is a relatively clear decreasing trend in SPM in most of the regions of the PRE (Cao et al., 2022). Although the satellite-derived SPM has efficiently revealed the spatial distribution and temporal variation of SPM in the PRE, it is limited to the surface. Previous studies suggested that the SPM in the PRE may be vertically uniform during the dry season due to strong mixing (Dong et al., 2006). However, this study shows that even during the highly mixed dry season, the vertical distribution of SPM in the PRE varies significantly, with high SPM values generally occurring in the middle and bottom layers. Therefore, remotely sensed SPM alone is not sufficient to accurately characterise its changes. Further investigation of the retrieval of vertical SPM from satellite or in-situ optical properties is needed.
Flocculation is critical in the sediment cycle because of its ability to alter sediment settling rates and the mode of sediment transport. The size of flocculated particles and associated settling velocities are essential for accurate simulation and prediction of sedimentation processes and sediment transport rates (Wang et al., 2013). Particle size and sources in the nepheloid layers are strongly related to flocculation, as flocculation transforms fine individual particles from rivers and seafloor resuspension into larger aggregates (Wang et al., 2020). Therefore, floc characteristics such as size, density and composition can help distinguish the origin of SPM. For example, riverine flocs are enriched in terrigenous organic matter compared to marine resuspension flocs (Li et al., 2018). The benthic nepheloid layer is enriched in inorganic mineral components, in contrast to the phytoplankton-dominated upper water layers in the eastern Hainan coast of the South China Sea (Zhou et al., 2022). Similarly, the study of the northern Yellow Sea cold water mass showed a low organic component in the lower nepheloid layer. Thus, aggregation of inorganic particles rather than biological flocculation dominated the bottom layer (Wang et al., 2020). Our results support their findings by showing a high concentration of SPM near the bottom in all three transects, indicating nepheloid layers in the PRE during the dry season and with a high percentage of SPIM in the near bottom (Figure 6). Besides, the observed consistency between density layering and SPM concentration provides evidence that the lateral distribution of SPM is influenced by the cross-shelf density structure. Isopycnals superimposed on the SPM distribution show that the nepheloid layers are bounded by density (Figure 6). In the nepheloid layer, the lateral particle transport flux in the nepheloid layer is several orders of magnitude greater than the vertical flux, and the intermediate nepheloid layers were found to be lateral extensions of the benthic nepheloid layer at various depths (Schulz et al., 2021). The presence of these lateral nepheloid layers is likely to facilitate offshore transport of resuspended sediment from the coast, allowing material to reach further offshore before settling out of suspension. The isotopic composition of the surface sediments of the PRE has shown that the sedimentary organic matter of the sea is of terrestrial and marine origin. Furthermore, the accumulation of organic matter of terrestrial origin is higher than that of marine origin in the mouth and western area of the PRE (Hu et al., 2006). Heavy metals in surface sediments were also found in the western part of the PRE and were highly correlated with SPM and hydrological conditions (Zhou et al., 2004; Ye et al., 2012). The complexity of the sediment source is also a result of the interaction between freshwater and seawater and the deposition of SPM in the PRE. In addition, the spatial variation of zooplankton may be further influenced by the complex sources of SPM from freshwater and seawater combined with the coastal current and tidal process (Li et al., 2006). Therefore, the studies of the spatial and temporal distribution and sources of SPM in the waters surrounding the PRE are fundamental to the study of biogeochemical cycling, carbon cycling, and environmental pollution treatment in the PRE.
4.3 Implications for future work
In our study, the results reveal that the analysis of vertical distribution of SPM for winter in the PRE displays significant profile stratification (Figure 6). Previous remote sensing-based SPM have mainly focused on the spatial and temporal analysis of surface SPM (Wang et al., 2017; Wang et al., 2018; Nukapothula et al., 2019; Zhan et al., 2019; Ma et al., 2022) in the PRE. However, the remote sensing analysis of surface SPM cannot accurately reflect the true SPM content in the water column, while the vertical-integrated SPM analysis cannot well consider the physical processes in water. Therefore, efforts have also been exploring to derive the vertical SPM from surface remote sensing SPM using layer-by-layer recursion (Lei et al., 2020) and to obtained depth-integrated particulate organic matter from space based on process-oriented method (Liu et al., 2023), but these approaches still need further validation in the PRE. In contrast, this study provides high-resolution vertical distribution of SPM in the PRE, which can be used to validate the accuracy of remote-sensed SPM on the one hand, and the reliability of model results on the other. This has important implications for future applications of modelling vertical SPM for remote sensing.
5 Conclusions
In summary, we found that the mean SPM of three transects of the Pearl River Estuary was about 20 g m-3. The SPM at the Huangmao Sea transect (about 33 g m-3) was higher than that at the Pearl River Estuary and Daya Bay transect (about 17 and 19 g m-3), which may be related to the high sediment transport at the outlet of the Pearl River Estuary into the Huangmao Sea. In addition, we found a significant linear relationship between bio-optical parameters and SPM with a correlation coefficient greater than 0.7. Based on this, we developed an empirical algorithm to retrieve SPM from attenuation coefficients and obtained the vertical distribution of SPM with high depth resolution. We further combined the temperature and current data obtained from HYCOM to investigate the possible mechanisms of the vertical distribution of SPM in the Pearl River estuary during winter. We found that the low surface SPM in the nearshore region of the Pearl River Estuary transect may not be caused by seawater intrusion at the surface, but rather by a higher bottom SPM relative to the surface due to sediment resuspension caused by seawater intrusion at the bottom. In addition, the SPM in the middle of the Daya Bay transect shows a pattern of high surface and bottom SPM and low middle SPM, which may be caused by the southwesterly currents transporting the high SPM waters near the shore outwards and the resuspension of sediments in the bottom layer. The main reason for the high SPM in the Huangmao Sea transect is that the westward currents restrict their outward diffusion along the transect to the open sea. Finally, by comparing the two SPMs in the Pearl River estuary and the Huangmao Sea, which are influenced by freshwater input, and those in Daya Bay, which are not, we find that the vertical distribution of winter SPMs in the three transects is significantly influenced by river discharge, and the origin of SPMs needs further analysis and investigation.
Data availability statement
The original contributions presented in the study are included in the article/supplementary material. Further inquiries can be directed to the corresponding author.
Author contributions
LD: Conceptualization, Methodology, Writing original draft. SH: Supervision, Funding acquisition, Writing - review & editing. SC: Software, Data curation. XZ: Methodology, Data curation ZW: Data collection. ZX: Methodology. SL: Data collection. All authors have read and agreed to the published version of the manuscript.
Funding
This research was supported in part by the National Natural Science Foundation of China (NSFC) under Grant 41890852; Shenzhen Science and Technology Program under Grant JCYJ20210324120207020; the State Key Laboratory of Tropical Oceanography, South China Sea Institute of Oceanology, Chinese Academy of Sciences under Grant LTO2216.
Acknowledgments
We would also like to acknowledge reviewers for their helpful comments on the manuscript. Disclosures.
Conflict of interest
The authors declare that the research was conducted in the absence of any commercial or financial relationships that could be construed as a potential conflict of interest.
Publisher's note
All claims expressed in this article are solely those of the authors and do not necessarily represent those of their affiliated organizations, or those of the publisher, the editors and the reviewers. Any product that may be evaluated in this article, or claim that may be made by its manufacturer, is not guaranteed or endorsed by the publisher.
References
Babin M., Morel A., Fournier-Sicre V., Fell F., Stramski D. (2003). Light scattering properties of marine particles in coastal and open ocean waters as related to the particle mass concentration. Limnol. Oceanogr. 48 (2), 843–859. doi: 10.4319/lo.2003.48.2.0843
Bishop J. K. B., Wood T. J. (2008). Particulate matter chemistry and dynamics in the twilight zone at VERTIGO ALOHA and K2 sites. Deep Sea Res. Part I: Oceanogr. Res. Papers 55 (12), 1684–1706. doi: 10.1016/j.dsr.2008.07.012
Boss E., Guidi L., Richardson M. J., Stemmann L., Gardner W., Bishop J. K. B., et al. (2015). Optical techniques for remote and in-situ characterization of particles pertinent to GEOTRACES. Prog. Oceanogr. 133, 43–54. doi: 10.1016/j.pocean.2014.09.007
Boss E., Slade W., Hill P. (2009a). Effect of particulate aggregation in aquatic environments on the beam attenuation and its utility as a proxy for particulate mass. Optics Express 17 (11), 9408–9420. doi: 10.1364/OE.17.009408
Boss E., Taylor L., Gilbert S., Gundersen K., Hawley N., Janzen C., et al. (2009b). Comparison of inherent optical properties as a surrogate for particulate matter concentration in coastal waters. Limnol. Oceanogr.: Methods 7 (11), 803–810. doi: 10.4319/lom.2009.7.803
Burford M. A., Webster I. T., Revill A. T., Kenyon R. A., Whittle M., Curwen G. (2012). Controls on phytoplankton productivity in a wet–dry tropical estuary. Estuarine Coast. Shelf Sci. 113, 141–151. doi: 10.1016/j.ecss.2012.07.017
Cai L., Zhou M., Yan X., Liu J., Ji Q., Chen Y., et al. (2022). HY-1C Coastal Zone Imager observations of the suspended sediment content distribution details in the sea area near Hong Kong-Zhuhai-Macao Bridge in China. Acta Oceanol. Sin. 41 (11), 126–138. doi: 10.1007/s13131-022-2107-0
Cao B., Qiu J., Zhang W., Xie X., Lu X., Yang X., et al. (2022). Retrieval of suspended sediment concentrations in the pearl river estuary using multi-source satellite imagery. Remote Sens. 14 (16), 3896. doi: 10.3390/rs14163896
Cetinić I., Perry M. J., Briggs N. T., Kallin E., D'Asaro E. A., Lee C. M. (2012). Particulate organic carbon and inherent optical properties during 2008 North Atlantic Bloom Experiment. J. Geophys. Res: Oceans 117 (C6), C06028. doi: 10.1029/2011jc007771
Chassignet E. P., Hurlburt H. E., Smedstad O. M., Halliwell G. R., Hogan P. J., Wallcraft A. J., et al. (2007). The HYCOM (HYbrid Coordinate Ocean Model) data assimilative system. J. Mar. Syst. 65 (1-4), 60–83. doi: 10.1016/j.jmarsys.2005.09.016
Chen Z., Gong W., Cai H., Chen Y., Zhang H. (2017). Dispersal of the Pearl River plume over continental shelf in summer. Estuarine Coast. Shelf Sci. 194, 252–262. doi: 10.1016/j.ecss.2017.06.025
Cloern J. E. (1987). Turbidity as a control on phytoplankton biomass and productivity in estuaries. Continental Shelf Res. 7 (11), 1367–1381. doi: 10.1016/0278-4343(87)90042-2
Dai S. B., Yang S., Cai A. M. (2008). Impacts of dams on the sediment flux of the Pearl River, Southern China. Catena 76, 36–43. doi: 10.1016/j.catena.2008.08.004
Davies-Colley R. J., Ballantine D. J., Elliott S. H., Swales A., Hughes A. O., Gall M. P. (2014). Light attenuation - a more effective basis for the management of fine suspended sediment than mass concentration? Water Sci. Technol. 69 (9), 1867–1874. doi: 10.2166/wst.2014.096
de Nijs M. A. J., Pietrzak J. D. (2012). Saltwater intrusion and ETM dynamics in a tidally-energetic stratified estuary. Ocean Model. 49-50, 60–85. doi: 10.1016/j.ocemod.2012.03.004
Dong L., Su J., Li Y., Xia X., Guan W. (2006). “Physical Processes and Sediment Dynamics in the Pearl River,” in The Environment in Asia Pacific Harbours, Springer, Dordrecht. 127–137. doi: 10.1007/1-4020-3655-8_9
Harrison P. J., Yin K., Lee J. H. W., Gan J., Liu H. (2008). Physical-biological coupling in the pearl river estuary. Continental Shelf Res. 28 (12), 1405–1415. doi: 10.1016/j.csr.2007.02.011
Hill P. S., Boss E., Newgard J. P., Law B. A., Milligan T. G. (2011). Observations of the sensitivity of beam attenuation to particle size in a coastal bottom boundary layer. J. Geophys. Res: Oceans 116 (C2), C02023. doi: 10.1029/2010JC006539
Hu J., Peng P., Jia G., Mai B., Zhang G. (2006). Distribution and sources of organic carbon, nitrogen and their isotopes in sediments of the subtropical Pearl River estuary and adjacent shelf, Southern China. Mar. Chem. 98 (2-4), 274–285. doi: 10.1016/j.marchem.2005.03.008
Huang C., Chen F., Zhang S., Chen C., Meng Y., Zhu Q., et al. (2020). Carbon and nitrogen isotopic composition of particulate organic matter in the Pearl River Estuary and the adjacent shelf. Estuarine Coast. Shelf Sci. 246, 107003–107014. doi: 10.1016/j.ecss.2020.107003
Ji X., Sheng J., Tang L., Liu D., Yang X. (2011). Process study of dry-season circulation in the pearl river estuary and adjacent coastal waters using a triple-nested coastal circulation model. Atmosphere-Ocean 49 (2), 138–162. doi: 10.1080/07055900.2011.580165
Lei S., Xu J., Li Y., Du C., Liu G., Zheng Z., et al. (2020). An approach for retrieval of horizontal and vertical distribution of total suspended matter concentration from GOCI data over Lake Hongze. Sci. Total Environ. 700, 134524. doi: 10.1016/j.scitotenv.2019.134524
Li X., Cai Y., Liu Z., Mo X., Zhang L., Zhang C., et al. (2023). Impacts of river discharge, coastal geomorphology, and regional sea level rise on tidal dynamics in Pearl River Estuary. Front. Mar. Sci. 10. doi: 10.3389/fmars.2023.1065100
Li Y., Jia J., Zhu Q., Cheng P., Gao S., Wang Y. P. (2018). Differentiating the effects of advection and resuspension on suspended sediment concentrations in a turbid estuary. Mar. Geol. 403, 179–190. doi: 10.1016/j.margeo.2018.06.001
Li W., Tian L., Li J., Zhou Q., Li Y., Li S. (2019). Impact of natural and anthropogenic changes on the spatial–temporal variations of total suspended matter in the pearl river estuary, China. J. Coast. Res. 90 (sp1), 66–76, 11. doi: 10.2112/SI90-009.1
Li K. Z., Yin J. Q., Huang L. M., Tan Y. H. (2006). Spatial and temporal variations of mesozooplankton in the Pearl River estuary, China. Estuarine Coast. Shelf Sci. 67 (4), 543–552. doi: 10.1016/j.ecss.2005.12.008
Lin Z., Zhang H., Lin H., Gong W. (2019). Intraseasonal and interannual variabilities of saltwater intrusion during dry seasons and the associated driving forcings in a partially mixed estuary. Continental Shelf Res. 174, 95–107. doi: 10.1016/j.csr.2019.01.008
Liu D., Sun Z., Shen M., Tian L., Yu S., Jiang X., et al. (2023). Three-dimensional observations of particulate organic carbon in shallow eutrophic lakes from space. Water Res. 229, 119519. doi: 10.1016/j.watres.2022.119519
Liu R., Wang Y., Gao J., Wu Z., Guan W. (2016). Turbidity maximum formation and its seasonal variations in the Zhujiang (Pearl River) Estuary, southern China. Acta Oceanol. Sin. 35 (8), 22–31. doi: 10.1007/s13131-016-0897-7
Loisel H., Meriaux X., Berthon J. F., Poteau A. (2007). Investigation of the optical backscattering ratio of marine particles in relation to their biogeochemical composition in the eastern English Channel and southern North Sea. Limnol. oceanogr. 52, 739–752. doi: 10.4319/lo.2007.52.2.0739
Ma C., Zhao J., Ai B., Sun S., Yang Z. (2022). Machine learning based long-term water quality in the turbid pearl river estuary, China. J. Geophys. Res: Oceans 127 (1). doi: 10.1029/2021jc018017
Manning A. J., Langston W. J., Jonas P. J. (2010). A review of sediment dynamics in the Severn Estuary: influence of flocculation. Mar. pollut. Bull. 61 (1-3), 37–51. doi: 10.1016/j.marpolbul.2009.12.012
Mayer L. M., Keil R. G., Macko S. A., Joye S. B., Ruttenberg K. C., Aller R. C. (1998). Importance of suspended participates in riverine delivery of bioavailable nitrogen to coastal zones. Global Biogeochem. Cycles 12 (4), 573–579. doi: 10.1029/98gb02267
Miller R. L., McKee B. A. (2004). Using MODIS Terra 250 m imagery to map concentrations of total suspended matter in coastal waters. Remote Sens. Environ. 93 (1-2), 259–266. doi: 10.1016/j.rse.2004.07.012
Neukermans G., Loisel H., Mériaux X., Astoreca R., McKee D. (2012). In situ variability of mass-specific beam attenuation and backscattering of marine particles with respect to particle size, density, and composition. Limnol. Oceanogr. 57 (1), 124–144. doi: 10.4319/lo.2012.57.1.0124
Ni H. G., Lu F. H., Luo X. L., Tian H. Y., Zeng E. Y. (2008). Riverine inputs of total organic carbon and suspended particulate matter from the Pearl River Delta to the coastal ocean off South China. Mar. pollut. Bull. 56 (6), 1150–1157. doi: 10.1016/j.marpolbul.2008.02.030
Nukapothula S., Chen C., Wu J. (2019). Long-term distribution patterns of remotely sensed water quality variables in Pearl River Delta, China. Estuarine Coast. Shelf Sci. 221, 90–103. doi: 10.1016/j.ecss.2019.02.038
Schulz K., Büttner S., Rogge A., Janout M., Hölemann J., Rippeth T. P. (2021). Turbulent mixing and the formation of an intermediate nepheloid layer above the siberian continental shelf break. Geophys. Res. Lett. 48 (9), e2021GL092988. doi: 10.1029/2021gl092988
Slade W. H., Boss E., Russo C. (2011). Effects of particle aggregation and disaggregation on their inherent optical properties. Optics Express 19 (9), 7945–7959. doi: 10.1364/OE.19.007945
Sullivan J., Twardowski M., Zaneveld J. R. V., Moore C., Barnard A. H., Donaghay P. L., et al. (2006). Hyperspectral temperature and salt dependencies of absorption by water and heavy water in the 400-750nm spectral range. Appl. Optics 45 (21), 5294–5309. doi: 10.1364/AO.45.005294
Wang C., Chen S., Li D., Wang D., Liu W., Yang J. (2017). A Landsat-based model for retrieving total suspended solids concentration of estuaries and coasts in China. Geosci. Model. Dev. 10 (12), 4347–4365. doi: 10.5194/gmd-10-4347-2017
Wang C., Li W., Chen S., Li D., Wang D., Liu J. (2018). The spatial and temporal variation of total suspended solid concentration in Pearl River Estuary during 1987-2015 based on remote sensing. Sci. Total Environ. 618, 1125–1138. doi: 10.1016/j.scitotenv.2017.09.196
Wang Z., Li W., Zhang K., Agrawal Y. C., Huang H. (2020). Observations of the distribution and flocculation of suspended particulate matter in the North Yellow Sea cold water mass. Continental Shelf Res. 204, 104187. doi: 10.1016/j.csr.2020.104187
Wang Y. P., Voulgaris G., Li Y., Yang Y., Gao J., Chen J., et al. (2013). Sediment resuspension, flocculation, and settling in a macrotidal estuary. J. Geophys. Res: Oceans 118 (10), 5591–5608. doi: 10.1002/jgrc.20340
Wong L. A., Chen J. C., Xue H., Dong L. X., Su J. L., Heinke G. (2003). A model study of the circulation in the Pearl River Estuary (PRE) and its adjacent coastal waters: 1. Simulations and comparison with observations. J. Geophys. Res: Oceans 108 (C5). doi: 10.1029/2002JC001451
Wren D. G., Barkdoll B. D., Kuhnle R. A., Derrow R. W. (2000). Field techniques for suspended-sediment measurement. J. Hydraulic Eng. 126 (2), 97–104. doi: 10.1061/(ASCE)0733-9429(2000)126:2(97
Ye F., Huang X., Zhang D., Tian L., Zeng Y. (2012). Distribution of heavy metals in sediments of the Pearl River Estuary, southern China: implications for sources and historical changes. J. Environ. Sci. (China) 24 (4), 579–588. doi: 10.1016/s1001-0742(11)60783-3
Zhan W., Wu J., Wei X., Tang S., Zhan H. (2019). Spatio-temporal variation of the suspended sediment concentration in the Pearl River Estuary observed by MODIS during 2003–2015. Continental Shelf Res. 172, 22–32. doi: 10.1016/j.csr.2018.11.007
Zhang S., Lu X. X., Higgitt D. L., Chen C.-T. A., Han J., Sun H. (2008). Recent changes of water discharge and sediment load in the Zhujiang (Pearl River) Basin, China. Global Planet. Change 60 (3-4), 365–380. doi: 10.1016/j.gloplacha.2007.04.003
Zhao J., Cao W., Xu Z., Ye H., Yang Y., Wang G., et al. (2018). Estimation of suspended particulate matter in turbid coastal waters: application to hyperspectral satellite imagery. Opt Express 26 (8), 10476–10493. doi: 10.1364/OE.26.010476
Zhou W., Cao W., Zhao J., Wang G., Zheng W., Deng L., et al. (2022). Variability of scattering and backscattering of marine particles in relation to particle concentration, size distribution, and composition off the eastern hainan coast in the south China sea. Continental Shelf Res. 232, 104615. doi: 10.1016/j.csr.2021.104615
Zhou H.-y., Peng X.-t., Pan J.-m. (2004). Distribution, source and enrichment of some chemical elements in sediments of the Pearl River Estuary, China. Continental Shelf Res. 24 (16), 1857–1875. doi: 10.1016/j.csr.2004.06.012
Keywords: water quality, suspended particulate matter, vertical distribution, pearl river, biooptical properties
Citation: Deng L, Hu S, Chen S, Zeng X, Wang Z, Xu Z and Liu S (2023) Vertical distribution of suspended particulate matter and its response to river discharge and seawater intrusion: a case study in the Pearl River Estuary during the 2020 dry season. Front. Mar. Sci. 10:1239649. doi: 10.3389/fmars.2023.1239649
Received: 13 June 2023; Accepted: 21 August 2023;
Published: 04 September 2023.
Edited by:
Vincent Le Fouest, Université de la Rochelle, FranceReviewed by:
François Bourrin, Université de Perpignan Domitia, FranceShengqiang Wang, Nanjing University of Information Science and Technology, China
Copyright © 2023 Deng, Hu, Chen, Zeng, Wang, Xu and Liu. This is an open-access article distributed under the terms of the Creative Commons Attribution License (CC BY). The use, distribution or reproduction in other forums is permitted, provided the original author(s) and the copyright owner(s) are credited and that the original publication in this journal is cited, in accordance with accepted academic practice. No use, distribution or reproduction is permitted which does not comply with these terms.
*Correspondence: Shuibo Hu, aHNiNTE0QDE2My5jb20=